UNITED STATES
SECURITIES AND EXCHANGE COMMISSION
WASHINGTON, D.C. 20549
FORM 20-F
| ☐ | REGISTRATION STATEMENT PURSUANT TO SECTION 12(b) OR 12(g) OF THE SECURITIES EXCHANGE ACT OF 1934 |
OR
| ☒ | ANNUAL REPORT PURSUANT TO SECTION 13 OR 15(d) OF THE SECURITIES EXCHANGE ACT OF 1934 |
For the fiscal year ended March 31, 2017
OR
| ☐ | TRANSITION REPORT PURSUANT TO SECTION 13 OR 15(d) OF THE SECURITIES EXCHANGE ACT OF 1934 |
For the transition period from to
OR
| ☐ | SHELL COMPANY REPORT PURSUANT TO SECTION 13 OR 15(d) OF THE SECURITIES EXCHANGE ACT OF 1934 |
Date of event requiring this shell company report
Commission file number001-32945
WNS (Holdings) Limited
(Exact name of Registrant as specified in its charter)
Not Applicable
(Translation of Registrant’s name into English)
Jersey, Channel Islands
(Jurisdiction of incorporation or organization)
Gate 4, Godrej & Boyce Complex
Pirojshanagar, Vikhroli (W)
Mumbai 400 079, India
(Address of principal executive offices)
Sanjay Puria
Group Chief Financial Officer
Gate 4, Godrej & Boyce Complex
Pirojshanagar, Vikhroli (W)
Mumbai 400 079, India
(91-22) 4095-2100
sanjay.puria@wns.com
(Name, Telephone,E-mail and/or Facsimile number and Address of Company Contact Person)
Securities registered or to be registered pursuant to Section 12(b) of the Act.
| | |
Title of each class | | Name of each exchange on which registered |
| American Depositary Shares, each represented by | | The New York Stock Exchange |
| one Ordinary Share, par value 10 pence per share | | |
Securities registered or to be registered pursuant to Section 12(g) of the Act.
None
(Title of Class)
Securities for which there is a reporting obligation pursuant to Section 15(d) of the Act
None
(Title of Class)
Indicate the number of outstanding shares of each of the issuer’s classes of capital or common stock as of the close of the period covered by the annual report.
As at March 31, 2017, 50,012,559 ordinary shares (excluding 3,300,000 treasury shares), par value 10 pence per share, were issued and outstanding, of which 49,721,174 ordinary shares were held in the form of American Depositary Shares (“ADSs”). Each ADS represents one ordinary share.
Indicate by check mark if the registrant is a well-known seasoned issuer, as defined in Rule 405 of the Securities Act. ☒ Yes ☐ No
If this report is an annual or transition report, indicate by check mark if the registrant is not required to file reports pursuant to Section 13 or 15(d) of the Securities Exchange Act of 1934. ☐ Yes ☒ No
Note — Checking the box above will not relieve any registrant required to file reports pursuant to Section 13 or 15(d) of the Securities Exchange Act of 1934 from their obligations under those Sections.
Indicate by check mark whether the registrant: (1) has filed all reports required to be filed by Section 13 or 15(d) of the Securities Exchange Act of 1934 during the preceding 12 months (or for such shorter period that the registrant was required to file such reports), and (2) has been subject to such filing requirements for the past 90 days. ☒ Yes ☐ No
Indicate by check mark whether the registrant has submitted electronically and posted on its corporate Web site, if any, every Interactive Data File required to be submitted and posted pursuant to Rule 405 of RegulationS-T (§232.405 of this chapter) during the preceding 12 months (or for such shorter period that the registrant was required to submit and post such files). ☐ Yes ☐ No
Indicate by check mark whether the registrant is a large accelerated filer, an accelerated filer, anon-accelerated filer, or an emerging growth company. See definition of “large accelerated filer,” “accelerated filer,” and “emerging growth company,” inRule 12b-2 of the Exchange Act. (Check one):
| | | | |
Large accelerated filer ☒ | | Accelerated filer ☐ | | Non-accelerated filer ☐ |
| | |
| | | | Emerging growth company ☐ |
If an emerging growth company that prepares its financial statements in accordance with U.S. GAAP, indicate by check mark if the registrant has elected not to use the extended transition period for complying with any new or revised financial accounting standards provided pursuant to Section 13(a) of the Exchange Act. ☐
Indicate by check mark which basis of accounting the registrant has used to prepare the financial statements included in this filing:
| | | | |
U.S. GAAP ☐ | | International Financial Reporting Standards as issued by the International Accounting Standards Board ☒ | | Other ☐ |
If “Other” has been checked in response to the previous question, indicate by check mark which financial statement item the registrant has elected to follow: ☐ Item 17 ☐ Item 18
If this report is an annual report, indicate by check mark whether the registrant is a shell company (as defined inRule 12b-2 of the Exchange Act). ☐ Yes ☒ No
TABLE OF CONTENTS
WNS (HOLDINGS) LIMITED
Ex-4.12 Stock Purchase Agreement dated as of January 10, 2017 by and among WNS North America Inc. and the Sellers, the Optionholders and the Sellers Representative (each as defined therein).
Ex-4.13 Stock Purchase Agreement and Plan of Merger dated as at March 15, 2017 by and among WNS Global Services Private Limited, WNS North America Inc., WNS Healthcare North America LLC, HealthHelp Holdings, LLC, MTS HealthHelp Inc., the stockholders of MTS HealthHelp Inc., Cherrill Farnsworth and the Sellers’ Representative (as defined therein).
Ex-4.14 Facility Agreement dated January 18, 2017 between WNS North America Inc. and BNP Paribas, Hong Kong.
Ex-4.15 Facility Agreement dated March 10, 2017 among WNS (Mauritius) Limited, HSBC Bank (Mauritius) Limited and Standard Chartered Bank, UK.
Ex-8.1 List of subsidiaries of WNS (Holdings) Limited
Ex-12.1 Certification by the Chief Executive Officer to 17 CFR 240,15d-14(a), as adopted pursuant to Section 302 of the Sarbanes-Oxley Act of 2002
Ex-12.2 Certification by the Chief Financial Officer to 17 CFR 240,15d-14(a), as adopted pursuant to Section 302 of the Sarbanes-Oxley Act of 2002
Ex-13.1 Certification by the Chief Executive Officer to 18 U.S.C. Section 1350, as adopted pursuant to Section 906 of the Sarbanes-Oxley Act of 2002
Ex-13.2 Certification by the Chief Financial Officer to 18 U.S.C. Section 1350, as adopted pursuant to Section 906 of the Sarbanes-Oxley Act of 2002
Ex-15.1 Consent of Grant Thornton India LLP, independent registered public accounting firm
1
CONVENTIONS USED IN THIS ANNUAL REPORT
In this annual report, references to “US” are to the United States of America, its territories and its possessions. References to “UK” are to the United Kingdom. References to “India” are to the Republic of India. References to “China” are to the People’s Republic of China. References to “South Africa” are to the Republic of South Africa. References to “$” or “dollars” or “US dollars” are to the legal currency of the US, references to “₹ ” or “rupees” or “Indian rupees” are to the legal currency of India, references to “pound sterling” or “£” are to the legal currency of the UK, references to “pence” are to the legal currency of Jersey, Channel Islands, references to “Euro” are to the legal currency of the European Monetary Union, references to “South African rand” or “R” or “ZAR” are to the legal currency of South Africa, references to “A$” or “AUD” or “Australian dollars” are to the legal currency of Australia, references to “CHF” or “Swiss Franc” are to the legal currency of Switzerland, references to “RMB” are to the legal currency of China and references to “LKR” or “Sri Lankan rupees” are to the legal currency of Sri Lanka. Our financial statements are presented in US dollars. Our financial statements included in this annual report are prepared in accordance with the International Financial Reporting Standards and its interpretations (“IFRS”), as issued by the International Accounting Standards Board (“IASB”). Unless otherwise indicated, references to “GAAP” in this annual report are to IFRS, as issued by the IASB.
References to a particular “fiscal” year are to our fiscal year ended March 31 of that calendar year. Any discrepancies in any table between totals and sums of the amount listed are due to rounding.
In this annual report, unless otherwise specified or the context requires, the term “WNS” refers to WNS (Holdings) Limited, a public company incorporated under the laws of Jersey, Channel Islands, and the terms “our company,” “we,” “our” and “us” refer to WNS (Holdings) Limited and its subsidiaries.
In this annual report, references to “Commission” are to the United States Securities and Exchange Commission.
We also refer in various places within this annual report to “revenue less repair payments,” which is anon-GAAP financial measure that is calculated as (a) revenue less (b) in our auto claims business, payments to repair centers (1) for “fault” repair cases where we act as the principal in our dealings with the third party repair centers and our clients and (2) for“non-fault” repair cases with respect to one former client (whose contract with us was terminated with effect from April 18, 2012). Thisnon-GAAP financial information is not meant to be considered in isolation or as a substitute for our financial results prepared in accordance with GAAP.
We refer to information regarding the business process management (“BPM”) industry, our company and our competitors from market research reports, analyst reports and other publicly available sources. Although we believe that this information is reliable, we have not independently verified the accuracy and completeness of the information. We caution you not to place undue reliance on this data. BPM services are also sometimes referred to as business process outsourcing (“BPO”) services.
This annual report also includes information regarding the BPM market from the “Gartner Inc., Forecast: IT Services, Worldwide, 2015-2021 1Q17 Update” report dated March 21, 2017 by Gartner Inc. (which we refer to herein as the “Gartner Report”). The Gartner Report described herein contains data, research opinions or viewpoints published, as part of a syndicated subscription service, by Gartner, Inc. (“Gartner”), and are not representations of fact. The Gartner Report speaks as of its original publication date (and not as of the date of this annual report) and the opinions expressed in the Gartner Report are subject to change without notice.
SPECIAL NOTE REGARDING FORWARD-LOOKING STATEMENTS
This annual report contains “forward-looking statements” that are based on our current expectations, assumptions, estimates and projections about our company and our industry. The forward-looking statements are subject to various risks and uncertainties. Generally, these forward-looking statements can be identified by the use of forward-looking terminology such as “anticipate”, “believe”, “estimate”, “expect”, “intend”, “will”, “project”, “seek”, “should” and similar expressions. Those statements include, among other things, the discussions of our business strategy and expectations concerning our market position, future operations, margins, profitability, liquidity and capital resources, tax assessment orders and future capital expenditures. We caution you that reliance on any forward-looking statement inherently involves risks and uncertainties, and that although we believe that the assumptions on which our forward-looking statements are based are reasonable, any of those assumptions could prove to be inaccurate, and, as a result, the forward-looking statements based on those assumptions could be materially incorrect. These risks and uncertainties include but are not limited to:
| | • | | worldwide economic and business conditions; |
2
| | • | | political or economic instability in the jurisdictions where we have operations; |
| | • | | our dependence on a limited number of clients in a limited number of industries; |
| | • | | regulatory, legislative and judicial developments; |
| | • | | increasing competition in the business process management industry; |
| | • | | technological innovation; |
| | • | | telecommunications or technology disruptions; |
| | • | | our ability to attract and retain clients; |
| | • | | our liability arising from fraud or unauthorized disclosure of sensitive or confidential client and customer data; |
| | • | | negative public reaction in the US or the UK to offshore outsourcing; |
| | • | | our ability to expand our business or effectively manage growth; |
| | • | | our ability to hire and retain enough sufficiently trained employees to support our operations; |
| | • | | the effects of our different pricing strategies or those of our competitors; |
| | • | | our ability to successfully consummate, integrate and achieve accretive benefits from our strategic acquisitions, and to successfully grow our revenue and expand our service offerings and market share; |
| | • | | future regulatory actions and conditions in our operating areas; and |
| | • | | volatility of our ADS price. |
These and other factors are more fully discussed in “Part I — Item 3. Key Information — D. Risk Factors”, “Part I — Item 5. Operating and Financial Review and Prospects” and elsewhere in this annual report. In light of these and other uncertainties, you should not conclude that we will necessarily achieve any plans, objectives or projected financial results referred to in any of the forward-looking statements. Except as required by law, we do not undertake to release revisions of any of these forward-looking statements to reflect future events or circumstances.
3
PART I
ITEM 1. IDENTITY OF DIRECTORS, SENIOR MANAGEMENT AND ADVISERS
Not applicable.
ITEM 2. OFFER STATISTICS AND EXPECTED TIMETABLE
Not applicable.
ITEM 3. KEY INFORMATION
A. Selected Financial Data
Our consolidated financial statements as at and for the years ended March 31, 2017, 2016, 2015, 2014 and 2013 have been prepared in conformity with IFRS, as issued by the IASB.
The following selected financial data should be read in conjunction with “Part I — Item 5. Operating and Financial Review and Prospects” and our consolidated financial statements included elsewhere in this annual report.
The following selected consolidated statement of income data for fiscal 2017, 2016 and 2015 and selected consolidated statement of financial position data as at March 31, 2017 and 2016 have been derived from our audited consolidated financial statements included elsewhere in this annual report. The selected consolidated statement of income data for fiscal 2014 and 2013 and selected consolidated statement of financial position data as at March 31, 2015, 2014 and 2013 have been derived from our audited consolidated financial statements which are not included in this annual report.
| | | | | | | | | | | | | | | | | | | | |
| | | For the year ended March 31, | |
| | | 2017 | | | 2016 | | | 2015 | | | 2014 | | | 2013 | |
| | | (US dollars in millions, except share and per share data) | |
Consolidated statement of income data: | | | | | | | | | | | | | | | | | | | | |
Revenue | | $ | 602.5 | | | $ | 562.2 | | | $ | 533.9 | | | $ | 502.6 | | | $ | 460.3 | |
Cost of revenue(1) | | | 403.3 | | | | 365.4 | | | | 342.7 | | | | 327.7 | | | | 311.0 | |
| | | | | | | | | | | | | | | | | | | | |
Gross profit | | | 199.2 | | | | 196.8 | | | | 191.2 | | | | 174.9 | | | | 149.3 | |
Operating expenses: | | | | | | | | | | | | | | | | | | | | |
Selling and marketing expenses(1) | | | 32.6 | | | | 30.8 | | | | 31.1 | | | | 35.2 | | | | 30.2 | |
General and administrative expenses (1) | | | 91.7 | | | | 78.9 | | | | 70.0 | | | | 55.4 | | | | 57.1 | |
Foreign exchange loss/(gains), net | | | (14.5 | ) | | | (11.0 | ) | | | (4.6 | ) | | | 11.2 | | | | 5.5 | |
Impairment of goodwill | | | 21.7 | | | | — | | | | — | | | | — | | | | — | |
Amortization of intangible assets | | | 20.5 | | | | 25.2 | | | | 24.2 | | | | 23.8 | | | | 26.4 | |
| | | | | | | | | | | | | | | | | | | | |
Operating profit | | | 47.2 | | | | 72.9 | | | | 70.5 | | | | 49.4 | | | | 30.1 | |
Other income, net | | | (8.7 | ) | | | (8.5 | ) | | | (11.9 | ) | | | (9.5 | ) | | | (4.8 | ) |
Finance expense | | | 0.5 | | | | 0.3 | | | | 1.3 | | | | 2.9 | | | | 3.6 | |
| | | | | | | | | | | | | | | | | | | | |
Profit before income taxes | | | 55.3 | | | | 81.1 | | | | 81.0 | | | | 55.9 | | | | 31.3 | |
Provision for income taxes | | | 17.5 | | | | 21.2 | | | | 22.4 | | | | 14.3 | | | | 9.9 | |
| | | | | | | | | | | | | | | | | | | | |
Profit | | $ | 37.8 | | | $ | 59.9 | | | $ | 58.6 | | | $ | 41.6 | | | $ | 21.4 | |
| | | | | | | | | | | | | | | | | | | | |
Earnings per share of ordinary share: | | | | | | | | | | | | | | | | | | | | |
Basic | | $ | 0.75 | | | $ | 1.17 | | | $ | 1.14 | | | $ | 0.82 | | | $ | 0.43 | |
Diluted | | $ | 0.71 | | | $ | 1.12 | | | $ | 1.10 | | | $ | 0.79 | | | $ | 0.41 | |
Basic weighted average ordinary shares outstanding | | | 50,582,852 | | | | 51,372,117 | | | | 51,633,516 | | | | 50,958,864 | | | | 50,309,140 | |
Diluted weighted average ordinary shares outstanding | | | 52,940,308 | | | | 53,639,670 | | | | 53,428,981 | | | | 52,689,157 | | | | 51,711,532 | |
4
| | | | | | | | | | | | | | | | | | | | |
| | | As at March 31, | |
| | | 2017 | | | 2016 | | | 2015 | | | 2014 | | | 2013 | |
| | | (US dollars in millions) | |
Consolidated statement of financial position data: | | | | | | | | | | | | |
Assets | | | | | | | | | | | | |
Cash and cash equivalents | | $ | 69.8 | | | $ | 41.9 | | | $ | 32.4 | | | $ | 33.7 | | | $ | 27.9 | |
Investments | | | 112.0 | | | | 133.0 | | | | 133.5 | | | | 83.8 | | | | 46.5 | |
Trade receivables including unbilled revenue, net | | | 109.3 | | | | 99.2 | | | | 95.5 | | | | 96.7 | | | | 90.0 | |
Other current assets(2) | | | 71.9 | | | | 48.4 | | | | 53.7 | | | | 39.6 | | | | 39.5 | |
| | | | | | | | | | | | | | | | | | | | |
Total current assets | | | 363.0 | | | | 322.5 | | | | 315.1 | | | | 253.9 | | | | 203.8 | |
| | | | | | | | | | | | | | | | | | | | |
Goodwill and intangible assets, net | | | 230.6 | | | | 103.4 | | | | 122.4 | | | | 152.9 | | | | 179.2 | |
Property and equipment, net | | | 54.8 | | | | 50.4 | | | | 48.2 | | | | 45.2 | | | | 48.4 | |
Deferred tax assets | | | 16.7 | | | | 22.5 | | | | 21.3 | | | | 37.1 | | | | 41.6 | |
Investments | | | 0.4 | | | | — | | | | — | | | | 28.7 | | | | 43.2 | |
Othernon-current assets(3) | | | 38.5 | | | | 26.7 | | | | 23.3 | | | | 20.8 | | | | 18.6 | |
| | | | | | | | | | | | | | | | | | | | |
Totalnon-current assets | | | 341.1 | | | | 203.0 | | | | 215.2 | | | | 284.6 | | | | 331.1 | |
| | | | | | | | | | | | | | | | | | | | |
Total assets | | | 704.1 | | | | 525.5 | | | | 530.3 | | | | 538.4 | | | | 534.9 | |
| | | | | | | | | | | | | | | | | | | | |
Liabilities and equity | | | | | | | | | | | | |
Current portion of long term debt | | | 27.6 | | | | — | | | | 12.8 | | | | 12.6 | | | | 7.7 | |
Trade payables | | | 14.2 | | | | 19.9 | | | | 22.7 | | | | 29.1 | | | | 29.3 | |
Other current liabilities(4) | | | 106.9 | | | | 83.5 | | | | 92.5 | | | | 143.2 | | | | 145.4 | |
| | | | | | | | | | | | | | | | | | | | |
Total current liabilities | | | 148.7 | | | | 103.4 | | | | 128.0 | | | | 184.8 | | | | 182.4 | |
| | | | | | | | | | | | | | | | | | | | |
Long term debt | | | 89.1 | | | | — | | | | — | | | | 13.5 | | | | 33.7 | |
Othernon-current liabilities(5) | | | 51.2 | | | | 13.9 | | | | 13.2 | | | | 15.1 | | | | 18.2 | |
| | | | | | | | | | | | | | | | | | | | |
Totalnon-current liabilities | | | 140.3 | | | | 13.9 | | | | 13.2 | | | | 28.6 | | | | 51.9 | |
| | | | | | | | | | | | | | | | | | | | |
Share capital (ordinary shares $0.16 (10 pence) par value, authorized 60,000,000 shares; issued: 53,312,559, 52,406,304, 51,950,662, 51,347,538 and 50,588,044 shares each as at March 31, 2017, 2016, 2015, 2014 and 2013, respectively) | | | 8.3 | | | | 8.2 | | | | 8.1 | | | | 8.0 | | | | 7.9 | |
Share premium | | | 338.3 | | | | 306.9 | | | | 286.8 | | | | 276.6 | | | | 269.3 | |
Other shareholders’ equity (6) | | | 163.2 | | | | 123.6 | | | | 94.2 | | | | 40.3 | | | | 23.4 | |
| | | | | | | | | | | | | | | | | | | | |
Total shareholders’ equity, including shares held in treasury | | | 509.8 | | | | 438.7 | | | | 389.1 | | | | 325.0 | | | | 300.6 | |
| | | | | | | | | | | | | | | | | | | | |
Less: 3,300,000 shares as at March 31, 2017, 1,100,000 shares as at March 31, 2016 and Nil shares as at March 31, 2015, 2014, and 2013, held in treasury, at cost | | | (94.7 | ) | | | (30.5 | ) | | | — | | | | — | | | | — | |
| | | | | | | | | | | | | | | | | | | | |
Total shareholders’ equity | | | 415.1 | | | | 408.2 | | | | 389.1 | | | | 325.0 | | | | 300.6 | |
| | | | | | | | | | | | | | | | | | | | |
Total liabilities and equity | | $ | 704.1 | | | $ | 525.5 | | | $ | 530.3 | | | $ | 538.4 | | | $ | 534.9 | |
| | | | | | | | | | | | | | | | | | | | |
5
The following table sets forth for the periods indicated selected consolidated financial data,non-GAAP financial data and operating data:
| | | | | | | | | | | | | | | | | | | | |
| | | For the year ended March 31, | |
| | | 2017 | | | 2016 | | | 2015 | | | 2014 | | | 2013 | |
| | | (US dollars in millions, except percentages and employee data) | |
Other Consolidated Financial Data: | | | | | | | | | | | | | | | | | | | | |
Revenue | | $ | 602.5 | | | $ | 562.2 | | | $ | 533.9 | | | $ | 502.6 | | | $ | 460.3 | |
Gross profit as a percentage of revenue | | | 33.1 | % | | | 35.0 | % | | | 35.8 | % | | | 34.8 | % | | | 32.4 | % |
Operating income as a percentage of revenue | | | 7.8 | % | | | 13.0 | % | | | 13.2 | % | | | 9.8 | % | | | 6.5 | % |
Non-GAAP Financial Data: | | | | | | | | | | | | | | | | | | | | |
Revenue less repair payments(non-GAAP)(7) | | $ | 578.4 | | | $ | 531.0 | | | $ | 503.0 | | | $ | 471.5 | | | $ | 436.1 | |
Gross profit as a percentage of revenue less repair payments(non-GAAP) | | | 34.4 | % | | | 37.1 | % | | | 38.0 | % | | | 37.1 | % | | | 34.2 | % |
Operating income as a percentage of revenue less repair payments(non-GAAP) | | | 8.2 | % | | | 13.7 | % | | | 14.0 | % | | | 10.5 | % | | | 6.9 | % |
Operating Data: | | | | | | | | | | | | | | | | | | | | |
Number of employees (at year end) | | | 33,968 | | | | 32,388 | | | | 28,890 | | | | 27,020 | | | | 25,520 | |
Notes:
| (1) | Includes the following share-based compensation expense amounts: |
| | | | | | | | | | | | | | | | | | | | |
| | | For the year ended March 31, | |
| | | 2017 | | | 2016 | | | 2015 | | | 2014 | | | 2013 | |
| | | (US dollars in millions) | |
Cost of revenue | | $ | 2.8 | | | $ | 1.9 | | | $ | 0.8 | | | $ | 1.3 | | | $ | 1.0 | |
Selling and marketing expenses | | $ | 1.7 | | | $ | 1.4 | | | $ | 0.8 | | | $ | 0.6 | | | $ | 0.4 | |
General and administrative expenses | | $ | 18.5 | | | $ | 14.6 | | | $ | 7.9 | | | $ | 5.0 | | | $ | 3.9 | |
| (2) | Consists of funds held for clients, derivative assets and prepayments and other current assets. |
| (3) | Consists ofnon-current portion of derivative assets and othernon-current assets. |
| (4) | Consists of provisions and accrued expenses, derivative liabilities, pension and other employee obligations, short term line of credit, deferred revenue, current taxes payable and other liabilities. |
| (5) | Consists ofnon-current portion of derivatives liabilities, pension and other employee obligations, deferred revenue, deferred tax liabilities and othernon-current liabilities. |
| (6) | Consists of retained earnings and other components of equity. |
6
| (7) | Revenue less repair payments is anon-GAAP financial measure which is calculated as (a) revenue less (b) in our auto claims business, payments to repair centers (1) for “fault” repair cases where we act as the principal in our dealings with the third party repair centers and our clients and (2) for“non-fault” repair cases with respect to one former client (whose contract with us was terminated with effect from April 18, 2012). The following table reconciles our revenue (a GAAP financial measure) to revenue less repair payments (anon-GAAP financial measure) for the indicated periods: |
| | | | | | | | | | | | | | | | | | | | |
| | | For the year ended March 31, | |
| | | 2017 | | | 2016 | | | 2015 | | | 2014 | | | 2013 | |
| | | (US dollars in millions) | |
Revenue (GAAP) | | $ | 602.5 | | | $ | 562.2 | | | $ | 533.9 | | | $ | 502.6 | | | $ | 460.3 | |
Less: Payments to repair centers(a) | | | 24.1 | | | | 31.2 | | | | 30.9 | | | | 31.1 | | | | 24.1 | |
| | | | | | | | | | | | | | | | | | | | |
Revenue less repair payments(non-GAAP) | | $ | 578.4 | | | $ | 531.0 | | | $ | 503.0 | | | $ | 471.5 | | | $ | 436.1 | |
| | | | | | | | | | | | | | | | | | | | |
Note:
| (a) | Consists of payments to repair centers in our auto claims business (1) for “fault” repair cases where we act as the principal in our dealings with the third party repair centers and our clients and (2) for“non-fault” repair cases with respect to one former client as discussed below. |
We have two reportable segments for financial statement reporting purposes — WNS Global BPM and WNS Auto Claims BPM. In our WNS Auto Claims BPM segment, we provide both “fault” and“non-fault” repairs. For “fault” repairs, we provide claims handling and repair management services, where we arrange for automobile repairs through a network of third party repair centers. Effective July 1, 2015, WNS Legal Assistance LLP, a subsidiary of WNS Assistance Limited, received an approval from the Solicitors Regulatory Authority, UK, to provide legal services in relation to personal injury claims. In our repair management services, where we act as the principal in our dealings with the third party repair centers and our clients, the amounts which we invoice to our clients for payments made by us to third party repair centers are reported as revenue. Where we are not the principal in providing the services, we record revenue from repair services net of repair cost. Since we wholly subcontract the repairs to the repair centers, we evaluate the financial performance of our “fault” repair business based on revenue less repair payments(non-GAAP) to third party repair centers, which is anon-GAAP financial measure. We believe that revenue less repair payments(non-GAAP) for “fault” repairs reflects more accurately the value addition of the business process management services that we directly provide to our clients.
For our“non-fault” repairs business, we generally provide a consolidated suite of accident management services including credit hire and credit repair, and we believe that measurement of such business on a basis that includes repair payments in revenue is appropriate. Revenue including repair payments is therefore used as a primary measure to allocate resources and measure operating performance for accident management services provided in our“non-fault” repairs business. For one former client in our“non-fault” repairs business (whose contract with us was terminated with effect from April 18, 2012), we provided only repair management services where we wholly subcontracted the repairs to the repair centers (similar to our “fault” repairs). Accordingly, we evaluated the financial performance of our business with this former client in a manner similar to how we evaluate our financial performance for our “fault” repairs business, that is, based on revenue less repair payments(non-GAAP). Our“non-fault” repairs business where we provide accident management services, accounts for a relatively small portion of our revenue for our WNS Auto Claims BPM segment.
Thisnon-GAAP financial information is not meant to be considered in isolation or as a substitute for our financial results prepared in accordance with GAAP. We believe that the presentation of thisnon-GAAP financial measure in this annual report provides useful information for investors regarding the financial performance of our business and our two reportable segments. Our revenue less repair payments(non-GAAP) may not be comparable to similarly titled measures reported by other companies due to potential differences in the method of calculation.
B. Capitalization and Indebtedness
Not applicable.
7
C. Reason for the Offer and the Use of Proceeds
Not applicable.
D. Risk Factors
This annual report contains forward-looking statements that involve risks and uncertainties. Our actual results could differ materially from those anticipated in these forward-looking statements as a result of a number of factors, including those described in the following risk factors and elsewhere in this annual report. If any of the following risks actually occur, our business, financial condition and results of operations could suffer and the trading price of our ADSs could decline.
Risks Related to Our Business
The global economic andgeo-political conditions have been challenging and have had, and may continue to have, an adverse effect on the financial markets and the economy in general, which has had, and may continue to have, a material adverse effect on our business, our financial performance and the prices of our equity shares and ADSs.
Global economic conditions continue to show signs of turbulence. Although some key indicators of sustainable economic growth show signs of improvement, volatility in the domestic politics of major markets may lead to changes in the institutional framework of the international economy.
In June 2016, a majority of voters in the United Kingdom elected to withdraw from the European Union in a national referendum. The referendum was advisory, and the terms of any withdrawal are subject to a negotiation period that could last at least two years after the government of the United Kingdom formally initiated a withdrawal process on March 29, 2017, putting the United Kingdom on track to leave the European Union by April 2019. The referendum has created significant uncertainty about the future relationship between the United Kingdom and the European Union, including with respect to the laws and regulations that will apply as the United Kingdom determines which European Union-derived laws to replace or replicate in the event of a withdrawal. The referendum has also given rise to calls for the governments of other European Union member states to consider withdrawal. These developments, or the perception that any of them could occur, have had and may continue to have a material adverse effect on global economic conditions and the stability of global financial markets, and may significantly reduce global market liquidity and restrict the ability of key market participants to operate in certain financial markets. Any of these factors could depress economic activity and restrict our access to capital, which could have a material adverse effect on our business, financial condition and results of operations.
39.6% of our revenues and 37.0% of our revenue less repair payments(non-GAAP) for fiscal 2017 and 46.9% of our revenues and 43.8% of our revenue less repair payments(non-GAAP) for fiscal 2016, respectively, are denominated in pound sterling. The extent and duration of any potential decline in the value of the pound sterling to the U.S. dollar and other currencies is unknown at this time. A long-term reduction in the value of the pound sterling as a result of the U.K. referendum could adversely impact our earnings growth rate and profitability. We believe that our hedging program is effective and it substantially protects us against fluctuations in foreign currency exchange rates through a mix of forwards and options for this current fiscal year.
China continues to have room for economic growth, but such growth opportunities remain subject to political developments and uncertainties in the regulatory framework of the economy. In the US, economic growth is tempered by continuing concerns over the failure to achieve a long term solution to the issues of government spending, the increasing US national debt, and their negative impact on the US economy as well as concerns over potential increases in cost of borrowing and reduction in availability of credit as the US Federal Reserve begins raising interest rates. The policies that may be pursued by the presidential administration in the US (such as the border adjustment tax under consideration) have added further uncertainty to the global economy, and the prevailing political climate may lead to more protectionist policies. Globally, countries may require additional financial support, sovereign credit ratings may continue to decline, and there may be default on sovereign debt obligations of certain countries. Any of these may increase the cost of borrowing and cause credit to become more limited. Further, there continue to be signs of economic weakness, such as relatively high levels of unemployment, in major markets including Europe. Continuing conflicts and instability in various regions around the world may lead to additional acts of terrorism, and armed conflict around the world. The ongoing refugee crisis in Europe, North Africa and the Middle East may contribute to political and economic instability in those regions. A resurgence of isolationist and/or protectionist policies in North America, Europe and Asia may curtail global economic growth.
These economic andgeo-political conditions may affect our business in a number of ways. The general level of economic activity, such as decreases in business and consumer spending, could result in a decrease in demand for our services, thus reducing our revenue. The cost and availability of credit has been and may continue to be adversely affected by illiquid credit markets and wider credit spreads. Continued turbulence or uncertainty in the European, US, Asian and international financial markets and economies may adversely affect our liquidity and financial condition, and the liquidity and financial condition of our customers. If these market conditions continue or worsen, they may limit our ability to access financing or increase our cost of financing to meet liquidity needs, and affect the ability of our customers to use credit to purchase our services or to make timely payments to us, resulting in adverse effects on our financial condition and results of operations.
8
Changing economic conditions may have an effect on foreign exchange rates, which in turn may affect our business. For further information, see “— Currency fluctuations among the Indian rupee, the pound sterling, the US dollar, the Australian dollar and the South African rand could have a material adverse effect on our results of operations.”
9
Uncertainty about current global economic conditions could also continue to increase the volatility of our share price. We cannot predict the timing or duration of an economic slowdown or the timing or strength of a subsequent economic recovery generally or in our targeted industries, including the travel and leisure and insurance industries. If macroeconomic conditions worsen or current global economic conditions continue for a prolonged period of time, we are not able to predict the impact that such worsening conditions will have on our targeted industries in general, and our results of operations specifically.
A few major clients account for a significant portion of our revenue and any loss of business from these clients could reduce our revenue and significantly harm our business.
We have derived and believe that we will continue to derive in the near term a significant portion of our revenue from a limited number of large clients. In fiscal 2017 and 2016, our five largest clients accounted for 32.1% and 30.7% of our revenue and 33.5% and 32.5% of our revenue less repair payments(non-GAAP), respectively. In fiscal 2017 and 2016, our three largest clients accounted for 21.5% and 24.0% of our revenue and 22.4% and 25.4% of our revenue less repair payments(non-GAAP), respectively. In fiscal 2017, our largest client, Aviva Global Services (Management Services) Private Limited (“Aviva MS”), individually accounted for 9.0% and 9.4% of our revenue and revenue less repair payments(non-GAAP), respectively, as compared to 10.9% and 11.6% in fiscal 2016, respectively. Any loss of business from any major client could reduce our revenue and significantly harm our business.
For example, in line with our expectations, one of our top five clients by revenue contribution in fiscal 2014 and 2013, an online travel agency (“OTA”), provided us with lower volume of business in fiscal 2015 as the OTA entered into a strategic marketing agreement with another OTA in August 2013, pursuant to which, it, over a period of time, from the fourth quarter of fiscal 2014 to the fourth quarter of fiscal 2015, moved its customer care and sales processes that were previously managed by us to a technology platform managed by the other OTA. As a result, we lost most of our business from that OTA and since June 2015, we ceased to provide services to that OTA. That OTA accounted for 2.5%, 6.1% and 7.3% of our revenue and 2.6%, 6.5% and 7.7% of our revenue less repair payments(non-GAAP) in fiscal 2015, 2014 and 2013, respectively. The other OTA uses several BPM vendors to manage such processes on their technology platform. We are approved as one of the other OTA’s providers of BPM services. We have managed to compete with incumbent BPM vendors for the other OTA’s business and the other OTA has become one of our large clients.
Revenue from Aviva MS under our master services agreement with Aviva MS (the “Aviva master services agreement”) accounts for a significant portion of our revenue and we expect our dependence on Aviva MS to continue for the foreseeable future. The terms of the Aviva master services agreement include termination at will provisions which permit Aviva MS to terminate the agreement without cause with 180 days’ notice upon payment of a termination fee.
In addition, the volume of work performed for specific clients is likely to vary from year to year, particularly since we may not be the exclusive outside service provider for our clients. Thus, a major client in one year may not provide the same level of revenue in any subsequent year. For example, revenue from Aviva MS has decreased in fiscal 2017 and 2016 from fiscal 2015. Part of this decline in revenue is attributable to revised pricing terms and part is attributable to a reduction of services due to automation performed by Aviva MS on their end. The loss of some or all of the business of any large client could have a material adverse effect on our business, results of operations, financial condition and cash flows. A number of factors other than our performance could cause the loss of or reduction in business or revenue from a client, and these factors are not predictable. For example, a client may demand price reductions, change its outsourcing strategy or move workin-house. A client may also be acquired by a company with a different outsourcing strategy that intends to switch to another business process management service provider or return workin-house.
Our revenue is highly dependent on clients concentrated in a few industries, as well as clients located primarily in Europe and the US. Economic slowdowns or factors that affect these industries or the economic environment in Europe or the US could reduce our revenue and seriously harm our business.
A substantial portion of our clients are concentrated in the insurance industry and the travel and leisure industry. In fiscal 2017 and 2016, 29.6% and 32.4% of our revenue, respectively, and 26.6% and 28.4% of our revenue less repair payments(non-GAAP), respectively, were derived from clients in the insurance industry. During the same periods, clients in the travel and leisure industry contributed 21.3% and 19.6% of our revenue, respectively, and 22.1% and 20.7% of our revenue less repair payments(non-GAAP), respectively. Our business and growth largely depend on continued demand for our services from clients in these industries and other industries that we may target in the future, as well as on trends in these industries to outsource business processes.
10
Turbulence in the global economy affects both the industries in which our clients are concentrated and the geographies in which we do business. For further details, see “ — The global economic andgeo-political conditions have been challenging and have had, and may continue to have, an adverse effect on the financial markets and the economy in general, which has had, and may continue to have, a material adverse effect on our business, our financial performance and the prices of our equity shares and ADSs.” Certain of our targeted industries are especially vulnerable to crises in the financial and credit markets and potential economic downturns. A downturn in any of our targeted industries, particularly the insurance or travel and leisure industries, a slowdown or reversal of the trend to offshore business process outsourcing in any of these industries or the introduction of regulation which restricts or discourages companies from outsourcing could result in a decrease in the demand for our services and adversely affect our results of operations. For example, as a result of the mortgage market crisis, in August 2007, First Magnus Financial Corporation (“FMFC”), a US mortgage services client, filed a voluntary petition for relief under Chapter 11 of the US Bankruptcy Code. FMFC was a major client of Trinity Partners Inc. which we acquired in November 2005 from the First Magnus Group and became one of our major clients. In fiscal 2008 and 2007, FMFC accounted for 1.0% and 4.3% of our revenue, respectively, and 1.4% and 6.8% of our revenue less repair payments(non-GAAP), respectively.
Further, the uncertainty in worldwide economic and business conditions could result in a few of our clients reducing or postponing their outsourced business requirements, which in turn could decrease the demand for our services and adversely affect our results of operations. In particular, our revenue is highly dependent on the economic environments in Europe and the US, which continue to show signs of economic weakness or uncertainty, particularly weaker economic growth and low inflation in the EU and continued uncertainty in the US. In fiscal 2017 and 2016, 47.5% and 53.3% of our revenue, respectively, and 45.3% and 50.6% of our revenue less repair payments(non-GAAP), respectively, were derived from clients located in Europe (including the UK). During the same periods, 32.6% and 27.6% of our revenue, respectively, and 33.9% and 29.3% of our revenue less repair payments(non-GAAP), respectively, were derived from clients located in North America (primarily the US). Any further weakening of or uncertainty in the European or US economy will likely have a further adverse impact on our revenue.
Other developments may also lead to a decline in the demand for our services in these industries. Significant changes in the financial services industry or any of the other industries on which we focus, or a consolidation in any of these industries or acquisitions, particularly involving our clients, may decrease the potential number of buyers of our services and have an adverse impact on our profitability. Any significant reduction in or the elimination of the use of the services we provide within any of these industries would result in reduced revenue and harm our business. Our clients may experience rapid changes in their prospects, substantial price competition and pressure on their profitability. Although such pressures can encourage outsourcing as a cost reduction measure, they may also result in increasing pressure on us from clients in these key industries to lower our prices which could negatively affect our business, results of operations, financial condition and cash flows.
11
Currency fluctuations among the Indian rupee, the pound sterling, the US dollar, the Australian dollar, the South African rand and the Philippines peso could have a material adverse effect on our results of operations.
Although substantially all of our revenue is denominated in pound sterling, US dollars, and to a lesser extent, Australian dollars and South African rand, a significant portion of our expenses (other than payments to repair centers, which are primarily denominated in pound sterling) are incurred and paid in Indian rupees and, to a lesser extent, in South African rand and Philippines pesos. Therefore, a weakening of the rate of exchange for the pound sterling, the US dollar or the Australian dollar against the Indian rupee or, to a lesser extent, a weakening of the pound sterling against the South African rand or the Philippines pesos would adversely affect our results. Furthermore, we report our financial results in US dollars and our results of operations would be adversely affected if the pound sterling or Australian dollar depreciates against the US dollar, or if the Indian rupee or, to a lesser extent, the South African rand or the Philippines peso appreciates against the US dollar. Although the expected shift in US monetary policy to increase short term interest rates may strengthen the US dollar against a number of currencies, particularly against emerging market currencies, fluctuations between the pound sterling, the Indian rupee, the South African rand, the Australian dollar or the Philippines peso, on the one hand, and the US dollar, on the other hand, also expose us to translation risk when transactions denominated in such currencies are translated to US dollars, our reporting currency. The exchange rates between each of the pound sterling, Indian rupee, South African rand, Australian dollar and Philippines peso, on the one hand, and the US dollar, on the other hand, have changed substantially in recent years and may fluctuate substantially in the future.
The referendum in the United Kingdom regarding withdrawal from the EU has created uncertainty in the British and European economies as the United Kingdom begins to negotiate the terms of its withdrawal, and in the global economy as a whole. See “—The global economic andgeo-political conditions have been challenging and have had, and may continue to have, an adverse effect on the financial markets and the economy in general, which has had, and may continue to have, a material adverse effect on our business, our financial performance and the prices of our equity shares and ADSs.” These developments have caused, and may continue to cause, volatility in the exchange rates between the pound sterling and other currencies.
The average pound sterling to US dollar exchange rate was approximately £0.76 per $1.00 in fiscal 2017, which represented a depreciation of the pound sterling by an average of 13.4% as compared with the average exchange rate of £0.66 per $1.00 in fiscal 2016, which in turn represented a depreciation of the pound sterling by an average of 6.4% as compared with the average exchange rate of approximately £0.62 per $1.00 in fiscal 2015.
The average Indian rupee to US dollar exchange rate was approximately₹67.10 per $1.00 in fiscal 2017, which represented a depreciation of the Indian rupee by an average of 2.6% as compared with the average exchange rate of approximately₹65.43 per $1.00 in fiscal 2016, which in turn represented a depreciation of the Indian rupee by an average of 7.1% as compared with the average exchange rate of approximately₹61.12 per $1.00 in fiscal 2015.
The average South African rand exchange rate was approximately R14.07 per $1.00 in fiscal 2017, which represented a depreciation of the South African rand by an average of 2.3% as compared with the average exchange rate of approximately R13.75 per $1.00 in fiscal 2016, which in turn represented a depreciation of the South African rand by an average of 24.3% as compared with the average exchange rate of approximately R11.07 per $1.00 in fiscal 2015.
The average Australian dollar exchange rate was approximately A1.33 per $1.00 in fiscal 2017, which represented an appreciation of the Australian dollar by an average of 2.1% as compared with the average exchange rate of approximately A1.36 per $1.00 in fiscal 2016, which in turn represented a depreciation of the Australian dollar by an average of 15.8% as compared with the average exchange rate of approximately A1.14 per $1.00 in fiscal 2015.
The average Philippines peso exchange rate was approximately PHP 48.18 per $1.00 in fiscal 2017, which represented a depreciation of the Philippines peso by an average of 4.2% as compared with the average exchange rate of approximately PHP 46.22 per $1.00 in fiscal 2016, which in turn represented a depreciation of the Philippines peso by an average of 4.3% as compared with the average exchange rate of approximately PHP 44.31 per $1.00 in fiscal 2015.
Our results of operations would be adversely affected if the Indian rupee appreciates significantly against the pound sterling or the US dollar or if the pound sterling or the Australian dollar depreciates against the US dollar or, to a lesser extent, the South African rand or the Philippines peso appreciates significantly against the US dollar. For example, the depreciation of the South African rand against the US dollar in fiscal 2017 and 2016 and the appreciation of the Australian dollar against the US dollar in fiscal 2017 positively impacted our results of operations in these years, whereas the depreciation of the pound sterling against the US dollar in fiscal 2017 and 2016 and the depreciation of the Australian dollar against the US dollar in fiscal 2016 negatively impacted our results of operations in these years.
We hedge a portion of our foreign currency exposures using options and forward contracts. We cannot assure you that our hedging strategy will be successful or will mitigate our exposure to currency risk.
12
The international nature of our business exposes us to several risks, such as significant currency fluctuations and unexpected changes in the regulatory requirements of multiple jurisdictions.
We have operations in China, Costa Rica, India, the Philippines, Poland, Romania, South Africa, Sri Lanka, the UK and the US, and we service clients across Asia, Europe, South Africa, Australia and North America. Our corporate structure also spans multiple jurisdictions, with our parent holding company incorporated in Jersey, Channel Islands, and intermediate and operating subsidiaries (including branch offices) incorporated in Australia, China, Costa Rica, France, India, Mauritius, the Netherlands, the Philippines, Romania, South Africa, Singapore, Sri Lanka, Turkey, the United Arab Emirates, the UK and the US. As a result, we are exposed to risks typically associated with conducting business internationally, many of which are beyond our control. These risks include:
| | • | | significant currency fluctuations between the US dollar and the pound sterling (in which our revenue is principally denominated) and the Indian rupee (in which a significant portion of our costs are denominated), for more information, see “ — Currency fluctuations among the Indian rupee, the pound sterling and the US dollar could have a material adverse effect on our results of operations”; |
| | • | | legal uncertainty owing to the overlap of different legal regimes, and problems in asserting contractual or other rights across international borders; |
13
| | • | | potentially adverse tax consequences, such as scrutiny of transfer pricing arrangements by authorities in the countries in which we operate; |
| | • | | potential tariffs and other trade barriers; |
| | • | | unexpected changes in legal regimes and regulatory requirements; |
| | • | | policy changes due to changes in government; |
| | • | | the burden and expense of complying with the laws and regulations of various jurisdictions; and |
| | • | | terrorist attacks and other acts of violence or war. |
For example, during the fourth quarter of fiscal 2017, proposed changes to the laws of the UK governing personal injury claims generated uncertainty regarding the future earnings trajectory of our legal services business in our WNS Auto Claims BPM segment, as a result of which we expect that we will eventually exit from providing legal services in relation to personal injury claims. We have also experienced a decrease in volume of and loss of business from certain clients of our traditional repair services in our WNS Auto Claims BPM segment. As a result, we expect the future performance of our WNS Auto Claims BPM segment to decline significantly and we have therefore significantly reduced our financial projections and estimates of our WNS Auto Claims BPM segment. We performed an impairment review of the goodwill associated with the companies we had acquired for our auto claims business and recorded an impairment charge of $21.7 million to our results of operations for fiscal 2017. The occurrence of other changes in legal regimes or regulatory requirements, or any other events associated with the risks of conducting business internationally, could have a material adverse effect on our results of operations and financial condition.
Our global operations expose us to numerous and sometimes conflicting legal and regulatory requirements. Failure to adhere to the laws and regulations that govern our business or our clients’ businesses that we are required to comply with in performing our services could harm our business.
We have operations in eleven countries and our corporate structure spans multiple jurisdictions. Further, we service clients across multiple geographic regions and multiple industries. We are required to comply with numerous, and sometimes conflicting and uncertain, laws and regulations including on matters relating to import/export controls, trade restrictions, taxation, immigration, internal disclosure and control obligations, securities regulation, anti-competition, data privacy and protection, anti-corruption, and employment and labor relations. In addition, we are required to obtain and maintain permits and licenses for the conduct of our business in various jurisdictions. Our clients’ business operations are also subject to numerous regulations in the jurisdiction in which they operate or that are applicable to their industry, and our clients may contractually require that we perform our services in compliance with regulations applicable to them or in a manner that will enable them to comply with such regulations. For example, regulations that our clients’ business operations are subject to include the Gramm-Leach-Bliley Act, the Health Insurance Portability and Accountability Act and Health Information Technology for Economic and Clinical Health Act in the US and the Financial Services Act in the UK and upcoming regulations such as the General Data Protection Regulation in the European Union, which will be effective from May 2018. Regulatory changes may result in our exiting certain parts of our business.
On account of the global nature of our and our clients’ operations, compliance with diverse legal and regulatory requirements is difficult, time-consuming and requires significant resources. Further, the extent of development of legal systems varies across the countries in which we operate and local laws may not be adequately developed or be able to provide us clear guidance to sufficiently protect our rights. Specifically, in many countries including those in which we operate and/or seek to expand to, the practices of local businesses may not be in accord with international business standards and could violate anti-corruption laws and regulations, including the UK Bribery Act 2010 and the US Foreign Corrupt Practices Act 1977. Our employees, subcontractors, agents, business partners, the companies we acquire and their employees, subcontractors and agents, and other third parties with which we associate, could act in a manner which violates policies or procedures intended to ensure compliance with laws and regulations, including applicable anti-corruption laws or regulations.
Violations of such laws or regulations by us, our employees or any of these third parties could subject us to criminal or civil enforcement actions (whether or not we participated or were aware of the actions leading to the violations), including fines or penalties, breach of contract damages, disgorgement of profits and suspension or disqualification from work, any of which could materially and adversely affect our business, including our results of operations and our reputation. If we are unable to maintain our licenses, permits or other qualifications necessary to provide our services, we may not be able to provide services to existing clients or be able to attract new clients and could lose revenue, which could have a material adverse effect on our business.
14
We face competition from onshore and offshore business process management companies and from information technology companies that also offer business process management services. Our clients may also choose to run their business processes themselves, either in their home countries or through captive units located offshore.
The market for outsourcing services is very competitive and we expect competition to intensify and increase from a number of sources. We believe that the principal competitive factors in our markets are price, service quality, sales and marketing skills, and industry expertise. We face significant competition from our clients’ ownin-house groups including, in some cases,in-house departments operating offshore or captive units. Clients who currently outsource a significant proportion of their business processes or information technology services to vendors in India may, for various reasons, including diversifying geographic risk, seek to reduce their dependence on any one country. We also face competition from onshore and offshore business process management and information technology services companies. In addition, the trend toward offshore outsourcing, international expansion by foreign and domestic competitors and continuing technological changes will result in new and different competitors entering our markets.
These competitors may include entrants from the communications, software and data networking industries or entrants in geographic locations with lower costs than those in which we operate. Technological changes include the development of complex automated systems for the processing of transactions that are formerly labor intensive, which may reduce or replace the need for outsourcing such transaction processing.
Some of these existing and future competitors have greater financial, human and other resources, longer operating histories, greater technological expertise, more recognizable brand names and more established relationships in the industries that we currently serve or may serve in the future. In addition, some of our competitors may enter into strategic or commercial relationships among themselves or with larger, more established companies in order to increase their ability to address client needs, or enter into similar arrangements with potential clients. Increased competition, our inability to compete successfully against competitors, pricing pressures or loss of market share could result in reduced operating margins which could harm our business, results of operations, financial condition and cash flows.
Changes in technology could lead to changes in our clients’ businesses as well as their requirements for business process services, which may adversely impact our business and results of operations.
Proliferation of accessible technology, such as smartphones and internet, has had an impact on the manner in which customers and businesses interact with each other. Companies are increasingly adopting social media platforms, online self-help portals and mobile applications for communicating with and servicing their customers rather than utilizing business process management companies such as ourselves to manage these interactions. Our clients also continue to invest in technology by upgrading their platforms and application capabilities towards increased automation of transactions. Advances in software, such as robotic process automation and voice recognition, have the potential to reduce dependency on human processing transactions. Such developments and other innovations, such as autonomous vehicles, have the potential to significantly change the way our clients’ businesses operate and may reduce their dependency on business process management companies, including our company, for managing their business processes. We are therefore subject to a risk of disintermediation on account of such changes in technology, which could impact our future growth prospects and may require continued investments in our business.
If we cause disruptions to our clients’ businesses, provide inadequate service or are in breach of our representations or obligations, our clients may have claims for substantial damages against us. Our insurance coverage may be inadequate to cover these claims and, as a result, our profits may be substantially reduced.
Most of our contracts with clients contain service level and performance requirements, including requirements relating to the quality of our services and the timing and quality of responses to the client’s customer inquiries. In some cases, the quality of services that we provide is measured by quality assurance ratings and surveys which are based in part on the results of direct monitoring by our clients of interactions between our employees and our client’s customers. Failure to consistently meet service requirements of a client or errors made by our associates in the course of delivering services to our clients could disrupt the client’s business and result in a reduction in revenue or a claim for substantial damages against us. For example, some of our agreements stipulate standards of service that, if not met by us, will result in lower payment to us. In addition, in connection with acquiring new business from a client or entering into client contracts, our employees may make various representations, including representations relating to the quality of our services, abilities of our associates and our project management techniques. A failure or inability to meet a contractual requirement or our representations could seriously damage our reputation and affect our ability to attract new business or result in a claim for substantial damages against us.
15
Our dependence on our offshore delivery centers requires us to maintain active data and voice communications between our main delivery centers in China, Costa Rica, India, the Philippines, Poland, Romania, South Africa, Sri Lanka, Turkey, the UK and the US, our international technology hubs in the UK and the US and our clients’ offices. Although we maintain redundant facilities and communications links, disruptions could result from, among other things, technical and electricity breakdowns, computer glitches and viruses and adverse weather conditions. Any significant failure of our equipment or systems, or any major disruption to basic infrastructure like power and telecommunications in the locations in which we operate, could impede our ability to provide services to our clients, have a negative impact on our reputation, cause us to lose clients, reduce our revenue and harm our business.
We depend on human resources to process transactions for our clients. Disruptive incidents, includingman-made events such as civil strikes and shutdowns, may impact the ability of our employees to commute to and from our operating premises.Non-natural disasters, whether unintentional (such as those caused by accidents) or intentional (such as those caused by terrorist attacks), may also disrupt our operations. While we have implemented business continuity plans for clients where we have contractually agreed to do so, we may not always be able to provide services to our clients for the duration of such incidents.
Under our contracts with our clients, our liability for breach of our obligations is generally limited to actual damages suffered by the client and capped at a portion of the fees paid or payable to us under the relevant contract. Although our contracts contain limitations on liability, such limitations may be unenforceable or otherwise may not protect us from liability for damages. In addition, certain liabilities, such as claims of third parties for which we may be required to indemnify our clients, are generally not limited under those agreements. Further, although we have professional indemnity insurance coverage, the coverage may not continue to be available on reasonable terms or in sufficient amounts to cover one or more large claims and our insurers may disclaim coverage as to any future claims. The successful assertion of one or more large claims against us that exceed available insurance coverage, or changes in our insurance policies (including premium increases or the imposition of large deductible orco-insurance requirements), could have a material adverse effect on our business, reputation, results of operations, financial condition and cash flows.
16
Our facilities are at risk of damage by natural disasters.
Our operational facilities and communication hubs may be damaged in natural disasters such as earthquakes, floods, heavy rains, tsunamis and cyclones. For example, Chennai was affected by severe flooding in November 2015. Although our clients experienced minimal disruptions during the Chennai flood due to the business continuity planning and infrastructure resiliency measures that are designed to minimize the impact of natural disasters on our business which we have implemented, such measures may be rendered less effective in other circumstances. Such natural disasters may also lead to disruption to information systems and telephone service for sustained periods. Damage or destruction that interrupts our provision of BPM services could damage our relationships with our clients and may cause us to incur substantial additional expenses to repair or replace damaged equipment or facilities. We may also be liable to our clients for disruption in service resulting from such damage or destruction. While we currently have property damage insurance and business interruption insurance, our insurance coverage may not be sufficient. Furthermore, we may be unable to secure such insurance coverage at premiums acceptable to us in the future or secure such insurance coverage at all. Prolonged disruption of our services as a result of natural disasters would also entitle our clients to terminate their contracts with us.
We are liable to our clients for damages caused by unauthorized disclosure of sensitive or confidential information, whether through a breach or circumvention of our or our clients’ computer systems and processes, through our employees or otherwise.
We are typically required to manage, utilize and store sensitive or confidential client data in connection with the services we provide. Under the terms of our client contracts, we are required to keep such information strictly confidential. Our client contracts do not include any limitation on our liability to them with respect to breaches of our obligation to maintain confidentiality on the information we receive from them. Although we seek to implement measures to protect sensitive and confidential client data, there can be no assurance that we would be able to prevent breaches of security. Further, some of our projects require us to conduct business functions and computer operations using our clients’ systems over which we do not have control and which may not be compliant with industry security standards. In addition, some of the client designed processes that we are contractually required to follow for delivering services to them and which we are unable to unilaterally change, could be designed in a manner that allows for control weaknesses to exist and be exploited. Any vulnerability in a client’s system or client designed process, if exploited, could result in breaches of security or unauthorized transactions and result in a claim for substantial damages against us. If any person, including any of our employees, penetrates our or our clients’ network security or otherwise mismanages or misappropriates sensitive or confidential client data, we could be subject to significant liability and lawsuits from our clients or their customers for breaching contractual confidentiality provisions or privacy laws. Although we have insurance coverage for mismanagement or misappropriation of such information by our employees, that coverage may not continue to be available on reasonable terms or in sufficient amounts to cover one or more large claims against us, and our insurers may disclaim coverage as to any future claims. Penetration of the network security of our or our clients’ data centers or computer systems or unauthorized use or disclosure of sensitive or confidential client data, whether through breach of our or our clients’ computer systems, systems failure, loss or theft of assets containing confidential information or otherwise, could also have a negative impact on our reputation which would harm our business.
Our business could be materially and adversely affected if we do not protect our intellectual property or if our services are found to infringe on the intellectual property of others.
Our success depends in part on certain methodologies, practices, tools and technical expertise we utilize in designing, developing, implementing and maintaining applications and other proprietary intellectual property rights. In order to protect our rights in such intellectual properties, we rely upon a combination of nondisclosure and other contractual arrangements as well as trade secret, copyright and trademark laws. We also generally enter into confidentiality agreements with our employees, consultants, clients and potential clients, and limit access to and distribution of our proprietary information to the extent required for our business purpose.
India is a member of the Berne Convention, an international intellectual property treaty, and has agreed to recognize protections on intellectual property rights conferred under the laws of other foreign countries, including the laws of the United States. There can be no assurance that the laws, rules, regulations and treaties in effect in the United States, India and the other jurisdictions in which we operate and the contractual and other protective measures we take, are adequate to protect us from misappropriation or unauthorized use of our intellectual property, or that such laws will not change. We may not be able to detect unauthorized use and take appropriate steps to enforce our rights, and any such steps may not be successful. Infringement by others of our intellectual property, including the costs of enforcing our intellectual property rights, may have a material adverse effect on our business, results of operations and financial condition.
17
Our clients may provide us with access to, and require us to use, third party software in connection with our delivery of services to them. Our client contracts generally require our clients to indemnify us for any infringement of intellectual property rights or licenses to third party software when our clients provide such access to us. If the indemnities under our client contracts are inadequate to cover the damages and losses we suffer due to infringement of third party intellectual property rights or licenses to third party software to which we were given access, our business and results of operations could be adversely affected. We are also generally required, by our client contracts, to indemnify our clients for any breaches of intellectual property rights by our services. Although we believe that we are not infringing on the intellectual property rights of others, claims may nonetheless be successfully asserted against us in the future. The costs of defending any such claims could be significant, and any successful claim may require us to modify, discontinue or rename any of our services. Any such changes may have a material adverse effect on our business, results of operations and financial condition.
Our clients may terminate contracts before completion or choose not to renew contracts which could adversely affect our business and reduce our revenue.
The terms of our client contracts typically range from three to five years. Many of our client contracts can be terminated by our clients with or without cause, with three to six months’ notice and, in most cases, without penalty. The termination of a substantial percentage of these contracts could adversely affect our business and reduce our revenue. Contracts that will expire on or before March 31, 2018 (including work orders/statement of works that will expire on or before March 31, 2018) represented approximately 15.9% of our revenue and 16.6% of our revenue less repair payments(non-GAAP) from our clients in fiscal 2017. Failure to meet contractual requirements could result in cancellation ornon-renewal of a contract. Some of our contracts may be terminated by the client if certain of our key personnel working on the client project leave our employment and we are unable to find suitable replacements. In addition, a contract termination or significant reduction in work assigned to us by a major client could cause us to experience a higher than expected number of unassigned employees, which would increase our cost of revenue as a percentage of revenue until we are able to reduce or reallocate our headcount. We may not be able to replace any client that elects to terminate or not renew its contract with us, which would adversely affect our business and revenue.
For example, one of our largest auto claims clients by revenue contribution in fiscal 2012 terminated its contract with us with effect from April 18, 2012. This client accounted for 10.4% and 7.5% of our revenue and 1.3% and 1.9% of our revenue less repair payments(non-GAAP) in fiscal 2012 and 2011, respectively.
In addition, one of our top five clients by revenue contribution in fiscal 2014 and 2013, an OTA, provided us with a lower volume of business in fiscal 2015 as the OTA entered into a strategic marketing agreement with another OTA in August 2013 pursuant to which it over a period of time, from the fourth quarter of fiscal 2014 to the fourth quarter of fiscal 2015, moved its customer care and sales processes that were previously managed by us to a technology platform managed by the other OTA. As a result, we lost most of our business from that OTA and since June 2015, we ceased to provide services to that OTA. That OTA accounted for 2.5%, 6.1% and 7.3% of our revenue and 2.6%, 6.5% and 7.7% of our revenue less repair payments(non-GAAP) in fiscal 2015, 2014 and 2013, respectively. The other OTA uses several BPM vendors to manage such processes on their technology platform. We are approved as one of the other OTA’s providers of BPM services. We have managed to compete with incumbent BPM vendors for the other OTA’s business and the other OTA has become one of our large clients. For more information, see “— A few major clients account for a significant portion of our revenue and any loss of business from these clients could reduce our revenue and significantly harm our business.”
Some of our client contracts contain provisions which, if triggered, could result in lower future revenue and have an adverse effect on our business.
In many of our client contracts, we agree to include certain provisions which provide for downward revision of our prices under certain circumstances. For example, certain contracts allow a client in certain limited circumstances to request a benchmark study comparing our pricing and performance with that of an agreed list of other service providers for comparable services. Based on the results of the study and depending on the reasons for any unfavorable variance, we may be required to make improvements in the service we provide or to reduce the pricing for services to be performed under the remaining term of the contract. Some of our contracts also provide that, during the term of the contract and for a certain period thereafter ranging from six to 12 months, we may not provide similar services to certain or any of their competitors using the same personnel. These restrictions may hamper our ability to compete for and provide services to other clients in the same industry, which may result in lower future revenue and profitability.
Some of our contracts specify that if a change in control of our company occurs during the term of the contract, the client has the right to terminate the contract. These provisions may result in our contracts being terminated if there is such a change in control, resulting in a potential loss of revenue. Some of our client contracts also contain provisions that would require us to pay penalties to our clients if we do not meetpre-agreed service level requirements. Failure to meet these requirements could result in the payment of significant penalties by us to our clients which in turn could have an adverse effect on our business, results of operations, financial condition and cash flows.
18
Fraud and significant security breaches in our or our clients’ computer systems and network infrastructure could adversely impact our business.
Our business is dependent on the secure and reliable operation of our information systems, including those used to operate and manage our business and our clients’ information systems, whether operated by our clients themselves or by us in connection with our provision of services to them. Although we take adequate measures to safeguard against system-related and other fraud, there can be no assurance that we would be able to prevent fraud or even detect them on a timely basis, particularly where it relates to our clients’ information systems which are not managed by us. For example, we have identified incidences where our employees have allegedly exploited weaknesses in information systems as well as processes in order to misappropriate confidential client data and used such confidential data to record fraudulent transactions. We are generally required to indemnify our clients from third party claims arising out of such fraudulent transactions and our client contracts generally do not include any limitation on our liability to our clients’ losses arising from fraudulent activities by our employees. Accordingly, we may have significant liability arising from such fraudulent transactions which may materially affect our business and financial results. Although we have professional indemnity insurance coverage for losses arising from fraudulent activities by our employees, that coverage may not continue to be available on reasonable terms or in sufficient amounts to cover one or more large claims against us, and our insurers may also disclaim coverage as to any future claims. We may also suffer reputational harm as a result of fraud committed by our employees, or by our perceived inability to properly manage fraud related risks, which could in turn lead to enhanced regulatory oversight and scrutiny.
Our expansion into new markets may create additional challenges with respect to managing the risk of fraud due to the increased geographical dispersion and use of intermediaries. Our business also requires the appropriate and secure utilization of client and other sensitive information. We cannot be certain that advances in criminal capabilities (including cyber-attacks or cyber intrusions over the internet, malware, computer viruses and the like), discovery of new vulnerabilities or attempts to exploit existing vulnerabilities in our or our clients’ systems, other data thefts, physical system or networkbreak-ins or inappropriate access, or other developments will not compromise or breach the technology protecting our or our client’s computer systems and networks that access and store sensitive information. Cyber threats, such as phishing and trojans, could intrude into our or our client’s network to steal data or to seek sensitive information. Any intrusion into our network or our client’s network (to the extent attributed to us or perceived to be attributed to us) that results in any breach of security could cause damage to our reputation and adversely impact our business and financial results. Although we have implemented security technology and operational procedures to prevent such occurrences, there can be no assurance that these security measures will be successful. A significant failure in security measures could have a material adverse effect on our business, reputation, results of operations and financial condition.
Our business may not develop in ways that we currently anticipate due to negative public reaction to offshore outsourcing, proposed legislation or otherwise.
We have based our strategy of future growth on certain assumptions regarding our industry, services and future demand in the market for such services. However, the trend to outsource business processes may not continue and could reverse. Offshore outsourcing is a politically sensitive topic in the UK, the US and elsewhere. For example, many organizations and public figures in the UK and the US have publicly expressed concern about a perceived association between offshore outsourcing providers and the loss of jobs in their home countries.
The issue of domestic companies outsourcing services to organizations operating in other countries is a topic of political discussion in the United States, as well as in Europe, Asia Pacific and other regions in which we have clients. Some countries and special interest groups have expressed concerns about a perceived association between offshore outsourcing and the loss of jobs in the domestic economy. This has resulted in increased political and media attention, especially in the United States, where the subject of outsourcing and immigration reform has been a focus of the current presidential administration. It is possible that there could be a change in the existing laws that would restrict offshore outsourcing or impose new standards that have the effect of restricting the use of certain visas in the foreign outsourcing context. The measures that have been enacted to date are generally directed at restricting the ability of government agencies to outsource work to offshore business service providers. These measures have not had a significant effect on our business because governmental agencies are not a focus of our operations. However, some legislative proposals would, for example, require contact centers to disclose their geographic locations, require notice to individuals whose personal information is disclosed tonon-US affiliates or subcontractors, require disclosures of companies’ foreign outsourcing practices, or restrict US private sector companies that have federal government contracts, federal grants or guaranteed loan programs from outsourcing their services to offshore service providers. Potential changes in tax laws, such as the border adjustment tax under consideration in the US, may also increase the overall costs of outsourcing or affect the balance of offshore and onshore business services. Such legislation could have an adverse impact on the economics of outsourcing for private companies in the US, which could in turn have an adverse impact on our business with US clients.
Such concerns have also led the UK and other EU jurisdictions to enact regulations which allow employees who are dismissed as a result of transfer of services, which may include outsourcing tonon-UK or EU companies, to seek compensation either from the company from which they were dismissed or from the company to which the work was transferred. This could discourage EU companies from outsourcing work offshore and/or could result in increased operating costs for us.
19
In addition, there has been publicity about the negative experiences, such as theft and misappropriation of sensitive client data, of various companies that use offshore outsourcing, particularly in India.
Current or prospective clients may elect to perform such services themselves or may be discouraged from transferring these services from onshore to offshore providers to avoid negative perceptions that may be associated with using an offshore provider. Any slowdown or reversal of existing industry trends towards offshore outsourcing would seriously harm our ability to compete effectively with competitors that operate out of facilities located in the UK or the US.
Adverse changes to our relationships with the companies with whom we have an alliance or in the business of the companies with whom we have an alliance could adversely affect our results of operations.
We have alliances with companies whose capabilities complement our own. For example, some of our services and solutions are based on technology, software or platforms provided by these companies. The priorities and objectives of these companies with whom we have an alliance may differ from ours. As most of our alliance relationships arenon-exclusive, these companies with whom we have an alliance are not prohibited from competing with us or forming closer or preferred arrangements with our competitors. One or more of these companies with whom we have an alliance may be acquired by a competitor, or may merge with each other, either of which could reduce our access over time to the technology, software or platforms provided by those companies. In addition, these companies with whom we have an alliance could experience reduced demand for their technology, software or platforms, including, for example, in response to changes in technology, which could lessen related demand for our services and solutions. If we do not obtain the expected benefits from our alliance relationships for any reason, we may be less competitive, our ability to offer attractive solutions to our clients may be negatively affected, which could have an adverse effect on our results of operations.
We may face difficulties as we expand our operations to establish delivery centers in onshore locations and offshore in countries in which we have limited or no prior operating experience.
In April 2014 our delivery center in South Carolina in the US became fully operational. We also opened an additional delivery center in Pennsylvania in the US in September 2014. In 2016, we opened an additional delivery center in the Philippines at Iloilo, and in fiscal 2017 we expanded into France, Germany and Turkey. We intend to continue to expand our global footprint in order to maintain an appropriate cost structure and meet our clients’ delivery needs. We plan to establish additional offshore delivery centers in the Asia Pacific and Europe, which may involve expanding into countries other than those in which we currently operate. Our expansion plans may also involve expanding into less developed countries, which may have less political, social or economic stability and less developed infrastructure and legal systems. As we expand our business into new countries we may encounter regulatory, personnel, technological and other difficulties that increase our expenses or delay our ability to start up our operations or become profitable in such countries. This may affect our relationships with our clients and could have an adverse effect on our business, results of operations, financial condition and cash flows.
We may be unable to effectively manage our growth and maintain effective internal controls, which could have a material adverse effect on our operations, results of operations and financial condition.
We were founded in April 1996, and we have experienced growth and significantly expanded our operations. For example, over the last seven fiscal years, our employees have increased to 33,968 as at March 31, 2017 from 21,958 as at March 31, 2010. In fiscal 2011, we expanded our delivery center in Romania. In fiscal 2013, we opened new facilities in Poland and Vishakhapatnam, or Vizag. In fiscal 2014, our facilities in China and Sri Lanka became operational. In fiscal 2015, our delivery centers in South Carolina and Pennsylvania, in the US, as well as in South Africa, became fully operational, as did our newest facility in China. In fiscal 2016, we added new facilities in Durban and Port Elizabeth, South Africa and Iloilo, the Philippines. In fiscal 2017, we added new facilities in Durban and Centurion, South Africa. We now have delivery centers across 11 countries in China, Costa Rica, India, the Philippines, Poland, Romania, South Africa, Sri Lanka, Turkey, the UK, and the US. Further, in February 2011, we receivedin-principle approval for the allotment of a piece of land on lease for a term of 99 years, measuring 5 acres in Tiruchirappalli Navalpattu, special economic zone (“SEZ”), in the state of Tamil Nadu, India from Electronics Corporation of Tamil Nadu Limited (“ELCOT”) for setting up delivery centers in the future. We intend to further expand our global delivery capability, and we are exploring plans to do so in Asia Pacific and Europe.
We have also completed numerous acquisitions. For example, in the first quarter of fiscal 2017, we acquired Value Edge Research Services Private Limited and its subsidiaries (“Value Edge”), a provider of commercial research and analytics services to clients in the pharma industry based in India, the United States and Europe. Value Edge had 129 employees as at March 31, 2017. In January 2017, we acquired Denali Sourcing Services, Inc. (“Denali”), a leading provider of strategic procurement BPM solutions based in the United States. With operations in United States, Turkey, China and India, Denali had 269 employees as at March 31, 2017. In March 2017, we acquired MTS HealthHelp Inc. and its subsidiaries (“HealthHelp”), an industry leader in care management based in the United States. HealthHelp had 406 employees as at March 31, 2017. For more information about more recent acquisitions, see “—We may not succeed in identifying suitable acquisition targets or integrating any acquired business into our operations, which could have a material adverse effect on our business, results of operations, financial conditions and cash flows.”
20
This growth places significant demands on our management and operational resources. In order to manage growth effectively, we must implement and improve operational systems, procedures and internal controls on a timely basis. If we fail to implement these systems, procedures and controls on a timely basis, we may not be able to service our clients’ needs, hire and retain new employees, pursue new business, complete future acquisitions or operate our business effectively. Failure to effectively transfer new client business to our delivery centers, properly budget transfer costs or accurately estimate operational costs associated with new contracts could result in delays in executing client contracts, trigger service level penalties or cause our profit margins not to meet our expectations or our historical profit margins. As a result of any of these potential problems associated with expansion, our business, results of operations, financial condition and cash flows could be materially and adversely affected.
Our executive and senior management team and other key team members in our business units are critical to our continued success and the loss of such personnel could harm our business.
Our future success substantially depends on the performance of the members of our executive and senior management team and other key team members in each of our business units. These personnel possess technical and business capabilities including domain expertise that are difficult to replace. There is intense competition for experienced senior management and personnel with technical and industry expertise in the business process management industry, and we may not be able to retain our key personnel due to various reasons, including the compensation philosophy followed by our company as described in “Part I — Item 6. Directors, Senior Management and Employees — Compensation.” Although we have entered into employment contracts with our executive officers, certain terms of those agreements may not be enforceable and in any event these agreements do not ensure the continued service of these executive officers. In the event of a loss of any key personnel, there is no assurance that we will be able to find suitable replacements for our key personnel within a reasonable time. The loss of key members of our senior management or other key team members, particularly to competitors, could have a material adverse effect on our business, results of operations, financial condition and cash flows. A loss of several members of our senior management at the same time or within a short period may lead to a disruption in the business of our company, which could materially adversely affect our performance.
We may fail to attract and retain enough sufficiently trained employees to support our operations, as competition for highly skilled personnel is significant and we experience significant employee attrition. These factors could have a material adverse effect on our business, results of operations, financial condition and cash flows.
The business process management industry relies on large numbers of skilled employees, and our success depends to a significant extent on our ability to attract, hire, train and retain qualified employees. The business process management industry, including our company, experiences high employee attrition. During each of fiscal 2017, 2016 and 2015, the attrition rate for our employees who have completed six months of employment with us was 34%. We cannot assure you that our attrition rate will not continue to increase in the future. There is significant competition in the jurisdictions where our operation centers are located, including India, the Philippines, Romania, South Africa and Sri Lanka, for professionals with the skills necessary to perform the services we offer to our clients. Increased competition for these professionals, in the business process management industry or otherwise, could have an adverse effect on us. A significant increase in the attrition rate among employees with specialized skills could decrease our operating efficiency and productivity and could lead to a decline in demand for our services.
In addition, our ability to maintain and renew existing engagements and obtain new business will depend largely on our ability to attract, train and retain personnel with skills that enable us to keep pace with growing demands for outsourcing, evolving industry standards and changing client preferences. Our failure either to attract, train and retain personnel with the qualifications necessary to fulfill the needs of our existing and future clients or to assimilate new employees successfully could have a material adverse effect on our business, results of operations, financial condition and cash flows.
Employee strikes and other labor-related disruptions may adversely affect our operations.
Our business depends on a large number of employees executing client operations. Strikes or labor disputes with our employees at our delivery centers may adversely affect our ability to conduct business. Our employees are not unionized, although they may in the future form unions. We cannot assure you that there will not be any strike, lock out or material labor dispute in the future. Work interruptions or stoppages could have a material adverse effect on our business, results of operations, financial condition and cash flows.
21
Our loan agreements impose operating and financial restrictions on us and our subsidiaries.
We have incurred a substantial amount of indebtedness in connection with recent acquisitions. As at March 31, 2017, we had total indebtedness of $118.0 million in secured bank loans. See “—Part I—Item 5—Operating and Financial Review and Prospects—Liquidity and Capital Resources.” Our loan agreements contain a number of covenants and other provisions that, among other things, may impose operating and financial restrictions on us and our subsidiaries. These restrictions could put a strain on our financial position. For example:
| | • | | they may increase our vulnerability to general adverse economic and industry conditions; |
| | • | | they may require us to dedicate a substantial portion of our cash flow from operations to payments on our loans, thereby reducing the availability of our cash flow to fund capital expenditure, working capital and other general corporate purposes; |
| | • | | they may require us to seek lenders’ consent prior to paying dividends on our ordinary shares; |
| | • | | they may limit our ability to incur additional borrowings or raise additional financing through equity or debt instruments; and |
| | • | | they may impose certain financial covenants on us that we may not be able to meet, which may cause the lenders to accelerate the repayment of the balance loan outstanding. |
Further, the restrictions that may be contained in our loan agreements may limit our ability to plan for or react to market conditions, meet capital needs or make acquisitions or otherwise restrict our activities or business plans. Our ability to comply with the covenants of our loan agreements may be affected by events beyond our control, and any material deviations from our forecasts could require us to seek waivers or amendments of covenants or alternative sources of financing or to reduce expenditures. We cannot assure you that such waivers, amendments or alternative financing could be obtained, or if obtained, would be on terms acceptable to us.
To fund our capital expenditures, service our indebtedness and fund other potential liquidity requirements, we will require a significant amount of cash. Our ability to generate cash depends on many factors beyond our control and we may need to access the credit market to meet our liquidity requirements.
Our ability to fund planned capital expenditures and to make payments on our outstanding loans will depend on our ability to generate cash in the future. This, to a large extent, is subject to general economic, financial, competitive, legislative, regulatory and other factors that are beyond our control. Furthermore, given that the uncertainty over global economic conditions remains, there can be no assurance that our business activity will be maintained at our expected level to generate the anticipated cash flows from operations or that our credit facilities would be available or sufficient. If global economic uncertainties continue, we may experience a decrease in demand for our services, resulting in our cash flows from operations being lower than anticipated. This may in turn result in our need to obtain financing.
If we cannot fund our capital expenditures, service our indebtedness or fund our other potential liquidity requirements, we may have to take actions such as seeking additional equity or reducing or delaying capital expenditures, strategic acquisitions and investments. We cannot assure you that any such actions, if necessary, could be effected on commercially reasonable terms or at all.
22
If we fail to maintain an effective system of internal control over financial reporting, we may not be able to accurately report our financial results or prevent or detect fraud. As a result, current and potential investors could lose confidence in our financial reporting, which could harm our business and have an adverse effect on our ADS price.
Effective internal control over financial reporting is necessary for us to provide reliable financial reports. The effective internal controls together with adequate disclosure controls and procedures are designed to prevent or detect fraud. Deficiencies in our internal controls may adversely affect our management’s ability to record, process, summarize, and report financial data on a timely basis. As a public company, we are required by Section 404 of the Sarbanes-Oxley Act of 2002 to include a report of management’s assessment on our internal control over financial reporting and an auditor’s attestation report on our internal control over financial reporting in our annual reports onForm 20-F.
If material weaknesses are identified in our internal controls over financial reporting, we could be required to implement remedial measures. If we fail to maintain effective disclosure controls and procedures or internal control over financial reporting, we could lose investor confidence in the accuracy and completeness of our financial reports, which could have a material adverse effect on our ADS price.
Wage increases may prevent us from sustaining our competitive advantage and may reduce our profit margin.
Salaries and related benefits of our operations staff and other employees in countries where we have delivery centers, in particular India, are among our most significant costs. Wage costs in India have historically been significantly lower than wage costs in the US and Europe for comparably skilled professionals, which has been one of our competitive advantages. However, rapid economic growth in India, increased demand for business process management outsourcing to India, increased competition for skilled employees in India, and regulatory developments resulting in wage increases in India may reduce this competitive advantage. For example, in December 2015, the Government of India amended the Payment of Bonus Act, 1965, which mandated increased employee bonus amounts for certain wage categories, effective retroactively from April 1, 2014. As a result, our wage costs in India have increased. In addition, if the US dollar or the pound sterling declines in value against the Indian rupee, wages in the US or the UK will further decrease relative to wages in India, which may further reduce our competitive advantage. We may need to increase our levels of employee compensation more rapidly than in the past to remain competitive in attracting the quantity and quality of employees that our business requires. Wage increases may reduce our profit margins and have a material adverse effect on our financial condition and cash flows.
Further, following the establishment of our delivery centers in the US in 2014, our operations in the US have expanded and our wage costs for employees located in the UK and the US now represent a larger proportion of our total wage costs. Wage increases in the UK and the US may therefore also reduce our profit margins and have a material adverse effect on our financial condition and cash flows.
Our operating results may differ from period to period, which may make it difficult for us to prepare accurate internal financial forecasts and respond in a timely manner to offset such period to period fluctuations.
Our operating results may differ significantly from period to period due to factors such as client losses, variations in the volume of business from clients resulting from changes in our clients’ operations, the business decisions of our clients regarding the use of our services, delays or difficulties in expanding our operational facilities and infrastructure, changes to our pricing structure or that of our competitors, inaccurate estimates of resources and time required to complete ongoing projects, currency fluctuations and seasonal changes in the operations of our clients. For example, our clients in the travel and leisure industry experience seasonal changes in their operations in connection with the US summer holiday season, as well as episodic factors such as adverse weather conditions. Transaction volumes can be impacted by market conditions affecting the travel and insurance industries, including natural disasters, outbreak of infectious diseases or other serious public health concerns in Asia or elsewhere (such as the outbreak of the Influenza A (H7N9) virus in various parts of the world) and terrorist attacks. In addition, our contracts do not generally commit our clients to provide us with a specific volume of business.
23
In addition, the long sales cycle for our services, which typically ranges from three to 12 months, and the internal budget and approval processes of our prospective clients make it difficult to predict the timing of new client engagements. Commencement of work and ramping up of volume of work with certain new and existing clients have in the past been slower than we had expected and may in the future be slower than we expect. Revenue is recognized upon actual provision of services and when the criteria for recognition are achieved. Accordingly, the financial benefit of gaining a new client may be delayed due to delays in the implementation of our services. These factors may make it difficult for us to prepare accurate internal financial forecasts or replace anticipated revenue that we do not receive as a result of those delays. Due to the above factors, it is possible that in some future quarters our operating results may be significantly below the expectations of the public market, analysts and investors.
If our pricing structures do not accurately anticipate the cost and complexity of performing our work, our profitability may be negatively affected.
The terms of our client contracts typically range from three to five years. In many of our contracts, we commit to long-term pricing with our clients, and we negotiate pricing terms with our clients utilizing a range of pricing structures and conditions. Depending on the particular contract, these include input-based pricing (such as full-time equivalent-based pricing arrangements), fixed-price arrangements, output-based pricing (such as transaction-based pricing), outcome-based pricing, and contracts with features of all these pricing models. Our pricing is highly dependent on our internal forecasts and predictions about our projects and the marketplace, which are largely based on limited data and could turn out to be inaccurate. If we do not accurately estimate the costs and timing for completing projects, our contracts could prove unprofitable for us or yield lower profit margins than anticipated. Some of our client contracts do not allow us to terminate the contracts except in the case ofnon-payment by our client. If any contract turns out to be economicallynon-viable for us, we may still be liable to continue to provide services under the contract.
We intend to focus on increasing our service offerings that are based onnon-linear pricing models (such as fixed-price and outcome-based pricing models) that allow us to price our services based on the value we deliver to our clients rather than the headcount deployed to deliver the services to them.Non-linear revenues may be subject to short term pressure on margins as initiatives in developing the products and services take time to deliver. The risk of entering intonon-linear pricing arrangements is that if we fail to properly estimate the appropriate pricing for a project, we may incur lower profits or losses as a result of being unable to execute projects with the amount of labor we expected or at a margin sufficient to recover our initial investments in our solutions. Whilenon-linear pricing models are expected to result in higher revenue productivity per employee and improved margins, they also mean that we continue to bear the risk of cost overruns, wage inflation, fluctuations in currency exchange rates and failure to achieve clients’ business objectives in connection with these projects.
Our profit margin, and therefore our profitability, is largely a function of our asset utilization and the rates we are able to recover for our services. An important component of our asset utilization is our seat utilization rate, which is the average number of work shifts per day, out of a maximum of three, for which we are able to utilize our work stations, or seats. During fiscal 2017, 2016 and 2015, we incurred significant expenditures to increase our number of seats by establishing additional delivery centers or expanding production capacities in our existing delivery centers. During fiscal 2015, we incurred costs to move our operations from one site in Gurgaon to another. If we are not able to maintain the pricing for our services or an appropriate seat utilization rate, without corresponding cost reductions, our profitability will suffer. The rates we are able to recover for our services are affected by a number of factors, including our clients’ perceptions of our ability to add value through our services, competition, introduction of new services or products by us or our competitors, our ability to accurately estimate, attain and sustain revenue from client contracts, margins and cash flows over increasingly longer contract periods and general economic and political conditions.
Our profitability is also a function of our ability to control our costs and improve our efficiency. As we increase the number of our employees and execute our strategies for growth, we may not be able to manage the significantly larger and more geographically diverse workforce that may result, which could adversely affect our ability to control our costs or improve our efficiency. Further, because there is no certainty that our business will ramp up at the rate that we anticipate, we may incur expenses for the increased capacity for a significant period of time without a corresponding growth in our revenue. Commencement of work and ramping up of volume of work with certain new and existing clients have in the past been slower than we had expected and may in the future be slower than we expect. If our revenue does not grow at our expected rate, we may not be able to maintain or improve our profitability.
24
We have in the past and may in the future enter into subcontracting arrangements for the delivery of services. For example, in China, in addition to delivering services from our own delivery center, we used to deliver services through a subcontractor’s delivery center. We could face greater risk when pricing our outsourcing contracts, as our outsourcing projects typically entail the coordination of operations and workforces with our subcontractor, and utilizing workforces with different skill sets and competencies. Furthermore, when outsourcing work we assume responsibility for our subcontractors’ performance. Our pricing, cost and profit margin estimates on outsourced work may include anticipated long-term cost savings from transformational and other initiatives that we expect to achieve and sustain over the life of the outsourcing contract. There is a risk that we will underprice our contracts, fail to accurately estimate the costs of performing the work or fail to accurately assess the risks associated with potential contracts. In particular, any increased or unexpected costs, delays or failures to achieve anticipated cost savings, or unexpected risks we encounter in connection with the performance of this work, including those caused by factors outside our control, could make these contracts less profitable or unprofitable, which could have an adverse effect on our profit margin
We have incurred losses in the past. We may not be profitable in the future.
We incurred losses in each of the three fiscal years from fiscal 2003 through fiscal 2005. We expect our selling and marketing expenses, general and administrative expenses and finance expense to increase in future periods. If our revenue does not grow at a faster rate than these expected increases in our expenses, or if our operating expenses are higher than we anticipate, we may not be profitable and we may incur losses.
We may not succeed in identifying suitable acquisition targets or integrating any acquired business into our operations, which could have a material adverse effect on our business, results of operations, financial condition and cash flows.
Our growth strategy involves gaining new clients and expanding our service offerings, both organically and through strategic acquisitions. It is possible that in the future we may not succeed in identifying suitable acquisition targets available for sale or investments on reasonable terms, have access to the capital required to finance potential acquisitions or investments, or be able to consummate any acquisition or investments. Future acquisitions or joint ventures may also result in the incurrence of indebtedness or the issuance of additional equity securities, which may present difficulties in financing the acquisition or joint venture on attractive terms. The inability to identify suitable acquisition targets or investments or the inability to complete such transactions may affect our competitiveness and our growth prospects.
Historically, we have expanded some of our service offerings and gained new clients through strategic acquisitions. For example, in November 2011, we acquired the shareholding of Advanced Contact Solutions, Inc. (“ACS”), our former joint venture partner in WNS Philippines Inc. and increased our share ownership from 65% to 100%. The lack of profitability of any of our acquisitions or joint ventures could have a material adverse effect on our operating results.
In addition, our management may not be able to successfully integrate any acquired business into our operations or benefit from any joint ventures that we enter into, and any acquisition we do complete or any joint venture we do enter into may not result in long-term benefits to us. For instance, if we acquire a company, we could experience difficulties in assimilating that company’s personnel, operations, technology and software, or the key personnel of the acquired company may decide not to work for us. For example, in June 2016, we acquired Value Edge, a provider of commercial research and analytics services to clients in the pharma industry. In January 2017, we acquired Denali, a leading provider of strategic procurement BPM solutions in the high tech, retail and CPG, banking and financial services, utilities and healthcare verticals. In March 2017, we acquired HealthHelp, an industry leader in care management whose solutions are delivered by combining a proprietary technology platform rooted in evidence-based medical research,high-end predictive analytics, and deep healthcare industry expertise. While Value Edge contributed a $0.2 million profit to our results of operations for fiscal 2017, HealthHelp and Denali contributed a $0.3 million loss and a $0.2 million loss, respectively, to our results of operations for fiscal 2017. There is no assurance that these acquisitions will be profitable for us. We also cannot assure you that we will be able to successfully integrate the business operations of Value Edge, Denali or HealthHelp with ours, or that we will be able to successfully leverage the assets of Value Edge, Denali or HealthHelp to grow our revenue, expand our service offerings and market share or achieve accretive benefits from these acquisitions. Further, we face the risk that the legal regime or regulatory requirements imposed on any business that we acquire may change following our acquisition and such changes may adversely affect our ability to achieve the expected accretive benefits from the acquisition, which could in turn require us to recognize an impairment of goodwill associated with the acquired business. See “—The international nature of our business exposes us to several risks, such as significant currency fluctuations and unexpected changes in the regulatory requirements of multiple jurisdictions.”
We also face risks arising from acquisitions of businesses reliant upon a small number of key clients. The value of such acquisitions may decline in the event that their key clients decide not to renew their contracts, or decrease their volume of business or the prices paid for services. For example, HealthHelp is reliant on one client. A decline in the volume of business from this client or in the pricing of our services to this client would likely adversely affect our ability to achieve the expected accretive benefits from our acquisition of HealthHelp.
25
Further, we may receive claims or demands by the sellers of the entities acquired by us on the indemnities that we have provided to them for losses or damages arising from any breach of contract by us. Conversely, while we may be able to claim against the sellers on their indemnities to us for breach of contract or breach of the representations and warranties given by the sellers in respect of the entities acquired by us, there can be no assurance that our claims will succeed, or if they do, that we will be able to successfully enforce our claims against the sellers at a reasonable cost. Acquisitions and joint ventures also typically involve a number of other risks, including diversion of management’s attention, legal liabilities and the need to amortize acquired intangible assets, any of which could have a material adverse effect on our business, results of operations, financial condition and cash flows.
26
We recorded a significant impairment charge to our earnings in fiscal 2017 and may be required to record another significant charge to earnings in the future when we review our goodwill, intangible or other assets for potential impairment.
As at March 31, 2017, we had goodwill and intangible assets of approximately $230.6 million, which primarily resulted from our acquisitions of HealthHelp, Denali and Value Edge. Under IFRS, we are required to review our goodwill, intangibles or other assets for impairment when events or changes in circumstances indicate the carrying value may not be recoverable. In addition, goodwill, intangible or other assets with indefinite lives are required to be tested for impairment at least annually. For example, during the fourth quarter of fiscal 2017, proposed changes to the laws of the UK governing personal injury claims generated uncertainty regarding the future earnings trajectory of our legal services business in our WNS Auto Claims BPM segment, as a result of which we expect that we will eventually exit from providing legal services in relation to personal injury claims. We have also experienced a decrease in volume of and loss of business from certain clients of our traditional repair services in our WNS Auto Claims BPM segment. As a result, we expect the future performance of our WNS Auto Claims BPM segment to decline significantly and we have therefore significantly reduced our financial projections and estimates of our WNS Auto Claims BPM segment. We performed an impairment review of the goodwill associated with the companies we had acquired for our auto claims business and recorded an impairment charge of $21.7 million to our results of operations for fiscal 2017. See also “—The international nature of our business exposes us to several risks, such as significant currency fluctuations and unexpected changes in the regulatory requirements of multiple jurisdictions.” We may be required to record further impairment charges to our goodwill and intangible assets associated with other acquisitions in the future. For example, of the total $230.6 million in goodwill and intangible assets we had as at March 31, 2017, $103.6 million pertains to our acquisition of HealthHelp in fiscal 2017. This goodwill and intangible assets associated with our acquisition of HealthHelp is primarily attributable to HealthHelp’s expected business from one client. Pricing of services to this client will be due for renegotiation in fiscal 2019. There is no assurance that the pricing terms will be renewed on terms acceptable to us. If there is a significant decline in the prices charged for services to this client or a decrease in the volume of business from this client, we may be required to review our goodwill and intangible assets for impairment and record a further impairment charge. Further, if, for example, the research and analytics industry experiences a significant decline in business and we determine that we will not be able to achieve the cash flows that we had expected from our acquisitions of Marketics Technologies (India) Private Limited (“Marketics”) and Value Edge, we may have to record an impairment of all or a portion of the goodwill or intangible assets relating to those acquisitions. Any further impairment to our goodwill or intangible assets may have a significant adverse impact on our results of operations.
We are incorporated in Jersey, Channel Islands and are subject to Jersey rules and regulations. If the tax benefits enjoyed by our company are withdrawn or changed, we may be liable for higher tax, thereby reducing our profitability.
As a company incorporated in Jersey, Channel Islands, we are currently subject to no Jersey income tax. Although we continue to enjoy the benefits of the Jersey business tax regime, if Jersey tax laws change or the tax benefits we enjoy are otherwise withdrawn or changed, we may become liable for higher tax, thereby reducing our profitability.
27
Risks Related to Key Delivery Locations
A substantial portion of our assets and operations are located in India and we are subject to regulatory, economic, social and political uncertainties in India.
Our primary operating subsidiary, WNS Global Services Private Limited (“WNS Global”), is incorporated in India, and a substantial portion of our assets and employees are located in India. The Government of India, however, has exercised and continues to exercise significant influence over many aspects of the Indian economy. The Government of India has provided significant tax incentives and relaxed certain regulatory restrictions in order to encourage foreign investment in specified sectors of the economy, including the business process management industry. Those programs that have benefited us include tax holidays, liberalized import and export duties and preferential rules on foreign investment and repatriation. We cannot assure you that such liberalization policies will continue. The Government of India may also enact new tax legislation or amend the existing legislation that could impact the way we are taxed in the future. For more information, see “ —New tax legislation and the results of actions by taxing authorities may have an adverse effect on our operations and our overall tax rate.” Other legislation passed by the Government of India may also impact our business. For example, in December 2015, the Government of India amended the Payment of Bonus Act, 1965, which mandated increased employee bonus amounts for certain wage categories, effective retroactively from April 1, 2014. As a result, our wage costs in India have increased. Our financial performance and the market price of our ADSs may be adversely affected by changes in inflation, exchange rates and controls, interest rates, Government of India policies (including taxation regulations and policies), social stability or other political, economic or diplomatic developments affecting India in the future.
India has witnessed communal clashes in the past. Although such clashes in India have, in the recent past, been sporadic and have been contained within reasonably short periods of time, any such civil disturbance in the future could result in disruptions in transportation or communication networks, as well as have adverse implications for general economic conditions in India. Such events could have a material adverse effect on our business, the value of our ADSs and your investment in our ADSs.
The results of the United Kingdom’s referendum on withdrawal from the European Union may have a negative effect on our operations in the United Kingdom and European Union.
We have operations in the United Kingdom, Romania and Poland. In June 2016, a majority of voters in the United Kingdom elected to withdraw from the European Union in a national referendum. The referendum was advisory, and the terms of any withdrawal are subject to a negotiation period that could last at least two years after the government of the United Kingdom formally initiated a withdrawal process on March 29, 2017. The referendum has created significant uncertainty about the future relationship between the United Kingdom and the European Union, including with respect to the laws and regulations that will apply as the United Kingdom determines which European Union-derived laws to replace or replicate in the event of a withdrawal. The referendum has also given rise to calls for the governments of other European Union member states to consider withdrawal. Any of these events may have an adverse effect on our operations in the United Kingdom and the European Union, the value of our ADSs and your investment in our ADSs.
Our business in South Africa is evaluated for compliance with the South African government’s Broad-Based Black Economic Empowerment (“BBBEE”) legislation. Failure to maintain a minimum BBBEE rating would result in a loss of certain government grants, and may also result in us losing certain business opportunities or clients imposing contractual penalties on us.
Our business in South Africa is evaluated for compliance with the South African government’s BBBEE legislation against a BBBEE scorecard, based on various criteria. South African government grants are available to businesses that meet specified conditions, including achieving a specified minimum BBBEE rating. Additionally, many South African companies require their service providers to maintain a minimum BBBEE rating, and many of our South African client contracts contain clauses that allow our clients to terminate their contracts with us or impose specified penalties on us if we do not maintain a minimum BBBEE rating.
New BBBEE criteria became effective for us from March 2017, according to which an entity receives a new compliance rating from the BBBEE rating agency. Under these new criteria, our rating based on our previous structure and practices would have dropped and we would have been required contractually to improve our rating. We developed a plan to achieve or improve our current rating by the BBBEE verification audit for period ended March 31, 2017 in May 2017. This plan included, among other measures, divesting some of our interests in our South Africa subsidiary to address the criterion relating to the percentage of ownership of an entity by “black people” (as defined under the applicable legislation). We achieved the required rating in our BBBEE verification audit in May 2017 on the basis of the steps taken to comply with the new BBBEE criteria which is valid until May 2018. However, there is no assurance that we will successfully maintain our existing BBBEE rating under the new criteria in our next annual BBBEE verification audit by the BBBEE rating agency, or at all. If we fail to achieve the required minimum BBBEE rating, we will cease to be eligible for government grants, will be disqualified from bidding for certain business, and our clients may terminate their contracts with us or impose penalties on us. These outcomes would have an adverse effect on our business, results of operations, financial condition and cash flows.
28
If the tax benefits and other incentives that we currently enjoy are reduced or withdrawn or not available for any other reason, our financial condition would be negatively affected.
We have benefitted from, and continue to benefit from, certain tax holidays and exemptions in various jurisdictions in which we have operations.
In fiscal 2017, 2016 and 2015, our tax rate in India, the Philippines and Sri Lanka impacted our effective tax rate. We would have incurred approximately $5.2 million, $5.0 million and $3.0 million in additional income tax expense on our combined operations in our SEZ operations in India, the Philippines and Sri Lanka for fiscal 2017, 2016 and 2015 respectively, if the tax holidays and exemptions as described below had not been available for the respective periods.
We expect our tax rate in India, the Philippines and Sri Lanka to continue to impact our effective tax rate. Our effective tax rate in India may be impacted by the reduction in the tax exemption enjoyed by operating units under the SEZ scheme.
For example, in the past, the majority of our Indian operations were eligible to claim income tax exemption with respect to profits earned from export revenue from operating units registered under the Software Technology Parks of India (“STPI”). The benefit was available for a period of 10 years from the date of commencement of operations, but not beyond March 31, 2011. Effective April 1,
2011, upon the expiration of this tax exemption, income derived from our STPI operations in India became subject to the prevailing annual tax rate, which is currently, and was in fiscal 2017 and 2016, 34.61%, and was 33.99% in fiscal 2015. See “Part I – Item 4. Information on the Company – B. Business Overview – Regulations.”
When any of our tax holidays or exemptions expire or terminate, or if the applicable government withdraws or reduces the benefits of a tax holiday or exemption that we enjoy, our tax expense may materially increase and this increase may have a material impact on our results of operations. The applicable tax authorities may also disallow deductions claimed by us and assess additional taxable income on us in connection with their review of our tax returns.
29
New tax legislation and the results of actions by taxing authorities may have an adverse effect on our operations and our overall tax rate.
The Government of India may enact new tax legislation that could impact the way we are taxed in the future. For example, the Government of India has clarified that, with retrospective effect from April 1, 1962, any income accruing or arising directly or indirectly through the transfer of capital assets situated in India will be taxable in India. If any of our transactions are deemed to involve the direct or indirect transfer of a capital asset located in India, such transactions could be investigated by the Indian tax authorities, which could lead to the issuance of tax assessment orders and a material increase in our tax liability. For example, we received requests for information from, and are in discussions with, the relevant income tax authority in India relating to our acquisition in July 2008 from Aviva of all the shares of Aviva Global, which owned subsidiaries with assets in India and Sri Lanka. The Government of India has issued guidelines on General Anti Avoidance Rule (the “GAAR”), which came into effect on April 1, 2017, and which is intended to curb sophisticated tax avoidance. Under the GAAR, a business arrangement will be deemed an “impermissible avoidance arrangement” if the main purpose of the arrangement is to obtain tax benefits. Although the full implications of the GAAR are presently still unclear, if we are deemed to have violated any of its provisions, we may face an increase to our tax liability. However, we do not expect any adverse impact on account of the GAAR.
The Government of India, the US or other jurisdictions where we have a presence could enact new tax legislation which would have a material adverse effect on our business, results of operations and financial condition. In addition, our ability to repatriate surplus earnings from our delivery centers in atax-efficient manner is dependent upon interpretations of local laws, possible changes in such laws and the renegotiation of existing double tax avoidance treaties. Changes to any of these may adversely affect our overall tax rate, or the cost of our services to our clients, which would have a material adverse effect on our business, results of operations and financial condition.
We are subject to transfer pricing and other tax related regulations and any determination that we have failed to comply with them could materially adversely affect our profitability.
Transfer pricing regulations to which we are subject require that any international transaction among our company and its subsidiaries, or the WNS group enterprises, be onarm’s-length terms. We believe that the international transactions among the WNS group enterprises are onarm’s-length terms. If, however, the applicable tax authorities determine that the transactions among the WNS group enterprises do not meetarm’s-length criteria, we may incur increased tax liability, including accrued interest and penalties. This would cause our tax expense to increase, possibly materially, thereby reducing our profitability and cash flows. We have signed an advance pricing agreement with the Government of India providing for the agreement on transfer pricing matters over certain transactions covered thereunder for a period of five years starting from April 2013.
30
We may be required to pay additional taxes in connection with audits by the tax authorities.
From time to time, we receive orders of assessment from Indian tax authorities assessing additional taxable income on us and/or our subsidiaries in connection with their review of our tax returns. We currently have orders of assessment for fiscal 2004 through fiscal 2013 pending before various appellate authorities. These orders assess additional taxable income that could in the aggregate give rise to an estimated₹2,394.3 million ($36.9 million based on the exchange rate on March 31, 2017) in additional taxes, including interest of₹891.3 million ($13.7 million based on the exchange rate on March 31, 2017).
These orders of assessment allege that the transfer prices we applied to certain of the international transactions between WNS Global or WNS Business Consulting Services Private Limited (“WNS BCS”), each of which is one of our Indian subsidiaries, as the case may be, and our other wholly-owned subsidiaries were not onarm’s-length terms, disallow a tax holiday benefit claimed by us, deny theset-off of brought forward business losses and unabsorbed depreciation and disallow certain expenses claimed as tax deductible by WNS Global or WNS BCS, as the case may be. As at March 31, 2017 we have provided a tax reserve of₹806.2 million ($12.4 million based on the exchange rate on March 31, 2017) primarily on account of the Indian tax authorities’ denying the set off of brought forward business losses and unabsorbed depreciation. We have appealed against these orders of assessment before higher appellate authorities. For more details on these assessments, see “Part I — Item 5 – Operating and Financial Review and Prospects—Tax Assessment Orders.”
In addition, we currently have orders of assessment pertaining to similar issues that have been decided in our favor by first level appellate authorities, vacating tax demands of₹2,890.6 million ($44.6 million based on the exchange rate on March 31, 2017) in additional taxes, including interest of₹891.1 million ($13.7 million based on the exchange rate on March 31, 2017). The income tax authorities have filed appeals against these orders at higher appellate authorities.
In case of disputes, the Indian tax authorities may require us to deposit with them all or a portion of the disputed amounts pending resolution of the matters on appeal. Any amount paid by us as deposits will be refunded to us with interest if we succeed in our appeals. We have deposited a portion of the disputed amount with the tax authorities and may be required to deposit the remaining portion of the disputed amount with the tax authorities pending final resolution of the respective matters.
As at March 31, 2017, corporate tax returns for fiscal years 2014 (for certain legal entities) and thereafter remain subject to examination by tax authorities in India.
After consultation with our Indian tax advisors and based on the facts of these cases, certain legal opinions from counsel, the nature of the tax authorities’ disallowances and the orders from first level appellate authorities deciding similar issues in our favor in respect of assessment orders for earlier fiscal years, we believe these orders are unlikely to be sustained at the higher appellate authorities and we intend to vigorously dispute the orders of assessment.
In March 2009, we also received an assessment order from the Indian Service Tax Authority demanding payment of₹348.1 million ($5.4 million based on the exchange rate on March 31, 2017) of service tax and related penalty for the period from March 1, 2003 to January 31, 2005. The assessment order alleges that service tax is payable in India on BPM services provided by WNS Global to clients based abroad as the export proceeds are repatriated outside India by WNS Global. In response to an appeal filed by us with the appellate tribunal against the assessment order in April 2009, the appellate tribunal has remanded the matter back to the lower tax authorities to be adjudicated afresh. Based on consultations with our Indian tax advisors, we believe this order of assessment is more likely than not to be upheld in our favor. We intend to continue to vigorously dispute the assessment.
In 2016, we also received an assessment order from the Sri Lankan Tax Authority, demanding payment of LKR 25.2 million ($0.2 million based on the exchange rate on March 31, 2017) in connection with the review of our tax return for fiscal year 2012. The assessment order challenges the tax exemption that we have claimed for export business. We have filed an appeal against the assessment order with the Sri Lankan Tax Appeal Commission in this regard. Based on consultations with our tax advisors, we believe this order of assessment is more likely than not to be upheld in our favor. We intend to continue to vigorously dispute the assessment.
No assurance can be given, however, that we will prevail in our tax disputes. If we do not prevail, payment of additional taxes, interest and penalties may adversely affect our results of operations, financial condition and cash flows. There can also be no assurance that we will not receive similar or additional orders of assessment in the future.
31
Terrorist attacks and other acts of violence involving India or its neighboring countries could adversely affect our operations, resulting in a loss of client confidence and materially adversely affecting our business, results of operations, financial condition and cash flows.
Terrorist attacks and other acts of violence or war involving India or its neighboring countries may adversely affect worldwide financial markets and could potentially lead to economic recession, which could adversely affect our business, results of operations, financial condition and cash flows. South Asia has, from time to time, experienced instances of civil unrest and hostilities among neighboring countries, including India and Pakistan. In previous years, military confrontations between India and Pakistan have occurred in the region of Kashmir and along the India/Pakistan border. There have also been incidents in and near India, such as the bombings of the Taj Mahal Hotel and Oberoi Hotel in Mumbai in 2008, a terrorist attack on the Indian Parliament, troop mobilizations along the India/Pakistan border and an aggravated geopolitical situation in the region. Such military activity or terrorist attacks in the future could influence the Indian economy by disrupting communications and making travel more difficult. Resulting political tensions could create a greater perception that investments in Indian companies involve a high degree of risk. Such political tensions could similarly create a perception that there is a risk of disruption of services provided by India-based companies, which could have a material adverse effect on the market for our services. Furthermore, if India were to become engaged in armed hostilities, particularly hostilities that were protracted or involved the threat or use of nuclear weapons, we might not be able to continue our operations.
Restrictions on entry visas may affect our ability to compete for and provide services to clients in the US and the UK, which could have a material adverse effect on future revenue.
The vast majority of our employees are Indian nationals. The ability of some of our executives to work with and meet our European and North American clients and our clients from other countries depends on the ability of our senior managers and employees to obtain the necessary visas and entry permits. In response to previous terrorist attacks and global unrest, US and European immigration authorities have sharply increased the level of scrutiny in granting visas. Immigration laws in those countries may also require us to meet certain other legal requirements as a condition to obtaining or maintaining entry visas. These restrictions have significantly lengthened the time requirements to obtain visas for our personnel, which has in the past resulted, and may continue to result, in delays in the ability of our personnel to meet with our clients. In addition, immigration laws are subject to legislative change and varying standards of application and enforcement due to political forces, economic conditions or other events, including terrorist attacks. We cannot predict the political or economic events that could affect immigration laws or any restrictive impact those events could have on obtaining or monitoring entry visas for our personnel. If we are unable to obtain the necessary visas for personnel who need to visit our clients’ sites or, if such visas are delayed, we may not be able to provide services to our clients or to continue to provide services on a timely basis, which could have a material adverse effect on our business, results of operations, financial condition and cash flows.
If more stringent labor laws become applicable to us, our profitability may be adversely affected.
India has stringent labor legislation that protects the interests of workers, including legislation that sets forth detailed procedures for dispute resolution and employee removal and legislation that imposes financial obligations on employers upon retrenchment. Though we are exempt from a number of these labor laws at present, there can be no assurance that such laws will not become applicable to the business process management industry in India in the future. In addition, our employees may in the future form unions. If these labor laws become applicable to our workers or if our employees unionize, it may become difficult for us to maintain flexible human resource policies, discharge employees or downsize, and our profitability may be adversely affected.
Most of our delivery centers operate on leasehold property and our inability to renew our leases on commercially acceptable terms or at all may adversely affect our results of operations.
Most of our delivery centers operate on leasehold property. Our leases are subject to renewal and we may be unable to renew such leases on commercially acceptable terms or at all. Our inability to renew our leases, or a renewal of our leases with a rental rate higher than the prevailing rate under the applicable lease prior to expiration, may have an adverse impact on our operations, including disrupting our operations or increasing our cost of operations. In addition, in the event ofnon-renewal of our leases, we may be unable to locate suitable replacement properties for our delivery centers or we may experience delays in relocation that could lead to a disruption in our operations. Any disruption in our operations could have an adverse effect on our results of operation.
32
Risks Related to our ADSs
Substantial future sales of our shares or ADSs in the public market could cause our ADS price to fall.
Sales by us or our shareholders of a substantial number of our ADSs in the public market, or the perception that these sales could occur, could cause the market price of our ADSs to decline. These sales, or the perception that these sales could occur, also might make it more difficult for us to sell securities in the future at a time or at a price that we deem appropriate or to pay for acquisitions using our equity securities. As at March 31, 2017, we had 50,012,559 ordinary shares (excluding 3,300,000 treasury shares) outstanding, including 49,721,174 shares represented by 49,721,174 ADSs. In addition, as at March 31, 2017, a total of 3,435,112 ordinary shares or ADSs are issuable upon the exercise or vesting of options and restricted share units (“RSUs”) outstanding under our Third Amended and Restated 2006 Incentive Award Plan and our 2016 Incentive Award Plan. All ADSs are freely transferable, except that ADSs owned by our affiliates may only be sold in the US if they are registered or qualify for an exemption from registration, including pursuant to Rule 144 under the Securities Act of 1933, as amended (the “Securities Act”). The remaining ordinary shares outstanding may also only be sold in the US if they are registered or qualify for an exemption from registration, including pursuant to Rule 144 under the Securities Act.
The market price for our ADSs may be volatile.
The market price for our ADSs is likely to be highly volatile and subject to wide fluctuations in response to factors including the following:
| | • | | announcements of technological developments; |
| | • | | regulatory developments in our target markets affecting us, our clients or our competitors; |
| | • | | actual or anticipated fluctuations in our operating results; |
| | • | | changes in financial estimates by securities research analysts; |
| | • | | changes in the economic performance or market valuations of other companies engaged in business process management; |
| | • | | addition or loss of executive officers or key employees; |
| | • | | sales or expected sales of additional shares or ADSs; |
| | • | | loss of one or more significant clients; and |
| | • | | a change in control, or possible change of control, of our company. |
In addition, securities markets generally and from time to time experience significant price and volume fluctuations that are not related to the operating performance of particular companies. These market fluctuations may also have a material adverse effect on the market price of our ADSs.
33
We may not be able to pay any dividends on our shares and ADSs.
We have never declared or paid any dividends on our ordinary shares. We cannot give any assurance that we will declare dividends of any amount, at any rate or at all. Because we are a holding company, we rely principally on dividends, if any, paid by our subsidiaries to us to fund our dividend payments, if any, to our shareholders. Any limitation on the ability of our subsidiaries to pay dividends to us could have a material adverse effect on our ability to pay dividends to you.
Any future determination to pay cash dividends will be at the discretion of our Board of Directors and will be dependent upon our results of operations and cash flows, our financial position and capital requirements, general business conditions, legal, tax, regulatory and any contractual restrictions on the payment of dividends and any other factors our Board of Directors deems relevant at the time.
Subject to the provisions of the Companies (Jersey) Law 1991 (the “1991 Law”) and our Articles of Association, we may by ordinary resolution declare annual dividends to be paid to our shareholders according to their respective rights and interests in our distributable reserves. Any dividends we may declare must not exceed the amount recommended by our Board of Directors. Our board may also declare and pay an interim dividend or dividends, including a dividend payable at a fixed rate, if paying an interim dividend or dividends appears to the Board to be justified by our distributable reserves. We can only declare dividends if our directors who are to authorize the distribution make a prior statement that, having made full enquiry into our affairs and prospects, they have formed the opinion that:
| | • | | immediately following the date on which the distribution is proposed to be made, we will be able to discharge our liabilities as they fall due; and |
| | • | | having regard to our prospects and to the intentions of our directors with respect to the management of our business and to the amount and character of the financial resources that will in their view be available to us, we will be able to continue to carry on business and we will be able to discharge our liabilities as they fall due until the expiry of the period of 12 months immediately following the date on which the distribution is proposed to be made or until we are dissolved under Article 150 of the 1991 Law, whichever first occurs. |
Subject to the deposit agreement governing the issuance of our ADSs, holders of ADSs will be entitled to receive dividends paid on the ordinary shares represented by such ADSs. See “ — Risks Related to Our Business — We, from time to time, enter into agreements for credit facilities, which may impose operating and financial restrictions on us and our subsidiaries.”
Holders of ADSs may be restricted in their ability to exercise voting rights.
At our request, the depositary of the ADSs will mail to you any notice of shareholders’ meeting received from us together with information explaining how to instruct the depositary to exercise the voting rights of the ordinary shares represented by ADSs. If the depositary timely receives voting instructions from you, it will endeavor to vote the ordinary shares represented by your ADSs in accordance with such voting instructions. However, the ability of the depositary to carry out voting instructions may be limited by practical and legal limitations and the terms of the ordinary shares on deposit. We cannot assure you that you will receive voting materials in time to enable you to return voting instructions to the depositary in a timely manner. Ordinary shares for which no voting instructions have been received will not be voted.
As a foreign private issuer, we are not subject to the proxy rules of the Commission, which regulate the form and content of solicitations byUS-based issuers of proxies from their shareholders. The form of notice and proxy statement that we have been using does not include all of the information that would be provided under the Commission’s proxy rules.
34
Holders of ADSs may be subject to limitations on transfers of their ADSs.
The ADSs are transferable on the books of the depositary. However, the depositary may close its transfer books at any time or from time to time when it deems necessary or advisable in connection with the performance of its duties. In addition, the depositary may refuse to deliver, transfer or register transfers of ADSs generally when the transfer books of the depositary are closed, or at any time or from time to time if we or the depositary deem it necessary or advisable to do so because of any requirement of law or of any government or governmental body or commission or any securities exchange on which the American Depositary Receipts or our ordinary shares are listed, or under any provision of the deposit agreement or provisions of or governing the deposited shares, or any meeting of our shareholders, or for any other reason.
Holders of ADSs may not be able to participate in rights offerings or elect to receive share dividends and may experience dilution of their holdings, and the sale, deposit, cancellation and transfer of our ADSs issued after exercise of rights may be restricted.
If we offer our shareholders any rights to subscribe for additional shares or any other rights, the depositary may make these rights available to them after consultation with us. We cannot make rights available to holders of our ADSs in the US unless we register the rights and the securities to which the rights relate under the Securities Act, or an exemption from the registration requirements is available. In addition, under the deposit agreement, the depositary will not distribute rights to holders of our ADSs unless we have requested that such rights be made available to them and the depositary has determined that such distribution of rights is lawful and reasonably practicable. We can give no assurance that we can establish an exemption from the registration requirements under the Securities Act, and we are under no obligation to file a registration statement with respect to these rights or underlying securities or to endeavor to have a registration statement declared effective. Accordingly, holders of our ADSs may be unable to participate in our rights offerings and may experience dilution of your holdings as a result. The depositary may allow rights that are not distributed or sold to lapse. In that case, holders of our ADSs will receive no value for them. In addition, US securities laws may restrict the sale, deposit, cancellation and transfer of ADSs issued after exercise of rights.
We may be classified as a passive foreign investment company, which could result in adverse US federal income tax consequences to US Holders of our ADSs or ordinary shares.
Based on our financial statements and relevant market and shareholder data, we believe that we should not be treated as a passive foreign investment company for US federal income tax purposes (“PFIC”) with respect to our most recently closed taxable year. However, the application of the PFIC rules is subject to uncertainty in several respects, and we cannot assure you that we will not be a PFIC for any taxable year. Anon-US corporation will be a PFIC for any taxable year if either (i) at least 75% of its gross income for such year is passive income or (ii) at least 50% of the value of its assets (based on an average of the quarterly values of the assets) during such year is attributable to assets that produce passive income or are held for the production of passive income. A separate determination must be made after the close of each taxable year as to whether we were a PFIC for that year. Because the value of our assets for purposes of the PFIC test will generally be determined by reference to the market price of our ADSs and ordinary shares, fluctuations in the market price of the ADSs and ordinary shares may cause us to become a PFIC. In addition, changes in the composition of our income or assets may cause us to become a PFIC. If we are a PFIC for any taxable year during which a US Holder (as defined in “Part I — Item 10. Additional Information — E. Taxation — US Federal Income Taxation”) holds an ADS or ordinary share, certain adverse US federal income tax consequences could apply to such US Holder.
35
Our share repurchase program could affect the price of our ADSs.
Our Board of Directors and shareholders have authorized the repurchase of up to 3.3 million of our ADSs, each representing one ordinary share, at a price range of $10 to $50 per ADS, in the open market from time to time over the nextthirty-six (36) months from the date of our shareholders’ approval on March 16, 2016. As at March 31, 2017, we have repurchased 2.2 million of our ADSs pursuant to our current repurchase program. Any repurchases pursuant to our repurchase program could affect the price of our ADSs and increase its volatility. The existence of a repurchase program could also cause the price of our ADSs to be higher than it would be in the absence of such a program and could potentially reduce the market liquidity of our ADSs. There can be no assurance that any repurchases will enhance shareholder value because the market price of our ADSs may decline below the levels at which we repurchase any ADSs. In addition, although our repurchase program is intended to enhance long-term shareholder value, short-term price fluctuations in our ADSs could reduce the program’s effectiveness. Significant changes in the price of our ADSs and our ability to fund our proposed repurchase program with cash on hand could impact our ability to repurchase ADSs. The timing and amount of future repurchases is dependent on our cash flows from operations, available cash on hand and the market price of our ADSs. Furthermore, the program does not obligate our Company to repurchase any dollar amount or number of ADSs and may be suspended or discontinued at any time, and any suspension or discontinuation could cause the market price of our ADSs to decline.
We have certain anti-takeover provisions in our Articles of Association that may discourage a change in control.
Our Articles of Association contain anti-takeover provisions that could make it more difficult for a third party to acquire us without the consent of our Board of Directors. These provisions include:
| | • | | a classified Board of Directors with staggered three-year terms; and |
| | • | | the ability of our Board of Directors to determine the rights, preferences and privileges of our preferred shares and to issue the preferred shares without shareholder approval, which could be exercised by our Board of Directors to increase the number of outstanding shares and prevent or delay a takeover attempt. |
These provisions could make it more difficult for a third party to acquire us, even if the third party’s offer may be considered beneficial by many shareholders. As a result, shareholders may be limited in their ability to obtain a premium for their shares.
It may be difficult for you to effect service of process and enforce legal judgments against us or our affiliates.
We are incorporated in Jersey, Channel Islands, and our primary operating subsidiary, WNS Global, is incorporated in India. A majority of our directors and senior executives are not residents of the US and virtually all of our assets and the assets of those persons are located outside the US. As a result, it may not be possible for you to effect service of process within the US upon those persons or us. In addition, you may be unable to enforce judgments obtained in courts of the US against those persons outside the jurisdiction of their residence, including judgments predicated solely upon the securities laws of the US.
36
ITEM 4. INFORMATION ON THE COMPANY
A. History and Development of our Company
WNS (Holdings) Limited was incorporated as a private liability company on February 18, 2002 under the laws of Jersey, Channel Islands, and maintains a registered office in Jersey at 22 Grenville Street, St Helier, Jersey JE4 8PX, Channel Islands. We converted from a private limited company to a public limited company on January 4, 2006 when we acquired more than 30 shareholders as calculated in accordance with Article 17A of the 1991 Law. We gave notice of this to the Jersey Financial Services Commission (“JFSC”) in accordance with Article 17(3) of the 1991 Law on January 12, 2006. Our principal executive office is located at Gate 4, Godrej & Boyce Complex, Pirojshanagar, Vikhroli (W), Mumbai 400 079, India, and the telephone number for this office is(91-22) 4095-2100. Our website address is www.wns.com. Information contained on our website does not constitute part of this annual report. Our agent for service in the US is our subsidiary, WNS North America Inc., 15 Exchange Place, 3rd Floor, Suite 310, Jersey City, New Jersey 07302, US.
We began operations as anin-house unit of British Airways in 1996 and became a business process outsourcing service provider for third parties in fiscal 2003. Warburg Pincus acquired a controlling stake in our company from British Airways in May 2002 and inducted a new senior management team.
In July 2006, we completed our initial public offering, whereupon our ADSs became listed on the New York Stock Exchange (the “NYSE”) under the symbol “WNS.” In February 2012, in connection with ourfollow-on offering, we issued new ordinary shares in the form of ADSs, at a price of $9.25 per ADS, aggregating approximately $50.0 million and at the same time, Warburg Pincus divested 6,847,500 ordinary shares in the form of ADSs. In February 2013, Warburg Pincus sold its remaining 14,519,144 ordinary shares in the form of ADSs, thereby divesting its entire stake in our company.
From 2004 to July 2007, we provided business process outsourcing services to Aviva, a major client, pursuant to build-operate-transfer contracts from facilities in Colombo, Sri Lanka and Pune, India. The contracts at that time granted Aviva Global the option to require us to transfer our facilities in Sri Lanka and Pune to Aviva Global, which was the business process offshoring subsidiary of Aviva at that time. In 2007, Aviva Global exercised its call option requiring us to transfer the Sri Lanka facility to Aviva Global and the transfer was effective in July 2007. In July 2008, we acquired Aviva Global from Aviva and resumed ownership of the Sri Lanka facility. In connection with our acquisition of Aviva Global, we also entered into a master services agreement with Aviva MS in 2008 (the “2008 Aviva master services agreement”), which we replaced with the Aviva master services agreement in September 2014, pursuant to which we provide BPM services to Aviva’s UK business and Aviva’s Irish subsidiary, Hibernian Aviva Direct Limited, and certain of its affiliates. See “Part I — Item 5. Operating and Financial Review and Prospects — Revenue — Our Contracts” for more details on this transaction.
We have made a number of acquisitions since fiscal 2003, including our acquisition of Town & Country Assistance Limited, aUK-based automobile claims handling company, thereby extending our service portfolio beyond the travel and leisure industry to include insurance-based automobile claims processing. We subsequently rebranded the company as WNS Assistance, which is part of WNS Auto Claims BPM, our reportable segment for financial statement purposes. In fiscal 2004, we acquired the health claims management business of Greensnow Inc. In fiscal 2006, we acquired Trinity Partners Inc. (which we merged into our subsidiary, WNS North America Inc.), a provider of BPM services to financial institutions, focusing on mortgage banking. In August 2006, we acquired from PRG Airlines Services Limited (“PRG Airlines”) its fare audit services business. In September 2006, we acquired from GHS Holdings LLC (“GHS”) its financial accounting business. In May 2007, we acquired Marketics, a provider of offshore analytics services. In June 2007, we acquired Flovate Technologies Limited (“Flovate”), a company engaged in the development and maintenance of software products and solutions, which we subsequently renamed as WNS Workflow Technologies Limited. In March 2008, we entered into a joint venture with ACS, a provider in BPO services and customer care in the Philippines, to form WNS Philippines Inc. and in November 2011, we acquired ACS’s shareholding in WNS Philippines Inc., which became our wholly-owned subsidiary. In April 2008, we acquired Chang Limited, an auto insurance claims processing services provider in the UK, through its wholly-owned subsidiary, Accidents Happen Assistance Limited (“AHA”) (formerly known as Call24-7 Limited, or Call24-7). In June 2008, we acquired BizAps, a provider of Systems Applications and Products (“SAP®”) solutions to optimize the enterprise resource planning functionality for our finance and accounting processes. In June 2012, we acquired Fusion Outsourcing Services (Proprietary) Limited (“Fusion”), a provider of a range of outsourcing services, including contact center, customer care and business continuity services, to both South African and international clients. Following our acquisition of Fusion, we have renamed it as WNS Global Services SA (Pty) Ltd. In June 2016, we acquired Value Edge, a leading provider of commercial research and analytics services to clients in the Pharma / Biopharma industry. In January 2017, we acquired Denali, a leading provider of strategic procurement BPM solutions. In March 2017, we acquired HealthHelp, an industry leader in BPM care management.
37
In fiscal 2010, we restructured our organizational structure in order to streamline our administrative operations, achieve operational and financial synergies, and reduce the costs and expenses relating to regulatory compliance. This restructuring involved the merger of the following seven Indian subsidiaries of WNS Global into WNS Global through a Scheme of Amalgamation approved by an order of the Bombay High Court passed in August 2009 pursuant to the Indian Companies Act, 1956: Customer Operational Services (Chennai) Private Limited, Marketics, Noida Customer Operations Private Limited (“ Noida”), NTrance Customer Services Private Limited, WNS Customer Solutions (Private) Limited (“WNS Customer Solutions”), WNS Customer Solutions Shared Services Private Limited and WNS Workflow Technologies (India) Private Limited. In another restructuring exercise, three of our subsidiaries, First Offshoring Technologies Private Limited,Hi-Tech Offshoring Services Private Limited and Servicesource Offshore Technologies Private Limited, were merged into WNS Global through a Scheme of Amalgamation approved by an order of the Bombay High Court passed in March 2010 pursuant to the Indian Companies Act, 1956. In fiscal 2011 and 2012, we restructured and rationalized our UK and US group companies, wherein three of ourUK-basednon-operating subsidiaries, Chang Limited, Town & Country Assistance Limited and BizAps, were voluntarily dissolved. In the US, two of our subsidiaries, WNS Customer Solutions North America Inc. and Business Application Associates Inc. were merged with and into WNS North America Inc. In fiscal 2012, we also incorporated a new subsidiary in the US, WNS Global Services Inc., established a new branch of WNS (Mauritius) Limited in the Dubai Airport Free Zone, United Arab Emirates, WNS Mauritius Limited ME (Branch), andde-registered our existing subsidiary WNS Global FZE in theRas-Al-Khaimah Free Trade Zone, United Arab Emirates or UAE. In fiscal 2013, as part of our restructuring activities, WNS Philippines Inc. was merged into WNS Global Services Philippines, Inc. and ownership of our Costa Rican subsidiary, WNS BPO Services Costa Rica, S.R.L. (formerly known as WNS BPO Services Costa Rica, S.A.), was transferred and is now a subsidiary of WNS North America Inc. In May 2012, WNS Global Services (UK) Limited (“WNS UK”) established a branch in Poland, WNS Global Services (UK) Limited (Spółka Z Ograniczoną Odpowiedzialnością) Oddział W Polsce, Gdańsk. In March 2013, we also established a new branch of Business Applications Associates Beijing Ltd. in Guangzhou, China named Business Applications Associates Beijing Limited Guangzhou Branch. In January 2014, we incorporated a new subsidiary of WNS (Mauritius) Limited in China, WNS Global Services (Dalian) Co. Ltd. In March 2014, we incorporated WNS Legal Assistance LLP in the UK under the Limited Liability Partnership Act, 2000. In November 2014, we established a new branch of WNS Global Services Private Limited in Singapore, WNS Global Services Private Limited (Singapore Branch). In December 2015, we established a new branch of WNS Global Services (UK) Limited in France, WNS Global Services (UK) Limited (Branch) (France), and amalgamated WNS Customer Solutions (Private) Limited, which was a subsidiary of WNS Customer Solutions (Singapore) Private Limited, with WNS Global Services (Private) Limited, an entity based out of Sri Lanka. In February 2016, we established a new branch of WNS Global Services (UK) Limited in Romania, WNS Global Services (UK) Limited London Bucharest Branch.
In April 2016, WNS Workflow Technologies Limited was renamed WNS Assistance Limited and WNS Assistance (Legal) Limited, a wholly owned subsidiary of WNS Assistance Limited, was incorporated. In June 2016, we incorporated Ucademy (Pty) Limited, a wholly owned subsidiary of WNS Global Services SA (Pty) Limited. In December 2016, we established two new branches of WNS Global Services Netherlands Cooperatief U.A in Ireland and Turkey, namely WNS Global Services Netherlands Cooperatief U.A (Ireland Branch) and WNS Global Services Netherlands Cooperatief U.A. Merkezi Hollanda Istanbul Merkez Subesi (Turkey Branch), respectively. In March 2017, we established WNS Global Services (Dalian) Co. Ltd Shanghai Branch, a new branch of WNS Global Services (Dalian) Co. Ltd. In April 2017, we established the WNS BBBEE Staff Share Trust with the principal objective of creating meaningful participation of the Black employees (as defined in the applicable legislation) of our South African subsidiaries in the growth of the company. We are committed to transformation in South Africa and are implementing this structure to benefit Black People in accordance with the objectives and requirements of the Codes of Good Practice on Black Economic Empowerment as promulgated by section 9(1) of the Broad-Based Black Economic Empowerment Act No. 53 of 2003 of South Africa. Our organizational structure now comprises 33 entities in 21 countries, and nine branches in Poland, UAE, China, Singapore, France, Romania, Turkey and Ireland. Of these 33 entities, WNS Cares Foundation, which is a wholly-owned subsidiary of WNS Global, is anot-for-profit organization registered under the former Section 25 of the Indian Companies Act, 1956 (which has become Section 8 of the Indian Companies Act, 2013), India. The WNS Cares Foundation was formed for the purpose of promoting corporate social responsibilities and does not qualify as a subsidiary under IFRS 10— Consolidated Financial Statements and hence is not considered for the purpose of preparing our consolidated financial statements.
We have our principal executive office in Mumbai, India, and we have client service offices in Dubai (United Arab Emirates), Jersey City, New Jersey (the US), Sydney (Australia), London (the UK), and Singapore, and we have delivery centers in Guangzhou, Dalian and Shanghai (China), San Jose (Costa Rica), Bangalore, Chennai, Gurgaon, Mumbai, Nashik, Pune, Noida and Vizag (India), Manila, Iloilo and Alabang (the Philippines), Gydnia (Poland), Bucharest and Constanta (Romania), Cape Town, Johannesburg, Durban and Port Elizabeth (South Africa), Colombo (Sri Lanka), Zurich (Switzerland), Istanbul (Turkey), Ipswich, Manchester and Mansfield (the UK), and Columbia, South Carolina, Luzerne, Pennsylvania, Pittsburgh, Pennsylvania, Bellevue, Washington, Boston, Massachusetts, Houston, Texas, and New York, New York (the US).
38
Our capital expenditures in fiscal 2017, 2016 and 2015 amounted to $22.9 million, $27.5 million and $22.9 million, respectively. Our principal capital expenditure were incurred for the purposes of setting up new delivery centers, expanding existing delivery centers and developing new technology-enabled solutions to enable execution and management of clients’ business processes. We expect our capital expenditure needs in fiscal 2018 to be between $28.0 million to $30.0 million, a significant amount of which we expect to spend on infrastructurebuild-out, technology-enablement and the streamlining of our operations. The geographical distribution, timing and volume of our capital expenditures in the future will depend on new client contracts we may enter into or the expansion of our business under our existing client contracts. As at March 31, 2017, we had commitments for capital expenditures of $6.3 million (net of advances to capital vendors) relating to the purchase of property and equipment for our delivery centers. Of this committed amount, we plan to spend approximately $3.1 million in India, approximately $1.0 million in South Africa, approximately $1.0 million in Philippines, approximately $0.9 million in Europe (excluding the UK), and approximately $0.3 million in the rest of the world. We expect to fund these estimated capital expenditures from cash generated from operating activities, existing cash and cash equivalents and the use of existing credit facilities. See “Part I — Item 5. Operating and Financial Review and Prospects — Liquidity and Capital Resources” for more information.
39
B. Business Overview
We are a global consultative BPM company, offering an array ofend-to-end industry-specific and cross-industry solutions. We have deep industry and process expertise, and providetechnology-led innovation, including intelligent automation tools (such as robotic process automation (“RPA”) and cognitive computing), business process as a service (“BPaaS”) platforms, embedded analytics and proprietary transformational andre-engineering frameworks. We strive to enable our clients to be more efficient and competitive through increased cost savings, better operational flexibility, improved service quality and actionable insights. We seek to help our clients “transform” their businesses by identifying business and process optimization opportunities through technology-enabled solutions, improvements to their processes, global delivery capabilities, analytics and an understanding of their business.
A key element in all our outsourcing engagements is our ability to continually deliver business value to our clients. We derive this ability from our core differentiators of deep industry expertise, cutting-edge technology and analytics, and a client-centric approach. Our industry-focused solution design helps us provide a specialized focus on each of the industries that we target, effectively manage our clients’ business processes and offer customized solutions and business insights designed to improve their competitive positioning. The major industry verticals that we currently focus on are: insurance, travel and leisure, diversified businesses (including manufacturing, retail, consumer packaged goods (“CPG”), media and entertainment and telecommunication or telecom), utilities, consulting and professional services, healthcare, banking and financial services, and shipping and logistics.
Our portfolio of services includes industry-focused processes that are tailored to address our clients’ specific business and industry requirements. In addition, we offer a set of shared services that are common across multiple industries, including customer interaction services, finance and accounting, research and analytics and technology services.
We measure our execution of our clients’ business processes against multiple performance parameters, and aim to consistently meet and exceed these parameters in order to maintain and expand our client relationships. We endeavor to build long-term client relationships, and typically sign multi-year contracts with our clients that provide us with recurring revenue. In fiscal 2017, 101 and 94 clients contributed more than $1 million to our revenue and revenue less repair payments(non-GAAP), respectively. In fiscal 2016, 91 and 84 clients contributed more than $1 million to our revenue and revenue less repair payments(non-GAAP), respectively.
As at March 31, 2017, we had 33,968 employees executing approximately 700 business processes for our 349 clients.
In fiscal 2017, our revenue was $602.5 million, our revenue less repair payments(non-GAAP) was $578.4 million and our profit was $37.8 million. Our revenue less repair payments is anon-GAAP financial measure. For a discussion of our revenue less repair payments(non-GAAP) and a reconciliation of our revenue less repair payments(non-GAAP) to revenue, see “Part I — Item 5. Operating and Financial Review and Prospects — Overview.”
Industry Overview
The global outsourcing market continues to evolve, with the focus shifting from process improvements to business transformation. While the original drivers of process efficiency, cost advantage and labor arbitrage remain relevant, there is a broader and more strategic narrative to outsourcing today with a strong focus on domain knowledge. Companies are now seeking long-term, strategic relationships with BPM providers and expect them to play a bigger and more profound role in achieving both incremental and transformational outcomes. As companies outsource some of their more complex andhigh-end business processes, the key consideration for them is the ability of the BPM provider to execute intricate, multi-layered transfer programs and successfully manage these processes on an ongoing basis. As a result, we see the outsourcing marketplace expanding beyond transactional processes to include more complex business processes, consulting, automation,technology-led initiatives, digitization, support for internet of things (“IoT”) capabilities, cloud computing, and research and analytics. Increasingly, companies with the aim of standardizing processes and maximizing the returns on their investments are demanding higher-value, cost-effective services such as processre-engineering and business transformation from their BPM providers. The increased focus on variable cost structures and the creation of tangible business benefit has resulted in alternative service delivery and pricing models such as transaction- and outcome-based models.
Businesses are thus undertaking a rigorous and multi-faceted evaluation process when selecting a BPM provider. Based on our experience, a client typically seeks several key attributes in a business process management provider, including:
| | • | | Domain knowledge and industry-specific expertise; |
| | • | | Process expertise across horizontal service offerings; |
| | • | | Ability to innovate, add new operational expertise and drive best practices based on internal and external benchmarking; |
| | • | | Proven ability to execute a diverse range of mission-critical and often complex business processes; |
| | • | | Ability to tie service delivery or process automation with the client’s existing IT infrastructure; |
40
| | • | | Ability to deploybolt-on tools or applications that can be easily added onto the enterprise architecture; |
| | • | | Capabilities to drive improved process standardization across business units and multiple locations, demonstrating strong global delivery capabilities; |
| | • | | Analytical capabilities to deliver actionable business insights; |
| | • | | Technology-enabled services and solutions, cloud-based offerings and platform-based BPM; |
| | • | | Global presence through a mix of offshore, nearshore and onshore delivery centers to access talent and capabilities, create cultural alignment, leverage language skills, and mitigate risks; and |
| | • | | Capability to scale employees and infrastructure without a diminution in quality of service. |
The recent outsourcing trends have driven BPM providers to be more innovative, strategic and forward looking in their outlook. Against the backdrop of this changed environment, we believe our company with our extensive industry expertise, client-centric approach, global footprint, transformational andre-engineering frameworks and ability to identify levers of change, is well positioned to deliver business value to our clients. We offer technology-enabled and BPaaS solutions that help companies rapidly adapt to changing business conditions. On similar lines, in addition to traditional pricing models based on headcount (often referred to as full-time equivalents (“FTEs”)), we offer transaction and outcome-based pricing models to provide clients with cost flexibility and measurable business benefit. In fiscal 2017, 28.2% of our total revenues were generated from“non-FTE” models. These“non-linear” pricing models, whichde-link the relationship between headcount and revenue for BPM providers, create an incentive for the providers to improve the productivity of their employees, increase the use of technology, and enhance the overall efficiency of their operations.
The global business process management industry is a large and growing industry. According to the Gartner Forecast: IT Services, Worldwide, 2015-2021, 1Q17 Update, the worldwide BPO market is estimated to have grown to $157.854 billion in 2016. Gartner has estimated that the revenue for the worldwide BPO market will grow from $157.854 billion in 2016 to $198.907 billion in 2021, which we calculate to represent a compounded annual growth rate of 4.73%.
41
The following chart sets forth the estimated growth in revenue generated from worldwide BPO services:
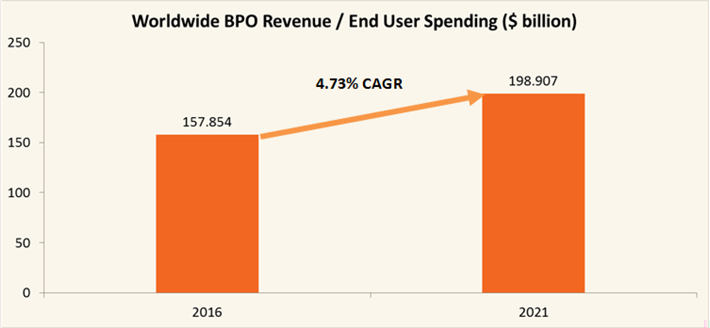
Chart created by WNS Global Services based on Gartner research.
Source: Gartner, Inc., Forecast: IT Services, Worldwide, 2015-2021, 1Q17 Update. Dated: March 21, 2017.
The Gartner Report(s) described herein (the “Gartner Report(s)”) represent(s) research opinion or viewpoints published, as part of a syndicated subscription service, by Gartner, Inc. (“Gartner”), and are not representations of fact. Each Gartner Report speaks as of its original publication date (and not as of the date of this annual report) and the opinions expressed in the Gartner Report(s) are subject to change without notice.
42
Competitive Strengths
We believe that we have the competitive strengths necessary to maintain and enhance our position as a leading global provider of BPM services.
Well-positioned for the evolving BPM market
The BPM industry, which started with the first wave of simple outsourced processes, has now expanded to include complex business processes and higher-value services that involve processre-engineering, business transformation, management of mission-critical operations, and generation of business insights to aid decision-making. We believe that our industry-specific expertise,end-to-end service capabilities, transformation capabilities, technology-enabled solutions, process management skills, embedded analytics, global delivery network and customer-centric approach position us at the forefront of the evolving BPM market.
Deep industry expertise
We have established deep expertise in the industries we target as a result of our vertical organizational structure, legacy client relationships, key acquisitions and the hiring of management with specific industry knowledge. Our deep domain expertise in each of the 12 industries we serve helps us develop keen insights and transform them into leading-edge impactful business solutions with the help of technology, analytics and process rigor. We have developed methodologies, proprietary knowledge and industry-specific technology platforms applicable to our target industries that allow us to provide industry-focused solutions and be more responsive to customer needs within these industries.
We have organized our company into business units aligned along each of the industries on which we focus. By doing so, we are able to approach clients in each of our target industries with a combined sales, marketing and delivery effort that leverages ourin-depth industry knowledge and industry-specific technology platforms and solutions.
43
We have received numerous recognitions for our industry leadership. Our awards and recognitions in fiscal 2017 and 2016 are set forth below:
Insurance:
| | • | | A “Leader” in Everest Group’s Property and Casualty Insurance BPO – Service Provider Landscape with PEAK Matrix™ Assessment 2016 |
| | • | | A “Major Contender” in Everest Group’s Life and Pensions Insurance BPO – Service Provider Landscape with PEAK Matrix™ Assessment 2016 |
| | • | | A “Leader” in NelsonHall’s NEAT for Life Annuities & Pensions Business Process Services 2016 |
Finance and Accounting:
| | • | | A “Winner’s Circle” player in HfS Research’s Blueprint Report: FinanceAs-a-Service 2016 |
| | • | | A “Major Contender” in Everest Group’s Finance and Accounting Outsourcing (“FAO”) – Service Provider Landscape with PEAK Matrix™ Assessment 2016 |
Banking and Financial Services:
| | • | | A “High Performer” in HfS Research’s Blueprint Report: Capital Markets Operations 2017 |
| | • | | A “Major Contender” in Everest Group’s Capital Markets BPO – Service Provider Landscape with PEAK Matrix™ Assessment 2016 |
| | • | | A “Major Contender” in Everest Group’s Banking BPO – Service Provider Landscape with PEAK Matrix™ Assessment 2016 |
| | • | | A “Major Contender” in Everest Group’s Retail Banking BPO – Service Provider Landscape with PEAK Matrix™ Assessment 2016 |
Customer Interaction Services:
| | • | | A “High Performer” in HfS Research’s Blueprint Report: Contact Center Operations 2016 |
| | • | | A “Leader” in NelsonHall’s NEAT for Customer Management Services 2016 |
| | • | | A “Major Contender” in Everest Group’s Contact Center Outsourcing – Service Provider Landscape with PEAK Matrix™ Assessment 2016 |
| | • | | An “Execution Powerhouse” in HfS Research’s Blueprint Report Digitally Enabled Contact Center 2016 |
Procurement and Supply Chain:
| | • | | A “Major Contender” in Everest Group’s Procurement Outsourcing (“PO”) – PO Service Provider Landscape with PEAK Matrix™ Assessment 2016 |
| | • | | An “Execution Powerhouse” in HfS Research’s Blueprint Report: ProcurementAs-a-Service 2016 |
Analytics:
| | • | | A “Major Contender” in Everest Group’s Analytics Business Process Services – Service Provider Landscape with PEAK Matrix™ Assessment 2016 |
| | • | | A “Major Performer” in IDC MarketScape: Worldwide Business Analytics BPO Services 2016 Vendor Assessment |
| | • | | A “Leader” in NelsonHall’s NEAT for Transforming Customer Management Services through Analytics 2016 |
44
Corporate:
| | • | | AON Best Employer India 2017 Award |
| | • | | Two Aecus Innovation Awards 2016: |
| | • | | National Association of Software and Services Companies (“NASSCOM”) Partnership Award 2016 for Lytx |
| | • | | Golden Peacock Innovation Management Award 2016 |
| | • | | Five 2016 Business Process Enabling South Africa National Industry Awards: |
| | • | | Best Contact Centre Operational Manager |
| | • | | Best Contact Centre Supervisor |
| | • | | Best Client Services Manager (Outsourced Services) |
| | • | | International Best Outsourced Contact Centre Mega (1000+) |
| | • | | Occupational Safety and Health Innovation Awards 2016 for Innovation category (Silver Award) |
| | • | | Two Shared Services & Outsourcing Network (“SSON”) Excellence Awards 2016: |
| | • | | Best Outsourcing Partnership (Silver Award) |
| | • | | Best Process Innovation (honorary mention) |
| | • | | Three National Energy Conservation Awards 2016 for BPO Building Sector Category (1st prize, 2nd prize and certificate of merit) |
| | • | | Recognized as a Leader in International Association of Outsourcing Professionals Global Outsourcing 100 ranking 2017 |
| | • | | Two Stevie Awards for Excellence in Sales & Customer Service 2017: |
| | • | | e-Commerce Customer Service Award (Bronze Award) |
| | • | | Business Intelligence Solution – New (Gold Award) |
Human Resources (“HR”):
| | • | | SSON Australasia 2016 for Excellence in People and Culture Creation (Honorary mention) |
| | • | | Business World HR Excellence Award 2016 for Excellence in Talent Acquisition |
Technology:
| | • | | Two International Data Group Chief Information Officer Awards 2016: |
| | • | | Collaboration Champions |
| | • | | Innovative Chief Information Officer Award 2016 for Innovation |
| | • | | Two Data Security Council of India Excellence Awards 2016: |
| | • | | Best Privacy Practices inIT-BPM Sector |
| | • | | Privacy Leader of the year (Finalist Certificate) |
45
Quality:
| | • | | Golden Star Six Sigma Awards 2016 for Best use of Six Sigma in Customer Service |
| | • | | World Quality Congress Award 2016 for Best Six Sigma Project in Travel Sector |
| | • | | Sri Lanka Association of Software Service Companies Award 2016 for Excellence in Quality Management |
| | • | | Two National Quality Excellence Awards 2017: |
| | • | | Best Business Process Excellence Program |
| | • | | Best Quality Assurance Management Program in BPO Sector |
Learning and Development:
| | • | | Golden Peacock National Training Award 2016 |
| | • | | HR Tech Conference and Awards 2016 for Most Innovation Training and Development Program |
| | • | | Society for Human Resource Management Excellence Awards 2016 for Excellence in Developing Leaders of Tomorrow |
Corporate Social Responsibility:
| | • | | Asian Customer Engagement Forum Customer Engagement Awards 2016 for Customer Engagement through Corporate Social Responsibility |
| | • | | Golden Peacock Global Award 2017 for Corporate Social Responsibility |
46
End-to-end service portfolio including higher-value transformational services and technology-enabled solutions
We seek to focus our service portfolio on more complex processes and solutions, and to shift away from reliance on services that are less integral to our clients’ operations, such as commoditized voice and transactional services (telemarketing and technical helpdesks), which characterized the business process outsourcing industry in its early days. We offer an array of higher-value, judgment-based services that seek to not only reduce cost and improve operating efficiency, but enable improved decision-making, competitive positioning and business outcomes for executive officers. These includehigh-end finance and accounting services, including strategic sourcing through supply chains, transformation services, technology-enabled offerings and analytics capabilities. We also provide a wide array of industry-specific solutions, which cut across these traditional “horizontal” services. These solutions are designed to help clients address process efficiency requirements and provide business insights specific to their industry.
We have also developed and continue to develop technology-enabled, or “automated,” solutions that utilize our proprietary software and licensed software in conjunction with our core business process management services. These integrated, technology-enabled solutions allow us to offer higher-value, differentiated services which are more scalable and repeatable and create value for our clients through increased process efficiency and quality. We also collaborate with technology companies, combining their software tools, platforms and expertise with our service capabilities to deliver business solutions to the marketplace. We believe these technology-enabled “automated” solutions will enable us to grow our revenue in anon-linear way by decoupling revenue growth from headcount growth.
To this end, we offer platform-enabled BPM or BPaaS that tightly integrates our domain expertise, business processes, automation, embedded analytics and a cloud-based infrastructure.
Proven global delivery platform
We deliver our services from 48 delivery centers around the world, located in China, Costa Rica, India, the Philippines, Poland, Romania, South Africa, Sri Lanka, Turkey, the UK and the US. Our ability to offer services delivered from a mix of onshore, nearshore and offshore locations benefits our clients from the perspectives of access to skills and talent, cultural alignment, language capabilities, risk mitigation, scalability, efficiency and cost-effectiveness.
We believe the breadth of our delivery capability allows us to meet our clients’ needs, diversifies our workforce and allows us to access local talent pools around the world.
Our client-centric focus
We have a client-centric engagement model that leverages our industry-specific and shared-services expertise, flexible pricing models, “client-partner” relationship approach, as well as our global delivery platform to offer business solutions designed to meet our clients’ specific needs.
We seek to enhance our value proposition to our clients by providing them with flexible pricing models that align our objectives with those of our clients. In addition to traditional full-time equivalent-based pricing, we provide alternative pricing models such as transaction-based pricing and outcome-based pricing. A sizable percentage of our revenue, being 28.2% in fiscal 2017, is derived from these“non-FTE”-based pricing models. These models enable our clients to pay only for actual work performed or tangible benefit received.
We have also adopted a client-centric sales model, which is tightly integrated with our vertical organizational structure. Strategic client accounts are assigned a dedicated client partner from our team who is responsible for managing theday-to-day relationship. The client partner is typically a seasoned resource with deep domain experience, who works directly from the client’s local offices. Within our company, the client partner is aligned with a specific vertical, and directly manages sales resources responsible for expanding client relationships (farmers). The client partner is responsible for driving business value to our clients, ensuring quality of delivery and customer satisfaction, and managing account growth and profitability.
47
Experience in transitioning processes and running them efficiently
Many of the business processes that our clients outsource to us are critical and core to their operations, requiring substantial program management expertise. Our rigorous program management methodology and proprietary toolsets are designed to ensure smooth transfer of business processes from the client to WNS. Our experienced program management team has transferred approximately 700 business processes for our clients globally.
“EnABLE” is our results-oriented transition methodology designed to enable us to engage with a client closely; address the client’s concerns and needs; identify, discover and diagnose loopholes if any; and enable efficient and timely migration of the client’s process from the existing environment to WNS. This methodology is continuously upgraded with our learnings and experiences from various transitions.
We focus on delivering our client processes effectively on an ongoing basis. We have a robust quality management system and we have maintained continual compliance with International Standard Organization (“ISO”) 9001:2008 and ISO 27001 standards. We apply Lean Six Sigma methodologies, which combine Six Sigma, a methodology designed to improve consistency across processes, and Lean, an engineering methodology to further improve our process delivery. We invest in training and development to equip our employees with Lean Six Sigma knowledge and skills, and encourage them to identify key opportunity areas within different processes and drive operational excellence.
We also continually seek feedback from our customers at regular intervals. We carry out annual surveys of our customers through which suggestions are invited for improvements along with ratings on specific parameters. Such ratings provide unfiltered customer feedback that helps us assess our performance and maintain focus on our clients’ key expectations.
Extensive investment in human capital development
We have established the WNS Learning Academy, which provides ongoing training to our employees for the purpose of continuously improving their leadership and professional skills. This includes the provision of extensive training infrastructure, such as training rooms, mobile application-based learning systems andin-house learning programs, which help impart key professional skills and industry-specific knowledge to our employees. We seek to promote our team leaders and operations managers from within, thereby offering internal advancement opportunities and clear long-term career paths.
The WNS Learning Academy is a training construct designed to build a culture of perpetual learning by placing the employees on a learning path, which imparts knowledge, builds confidence and enables advancement. As a part of the WNS Learning Academy, we have created specific Domain Universities, which enable individuals at any level of the organization to continuously improve their industry knowledge and prepare for increasingly complex, domain specific roles.
As part of their development, we have launched programs for our front line managers and top employees to help them improve their performance in their current roles and to develop new skill sets to enable them to take on new roles. These programs include our business intervention programs “Beyond Horizon,” “Inspire,” “TransforME,” “Empower,” “Evolve,” and “Ascend,” which are all programs designed to identify promising employees at various levels of the organization and empower them with the requisite skills to grow and eventually step into senior leadership roles.
We have put in place our New Leadership Competency framework, which serves as a tool to help leaders measure the necessary skill sets and behavioral patterns required to excel in the current and future roles.
In addition, we create individual development plans for our top talent based on inputs from our line managers and business units heads to help further their career development.
Our aim is to develop a high performing global team and increase our employees’ effectiveness. We expect to increasingly leverage technology to create a learning organization.
Experienced management team
We benefit from the effective leadership of a global management team with diverse backgrounds including extensive experience in outsourcing. Members of our executive and senior management team have, on average, over 20 years of experience in diverse industries, including in the business process and information technology outsourcing sector, and in the course of their respective careers have gathered experience in developing long-standing client relationships, leveraging technology, launching practices in new geographies, developing new service offerings and successfully integrating acquisitions.
48
Business Strategy
Our objective is to strengthen our position as a leading global business process management provider. We seek to increase our client base, expand our existing relationships, further develop our industry expertise, enhance our value proposition to our clients, develop new business services, leverage analytics to create actionable insights, enhance our brand, develop technology-enabled services and solutions, expand our global delivery platform and make select acquisitions.
We have made significant investments to accelerate our growth. These investments include:
| | • | | Expansion and reorganization of our sales force; |
| | • | | Increase in the expertise and management capability within our sales force; |
| | • | | Expansion of other sales channels including the development of new partnerships and alliances and broadening our engagement with outsourcing industry advisors and analysts; |
| | • | | Increase in the range of services and solutions offered to our clients across different industries and business functions; |
| | • | | Establishment of our Capability Creation Group to facilitate the creation of new client offerings and automation of solutions; |
| | • | | Increased focus on analytics through internal investment, strategic partnerships and acquisitions; |
| | • | | Increased use of technology in our service offerings, including the development of new technology-enabled solutions; |
| | • | | Expansion of our global delivery platform; and |
| | • | | Focused strategic acquisitions to improve our capabilities. |
The key elements of our growth strategy are described below:
Increase business from existing clients and add business from new clients
We have organized our company into vertical business units to focus on each of the industries that we target and to more effectively manage our clients’ business processes and to offer customized solutions designed to solve their business challenges. Our sales force of 86 members as at March 31, 2017, provides broad sales coverage and management experience. Our sales force is organized into two groups, one focused primarily on expanding existing client relationships (farmers) and another focused on seeking new clients (hunters).
We seek to expand our relationships with existing clients by identifying additional processes that can be transferred to our global delivery centers, cross-selling new services, adding technology-based offerings, utilizing analytics to create actionable insights, and expanding into other lines of business and geographies within each client. Our account managers and client partners have industry-specific knowledge and expertise, and are responsible for maintaining a thorough understanding of our clients’ outsourcing roadmaps as well as identifying and advocating new outsourcing opportunities. As a result of this strategy, we have built a strong track record of extending the scope of our client relationships over time.
For new clients, we seek to provide value-added solutions by leveraging our deep industry knowledge, process expertise, technology-enablement, analytics capabilities and transformation solutions. As a result of our capabilities and industry verticalgo-to-market approach, we have been able to compete effectively for new opportunities.
49
Reinforce leadership in existing industries
Through our industry-focused operating model, we have established leading business process management practices in various industries and business sectors. We intend to leverage our knowledge of the insurance; travel and leisure; diversified businesses including manufacturing, retail, CPG, media and entertainment, and telecom; utilities; consulting and professional services; healthcare; banking and financial services; and shipping and logistics industries, to penetrate additional client opportunities within these industries. To complement our industry-focused approach, we continue to invest in talent, analytics and technology platforms with the goal of expanding our business and acquiring industry specific expertise to improve our service offerings across industries.
Provide higher value added services
We enhance our value proposition to our clients by leveraging our industry-specific expertise; our portfolio of higher-value services such as our finance and accounting services, research and analytics services, transformation services and technology-enabled solutions; and our flexible pricing models. We expect that as the BPM market further matures, the demand for industry-specific services andnon-linear pricing models will increase. Accordingly, we have made significant investments in both these areas which we expect will give us a competitive advantage. We intend to broaden the scope of our higher-value service offerings to capture new market opportunities. By delivering a wider portfolio of higher-value services to our clients, and migrating them towards transaction and outcome-based pricing models, we aim to move up the value chain with our clients and thereby enhance the size, strength and profitability of these relationships.
In January 2012, we established our Capability Creation Group, which is responsible for facilitating the creation of new industry-leading solution offerings, transformation methodologies and frameworks, and process reengineering offerings. These solution offerings include automation of manual processes, solving operational challenges and enhancing productivity and efficiencies for client organizations. We intend to continue to expand on capability creation to drive process excellence, technology development, and new solutions and capabilities to address client needs.
Enhance awareness of the WNS brand name
Our reputation for operational excellence and domain expertise among our clients has been instrumental in attracting and retaining new clients as well as talented and qualified employees. We believe we have benefited from strongword-of-mouth references that have helped us to scale our business. We are actively increasing our efforts to enhance awareness of the WNS brand in our target client and employee markets. To accomplish this, we have a dedicated global marketing team comprised of experienced industry talent. We are also focusing on developing channels to increase market awareness of the WNS brand, including participation in industry events and conferences, exposure in industry publications, publication of articles and white papers, webinars and podcasts, internet and digital media, and other initiatives that create enhanced visibility of the WNS brand and establish WNS’ thought leadership capabilities in the BPM industry. In addition, we are working to improve visibility and positioning with the BPM industry analysts, sourcing advisors, general management consulting firms, and boutique outsourcing firms, who are often retained by prospective clients to provide strategic advice, act as intermediaries in the sourcing processes, develop scope specifications, and aid in the partner selection process.
Expand our delivery capabilities
We currently operate from 48 delivery centers located in 11 countries around the world. In fiscal 2017, we expanded our delivery capacity by 1,601 seats or approximately 6.1% of our capacity at the end of fiscal 2016. We will expand our global delivery capability through additional delivery centers in onshore, nearshore and offshore locations as well through collaborations with other providers, based on client demand and market trends. This approach will allow us to offer our clients maximum value and flexibility, as well as gain access to potential clients and markets that may have specific delivery requirements or constraints.
Broaden industry expertise and enhance growth through selective acquisitions and partnerships
Our acquisition strategy is focused on adding new service offerings and capabilities, technology-enabled automation tools and analytics capabilities, and deeper industry expertise, as well as expanding our geographic delivery platform. Our acquisition track record demonstrates our ability to integrate, manage and develop the specific capabilities we acquire. One of our key objectives is to continue to pursue targeted acquisitions in the future and to rely on our integration capabilities to expand the growth of our business.
50
Business Process Management Service Offerings
We offer our services to clients through industry-focused business units. We are organized into the following vertical business units to provide more specialized focus on each of these industries and more effectively manage our sales, marketing and delivery processes:
| | • | | Diversified businesses including manufacturing, retail, CPG, media and entertainment, and telecom; |
| | • | | Consulting and professional services; |
| | • | | Banking and financial services; and |
| | • | | Shipping and logistics. |
In addition to industry-specific services, we offer a range of services that are common across multiple industries (which we refer to as our horizontal services), in the areas of customer interaction services, finance and accounting, research and analytics and technology services. In addition, our global transformation practice offers higher-value services such as transformation services, which are designed to help our clients modify their business processes to enhance productivity, and manage changes in the business environment and leverage business knowledge to increase market competitiveness. We help clients drive these initiatives with technology-enabled solutions, processre-design including quality initiatives such as Six Sigma or Lean, and business analytics.
To achievein-depth understanding of our clients’ industries and the geographies in which they operate, we manage and conduct our sales processes in our three key markets — Europe, North America and Asia-Pacific. Our sales teams are led by senior professionals who focus on target industries, processes and clients. Each business unit is staffed by a dedicated team of managers and employees engaged in providing business process management client solutions. In addition, each business unit draws upon common support services from our information technology, human resources, training, corporate communications, corporate finance, risk management and legal departments, which we refer to as our corporate-enabling units.
Vertical Business Units:
Insurance
Our insurance services (actuarial andnon-actuarial) are structured into three lines of business offerings customized for property and casualty insurance, life and annuities, and healthcare. We cater to a diverse and sizeable number of clients globally and have significant experience across a broad range of insurance product lines.
The key insurance industry sectors that we serve include:
| | • | | Life, annuity and property and casualty insurers; |
| | • | | Insurance brokers and loss assessors, property and casualty insurance providers,re-insurance brokers and motor insurance companies; |
| | • | | Self-insured auto fleet owners; |
51
| | • | | Lloyds of London Market; and |
Our insurance business vertical includes our auto claims business, consisting of WNS Assistance Limited, AHA, WNS Assistance (Legal) Limited and WNS Legal Assistance LLP, which comprises our WNS Auto Claims BPM segment. We offer a technology-driven model that enables us to handle the entire automobile insurance claims cycle.
We offer Broker Connect, an advanced mobility solution that is designed to provide a comprehensive solution to meet the requirements of insurance brokers and financial advisors. It has features such as real-time status update / push notifications on new policyset-up as well as policy amendments. Our eAdjudicator tool automates theend-to-end adjudication process of various types of claims. It is driven by robotic process automation and analytics, and improves the insurer’s claims settlement rate with enhanced efficiency and accuracy. We also offer “WNS IPAS,” an insurance policy administration system integrator that provides a unified view of operations spread across multiple geographies with real-time distribution of work to manage high-transaction volumes.
As at March 31, 2017, we had 7,239 employees working in this business unit. In fiscal 2017 and 2016, this business unit accounted for 29.6% and 32.4% of our revenue 26.6% and 28.4% of our revenue less repair payments(non-GAAP), respectively.
The following table illustrates the key areas of services that we provide to clients in this business unit:
| | | | | | |
Insurance – Service Offerings |
Property & Casualty | | Actuarial | | Analytics | | Life & Annuity |
Sales & service, underwriting & support, policy administration, risk & compliance, premium / billing management, claims management, actuarial and research & analytics, shared services (procurement & claims, supply chain, finance & accounting, HR & payroll, consulting services) | | Actuarial services in life insurance:In-force model projections / reporting, financial modeling, product management and pricing, capital management, asset liability management; Actuarial services in property & casualty insurance: Reserving & claims analysis, solvency II & capital modeling, pricing and underwriting support, catastrophe modeling | | Claims analytics, subrogation analytics, fraud analytics, customer analytics | | Sales & service, underwriting & support, policy administration, risk & compliance, premium / billing management, claims management, actuarial and research & analytics, shared services (procurement & claims, supply chain, finance & accounting, HR & payroll, consulting services) |
52
Travel and Leisure
We deliverend-to-end services to clients across the travel and leisure industry value chain. We provide a wide range of scalable solutions that support air, car, hotel, marine and packaged travel and leisure services offered by our clients.
The key travel and leisure industry sectors that we serve include:
| | • | | Travel agencies, including online travel agencies, tour operators and travel management companies; |
| | • | | Global distribution systems providers; |
| | • | | Rental car companies and motor clubs; and |
| | • | | Hotels and cruise lines. |
As at March 31, 2017, we had 8,402 employees in this business unit, several hundred of whom have International Air Transport Association, Universal Federation of Travel Agents or other travel industry related certifications. In fiscal 2017 and 2016, this business unit accounted for 21.3% and 19.6% of our revenue and 22.1% and 20.7% of our revenue less repair payments(non-GAAP), respectively.
The following table illustrates the key areas of services that we provide to clients in this business unit:
| | | | |
Travel and Leisure—Service Offerings |
Front-office | | Mid-office | | Back-office |
| Reservations / sales, fares support, multi-channel customer care, baggage handling, loyalty program management | | Pricing and revenue management, fulfillment, cargo support | | Finance and accounting, revenue accounting, human resource management, procurement, cabin crew management, flight / network operations, engineering technical records processing |
Research and analytics: Loyalty analytics, customer interaction service analytics, commercial intelligence, flight operations, pricing and revenue management
Technology platforms:
| | • | | VERIFARE PlusSM: Fare audit solution |
| | • | | SmartProSM:Interline proration engine that helps airlines arrest revenue leakage through accurate proration of partner revenues |
| | • | | QbaySM:Automated queue distribution and workflow management solution, which empowers floor supervisors and process managers to improve operations, minimize costs and enhance customer service |
| | • | | RePAXSM: Automated flight disruption management solution, which is designed to help airlines minimize losses and improve passenger experience during flight disruptions |
| | • | | WNS’ Commercial Planning Suite: Comprehensive suite of analytic dashboards and decision support tools to assist the various commercial functions of an airline to maximize the revenues, quickly asses key gaps in revenue production and identify root causes |
53
Diversified Businesses (including Manufacturing, Retail, Consumer Products, Media and Entertainment and Telecom)
We deliver comprehensive BPM services for diversified businesses, including manufacturing, retail, consumer products, media and entertainment, and telecom.
As at March 31, 2017, we had 5,032 employees in this business unit. In fiscal 2017 and 2016, this business unit accounted for 17.5% and 15.4% of our revenue and 18.2% and 16.3% of our revenue less repair payments(non-GAAP), respectively.
Manufacturing: Our manufacturing team has rich experience in delivering metrics-driven solutions and transformation programs for our manufacturing clients. The key manufacturing sectors that we serve include:
| | • | | Electronics manufacturers; |
| | • | | Metal and mining companies; |
| | • | | Medical equipment manufacturers; |
| | • | | Surgical equipment and vision care product manufacturers; |
| | • | | Building and construction product manufacturers; |
| | • | | Automobile manufacturers; and |
54
The following table illustrates the key areas of services provided to clients in this business unit:
| | | | | | | | | | |
Manufacturing—Service Offerings |
Supply Chain Planning and Forecasting | | Sourcing and Procurement | | Fulfillment & Logistics | | Warranty and Returns Management | | Shared Services | | Sales, Marketing and Customer Services |
| Sales and operations planning, demand forecasting, supply planning, inventory management, inventory analytics | | Strategic sourcing, category management, contract management, spending analytics, transactional procurement | | Order entry & processing, order tracking, billing / invoicing, transport management, logistics optimization | | Warranty customer operations, warranty claims management, parts / repair management, warranty financial management, returns management, customer helpdesk | | Finance and accounting services, customer care services, human resource services | | Global market opportunities, brand building, go to market strategy, customer services, order management, acquisition analysis, retention analysis |
Retail and Consumer Products: Our retail and CPG solutions are designed to help our clients improve customer service, optimize marketing expenditures, reduce operational costs and streamline processes through efficiency, quality and productivity improvements.
The key retail and CPG companies that we serve include:
| | • | | Fast food chains and restaurants; |
| | • | | Cosmetics and healthcare companies; |
| | • | | Specialty retailers; and |
To support our services, we use our research and analytics platform, WADESM, which was designed and developed to enable retail and CPG companies to access, organize and analyze data from various outside sources and use the information to take informed decisions.
55
The following table illustrates the key areas of services that we provide to clients in this business unit:
| | | | | | | | |
Retail and Consumer Packaged Goods—Service Offerings |
Strategy Solutions | | Customer Service Solutions | | Supply Chain Solutions | | Revenue Management Solutions | | Global Back-office Solutions |
| Market entry strategy, balancing portfolio investments, consumer and market insights, innovation strategies, power brand strategy, marketing spending optimization | | Omni-channel (phone,e-mail, fax, website, live chat, social media) customer relationship management | | Retailer-supplier collaboration for demand-driven supply chain and retail execution management, supply intelligence, supplier performance and risk monitoring, contract management, supply chain orchestration – global trade shared services, trading partner helpdesks, logistics | | Planning and execution of transaction and interaction-based campaign strategies, loyalty management, credit control and collections | | Simplified, shared global self-service organization model with local business partners for finance and accounting, human resources or indirect procurement;end-to-end low cost shared services for transaction processes and virtual centers of excellence (“CoEs”) for specialized services (e.g., tax and internal audit) |
Media and Entertainment: Our media and entertainment solutions are designed to help our clients create new revenue streams, capitalize on emerging digital opportunities, harnessnew-age consumers to their advantage and boost margins. The key media and entertainment sectors that we serve include:
| | • | | Sports entertainment; and |
| | • | | Internet and outdoor advertising firms. |
Working with some of the largest media and entertainment companies in the world gives us an undisputed advantage in understanding the nuances of the business. We leverage years of industry and process experience, and a large team of digital media experts in deliveringnew-age cost-effective solutions to clients in this industry.
56
The following table illustrates the key areas of services that we provide to clients in this business unit:
| | | | | | | | |
Media and Entertainment—Service Offerings |
Strategy Solutions | | Digital Operations and Royalty Management Solutions | | Sales, Marketing and Distribution Solutions | | Customer Service Solutions | | Global Back-office Solutions |
| Market entry strategy, balancing portfolio investments, consumer and market insights, innovation strategies, brand power strategy, marketing expense optimization | | Digital operations solutions to help companies successfully expand into the digital business; royalty management solutions to help clients manage rights and royalties in both new media and traditional media | | Seamless integration of traditional and digital product sales, marketing and distribution to enable clients to roll out timely innovative pricing / packaging strategies | | Omni-channel (phone,e-mail, fax, website, live chat, social media) customer relationship management | | Simplified, shared global self-service organization model with local business partners for finance and accounting, human resources or indirect procurement;end-to-end low cost shared services for transaction processes and virtual CoEs for specialized services (e.g., tax and internal audit) |
Telecom: Our experience in consolidating and centralizing the functions of our telecommunications clients withbuilt-in variable capacity to meet business requirements helps us deliver business value. Withend-to-end BPM services, our solutions are designed to enable telecom companies to transform their value chain while tackling myriad challenges. Our solutions are designed to deliver business value through the right mix of analytics, technology, domain and process expertise that enable our clients to achieve cost efficiencies and drive sustainable growth strategies.
The following table illustrates the key areas of services that we provide to clients in this business unit:
| | | | | | |
Telecommunications—Service Offerings |
Customer Acquisition | | Order Provisioning and Order Management | | Operations and Customer Relationship Management (“CRM”) | | Global Back-office Solutions |
| Lead generation, outbound sales, sales analytics, cross-selling andup-selling analytics, contract administration | | New products and services, service delivery process creation, order provisioning, technical validation and support, rejected order tracking, multi-vendor tracking, order tracking, proactive order management, billing, data management (e.g. forms and administration) | | Inbound customer interaction services, logging and monitoring service requests, directory publishing, churn analysis and support, usage analytics, CRM analytics, collection analytics, web correspondence | | Simplified, shared global self-service organization model with local business partners for finance and accounting, human resources or indirect procurement;end-to-end low cost shared services for transaction processes and virtual CoEs for specialized services (e.g., tax and internal audit) |
57
Utilities
We are a leading utilities BPM service provider, with deep domain expertise in the management of customer needs across the entire utilities value chain - generation, transmission and distribution. We work with utilities companies globally in the residential, industrial, and small and medium enterprise (“SME”) segments for both prepaid and post-paid metered products.
The key energy and utilities industry sectors we serve include:
As at March 31, 2017, we had 3,707 employees working in this business unit. In fiscal 2017 and 2016, this business unit accounted for 9.3% and 10.2% of our revenue, and 9.7% and 10.8% of our revenue less repair payments(non-GAAP), respectively.
We are a strategic outsourcing provider for clients from the US, the UK and Asia-Pacific regions supportingbusiness-to-customer andbusiness-to-business customer segments across our suite ofend-to-endmeter-to-cash customer management services (including customer acquisition and management, billing and metering, payment processing, credit and collections) - all supported by our analytics expertise. We have capabilities to support clients across processes in oil and gas downstream, electricity distribution, asset management, FAO services in utilities and oil and gas, debt management and other enabling services such as meter reading, bill printing and digital support services (including smart metering). We offer platform integration, application integration, data integration, process integration, component integration, and system integration capabilities to enhance process management through technology-enabled platforms. We also work with clients to offer detailed multi-channel provisioning and social media analytics, such as data mining of structured and unstructured data, and speech and text analysis, with a view to increase customer satisfaction and improve collection rates.
The following table illustrates the key areas of services that we provide to clients in this business unit:
| | | | | | | | |
Utilities |
Meter-to-Cash Revenue Cycle Operations | | Customer Management | | Supply Chain Management & Procurement | | IT Solutions | | Research and Analytics |
| Customer billing, dispute resolution, exception handling, prepaid account management, billing of unmetered services, credit and collections, payment services, tariff plans, renewals, home move processing | | Customer acquisitions, customer retention, customer enhancement, cross- selling /up-selling, customer care – queries, correspondence, asset management | | eSourcing, vendor rationalization, supplier management, procurement optimization, sourcing, support,procure-to-pay (“P2P”) transaction, supply chain analytics | | Document control and digitization, master data management, enterprise resource planning (“ERP”) implementation and support,meter-to-cash –business-process-as-a-service, robotics – automation, workflow, support for SAP implementations, BPaaS platform solutions formeter-to-cash (“M2C”) | | Data mining, decision support services, collections optimizations, customer analytics – segmentation, lifetime value analysis, net promoter score (“NPS”) analysis, predictive analytics, text analytics |
| | |
Shared Services |
Finance & Accounting | | Human Resource Management |
| Order-to-cash, financial analysis,procure-to-pay, accounts receivable / payable, joint venture accounting, royalty accounting, contract accounting services specific to utilities and oil and gas industries | | Administration support and payroll services |
58
Consulting and Professional Services
Our consulting and professional services (“CPS”) business unit has a strong India presence coupled with global delivery capabilities, which allows us to serve a diverse and large global client base.
Our CPS business unit offers an array of services to a range of client sectors in consulting and professional services. These sectors include:
| | • | | Content and information publishers; |
| | • | | Research and consulting firms; |
| | • | | Real estate service firms; |
| | • | | Executive search firms; |
| | • | | Marketing service providers; and |
As at March 31, 2017, we had 1,490 employees in the business unit. In fiscal 2017 and 2016, this business unit accounted for 6.9% and 7.8% of our revenue and 7.2% and 8.2% revenue less repair payments(non-GAAP), respectively.
We provide a wide range of services from complex business and financial research and analytics to very simple data management operations. Besides providing shared services support to our clients such as finance and accounting, human resource management, customer support and IT and infrastructure management, we provide the following domain-specific services:
| | | | | | |
Consulting and Professional Services—Service Offerings |
Content & Information Publishers | | Research and Consulting Firms | | Real Estate Services Firms | | Executive Search Firms |
| Content sourcing, indexing / tagging, analysis & product creation, content management, including design and production services for digital / print products | | Opportunity assessment, sector / thematic research, target screening, company analysis, including financial modeling, competitive intelligence and benchmarking | | Strategy support, sales and marketing support, business research, survey management support,end-to-end conveyancing process, lease preparation & abstraction, contract management | | Pitch book support, industry and company research, databaseclean-up, update and management, name identification, business executive support |
| | | | |
Market Research Firms | | Marketing Service Providers | | Legal Services Firms |
| End-to-end research operations support: research design, project management, survey programming, data collection, coding, data processing, data analytics and presentation | | Industry, company & product research support, market research operations, market research analytics, shopper & CRM analytics, web / digital analytics, 24/7 data management production support, digital content management and production support (designing & development) | | Legal support, legal and business research, digital dictation transcription, pitch support, accounts payables & general ledger, employee data management and payroll |
59
Healthcare
We deliverend-to-end BPM services across the healthcare industry value chain. We offer health information management, coding (including current procedural technology andICD-9 codes for international statistical classification of diseases and related health problems), marketing analytics and data analytics for pharma, Medicare and medical claim processing, revenue- management related processes, and Health Insurance Portability and Accountability Act (“HIPAA”) compliance support.
The healthcare industry segments that we serve include:
| | • | | Durable medical equipment manufacturers; |
| | • | | Health insurance companies; |
| | • | | Healthcare provider practices and hospitals; |
| | • | | Pharmaceutical and biotech companies; and |
| | • | | Third-party administrators. |
Our recent acquisitions of Value Edge and HealthHelp have considerably strengthened ourend-to-end healthcare capabilities and services in the BPM industry. Value Edge strongly positions us in the pharmaceutical and biopharmaceutical industry with research and analytics expertise to support drug development and commercial services. HealthHelp positions us as a strategic provider helping healthcare insurance companies deliver affordable and improved care management through its analytics-based and medical-content rules driven platform which provides an alternative to traditional care management outsourcing.
As at March 31, 2017, we had 2,582 employees in this business unit. In fiscal 2017 and 2016, this business unit accounted for 6.8% and 5.2% of our revenue and 7.1% and 5.5% of our revenue less repair payments(non-GAAP), respectively.
The following table illustrates the key areas of services that we provide to client segments in this business unit:
| | | | | | | | |
Healthcare—Service Offerings |
Providers | | Payer | | Durable Medical Equipment Manufacturers | | Enterprise Shared Services | | Pharmaceutical and Consumer Health |
| Revenue cycle management, medical coding, bill preparation, receivables management, payment posting, debt analysis | | Claims administration, member and provider services, clinical support, overpayment recovery, fraud detection and investigation, utilization management services (i.e., optimizing the payer healthcare spend on areas such as tests and procedures without compromising the patient care-quality-safety norms) | | Billing and submissions, fulfillment support, collections, patient services, collection analytics | | Finance and accounting, workflow / platforms, research and analytics (knowledge process outsourcing), technology solutions,front-end / mailroom, customer interaction services | | Competitive intelligence, pipeline analysis, product profiling, key performance indicators (“KPI”) reporting, epidemiology analysis, market opportunity assessment, social media analysis, key opinion leader (“KOL”) research, modeling and tool building support, pricing analytics, patient data analytics |
60
Banking and Financial Services
We perform front and back office and other services for more than 20 banking and financial services clients, including large commercial and retail banks, wholesale and retail lenders, wealth advisors, asset managers, hedge funds and mortgage servicing companies.
We aim to add value to our clients’ businesses by improving their customer satisfaction, unlocking cost efficiencies and streamlining processes through technology optimization.
The key banking and financial sectors that we serve include:
| | • | | Retail and commercial banking; |
| | • | | Wealth and investment banking; |
| | • | | Capital markets and asset management; |
| | • | | Financial advisory firms; |
| | • | | Financial research and financial market intelligence companies; |
| | • | | Financial institutions. |
As at March 31, 2017, we had 1,584 employees working in this business unit. In fiscal 2017 and 2016, this business unit accounted for 4.4% and 5.5% of our revenue and 4.6% and 5.8% of our revenue less repair payments(non-GAAP), respectively.
61
The following table illustrates the key areas of services that we provide to clients in this business unit:
| | | | | | |
| | | Banking and Financial Services—Service Offerings | | |
Retail Banking | | Commercial Banking | | Capital Markets | | Mortgage Banking |
Acquisition: Lead generation and deployment, customer behavioral analysis, campaign management, product development / management and support; On-boarding: Application scanning and indexing, account opening, product application processing, detailed documentation review and verification, underwriting / spend limit assignment, welcome calls; Maintenance and servicing: Account maintenance, account and general enquiries, customer data maintenance, statement generation, payment processing, funds allocation and return payment processing, complaint handling, funds transfers, remittance, refunds and settlements, billing queries and statement processing Collections: Collections and recovery, ship tracking,pre-delinquency management, payment plans Bank Secrecy Act / Anti-Money Laundering: Alert elimination, enhanced due diligence, fraud & cyber-crime, politically exposed personnel and negative news | | Trade finance: Account opening, bills for collection, export bills negotiation, import bills, letter of credit processing, bank guarantee credit limits; Credit risk management: Financial spreading, proposal development, reconciliation, credit analysis, collateral management, renewal support, billing and contribution management, audit support; Cash management: Funds transfer, trade processing, reconciliations, accrual calculations, investigations, payment processing, settlement, reference data management, reporting; Commercial lending: Account opening, “know your customer,” loan onboarding, documentation, covenant monitoring, billing, statutory accounting; Treasury services: Cash management, foreign exchange settlements, bill discounting, rates updates, mark to market, margin allocation | | Front office: Financial and business research, investment strategy and modeling, order entry, allocation / rebalancing; Middle office: Reference data management, cash flow forecasting, risk management, amendments / maintenance of existing data, manual trade allocations, manual trade booking, trade exception / rejection management, trade amendment, trade confirmation, queries handling; Back office – Accounting: Expense and income processing, securities lending, corporate actions processing, fund accounting / net asset value calculations, financial reporting, settlementfollow-up with clients; Back office – Asset servicing : Clearing and settlement, custody / record keeping, stock transfer, collateral management, transfer agency, claims management; Back office – Treasury: Cash management, cash forecasting, payment processing, invoicing / billing processing | | Originations: Indexing,pre-underwriting checklist,pre-funding audit, correspondent indexing, title commitment, credit evaluation, contact point verification, disbursals; Servicing: Customer service, loan boarding andset-up, adjustable rate mortgage audit, payments processing, assignments and endorsements, lien release, escrow management / periodic analysis, final documents follow up and audit; Default servicing:Pre-loss mitigation, foreclosure support, borrower research, operations intake, claims processing, investor reporting, closing and monitoring functions, trial period monitoring (forbearance support), loan modification document preparation; Secondary markets services: Post close audit, due diligence of acquired packets, documentary fulfillment |
62
The following table illustrates our research and analytics practice focused on banking and financial services:
| | | | | | | | |
Retail Banking | | Investment Banking | | Commercial Banking | | Wealth Management | | Asset Management |
Loans, cards, profitability, attrition, risk, fraud | | Mergers and acquisitions (“M&A”), initial public offerings, private placements | | Financial statement spreading, credit appraisal, risk ratings, portfolio construction, portfolio measurement, probability of default, loss given default exposure at default prediction models | | Current investment reviews, new business, pitch books, CRM support, fund research, portfolio research | | Fixed income, equities, investment strategies, portfolio monitoring |
| | | | |
| | Data Mining and Data Management Analysis of structured and unstructured data across the banking and finance sector, organization of data for retrieval and analysis | | |
| | | | |
| | Reporting, Dash-boarding and Visualization Generation and presentation of data-driven insights, communication tools for analysts | | |
| | | | |
| | Model Development and Recalibration Actionable models for optimization of operations and strategic planning, insights for changing market conditions | | |
63
Shipping and Logistics
We deliver a range of industry-specific business processes across the shipping and logistics industry, in addition to providing services in the areas of finance and accounting, customer interaction services, business technology, procurement and human resources administration. We also offer decision support services in the form of research and analytics. To support our shipping and logistics team, we leverage various enabling tools, technologies and our proprietary digitization platform to deliver high-quality service to our customers.
The key shipping and logistics industry sectors that we serve include:
| | • | | Global express and courier companies; |
| | • | | Ocean sector –non-vessel operating common carrier, ocean liners, ports and terminals and shipping agencies; |
| | • | | Trucking sector – Less-than-truck load, full truck load, truck rental and leasing, compliance, safety and accountability companies; |
| | • | | Third and fourth-party logistics; and |
64
As at March 31, 2017, we had 1,838 employees working in this business unit. In fiscal 2017 and 2016, this business unit accounted for 4.3% and 3.9% of our revenue, and 4.4% and 4.1% of our revenue less repair payments(non-GAAP), respectively.
The following table illustrates the key areas of services provided to clients in this business unit:
| | | | | | | | | | | | |
Shipping and Logistics |
Sales & Marketing | | Customer Service | | Document Processing | | Operations Support | | Finance & Accounting | | Research and Analytics | | Technology Services |
| Tariff filing and maintenance, rate quotes, service contract / rate agreement creation and maintenance | | Customer file and debtor file administration, customer helpdesk, booking desk-phone, bookingdesk-e-mail, electronic data interchange / Web, rating | | Exports, bill of lading, processing and data entry, advance manifest processing, freight audit, billing and invoicing, vessel closures, imports, import data quality process / checks, arrival notifications, import general manifest filings with customers, delivery order issuance, customers document processing | | Vessel schedules – long term support , vessel schedules – coastal, routing module maintenance, hazardous cargo approvals, vendor management – vendor file administration, purchase order / job order creation, gate moves, ship husbanding, stowage planning, bayplan submission and distribution, inbound and outbound trans-shipment, maintenance and repairs, global stock reconciliation, container leasing validation, vessel performance reports, inventory management, chart corrections management, safety and environmental KPI monitoring onshore | | Accounts payable, accounts receivables, disbursement accounting, credit and collections, agency reconciliations, general ledger / bank reconciliation, cash reporting and audit / vendor reconciliation, financial management reporting, vendor helpdesk, monthly closing / quarterly / yearly closing, treasury support, agency audits, claims management | | Metrics realization & analysis, network design and optimization, transport management, shipping performance management, tonnage analytics, carrier sourcing analytics, fleet analysis and maintenance, corporate management, revenue analytics, reverse logistics analytics | | Intranet support, claims management, data hubbing,E-commerce registration,E-learning module content management,E-learning module content creation |
65
Horizontal Units
Customer Interaction Services
We have a strong track record of supporting customer interaction services while focusing on business outcomes. To increase customer loyalty and satisfaction, we offer tailor-made solutions by leveraging our industry-specific expertise, sophisticated technology,analytics-led transformation suite, and omni-channel digital stack supported by a strong talent pool. Customer interaction services are offered across our vertical business units. As at March 31, 2017, we had 12,175 employees in this horizontal unit. In fiscal 2017 and 2016, this horizontal unit accounted for 27.9% and 26.9% of our revenue, and 29.1% and 28.5% of our revenue less repair payments(non-GAAP), respectively.
The following table illustrates the key customer interaction services that we provide:
| | | | |
| | | Customer Interaction Services—Service Offerings | | |
Services | | Channels | | Languages |
Customer acquisition(sales –up-sell or cross-sell, campaign management), Customerretention(complaint management, loyalty program management, customer / guest relations), Customerservice(account management, transaction processing, billing and payments), Collections (early stage, late stage, skip tracing) Technical helpdesk (support for query levels “L0” and “L1” - website assistance) Digital customer experience management (web chat, social media, content) As-a-Service models (quality, training, workforce management) Analytics(customer segmentation, loyalty management, sentiment analytics, sales analytics) | | Voice (inbound / outbound), interactive voice response,e-mail, chat, social media, short message service (“SMS”), white mail, fax, ChatBots (virtual assistant) | | English, French, Italian, Russian, Spanish, Portuguese, German, Hungarian, Greek, Turkish, Finnish, Dutch, Polish, Swedish, Mandarin, Cantonese, Japanese, Korean, Arabic, Filipino (Tagalog), IsiZulu, IsiXhosa, Afrikaans, and more than 20 regional languages |
Finance and Accounting
Our finance and accounting service offerings include a full suite of finance and accounting processes, business processre-engineering, and transformation, including automation of finance operations. Finance and accounting services are offered across all our vertical business units.
We have experience in delivering large-scale and complex finance and accounting transformation programs, which include:
| | • | | Industry-specific accounting processes such as royalty accounting, fiduciary accounting, revenue recovery management and airline passenger revenue accounting; |
| | • | | Source-to-pay procurement, including strategic sourcing capabilities such as category management, contract management, vendor management and spend analytics; |
| | • | | Services acrossorder-to-cash, including order management, supply chain fulfillment support, supply chain management, deductions management, cash application; |
| | • | | End-to-end processes ranging from simple, transaction-based processes (such as journals and reconciliations) tohigh-end, judgment-based processes, such as analytics and treasury; |
| | • | | Global risk and compliance services such as forensics, background screening and digital credit screening; |
| | • | | Automation suite for accounting activities, including WNS IP best practices, robotics process automations, embedded analytics and reporting under the “CFO TRAC” offerings; |
| | • | | Business processre-engineering and transformation tools offering such as our “Process Maturity Model,” which allows for objective assessment of processes, technology and people using performance benchmarks that are customized for the industry and size of the company or “ADAPT,” which is our proprietary business processre-engineering methodology; |
66
| | • | | Rapid, large-scale transitions; |
| | • | | Implementation of shared service centers and rationalization of financial systems to optimize and consolidate our clients’ information technology platforms; and |
| | • | | Multi-location, multi-system global finance and accounting consolidation. |
67
As at March 31, 2017, we had 4,844 employees in this horizontal unit. In fiscal 2017 and 2016, this horizontal unit accounted for 20.6% and 18.4% of our revenue, and 21.5% and 19.5% of our revenue less repair payments(non-GAAP), respectively.
The following table illustrates the key finance and accounting services we provide:
| | | | | | | | |
| | | Finance and Accounting—Service Offerings | | |
Source-to-Pay | | Order-to-Cash | | Record-to-Report | | Decision Support | | Corporate Functions |
| Sourcing services including strategic sourcing & category management, procurement and administration, invoice / expense processing and payment, accounts payables, accounting and treasury support | | Accounts receivables, billing and cash application, order management, credit control, collections and deductions management | | General accounting, fixed assets, reconciliations,month-end reporting and consolidation, tax filing and reporting, cost accounting, inter-company accounting, statutory reporting | | Budgeting, forecasting, variance analysis, management reporting | | Treasury, cash management, financial planning and analysis, tax and compliance, decision support, management accounting |
| | | | | | |
Supply Chain Finance | | Industry-specific Accounting | | Technology Solutions | | Governance, Risk, Compliance and Audit Services |
| Product costing, inventory accounting, manufacturing accounting, supply chain analytics, supply chain fulfillment support | | Passenger revenue accounting, revenue audit and recovery, claims management, loan account maintenance, royalty accounting, fiduciary accounting, trip records, freight and fuel charges accounting, cost accounting, franchise accounting, meter reading,pre-payment billing, disbursement accounting | | Enterprise resource planning (“ERP”): Implementation, hosting, optimization; Bolt-on tools: Reconciliations, reporting, workbench, query management, web portal; Enablers: Mailroom solution, workflow | | Governance consulting, risk analytics services, compliance services and audit services |
Proprietary Platform:
| | • | | Proprietary platform-based service offerings include: “CFO TRAC – Finance and Accounting Automation Suite” brand umbrella, and “Xponential — The ERP Card SolutionTM,” a part of our BizApsProcure-to-Pay (P2P) solutions brand umbrella |
Our recent acquisition of Denali further strengthened our services acrosssource-to-pay, including strategic sourcing, category management, spend analytics, contract management, catalog (demand management), global procurement,end-to-end accounts payable, industry-specific accounts payable, treasury and accounting support activities.
68
Research and Analytics
With more than 2,400 employees, our research and analytics practice helps more than 100 global clients make critical business decisions with data-driven insights. We combine our consultative approach with deep domain knowledge and advanced analytics to provide decision support to our clients. Our practice endeavors to support clients with customized big data, machine learning, artificial intelligence, social media analytics and advanced analytics solutions for digital transformation, better customer understanding, improved marketing efficiencies, risk reduction, and insights generation to optimize operations.
Our industry analytics portfolio spans various verticals, including retail and CPG, retail, hospitality, travel, banking and insurance, utilities and other emerging industries.
Our integrated business analytics services provide focused solutions to clients and seek to create long-term business value. We employ suitable tools and techniques based on the business context to generate actionable insights, focus on operational goals of quality and efficiency, and aid transformational initiatives. Our “Data Sciences Group”- a specialized research and development-focused unit comprising data scientists and leading analytics experts, develops cutting-edge products, solutions and capabilities with the view to enhance our clients’ returns on their analytics investments.
As at March 31, 2017, we had 2,405 employees in this horizontal unit. In fiscal 2017 and 2016, this horizontal unit accounted for 13.3% and 12.4% of our revenue, and 13.8% and 13.1% of our revenue less repair payments(non-GAAP), respectively.
The following illustrates the key research and analytics products and services:
WNS “IDEA (Interactive Data Enabled Analytics)” is a suite of domain-specific products that are designed to help clients optimize their results and outperform their competitors. It leverages our domain-focused intellectual property, deep market understanding (gained from the extensive and varied engagements undertaken for multiple clients) and technology prowess. Comprehensive set of industry specific key metrics / KPIs arepre-built in the IDEA suite and more specific metrics can be added based on client requirements.
| | |
Product Name | | Industry Served |
| Fare Audit Analytics Suite | | Airlines |
| Contact Center Insights | | Contact center (all industries) |
| Bookings Analysis Suite | | Shipping and logistics |
| Broker Analytics Insights Suite | | Insurance |
| Pharma Sales Insights Suite | | Pharmaceutical |
“SocioSEERTM” is our proprietary big data analytics platform that lets organizations create brand advantage by harnessing the power of social media. SocioSEERTM combines machine learning and deep domain expertise to help brands proactively manage and outperform their stated goals around brand health, customer centricity and topline growth. The solution is built on a scalable, open source tech stack that uses WNS proprietary RE.CO.IN methodology along with proprietary algorithms.
“BrandttitudeTM” is a cloud-based analytical market intelligence product to track brand performance and perceptions over multiple dimensions across varied data sources to help clients take informed decisions. The product is built using open source technologies on a scalable data harmonization platform.
69
| | | | |
Research and Analytics—Service Offerings |
Analytics Consulting | | Marketing Analytics | | Digital Analytics |
| Analytics maturity consulting, data maturity consulting, model validation, partnership evaluation, model conversations, visualization needs assessment, digital transformation, big data consulting | | Customer analytics, campaign management and loyalty analytics, sales analytics, market / media mix modeling, market research analytics, pricing analytics, personalization, social media analytics | | Social media analytics, web analytics, text mining |
| | |
Data and Visualization Services | | Research | | Financial Analytics |
| Data stitching and analysis, reports and dashboards, visualization tools, data cleansing and aggregation | | Business research: Strategic marketing intelligence, competitive research; Financial research: Credit research, equity research, M&A research, fixed income research Market research: Survey programming and web surveys | | Actuarial analytics, collections analytics, budgeting and forecasting, balance sheet analytics, working capital analytics |
| | | | |
| | | Domain-based Analytics | | |
Insurance Analytics | | Travel & Leisure Analytics | | Banking & Financial Analytics |
| Claims analytics, subrogation analytics, fraud analytics, customer analytics | | Loyalty analytics, customer interaction service analytics, commercial intelligence, flight operations, pricing and revenue management | | Data Mining and Data Management:Analysis of structured and unstructured data across the banking and finance sector, organization of data for retrieval and analysis Reporting, Dash-boarding and Visualization: Generation and presentation of data-driven insights, communication tools for analysts Model Development and Recalibration: Actionable models for optimization of operations and strategic planning, insights for changing market conditions |
| | |
Utilities Analytics | | Shipping & Logistics Analytics | | Healthcare (Pharma & Consumer Health)
Analytics |
| Data mining, decision support services, collections optimizations, customer analytics – segmentation, lifetime value analysis, NPS analysis, predictive analytics, text analytics | | Metrics realization and analysis, network design and optimization, transport management, shipping performance management, tonnage analytics, carrier sourcing analytics, fleet analysis and maintenance, corporate management, revenue analytics, reverse logistics analytics | | Competitive intelligence, pipeline analysis, product profiling, KPI reporting, epidemiology analysis, market opportunity assessment, social media analysis, KOL research, modeling and tool building support, pricing analytics, patient data analytics |
70
Technology Services
With a view to consolidate our technology offerings further, we recently launched “WNS TRACTM,” our next-generation suite of BPM enablement technology solutions empowered by robotics, including digital automation, analytics and cloud.
WNS TRACTMis differentiated by our deep domain expertise in strategic verticals and processknow-how in key horizontal domains to equip us with an ability to understand and identify suitable technology for our clients’ businesses outcomes. The WNS TRACTM solutions are available in the form of(a) all-inclusive and comprehensive enterprise platforms that are a combination of own IP with key partner products and (b) as plug and play solutions that seamlessly integrate with client’s existing technology environment without the need for a complete overhaul. Also, the solutions arepre-configured with best practices and industrialized accelerators to drive implementation around social, mobility, analytics, cloud, robotics and digital automation, including RPA – with a host of deployment options and commercial models to choose from.
From consulting to application management and operations, WNS TRACTM drives seamless technology deployment across the business process lifecycle with the view to achieve sustained growth and profitability.
As at March 31, 2017, we had 218 employees in this horizontal unit. In fiscal 2017 and 2016, this horizontal unit accounted for 1.5% and 1.4% of our revenue, and 1.6% and 1.4% of our revenue less repair payments(non-GAAP), respectively.
The following table illustrates our industry-specific and cross-industry solutions available as part of WNS TRACTM:
| | | | | | | | | | |
WNS TRACTM |
Industry-specific solutions |
Travel | | Insurance | | Healthcare | | S&L | | Utilities | | CPG & Retail |
• Verifare • SmartPro • Qbay • RePax • Commercial planning suite | | • Policy administration • Broker connect • eAdjudicator • Actuarial proprietary platform | | • Order-to-cash (“O2C”) for medical device manufacturing • Electronic health records and advanced analytics • Fraud detection for payers | | • Shipping document lifecycle management • Billing transformation and analytics | | • Meter-to-cash solution • Front-office digital transformation • SMART automation and analytics | | • Demand-driven supply chain • All channel solutions • Deductions and warranty management |
| | | | | | |
WNS TRACTM |
Cross-industry solutions |
Solutions for Chief Financial Officers | | Solutions for Chief Procurement Officers | | Robotics & Digital Automation | | Customer Interaction Services |
• WNS P2P solution • WNS O2C solution • WNSrecord-to-report solution • Reporting and analytics | | • WNSsource-to-pay solutions • WNS Procurement Card(“P-Card”) solution • WNS supplier portal • WNS spend analytics | | • Robotics • Digital automation, including cognitive tech, machine learning, predictive modeling | | • Self-service solutions • Agent assist (digital and social engagement) • Interaction and text analytics |
71
Sales and Marketing
The sales cycle for business process management services can be time-consuming and complex in nature. The extended sales cycle generally includes initiating client contact, submitting requests for information and requests for proposals for client business, hosting client visits to our delivery centers, performing analysis (including diagnostic studies and conducting pilot implementations) to demonstrate our delivery capabilities. Due to the complex nature of the sales cycle, we have aligned our sales teams to our vertical business units and staffed them with hunting, or new sales, professionals, as well as farming, or client relationship, professionals. Our hunters and farmers have specialized industry knowledge and experience, which enable them to better understand prospective and existing client’s business needs and to offer appropriate domain-specific solutions.
Our sales and sales support professionals are based in Australia, Dubai, Eastern Europe, India, Singapore, South Africa, the UK and the US. Our sales teams work closely with our global sales support team, which provides critical analytical support throughout the sales cycle. Other key functions provided by our sales support team include generating leads for potential business opportunities and telephone sales support. As at March 31, 2017, our front-line sales teams consisted of 86 members including hunters and farmers. Our front-line sales teams are responsible for identifying and initiating discussions with prospective clients, and selling services in new areas to existing clients. We assign dedicated client partners and / or account managers to our key clients. These managers work with their clients daily at the client locations. They also are the conduit to our service delivery teams addressing clients’ needs. More importantly, by leveraging their detailed understanding of the client’s business and outsourcing objectives gained through this close interaction, our existing clients and account managers actively identify and target additional processes that can be outsourced to us. Through this methodology, we have developed a strong track record of increasing our sales to existing clients over time.
Clients
As at March 31, 2017, we had a diverse client base of 349 clients across a variety of industries and process types, including companies that we believe are among the leading players in their respective industries.
We believe the diversity in our client profile differentiates us from our competitors. See “Part I — Item 5. Operating and Financial Review and Prospects — Revenue” for additional information on our client base.
The table below sets forth the number of our clients by revenue for the periods indicated. We believe that the large number of clients who generate more than $1 million of annual revenue indicates our ability to extend the depth of our relationships with existing clients over time.
| | | | | | | | |
| | | Year ended March 31, | |
| | | 2017 | | | 2016 | |
Below $1.0 million | | | 248 | | | | 211 | |
$1.0 million to $5.0 million | | | 76 | | | | 61 | |
$5.0 million to $10.0 million | | | 14 | | | | 19 | |
More than $10.0 million | | | 11 | | | | 11 | |
72
Competition
Competition in the business process management services industry is intense and growing steadily. See “Part I — Item 3. Key Information — D. Risk Factors — Risks Related to Our Business — We face competition from onshore and offshore business process management companies and from information technology companies that also offer business process management services. Our clients may also choose to run their business processes themselves, either in their home countries or through captive units located offshore.”
We compete primarily with:
| | • | | Focused BPM service companies with presence in offshore locations (primarily India), such as EXL Service Holdings, Inc., Firstsource Solutions Limited and Genpact Limited; |
| | • | | BPM divisions of numerous information technology service companies operating out of India, such as Cognizant Technology Solutions, Infosys Technologies Limited, Tata Consultancy Services Limited and Wipro Technologies Limited; |
| | • | | Global companies such as Accenture Limited, Electronic Data Systems Corporation, a division of Hewlett-Packard, and International Business Machines Corporation, which provide an array of products and services, including broad-based information technology, software, consulting and business process outsourcing services; and |
| | • | | Global financial services and consulting firms such as Deloitte Private Limited, industry-focused niche technology players such as InterGlobe Enterprises and Accelya, and specialty analytics service providers such as Mu Sigma Inc. |
In addition, departments of certain companies may choose to perform their business processesin-house, in some cases via an owned and operated facility in an offshore location such as India. Their employees provide these services as part of their regular business operations.
Intellectual Property
We use a combination of our clients’ software systems, third party software platforms and systems and our own proprietary software platforms and systems to provide our BPM and technology services. Our proprietary solutions and licensed software allows us to market our services as integrated solutions under WNS TRACTM that combine technology solutions together with our core BPM service offerings. Our principal proprietary software solutions include: –
| | (1) | WNS TRACTM Travel technology solutions, including a revenue accounting platform and a fare audit platform, which we use in our travel and leisure business unit; |
| | (2) | WNS Auto Claims software platform, which we use in WNS Assistance; |
| | (3) | WNS TRACTM Insurance technology solutions, including “iPAS” and “eAdjudicator,” which we use in our insurance business unit; |
| | (4) | WNS TRACTM Finance and Accounting solutions, including proprietary software, point solutions and platform solutions developed on third party software that we use in our finance and accounting services; and |
| | (5) | WNS TRACTM Robotics and Digital Transformation solutions, including our proprietary solutions and solutions developed on third party software, for delivering automation and transformation services to our clients. |
We customarily enter into licensing andnon-disclosure agreements with our clients with respect to the use of their software platforms and systems. We maintain intellectual property rights in our proprietary software platforms and systems, and license the use of third party software platforms and systems from their respective owners. Under our contracts with third-party software platform providers, any solutions developed by us on top of such third party software platforms, using our domain knowledge, are our intellectual property (unless qualified otherwise). Our client contracts usually provide that all customized intellectual property created specifically for the use of our clients will be assigned to them, unless it is clearly identified as our intellectual property.
Our employees are also required to sign confidentiality agreements as a condition to their employment. These agreements include confidentiality undertakings regarding our company’s and the client’s intellectual property that bind our employees even after they cease to work with us. These agreements also ensure that all intellectual property created or developed by our employees in the course of their employment is assigned to us.
We have registered the trademark “WNS,”“WNS-Extending Your Enterprise” and “WNS TRAC” in most of the countries where we have global presence.
73
Technology
We have a dedicated team of technology experts who support clients at every stage of their engagement with us. The team designs, executes and supports technology solutions to enable delivery of business processes for our customers.
Wide-area-network — We have designed and built a highly redundant and resilient global multi-protocol label switching (“MPLS”) network, connecting all of our delivery centers to our points of presence in the US and UK. We run data, voice and video services on this global MPLS network to serve customers.
Customer interaction services technology infrastructure — We have deployed omni-channel capable contact center platforms comprising voice, web chat, email, social media, and interactive voice response across all our delivery centers, delivering customer experience through customer interaction services. These customized platforms orchestrate omni-channel customer journeys across digital channels including self-service and payment card industry data security standard compliance
Data centers — We have set up a highly secure, redundant, state of art data center for hosting our omni-channel contact center platform, automation tools for servicing our clients and our corporate infrastructure services.
Technology service management methodology — Our technology service management and delivery is based on an information technology infrastructure library framework. We manage over 200 clients for technology implementation, service delivery and support for end user computing, network, telecommunications, IT security and systems technology platforms.
Process and Quality Assurance and Risk Management
Our Transformation Quality and Quality Assurance programs are critical for the success of our operations. We have an independent Quality Assurance team to monitor, analyze, and provide feedback, as well as report process performance and compliance. Our company-wide quality management system focuses on effectively managing our client processes on an ongoing basis. Our process delivery is managed by independent empowered teams and is measured regularly againstpre-defined operational metrics. We have over 1,000 employees in our Quality Assurance team who help us meet ISO 9001 standards for quality management systems and ensure continued compliance. As part of our Transformation Quality program, we apply Lean Six Sigma methodologies, which are statistical and process-focused methodologies to improve and deliver consistent quality across processes. We apply well-defined quality management principles to improve our levels of service quality to our clients. In fiscal 2017, more than 430 different projects were completed using Lean Six Sigma methodologies.
We have been honored with the following awards for our achievements in quality assurance in fiscal 2017:
| | • | | National Quality Excellence Award for: |
| | • | | Best Business Process Excellence Program |
| | • | | Best Quality Assurance Management Program in the Travel sector |
| | • | | World Quality Congress Award for Best Six Sigma Project in the Travel sector |
| | • | | Golden Star Six Sigma Award for Best use of Six Sigma in Customer Service |
| | • | | Golden Peacock National Quality Award – 2016 |
| | • | | 2nd SLASSCOM Award 2016 for Excellence in Quality Management |
Our Board of Directors is primarily responsible for overseeing our risk management processes. The Board of Directors receives and reviews reports from the Head of Risk Management and Audit as considered appropriate regarding our company’s assessment of risks. The Board of Directors focuses on the most significant risks facing our company and our company’s general risk management strategy, and also ensures that risks undertaken by our company are consistent with the Board’s appetite for risk.
Our risk management framework also focuses on three important elements: business continuity planning, information security and operations risk management.
Our approach to business continuity planning involves implementation of an organization-wide business continuity management framework which includes continual self-assessment, strategy formulation, execution and review. Our business continuity strategy leverages our expanding network of delivery centers for operational and technological risk mitigation in the event of a disaster. To manage our business continuity planning program, we employ a dedicated team of experienced professionals. A customized business continuity strategy is developed for key clients, depending on their specific requirements. For mission-critical processes, operations are typically split across multiple delivery centers in accordance with client-approved customized business continuity plans.
74
Our approach to information security involves implementation of an organization-wide information security management system, which complies with the ISO 27001:2013 to manage organizational information security risks. These measures seek to ensure that sensitive information pertaining to our company or our clients remains secure. Currently, information security systems at 34 delivery centers are ISO 27001:2013 certified, and we expect to seek similar certifications for our newer delivery centers. We also comply with the Payment Card Industry Data Security Standard (“PCI DSS”) which is a security standard aimed at helping companies proactively protect cardholder data and sensitive authentication data. In addition, we also undergo Statement on Standards for Attestation Engagements No. 16 / International Standard on Assurance Engagements (“ISAE”) No. 3402, “Reporting on Controls at a Service Organization (“SOC”) 1 Type 2” audits with respect to our general control environment supporting operational delivery and with respect to security, availability and confidentiality in accordance with ISAE on an annual basis.
Our approach to operations risk management involves the implementation of a “three lines of defense” framework for our clients’ offshored business processes. Under this framework, the quality assurance teams embedded within the business units act as the first line of defense, an independent and centralized risk management team acts as the second line of defense andclient-end internal audit teams act as the third line of defense. Our lines of defense are designed to identify potential risks, evaluate design efficiency and operating effectiveness of controls embedded within the outsourced business processes that we manage for our clients, and propose additional controls as appropriate for mitigation of the identified risks.
In addition, our clients may be governed by regulations specific to their industries or in the jurisdictions where they operate or where their customers are domiciled which may require them to comply with certain process-specific requirements. As we serve a large number of clients globally and across various industries, we rely on our clients to identify the process-specific compliance requirements and the measures that must be implemented in order to comply with their regulatory obligations. We assist our clients to maintain and enforce compliance in their business processes by implementing control and monitoring procedures and providing training to our employees serving specific client programs. These control and monitoring procedures are separate from and in addition to our periodic internal audits.
Human Capital
As at March 31, 2017, we had 33,968 employees, of which 21 are based in Australia, 274 are based in China, 137 are based in Costa Rica, one is based in Denmark, 10 are based in France, 7 are based in Germany, 21,480 are based in India, 4,946 are based in the Philippines, 193 are based in Poland, 434 are based in Romania, one is based in Singapore, 4,343 are based in South Africa, 840 are based in Sri Lanka, 6 are based in Turkey, one is based in the United Arab Emirates, 467 are based in the UK and 807 are based in the US. Most of our associates hold university degrees. As at March 31, 2016 and 2015, we had 32,388 and 28,890 employees, respectively. Our employees are not unionized. We believe that our employee relations are good. We focus heavily on recruiting, training and retaining our employees.
Recruiting and Retention
We believe that talent acquisition is an integral part our overall organizational strategy. We have developed effective human resource strategies and demonstrated a strong track record in recruitment specific to the needs of our business units to optimize the training and development of our employees. As we continue to grow, we look to improve and enhance our candidate pool, which is sourced from recruitment agencies, job portals, advertisements, college campuses (where we focus on recruiting talented individuals) andwalk-in applications. In addition, a significant number of our applicants are referred to us by existing employees. We recruit an average of 1,653 employees per month.
During fiscal 2017, 2016 and 2015, the attrition rate for our employees who had completed six months of employment with us was 34%.
Training and Development
We devote significant resources to the training and development of our associates. Our training typically covers modules in leadership and client processes, including the functional aspects of client processes such as quality and transfer. Training for new associates may also include behavioral and process training as well as cultural, voice and accent training, as required by our clients.
75
We have established the WNS Learning Academy, where we offer specialized skills development, such as leadership and management development, skills and behavioral programs for employees across all levels. The WNS Learning Academy is staffed with over 35 full-time trainers content designers ande-learning developers. We customize our training programs according to the nature of the client’s business, the country in which the client operates and the services the client requires. Further, the WNS Learning Academy has anin-housee-learning unit which creates computer orweb-based learning modules to support ongoing learning and development.
Since the launch of the WNS Learning Academy, we have made significant efforts to improve the learning and development of our supervisory, management and leadership teams, which is visible through focused learning initiatives targeted at employees with specific job roles and based upon current and future business competency requirements. Our learning initiatives include, among others, the following:
| | • | | Afive-day leadership program, implemented in 2008, with a60-90 day action learning project focused on professional and leadership skills and process improvement for over 2,000 team leaders and managers; |
| | • | | Educational opportunities throughtie-ups with leading institutions, such as the Narsee Monjee Institute of Management Studies and NIIT University; |
| | • | | “Train the Trainer” programs, in which master trainers visit our various locations to conduct training sessions; |
| | • | | The ongoing expansion of our virtual domain university for each business unit, which we intend to serve as a one stop solution for domain knowledge; and |
| | • | | Diversity and cross-cultural understanding training initiatives. |
Through these learning initiatives and others, we are addressing developmental and functional needs at the junior management level, leadership and sales focus at the middle management level and business and strategic development at the senior leadership level. Our goal is to consolidate, build and share intellectual property and business knowledge throughout our organization, which we believe will benefit us, as well as our clients, in the long run.
Further, in connection with our focus on institutionalizing talent identification, succession planning and talent development frameworks, the WNS Learning Academy is involved with the design and implementation of talent development roadmaps that are designed to help us organically build leaders for the future and develop clear succession plans. We plan to achieve this through the design androll-out of customized individual development plans, as well as specialized training programs run for groups of employees at similar stages of career development or in similar roles, which we call “clustered interventions.”
In order to keep pace with the ever-changing global business environment, we recognize that there is a strong need to focus on consolidating, building and sharing our domain knowledge. Hence, in fiscal 2015, we set up a virtual domain university for certain vertical business units such as finance and accounting, banking and financial services, travel, diversified businesses, and shipping and logistics. The university serves as repository for domain knowledge that is accessible virtually by our employees. The university was established to assist us in retaining and building our domain knowledge for our business units, and we intend to continue to expand its offerings to cover each of our business units. It is expected to benefit us as well as our clients in the long run. In the past fiscal year, we have collaborated with Lynda.com (a LinkedIn company), a leading provider of learning solutions, to provide our employees the opportunity of self-paced learning. We have also introduced video-based learning that uses videos provided by Lynda.com for employees, which can be accessed through their mobile phones.
Other Development Initiatives
Diversity and inclusion — As we increase our global presence, we believe it is important to grow and foster an inclusive and diverse business environment, and therefore we seek to equip our managers with the skills required to collaborate, manage and lead in a diverse global environment. Our learning and development team is proactively designing training materials related to diversity and cross-cultural understanding in order to groom successful managers who have a global mindset and the necessary soft skills to function effectively in a diverse environment. We believe that skills such as good communication and cultural adaptability and understanding are essential in the workplace. Therefore, we aim to instill in our global managers an awareness of, and an appreciation for, the differences among the cultures with which they do business and to provide them the techniques and support they need to succeed.
76
Representatives of the learning and development team are also involved in feasibility studies for potential new locations from a talent availability point of view. To improve our reach, we are increasingly deploying blended learning solutions via video-based ande-learning to reach our managers globally. We have also collaborated with an externale-learning provider to assist in providing appropriate and relevant online training materials while keeping in mind our organizational goals. Our continued focus one-learning has helped us in reducing costs associated with training as the costs associated with online products on a per person, per hour basis, are significantly less than the costs associated with training in the physical classroom. We were recognized in 2013 as the “Global L&D Team of the Year” at the 5thTISS Leap Vault CLO Summit India and we received the Corporate UniversityBest-in-Class (or CUBIC™) Award. We were also the recipient of the Golden Peacock National Training Award- 2016 in fiscal 2016.
Front line capability building — As an individual advances within an organization, it is important that he or she adds the qualifications and skills required to perform the role and responsibilities to which he or she is assigned. Our Learning Academy focuses on providing new managers the necessary tools to successfully make the transition from employee to business leader. In doing so, our Learning Academy trains new managers on the technical and leadership skills necessary to manage people, understand key drivers of financial performance, provide good customer service and follow our business and shared best practices.
Top Talent development initiatives—We focus on employees identified as top talent via our “WNS performance management system” by building their capability to be future leaders in our company. These initiatives include:
| | • | | focusing on leadership pipeline development through programs to develop future-ready leaders in our company; |
| | • | | investing in top talent individuals identified as “best bets”; and |
| | • | | providing a support system and learning mechanism to enable the individual to understand, improve and reinvent oneself. |
Regulations
Due to the industry and geographic diversity of our operations and services, our operations are subject to a variety of rules and regulations, and several federal and state agencies in Australia, China, Costa Rica, France, Germany, India, Mauritius, the Netherlands, the Philippines, Poland, Romania, Singapore, South Africa, Sri Lanka, Switzerland, United Arab Emirates, the UK and the US that regulate various aspects of our business. See “Part I — Item 3. Key Information — D. Risk Factors — Risks Related to our Business — Our global operations expose us to numerous and sometimes conflicting legal and regulatory requirements. Failure to adhere to the laws and regulations that govern our business or our clients’ businesses that we are required to comply with in performing our services could harm our business.” We have benefitted from, and continue to benefit from, certain tax holidays and exemptions in various jurisdictions in which we have operations.
In fiscal 2017, 2016 and 2015, our tax rate in India, the Philippines and Sri Lanka impacted our effective tax rate. We would have incurred approximately $5.2 million, $5.0 million and $3.0 million in additional income tax expense on our combined operations in our SEZ operations in India, the Philippines and Sri Lanka for fiscal 2017, 2016 and 2015, respectively, if the tax holidays or exemptions as described below had not been available for the respective periods.
We expect our tax rate in India, the Philippines and Sri Lanka to continue to impact our effective tax rate. Our tax rate in India has been impacted by the reduction in the tax exemption enjoyed by our delivery center operating under the SEZ scheme, as more fully described below.
India
In the past, the majority of our India operations were eligible to claim income tax exemption with respect to profits earned from export revenue from operating units registered under the STPI. The benefit was available for a period of 10 years from the date of commencement of operations, but not beyond March 31, 2011. Effective April 1, 2011, upon the expiration of this tax exemption, income derived from our operations in India became subject to the prevailing annual tax rate, which is currently, and was in fiscal 2017 and 2016, 34.61%, and was 33.99% in fiscal 2015.
In 2005, the Government of India implemented the SEZ legislation, with the effect that taxable income of new operations established in designated SEZs may be eligible for a15-year tax holiday scheme consisting of a complete tax holiday for the initial five years and a partial tax holiday for the subsequent ten years, subject to the satisfaction of certain capital investment conditions. Our delivery center located in Gurgaon, India and registered under the SEZ scheme is eligible for a 50.0% income tax exemption from fiscal 2013 to fiscal 2022. During fiscal 2012, we also started operations in delivery centers in Pune, Mumbai and Chennai, India registered under the SEZ scheme, which were, prior to fiscal 2017, eligible for a complete tax holiday but commencing fiscal 2017 to fiscal 2026 are eligible for only a 50.0% income tax exemption. During fiscal 2015, we commenced operations at our new delivery centers in Gurgaon and Pune in India which were registered under the SEZ scheme and are eligible for a 100.0% income tax exemption until fiscal 2019, and a 50.0% income tax exemption from fiscal 2020 to fiscal 2029.
77
The SEZ legislation has been criticized on economic grounds by the International Monetary Fund and the SEZ legislation may be challenged by certainnon-governmental organizations. It is possible that, as a result of such political pressures, the procedure for obtaining benefits under the SEZ legislation may become more onerous, the types of land eligible for SEZ status may be further restricted or the SEZ legislation may be amended or repealed.
In addition to these tax holidays, our Indian subsidiaries are also entitled to certain benefits under relevant state legislation and regulations. These benefits include the preferential allotment of land in industrial areas developed by state agencies, incentives for captive power generation, rebates and waivers in relation to payments for transfer of property and registration (including for purchase or lease of premises) and commercial usage of electricity.
Since fiscal 2008, we have become subject to minimum alternate tax (“MAT”) and we have been required to pay additional taxes. The Government of India, pursuant to the Indian Finance Act, 2011, has also levied MAT on the book profits earned by the SEZ units at the prevailing tax rate, which is currently, and was in fiscal 2017 and 2016, 21.34%, and was 20.96% in fiscal 2015. To the extent MAT paid exceeds the actual tax payable on our taxable income, we would be able to offset such MAT credits from tax payable in the succeeding ten years, subject to the satisfaction of certain conditions. During fiscal 2017, 2016 and 2015, we have offset Nil, $9.2 million and $6.4 million, respectively, of our MAT payments for earlier years from our increased tax liability based on our taxable income following the expiry of our tax holiday on STPI effective fiscal 2012.
The Government of India may enact new tax legislation that could impact the way we are taxed in the future. For example, the Government of India has clarified that, with retrospective effect from April 1, 1962, any income accruing or arising directly or indirectly through the transfer of capital assets situated in India will be taxable in India. If any of our transactions are deemed to involve the direct or indirect transfer of a capital asset located in India, such transactions could be investigated by the Indian tax authorities, which could lead to the issuance of tax assessment orders and a material increase in our tax liability. For example, we received requests for information from, and are in discussions with, the relevant income tax authority in India relating to our acquisition in July 2008 from Aviva of all the shares of Aviva Global, which owned subsidiaries with assets in India and Sri Lanka. The Government of India has issued guidelines on the GAAR, which came into effect on April 1, 2017, and which is intended to curb sophisticated tax avoidance. Under the GAAR, a business arrangement will be deemed an “impermissible avoidance arrangement” if the main purpose of the arrangement is to obtain tax benefits. Although the full implications of the GAAR are presently still unclear, if we are deemed to have violated any of its provisions, we may face an increase to our tax liability. However, we do not expect any adverse impact on account of the GAAR. The Government of India has passed the Goods and Service Tax Act (“GST Act”), which is expected to be effective from July 1, 2017. Once effective, the majority of the various existing indirect tax levies would be subsumed by the goods and services tax payable under the GST Act. Based on the current GST law and the draft rules, we do not expect a significant impact on our operations. See “Part I — Item 3. Key Information — D. Risk Factors — Risks Related to Key Delivery Locations — New tax legislation and the results of actions by taxing authorities may have an adverse effect on our operations and our overall tax rate.”
Philippines
Our subsidiary in the Philippines, WNS Global Services Philippines Inc., located in Eastwood Avenue, Manila, was eligible to claim income tax exemption with respect to profits earned from export revenue by our delivery centers registered with the Philippines Economic Zone Authority, which expired in fiscal 2016. During fiscal 2013, we started operations in a delivery center in Techno Plaza II, Manila which was eligible for a tax exemption that expired in fiscal 2017. We intend to apply this year for an extension of this tax exemption until fiscal 2018. During fiscal 2016, we started operations in a delivery center in Iloilo, Manila which is also eligible for a tax exemption that will expire in fiscal 2020. During fiscal 2017, we started operations in additional delivery centers in Iloilo, Manila and Alabang, Philippines which are also eligible for tax exemption that will expire in fiscal 2021. Following the expiry of the tax exemption, income generated by WNS Global Services Philippines Inc. will be taxed at the prevailing special tax rate, which is currently 5.0% on gross margin.
Sri Lanka
Our operations in Sri Lanka are eligible to claim tax exemption under the Sri Lanka Inland Revenue Act for profits earned from export revenue.
Costa Rica
Our subsidiary in Costa Rica is eligible for a 100.0% income tax exemption from fiscal 2010 until fiscal 2017 and a 50.0% income tax exemption from fiscal 2018 to fiscal 2021.
78
See “Part I — Item 5. Operating and Financial Review and Prospects — Critical Accounting Policies — Income Taxes.”
Enforcement of Civil Liabilities
We are incorporated in Jersey, Channel Islands. Most of our directors and executive officers reside outside of the US. Substantially all of the assets of these persons and substantially all of our assets are located outside the US. As a result, it may not be possible for investors to effect service of process on these persons or us within the US, or to enforce against these persons or us, either inside or outside the US, a judgment obtained in a US court predicated upon the civil liability provisions of the federal securities or other laws of the US or any state thereof. A judgment of a US court is not directly enforceable in Jersey, but constitutes a cause of action which will be enforced by Jersey courts provided that:
| | • | | the court which pronounced the judgment has jurisdiction to entertain the case according to the principles recognized by Jersey law with reference to the jurisdiction of the US courts; |
| | • | | the judgment is given on the merits and is final and conclusive — it cannot be altered by the courts which pronounced it; |
| | • | | there is payable pursuant to the judgment a sum of money, not being a sum payable in respect of tax or other charges of a like nature or in respect of a fine or other penalty; |
| | • | | the courts of the US have jurisdiction in the circumstances of the case; |
| | • | | the judgment can be enforced by execution in the jurisdiction in which the judgment is given; |
| | • | | the person against whom the judgment is given does not benefit from immunity under the principles of public international law; |
| | • | | there is no earlier judgment in another court between the same parties on the same issues as are dealt with in the judgment to be enforced; |
| | • | | the judgment was not obtained by fraud, duress and was not based on a clear mistake of fact; and |
| | • | | the recognition and enforcement of the judgment is not contrary to public policy in Jersey, including observance of the principles of natural justice which require that documents in the US proceeding were properly served on the defendant and that the defendant was given the right to be heard and represented by counsel in a free and fair trial before an impartial tribunal. |
It is the policy of Jersey courts to award compensation for the loss or damage actually sustained by the person to whom the compensation is awarded. Although the award of punitive damages is generally unknown to the Jersey legal system, there is no prohibition on them either by statute or by customary law. Whether a judgment is contrary to public policy depends on the facts of each case. Exorbitant, unconscionable, or excessive awards will generally be contrary to public policy. Moreover, if a US court gives a judgment for multiple damages against a qualifying defendant, the Protection of Trading Interests Act 1980, an Act of the UK extended to Jersey by the Protection of Trading Interests Act 1980 (Jersey) Order 1983 (“the Order”), provides that such judgment would not be enforceable in Jersey and the amount which may be payable by such defendant may be limited. The Order provides, among others, that such qualifying defendant may be able to recover such amount paid by it as represents the excess of such multiple damages over the sum assessed as compensation by the court that gave the judgment. A “qualifying defendant” for these purposes is a citizen of the UK and Colonies, a body corporate incorporated in the UK, Jersey or other territory for whose international relations the UK is responsible or a person carrying on business in Jersey.
79
Jersey courts cannot enter into the merits of the foreign judgment and cannot act as a court of appeal or review over the foreign courts. It is doubtful whether an original action based on US federal securities laws can be brought before Jersey courts. A plaintiff who is not resident in Jersey may be required to provide security for costs in the event of proceedings being initiated in Jersey. There is uncertainty as to whether the courts of Jersey would:
| | • | | recognize or enforce judgments of US courts obtained against us or our directors or officers predicated upon the civil liability provisions of the securities laws of the US or any state in the US; or |
| | • | | entertain original actions brought in each respective jurisdiction against us or our directors or officers predicated upon the federal securities laws of the US or any state in the US. |
In India, recognition and enforcement of foreign judgments is provided for under Section 13 and Section 44A of the Code of Civil Procedure, 1908 (India) (the “Civil Code”), as amended. Section 44A of the Civil Code provides that where a foreign judgment has been rendered by a superior court in any country or territory outside India which the Indian government has by notification declared to be a reciprocating territory, such foreign judgment may be enforced in India by proceedings in execution as if the judgment had been rendered by a competent court in India. However, Section 44A of the Civil Code is applicable only to monetary decrees not being in the nature of amounts payable in respect of taxes or other charges of a similar nature or in respect of fines or other penalties and does not include arbitration awards. The US has not been declared by the Indian government to be a reciprocating territory for the purposes of Section 44A of the Civil Code. Accordingly, a judgment of a foreign court, which is not a court in a reciprocating territory, may be enforced in India only by a fresh suit instituted in a court of India and not by proceedings in execution. Furthermore, the execution of the foreign decree under Section 44A of the Civil Code is also subject to the exception under Section 13 of the Civil Code, as discussed below.
Section 13 of the Civil Code, states that a foreign judgment is conclusive as to any matter directly adjudicated upon except:
| | • | | where the judgment has not been pronounced by a court of competent jurisdiction; |
| | • | | where the judgment has not been given on the merits of the case; |
| | • | | where it appears on the face of the proceedings that the judgment is founded on an incorrect view of international law or a refusal to recognize the law of India in cases where such law is applicable; |
| | • | | where the proceedings in which the judgment was obtained were opposed to natural justice; |
| | • | | where the judgment has been obtained by fraud; or |
| | • | | where the judgment sustains a claim founded on a breach of any law in force in India. |
The suit must be brought in India within three years from the date of the judgment in the same manner as any other suit filed to enforce a civil liability in India. It is unlikely that a court in India would award damages on the same basis as a foreign court if an action is brought in India. Furthermore, it is unlikely that an Indian court would enforce foreign judgments if it viewed the amount of damages awarded as excessive or inconsistent with public policy in India. A party seeking to enforce a foreign judgment in India is required to obtain prior approval from the Reserve Bank of India under the Indian Foreign Exchange Management Act, 1999, to repatriate any amount recovered pursuant to such execution and such amount may be subject to tax in accordance with applicable laws. Any judgment in a foreign currency would be converted into Indian rupees on the date of judgment and not on the date of payment. We cannot predict whether a suit brought in a court in India will be disposed of in a timely manner.
80
C. Organizational Structure
The following diagram illustrates our company’s organizational structure and the place of organization of each of our subsidiaries as of the date hereof. Unless otherwise indicated, each of our subsidiaries is wholly owned, directly or indirectly, by WNS (Holdings) Limited.
Notes:
| (1) | All the shares except one share of WNS Business Consulting Services Private Limited are held by WNS North America Inc. The remaining one share is held by a nominee shareholder on behalf of WNS North America Inc. to satisfy the regulatory requirement to have a minimum of two shareholders. |
| (2) | We acquired Denali Sourcing Services Inc. in January 2017. |
| (3) | WNS (Holdings) Limited has made a 99.99% capital contribution in WNS Global Services Netherlands Cooperatief U.A., (the“Co-op”). The remaining 0.01% capital contribution in theCo-op was made by WNS North America Inc. to satisfy the regulatory requirement to have a minimum of two members. |
| (4) | WNS Global Services Netherlands Cooperatief U.A (Ireland Branch) was formed on December 13, 2016 and is a branch of WNS Global Services Netherlands Cooperatief U.A. |
| (5) | WNS Global Services Netherlands Cooperatief U.A. Merkezi Hollanda Istanbul Merkez Subesi (Turkey Branch) was formed on December 30, 2016 and is a branch of WNS Global Services Netherlands Cooperatief U.A. |
| (6) | We acquired MTS HealthHelp Inc. and its subsidiaries (HealthHelp Holdings LLC and HealthHelp LLC) in March 2017. |
| (7) | We acquired Value Edge Research Services Private Limited and its wholly owned subsidiaries, Value Edge Inc., Value Edge AG and VE Value Edge GmbH in June 2016. |
| (8) | WNS Cares Foundation is a “not for profit organization” registered under the former Section 25 of the Indian Companies Act, 1956 (which has become Section 8 of the Indian Companies Act, 2013), formed for the purpose of promoting corporate social responsibilities. As a result, it is not considered for the purpose of preparing our consolidated financial statements. |
| (9) | WNS Global Services (Dalian) Co. Ltd Shanghai Branch was formed in March 2017 and is a branch of WNS Global Services (Dalian) Co. Ltd. |
| (10) | The WNSB-BBEE Staff Share Trust was registered on April 26, 2017 with the principal object of creating meaningful participation of our Black employees in the growth of our company. |
| (11) | Ucademy (Pty) Limited, a wholly owned subsidiary of WNS Global Services SA (Pty) Limited, was incorporated on June 20, 2016. |
81
D. Property, Plants and Equipment
As at March 31, 2017, we have an installed capacity of 28,008 production workstations, or seats, that can operate on an uninterrupted 24/7 basis and can be staffed on a three-shift per day basis. The majority of our properties are leased by us, as described in the table below, and most of our leases are renewable at our option. The following table describes each of our delivery centers and sales offices, including centers under construction, and sets forth our lease expiration dates.
| | | | | | | | | | | | |
| Location | | Total Space
(square feet) | | Total number of
work stations | | Lease Expiration Date | | | Extendable Until(1) | |
India: | | | | | | | | | | | | |
Mumbai | | 364,835 | | 3,093 | | | | | | | | |
Godrej Plant 10 | | | | | | | February 15, 2021 | | | | February 15, 2023 | |
Godrej Plant 11 | | | | | | | February 15, 2021 | | | | February 15, 2023 | |
Godrej Plant 5 | | | | | | | February 15, 2021 | | | | February 15, 2023 | |
Raheja (SEZ), Airoli | | | | | | | May 31, 2019 | | | | N/A | |
Rupa Solitaire-Unit 316 | | | | | | | May 31, 2020 | | | | May 31, 2025 | |
Gurgaon | | 292,131 | | 3,042 | | | | | | | | |
DLF (SEZ) | | | | | | | September 15, 2017 | | | | N/A | |
World Tech park Block- B2 9th Floor | | | | | | | May 14, 2022 | | | | May 15, 2027 | |
World Tech park Block-B3 9th Floor | | | | | | | May 14, 2022 | | | | May 15, 2027 | |
World TechPark-8th, 9th, 10th & part 11th Floor | | | | | | | April 27, 2019 | | | | April 27, 2024 | |
World Tech Park- Remaining part of 11th Floor | | | | | | | November 2, 2019 | | | | April 27, 2024 | |
World Tech Park- Block A3, 11th floor | | | | | | | September 19, 2020 | | | | September 19, 2024 | |
Pune | | 611,646 | | 7,170 | | | | | | | | |
Magarpatta | | | | | | | N/A | | | | N/A | |
Weikfield—Phase I | | | | | | | February 14, 2018 | | | | February 14, 2022 | |
Weikfield—Phase II | | | | | | | April 30, 2018 | | | | April 30, 2022 | |
Weikfield—Phase III | | | | | | | June 14, 2018 | | | | June 14, 2022 | |
Mantri Estate | | | | | | | May 27, 2020 | | | | N/A | |
Magarpatta (SEZ) – Level 5 | | | | | | | February 14, 2026 | | | | N/A | |
Magarpatta (SEZ) – Level 6 | | | | | | | October 26, 2026 | | | | N/A | |
Magarpatta (SEZ) – Level 7 | | | | | | | February 28, 2027 | | | | N/A | |
Giga Space | | | | | | | January 17, 2021 | | | | N/A | |
Nasik | | 74,620 | | 990 | | | | | | | | |
Shreeniketan | | | | | | | June 30, 2018 | | | | N/A | |
Vascon | | | | | | | October 13, 2018 | | | | N/A | |
Bangalore | | 156,432 | | 1,473 | | | | | | | | |
RMZ Centennial – Ground Floor & Level 1 | | | | | | | June 14, 2018 | | | | June 14, 2025 | |
RMZ Centennial – Level 2 & 3 | | | | | | | October 31, 2018 | | | | October 31, 2025 | |
RMZ Centennial – Terrace | | | | | | | July 31, 2018 | | | | July 31, 2025 | |
Chennai | | 110,792 | | 914 | | | | | | | | |
RMZ Millenia | | | | | | | March 31, 2018 | | | | March 31, 2045 | |
DLF (SEZ)—Phase 1 | | | | | | | March 31, 2021 | | | | March 31, 2026 | |
DLF (SEZ)—Phase 2 | | | | | | | March 31, 2021 | | | | N/A | |
Vishakhapatnam | | 37,050 | | 574 | | | | | | | | |
MPS Plaza | | | | | | | March 4, 2022 | | | | March 4, 2027 | |
Tiruchirappalli | | 217,800 | | N/A | | | November 15, 2111 | | | | November 15, 2210 | |
Plot of land(2) | | | | | | | | | | | | |
Noida | | 18,950 | | 153 | | | | | | | | |
C-125 A | | | | | | | December 31, 2018 | | | | N/A | |
C-120 | | | | | | | March 31, 2018 | | | | N/A | |
Sadhana Enclave | | | | | | | July 31, 2017 | | | | N/A | |
| | | | | | | | | | | | |
82
| | | | | | | | | | | | |
Sri Lanka: | | 59,249 | | 871 | | | | | | | | |
Colombo (HNB) – Level 15 | | | | | | | July 31, 2018 | | | | N/A | |
Colombo (Orion City) – Level 12&13 | | | | | | | May 31, 2018 | | | | N/A | |
UK: | | 29,530 | | 511 | | | | | | | | |
Ipswich (Museum Street) | | | | | | | May 23, 2028 | | | | N/A | |
Cheadle (Hercules Office Park) | | | | | | | July 21, 2020 | | | | N/A | |
Piccadilly (Malta House) | | | | | | | February 10, 2027 | | | | N/A | |
Mansfield (Oakham Business Park)(3) | | | | | | | February 14, 2016 | | | | N/A | |
Hayes (Hyde Park) | | | | | | | February 28, 2021 | | | | N/A | |
US: | | 149,845 | | 944 | | | | | | | | |
NJ (Exchange Place) | | | | | | | July 30, 2019 | | | | July 30, 2024 | |
SC (The State Building) | | | | | | | July 31, 2020 | | | | April 19, 2023 | |
Pennsylvania (Hanover Street) | | | | | | | June 23, 2020 | | | | June 23, 2025 | |
Bellevue (Cascade Building) | | | | | | | October 31, 2019 | | | | N/A | |
Pittsburg (One Waterfront Place) | | | | | | | January 31, 2022 | | | | N/A | |
NY (East Greenbush) | | | | | | | February 28, 2019 | | | | N/A | |
Houston (Corporate Drive) | | | | | | | December 31, 2020 | | | | N/A | |
Houston (Northchase Drive) | | | | | | | March 31, 2026 | | | | N/A | |
Turkey: | | N/A | | 12 | | | | | | | | |
Istanbul (MeydanK Plaza) | | | | | | | March 31, 2018 | | | | N/A | |
Switzerland: | | 2,077 | | — | | | | | | | | |
Zurich (Bahnhofstrasse) | | | | | |
| Can be terminated
with three months
notice |
| | | N/A | |
Romania: | | 53,201 | | 520 | | | | | | | | |
Bucharest (West Gate) – 2nd & 3rd Floor | | | | | | | February 25, 2023 | | | | February 25, 2026 | |
Constanta (Euro Construct) | | | | | | | January 15, 2022 | | | | N/A | |
Philippines: | | 282,886 | | 2,526 | | | | | | | | |
Manila | | | | | | | | | | | | |
Eastwood—Basement 3 Parking | | | | | | | November 30, 2021 | | | | N/A | |
Eastwood—Basement 4 Parking | | | | | | | June 4, 2021 | | | | N/A | |
Eastwood—10th floor | | | | | | | June 30, 2021 | | | | N/A | |
Eastwood—9th floor | | | | | | | June 30, 2021 | | | | June 30, 2031 | |
Techno Plaza II | | | | | | | April 30, 2019 | | | | April 30, 2024 | |
Ilo Ilo | | | | | | | | | | | | |
One Global Centre | | | | | | | January 15, 2021 | | | | N/A | |
Three Techno Place – 4th Floor | | | | | | | March 15, 2022 | | | | N/A | |
Alabang | | | | | | | | | | | | |
Vector 2 | | | | | | | February 28, 2022 | | | | N/A | |
Capella | | | | | | | June 30, 2022 | | | | N/A | |
Costa Rica: | | 12,592 | | 205 | | | | | | | | |
San Jose (Forum H) | | | | | | | April 30, 2021 | | | | N/A | |
United Arab Emirates: | | 510 | | N/A | | | | | | | | |
Dubai Airport Free Trade Zone | | | | | | | November 27, 2017 | | | | N/A | |
South Africa: | | 355,361 | | 4,504 | | | | | | | | |
Cape Town | | | | | | | | | | | | |
Knowledge Park | | | | | | | March 31, 2019 | | | | N/A | |
Ambition House – 4th Floor | | | | | | | September 30, 2017 | | | | September 30, 2018 | |
Ambition House – 3rd Floor | | | | | | | June 30, 2018 | | | | June 30, 2019 | |
Claremont – Level 4 | | | | | | | June 30, 2018 | | | | June 30, 2022 | |
Claremont – Level 5 | | | | | | | June 30, 2018 | | | | June 30, 2022 | |
Johannesburg | | | | | | | | | | | | |
Commissioners Street | | | | | | | September 30, 2017 | | | | May 31, 2019 | |
DownSouth Ridge Park | | | | | | | August 31, 2021 | | | | N/A | |
Port Elizabeth (COEGA) | | | | | | | July 31, 2020 | | | | July 31, 2025 | |
Durban | | | | | | | | | | | | |
Hippopark Avenue - Section #1 & 2 | | | | | | | May 30, 2020 | | | | N/A | |
Grid Eye | | | | | | | June 30, 2021 | | | | N/A | |
| | | | | | | | | | | | |
83
| | | | | | | | | | | | |
Poland: | | 19,498 | | 215 | | | | | | | | |
Gdynia (Luzycka Office Park) – Bldg C & D | | | | | | | April 1, 2018 | | | | April 1, 2023 | |
China: | | 31,708 | | 290 | | | | | | | | |
Guangzhou (Zhongshan Street) – 30th Floor | | | | | | | April 30, 2019 | | | | N/A | |
Dalian (Dalian Software Park) – Bldg 22 | | | | | | | May 15, 2020 | | | | N/A | |
Beijing (YongAnDongLi) – 5th Floor | | | | | | | April 30, 2019 | | | | N/A | |
Shanghai (Huang PL) | | | | | | | April 30, 2019 | | | | N/A | |
Australia: | | 646 | | N/A | | | | | | | | |
Sydney (Lavender Street) | | | �� | | | | February 28, 2018 | | | | N/A | |
| | | | | | | | | | | | |
Notes:
N/A means not applicable.
| (1) | Reflects the expiration date if the applicable extension option is exercised. |
| (2) | This is a SEZ plot in the ELCOT Navalpattu IT/ITES SEZ Park. |
| (3) | The lease agreement for the premises expired on February 14, 2016. The current arrangement will continue to apply until, either we vacate the premises or a new lease is granted or signed. All other terms of the lease remain the same under this arrangement. |
Our delivery centers are equipped with fiber optic connectivity and have backups to their power supply designed to achieve uninterrupted operations. In fiscal 2018, we intend to establish additional delivery centers, as well as continue to streamline our operations by further consolidating production capacities in our delivery centers.
ITEM 4A. UNRESOLVED STAFF COMMENTS
None.
84
ITEM 5. OPERATING AND FINANCIAL REVIEW AND PROSPECTS
The following discussion on the financial condition and results of operations of our company should be read in conjunction with our consolidated financial statements and the related notes included elsewhere in this annual report. Some of the statements in the following discussion contain forward-looking statements that involve risks and uncertainties. See “Special Note Regarding Forward-Looking Statements.” Our actual results could differ materially from those anticipated in these forward-looking statements as a result of a number of factors, including, but not limited to, those described below and elsewhere in this annual report, particularly in the risk factors described in “Part I — Item 3 Key Information — D. Risk Factors.”
Overview
We are a leading global provider of BPM services, offering comprehensive data, voice, analytical and business transformation services with a blended onshore, near shore and offshore delivery model. We transfer the business processes of our clients to our delivery centers, located in China, Costa Rica, India, the Philippines, Poland, Romania, South Africa, Sri Lanka, Turkey, the UK, and the US, with a view to offer cost savings, operational flexibility, improved quality and actionable insights to our clients. We seek to help our clients “transform” their businesses by identifying business and process optimization opportunities through technology-enabled solutions, process design improvements, analytics and improved business understanding.
We win outsourcing engagements from our clients based on our domain knowledge of their business, our experience in managing the specific processes they seek to outsource and our customer-centric approach. Our company is organized into vertical business units in order to provide more specialized focus on each of the industries that we target, to more effectively manage our sales and marketing process and to developin-depth domain knowledge. The major industry verticals we currently target are the insurance; travel and leisure; diversified businesses including manufacturing, retail, CPG, media and entertainment, and telecom; utilities; consulting and professional services; healthcare; banking and financial services; and shipping and logistics industries.
Our portfolio of services includes vertical-specific processes that are tailored to address our clients’ specific business and industry practices. In addition, we offer a set of shared services that are common across multiple industries, including customer interaction services, finance and accounting, research and analytics, technology services, legal services, and human resources outsourcing.
Although we typically enter into long-term contractual arrangements with our clients, these contracts can usually be terminated with or without cause by our clients and often with short notice periods. Nevertheless, our client relationships tend to be long-term in nature given the scale and complexity of the services we provide coupled with risks and costs associated with switching processesin-house or to other service providers. We structure each contract to meet our clients’ specific business requirements and our target rate of return over the life of the contract. In addition, since the sales cycle for offshore business process management is long and complex, it is often difficult to predict the timing of new client engagements. As a result, we may experience fluctuations in growth rates and profitability from quarter to quarter, depending on the timing and nature of new contracts. Our operating results may also differ significantly from quarter to quarter due to seasonal changes in the operations of our clients. For example, our clients in the travel and leisure industry typically experience seasonal changes in their operations in connection with the US summer holiday season, as well as episodic factors such as adverse weather conditions. Our focus, however, is on deepening our client relationships and maximizing shareholder value over the life of a client’s relationship with us.
The following table represents our revenue (a GAAP financial measure) for the periods indicated:
| | | | | | | | | | | | |
| | | Year ended March 31, | |
| | | 2017 | | | 2016 | | | 2015 | |
| | | (US dollars in millions) | |
Revenue | | $ | 602.5 | | | $ | 562.2 | | | $ | 533.9 | |
Our revenue is generated primarily from providing business process management services. We have two reportable segments for financial statement reporting purposes — WNS Global BPM and WNS Auto Claims BPM. In our WNS Auto Claims BPM segment, we provide both “fault” and“non-fault” repairs. For “fault” repairs, we provide claims handling and repair management services, where we arrange for automobile repairs through a network of third party repair centers. In our repair management services, where we act as the principal in our dealings with the third party repair centers and our clients, the amounts which we invoice to our clients for payments made by us to third party repair centers are reported as revenue. Where we are not the principal in providing the services, we record revenue from repair services net of repair cost. See Note 2.s of the consolidated financial statements included elsewhere in this annual report. Since we wholly subcontract the repairs to the repair centers, we evaluate the financial performance of our “fault” repair business based on revenue less repair payments to third party repair centers, which is anon-GAAP financial measure. We believe that revenue less repair payments (anon-GAAP financial measure) for “fault” repairs reflects more accurately the value addition of the business process management services that we directly provide to our clients. Management believes that revenue less repair payments(non-GAAP) may be useful to investors as a more accurate reflection of our performance and operational results.
85
For our“non-fault” repairs business, we generally provide a consolidated suite of accident management services including credit hire and credit repair, and we believe that measurement of such business on a basis that includes repair payments in revenue is appropriate. Revenue including repair payments is therefore used as a primary measure to allocate resources and measure operating performance for accident management services provided in our“non-fault” repairs business. Our“non-fault” repairs business where we provide accident management services accounts for a relatively small portion of our revenue for our WNS Auto Claims BPM segment. In our WNS Auto Claims BPM segment, effective July 1, 2015, WNS Legal Assistance LLP, a subsidiary of WNS Assistance Limited, received an approval from Solicitors Regulatory Authority, UK to provide legal services in relation to personal injury claims.
Revenue less repair payments is anon-GAAP financial measure which is calculated as (a) revenue less (b) in our auto claims business, payments to repair centers for “fault” repair cases where we act as the principal in our dealings with the third party repair centers and our clients. Thisnon-GAAP financial information is not meant to be considered in isolation or as a substitute for our financial results prepared in accordance with GAAP. Our revenue less repair payments(non-GAAP) may not be comparable to similarly titled measures reported by other companies due to potential differences in the method of calculation.
The following table reconciles our revenue (a GAAP financial measure) to revenue less repair payments (anon-GAAP financial measure) for the periods indicated:
| | | | | | | | | | | | |
| | | Year ended March 31, | |
| | | 2017 | | | 2016 | | | 2015 | |
| | | (US dollars in millions) | |
Revenue | | $ | 602.5 | | | $ | 562.2 | | | $ | 533.9 | |
Less: Payments to repair centers(1) | | | 24.1 | | | | 31.2 | | | | 30.9 | |
| | | | | | | | | | | | |
Revenue less repair payments(non-GAAP) | | $ | 578.4 | | | $ | 531.0 | | | $ | 503.0 | |
| | | | | | | | | | | | |
Note:
| (1) | Consists of payments to repair centers in our auto claims business for “fault” repair cases where we act as the principal in our dealings with the third party repair centers and our clients. |
The following table sets forth our constant currency revenue less repair payments (anon-GAAP financial measure) for the periods indicated. Constant currency revenue less repair payments is anon-GAAP financial measure. We present constant currency revenue less repair payments(non-GAAP) so that revenue less repair payments(non-GAAP) may be viewed without the impact of foreign currency exchange rate fluctuations, thereby facilitatingperiod-to-period comparisons of business performance. Constant currency revenue less repair payments(non-GAAP) is presented by recalculating prior period’s revenue less repair payments(non-GAAP) denominated in currencies other than in US dollars using the foreign exchange rate used for the latest period, without taking into account the impact of hedging gains/losses. Ournon-US dollar denominated revenue includes, but is not limited to, revenue denominated in pound sterling, Australian dollars, South African rand and euros. Management believes constant currency revenue less repair payments(non-GAAP) may be useful to investors in evaluating the underlying operating performance of our company. Thisnon-GAAP financial information is not meant to be considered in isolation or as a substitute for our financial results prepared in accordance with GAAP. Our constant currency revenue less repair payments(non-GAAP) may not be comparable to similarly titled measures reported by other companies due to potential differences in the method of calculation.
| | | | | | | | | | | | |
| | | Year ended March 31, | |
| | | 2017 | | | 2016 | | | 2015 | |
| | | (US dollars in millions) | |
Revenue less repair payments(non-GAAP) | | | 578.4 | | | | 531.0 | | | | 503.0 | |
Exchange rate impact | | | (6.8 | ) | | | (37.5 | ) | | | (60.8 | ) |
| | | | | | | | | | | | |
Constant currency revenue less repair payments(non-GAAP) | | $ | 571.6 | | | $ | 493.5 | | | $ | 442.2 | |
86
Global Economic Conditions
Global economic conditions continue to show signs of turbulence. Although some key indicators of sustainable economic growth show signs of improvement, volatility in the domestic politics of major markets may lead to changes in the institutional framework of the international economy. In June 2016, a majority of voters in the United Kingdom elected to withdraw from the European Union in a national referendum. The referendum was advisory, and the terms of any withdrawal are subject to a negotiation period that could last at least two years after the government of the United Kingdom formally initiated a withdrawal process on March 29, 2017, putting the United Kingdom on track to leave the European Union by April 2019. The referendum has created significant uncertainty about the future relationship between the United Kingdom and the European Union, including with respect to the laws and regulations that will apply as the United Kingdom determines which European Union-derived laws to replace or replicate in the event of a withdrawal. The referendum has also given rise to calls for the governments of other European Union member states to consider withdrawal. These developments, or the perception that any of them could occur, have had and may continue to have a material adverse effect on global economic conditions and the stability of global financial markets, and may significantly reduce global market liquidity and restrict the ability of key market participants to operate in certain financial markets. Any of these factors could depress economic activity and restrict our access to capital, which could have a material adverse effect on our business, financial condition and results of operations. China continues to have room for economic growth, but such growth opportunities remain subject to political developments and uncertainties in the regulatory framework of the economy. In the US, economic growth is tempered by continuing concerns over the failure to achieve a long term solution to the issues of government spending, the increasing US national debt, and their negative impact on the US economy as well as concerns over potential increases in cost of borrowing and reduction in availability of credit as the US Federal Reserve begins raising interest rates. The policies that may be pursued by the presidential administration in the US (such as the border adjustment tax under consideration) have added further uncertainty to the global economy, and the prevailing political climate may lead to more protectionist policies. Globally, countries may require additional financial support, sovereign credit ratings may continue to decline, and there may be defaults on sovereign debt obligations of certain countries. Any of these may increase the cost of borrowing and cause credit to become more limited. Further, there continue to be signs of economic weakness, such as relatively high levels of unemployment, in major markets including Europe. Continuing conflicts and instability in various regions around the world may lead to additional acts of terrorism and armed conflict around the world. The ongoing refugee crisis in Europe, North Africa and the Middle East may contribute to political and economic instability in those regions. A resurgence of isolationist and/or protectionist policies in North America, Europe and Asia may curtail global economic growth.
These economic conditions may affect our business in a number of ways. The general level of economic activity, such as decreases in business and consumer spending, could result in a decrease in demand for our services, thus reducing our revenue. The cost and availability of credit has been and may continue to be adversely affected by illiquid credit markets and wider credit spreads. Continued turbulence or uncertainty in the European, US, Asian and international financial markets and economies may adversely affect our liquidity and financial condition, and the liquidity and financial condition of our customers. If these market conditions continue or worsen, they may limit our ability to access financing or increase our cost of financing to meet liquidity needs, and affect the ability of our customers to use credit to purchase our services or to make timely payments to us, resulting in adverse effects on our financial condition and results of operations.
Furthermore, a weakening of the rate of exchange for the pound sterling, the US dollar or, to a lesser extent, the Australian dollar or the South African rand (in which our revenue is principally denominated) against the Indian rupee, or to a lesser extent, the South African rand (in which a significant portion of our costs are denominated) would also adversely affect our results. Fluctuations between the pound sterling, the Indian rupee, the Australian dollar or the South African rand, on the one hand, and the US dollar, on the other hand, also expose us to translation risk when transactions denominated in these currencies are translated into US dollars, our reporting currency. The exchange rates between each of the pound sterling, the Indian rupee, the Australian dollar and South African rand, on the one hand, and the US dollar, on the other hand, have changed substantially in recent years and may fluctuate substantially in the future. For example, the pound sterling depreciated against the US dollar by an average of 13.4% in fiscal 2017, and by an average of 6.4% in fiscal 2016. On the other hand, in fiscal 2017 and 2016, the Indian rupee depreciated against the US dollar by an average of 2.6% and 7.1%, respectively, the South African rand depreciated against the US dollar by an average of 2.3% and 24.3%, respectively, and the Australian dollar appreciated against the US dollar by an average of 2.1% and depreciated against the US dollar by an average of 15.8%, respectively. The depreciation of the Indian rupee and the South African rand is fiscal 2017 and 2016, and the appreciation of the Australian dollar in fiscal 2017, against the US dollar positively impacted our results of operations in those years, whereas the depreciation of the pound sterling in fiscal 2017 and 2016 and the depreciation of the Australian dollar is fiscal 2016 against the US dollar negatively impacted our results of operations in those years.
Uncertainty about current global economic conditions could also continue to increase the volatility of our share price. We cannot predict the timing or duration of an economic slowdown or the timing or strength of a subsequent economic recovery generally or in our targeted industries, including the travel and leisure and insurance industries. If macroeconomic conditions worsen or current global economic conditions continue for a prolonged period of time, we are not able to predict the impact that such worsening conditions will have on our targeted industries in general, and our results of operations specifically.
87
Our History and Milestones
We began operations as anin-house unit of British Airways in 1996 and started focusing on providing business process management services to third parties in fiscal 2003. The following are the key milestones in our operating history since Warburg Pincus acquired a controlling stake in our company from British Airways in May 2002 and inducted a new senior management team:
| | • | | In fiscal 2003, we acquired Town and Country Assistance Limited (which we subsequently rebranded as WNS Assistance and which is part of WNS Auto Claims BPM, our reportable segment for financial statement purposes), aUK-based automobile claims handling company, thereby extending our service portfolio beyond the travel and leisure industry to include insurance-based automobile claims processing. |
| | • | | In fiscal 2003 and 2004, we invested in our infrastructure to expand our service portfolio from data-oriented processing to include complex voice and blended data/voice service capabilities, and commenced offering comprehensive processes in the travel and leisure, banking and financial services and insurance industries. |
| | • | | In fiscal 2004, we acquired the health claims management business of Greensnow Inc. |
| | • | | In fiscal 2005, we opened facilities in Gurgaon, India and Colombo, Sri Lanka, thereby expanding our operating footprints across India and Sri Lanka. |
| | • | | In fiscal 2006, we acquired Trinity Partners Inc. (which we subsequently merged into our subsidiary, WNS North America Inc.), a provider of business process management services to financial institutions, focusing on mortgage banking. |
| | • | | In fiscal 2007, we expanded our facilities in Gurgaon, Mumbai and Pune, India, and we also acquired the fare audit services business of PRG Airlines and the financial accounting business of GHS. |
| | • | | In May 2007, we acquired Marketics, a provider of offshore analytics services. |
| | • | | In June 2007, we acquired Flovate, a company engaged in the development and maintenance of software products and solutions, which we subsequently renamed as WNS Workflow Technologies Limited. |
| | • | | In July 2007, we completed the transfer of our delivery center in Sri Lanka to Aviva Global. |
| | • | | In January 2008, we launched a133-seat facility in Bucharest, Romania. Also, in March 2008, we entered into a joint venture with ACS, a provider in BPM services and customer care in the Philippines, to form WNS Philippines Inc. |
| | • | | In April 2008, we opened a facility in Manila, the Philippines, and we also acquired Chang Limited, an auto insurance claims processing services provider in the UK, through its wholly-owned subsidiary, AHA (formerly known as Call24-7). |
| | • | | In June 2008, we acquired BizAps, a provider of SAP® solutions to optimize the enterprise resource planning functionality for our finance and accounting processes. |
| | • | | In July 2008, we acquired from Aviva all the shares of Aviva Global, which we renamed to WNS Global Singapore, and resumed ownership of the delivery center in Sri Lanka that was transferred to Aviva Global in July 2007, as mentioned above. In connection with our acquisition of Aviva Global, we also entered into the 2008 Aviva master services agreement (as varied by the variation agreement entered into in March 2009) with Aviva MS, pursuant to which we provided BPM services to Aviva’s UK business and Aviva’s Irish subsidiary, Hibernian Aviva Direct Limited, and certain of its affiliates. We replaced this 2008 Aviva master services agreement with the Aviva master services agreement in September 2014. |
| | • | | In November 2009, we opened a facility in San Jose, Costa Rica. |
| | • | | In January 2010, we moved from our existing facility to a new and expanded facility in Manila, the Philippines. |
| | • | | In October 2010, we moved from our existing facility in Marple to Manchester, UK and expanded our facility in Manila, the Philippines. |
| | • | | In November 2010, we expanded our sales office in London, UK. |
| | • | | In March 2011, we expanded our facility in Bucharest, Romania. |
| | • | | In November 2011, we acquired ACS’s shareholding in WNS Philippines Inc., which became our wholly-owned subsidiary. |
| | • | | In fiscal 2012, we expanded our facilities in Mumbai, Pune, Gurgaon, Chennai, India, the Philippines, Costa Rica and Romania. |
88
| | • | | In February 2012, we completed afollow-on public offering of ADSs and raised approximately $50.0 million to fund our growth initiatives and enhance delivery capability. |
| | • | | In June 2012, we acquired Fusion, a provider of a range of management services, including contact center, customer care and business continuity services, to both South African and international clients, which we subsequently renamed as WNS Global Services SA (Pty) Ltd. We also opened a facility in Vizag, India. |
| | • | | In December 2012, we opened a facility in Gydnia, Poland. |
| | • | | In fiscal 2014, we added new facilities in Guangzhou, China; Colombo, Sri Lanka; and Mumbai, India. |
| | • | | In fiscal 2015, we added new facilities in Dalian, China; Cape Town, South Africa; and Pennsylvania, United States. |
| | • | | In fiscal 2016, we added new facilities in Durban and Port Elizabeth, South Africa; and Iloilo, the Philippines. |
| | • | | In June 2016, we acquired Value Edge, a leading provider of commercial research and analytics services to clients in the pharmaceutical and biopharmaceutical industries. We paid $18.3 million in total consideration, including adjustments for working capital of $0.8 million and contingent consideration of $5.1 million (which is held in escrow), subject to compliance with certain conditions, which is payable over three years. We funded this acquisition with cash on hand. Value Edge had 129 employees as at March 31, 2017 in India, the United States and Europe. Value Edge contributed a $0.2 million profit to our results of operations in fiscal 2017. |
| | • | | In January 2017, we acquired Denali, a leading provider of strategic procurement BPM services. We paid $39.6 million in cash consideration, including contingent consideration of up to $6.6 million, dependent on the achievement of revenue targets over a period of three years and deferred consideration of $0.5 million payable in fiscal 2018, subject to adjustments for cash and working capital. We funded this acquisition primarily with the proceeds from our $34.0 million secured three year term loan facility described under “—Liquidity and Capital Resources” below. Denali had 269 employees as at March 31, 2017 in the United States, Turkey, China and India. Denali contributed a $0.2 million loss to our results of operations in fiscal 2017. |
| | • | | In March 2017, we acquired HealthHelp, an industry leader in care management, for a total consideration of $68.3 million, subject to adjustments for cash and working capital, including contingent consideration of up to $8.9 million, payable over a period of two years and dependent on the achievement of revenue targets and the continuation of a specified client contract. We funded this acquisition primarily with the proceeds from our $84.0 million secured five year term loan facility described under “—Liquidity and Capital Resources” below. HealthHelp had 406 employees as at March 31, 2017 in the United States. HealthHelp contributed a $0.3 million loss to our results of operations in fiscal 2017. |
| | • | | In fiscal 2017, we added new facilities in Durban and Centurion, South Africa. We also added new facilities in Pune and Noida, India; Bellevue, Pittsburgh, New York City and Houston, USA; and Istanbul, Turkey. We also expanded our facility in Gurgaon, India. |
89
Revenue
We generate revenue by providing business process management services to our clients. The following table shows our revenue (a GAAP financial measure) and revenue less repair payments (anon-GAAP financial measure) for the periods indicated:
| | | | | | | | | | | | | | | | |
| | | Year ended March 31, | | | Change | |
| | | 2017 | | | 2016 | | | $ | | | % | |
| | | (US dollars in millions) | | | | |
Revenue | | $ | 602.5 | | | $ | 562.2 | | | | 40.4 | | | | 7.2 | % |
Revenue less repair payments(non-GAAP) | | $ | 578.4 | | | $ | 531.0 | | | | 47.4 | | | | 8.9 | % |
We have a large client base diversified across industries and geographies. Our client base grew from 302 clients as at March 31, 2016 to 349 clients as at March 31, 2017, including clients of the businesses we acquired in fiscal 2017.
Our revenue is characterized by client, industry, service type, geographic and contract type diversity, as the analysis below indicates.
Revenue by Top Clients
For fiscal 2017, 2016 and 2015, the percentage of revenue and revenue less repair payments(non-GAAP) that we derived from our largest clients were in the proportions set forth in the following table:
| | | | | | | | | | | | | | | | | | | | | | | | |
| | | Revenue | | | Revenue less repair payments
(non-GAAP) | |
| | | Year ended March 31, | | | Year ended March 31, | |
| | | 2017 | | | 2016 | | | 2015 | | | 2017 | | | 2016 | | | 2015 | |
Top client | | | 9.0 | % | | | 10.9 | % | | | 13.4 | % | | | 9.4 | % | | | 11.6 | % | | | 14.2 | % |
Top five clients | | | 32.1 | % | | | 30.7 | % | | | 33.0 | % | | | 33.5 | % | | | 32.5 | % | | | 35.0 | % |
Top ten clients | | | 43.6 | % | | | 43.0 | % | | | 44.5 | % | | | 45.4 | % | | | 45.5 | % | | | 47.2 | % |
Top twenty clients | | | 55.7 | % | | | 57.3 | % | | | 60.1 | % | | | 58.0 | % | | | 60.7 | % | | | 63.5 | % |
In fiscal 2017, our three largest clients individually accounted for 9.0%, 6.4% and 6.1%, respectively, of our revenue as compared to 10.9%, 7.8% and 5.2%, respectively, in fiscal 2016 and 13.4%, 8.5% and 5.5%, respectively, in fiscal 2015.
In fiscal 2017, our three largest clients individually accounted for 9.4%, 6.7% and 6.3%, respectively, of our revenue less repair payments (non-GAAP) as compared to 11.6%, 8.3% and 5.5%, respectively, in fiscal 2016 and 14.2%, 9.0% and 5.8%, respectively, in fiscal 2015.
One of our top five clients by revenue contribution in fiscal 2014, an OTA, provided us with a lower volume of business in fiscal 2015 as the OTA entered into a strategic marketing agreement with another OTA in August 2013 pursuant to which it over a period of time, from the fourth quarter of fiscal 2014 to the first quarter of fiscal 2016, moved its customer care and sales processes that were previously managed by us to a technology platform managed by the other OTA. As a result, we lost most of our business from that OTA and since June 2015, we ceased to provide services to that OTA. That OTA accounted for 2.5% of our revenue and 2.6% of our revenue less repair payments(non-GAAP) in fiscal 2015. The other OTA uses several BPM vendors to manage such processes on their technology platform. We are approved as one of the other OTA’s providers of BPM services. We have managed to compete with incumbent BPM vendors for the other OTA’s business and the other OTA has become one of our large clients.
Further, we have entered into the Aviva master services agreement with an existing major client, Aviva MS, effective April 1, 2014. The Aviva master services agreement replaced our prior master services agreement, the 2008 Aviva master services agreement, with the client that was due to expire in November 2016. See “– Our Contracts – Revenue by Contract Type.” The revised pricing arrangements under the new agreement resulted in lower revenue from the client in fiscal 2017 and 2016, as compared to fiscal 2015. The decline in revenue in fiscal 2017 was due to the termination of a minimum commitment fee during the fiscal year, which had applied during the full fiscal 2016. Aviva MS accounted for 9.0%, 10.9% and 13.4% of our revenue and 9.4%, 11.6% and 14.2% of our revenue less repair payments(non-GAAP) in fiscal 2017, 2016 and 2015, respectively. Part of the decline in revenue was due to a reduction of services due to automation performed by Aviva MS on their end.
90
Revenue by Industry
For financial statement reporting purposes, we aggregate our operating segments, except for the WNS Auto Claims BPM (which we market under the WNS Assistance brand) as it does not meet the aggregation criteria under IFRS. See “— Results by Reportable Segment.”
We organize our company into the following industry-focused business units to provide more specialized focus on each of these industries: insurance; travel and leisure; diversified businesses including manufacturing, retail, CPG, media and entertainment, and telecom; utilities; consulting and professional services; healthcare; banking and financial services; and shipping and logistics.
For fiscal 2017, 2016 and 2015, our revenue and revenue less repair payments(non-GAAP) were diversified across our industry-focused business units in the proportions set forth in the following table:
| | | | | | | | | | | | | | | | | | | | | | | | |
| | | As a percentage of revenue | | | As a percentage of revenue less
repair payments (non-GAAP) | |
| | | Year ended March 31, | | | Year ended March 31, | |
Business Unit | | 2017 | | | 2016 | | | 2015 | | | 2017 | | | 2016 | | | 2015 | |
Insurance | | | 29.6 | % | | | 32.3 | % | | | 35.8 | % | | | 26.6 | % | | | 28.5 | % | | | 31.7 | % |
Travel and leisure | | | 21.3 | % | | | 19.6 | % | | | 18.7 | % | | | 22.1 | % | | | 20.7 | % | | | 19.8 | % |
Diversified businesses including manufacturing, retail, CPG, media and entertainment, and telecom | | | 17.5 | % | | | 15.4 | % | | | 14.0 | % | | | 18.2 | % | | | 16.3 | % | | | 14.9 | % |
Utilities | | | 9.3 | % | | | 10.2 | % | | | 9.5 | % | | | 9.7 | % | | | 10.8 | % | | | 10.1 | % |
Consulting and professional services(1) | | | 6.9 | % | | | 7.9 | % | | | 7.6 | % | | | 7.2 | % | | | 8.3 | % | | | 8.2 | % |
Healthcare | | | 6.8 | % | | | 5.2 | % | | | 5.2 | % | | | 7.1 | % | | | 5.5 | % | | | 5.6 | % |
Banking and financial services | | | 4.4 | % | | | 5.5 | % | | | 5.8 | % | | | 4.6 | % | | | 5.8 | % | | | 6.1 | % |
Shipping and logistics | | | 4.3 | % | | | 3.9 | % | | | 3.4 | % | | | 4.4 | % | | | 4.1 | % | | | 3.6 | % |
| | | | | | | | | | | | | | | | | | | | | | | | |
Total | | | 100.0 | % | | | 100.0 | % | | | 100.0 | % | | | 100.0 | % | | | 100.0 | % | | | 100.0 | % |
| | | | | | | | | | | | | | | | | | | | | | | | |
Note:
| (1) | We merged our public sector business unit with our consulting and professional services business unit with effect from April 1, 2015 and revenue from the public sector business unit for fiscal 2015 has been included in the revenue and revenue less repair payments(non-GAAP) from the consulting and professional business unit for comparability. |
Certain services that we provide to our clients are subject to the seasonality of our clients’ business. Accordingly, we see an increase in transaction related services within the travel and leisure industry during holiday seasons, such as during the US summer holidays (our fiscal second quarter); an increase in business in the insurance industry during the beginning and end of the fiscal year (our fiscal first and last quarters) and during the US peak winter season (our fiscal third quarter); and an increase in business in the consumer product industry during the US festive season towards the end of the calendar year when new product launches and campaigns typically happen (our fiscal third quarter).
91
Revenue by Service Type
For fiscal 2017, 2016 and 2015, our revenue and revenue less repair payments(non-GAAP) were diversified across service types in the proportions set forth in the following table:
| | | | | | | | | | | | | | | | | | | | | | | | |
| | | As a percentage of revenue | | | As a percentage of revenue less
repair payments (non-GAAP) | |
| | | Year ended March 31, | | | Year ended March 31, | |
Service Type | | 2017 | | | 2016 | | | 2015 | | | 2017 | | | 2016 | | | 2015 | |
Industry-specific | | | 28.2 | % | | | 30.2 | % | | | 31.0 | % | | | 29.4 | % | | | 31.9 | %�� | | | 33.0 | % |
Customer interaction services(1) | | | 27.9 | % | | | 26.9 | % | | | 22.5 | % | | | 29.1 | % | | | 28.5 | % | | | 23.9 | % |
Finance and accounting | | | 20.6 | % | | | 18.4 | % | | | 20.0 | % | | | 21.5 | % | | | 19.5 | % | | | 21.2 | % |
Research and analytics | | | 13.3 | % | | | 12.4 | % | | | 12.5 | % | | | 13.8 | % | | | 13.1 | % | | | 13.2 | % |
Auto claims | | | 7.4 | % | | | 9.5 | % | | | 11.4 | % | | | 3.6 | % | | | 4.2 | % | | | 6.0 | % |
Others(2) | | | 2.6 | % | | | 2.6 | % | | | 2.6 | % | | | 2.7 | % | | | 2.8 | % | | | 2.7 | % |
| | | | | | | | | | | | | | | | | | | | | | | | |
Total | | | 100.0 | % | | | 100.0 | % | | | 100.0 | % | | | 100.0 | % | | | 100.0 | % | | | 100.0 | % |
| | | | | | | | | | | | | | | | | | | | | | | | |
Notes:
| (1) | We have renamed our “contact center” horizontal unit as “customer interaction services” with effect from April 1, 2016, as we have expanded the services offered in that horizontal unit to include more value-added services beyond the customary contact center services. |
| (2) | Others includes revenue from technology services, legal services and human resources outsourcing services. |
During the fourth quarter of fiscal 2017, proposed changes to the laws of the UK governing personal injury claims generated uncertainty regarding the future earnings trajectory of our legal services business in our WNS Auto Claims BPM segment, as a result of which we expect that we will eventually exit from providing legal services in relation to personal injury claims. We have also experienced a decrease in volume of and loss of such business from certain clients of our traditional repair services in our WNS Auto Claims BPM segment. As a result, we expect the future performance of our WNS Auto Claims BPM segment to decline significantly and the business will run with an opportunistic view.
92
Revenue by Geography
For fiscal 2017, 2016 and 2015, our revenue and revenue less repair payments(non-GAAP) were derived from the following geographies (based on the location of our clients) in the proportions set forth below in the following table:
| | | | | | | | | | | | | | | | | | | | | | | | |
| | | As a percentage of revenue | | | As a percentage of revenue less
repair payments (non-GAAP) | |
| | | Year ended March 31, | | | Year ended March 31, | |
Geography | | 2017 | | | 2016 | | | 2015 | | | 2017 | | | 2016 | | | 2015 | |
UK | | | 41.3 | % | | | 47.1 | % | | | 52.8 | % | | | 38.8 | % | | | 44.0 | % | | | 49.9 | % |
North America (primarily the US) | | | 32.6 | % | | | 27.6 | % | | | 25.9 | % | | | 33.9 | % | | | 29.3 | % | | | 27.5 | % |
Australia | | | 8.1 | % | | | 7.2 | % | | | 6.4 | % | | | 8.5 | % | | | 7.6 | % | | | 6.8 | % |
South Africa | | | 7.1 | % | | | 5.4 | % | | | 3.3 | % | | | 7.4 | % | | | 5.7 | % | | | 3.5 | % |
Europe (excluding the UK) | | | 6.2 | % | | | 6.2 | % | | | 5.4 | % | | | 6.5 | % | | | 6.5 | % | | | 5.7 | % |
Rest of world | | | 4.7 | % | | | 6.5 | % | | | 6.2 | % | | | 4.9 | % | | | 6.9 | % | | | 6.6 | % |
| | | | | | | | | | | | | | | | | | | | | | | | |
Total | | | 100.0 | % | | | 100.0 | % | | | 100.0 | % | | | 100.0 | % | | | 100.0 | % | | | 100.0 | % |
| | | | | | | | | | | | | | | | | | | | | | | | |
Our business in South Africa is evaluated for compliance with the South African government’s BBBEE legislation against a BBBEE scorecard based on various criteria. South African government grants are available to certain businesses that meet specified conditions, including achieving a specified minimum BBBEE rating. Additionally, many South African companies require their service providers to maintain a minimum BBBEE rating, and many of our South African client contracts contain clauses that allow our clients to terminate their contracts with us or impose specified penalties on us if we do not maintain a minimum BBBEE rating.
New BBBEE criteria became effective for us from March 2017, according to which an entity receives a new compliance rating from the BBBEE rating agency. Under these new criteria, our rating based on our previous structure and practices would have dropped and we would have been required contractually to improve our rating. We developed a plan to achieve or improve our current rating by the BBBEE verification audit for period ended March 31, 2017 in May 2017. This plan included, among other measures, divesting some of our interests in our South Africa subsidiary to address the criterion relating to the percentage of ownership of an entity by “black people” (as defined under the applicable legislation). We achieved the required rating on the basis of the steps taken to comply with the new BBBEE criteria which is valid until May 2018. However, there is no assurance that we will successfully maintain our existing BBBEE rating under the new criteria in our next annual BBBEE verification audit by the BBBEE rating agency, or at all. If we fail to achieve the required minimum BBBEE rating, we will cease to be eligible for government grants, will be disqualified from bidding for certain business, and our clients may terminate their contracts with us or impose penalties on us. These outcomes would have an adverse effect on our business, results of operations, financial condition and cash flows.
93
Revenue by Location of Delivery Centers
For fiscal 2017, 2016 and 2015, our revenue and revenue less repair payments(non-GAAP) were derived from the following geographies (based on the location of our delivery centers) in the proportions set forth in the following table:
| | | | | | | | | | | | | | | | | | | | | | | | |
| | | As a percentage of revenue | | | As a percentage of revenue less
repair payments (non-GAAP) | |
| | | Year ended March 31, | | | Year ended March 31, | |
Location of Delivery Center | | 2017 | | | 2016 | | | 2015 | | | 2017 | | | 2016 | | | 2015 | |
India | | | 58.5 | % | | | 61.4 | % | | | 64.2 | % | | | 60.9 | % | | | 65.1 | % | | | 68.4 | % |
South Africa | | | 11.1 | % | | | 10.6 | % | | | 7.8 | % | | | 11.6 | % | | | 11.2 | % | | | 8.3 | % |
Philippines | | | 10.7 | % | | | 8.2 | % | | | 6.6 | % | | | 11.2 | % | | | 8.7 | % | | | 7.0 | % |
UK | | | 8.7 | % | | | 10.2 | % | | | 12.0 | % | | | 4.9 | % | | | 4.9 | % | | | 6.6 | % |
United States | | | 3.9 | % | | | 2.2 | % | | | 1.3 | % | | | 4.1 | % | | | 2.3 | % | | | 1.3 | % |
Sri Lanka | | | 2.5 | % | | | 2.8 | % | | | 3.0 | % | | | 2.6 | % | | | 2.9 | % | | | 3.1 | % |
Romania | | | 1.8 | % | | | 2.1 | % | | | 2.5 | % | | | 1.9 | % | | | 2.2 | % | | | 2.7 | % |
China | | | 1.3 | % | | | 1.0 | % | | | 1.1 | % | | | 1.4 | % | | | 1.1 | % | | | 1.1 | % |
Poland | | | 0.9 | % | | | 0.7 | % | | | 0.8 | % | | | 0.9 | % | | | 0.8 | % | | | 0.8 | % |
Costa Rica | | | 0.6 | % | | | 0.8 | % | | | 0.7 | % | | | 0.7 | % | | | 0.8 | % | | | 0.7 | % |
| | | | | | | | | | | | | | | | | | | | | | | | |
Total | | | 100.0 | % | | | 100.0 | % | | | 100.0 | % | | | 100.0 | % | | | 100.0 | % | | | 100.0 | % |
| | | | | | | | | | | | | | | | | | | | | | | | |
94
Our Contracts
We provide our services under contracts with our clients, which typically range from three to five years, with some being rolling contracts with no end dates. Typically, these contracts can be terminated by our clients with or without cause and with short notice periods. However, we tend to have long-term relationships with our clients given the complex and comprehensive nature of the business processes executed by us, coupled with the switching costs and risks associated with relocating these processesin-house or to other service providers.
Each client contract has different terms and conditions based on the scope of services to be delivered and the requirements of that client. Occasionally, we may incur significant costs on certain contracts in the early stages of implementation, with the expectation that these costs will be recouped over the life of the contract to achieve our targeted returns. Each client contract has corresponding service level agreements that define certain operational metrics based on which our performance is measured. Some of our contracts specify penalties or damages payable by us in the event of failure to meet certain key service level standards within an agreed upon time frame.
When we are engaged by a client, we typically transfer that client’s processes to our delivery centers over a two to six month period. This transfer process is subject to a number of potential delays. Therefore, we may not recognize significant revenue until several months after commencing a client engagement.
In the WNS Global BPM segment, we charge for our services based on the following pricing models:
| | 1) | per full-time equivalent arrangements, which typically involve billings based on the number of full-time employees (or equivalent) deployed on the execution of the business process managed; |
| | 2) | per transaction arrangements, which typically involve billings based on the number of transactions processed (such as the number ofe-mail responses, or airline coupons or insurance claims processed); |
| | 3) | fixed-price arrangements, which typically involve billings based on achievements ofpre-defined deliverables or milestones; |
| | 4) | outcome-based arrangements, which typically involve billings based on the business result achieved by our clients through our service efforts (such as measured based on a reduction in days sales outstanding, an improvement in working capital, an increase in collections or a reduction in operating expenses); or |
| | 5) | other pricing arrangements, including cost-plus arrangements, which typically involve billing the contractually agreed direct and indirect costs and a fee based on the number of employees deployed under the arrangement. |
Apart from the above-mentioned pricing methods, a small portion of our revenue is comprised of reimbursements ofout-of-pocket expenses incurred by us in providing services to our clients.
Outcome-based arrangements are examples ofnon-linear pricing models where revenues from platforms and solutions and the services we provide are linked to usage or savings by clients rather than the efforts deployed to provide these services. We intend to focus on increasing our service offerings that are based onnon-linear pricing models that allow us to price our services based on the value we deliver to our clients rather than the headcount deployed to deliver the services to them. We believe thatnon-linear pricing models help us to grow our revenue without increasing our headcount. Accordingly, we expect increased use ofnon-linear pricing models to result in higher revenue per employee and improved margins.Non-linear revenues may be subject to short term pressure on margins, however, as initiatives in developing the products and services take time to deliver. Moreover, in outcome-based arrangements, we bear the risk of failure to achieve clients’ business objectives in connection with these projects. For more information, see “Part I — Item 3. Key Information — D. Risk Factors — If our pricing structures do not accurately anticipate the cost and complexity of performing our work, our profitability may be negatively affected.”
In our WNS Auto Claims BPM segment, we earn revenue from claims handling and repair management services. For claims handling, we charge on a per claim basis or a fixed fee per vehicle over a contract period. For automobile repair management services, where we arrange for the repairs through a network of repair centers that we have established, we invoice the client for the amount of the repair. When we direct a vehicle to a specific repair center, we receive a referral fee from that repair center. We also provide a consolidated suite of services towards accident management including credit hire and credit repair for“non-fault” repairs business. Effective July 1, 2015, WNS Legal Assistance LLP, a subsidiary of WNS Assistance Limited, commenced providing legal services in relation to personal injury claims.
95
Revenue by Contract Type
For fiscal 2017, 2016 and 2015, our revenue and revenue less repair payments(non-GAAP) were diversified by contract type in the proportions set forth in the following table:
| | | | | | | | | | | | | | | | | | | | | | | | |
| | | As a percentage of revenue | | | As a percentage of revenue less
repair payments (non-GAAP) | |
| | | Year ended March 31, | | | Year ended March 31, | |
| | | 2017 | | | 2016 | | | 2015 | | | 2017 | | | 2016 | | | 2015 | |
Full-time-equivalent | | | 71.8 | % | | | 73.0 | % | | | 69.7 | % | | | 74.8 | % | | | 77.3 | % | | | 74.0 | % |
Transaction | | | 17.7 | % | | | 19.7 | % | | | 22.4 | % | | | 14.2 | % | | | 15.0 | % | | | 17.6 | % |
Fixed price | | | 4.5 | % | | | 2.6 | % | | | 3.4 | % | | | 4.7 | % | | | 2.8 | % | | | 3.6 | % |
Outcome-based | | | 0.3 | % | | | 0.7 | % | | | 1.1 | % | | | 0.3 | % | | | 0.7 | % | | | 1.2 | % |
Others | | | 5.7 | % | | | 4.0 | % | | | 3.4 | % | | | 5.9 | % | | | 4.2 | % | | | 3.6 | % |
| | | | | | | | | | | | | | | | | | | | | | | | |
Total | | | 100.0 | % | | | 100.0 | % | | | 100.0 | % | | | 100.0 | % | | | 100.0 | % | | | 100.0 | % |
| | | | | | | | | | | | | | | | | | | | | | | | |
We have continued ourten-year relationship with Aviva MS by entering into the Aviva master services agreement with Aviva MS in September 2014 for a term of eight years, effective April 1, 2014 and expiring on March 31, 2022. The Aviva master services agreement replaced our 2008 Aviva master services agreement with the client that was due to expire in November 2016. The agreement continues to provide us with the exclusive right to provide the client with the services we currently provide, and in the same geographic regions, subject to the rights and obligations of the Aviva group under their existing contracts with other providers of similar services. Aviva MS has agreed, and further agreed to procure other members of the Aviva group, not to renew or extend such existing contracts unless they are contractually bound to do so. We are also regarded as a preferred supplier with respect to any new services or any new geographic regions in which the client seeks BPM services, subject to our meeting certain conditions of the client’s supplier tender process.
Our clients customarily provide one to three month rolling forecasts of their service requirements. Our contracts with our clients do not generally provide for a committed minimum volume of business or committed amounts of revenue, with the exception of the Aviva master services agreement. The Aviva master services agreement required Aviva MS to provide us with a minimum volume of business until October 31, 2016 (the last complete month prior to the expiration of the 2008 Aviva master services agreement). The minimum volume commitment is calculated as 3,000 billable full time employees, where one billable full time employee is the equivalent of a production employee engaged by us to perform our obligations under the contract for one working day at least nine hours for 250 days a year. The revised contract is priced on an FTE pricing model for certain types of outsourced processes and anon-FTE based pricing model for other types of outsourced processes. In the event the mean average monthly volume of business in any rolling three-month period does not reach the minimum volume commitment, Aviva MS has agreed to pay us a minimum commitment fee as liquidated damages. Notwithstanding the minimum volume commitment, there are termination at will provisions which permit Aviva MS to terminate the Aviva master services agreement without cause, with six months’ notice upon payment of a termination fee. The annual minimum volume commitment under this contract was not met, due to decreased volumes on the client’s end, in fiscal 2017 (until October 31, 2016), 2016 and 2015, and Aviva MS paid us the minimum commitment fee for fiscal 2017 (until October 31, 2016), 2016 and 2015.
The new pricing arrangements under the Aviva master services agreement provide for productivity-related discounts associated with FTE andnon-FTE models. Some of these discounts are mandatorily applied through the term of the contract. Pricing also varies based on degree of complexity of the outsourced processes. The new pricing arrangements under the Aviva master services agreement, including the termination of the minimum commitment fee on October 31, 2016, resulted in lower revenue for fiscal 2017 as compared to fiscal 2016 and 2015. Aviva MS accounted for 9.0%, 10.9% and 13.4% of our revenue and 9.4%, 11.6% and 14.2% of our revenue less repair payments(non-GAAP) in fiscal 2017, 2016 and 2015, respectively.
Under the terms of an agreement with a former client (who was one of our top five clients by revenue contribution in fiscal 2014) negotiated in December 2009, we were the exclusive provider of certain key services from delivery locations outside of the US, including customer service and ticketing support for the client. This agreement became effective on April 1, 2010 and was due to expire in December 2015. Under our earlier agreement with this client, we were entitled to charge premium pricing because we had absorbed the initial transition cost in 2004. That premium pricing is no longer available in this subsequent agreement with this client. The early termination of the prior agreement entitled us to a payment by the client of a termination fee of $5.4 million which was received on April 1, 2010. As the termination fee was related to a renewal of our agreement with the client, we have determined that the recognition of the termination fee as revenue was to be deferred over the term of this subsequent agreement (i.e., over the period from April 1, 2010 to December 31, 2015). Since June 2015, we have ceased to provide services under this agreement to this client. Accordingly, in June 2015 we recognized in full the termination fee for the remaining six months of the term of this agreement.
96
Expenses
The majority of our expenses consist of cost of revenue and operating expenses. The key components of our cost of revenue are employee costs, facilities costs, payments to repair centers, depreciation, travel expenses, and legal and professional costs. Our operating expenses include selling and marketing expenses, general and administrative expenses, foreign exchange gains and losses and amortization of intangible assets. Ournon-operating expenses include finance expenses as well as other expenses recorded under “other income, net.”
Cost of Revenue
Employee costs represent the largest component of cost of revenue. In addition to employee salaries, employee costs include costs related to recruitment, training and retention, and share-based compensation expense. Historically, our employee costs have increased primarily due to increases in number of employees to support our growth and, to a lesser extent, to recruit, train and retain employees. Salary levels in India and our ability to efficiently manage and retain our employees significantly influence our cost of revenue. See “Part I — Item 4. Information on the Company — B. Business Overview — Human Capital.” Regulatory developments may, however, result in wage increases in India and increase our cost of revenue. For example, in December 2015, the Government of India amended the India Payment of Bonus Act, which mandated increased employee bonus amounts for certain wage categories, effective retroactively from April 1, 2014. See “Part I — Item. 3. Key Information. — D. Risk Factors — Risks Related to Our Business — Wage increases may prevent us from sustaining our competitive advantage and may reduce our profit margin.” We seek to mitigate these cost increases through improvements in employee productivity, employee retention and asset utilization.
Our WNS Auto Claims BPM segment includes repair management services, where we arrange for automobile repairs through a network of third party repair centers. This cost is primarily driven by the volume of accidents and the amount of the repair costs related to such accidents. It also includes incremental and direct costs incurred to contract with claimants by WNS Legal Assistance LLP.
Our facilities costs comprise lease rentals, utilities cost, facilities management and telecommunication network cost. Most of our leases for our facilities are long-term agreements and have escalation clauses which provide for increases in rent at periodic intervals commencing between three and five years from the start of the lease. Most of these agreements have clauses that have fixed escalation of lease rentals.
We create capacity in our operational infrastructure ahead of anticipated demand as it takes six to nine months to build up a new site. Hence, our cost of revenue as a percentage of revenue may be higher during periods in which we carry such additional capacity.
Once we are engaged by a client in a new contract, we normally have a transition period to transfer the client’s processes to our delivery centers and accordingly incur costs related to such transfer. Therefore, our cost of revenue in relation to our revenue may be higher until the transfer phase is completed, which may last for two to six months.
Selling and Marketing Expenses
Our selling and marketing expenses comprise primarily employee costs for sales and marketing personnel, travel expenses, legal and professional fees, share-based compensation expense, brand building expenses and other general expenses relating to selling and marketing.
Selling and marketing expenses as a proportion of revenue was 5.4% in fiscal 2017 as compared to 5.5% and 5.8% for fiscal 2016 and 2015, respectively. Selling and marketing expenses as a proportion of revenue less repair payments(non-GAAP) was 5.6% in fiscal 2017 as compared with 5.8% and 6.2% for fiscal 2016 and 2015, respectively. We expect our selling and marketing expenses to increase in fiscal 2018 but at a lower rate than the increase in our revenue less repair payments(non-GAAP). See “Part I — Item 4. Information on the Company — B. Business Overview — Business Strategy — Enhance awareness of the WNS brand name.” Our sales team is compensated based on achievement of business targets set at the beginning of each fiscal year. Accordingly, we expect this variable component of the sales team costs to increase in line with overall business growth.
97
General and Administrative Expenses
Our general and administrative expenses comprise primarily employee costs for senior management and other support personnel, travel expenses, legal and professional fees, share-based compensation expense and other general expenses not related to cost of revenue and selling and marketing.
General and administrative expenses as a proportion of revenue was 15.2% in fiscal 2017 as compared with 14.0% and 13.1% for fiscal 2016 and 2015, respectively. General and administrative expenses as a proportion of revenue less repair payments(non-GAAP) was 15.9% in fiscal 2017 as compared with 14.9% and 13.9% for fiscal 2016 and 2015, respectively. We expect general and administrative expenses to increase in fiscal 2018 but at a lower rate than the increase in our revenue less repair payments(non-GAAP).
We also expect our corporate employee costs for general and administrative and other support personnel to increase in fiscal 2018 but at a lower rate than the increase in our revenue less repair payments(non-GAAP).
Foreign Exchange Loss / (Gain), Net
Foreign exchange gains or losses, net include:
| | • | | marked to market gains or losses on derivative instruments that do not qualify for “hedge” accounting and are deemed ineffective; |
| | • | | realized foreign currency exchange gains or losses on settlement of transactions in foreign currency and derivative instruments; and |
| | • | | unrealized foreign currency exchange gains or losses on revaluation of other assets and liabilities. |
We had a foreign exchange gain of $14.5 million in fiscal 2017 as compared to $11.0 million and $4.5 million in fiscal 2016 and 2015, respectively. We expect our foreign exchange gains to be higher in fiscal 2018 as compared to fiscal 2017, based on our current hedge positions and exchange rates.
Impairment of Goodwill
During the fourth quarter of fiscal 2017, proposed changes to the laws of the UK governing personal injury claims generated uncertainty regarding the future earnings trajectory of our legal services business in our WNS Auto Claims BPM segment, as a result of which we expect that we will eventually exit from providing legal services in relation to personal injury claims. We have also experienced a decrease in volume of and loss of business from certain clients of our traditional repair services in our WNS Auto Claims BPM segment. As a result, we expect the future performance of our WNS Auto Claims BPM segment to decline significantly and we have therefore significantly reduced our financial projections and estimates of our WNS Auto Claims BPM segment. We performed an impairment review of the goodwill associated with the companies we had acquired for our auto claims business and recorded an impairment charge of $21.7 million to our results of operations for fiscal 2017.
Amortization of Intangible Assets
Amortization of intangible assets is primarily associated with our acquisitions of Aviva Global in July 2008, Fusion in June 2012, a customer contract from Telkom in May 2015, Value Edge in June 2016, Denali in January 2017 and HealthHelp in March 2017.
Other Income, Net
Other income, net comprises interest income, income from investments, gain or loss on sale of assets and other miscellaneous expenses.
Finance Expense
Finance expense primarily relates to interest charges payable on our term loans and short term borrowings, transaction costs and the gains/losses on settlement of related derivative instruments. We expect finance expense to increase on account of interest payable on long term loans obtained during the year to fund our acquisitions of Denali and HealthHelp.
98
Operating Data
Our profit margin is largely a function of our asset utilization and the rates we are able to recover for our services. One of the most significant components of our asset utilization is our seat utilization rate which is the average number of work shifts per day, out of a maximum of three, for which we are able to utilize our seats. Generally, an improvement in seat utilization rate will improve our profitability unless there are other factors which increase our costs such as an increase in lease rentals, largeramp-ups to build new seats, and increases in costs related to repairs and renovations to our existing or used seats. In addition, an increase in seat utilization rate as a result of an increase in the volume of work will generally result in a lower cost per seat and a higher profit margin as the total fixed costs of our built up seats remain the same while each seat is generating more revenue.
The following table presents certain operating data as at the dates indicated:
| | | | | | | | | | | | |
| | | As at March 31, | |
| | | 2017 | | | 2016 | | | 2015 | |
Total headcount | | | 33,968 | | | | 32,388 | | | | 28,890 | |
Built up seats(1) | | | 28,008 | | | | 26,407 | | | | 24,131 | |
Used seats(1) | | | 20,795 | | | | 20,063 | | | | 17,451 | |
Seat utilization rate(2) | | | 1.22 | | | | 1.21 | | | | 1.18 | |
Notes:
| (1) | Built up seats refer to the total number of production seats (excluding support functions like Finance, Human Resource, Administration and seats dedicated for business continuity planning) that are set up in any premises. Used seats refer to the number of built up seats that are being used by employees. The remainder would be termed “vacant seats.” The vacant seats would get converted into used seats when we increase headcount. Previously, our reported built up seats included seats dedicated for business continuity planning. Commencing fiscal 2016, we have been reporting our built up seats and computing our seat utilization rate excluding seats dedicated for business continuity planning to better reflect our business operations. The built up seats and seat utilization rate presented for prior years in the table above have beenre-computed to exclude seats dedicated for business continuity planning. |
| (2) | The seat utilization rate is calculated by dividing the average total headcount by the average number of built up seats to show the rate at which we are able to utilize our built up seats. Average total headcount and average number of built up seats are calculated by dividing the aggregate of the total headcount or number of built up seats, as the case may be, as at the beginning and end of the fiscal year by two. |
We expect our total headcount in fiscal 2018 to increase as compared to fiscal 2017 as the impact of an increased flow of business from new and existing clients is expected to increase our hiring requirements in fiscal 2018.
Foreign Exchange
Exchange Rates
We report our financial results in US dollars and our results of operations would be adversely affected if the pound sterling or, to a lesser extent, the Australian dollar depreciates against the US dollar, or if the Indian rupee or, to a lesser extent, the South African rand or the Philippines peso appreciates against the US dollar. Although a substantial portion of our revenue and revenue less repair payments(non-GAAP) is denominated in pound sterling (39.6% and 37.0%, respectively, in fiscal 2017, 46.9% and 43.8%%, respectively, in fiscal 2016 and 51.5% and 48.5%, respectively, in fiscal 2015), US dollars (38.7% and 40.3%, respectively, in fiscal 2017, 34.8% and 36.9%, respectively, in fiscal 2016 and 32.7% and 34.7%, respectively, in fiscal 2015) and, to a lesser extent, Australian dollars (7.2% and 7.5%, respectively, in fiscal 2017, 6.9% and 7.3%, respectively, in fiscal 2016 and 6.4% and 6.8%, respectively, in fiscal 2015), and South African rand (6.8% and 7.0%, respectively, in fiscal 2017, 5.2% and 5.6%, respectively, in fiscal 2016 and 3.2% and 3.4%, respectively, in fiscal 2015), most of our expenses (net of payments to repair centers) are incurred and paid in Indian rupees (51.1% in fiscal 2017, 54.2% in fiscal 2016 and 55.5% in fiscal 2015) and, to a lesser extent, in South African rand (11.1% in fiscal 2017, 11.0% in fiscal 2016 and 8.3% in fiscal 2015) and Philippines pesos (9.4% in fiscal 2017, 8.0% in fiscal 2016 and 7.0% in fiscal 2015). The exchange rates between these currencies and the US dollar have changed substantially in recent years and may fluctuate substantially in the future.
99
The average Indian rupee to US dollar exchange rate was approximately₹67.10 per $1.00 in fiscal 2017, which represented a depreciation of the Indian rupee of 2.6% as compared with the average exchange rate of approximately₹65.43 per $1.00 in fiscal 2016, which in turn represented a depreciation of the Indian rupee of 7.1% as compared with the average exchange rate of approximately₹61.12 per $1.00 in fiscal 2015. The average pound sterling to US dollar exchange rate was approximately £0.765 per $1.00 in fiscal 2017, which represented a depreciation of the pound sterling of 13.4% as compared with the average exchange rate of approximately £0.662 per $1.00 in fiscal 2016, which in turn represented a depreciation of the pound sterling of 6.4% as compared with the average exchange rate of approximately £0.620 per $1.00 in fiscal 2015. The average Australian dollar to US dollar exchange rate was approximately A$1.33 per $1.00 in fiscal 2017, which represented an appreciation of the Australian dollar of 2.1% as compared with the average exchange rate of approximately A$1.36 per $1.00 in fiscal 2016, which in turn represented a depreciation of the Australian dollar of 15.8% as compared with the average exchange rate of approximately A$1.14 per $1.00 in fiscal 2015. The average South African rand to US dollar exchange rate was approximately R14.07 per $1.00 in fiscal 2017, which represented a depreciation of the South African rand of 2.3% as compared with the average exchange rate of approximately R13.75 per $1.00 in fiscal 2016, which in turn represented a depreciation of the South African rand of 24.3% as compared with the average exchange rate of approximately R11.07 per $1.00 in fiscal 2015.
The depreciation of the Indian rupee against the US dollar by 2.6% in fiscal 2017 as compared to the average exchange rate in fiscal 2016 and by 7.1% as compared to the average exchange rate in fiscal 2015, had a positive impact on our expenses in fiscal 2017 and 2016. As a result, increases in our cost of revenue, and to a lesser extent, our general and administrative expenses were partially offset by the impact of the depreciation of Indian rupee in fiscal 2017 and 2016. The depreciation of the South African rand in fiscal 2017 and 2016 against the US dollar and the appreciation of the Australian dollar in fiscal 2017 also positively impacted our results of operations in those years. On the other hand, the depreciation of the pound sterling in fiscal 2017 and 2016 and the depreciation of the Australian dollar in fiscal 2016 against the US dollar negatively impacted our results of operations in these years. See “Part I — Item 11. Quantitative and Qualitative Disclosures About Market Risk — B. Risk Management Procedures — Components of Market Risk — Exchange Rate Risk.”
We have subsidiaries in several countries and hence, the functional currencies of these entities differ from our reporting currency, the US dollar. The financial statements of these entities are translated to the reporting currency as at the balance sheet date. Adjustments resulting from the translation of these financial statements from functional currency to reporting currency are accumulated and reported as other comprehensive income (loss), which is a separate component of equity and such exchange differences are recognized in the consolidated statement of income in the period in which such subsidiaries are disposed. Foreign currency transaction gains and losses are recorded as other income or expense.
100
Currency Regulation
Our Indian subsidiaries are registered as exporters of business process management services with STPI or SEZ. According to the prevailing foreign exchange regulations in India, an exporter of business process management services registered with STPI or SEZ is required to receive its export proceeds in India within a period of 9 months from the date of such exports in order to avail itself of the tax and other benefits. In the event that such a registered exporter has received any advance against exports in foreign exchange from its overseas customers, it is required to render the requisite services so that such advances are earned within a period of 12 months from the date of such receipt. If such a registered exporter does not meet these conditions, it will be required to obtain permission from the Reserve Bank of India to receive and realize such foreign currency earnings.
A majority of the payments we receive from our clients are denominated in pound sterling and US dollars. For most of our clients, our subsidiaries in Mauritius, the Netherlands, the UK and the US enter into contractual agreements directly with our clients for the provision of business process management services by our Indian subsidiaries, which hold the foreign currency receipts in an export earners’ foreign currency account. All foreign exchange requirements, such as for the import of capital goods, expenses incurred during overseas travel by employees and discharge of foreign exchange expenses or liabilities, can be met using the foreign currency in the export earners’ foreign currency account in India. As and when funds are required by us, the funds in the export earners’ foreign currency account may be transferred to an ordinary rupee-denominated account in India.
There are currently no Jersey, UK or US foreign exchange control restrictions on the payment of dividends on our ordinary shares or on the conduct of our operations.
Income Taxes
We operate in multiple tax jurisdictions including Australia, China, Costa Rica, France, Germany, India, Mauritius, the Netherlands, the Philippines, Poland, Romania, Singapore, South Africa, Sri Lanka, Switzerland, Turkey, United Arab Emirates, the UK and the US. As a result, our effective tax rate changes from year to year based on recurring factors such as the geographical mix of income before taxes, state and local taxes, the ratio of permanent items topre-tax book income and the implementation of various global tax strategies, as well asnon-recurring events.
In fiscal 2017, 2016 and 2015, our tax rate in India, the Philippines and Sri Lanka impacted our effective tax rate. We would have incurred approximately $5.2 million, $5.0 million and $3.0 million in additional income tax expense on our combined operations in our SEZ operations in India, the Philippines and Sri Lanka for fiscal 2017, 2016 and 2015, respectively, if the tax holidays and exemptions as described below had not been available for the respective periods.
We expect our tax rate in India, the Philippines and Sri Lanka to continue to impact our effective tax rate. Our tax rate in India has been impacted by the reduction in the tax exemption enjoyed by our delivery center operating under the SEZ scheme as discussed below.
India
In the past, the majority of our Indian operations were eligible to claim income tax exemption with respect to profits earned from export revenue from operating units registered under the STPI. The benefit was available for a period of 10 years from the date of commencement of operations, but not beyond March 31, 2011. Effective April 1, 2011, upon the expiration of this tax exemption, income derived from our operations in India became subject to the prevailing annual tax rate, which is currently, and was in fiscal 2017 and 2016, 34.61% and was 33.99% in fiscal 2015.
In 2005, the Government of India implemented the SEZ legislation, with the effect that taxable income of new operations established in designated SEZs may be eligible for a15-year tax holiday scheme consisting of a complete tax holiday for the initial five years and a partial tax holiday for the subsequent ten years, subject to the satisfaction of certain capital investment conditions. Our delivery center located in Gurgaon, India and registered under the SEZ scheme is eligible for a 50.0% income tax exemption from fiscal 2013 to fiscal 2022. During fiscal 2012, we also started operations in delivery centers in Pune, Mumbai and Chennai, India registered under the SEZ scheme, which were, prior to fiscal 2017, eligible for a complete tax holiday but commencing fiscal 2017 to fiscal 2026 are eligible for only a 50.0% income tax exemption. During fiscal 2015, we commenced operations at our new delivery centers in Gurgaon and Pune in India which were registered under the SEZ scheme and are eligible for a 100.0% income tax exemption until fiscal 2019, and a 50.0% income tax exemption from fiscal 2020 to fiscal 2029.
The SEZ legislation has been criticized on economic grounds by the International Monetary Fund and the SEZ legislation may be challenged by certainnon-governmental organizations. It is possible that, as a result of such political pressures, the procedure for obtaining benefits under the SEZ legislation may become more onerous, the types of land eligible for SEZ status may be further restricted or the SEZ legislation may be amended or repealed.
101
In addition to these tax holidays, our Indian subsidiaries are also entitled to certain benefits under relevant state legislation and regulations. These benefits include the preferential allotment of land in industrial areas developed by state agencies, incentives for captive power generation, rebates and waivers in relation to payments for transfer of property and registration (including for purchase or lease of premises) and commercial usage of electricity.
Since fiscal 2008, we have become subject to MAT and we have been required to pay additional taxes. The Government of India, pursuant to the Indian Finance Act, 2011, has also levied MAT on the book profits earned by the SEZ units at the prevailing tax rate, which is currently, and was in fiscal 2017 and 2016, 21.34%, and was 20.96% in fiscal 2015. To the extent MAT paid exceeds the actual tax payable on our taxable income, we would be able to offset such MAT credits from tax payable in the succeeding 10 years, subject to the satisfaction of certain conditions. During fiscal 2017, 2016 and 2015, we have offset Nil, $9.2 million and $6.4 million, respectively, of our MAT payments for earlier years from our increased tax liability based on our taxable income following the expiry of our tax holiday on STPI effective fiscal 2012.
The Government of India may enact new tax legislation that could impact the way we are taxed in the future. For example, the Government of India has clarified that, with retrospective effect from April 1, 1962, any income accruing or arising directly or indirectly through the transfer of capital assets situated in India will be taxable in India. If any of our transactions are deemed to involve the direct or indirect transfer of a capital asset located in India, such transactions could be investigated by the Indian tax authorities, which could lead to the issuance of tax assessment orders and a material increase in our tax liability. For example, we received requests for information from, and are in discussions with, the relevant income tax authority in India relating to our acquisition in July 2008 from Aviva of all the shares of Aviva Global, which owned subsidiaries with assets in India and Sri Lanka. The Government of India has issued guidelines on the GAAR which came into effect on April 1, 2017, and which is intended to curb sophisticated tax avoidance. Under the GAAR, a business arrangement will be deemed an “impermissible avoidance arrangement” if the main purpose of the arrangement is to obtain tax benefits. Although the full implications of the GAAR are presently still unclear, if we are deemed to have violated any of its provisions, we may face an increase to our tax liability. However, we do not expect the GAAR to have a material impact on our operations. The Government of India has passed the GST Act, which is expected to be effective from July 1, 2017. Once effective, the majority of the various existing indirect tax levies would be subsumed by the goods and services tax payable under the GST Act. Based on the current GST law and the draft rules, we do not expect a significant impact on our operations. See “Part I — Item 3. Key Information — D. Risk Factors — Risks Related to Key Delivery Locations — New tax legislation and the results of actions by taxing authorities may have an adverse effect on our operations and our overall tax rate.
Philippines
Our subsidiary in the Philippines, WNS Global Services Philippines, Inc. located in Eastwood Avenue, Manila, was eligible to claim income tax exemption with respect to profits earned from export revenue by our delivery centers registered with the Philippines Economic Zone Authority, which expired in fiscal 2016. During fiscal 2013, we started operations in a delivery center in the Philippines located in Techno Plaza II, Manila which was eligible for a tax exemption that expired in fiscal 2017. We intend to apply this year for an extension of this tax exemption until fiscal 2018. During fiscal 2016, we started operations in a delivery center in Iloilo, Manila which is also eligible for a tax exemption that will expire in fiscal 2020. During fiscal 2017, we started operations in additional delivery centers in Iloilo, Manila and Alabang, Philippines which are also eligible for tax exemption that will expire in fiscal 2021. Following the expiry of the tax exemption, income generated by WNS Global Services Philippines, Inc. will be taxed at the prevailing special tax rate, which is currently 5.0% on gross margin.
Sri Lanka
Our operations in Sri Lanka are eligible to claim income tax exemption under the Sri Lanka Inland Revenue Act for the profits earned from export revenue.
Costa Rica
Our subsidiary in Costa Rica is eligible for a 100.0% income tax exemption from fiscal 2010 until fiscal 2017 and a 50.0% income tax exemption from fiscal 2018 to fiscal 2021.
Critical Accounting Policies
The discussion and analysis of our financial condition and results of operations are based on our consolidated financial statements included elsewhere in this annual report which have been prepared in accordance IFRS, as issued by the IASB. Note 2 to our consolidated financial statements included elsewhere in this annual report describes our significant accounting policies and is an essential part of our consolidated financial statements.
We believe the following to be critical accounting policies. By “critical accounting policies,” we mean policies that are both important to the portrayal of our financial condition and financial results and require critical management judgments and estimates. Although we believe that our judgments and estimates are appropriate, actual future results may differ from our estimates.
102
Revenue Recognition
We derive revenue from providing BPM services to our clients, which primarily include providing back office administration, data management, contact center management and automobile claims handling services. We recognize revenue when the significant terms of the arrangement are enforceable, services are being delivered and the collectability is reasonably assured. We recognize revenue on an accrual basis when services are performed and revenue from the end of last billing to the reporting date is recognized as unbilled revenues.
When the terms of the agreement specify service level parameters that must be met, we monitor such service level parameters and determine if there are any service credits or penalties that we need to account for. Revenue is recognized net of any service credits that are due to a client. Generally, our revenue is from large companies, where we do not believe we have a significant credit risk.
We invoice our clients depending on the terms of the arrangement, which include billing based on a per employee basis, a per transaction basis, a fixed price basis, an outcome based basis or other pricing arrangements including cost-plus arrangements. Amounts billed or payments received, where all the conditions for revenue recognition have not been met, are recorded as deferred revenue and are recognized as revenue when all recognition criteria have been met. However, the costs related to the performance of BPM services unrelated to transition services (discussed below) are recognized in the period in which the services are rendered. An upfront payment received towards future services is recognized ratably over the period when such services are provided.
For certain of our clients, we perform transition activities at the outset of entering into a new contract for the provision of BPM services. We have determined these transition activities do not meet the revenue recognition criteria to be accounted for as a separate unit of accounting with stand-alone value separate from theon-going BPM contract. Accordingly, transition revenue and costs are subsequently recognized ratably over the period in which the BPM services are performed. Further, the deferral of costs is limited to the amount of the deferred revenue. Any costs in excess of the deferred transition revenue are recognized in the period it was incurred.
In limited instances, we have entered into minimum commitment arrangements that provide for a minimum revenue commitment on an annual basis or a cumulative basis over multiple years, stated in terms of annual minimum amounts. Where a minimum commitment is specific to an annual period, any revenue shortfall is invoiced and recognized at the end of this period.
Our revenue is net of value-added taxes and includes reimbursements ofout-of-pocket expenses.
We provide automobile claims handling services, which include claims handling and administration (which we refer to as “claims handling”), car hire and arranging for repairs with repair centers across the UK and the related payment processing for such repairs (which we refer to as “repair management”). We also provide legal services in relation to personal injury claims.
We also provide services where motorists involved in accidents were not at fault. Our service offerings include the provision of replacement hire vehicles (which we refer to as “credit hire”), repair management services and claims handling (which we collectively refer to as “accident management”).
With respect to claims handling, we enter into contracts with our clients to process all their claims over the contract period, where the fees are determined either on a per claim basis or a fixed payment for the contract period. Where our contracts are on a per claim basis, we invoice the client at the inception of the claim process. We estimate the processing period for the claims and recognize revenue over the estimated processing period. This processing period generally ranges between one to two months. The processing time may be greater for new clients and the estimated service period is adjusted accordingly. The processing period is estimated based on historical experience and other relevant factors, if any. Where the fee is a fixed payment for the contract period, revenue is recognized on a straight line basis over the period of the contract. In certain cases, where the fee is contingent upon the successful recovery of a claim by the client, revenue is not recognized until the contingency is resolved. Revenue in respect of car hire is recognized over the car hire term.
103
In order to provide repair management services, we arrange for the repair of vehicles involved in an accident through a network of repair centers. The repair costs are invoiced to customers. In determining whether the receipt from the customers related to payments to repair centers should be recognized as revenue, we consider the criteria established by IAS 18,Illustrative example 21 — “Determining whether an entity is acting as a principal or as an agent.” When we determine that we are the principal in providing repair management services, amounts received from customers are recognized and presented as third party revenue and the payments to repair centers are recognized as cost of revenue in the consolidated statement of income.
Factors considered in determining whether we are the principal in the transaction include whether:
| (a) | we have the primary responsibility of providing the services, |
| (b) | we negotiate the labor rates with repair centers, |
| (c) | we are responsible for timely and satisfactory completion of repairs, and |
| (d) | we bear the risk that the customer may not pay for the services provided (credit risk). |
If there are circumstances where the above criteria are not met and therefore we are not the principal in providing repair management services, amounts received from customers are recognized and presented net of payments to repair centers in the consolidated statement of income. Revenue from repair management services is recorded net of the repairer referral fees passed on to customers.
Revenue from legal services is recognized on the admission of liability by the third party to the extent of fixed fees earned at each stage and any further income on the successful settlement of the claim. Incremental and direct costs incurred to contract with a claimant are amortized over the estimated period of provision of services, not exceeding 15 months. All other costs to us are expensed as incurred.
Share-based Compensation
We provide share-based awards such as share options and RSUs to our employees, directors and executive officers through various equity compensation plans. We account for share-based compensation expense relating to share-based payments using a fair-value method in accordance with IFRS 2 “Share-based Payments.” IFRS 2 addresses the accounting for share-based payment transactions in which an enterprise receives employee services in exchange for equity instruments of the enterprise or liabilities that are based on the fair value of the enterprise’s equity instruments or that may be settled by the issuance of such equity instruments.
Equity instruments granted is measured by reference to the fair value of the instrument at the date of grant. The grants vest in a graded manner. Under the fair value method, the estimated fair value of awards is charged to income over the requisite service period, which is generally the vesting period of the award, for each separately vesting portion of the award as if the award was, in substance, multiple awards. We include a forfeiture estimate in the amount of compensation expense being recognized based on our estimate of equity instrument that will eventually vest.
IFRS 2 requires the use of a valuation model to calculate the fair value of share-based awards. Based on our judgment, we have elected to use the Black-Scholes-Merton pricing model to determine the fair value of share-based awards on the date of grant. RSUs are measured based on the fair market value of the underlying shares on the date of grant. Further, each of the 2006 Incentive Award Plan and the 2016 Incentive Award Plan also allows for the grant of RSUs based on the market price of our shares achieving a specified target over a period of time. The fair value of market-based share awards is determined using Monte-Carlo simulation. Certain RSUs based on the market price of our shares were modified to vest on a longer timeframe. The additional cost as a result of such modification in respect of modified share awards amounted to $1.2 million. The additional cost is amortized over the period from the modification date until the vesting date of the modified award, which differ from the vesting date of the original award.
We believe the Black-Scholes-Merton model to be the most appropriate model for determination of fair value of the share-based awards. In determining the fair value of share-based awards using the Black-Scholes-Merton option pricing model, we are required to make certain estimates of the key assumptions that include expected term, expected volatility of our shares, dividend yield and risk free interest rate. Estimating these key assumptions involves judgment regarding subjective future expectations of market prices and trends. The assumptions for expected term and expected volatility have the most significant effect on calculating the fair value of our share options. We use the historical volatility of our ADSs in order to estimate future share price trends. In order to determine the estimated period of time that we expect employees to hold their share-based options, we have used historical exercise pattern of employees. The aforementioned inputs entered into the option valuation model that we use to determine the fair value of our share awards are subjective estimates and changes to these estimates will cause the fair value of our share-based awards and related share-based compensation expense we record to vary.
104
We are required to estimate the share-based awards that we expect to vest and to reduce share-based compensation expense for the effects of estimated forfeitures of awards over the expense recognition period. Although we estimate forfeitures based on historical experience and other factors, actual forfeitures in the future may differ. To the extent our actual forfeitures are different than our estimates, we record atrue-up for the difference in the period in which the awards vest, and suchtrue-ups could materially affect our operating results.
We record deferred tax assets for share-based awards based on the future tax deduction which will be based on our ADS price at the reporting date. If the amount of the future tax deduction exceeds the cumulative amount of share-based compensation expense, the excess deferred tax is directly recognized in equity.
105
Business Combinations, Goodwill and Intangible Assets
Business combinations are accounted for using the acquisition method. The cost of an acquisition is measured at the fair value of the assets transferred, equity instruments issued and liabilities incurred at the date of acquisition. The cost of the acquisition also includes the fair value of any contingent consideration. As a part of acquisition accounting, we allocate the purchase price of acquired companies to the identified tangible and intangible assets based on the estimated fair values on the date of the acquisition. The purchase price allocation process requires management to make significant estimates and assumptions, especially at acquisition date with respect to intangible assets, income taxes, contingent consideration and estimated restructuring liabilities. Although we believe the assumptions and estimates we have made in the past have been reasonable and appropriate, they are based in part on historical experience and information obtained from the management of the acquired companies and are inherently uncertain. Examples of critical estimates in valuing certain of the intangible assets we have acquired or may acquire in the future include but are not limited to appropriate method of valuation, future cash flow projections, weighted average cost of capital, discount rates, risk-free rates, market rate of return and risk premiums.
Unanticipated events and circumstances may occur which may affect the accuracy or validity of such assumptions, estimates or actual results.
Goodwill is initially measured at cost, being the excess of the cost of the acquisition of the acquiree over our share of the net fair value of the acquiree’s identifiable assets, liabilities and contingent liabilities on the date of the acquisition. If the cost of acquisition is less than the fair value of the net assets of the business acquired, the difference is recognized immediately in the income statement. Goodwill is tested for impairment at least annually and when events occur or changes in circumstances indicate that the recoverable amount of the cash generating unit is less than its carrying value. The goodwill impairment test is performed at the level of cash-generating unit or groups of cash-generating units which represent the lowest level at which goodwill is monitored for internal management purposes.
We use market related information and estimates (generally risk adjusted discounted cash flows) to determine the fair values. Cash flow projections take into account past experience and represents management’s best estimate about future developments. Key assumptions on which management has based its determination of fair value less costs of disposal and value in use include estimated growth rates, weighted average cost of capital and tax rates. These estimates, including the methodology used, can have a material impact on the respective values and ultimately the amount of any goodwill impairment. See also the discussion on impairment testing under “—Impairment of Goodwill and Intangible Assets” below.
Intangible assets are recognized only when it is probable that the expected future economic benefits attributable to the assets will accrue to us and the cost can be reliably measured. Intangible assets acquired separately are measured on initial recognition at cost. The cost of intangible assets acquired in a business combination is its fair value as at the date of acquisition determined using generally accepted valuation methods appropriate for the type of intangible asset. Following initial recognition, intangible assets are carried at cost less any accumulated amortization and any accumulated impairment losses. Intangible assets with finite lives are amortized over the estimated useful life and assessed for impairment whenever there is an indication that the intangible asset may be impaired. The amortization of an intangible asset with a finite useful life reflects the manner in which the economic benefit is expected to be generated and consumed. These estimates are reviewed at least at each financial year end. Intangible assets with indefinite lives are not amortized, but instead are tested for impairment at least annually and written down to the fair value as required. See also the discussion on impairment testing under “— Impairment of Goodwill and Intangible Assets” below.
Impairment of Goodwill and Intangible Assets
Goodwill is not subject to amortization and is instead tested annually for impairment and whenever events or changes in circumstances indicate that the carrying amount may not be recoverable. Intangible assets that are subject to amortization are reviewed for impairment whenever events or changes in circumstances indicate that the carrying amount may not be recoverable. An impairment loss is recognized for the amount by which the asset’s carrying amount exceeds its recoverable amount. The recoverable amount is the higher of an asset’s fair value less costs of disposal and value in use. For the purposes of assessing impairment, assets are grouped at the cash generating unit level, which is the lowest level for which there are separately identifiable cash flows. Impairment losses recognized in respect of cash generating units are allocated first to reduce the carrying amount of any goodwill allocated to the cash generating units (or group of cash generating units) and then, to reduce the carrying amount of the other assets in the cash generating unit (or group of cash generating units) on a pro rata basis. Intangible assets that suffered impairment are reviewed for possible reversal of the impairment at each reporting date.
106
An impairment loss is recognized for the amount by which an asset’s or cash-generating unit’s carrying amount exceeds its recoverable amount. To determine the value in use, management estimates expected future cash flows from each asset or cash-generating unit and determines a suitable interest rate in order to calculate the present value of those cash flows. In the process of measuring expected future cash flows management makes assumptions about future operating results. These assumptions relate to future events and circumstances. In arriving at our forecasts, we consider past experience, economic trends including underlying current dynamics of the business and inflation as well as industry and market trends. The projections also take into account factors such as the expected impact from new client contracts and expansion of business from existing clients, efficiency initiatives, and the maturity of the markets in which each business operates. To determine the fair value less costs of disposal the management uses Level 3 inputs under the “Income Approach — Discounted Cash Flow Analysis” method. See note 9 to our consolidated financial statements included elsewhere in this annual report. The actual results of recoverable amount may vary, and may cause significant adjustments to our assets within the next financial year. The calculation of impairment loss involves significant estimates and assumptions which include revenue and earnings multiples, inputs used by market participants, growth rates and net margins used to calculate projected future cash flows, risk-adjusted discount rate, and future economic and market conditions.
107
In most cases, determining the applicable discount rate involves estimating the appropriate adjustment to market risk and the appropriate adjustment to asset-specific risk factors.
We cannot predict the occurrence of future events that might adversely affect the reported value of goodwill, intangible assets. Such events include, but are not limited to, strategic decisions made in response to economic and competitive conditions, the impact of the environment on our customer base, and material negative changes in relationships with significant customers.
Income Taxes
Income tax comprises current and deferred tax. Income tax expense is recognized in statements of income except to the extent it relates to items directly recognized in equity, in which case it is recognized in equity.
Current Income Tax
As part of the process of preparing our consolidated financial statements, we are required to estimate our income taxes in each of the jurisdictions in which we operate. We are subject to tax assessments in each of these jurisdictions. Current income taxes for the current and prior periods are measured at the amount expected to be recovered from or paid to the taxation authorities based on the taxable profit for the period. The tax rates and tax laws used to compute the amount are those that are enacted or substantively enacted by the reporting date and applicable for the period. We offset current tax assets and current tax liabilities, where we have a legally enforceable right to set off the recognized amounts and where we intend either to settle on a net basis, or to realize the asset and liability simultaneously.
Significant judgments are involved in determining the provision for income taxes including judgment on whether tax positions are probable of being sustained in tax assessments. A tax assessment can involve complex issues, which can only be resolved over extended time periods. The recognition of taxes that are subject to certain legal or economic limits or uncertainties is assessed individually by management based on the specific facts and circumstances. Though we have considered all these issues in estimating our income taxes, there could be an unfavorable resolution of such issues that may affect results of our operations.
Deferred Income Tax
We recognize deferred income tax using the balance sheet approach. Deferred income tax assets and liabilities are recognized for all deductible temporary differences arising between the tax bases of assets and liabilities and their carrying amount in financial statements, except when the deferred income tax arises from the initial recognition of goodwill or an asset or liability in a transaction that is not a business combination and affects neither accounting nor taxable profits or loss at the time of transaction.
Deferred income tax assets and liabilities are measured at the tax rates that are expected to apply in the period when the asset is realized or the liability is settled, based on tax rates (and tax laws) that have been enacted or substantively enacted at the reporting date.
Deferred income tax asset in respect of carry forward of unused tax credits and unused tax losses are recognized to the extent that it is probable that taxable profit will be available against which the deductible temporary differences, and the carry forward of unused tax credits and unused tax losses can be utilized.
The carrying amount of deferred income tax assets is reviewed at each reporting date and reduced to the extent that it is no longer probable that sufficient taxable profit will be available to allow all or part of the deferred income tax asset to be utilized.
The measurement of deferred tax assets involves judgment regarding the deductibility of costs not yet subject to taxation and estimates regarding sufficient future taxable income to enable utilization of unused tax losses in different tax jurisdictions. We consider the expected reversal of deferred tax assets and projected future taxable income in making this assessment. All deferred tax assets are subject to review of probable utilization. The assessment of the probability of future taxable profit in various years in which deferred tax assets can be utilized is based on the latest approved budget forecast, which is adjusted for significantnon-taxable profit and expenses and specific limits to the use of any unused tax loss or credit. The tax rules in the various jurisdictions in which we operate are also carefully taken into consideration. If a positive forecast of taxable profit indicates the probable use of a deferred tax asset, especially when it can be utilized without a time limit, that deferred tax asset is usually recognized in full. The recognition of deferred tax assets that are subject to certain legal or economic limits or uncertainties is assessed individually by management based on the specific facts and circumstances.
We recognize deferred tax liabilities for all taxable temporary differences, except those associated with investments in subsidiaries and associates where the timing of the reversal of the temporary difference can be controlled and it is probable that the temporary difference will not reverse in the foreseeable future.
108
As part of our accounting for business combinations, some of the purchase price is allocated to goodwill and intangible assets. Impairment charges associated with goodwill are generally not tax deductible and will result in an increased effective income tax rate in the quarter any impairment is recorded. Amortization expenses associated with acquired intangible assets are generally not tax deductible pursuant to our existing tax structure; however, deferred taxes have been recorded fornon-deductible amortization expenses as a part of the purchase price allocation process. We have taken into account the allocation of these identified intangibles among different taxing jurisdictions, including those with nominal or zero percent tax rates, in establishing the related deferred tax liabilities. Income tax contingencies existing as of the acquisition dates of the acquired companies are evaluated quarterly and any adjustments are recorded as adjustments to goodwill during the measurement period.
Uncertainties in income taxes are not addressed specifically in IAS12 “Income Taxes” and hence the general measurement principles in IAS12 are applied in measuring the uncertain tax positions. Uncertain tax positions are reflected at the amount likely to be paid to the taxation authorities. A liability is recognized in connection with each item that is not probable of being sustained on examination by taxing authority. The liability is measured using single best estimate of the most likely outcome for each position taken in the tax return. Thus the provision would be the aggregate liability in connection with all uncertain tax positions. We also include interest related to such uncertain tax positions within our provision for income tax expense.
Evaluation of tax positions and recognition of provisions, as discussed above, involves interpretation of tax laws, estimates of probabilities of tax positions being sustained and the amounts of payments to be made under various scenarios. Although we believe we are adequately reserved for our unresolved disputes with the taxation authorities, no assurance can be given with respect to the final outcome on these matters. To the extent that the final outcome on these matters is different than the amounts recorded, such differences will impact our provision for income taxes in the period in which such a determination is made.
109
Derivative Financial Instruments and Hedge Accounting
We are exposed to foreign currency fluctuations on foreign currency assets, liabilities, net investment in foreign operations, forecasted cash flows denominated in foreign currency and fluctuation in interest rates. We limit the effect of foreign exchange rate fluctuation by following established risk management policies including the use of derivatives. We enter into derivative financial instruments where the counter party is a bank. We use derivative financial instruments such as foreign exchange forward, option contracts, currency swaps and interest rate swaps to hedge certain foreign currency and interest rate exposures. Forward and option contracts on various foreign currencies are entered into to manage the foreign currency exchange rate risk on forecasted transactions denominated in foreign currencies and monetary assets and liabilities held innon-functional currencies. Interest rate swaps are entered into to manage interest rate risk associated with floating rate borrowings. Our primary exchange rate exposures are with the US dollar or the pound sterling against the Indian rupee.
Cash Flow Hedges
We recognize derivative instruments as either assets or liabilities in the statement of financial position at fair value. Derivative instruments qualify for hedge accounting when the instrument is designated as a hedge; the hedged item is specifically identifiable and exposes us to risk; and it is expected that a change in fair value of the derivative instrument and an opposite change in the fair value of the hedged item will have a high degree of correlation. Determining that there is a high degree of correlation between the change in fair value of the hedged item and the derivative instruments involves significant judgment including the probability of the occurrence of the forecasted transaction. Although our estimates of the forecasted transactions are based on historical experience and we believe that they are reasonable, the final occurrence of such transactions could be different as a result of external factors such as industry and economic trends, and internal factors such as changes in our business strategy and our internal forecasts, which will have a material effect on our earnings.
For derivative instruments where hedge accounting is applied, we record the effective portion of derivative instruments that are designated as cash flow hedges in other comprehensive income (loss) in the statement of comprehensive income, which is reclassified into earnings in the same period during which the hedged item affects earnings. The remaining gain or loss on the derivative instrument in excess of the cumulative change in the present value of future cash flows of the hedged item, if any (i.e., the ineffective portion) or hedge components excluded from the assessment of effectiveness, and changes in fair value of other derivative instruments not designated as qualifying hedges is recorded as gains/losses, net in the consolidated statement of income. Gains / losses on cash flow hedges on intercompany forecasted revenue transactions are recorded in foreign exchange gains/losses and cash flow hedge on interest rate swaps are recorded in finance expense. Cash flows from the derivative instruments are classified within cash flows from operating activities in the statement of cash flows.
Fair Value Measurements
IFRS 13 “Fair Value Measurements” (“IFRS 13”) defines fair value as the amount for which an asset could be exchanged, or a liability settled, between knowledgeable, willing parties in an arm’s length transaction. The fair value of financial instruments that are traded in active markets at each reporting date is determined by reference to quoted market prices or dealer price quotations, without any deduction for transaction costs. For financial instruments not traded in an active market, the fair value is determined using appropriate valuation models. Where applicable, these models project future cash flows and discount the future amounts to a present value using market-based observable inputs including interest rate curves, credit risk, foreign exchange rates, and forward and spot prices for currencies.
IFRS 7 “Financial Instruments: Disclosures” also requires the classification of fair value measurements using fair value hierarchy that reflects the significance of the inputs used in making the measurements as below:
Level 1 — quoted prices (unadjusted) in active markets for identical assets or liabilities;
Level 2 — other techniques for which all inputs which have a significant effect on the recorded fair value are observable, either directly or indirectly; and
Level 3 — techniques which use inputs which have a significant effect on the recorded fair value that are not based on observable market data.
The fair value is estimated using the discounted cash flow approach and market rates of interest. The valuation technique involves assumptions and judgments regarding risk characteristics of the instruments, discount rates and future cash flows.
Management uses valuation techniques in measuring the fair value of financial instruments, where active market quotes are not available. In applying the valuation techniques, management makes maximum use of market inputs, and uses estimates and assumptions that are, as far as possible, consistent with observable data that market participants would use in pricing the instrument. Where applicable data is not observable, management uses its best estimate about the assumptions that market participants would make. These estimates may vary from the actual prices that would be achieved in an arm’s length transaction at the reporting date.
110
Other Estimates
Allowance for Doubtful Accounts
We make estimates of the uncollectability of our accounts receivable based on historical trends and other factors such as ageing and economic trends. Adverse economic conditions or other factors that might cause deterioration of the financial health of customers could change the timing and levels of payments received and necessitate a change in estimated losses.
Accounting for Defined Benefit Plans
In accounting for pension and post-retirement benefits, several statistical and other factors that attempt to anticipate future events are used to calculate plan expenses and liabilities. These factors include expected return on plan assets, discount rate assumptions and rate of future compensation increases. To estimate these factors, actuarial consultants also use estimates such as withdrawal, turnover, and mortality rates which require significant judgment. The actuarial assumptions used by us may differ materially from actual results in future periods due to changing market and economic conditions, regulatory events, judicial rulings, higher or lower withdrawal rates, or longer or shorter participant life spans.
Results of Operations
The following table sets forth certain financial information as a percentage of revenue and revenue less repair payments(non-GAAP) for the periods indicated:
| | | | | | | | | | | | | | | | | | | | | | | | |
| | | As a percentage of | |
| | | Revenue | | | Revenue less repair payments
(non-GAAP) | |
| | | Year ended March 31, | | | Year ended March 31, | |
| | | 2017 | | | 2016 | | | 2015 | | | 2017 | | | 2016 | | | 2015 | |
Cost of revenue | | | 66.9 | % | | | 65.0 | % | | | 64.2 | % | | | 65.6 | % | | | 62.9 | % | | | 62.0 | % |
Gross profit | | | 33.1 | % | | | 35.0 | % | | | 35.8 | % | | | 34.4 | % | | | 37.1 | % | | | 38.0 | % |
Operating expenses: | | | | | | | | | | | | | | | | | | | | | | | | |
Selling and marketing expenses | | | 5.4 | % | | | 5.5 | % | | | 5.8 | % | | | 5.6 | % | | | 5.8 | % | | | 6.2 | % |
General and administrative expenses | | | 15.2 | % | | | 14.0 | % | | | 13.1 | % | | | 15.9 | % | | | 14.9 | % | | | 13.9 | % |
Foreign exchange loss / (gains), net | | | (2.4 | )% | | | (2.0 | )% | | | (0.9 | )% | | | (2.5 | )% | | | (2.1 | )% | | | (0.9 | )% |
Impairment of goodwill | | | 3.6 | % | | | — | | | | — | | | | 3.7 | % | | | — | | | | — | |
Amortization of intangible assets | | | 3.4 | % | | | 4.5 | % | | | 4.5 | % | | | 3.6 | % | | | 4.7 | % | | | 4.8 | % |
Operating profit | | | 7.8 | % | | | 13.0 | % | | | 13.2 | % | | | 8.2 | % | | | 13.7 | % | | | 14.0 | % |
Other (income) / expense, net | | | (1.4 | )% | | | (1.5 | )% | | | (2.2 | )% | | | (1.5 | )% | | | (1.6 | )% | | | (2.4 | )% |
Finance expense | | | 0.1 | % | | | 0.0 | % | | | 0.2 | % | | | 0.1 | % | | | 0.1 | % | | | 0.3 | % |
Provision for income taxes | | | 2.9 | % | | | 3.8 | % | | | 4.2 | % | | | 3.0 | % | | | 4.0 | % | | | 4.5 | % |
Profit | | | 6.3 | % | | | 10.7 | % | | | 11.0 | % | | | 6.5 | % | | | 11.3 | % | | | 11.7 | % |
The following table reconciles revenue (a GAAP financial measure) to revenue less repair payments (anon-GAAP financial measure) and sets forth payments to repair centers and revenue less repair payments(non-GAAP) as a percentage of revenue for the periods indicated:
| | | | | | | | | | | | | | | | | | | | | | | | |
| | | Year ended March 31, | |
| | | 2017 | | | 2016 | | | 2015 | | | 2017 | | | 2016 | | | 2015 | |
| | | (US dollars in millions) | | | | | | | | | | |
Revenue | | $ | 602.5 | | | $ | 562.2 | | | $ | 533.9 | | | | 100.0 | % | | | 100 | % | | | 100.0 | % |
Less: Payments to repair centers | | | 24.1 | | | | 31.2 | | | | 30.9 | | | | 4.0 | % | | | 5.5 | % | | | 5.8 | % |
| | | | | | | | | | | | | | | | | | | | | | | | |
Revenue less repair payments(non-GAAP) | | $ | 578.4 | | | $ | 531.0 | | | $ | 503.0 | | | | 96.0 | % | | | 94.5 | % | | | 94.2 | % |
| | | | | | | | | | | | | | | | | | | | | | | | |
111
The following table presents our results of operations for the periods indicated:
| | | | | | | | | | | | |
| | | Year ended March 31, | |
| | | 2017 | | | 2016 | | | 2015 | |
| | | (US dollars in millions) | |
Revenue | | $ | 602.5 | | | $ | 562.2 | | | $ | 533.9 | |
Cost of revenue(1) | | | 403.3 | | | | 365.4 | | | | 342.7 | |
| | | | | | | | | | | | |
Gross profit | | | 199.2 | | | | 196.8 | | | | 191.2 | |
Operating expenses: | | | | | | | | | | | | |
Selling and marketing expenses(2) | | | 32.6 | | | | 30.8 | | | | 31.1 | |
General and administrative expenses(3) | | | 91.7 | | | | 78.9 | | | | 70.0 | |
Foreign exchange loss / (gains), net | | | (14.5 | ) | | | (11.0 | ) | | | (4.6 | ) |
Impairment of goodwill | | | 21.7 | | | | — | | | | — | |
Amortization of intangible assets | | | 20.5 | | | | 25.2 | | | | 24.2 | |
| | | | | | | | | | | | |
Operating profit | | | 47.2 | | | | 72.8 | | | | 70.5 | |
Other income, net | | | (8.7 | ) | | | (8.5 | ) | | | (11.9 | ) |
Finance expense | | | 0.5 | | | | 0.3 | | | | 1.3 | |
| | | | | | | | | | | | |
Profit before income taxes | | | 55.3 | | | | 81.1 | | | | 81.0 | |
Provision for income taxes | | | 17.5 | | | | 21.2 | | | | 22.4 | |
| | | | | | | | | | | | |
Profit | | $ | 37.8 | | | $ | 59.9 | | | $ | 58.6 | |
| | | | | | | | | | | | |
Notes:
| (1) | Includes share-based compensation expense of $2.8 million for fiscal 2017, $1.9 million for fiscal 2016 and $0.9 million for fiscal 2015. |
| (2) | Includes share-based compensation expense of $1.7 million for fiscal 2017, $1.4 million for fiscal 2016 and $0.8 million for fiscal 2015. |
| (3) | Includes share-based compensation expense of $18.5 million for fiscal 2017, $14.6 million for fiscal 2016 and $7.9 million for fiscal 2015. |
112
Fiscal 2017 Compared to Fiscal 2016
The following table sets forth our revenue and percentage change in revenue for the periods indicated:
Revenue
| | | | | | | | | | | | | | | | |
| | | Year ended March 31, | | | | | | | |
| | | 2017 | | | 2016 | | | Change | | | % Change | |
| | | (US dollars in millions) | | | | |
Revenue | | $ | 602.5 | | | $ | 562.2 | | | $ | 40.4 | | | | 7.2 | % |
The increase in revenue of $40.4 million was primarily attributable to (i) revenue from new clients of $35.8 million including revenue from clients of acquired businesses during fiscal 2017, (ii) an increase in revenue from existing clients of $4.1 million, and (iii) an increase in hedging gain on our revenue by $0.4 million to $6.8 million in fiscal 2017 from $6.4 million in fiscal 2016. The increase in revenue was primarily due to higher volumes in our diversified businesses, travel, healthcare, and shipping and logistics verticals. The increase in revenue was partially offset by the impact of a lower volume of business from one of our top five clients by revenue contribution in fiscal 2016, and lower volumes in our banking and financial services, insurance, and consulting and professional services verticals. The increase was also partially offset by a depreciation of the pound sterling and South African rand by an average of 13.4% and 2.3%, respectively, against the US dollar, as compared to the respective average exchange rates in fiscal 2016.
Revenue by Geography
The following table sets forth the composition of our revenue based on the location of our clients in our key geographies for the periods indicated:
| | | | | | | | | | | | | | | | |
| | | Revenue | | | As a percentage of
Revenue | |
| | | Year ended March 31, | |
| | | 2017 | | | 2016 | | | 2017 | | | 2016 | |
| | | (US dollars in millions) | | | | | | | |
UK | | $ | 248.6 | | | $ | 264.9 | | | | 41.3 | % | | | 47.1 | % |
North America (primarily the US) | | | 196.2 | | | | 155.3 | | | | 32.6 | % | | | 27.6 | % |
Australia | | | 49.1 | | | | 40.3 | | | | 8.1 | % | | | 7.2 | % |
South Africa | | | 42.7 | | | | 30.1 | | | | 7.1 | % | | | 5.4 | % |
Europe (excluding the UK) | | | 37.5 | | | | 34.7 | | | | 6.2 | % | | | 6.2 | % |
Rest of world | | | 28.5 | | | | 36.8 | | | | 4.7 | % | | | 6.5 | % |
| | | | | | | | | | | | | | | | |
Total | | $ | 602.5 | | | $ | 562.2 | | | | 100.0 | % | | | 100.0 | % |
| | | | | | | | | | | | | | | | |
The increase in revenue in North America (primarily the US) was primarily driven by higher volumes in our travel, diversified businesses, healthcare, consulting and professional services, shipping and logistics, banking and financial services and utilities verticals and revenues from clients of businesses acquired in fiscal 2017. The increase in revenue from the South Africa region was primarily attributable to higher volumes in our diversified businesses and utilities verticals, partially offset by lower volumes in our banking and financial services, and travel vertical. The increase in revenue from the Australia region was primarily attributable to higher volumes in our insurance, travel, and shipping and logistics verticals, partially offset by a lower volume in our utilities vertical. The increase in revenue from the Europe (excluding the UK) region was primarily attributable to higher volumes in our healthcare and travel verticals, partially offset by a lower volume in our insurance vertical. The decrease in revenue from the UK region was primarily attributable to lower volumes in our insurance, consulting and professional services, travel, and utilities verticals, partially offset by higher volumes in our healthcare, diversified businesses, and banking and financial services verticals. The decrease in revenue from the Rest of world region was primarily attributable to lower volumes in our banking and financial services, travel, and diversified businesses verticals, partially offset by a higher volume in our insurance vertical.
Revenue Less Repair Payments(non-GAAP)
The following table sets forth our revenue less repair payments(non-GAAP) and percentage change in revenue less repair payments(non-GAAP) for the periods indicated:
| | | | | | | | | | | | | | | | |
| | | Year ended March 31, | | | | | | | |
| | | 2017 | | | 2016 | | | Change | | | % Change | |
| | | (US dollars in million) | | | | |
Revenue less repair payments(non-GAAP) | | $ | 578.4 | | | $ | 531.0 | | | $ | 47.4 | | | | 8.9 | % |
113
The increase in revenue less repair payments(non-GAAP) of $47.4 million was primarily attributable to (i) revenue less repair payments(non-GAAP) from new clients of $35.0 million, including revenue from clients of acquired businesses during fiscal 2017, (ii) an increase in revenue less repair payments(non-GAAP) from existing clients of $12.0 million, and (iii) an increase in hedging gain on our revenue less repair payments(non-GAAP) by 0.4 million to $6.8 million in fiscal 2017 from $6.4 million in fiscal 2016. The increase in revenue was primarily due to higher volumes in our diversified businesses, travel, healthcare, shipping and logistics, and insurance verticals. The increase in revenue was partially offset by the impact of a lower volume of business from one of our top five clients by revenue contribution in fiscal 2016, and lower volumes in our banking and financial services, and consulting and professional services verticals. The increase was also partially offset by a depreciation of the pound sterling and South African rand by an average of 13.4% and 2.3%, respectively, against the US dollar, as compared to the respective average exchange rates in fiscal 2016.
Revenue Less Repair Payments(non-GAAP) by Geography
The following table sets forth the composition of our revenue less repair payments(non-GAAP) based on the location of our clients in our key geographies for the periods indicated:
| | | | | | | | | | | | | | | | |
| | | Revenue less repair payments
(non-GAAP) | | | As a percentage of
revenue less repair
payments (non-GAAP) | |
| | | Year ended March 31, | |
| | | 2017 | | | 2016 | | | 2017 | | | 2016 | |
| | | (US dollars in millions) | | | | | | | |
UK | | $ | 224.5 | | | $ | 233.7 | | | | 38.8 | % | | | 44.0 | % |
North America (primarily the US) | | | 196.2 | | | | 155.3 | | | | 33.9 | % | | | 29.3 | % |
Australia | | | 49.1 | | | | 40.3 | | | | 8.5 | % | | | 7.6 | % |
South Africa | | | 42.7 | | | | 30.1 | | | | 7.4 | % | | | 5.7 | % |
Europe (excluding the UK) | | | 37.5 | | | | 34.7 | | | | 6.5 | % | | | 6.5 | % |
Rest of world | | | 28.5 | | | | 36.8 | | | | 4.9 | % | | | 6.9 | % |
| | | | | | | | | | | | | | | | |
Total | | $ | 578.4 | | | $ | 531.0 | | | | 100 | % | | | 100 | % |
| | | | | | | | | | | | | | | | |
The increase in revenue less repair payments(non-GAAP) in North America (primarily the US) was primarily driven by higher volumes in our travel, diversified businesses, healthcare, consulting and professional services, shipping and logistics, banking and financial services, utilities verticals and revenues from clients of businesses acquired in fiscal 2017. The increase in revenue less repair payments(non-GAAP) from the South Africa region was primarily attributable to higher volumes in our diversified businesses and utilities verticals, partially offset by lower volumes in our banking and financial services, and travel vertical. The increase in revenue less repair payments(non-GAAP) from the Australia region was primarily attributable to higher volumes in our insurance, travel, and shipping and logistics verticals, partially offset by a lower volume in our utilities vertical. The increase in revenue less repair payments(non-GAAP) from the Europe (excluding the UK) region was primarily attributable to higher volumes in our healthcare and travel verticals, partially offset by a lower volume in our insurance vertical. The decrease in revenue less repair payments(non-GAAP) from the UK region was primarily attributable to lower volumes in our insurance, consulting and professional services, travel, and utilities verticals, partially offset by higher volumes in our healthcare, diversified businesses, and banking and financial services verticals. The decrease in revenue less repair payments(non-GAAP) from the Rest of world region was primarily attributable to lower volumes in our banking and financial services, travel, and diversified businesses verticals, partially offset by a higher volume in our insurance vertical.
Cost of Revenue
The following table sets forth the composition of our cost of revenue for the periods indicated:
| | | | | | | | | | | | |
| | | Year ended March 31, | | | | |
| | | 2017 | | | 2016 | | | Change | |
| | | (US dollars in millions) | |
Employee costs | | $ | 249.7 | | | $ | 217.1 | | | $ | 32.6 | |
Facilities costs | | | 72.6 | | | | 64.8 | | | | 7.7 | |
Repair payments | | | 24.1 | | | | 31.2 | | | | (7.1 | ) |
Depreciation | | | 16.4 | | | | 14.9 | | | | 1.5 | |
Travel costs | | | 10.6 | | | | 10.3 | | | | 0.2 | |
Legal and professional costs | | | 6.5 | | | | 7.0 | | | | (0.5 | ) |
Other costs | | | 23.4 | | | | 20.0 | | | | 3.4 | |
| | | | | | | | | | | | |
Total cost of revenue | | $ | 403.3 | | | $ | 365.4 | | | $ | 38.0 | |
| | | | | | | | | | | | |
As a percentage of revenue | | | 66.9 | % | | | 65.0 | % | | | | |
114
The increase in cost of revenue was primarily due to higher employee cost on account of higher headcount (including headcount of businesses acquired during fiscal 2017), wage inflation, an increase in share-based compensation expense; higher facilities costs; increase in subcontracting costs; and higher depreciation costs. These increases were partially offset by lower repair payments; and lower legal and professional costs. Further, the depreciation of the Indian rupee and South African rand against the US dollar by an average of 2.6% and 2.3%, respectively, in fiscal 2017, as compared to the average exchange rate in fiscal 2016, resulted in a decrease of approximately $6.0 million in the cost of revenue.
Gross Profit
The following table sets forth our gross profit for the periods indicated:
| | | | | | | | | | | | |
| | | Year ended March 31, | | | | |
| | | 2017 | | | 2016 | | | Change | |
| | | (US dollars in millions) | |
Gross profit | | $ | 199.2 | | | $ | 196.8 | | | $ | 2.4 | |
As a percentage of revenue | | | 33.1 | % | | | 35.0 | % | | | | |
As a percentage of revenue less repair payments(non-GAAP) | | | 34.4 | % | | | 37.1 | % | | | | |
Gross profit as a percentage of revenue and revenue less repair payments(non-GAAP) decreased primarily due to higher cost of revenue as discussed above. Cost of revenue was higher notwithstanding the depreciation of the Indian rupee and South African rand against the US dollar by an average of 2.6% and 2.3%, respectively, in fiscal 2017, as compared to the average exchange rate for fiscal 2016. This increase in cost of revenue was partially offset by higher revenue, and an increase in hedging gain on our revenue by $0.4 million to $6.8 million in fiscal 2017 from $6.4 million in fiscal 2016.
During fiscal 2017, our built up seats increased by 6.1% from 26,407 as at the end of fiscal 2016 to 28,008 as at the end of fiscal 2017 as we expanded our existing facility in Gurgaon, India, and added new facilities in South Africa. Our expansion of the facility in Gurgaon was part of our strategy to expand our delivery capabilities, including in the SEZ in India. Further, we added new facilities in Pune and Noida, India, Turkey and the US due to our acquisitions of Value Edge, Denali and HealthHelp during fiscal 2017. Our total headcount increased by 4.9% from 32,388 to 33,968 during the same period, resulting in an increase in our seat utilization rate from 1.21 in fiscal 2016 to 1.22 in fiscal 2017. This 0.01 increase in our seat utilization rate increased our gross profit as a percentage of revenue by approximately 0.08% and increased our gross profit as a percentage of revenue less repair payments(non-GAAP) by approximately 0.09%.
Selling and Marketing Expenses
The following table sets forth the composition of our selling and marketing expenses for the periods indicated:
| | | | | | | | | | | | |
| | | Year ended March 31, | | | | |
| | | 2017 | | | 2016 | | | Change | |
| | | (US dollars in millions) | |
Employee costs | | $ | 24.7 | | | $ | 22.3 | | | $ | 2.4 | |
Other costs | | | 7.9 | | | | 8.5 | | | | (0.6 | ) |
| | | | | | | | | | | | |
Total selling and marketing expenses | | $ | 32.6 | | | $ | 30.8 | | | $ | 1.8 | |
| | | | | | | | | | | | |
As a percentage of revenue | | | 5.4 | % | | | 5.5 | % | | | | |
As a percentage of revenue less repair payments(non-GAAP) | | | 5.6 | % | | | 5.8 | % | | | | |
The increase in selling and marketing expenses was primarily due to an increase in employee costs as a result of an increase in sales headcount and wage inflation, and higher travel cost, partially offset by lower marketing costs. Further, the depreciation of the pound sterling against the US dollar by an average of 13.4% in fiscal 2017, as compared to the average exchange rate for fiscal 2016, resulted in a decrease of approximately of $1.4 million of selling and marketing expenses. Our selling and marketing expenses also increased as a result of our acquisitions during fiscal 2017.
115
General and Administrative Expenses
The following table sets forth the composition of our general and administrative expenses for the periods indicated:
| | | | | | | | | | | | |
| | | Year ended March 31, | | | | |
| | | 2017 | | | 2016 | | | Change | |
| | | (US dollars in millions) | |
Employee costs | | $ | 68.9 | | | $ | 60.1 | | | $ | 8.8 | |
Other costs | | | 22.8 | | | | 18.8 | | | | 4.1 | |
| | | | | | | | | | | | |
Total general and administrative expenses | | $ | 91.7 | | | $ | 78.9 | | | $ | 12.8 | |
| | | | | | | | | | | | |
As a percentage of revenue | | | 15.2 | % | | | 14.0 | % | | | | |
As a percentage of revenue less repair payments(non-GAAP) | | | 15.9 | % | | | 14.9 | % | | | | |
The increase in general and administrative expenses was primarily due to an increase in employee costs as a result of higher salaries on account of a higher headcount, wage inflation and higher share-based compensation expenses primarily due to an increase in grant date fair value of RSUs; higher legal and professional expenses (including costs related to our acquisitions) and higher other costs. Further, the depreciation of the Indian rupee and South African rand against the US dollar by an average of 2.6% and 2.3%, respectively, for fiscal 2017, as compared to the respective average exchange rates for fiscal 2016, resulted in a decrease of approximately $1.1 million in general and administrative expenses.
Foreign Exchange Loss / (Gains), Net
The following table sets forth our foreign exchange loss / (gains), net for the periods indicated:
| | | | | | | | | | | | |
| | | Year ended March 31, | | | | |
| | | 2017 | | | 2016 | | | Change | |
| | | (US dollars in millions) | |
Foreign exchange loss / (gains), net | | $ | (14.5 | ) | | $ | (11.0 | ) | | $ | (3.5 | ) |
The foreign exchange gains were higher primarily due to higher gains of $2.8 million from our rupee and pound denominated hedge contracts as a result of a depreciation of the pound sterling against the US dollar, and a higher foreign currency revaluation gain of $0.8 million arising from a $3.9 million gain in fiscal 2017 compared to a gain of $3.1 million in fiscal 2016. We expect our foreign exchange gains to be higher in fiscal 2018 as compared to fiscal 2017, based on our current hedge positions and exchange rates.
Impairment of Goodwill
| | | | | | | | | | | | |
| | | Year ended March 31, | | | | |
| | | 2017 | | | 2016 | | | Change | |
| | | (US dollars in millions) | |
Impairment of Goodwill | | $ | 21.7 | | | $ | 0.0 | | | $ | 21.7 | |
During the fourth quarter of fiscal 2017, proposed changes to the laws of the UK governing personal injury claims generated uncertainty regarding the future earnings trajectory of our legal services business in our WNS Auto Claims BPM segment, as a result of which we expect that we will eventually exit from providing legal services in relation to personal injury claims. We have also experienced a decrease in volume of and loss of business from certain clients of our traditional repair services in our WNS Auto Claims BPM segment. As a result, we expect the future performance of our WNS Auto Claims BPM segment to decline significantly and we have therefore significantly reduced our financial projections and estimates of our WNS Auto Claims BPM segment. We performed an impairment review of the goodwill associated with the companies we had acquired for our auto claims business and recorded an impairment charge of $21.7 million to our results of operations for fiscal 2017.
116
Amortization of Intangible Assets
The following table sets forth our amortization of intangible assets for the periods indicated:
| | | | | | | | | | | | |
| | | Year ended March 31, | | | | |
| | | 2017 | | | 2016 | | | Change | |
| | | (US dollars in millions) | |
Amortization of intangible assets | | $ | 20.5 | | | $ | 25.2 | | | $ | (4.7 | ) |
The decrease in amortization of intangible assets was primarily attributable to the completion of amortization in November 2016 of intangible assets associated with our acquisition of Aviva Global made in July 2008, partially offset by the amortization of intangible assets arising out of our acquisitions of Value Edge, Denali and HealthHelp in fiscal 2017, and depreciation of the Indian rupee and South African rand against the US dollar by an average of 2.6% and 2.3%, respectively, in fiscal 2017, as compared to the respective average exchange rates in fiscal 2016.
Operating Profit
The following table sets forth our operating profit for the periods indicated:
| | | | | | | | | | | | |
| | | Year ended March 31, | | | | |
| | | 2017 | | | 2016 | | | Change | |
| | | (US dollars in millions) | |
Operating profit | | $ | 47.2 | | | $ | 72.8 | | | $ | (25.7 | ) |
As a percentage of revenue | | | 7.8 | % | | | 13.0 | % | | | | |
As a percentage of revenue less repair payments(non-GAAP) | | | 8.2 | % | | | 13.7 | % | | | | |
Operating profit as a percentage of revenue and revenue less repair payments(non-GAAP) is lower due to higher cost of revenue, impairment of goodwill accounted in fiscal 2017 and higher general and administrative expenses, partially offset by higher revenue, lower selling and marketing expenses, higher foreign exchanges gains and lower amortization expenses.
117
Other income, net
The following table sets forth our other income, net for the periods indicated:
| | | | | | | | | | | | |
| | | Year ended March 31, | | | | |
| | | 2017 | | | 2016 | | | Change | |
| | | (US dollars in millions) | |
Other income, net | | $ | (8.7 | ) | | $ | (8.5 | ) | | $ | (0.2 | ) |
Other income was higher primarily due to higher cash and cash equivalents and investments partially offset by lower interest yield and earnings due to reduced funds as funds were utilized for our share repurchases in fiscal 2017.
Finance Expense
The following table sets forth our finance expense for the periods indicated:
| | | | | | | | | | | | |
| | | Year ended March 31, | | | | |
| | | 2017 | | | 2016 | | | Change | |
| | | (US dollars in millions) | |
Finance expense | | $ | 0.5 | | | $ | 0.3 | | | $ | 0.2 | |
Finance expense increased primarily on account of interest on long term loans obtained during the year to fund our acquisitions of Denali and HealthHelp.
Provision for Income Taxes
The following table sets forth our provision for income taxes for the periods indicated:
| | | | | | | | | | | | |
| | | Year ended March 31, | | | | |
| | | 2017 | | | 2016 | | | Change | |
| | | (US dollars in millions) | |
Provision for income taxes | | $ | 17.5 | | | $ | 21.2 | | | $ | (3.7 | ) |
Provision for income taxes was lower primarily on account of aone-time benefit of $1.2 million resulting from a delivery location becoming profitable and reversal of a tax provision of $1.5 million pertaining to previous fiscal years during fiscal 2017.
Profit
The following table sets forth our profit for the periods indicated:
| | | | | | | | | | | | |
| | | Year ended March 31, | | | | |
| | | 2017 | | | 2016 | | | Change | |
| | | (US dollars in millions) | |
Profit | | $ | 37.8 | | | $ | 59.9 | | | $ | (22.1 | ) |
As a percentage of revenue | | | 6.3 | % | | | 10.7 | % | | | | |
As a percentage of revenue less repair payments(non-GAAP) | | | 6.5 | % | | | 11.3 | % | | | | |
The decrease in profit was primarily on account of lower operating profit and higher finance expense, partially offset by lower provision for income taxes and higher other income. Our acquisitions in fiscal 2017 contributed to a decrease in profit primarily due to transaction and integration costs. Value Edge contributed $0.2 million to our profit for fiscal 2017, but HealthHelp generated a loss of $0.3 million and Denali generated a loss of $0.2 million for fiscal 2017.
118
Fiscal 2016 Compared to Fiscal 2015
The following table sets forth our revenue and percentage change in revenue for the periods indicated:
Revenue
| | | | | | | | | | | | | | | | |
| | | Year ended March 31, | | | | | | | |
| | | 2016 | | | 2015 | | | Change | | | % Change | |
| | | (US dollars in millions) | | | | |
Revenue | | $ | 562.2 | | | $ | 533.9 | | | $ | 28.3 | | | | 5.3 | % |
The increase in revenue of $28.3 million was primarily attributable to revenue from new clients of $17.4 million, an increase in revenue from existing clients of $7.4 million, and an increase in hedging gain on our revenue by $3.5 million to $6.4 million in fiscal 2016 from $2.9 million in fiscal 2015. The increase in revenue was primarily due to higher volumes in our shipping and logistics, diversified businesses, utilities, travel, consulting and professional services, and healthcare verticals. The increase in revenue was partially offset by the impact of a lower volume of business from one of our top five clients by revenue contribution in fiscal 2015 and 2014, and lower volumes in our insurance vertical. The increase was also partially offset by a depreciation of the pound sterling, South African rand and Australian dollar by an average of 6.4%, 24.3% and 15.8%, respectively, against the US dollar, as compared to the average exchange rate in fiscal 2015.
Revenue by Geography
The following table sets forth the composition of our revenue based on the location of our clients in our key geographies for the periods indicated:
| | | | | | | | | | | | | | | | |
| | | Revenue | | | As a percentage of
Revenue | |
| | | Year ended March 31, | |
| | | 2016 | | | 2015 | | | 2016 | | | 2015 | |
| | | (US dollars in millions) | | | | | | | |
UK | | $ | 264.9 | | | $ | 281.9 | | | | 47.1 | % | | | 52.8 | % |
North America (primarily the US) | | | 155.3 | | | | 138.5 | | | | 27.6 | % | | | 25.9 | % |
Australia | | | 40.3 | | | | 34.2 | | | | 7.2 | % | | | 6.4 | % |
Europe (excluding the UK) | | | 34.7 | | | | 28.8 | | | | 6.2 | % | | | 5.4 | % |
South Africa | | | 30.1 | | | | 17.4 | | | | 5.4 | % | | | 3.3 | % |
Rest of world | | | 36.8 | | | | 33.1 | | | | 6.5 | % | | | 6.2 | % |
| | | | | | | | | | | | | | | | |
Total | | $ | 562.2 | | | $ | 533.9 | | | | 100.0 | % | | | 100 | % |
| | | | | | | | | | | | | | | | |
The increase in revenue in North America (primarily the US) was primarily attributable to higher volumes in our consulting and professional services, travel, shipping and logistics, insurance, and utilities verticals, partially offset by lower volumes in our diversified businesses and banking and financial services verticals. The increase in revenue from the South Africa region was primarily attributable to higher volumes in our consulting and professional services and diversified businesses verticals, partially offset by a lower volume in our banking and financial services vertical. The increase in revenue from the Australia region was primarily attributable to higher volumes in our utilities, diversified businesses, and shipping and logistics verticals. The increase in revenue from the Europe (excluding the UK) region was primarily attributable to a higher volume in our diversified businesses vertical, partially offset by lower volumes in our insurance, consulting and professional services, and healthcare verticals. The increase in revenue from the Rest of world region was primarily attributable to higher volumes in our shipping and logistics, and banking and financial services verticals, partially offset by lower volumes in our insurance, and travel verticals. The decrease in revenue from the UK region was primarily attributable to lower volumes in our insurance, shipping and logistics, diversified businesses, and consulting and professional services verticals.
Revenue Less Repair Payments(non-GAAP)
The following table sets forth our revenue less repair payments(non-GAAP) and percentage change in revenue less repair payments(non-GAAP) for the periods indicated:
| | | | | | | | | | | | | | | | |
| | | Year ended March 31, | | | | | | | |
| | | 2016 | | | 2015 | | | Change | | | % Change | |
| | | (US dollars in million) | | | | |
Revenue less repair payments(non-GAAP) | | $ | 531.0 | | | $ | 503.0 | | | $ | 28.0 | | | | 5.6 | % |
119
The increase in revenue less repair payments(non-GAAP) of $28.0 million was primarily attributable to revenue less repair payments(non-GAAP) from new clients of $17.4 million, an increase in revenue less repair payments(non-GAAP) from existing clients of $7.1 million, and an increase in hedging gain on our revenue less repair payments(non-GAAP) by $3.5 million to $6.4 million in fiscal 2016 from $2.9 million in fiscal 2015. The increase in revenue less repair payments(non-GAAP) was primarily due to higher volumes in our shipping and logistics, diversified businesses, utilities, travel, consulting and professional services, and healthcare verticals. The increase in revenue less repair payments(non-GAAP) was partially offset by the impact of a lower volume of business from one of our top five clients by revenue less repair payments(non-GAAP) contribution in fiscal 2015 and 2014, and a lower volume in our insurance vertical. The increase was partially offset by a depreciation of the pound sterling, South African rand and Australian dollar by an average of 6.4%, 24.3% and 15.8%, respectively, against the US dollar, as compared to the average exchange rate in fiscal 2015.
Revenue Less Repair Payments(non-GAAP) by Geography
The following table sets forth the composition of our revenue less repair payments(non-GAAP) based on the location of our clients in our key geographies for the periods indicated:
| | | | | | | | | | | | | | | | |
| | | Revenue less repair payments
(non-GAAP) | | | As a percentage of
revenue less repair
payments (non-GAAP) | |
| | | Year ended March 31, | |
| | | 2016 | | | 2015 | | | 2016 | | | 2015 | |
| | | (US dollars in millions) | | | | | | | |
UK | | $ | 233.7 | | | $ | 251.1 | | | | 44.0 | % | | | 49.9 | % |
North America (primarily the US) | | | 155.3 | | | | 138.5 | | | | 29.3 | % | | | 27.5 | % |
Australia | | | 40.3 | | | | 34.2 | | | | 7.6 | % | | | 6.8 | % |
Europe (excluding the UK) | | | 34.7 | | | | 28.8 | | | | 6.5 | % | | | 5.7 | % |
South Africa | | | 30.1 | | | | 17.4 | | | | 5.7 | % | | | 3.5 | % |
Rest of world | | | 36.8 | | | | 33.1 | | | | 6.9 | % | | | 6.6 | % |
| | | | | | | | | | | | | | | | |
Total | | $ | 531.0 | | | $ | 503.0 | | | | 100.0 | % | | | 100.0 | % |
| | | | | | | | | | | | | | | | |
The increase in revenue less repair payments(non-GAAP) in North America (primarily the US) was primarily attributable to higher volumes in our consulting and professional services, travel, shipping and logistics, insurance, and utilities verticals, partially offset by lower volumes in our diversified businesses and banking and financial services verticals. The increase in revenue less repair payments(non-GAAP) from the South Africa region was primarily attributable to higher volumes in our consulting and professional services, and diversified businesses verticals, partially offset by a lower volume in our banking and financial services vertical. The increase in revenue less repair payments(non-GAAP) from the Australia region was primarily attributable to higher volumes in our utilities, diversified businesses, and shipping and logistics verticals. The increase in revenue less repair payments(non-GAAP) from the Europe (excluding the UK) region was primarily attributable to a higher volume in our diversified businesses vertical, partially offset by lower volumes in our insurance, consulting and professional services, and healthcare verticals. The increase in revenue less repair payments(non-GAAP) from the Rest of world region was primarily attributable to higher volumes in our shipping and logistics, and banking and financial services verticals, partially offset by lower volumes in our insurance, and travel verticals. The decrease in revenue less repair payments(non-GAAP) from the UK region was primarily attributable to lower volumes in our insurance, shipping and logistics, diversified businesses, and consulting and professional services verticals.
120
Cost of Revenue
The following table sets forth the composition of our cost of revenue for the periods indicated:
| | | | | | | | | | | | |
| | | Year ended March 31, | | | | |
| | | 2016 | | | 2015 | | | Change | |
| | | (US dollars in millions) | |
Employee costs | | $ | 217.1 | | | $ | 199.8 | | | $ | 17.3 | |
Facilities costs | | | 64.8 | | | | 64.7 | | | | 0.2 | |
Repair payments | | | 31.2 | | | | 30.9 | | | | 0.3 | |
Depreciation | | | 14.9 | | | | 13.9 | | | | 1.0 | |
Travel costs | | | 10.3 | | | | 9.5 | | | | 0.8 | |
Legal and professional costs | | | 7.0 | | | | 7.3 | | | | (0.3 | ) |
Other costs | | | 20.0 | | | | 16.8 | | | | 3.2 | |
| | | | | | | | | | | | |
Total cost of revenue | | $ | 365.4 | | | $ | 342.7 | | | $ | 22.6 | |
| | | | | | | | | | | | |
As a percentage of revenue | | | 65.0 | % | | | 64.2 | % | | | | |
121
The increase in cost of revenue was primarily due to higher employee cost on account of higher headcount, wage inflation and a $2.5 million charge arising from the amendment to the India Payment of Bonus Act, 1965, adopted in December 2015, which increased employee bonus amounts for certain wage categories retroactively from April 1, 2014; higher other costs incurred to contract with claimants associated with our legal services business, and an increase in subcontracting costs; higher depreciation costs; higher travel costs; higher repair payments; and higher facilities costs. These increases were partially offset by lower legal and professional costs. Further, the depreciation of the Indian rupee and South African rand against the US dollar by an average of 7.1% and 24.3%, respectively, in fiscal 2016, as compared to the average exchange rate in fiscal 2015, resulted in a decrease of approximately $17.3 million in the cost of revenue.
Gross Profit
The following table sets forth our gross profit for the periods indicated:
| | | | | | | | | | | | |
| | | Year ended March 31, | | | | |
| | | 2016 | | | 2015 | | | Change | |
| | | (US dollars in millions) | |
Gross profit | | $ | 196.8 | | | $ | 191.2 | | | $ | 5.6 | |
As a percentage of revenue | | | 35.0 | % | | | 35.8 | % | | | | |
As a percentage of revenue less repair payments(non-GAAP) | | | 37.1 | % | | | 38.0 | % | | | | |
Gross profit as a percentage of revenue and revenue less repair payments(non-GAAP) decreased primarily due to higher cost of revenue as discussed above. Cost of revenue was higher notwithstanding the depreciation of the Indian rupee and South African rand against the US dollar by an average of 7.1% and 24.3%, respectively, in fiscal 2016, as compared to the average exchange rate for fiscal 2015. This increase in cost of revenue was partially offset by higher revenue, and an increase in hedging gain on our revenue by $3.5 million to $6.4 million in fiscal 2016 from $2.9 million in fiscal 2015.
During fiscal 2016, our built up seats increased by 9.4% from 24,131 as at the end of fiscal 2015 to 26,407 as at the end of fiscal 2015 as we expanded our existing facilities in Gurgaon, India, South African and the Philippines, and added new facilities in South Africa, and the Philippines. This was part of our strategy to expand our delivery capabilities, including in the SEZ in India. Our total headcount increased by 12.1% from 28,890 to 32,388 during the same period, resulting in an increase in our seat utilization rate from 1.18 in fiscal 2015 to 1.21 in fiscal 2016. This 0.03 increase in our seat utilization rate increased our gross profit as a percentage of revenue by approximately 0.41% and increased our gross profit as a percentage of revenue less repair payments(non-GAAP) by approximately 0.44%.
Selling and Marketing Expenses
The following table sets forth the composition of our selling and marketing expenses for the periods indicated:
| | | | | | | | | | | | |
| | | Year ended March 31, | | | | |
| | | 2016 | | | 2015 | | | Change | |
| | | (US dollars in millions) | |
Employee costs | | $ | 22.3 | | | $ | 23.1 | | | $ | (0.7 | ) |
Other costs | | | 8.5 | | | | 8.0 | | | | 0.5 | |
| | | | | | | | | | | | |
Total selling and marketing expenses | | $ | 30.8 | | | $ | 31.1 | | | $ | (0.2 | ) |
| | | | | | | | | | | | |
As a percentage of revenue | | | 5.5 | % | | | 5.8 | % | | | | |
As a percentage of revenue less repair payments(non-GAAP) | | | 5.8 | % | | | 6.2 | % | | | | |
The decrease in selling and marketing expenses was primarily due to a decrease in employee costs as a result of a decrease in sales headcount, and lower legal and professional expenses, partially offset by higher marketing costs. Further, the depreciation of the pound sterling against the US dollar by an average of 6.4% in fiscal 2016, as compared to the average exchange rate for fiscal 2015, resulted in a decrease of approximately $0.7 million of selling and marketing expenses.
122
General and Administrative Expenses
The following table sets forth the composition of our general and administrative expenses for the periods indicated:
| | | | | | | | | | | | |
| | | Year ended March 31, | | | | |
| | | 2016 | | | 2015 | | | Change | |
| | | (US dollars in millions) | |
Employee costs | | $ | 60.1 | | | $ | 48.3 | | | $ | 11.8 | |
Other costs | | | 18.8 | | | | 21.7 | | | | (2.9 | ) |
| | | | | | | | | | | | |
Total general and administrative expenses | | $ | 78.9 | | | $ | 70.0 | | | $ | 8.9 | |
| | | | | | | | | | | | |
As a percentage of revenue | | | 14.0 | % | | | 13.1 | % | | | | |
As a percentage of revenue less repair payments(non-GAAP) | | | 14.9 | % | | | 13.9 | % | | | | |
123
The increase in general and administrative expenses was primarily due to an increase in employee costs as a result of higher salaries on account of a higher headcount, wage inflation and higher share-based compensation expenses; higher travel cost, and higher legal and professional expenses, partially offset by lower facilities costs, and lower other costs. Further, the depreciation of the Indian rupee and South African rand against the US dollar by an average of 7.1% and 24.3%, respectively, for fiscal 2016, as compared to the average exchange rate for fiscal 2015, resulted in a decrease of approximately $3.1 million in general and administrative expenses.
Foreign Exchange Loss / (Gains), Net
The following table sets forth our foreign exchange loss / (gains), net for the periods indicated:
| | | | | | | | | | | | |
| | | Year ended March 31, | | | | |
| | | 2016 | | | 2015 | | | Change | |
| | | (US dollars in millions) | |
Foreign exchange loss / (gains), net | | $ | (11.0 | ) | | $ | (4.6 | ) | | $ | (6.4 | ) |
The foreign exchange gains were primarily due to higher gains of $2.1 million from our rupee and pound denominated hedge contracts as a result of a depreciation of the pound sterling against the US dollar, and a higher foreign currency revaluation gain of $4.3 million arising from a $3.1 million gain in fiscal 2016 from a loss of $1.3 million in fiscal 2015.
Amortization of Intangible Assets
The following table sets forth our amortization of intangible assets for the periods indicated:
| | | | | | | | | | | | |
| | | Year ended March 31, | | | | |
| | | 2016 | | | 2015 | | | Change | |
| | | (US dollars in millions) | |
Amortization of intangible assets | | $ | 25.2 | | | $ | 24.2 | | | $ | 1.0 | |
The increase in amortization of intangible assets was primarily attributable to the acquisition of a customer contract from Telkom, partially offset by the depreciation of the Indian rupee and South African rand against the US dollar by an average of 7.1% and 24.3%, respectively, in fiscal 2016, as compared to the average exchange rate in fiscal 2015.
Operating Profit
The following table sets forth our operating profit for the periods indicated:
| | | | | | | | | | | | |
| | | Year ended March 31, | | | | |
| | | 2016 | | | 2015 | | | Change | |
| | | (US dollars in millions) | |
Operating profit | | $ | 72.8 | | | $ | 70.5 | | | $ | 2.4 | |
As a percentage of revenue | | | 13.0 | % | | | 13.2 | % | | | | |
As a percentage of revenue less repair payments(non-GAAP) | | | 13.7 | % | | | 14.0 | % | | | | |
Operating profit as a percentage of revenue and revenue less repair payments(non-GAAP) was lower due to higher cost of revenue, higher general and administrative expenses, and higher amortization expenses, partially offset by higher revenue, higher foreign exchanges gains and lower selling and marketing expenses.
Other income, net
The following table sets forth our other income, net for the periods indicated:
| | | | | | | | | | | | |
| | | Year ended March 31, | | | | |
| | | 2016 | | | 2015 | | | Change | |
| | | (US dollars in millions) | |
Other income, net | | $ | (8.5 | ) | | $ | (11.9 | ) | | $ | 3.4 | |
Other income was lower primarily due to lower yield on our cash and cash equivalents and investments, as funds were utilized for our share repurchases in fiscal 2016.
124
Finance Expense
The following table sets forth our finance expense for the periods indicated:
| | | | | | | | | | | | |
| | | Year ended March 31, | | | | |
| | | 2016 | | | 2015 | | | Change | |
| | | (US dollars in millions) | |
Finance expense | | $ | 0.3 | | | $ | 1.3 | | | $ | (1.0 | ) |
Finance expense decreased primarily due to lower interest cost as a result of lower borrowings following scheduled repayments of our short term and long term loans.
Provision for Income Taxes
The following table sets forth our provision for income taxes for the periods indicated:
| | | | | | | | | | | | |
| | | Year ended March 31, | | | | |
| | | 2016 | | | 2015 | | | Change | |
| | | (US dollars in millions) | |
Provision for income taxes | | $ | 21.2 | | | $ | 22.4 | | | $ | (1.2 | ) |
Provision for income taxes was lower as the provision in fiscal 2015 included a $1.7 million provision on account of a change in Indian tax law pursuant to the India Finance Act 2014. As a result of this change in Indian tax law, a number of debt FMPs in which we had invested and held for less than 36 months werere-categorized as short term capital assets and, accordingly, were subject to tax.
Profit
The following table sets forth our profit for the periods indicated:
| | | | | | | | | | | | |
| | | Year ended March 31, | | | | |
| | | 2016 | | | 2015 | | | Change | |
| | | (US dollars in millions) | |
Profit | | $ | 59.9 | | | $ | 58.6 | | | $ | 1.3 | |
As a percentage of revenue | | | 10.7 | % | | | 11.0 | % | | | | |
As a percentage of revenue less repair payments(non-GAAP) | | | 11.3 | % | | | 11.7 | % | | | | |
The increase in profit was primarily on account of higher operating profit, lower finance expense, and lower provision for income taxes, partially offset by lower other income.
Results by Reportable Segment
For purposes of evaluating operating performance and allocating resources, we have organized our company by operating segments. See note 26 to our consolidated financial statements included elsewhere in this annual report. For financial statement reporting purposes, we aggregate the segments that meet the criteria for aggregation as set forth in IFRS 8 “Operating Segments.” We have separately reported our Auto Claims BPM segment, as it does not meet the aggregation criteria under IFRS 8. Accordingly, pursuant to IFRS 8, we have two reportable segments: WNS Global BPM and WNS Auto Claims BPM.
WNS Global BPM is delivered out of our delivery centers in China, Costa Rica, India, the Philippines, Poland, Romania, South Africa, Sri Lanka, Turkey, the UK and the US. This segment includes all of our business activities with the exception of WNS Auto Claims BPM. WNS Auto Claims BPM is our automobile claims management business which is primarily based in the UK and is part of our insurance business unit. See “Part I — Item 4. Information on the Company — B. Business Overview — Business Process Management Service Offerings.” We report WNS Auto Claims BPM as a separate segment for financial statement reporting purposes since a substantial part of our reported revenue in this business consists of amounts invoiced to our clients for payments made by us to third party automobile repair centers, resulting in lower long-term gross margins when measured on the basis of revenue, relative to the WNS Global BPM segment.
Our revenue is generated primarily from providing business process management services.
125
In our WNS Auto Claims BPM segment, we provide both “fault” and“non-fault” repairs. For “fault” repairs, we provide claims handling and repair management services, where we arrange for automobile repairs through a network of third party repair centers. In our repair management services, where we act as the principal in our dealings with the third party repair centers and our clients, the amounts which we invoice to our clients for payments made by us to third party repair centers are reported as revenue. Where we are not the principal in providing the services, we record revenue from repair services net of repair cost. Since we wholly subcontract the repairs to the repair centers, we evaluate the financial performance of our “fault” repair business based on revenue less repair payments(non-GAAP) to third party repair centers, which is anon-GAAP financial measure. We believe that revenue less repair payments(non-GAAP) for “fault” repairs reflects more accurately the value addition of the business process management services that we directly provide to our clients.
For our“non-fault” repairs business, we generally provide a consolidated suite of accident management services including credit hire and credit repair, and we believe that measurement of such business on a basis that includes repair payments in revenue is appropriate. Revenue including repair payments is therefore used as a primary measure to allocate resources and measure operating performance for accident management services provided in our“non-fault” repairs business. Our“non-fault” repairs business where we provide accident management services accounts for a relatively small portion of our revenue for our WNS Auto Claims BPM segment. In our WNS Auto Claims BPM segment, effective July 1, 2015, WNS Legal Assistance LLP, a subsidiary of WNS Assistance Limited, commenced providing legal services in relation to personal injury claims.
Revenue less repair payments is anon-GAAP financial measure which is calculated as (a) revenue less (b) in our auto claims business, payments to repair centers for “fault” repair cases where we act as the principal in our dealings with the third party repair centers and our clients. Thisnon-GAAP financial information is not meant to be considered in isolation or as a substitute for our financial results prepared in accordance with GAAP. Our revenue less repair payments(non-GAAP) may not be comparable to similarly titled measures reported by other companies due to potential differences in the method of calculation.
Our management allocates resources based on segment revenue less repair payments(non-GAAP) and measures segment performance based on revenue less repair payments(non-GAAP) and to a lesser extent on segment operating income. The accounting policies of our reportable segments are the same as those of our company. See “— Critical Accounting Policies.”
We may in the future change our reportable segments based on how our business evolves.
The following table shows revenue and revenue less repair payments(non-GAAP) for our two reportable segments for the periods indicated:
| | | | | | | | | | | | | | | | | | | | | | | | |
| | | Year ended March 31, | |
| | | 2017 | | | 2016 | | | 2015 | |
| | | WNS
Global
BPM | | | WNS
Auto
claims
BPM | | | WNS
Global
BPM | | | WNS
Auto
claims
BPM | | | WNS
Global
BPM | | | WNS
Auto
claims
BPM | |
Segment revenue(1) | | $ | 558.0 | | | $ | 44.6 | | | $ | 509.3 | | | $ | 53.3 | | | $ | 473.1 | | | $ | 61.1 | |
Less: Payments to repair centers | | | — | | | | 24.1 | | | | — | | | | 31.2 | | | | — | | | | 30.9 | |
| | | | | | | | | | | | | | | | | | | | | | | | |
Revenue less repair payments(non-GAAP) (1) | | | 558.0 | | | | 20.5 | | | | 509.3 | | | | 22.1 | | | | 473.1 | | | | 30.2 | |
Cost of revenue (excluding payments to repair centers) (2) | | | 361.0 | | | | 15.6 | | | | 314.5 | | | | 18.2 | | | | 292.3 | | | | 18.9 | |
Impairment of Goodwill | | | — | | | | 21.7 | | | | — | | | | — | | | | — | | | | — | |
Other costs(3) | | | 84.7 | | | | 4.9 | | | | 77.6 | | | | 5.2 | | | | 82.1 | | | | 5.8 | |
| | | | | | | | | | | | | | | | | | | | | | | | |
Segment operating profit / (loss) | | | 112.3 | | | | (21.6 | ) | | | 117.2 | | | | (1.2 | ) | | | 98.7 | | | | 5.4 | |
Other (income)/expense, net | | | (7.8 | ) | | | (0.9 | ) | | | (7.5 | ) | | | (1.0 | ) | | | (11.1 | ) | | | (0.8 | ) |
Finance expense | | | 0.5 | | | | 0.0 | | | | 0.3 | | | | 0.0 | | | | 1.3 | | | | — | |
| | | | | | | | | | | | | | | | | | | | | | | | |
Segment profit before income taxes | | | 119.5 | | | | (20.7 | ) | | | 124.4 | | | | (0.2 | ) | | | 108.5 | | | | 6.2 | |
Provision for income taxes | | | 17.4 | | | | 0.1 | | | | 20.9 | | | | 0.3 | | | | 21.2 | | | | 1.2 | |
| | | | | | | | | | | | | | | | | | | | | | | | |
Segment profit / (loss) | | $ | 102.1 | | | $ | (20.8 | ) | | $ | 103.5 | | | $ | (0.5 | ) | | $ | 87.3 | | | $ | 5.0 | |
| | | | | | | | | | | | | | | | | | | | | | | | |
126
Notes:
| (1) | Segment revenue and revenue less repair payments(non-GAAP) include inter-segment revenue of $0.1 million for fiscal 2017, $0.4 million for fiscal 2016 and $0.2 million for fiscal 2015. |
| (2) | Cost of revenue includes inter-segment expenses of $0.1 million for fiscal 2017, $0.4 million for fiscal 2016 and $0.2 million for fiscal 2015, and excludes share-based compensation expense of $2.8 million for fiscal 2017, $1.9 million for fiscal 2016 and $0.9 million for fiscal 2015, which are not allocable between our segments. |
| (3) | Other costs include selling and marketing, general and administrative expense and foreign exchange gain/loss. Excludes share-based compensation expense of $20.3 million for fiscal 2017, $16.0 million for fiscal 2016 and $8.6 million for fiscal 2015, which are not allocable between our segments. |
WNS Global BPM accounted for 92.6% of our revenue and 96.4% of our revenue less repair payments(non-GAAP) in fiscal 2017 as compared to 90.5% of our revenue and 95.8% of our revenue less repair payments(non-GAAP) in fiscal 2016, and 88.6% of our revenue and 94.0% of our revenue less repair payments(non-GAAP) in fiscal 2015.
WNS Global BPM
Segment Revenue. Revenue in the WNS Global BPM segment increased by 9.6% to $558.0 million in fiscal 2017 from $509.3 million in fiscal 2016. This increase was primarily attributable to the increase in the volume of transactions executed for new and existing clients, with $34.5 million being attributable to new clients, including revenue from clients of acquired businesses and $13.8 million being attributable to existing clients. In addition, we had an increase in hedging gain on our revenue by $0.4 million to $6.8 million in fiscal 2017 from $6.4 million in fiscal 2016. The increase was partially offset by a depreciation of the pound sterling and South African rand by an average of 13.4% and 2.3%, respectively, against the US dollar, as compared to the respective average exchange rates in fiscal 2016.
Revenue in the WNS Global BPM segment increased by 7.7% to $509.3 million in fiscal 2016 from $473.1 million in fiscal 2015. This increase was primarily attributable to the increase in the volume of transactions executed for new and existing clients, with $17.4 million being attributable to new clients and $7.4 million being attributable to existing clients. In addition, we had an increase in hedging gain on our revenue by $3.5 million to $6.4 million in fiscal 2016 from $2.9 million in fiscal 2015. The increase was partially offset by a depreciation of the pound sterling, South African rand and Australian dollar by an average of 6.4%, 24.3% and 15.8%, respectively, against the US dollar as compared the respective average exchange rates in fiscal 2015.
Segment Operating Profit. Segment operating profit in the WNS Global BPM segment decreased by 4.2% to $112.3 million in fiscal 2017 from $117.2 million in fiscal 2016. The decrease was primarily attributable to higher cost of revenue, higher general and administrative expenses, and higher selling and marketing expense, partially offset by higher segment revenue and higher foreign exchange gains.
Our cost of revenue includes employee costs, facilities costs, depreciation, legal and professional costs, travel costs and other related costs. Employee related costs represent the largest component of our cost of revenue for the WNS Global BPM segment. Our cost of revenue increased by $46.5 million to $361.0 million in fiscal 2017 from $314.5 million in fiscal 2016, primarily on account of (i) an increase in employee costs by $33.6 million on account of higher headcount, (ii) an increase in facilities costs by $11.0 million due to an expansion of our existing facility in Gurgaon, India, the addition of new facilities in South Africa and addition of new facilities due to our acquisitions of Value Edge, Denali, and HealthHelp, (iii) an increase in depreciation cost by $1.6 million, and (iv) an increase in travel cost by $0.3 million. Also, the depreciation of the Indian rupee and South African rand against the US dollar by an average of 2.6% and 2.3%, respectively, in fiscal 2017, as compared to the respective average exchange rates in fiscal 2016, resulted in a lower cost of revenue of approximately $6.0 million.
Our other costs include selling and marketing expenses, general and administrative expenses and foreign exchange loss or gain. Our other costs increased by $7.1 million to $84.7 million in fiscal 2017 from $77.6 million in fiscal 2016, primarily on account of (i) an increase in general and administrative expenses by $9.4 million, and (ii) an increase in selling and marketing expenses by $1.4 million partially offset by an increase in foreign exchange gain by $3.7 million.
General and administrative expenses increased by $9.4 million to $68.9 million in fiscal 2017 from $59.5 million in fiscal 2016, primarily due to an increase in employee costs as a result of higher salaries on account of a higher headcount and wage inflation, higher legal and professional expenses (including costs related to our acquisitions) and higher other costs, and higher travel cost, partially offset by the depreciation of the Indian rupee and South African rand against the US dollar by an average of 2.6% and 2.3%, respectively, for fiscal 2017, as compared to the respective average exchange rates for fiscal 2016.
127
Selling and marketing expenses increased by $1.4 million to $30.5 million in fiscal 2017 from $29.1 million in fiscal 2016, primarily due to an increase in employee costs as a result of an increase in sales headcount and higher travel cost, partially offset by lower marketing costs, and the depreciation of the pound sterling against the US dollar by an average of 13.4% in fiscal 2017, as compared to the average exchange rate for fiscal 2016 resulted in a lower cost.
The foreign exchange gains were primarily due to higher gains of $2.8 million from our rupee and pound denominated hedge contracts as a result of a depreciation of the pound sterling against the US dollar, and a higher foreign currency revaluation gain of $0.8 million arising from a $3.9 million gain in fiscal 2017 from a gain of $3.1 million in fiscal 2016.
Segment operating profit in the WNS Global BPM segment increased by 18.7% to $117.2 million in fiscal 2016 from $98.7 million in fiscal 2015. The increase was primarily attributable to higher segment revenue, higher foreign exchange gains, and lower selling and marketing expenses, partially offset by higher cost of revenue and higher general and administrative expenses.
Our cost of revenue includes employee costs, facilities costs, depreciation, legal and professional costs, travel costs and other related costs. Employee related costs represent the largest component of our cost of revenue for the WNS Global BPM segment. Our cost of revenue increased by $22.2 million to $314.5 million in fiscal 2016 from $292.3 million in fiscal 2015, primarily on account of (i) an increase in employee costs by $18.4 million on account of higher headcount, wage inflation and a $2.5 million charge arising from the amendment to the India Payment of Bonus Act, 1965, which increased employee bonus amounts for certain wage categories retroactively from April 1, 2014, (ii) an increase in facilities costs by $3.0 million due to an expansion of our existing facilities in the Gurgaon, India, South Africa and the Philippines and the addition of new facilities in South Africa and the Philippines, (iii) an increase in depreciation cost by $1.0 million, and (iv) an increase in travel cost by $0.9 million. Further, the depreciation of the Indian rupee and South African rand against the US dollar by an average of 7.1% and 24.3%, respectively, in fiscal 2016, as compared to the respective average exchange rates in fiscal 2015, resulted in a lower cost of revenue of approximately $17.3 million.
Our other costs include selling and marketing expenses, general and administrative expenses and foreign exchange loss or gain. Our other costs decreased by $4.5 million to $77.6 million in fiscal 2016 from $82.1 million in fiscal 2015, primarily on account of (i) an increase in foreign exchange gain by $6.3 million, (ii) an increase in general and administrative expenses by $2.0 million, and (iii) a decrease in selling and marketing expenses by $0.2 million.
The foreign exchange gains were primarily due to higher gains of $2.1 million from our rupee and pound denominated hedge contracts as a result of a depreciation of the pound sterling against the US dollar, and a higher foreign currency revaluation gain of $4.3 million arising from a $3.1 million gain in fiscal 2016 from a loss of $1.3 million in fiscal 2015.
General and administrative expenses increased by $2.0 million to $59.5 million in fiscal 2016 from $57.5 million in fiscal 2015, primarily due to an increase in employee costs as a result of higher salaries on account of a higher headcount and wage inflation, higher travel cost, higher legal and professional expenses, and the depreciation of the Indian rupee and South African rand against the US dollar by an average of 7.1% and 24.3%, respectively, for fiscal 2016, as compared to the respective average exchange rates for fiscal 2015, partially offset by lower facilities costs, and lower other costs.
128
Selling and marketing expenses decreased by $0.2 million to $29.1 million in fiscal 2016 from $29.3 million in fiscal 2015, primarily due to a decrease in employee costs as a result of a decrease in sales headcount, lower legal and professional expenses and marketing costs, and the depreciation of the pound sterling against the US dollar by an average of 6.4% in fiscal 2016, as compared to the average exchange rate for fiscal 2015.
Segment Profit. Segment profit in the WNS Global BPM segment decreased by 1.3% to $102.1 million in fiscal 2017 from $103.5 million in fiscal 2016. The decrease in profit was primarily attributable to higher cost of revenue, higher general and administrative expenses, higher selling and marketing expenses, and higher finance expense, partially offset by higher segment revenue, higher foreign exchange gain and higher other income, net.
The other income, net increased by $0.3 million in fiscal 2017 to $7.8 million from $7.5 million in fiscal 2016 primarily due to higher cash and cash equivalents and investments, partially offset by lower interest yield and earnings due to funds utilized for our share repurchases in fiscal 2017.
The finance expense for fiscal 2017 was $0.5 million as compared to $0.3 million in fiscal 2016 primarily due to interest on long term loans availed during the year for the acquisition of Denali and HealthHelp.
Provision for income taxes in fiscal 2017 was $17.4 million as compared to $20.9 million in fiscal 2016. Provision for income taxes was lower primarily on account of aone-time benefit of $1.2 million resulting from a delivery location becoming profitable and reversal of a tax provision of $1.5 million pertaining to previous fiscal years during fiscal 2017.
Segment profit in the WNS Global BPM segment increased by 18.5% to $103.5 million in fiscal 2016 from $87.3 million in fiscal 2015. The increase in profit was primarily attributable to higher segment revenue, higher foreign exchange gains, lower finance expense and lower selling and marketing expenses, partially offset by higher cost of revenue, higher general and administrative expenses, and lower other income, net.
The other income, net decreased by $3.7 million in fiscal 2016 to $7.5 million from $11.1 million in fiscal 2015 primarily due to a lower yield on our cash and cash equivalents and investments, and funds were utilized for our share repurchases commencing in fiscal 2016.
The finance expense for fiscal 2016 was $0.3 million as compared to $1.3 million in fiscal 2015 due to lower interest cost as a result of lower borrowings following scheduled repayments of our short term and long term loans.
Provision for income taxes in fiscal 2016 was $20.9 million as compared to $21.2 million in fiscal 2015. Provision for income taxes was lower as the provision in fiscal 2015 includes a $1.7 million provision on account of a change in Indian tax law pursuant to the India Finance Act 2014, as a result of which a number of debt FMPs that we had invested in werere-categorized as short term capital assets as they had been held for less than 36 months and, accordingly, were subject to tax
129
WNS Auto Claims BPM
Segment Revenue. Revenue in the WNS Auto Claims BPM segment decreased by $8.7 million to $44.6 million in fiscal 2017 from $53.3 million in fiscal 2016. The decrease was primarily on account of a decrease in revenue from existing clients of $10 million partially offset by an increase in revenue from new clients by $1.3 million. The decrease was also on account of depreciation of the pound sterling against the US dollar by an average of 13.4% in fiscal 2017 as compared to the average exchange rate in fiscal 2016. Payments made to repair centers in fiscal 2017 decreased by $7.1 million to $24.1 million in fiscal 2017 from $31.2 million in fiscal 2016.
Revenue less repair payments(non-GAAP) in this segment decreased by 7.2% to $20.5 million in fiscal 2017 from $22.1 million in fiscal 2016. The decrease was primarily on account of a decrease in revenue from existing clients of $2.1 million partially offset by an increase in revenue from new clients by $0.5 million. The decrease was also on account of depreciation of the pound sterling against the US dollar by an average of 13.4% in fiscal 2017 as compared to the average exchange rate in fiscal 2016.
Revenue in the WNS Auto Claims BPM segment decreased by $7.7 million to $53.3 million in fiscal 2016 from $61.1 million in fiscal 2015. The decrease was primarily on account of a decrease in revenue from existing clients of $7.7 million, and a depreciation of the pound sterling against the US dollar by an average of 6.4% in fiscal 2016 as compared to the average exchange rate in fiscal 2015. Payments made to repair centers in fiscal 2016 increased by $0.3 million to $31.2 million from $30.9 million in fiscal 2015.
Revenue less repair payments(non-GAAP) in this segment decreased by 26.6% to $22.1 million in fiscal 2016 from $30.2 million in fiscal 2015 primarily due to lower volume of business of $7.7 million from existing clients.
Segment Operating Profit. The segment reported an operating loss of $21.6 million in fiscal 2017 as compared to a loss of $1.2 million in fiscal 2016. This was primarily on account of the impairment of goodwill recorded in fiscal 2017, lower revenue less repair payments (non-GAAP), and higher foreign exchange losses, partially offset by lower cost of revenue (excluding payments to repair centers), and lower general and administrative expenses.
During the fourth quarter of fiscal 2017, proposed changes to the laws of the UK governing personal injury claims generated uncertainty regarding the future earnings trajectory of our legal services business in our WNS Auto Claims BPM segment, as a result of which we expect that we will eventually exit from providing legal services in relation to personal injury claims. We have also experienced a decrease in volume of and loss of such business from certain clients of our traditional repair services in our WNS Auto Claims BPM segment. As a result, we expect the future performance of our WNS Auto Claims BPM segment to decline significantly and we have therefore significantly reduced our financial projections and estimates of our WNS Auto Claims BPM segment. We performed an impairment review of the goodwill associated with the companies we had acquired for our auto claims business and recorded an impairment charge of $21.7 million to our results of operations for fiscal 2017.
Our cost of revenue (excluding payments to repair centers) decreased by $2.6 million to $15.6 million in fiscal 2017 from $18.2 million in fiscal 2016. The decrease in cost of revenue (excluding payments made to repair centers) was primarily on account of a decrease in our employee costs by $1.7 million, and a decrease in facilities cost by $0.8 million.
Our other costs include selling and marketing expenses, general and administrative expenses, and foreign exchange loss or gain. Our other costs decreased by $0.3 million to $4.9 million in fiscal 2017 from $5.2 million in fiscal 2016, primarily on account of a decrease in general and administrative expenses by $0.5 million to $4.3 million in fiscal 2017 from $4.8 million in fiscal 2016, partially offset by an increase in foreign exchange losses by $0.1 million.
The segment reported an operating loss of $1.2 million in fiscal 2016 as compared to a profit of $5.4 million in fiscal 2015. This decrease was primarily on account of a decrease in revenue less repair payments(non-GAAP), and higher general and administrative expenses, partially offset by lower cost of revenue (excluding payments to repair centers) and lower selling and marketing expenses.
Our cost of revenue (excluding payments to repair centers) decreased by $0.8 million to $18.2 million in fiscal 2016 from $18.9 million in fiscal 2015. The decrease in cost of revenue (excluding payments made to repair centers) was primarily on account of a decrease in our employee costs by $1.4 million, an increase in other costs by $0.7 million incurred to contract with claimants associated with our legal services business.
Our other costs include selling and marketing expenses, and general and administrative expenses. Our other costs decreased by $0.6 million to $5.2 million in fiscal 2016 from $5.8 million in fiscal 2015, primarily on account of a decrease in selling and marketing expenses by $0.7 million to $0.4 million in fiscal 2016 from $1.0 million in fiscal 2015, and an increase in general and administrative expenses by $0.1 million to $4.8 million in fiscal 2016 from $4.6 million in fiscal 2015
Segment Profit. The segment reported a loss of $20.8 million in fiscal 2017 as compared to a loss of $0.5 million in fiscal 2016. This was primarily attributable to the impairment of goodwill recorded in fiscal 2017 and lower other income, partially offset by higher operating profit and lower provision for income tax. The other income, net in fiscal 2017 was $0.9 million as compared to $1.0 million in fiscal 2016.
Provision for income taxes in fiscal 2017 was $0.1 million as compared to $0.3 million in fiscal 2016. The provision for income taxes in fiscal 2017 was lower primarily on account of lower taxable profits.
130
The segment reported a loss of $0.5 million in fiscal 2016 as compared to a profit of $5.0 million in fiscal 2015. This was primarily attributable to the operating loss, partially offset by an increase in other income, net and lower provision for income tax.
The other income, net in fiscal 2016 was an income of $1.0 million as compared to an income of $0.8 million in fiscal 2015.
Provision for income taxes in fiscal 2016 was $0.3 million as compared to $1.2 million in fiscal 2015. The provision for income taxes in fiscal 2016 was lower primarily on account of lower taxable profits.
Quarterly Results
The following table presents unaudited quarterly financial information for each of our last eight fiscal quarters on a historical basis. We believe the quarterly information contains all adjustments necessary to fairly present this information. As a business process management services provider, we anticipate and respond to demand from our clients. Accordingly, we have limited control over the timing and circumstances under which our services are provided. Typically, we show a decrease in our first quarter operating profit margins as a result of salary increases. For these and other reasons, we can experience variability in our operating results from quarter to quarter. The operating results for any quarter are not necessarily indicative of the results for any future period.
| | | | | | | | | | | | | | | | | | | | | | | | | | | | | | | | |
| | | Fiscal 2017 | | | Fiscal 2016 | |
| | | Three months ended | | | Three months ended | |
| | | March 31,
2017 | | | December 31,
2016 | | | September 30,
2016 | | | June 30,
2016 | | | March 31,
2016 | | | December 31,
2015 | | | September 30,
2015 | | | June 30,
2015 | |
| | | (Unaudited, US dollars in millions) | |
Revenue | | $ | 159.4 | | | $ | 145.4 | | | $ | 149.8 | | | $ | 148.0 | | | $ | 142.6 | | | $ | 144.4 | | | $ | 141.0 | | | $ | 134.1 | |
Cost of revenue | | | 107.4 | | | | 97.5 | | | | 99.7 | | | | 98.7 | | | | 92.2 | | | | 93.8 | | | | 90.5 | | | | 88.8 | |
| | | | | | | | | | | | | | | | | | | | | | | | | | | | | | | | |
Gross Profit | | | 52.0 | | | | 47.9 | | | | 50.1 | | | | 49.3 | | | | 50.4 | | | | 50.5 | | | | 50.5 | | | | 45.3 | |
Operating expenses: | | | | | | | | | | | | | | | | | | | | | | | | | | | | | | | | |
Selling and marketing expenses | | | 9.0 | | | | 7.9 | | | | 8.0 | | | | 7.7 | | | | 7.4 | | | | 7.9 | | | | 8.0 | | | | 7.4 | |
General and administrative expenses | | | 27.3 | | | | 21.5 | | | | 22.1 | | | | 20.9 | | | | 20.8 | | | | 19.7 | | | | 20.4 | | | | 18.0 | |
Foreign exchange loss / (gains), net | | | (5.7 | ) | | | (6.2 | ) | | | (2.5 | ) | | | (0.1 | ) | | | (2.8 | ) | | | (2.8 | ) | | | (3.6 | ) | | | (1.8 | ) |
Impairment of Goodwill | | | 21.7 | | | | — | | | | — | | | | — | | | | — | | | | — | | | | — | | | | — | |
Amortization of intangible assets | | | 2.9 | | | | 4.1 | | | | 7.2 | | | | 6.3 | | | | 6.2 | | | | 6.3 | | | | 6.5 | | | | 6.2 | |
| | | | | | | | | | | | | | | | | | | | | | | | | | | | | | | | |
Operating profit / (loss) | | | (3.3 | ) | | | 20.6 | | | | 15.3 | | | | 14.5 | | | | 18.8 | | | | 19.3 | | | | 19.3 | | | | 15.4 | |
Other (income) expense, net | | | (2.0 | ) | | | (2.2 | ) | | | (2.1 | ) | | | (2.3 | ) | | | (2.6 | ) | | | (1.9 | ) | | | (1.8 | ) | | | (2.2 | ) |
Finance expense | | | 0.4 | | | | 0.0 | | | | 0.0 | | | | 0.1 | | | | 0.0 | | | | 0.1 | | | | 0.1 | | | | 0.1 | |
Provision for income taxes | | | 3.3 | | | | 4.8 | | | | 4.7 | | | | 4.6 | | | | 5.5 | | | | 5.4 | | | | 5.5 | | | | 4.7 | |
| | | | | | | | | | | | | | | | | | | | | | | | | | | | | | | | |
Profit | | | (5.0 | ) | | | 18.0 | | | | 12.6 | | | | 12.2 | | | | 15.9 | | | | 15.7 | | | | 15.5 | | | | 12.8 | |
| | | | | | | | | | | | | | | | | | | | | | | | | | | | | | | | |
131
The following table sets forth for the periods indicated selected consolidated financial data:
| | | | | | | | | | | | | | | | | | | | | | | | | | | | | | | | |
| | | Fiscal 2017 | | | Fiscal 2016 | |
| | | Three months ended | | | Three months ended | |
| | | March 31,
2017 | | | December 31,
2016 | | | September 30,
2016 | | | June 30,
2016 | | | March 31,
2016 | | | December 31,
2015 | | | September 30,
2015 | | | June 30,
2015 | |
| | | (Unaudited) | |
Gross profit as a percentage of revenue | | | 32.6 | % | | | 32.9 | % | | | 33.4 | % | | | 33.3 | % | | | 35.3 | % | | | 35.0 | % | | | 35.8 | % | | | 33.8 | % |
Operating income as a percentage of revenue | | | (2.0 | )% | | | 14.2 | % | | | 10.2 | % | | | 9.8 | % | | | 13.2 | % | | | 13.4 | % | | | 13.7 | % | | | 11.5 | % |
Gross profit as a percentage of revenue less repair payments(non-GAAP) | | | 33.7 | % | | | 34.3 | % | | | 34.8 | % | | | 35.0 | % | | | 37.2 | % | | | 37.2 | % | | | 37.9 | % | | | 35.8 | % |
Operating income as a percentage of revenue less repair payments(non-GAAP) | | | (2.1 | )% | | | 14.7 | % | | | 10.6 | % | | | 10.3 | % | | | 13.9 | % | | | 14.2 | % | | | 14.5 | % | | | 12.2 | % |
The following table reconciles our revenue (a GAAP measure) to revenue less repair payments (anon-GAAP measure):
| | | | | | | | | | | | | | | | | | | | | | | | | | | | | | | | |
| | | Fiscal 2017 | | | Fiscal 2016 | |
| | | Three months ended | | | Three months ended | |
| | | March 31,
2017 | | | December 31,
2016 | | | September 30,
2016 | | | June 30,
2016 | | | March 31,
2016 | | | December 31,
2015 | | | September 30,
2015 | | | June 30,
2014 | |
| | | (Unaudited, US dollars in millions) | |
Revenue | | $ | 159.4 | | | $ | 145.4 | | | $ | 149.8 | | | $ | 148.0 | | | $ | 142.6 | | | $ | 144.4 | | | $ | 141.0 | | | $ | 134.1 | |
Less: Payments to repair centers | | | 5.3 | | | | 5.6 | | | | 6.0 | | | | 7.2 | | | | 7.3 | | | | 8.5 | | | | 7.7 | | | | 7.6 | |
| | | | | | | | | | | | | | | | | | | | | | | | | | | | | | | | |
Revenue less repair payments(non-GAAP) | | $ | 154.1 | | | $ | 139.8 | | | $ | 143.7 | | | $ | 140.8 | | | $ | 135.3 | | | $ | 135.9 | | | $ | 133.3 | | | $ | 126.5 | |
| | | | | | | | | | | | | | | | | | | | | | | | | | | | | | | | |
132
Contractual Obligations
Our principal commitments consist of expected principal cash payments relating to our obligations under debt and operating leases for office space, which represent minimum lease payments for office space, and purchase obligations for property and equipment. The following table sets out our total future contractual obligations as at March 31, 2017 on a consolidated basis:
| | | | | | | | | | | | | | | | | | | | |
| | | Payments Due By Period | |
| | | Total | | | Less than
1 year | | | 1-3 years | | | 3-5 years | | | More
than 5
years | |
| | | (US dollars in thousands) | |
Long term debt | | | 118,000 | | | | 28,100 | | | | 56,300 | | | | 33,600 | | | | — | |
Estimated interest payments(1) | | | 8,545 | | | | 3,257 | | | | 4,045 | | | | 1,243 | | | | — | |
Trade payables | | | 14,239 | | | | 14,239 | | | | — | | | | — | | | | — | |
Operating leases | | | 109,254 | | | | 23,657 | | | | 37,939 | | | | 24,601 | | | | 23,057 | |
Purchase obligations | | | 6,257 | | | | 6,257 | | | | — | | | | — | | | | — | |
| | | | | | | | | | | | | | | | | | | | |
Total | | $ | 256,295 | | | $ | 75,510 | | | $ | 98,284 | | | $ | 59,444 | | | $ | 23,057 | |
| | | | | | | | | | | | | | | | | | | | |
Note:
| (1) | Interest payments on debt includes payout for interest rate swaps which convert our floating rate debt to fixed rate debt. There is no contractual obligation to renew this debt. |
Our pension and other employee obligations(non-current) amounting to $10.7 million as at March 31, 2017, included in the consolidated statement of financial position, have not been disclosed in the table above as the amounts and timing of payments cannot be reliably estimated or determined at present.
Uncertain income tax liabilities totaling $12.4 million, have not been disclosed in the table above because we cannot make a reasonable estimate of the period of cash settlement with the relevant taxing authority.
133
Off-Balance Sheet Arrangements
We have nooff-balance sheet arrangements or obligations.
Tax Assessment Orders
Transfer pricing regulations to which we are subject require that any international transaction among the WNS group enterprises be onarm’s-length terms. We believe that the international transactions among the WNS group enterprises are onarm’s-length terms. If, however, the applicable tax authorities determine that the transactions among the WNS group enterprises do not meetarm’s-length criteria, we may incur increased tax liability, including accrued interest and penalties. This would cause our tax expense to increase, possibly materially, thereby reducing our profitability and cash flows. We have signed an advance pricing agreement with the Government of India providing for the agreement on transfer pricing matters over certain transactions covered thereunder for a period of five years starting from April 2013. The applicable tax authorities may also disallow deductions or tax holiday benefits claimed by us and assess additional taxable income on us in connection with their review of our tax returns.
From time to time, we receive orders of assessment from the Indian tax authorities assessing additional taxable income on us and/or our subsidiaries in connection with their review of our tax returns. We currently have orders of assessment for fiscal 2004 through fiscal 2013 pending before various appellate authorities. These orders assess additional taxable income that could in the aggregate give rise to an estimated₹2,394.3 million ($36.9 million based on the exchange rate on March 31, 2017) in additional taxes, including interest of₹891.3 million ($13.7 million based on the exchange rate on March 31, 2017).
134
The following sets forth the details of these orders of assessment:
| | | | | | | | | | | | | | | | | | | | |
Entities | | Tax year(s) | | | Amount
demanded
(including
interest) | | | Interest on amount
Demanded | |
| | | (₹ and US dollars in millions) | |
WNS Global | | | Fiscal 2004 | | | ₹ | 12.5 | | | $ | (0.2 | )(1) | | ₹ | 3.1 | | | $ | (0.1 | )(1) |
WNS Global | | | Fiscal 2005 | | | ₹ | 27.4 | | | $ | (0.4 | )(1) | | ₹ | 8.6 | | | $ | (0.1 | )(1) |
WNS Global | | | Fiscal 2006 | | | ₹ | 527.1 | | | $ | (8.1 | )(1) | | ₹ | 194.9 | | | $ | (2.9 | )(1) |
Permanent establishment of WNS North America Inc. and WNS UK in India | | | Fiscal 2006 | | | ₹ | 67.9 | | | $ | (1.0 | )(1) | | ₹ | 24.1 | | | $ | (0.4 | )(1) |
WNS Global | | | Fiscal 2007 | | | ₹ | 98.7 | | | $ | (1.5 | )(1) | | ₹ | 31.9 | | | $ | (0.5 | )(1) |
Permanent establishment of WNS North America Inc. and WNS UK in India | | | Fiscal 2007 | | | ₹ | 34.3 | | | $ | (0.5 | )(1) | | ₹ | 10.8 | | | $ | (0.2 | )(1) |
WNS Global | | | Fiscal 2008 | | | ₹ | 819.7 | | | $ | (12.7 | )(1) | | ₹ | 344.3 | | | $ | (5.3 | )(1) |
WNS BCS | | | Fiscal 2009 | | | ₹ | 7.1 | | | $ | (0.1 | )(1) | | ₹ | 2.3 | | | $ | (0.1 | )(1) |
WNS Global | | | Fiscal 2010 | | | ₹ | 60.2 | | | $ | (0.9 | )(1) | | ₹ | 23.5 | | | $ | (0.4 | )(1) |
WNS BCS | | | Fiscal 2010 | | | ₹ | 1.0 | | | $ | (0.1 | )(1) | | | — | | | | — | |
WNS BCS | | | Fiscal 2011 | | | ₹ | 9.7 | | | $ | (0.1 | )(1) | | ₹ | 3.2 | | | $ | (0.1 | )(1) |
WNS Global | | | Fiscal 2012 | | | ₹ | 305.7 | | | $ | (4.7 | )(1) | | ₹ | 107.4 | | | $ | (1.6 | )(1) |
WNS Global | | | Fiscal 2013 | | | ₹ | 423.0 | | | $ | (6.6 | )(1) | | ₹ | 137.2 | | | $ | (2.0 | )(1) |
| | | | | | | | | | | | | | | | | | | | |
Total | | | | | | ₹ | 2,394.3 | | | $ | (36.9 | )(1) | | ₹ | 891.3 | | | $ | (13.7 | )(1) |
| | | | | | | | | | | | | | | | | | | | |
Note:
| (1) | Based on the exchange rate as at March 31, 2017. |
The aforementioned orders of assessment allege that the transfer prices we applied to certain of the international transactions between WNS Global or WNS BCS (each of which is one of our Indian subsidiaries), as the case may be, and our other wholly-owned subsidiaries named above were not onarm’s-length terms, disallow a tax holiday benefit claimed by us, deny the set off of brought forward business losses and unabsorbed depreciation and disallow certain expenses claimed as tax deductible by WNS Global or WNS BCS, as the case may be. As at March 31, 2017, we have provided a tax reserve of₹806.2 million ($12.4 million based on the exchange rate on March 31, 2017) primarily on account of the Indian tax authorities’ denying theset-off of brought forward business losses and unabsorbed depreciation. We have appealed against these orders of assessment before higher appellate authorities.
135
In addition, we currently have orders of assessment pertaining to similar issues that have been decided in our favor by first level appellate authorities, vacating tax demands of₹2,890.6 million ($44.6 million based on the exchange rate on March 31, 2017) in additional taxes, including interest of₹891.1 million ($13.7 million based on the exchange rate on March 31, 2017). The income tax authorities have filed appeals against these orders at higher appellate authorities.
In case of disputes, the Indian tax authorities may require us to deposit with them all or a portion of the disputed amounts pending resolution of the matters on appeal. Any amount paid by us as deposits will be refunded to us with interest if we succeed in our appeals. We have deposited some portion of the disputed amount with the tax authorities and may be required to deposit the remaining portion of the disputed amount with the tax authorities pending final resolution of the respective matters.
As at March 31, 2017, corporate tax returns for fiscal years 2014 (for certain legal entities) and thereafter remain subject to examination by tax authorities in India.
After consultation with our Indian tax advisors and based on the facts of these cases, legal opinions from counsel on certain matters, the nature of the tax authorities’ disallowances and the orders from first level appellate authorities deciding similar issues in our favor in respect of assessment orders for earlier fiscal years, we believe these orders are unlikely to be sustained at the higher appellate authorities and we intend to vigorously dispute the orders of assessment.
In March 2009, we also received an assessment order from the Indian Service Tax Authority demanding payment of₹348.1 million ($5.4 million based on the exchange rate on March 31, 2017) of service tax and related penalty for the period from March 1, 2003 to January 31, 2005. The assessment order alleges that service tax is payable in India on BPM services provided by WNS Global to clients based abroad as the export proceeds are repatriated outside India by WNS Global. In response to an appeal filed by us with the appellate tribunal against the assessment order in April 2009, the appellate tribunal has remanded the matter back to the lower tax authorities to be adjudicated afresh. Based on consultations with our Indian tax advisors, we believe this order of assessment is more likely than not to be upheld in our favor. We intend to continue to vigorously dispute the assessment.
In 2016, we also received an assessment order from the Sri Lankan Tax Authority, demanding payment of LKR 25.2 million ($0.2 million based on the exchange rate on March 31, 2017) in connection with the review of our tax return for fiscal year 2012. The assessment order challenges the tax exemption that we have claimed for export business. We have filed an appeal against the assessment order with the Sri Lankan Tax Appeal Commission in this regard. Based on consultations with our tax advisors, we believe this order of assessment is more likely than not to be upheld in our favor. We intend to continue to vigorously dispute the assessment.
No assurance can be given, however, that we will prevail in our tax disputes. If we do not prevail, payment of additional taxes, interest and penalties may adversely affect our results of operations, financial condition and cash flows. There can also be no assurance that we will not receive similar or additional orders of assessment in the future.
Liquidity and Capital Resources
Our capital requirements are principally for the establishment of operating facilities to support our growth and acquisitions, debt repayment and to fund the repurchase of ADSs under our share repurchase programs, as described in further detail below, see “— Share Repurchases.” Our sources of liquidity include cash and cash equivalents and cash flow from operations, supplemented by equity and debt financing and bank credit lines as required.
As at March 31, 2017, we had cash and cash equivalents of $69.8 million which were primarily held in US dollars, Indian rupees, pound sterling, South African rand and Sri Lankan rupees. We typically seek to invest our available cash on hand in bank deposits and money market instruments. Our investments include primarily bank deposits, marketable securities and mutual funds which totaled $112.4 million as at March 31, 2017.
As at March 31, 2017, our total debt outstanding was $118.0 million. We also had available lines of credit amounting to $77.5 million, all of which were available as at March 31, 2017.
As at March 31, 2017, our Indian subsidiary, WNS Global, had an unsecured line of credit of₹1,100.0 million ($17.0 million based on the exchange rate on March 31, 2017) from The Hongkong and Shanghai Banking Corporation Limited, $15.0 million from BNP Paribas,₹1,200.0 million ($18.5 million based on the exchange rate on March 31, 2017) from Citibank N.A. and₹810.0 million ($12.5 million based on the exchange rate on March 31, 2017) from Standard Chartered Bank for working capital purposes. Interest on these lines of credit would be determined on the date of the borrowing. These lines of credit generally can be withdrawn by the relevant lender at any time. As at March 31, 2017, there was no amount utilized from these lines of credit.
136
In February 2017, WNS UK renewed its working capital facility obtained from HSBC Bank plc. of £9.9 million ($12.3 million based on the exchange rate on March 31, 2017) until February 28, 2018. The working capital facility bears interest at Bank of England base rate plus a margin of 2.45% per annum. Interest is payable on a quarterly basis. The facility is subject to conditions to drawdown and can be withdrawn by the lender at any time by notice to the borrower. As at March 31, 2017, there was no outstanding amount under this facility.
As at March 31, 2017, our South African subsidiary, WNS Global Services SA (Pty) Ltd., had an unsecured line of credit of ZAR 30.0 million ($2.3 million based on the exchange rate on March 31, 2017) from The HSBC Bank plc. for working capital purposes. This facility bears interest at prime rate plus a margin of 2.25% per annum. This line of credit can be withdrawn by the lender at any time. As at March 31, 2017, there was no outstanding amount under this facility.
In January 2017, our United States subsidiary, WNS North America Inc., obtained a term loan facility for $34.0 million from BNP Paribas, Hong Kong. The proceeds from this loan facility were used to finance our acquisition of Denali. The loan bears interest at a rate equivalent to the three-month US dollar LIBOR plus a margin of 1.27% per annum. WNS North America Inc.’s obligations under the term loan are guaranteed by WNS. The term loan is secured by a pledge of shares of Denali held by WNS North America Inc. and security over the assets of WNS North America Inc. The facility agreement for the term loan contains certain covenants, including restrictive covenants relating to our indebtedness and financial covenants relating to our debt service to EBITDA ratio and total borrowings to EBITDA ratio, each as defined in the facility agreement. The loan matures in January 2020 and the principal is repayable in six semi-annual instalments. The first five repayment instalments are $5.65 million each and the sixth and final repayment instalment is $5.75 million. The first scheduled repayment date is in July 2017.
In March 2017, our Mauritius subsidiary, WNS (Mauritius) Limited, obtained a term loan facility for $84.0 million from HSBC Bank (Mauritius) Ltd. and Standard Chartered Bank, UK. The proceeds from this loan facility were used to finance our acquisition of HealthHelp. The loan bears interest at a rate equivalent to the three-month US dollar LIBOR plus a margin of 0.95% per annum. WNS (Mauritius) Limited’s obligations under the term loan are guaranteed by WNS. The term loan is secured by a pledge of shares of WNS (Mauritius) Limited held by WNS. The facility agreement for the term loan contains certain covenants, including restrictive covenants relating to our indebtedness and financial covenants relating to our debt service to EBITDA ratio and total borrowings to EBITDA ratio, each as defined in the facility agreement. The loan matures in March 2022 and the principal is repayable in ten semi-annual instalments of $8.4 million each. The first scheduled repayment date is in September 2017.
Based on our current level of operations, we expect that our anticipated cash generated from operating activities, cash and cash equivalents on hand, and use of existing credit facilities will be sufficient to fund our debt repayment obligations, estimated capital expenditures, share repurchase, contingent consideration for our acquisitions of Denali and HealthHelp and working capital needs for the next 12 months. However, if our lines of credit were to become unavailable for any reason, we would require additional financing to fund our debt repayment obligations, capital expenditures, share repurchase, contingent consideration for our acquisitions of Denali and HealthHelp and working capital needs. We currently expect our capital expenditures needs in fiscal 2018 to be between $28.0 million to $30 million. The geographical distribution, timing and volume of our capital expenditures in the future will depend on new client contracts we may enter into or the expansion of our business under our existing client contracts. Our capital expenditure for fiscal 2017 amounted to $22.9 million and our capital commitments (net of capital advances) as at March 31, 2017 were $6.3 million. Of the capital expenditure incurred, approximately $8.5 million was incurred in India, approximately $7.0 million was incurred in Philippines, approximately $4.9 million was incurred in South Africa, approximately $0.8 million was incurred in Europe (excluding the UK), and approximately $1.7 million was incurred in the rest of the world. Of the capital commitments amount, we plan to spend approximately $3.1 million in India, approximately $1.0 million in South Africa, approximately $1.0 million in Philippines, approximately $0.9 million in Europe (excluding the UK), and approximately $0.3 million in the rest of the world. Further, under the current challenging economic and business conditions as discussed under “— Global Economic Conditions” above, there can be no assurance that our business activity would be maintained at the expected level to generate the anticipated cash flows from operations. If the current market conditions deteriorate, we may experience a decrease in demand for our services, resulting in our cash flows from operations being lower than anticipated. If our cash flows from operations are lower than anticipated, including as a result of the ongoing downturn in the market conditions or otherwise, we may need to obtain additional financing to meet our debt repayment obligations and pursue certain of our expansion plans. Further, we may in the future make further acquisitions. If we have significant growth through acquisitions or require additional operating facilities beyond those currently planned to service new client contracts, we may also need to obtain additional financing. We believe in maintaining maximum flexibility when it comes to financing our business. We regularly evaluate our current and future financing needs. Depending on market conditions, we may access the capital markets to strengthen our capital position, and provide us with additional liquidity for general corporate purposes, which may include capital expenditures acquisitions, refinancing of our indebtedness and working capital. If current market conditions deteriorate, we may not be able to obtain additional financing or any such additional financing may be available to us on unfavorable terms. An inability to pursue additional opportunities will have a material adverse effect on our ability to maintain our desired level of revenue growth in future periods.
137
The following table shows our cash flows for fiscal 2017, 2016 and 2015:
| | | | | | | | | | | | |
| | | Year ended March 31, | |
| | | 2017 | | | 2016 | | | 2015 | |
| | | (US dollars in millions) | |
Net cash provided by operating activities | | $ | 92.1 | | | $ | 102.9 | | | $ | 95.5 | |
Net cash used in investing activities | | $ | (131.3 | ) | | $ | (30.1 | ) | | $ | (40.2 | ) |
Net cash used in financing activities | | $ | 61.6 | | | $ | (55.2 | ) | | $ | (54.9 | ) |
Cash Flows from Operating Activities
Net cash provided by operating activities decreased to $92.1 million for fiscal 2017 from $102.9 million for fiscal 2016. The decrease in net cash provided by operating activities was attributable to a decrease in profit as adjusted fornon-cash related items by $17.6 million and an increase in taxes paid by $7.0 million, which was partially offset by a decrease in outflow on account of working capital changes by $12.9 million, an increase in interest received by $0.8 million and a decrease in interest paid by $0.1 million.
The net profit as adjusted fornon-cash related items, primarily comprised the following: (i) profit of $37.8 million for fiscal 2017 as compared to $59.9 million for fiscal 2016; (ii) unrealized exchange gain of $11.1 million for fiscal 2017 as compared to an unrealized exchange loss of $4.0 million for fiscal 2016; (iii) deferred tax credit of $8.2 million for fiscal 2017 as compared to a deferred tax expense of $1.6 million for fiscal 2016; (iv) income tax expense of $25.8 million for fiscal 2017 as compared to $19.6 million for fiscal 2016; (v) share-based compensation expense of $23.0 million for fiscal 2017 as compared to $17.9 million for fiscal 2016; (vi) impairment of goodwill of $21.7 million for fiscal 2017 as compared to $Nil for fiscal 2016; and (vii) depreciation and amortization expense of $37.4 million for fiscal 2017 as compared to $40.6 million for fiscal 2016.
Cash inflow on account of working capital changes was $1.2 million for fiscal 2017 as compared to a cash outflow of $11.7 million for fiscal 2016. This was primarily on account of a decrease in cash outflow due to lower current assets by $7.0 million, a decrease in cash outflow due to lower accounts receivables and unbilled revenue by $4.1 million, an increase in cash inflow due to higher deferred revenue by $3.4 million, partially offset by an increase in cash outflow towards accounts payable by $1.9 million.
Net cash provided by operating activities increased to $102.9 million for fiscal 2016 from $95.5 million for fiscal 2015. The increase in net cash provided by operating activities for fiscal 2016 as compared to fiscal 2015 was attributable to an increase in profit as adjusted bynon-cash related items by $19.3 million, a decrease in interest paid by $1.1 million and an increase in interest received by $0.8 million, which was partially offset by an increase in cash outflow towards working capital by $10.1 million and an increase in taxes paid by $3.8 million.
The increase in profit as adjusted fornon-cash related items by $19.3 million was primarily on account of (i) an increase in share-based compensation expense by $8.4 million, (ii) an increase in unrealized exchange losses by $5.7 million, (iii) a decrease in mark to market gains on fixed maturity plans by $4.5 million, (iv) an increase in current tax expense by $2.7 million, (v) an increase in depreciation and amortization expense by $2.1 million, (vi) a decrease in unrealized gains on derivative instruments by $1.9 million, (vii) an increase in profit by $1.3 million, and (viii) a decrease in gains from sale of property and equipment by $0.5 million.
This increase was partially offset by (i) a decrease in deferred income tax by $3.9 million, (ii) a decrease in allowance for doubtful accounts by $1.5 million, (iii) a decrease in interest expense by $1.0 million, (iv)an increase in interest income by $0.8 million, and (v) an increase in dividend income by $0.6 million
Cash outflow towards working capital increased by $10.1 million for fiscal 2016 as compared to fiscal 2015, primarily as a result of a decrease in cash inflow from other assets by $10.3 million, which mainly includes other advances, derivative assets and prepaid expenses, and a decrease in cash inflows from other liabilities by $4.8 million, which was partially offset by a decrease in cash outflows for accounts payables and deferred revenue by $2.9 million, and a decrease in cash outflows for accounts receivables and unbilled revenue by $2.2 million.
138
Cash Flows from Investing Activities
Net cash used in investing activities increased to $131.3 million for fiscal 2017 from $30.1 million for fiscal 2016. This was primarily on account of a cash outflow of $135.6 million towards our acquisitions made in fiscal 2017 as compared to $2.6 million in fiscal 2016; a cash inflow of $Nil for fiscal 2017 as compared to $30.1 million for fiscal 2016 from sale of FMPs; a net investment in fixed deposits of $9.7 million for fiscal 2017 as compared to $6.0 million for fiscal 2016; partially offset by a net cash inflow of $32.4 million from sale of marketable securities for fiscal 2017 as compared to a net cash outflow of $29.6 million invested in purchase of marketable securities in fiscal 2016; and cash outflow of $ 22.9 million for fiscal 2017 towards the purchase of property, plant and equipment (comprising mainly leasehold improvements, furniture and fixtures, office equipment and information technology equipment) and intangible assets (comprising computer software), as compared to $27.5 million for fiscal 2016.
Net cash used in investing activities decreased to $30.1 million for fiscal 2016 from $40.2 million for fiscal 2015. Investing activities in fiscal 2016 and fiscal 2015 consisted of the following: (i) net amount invested in purchase of marketable securities in fiscal 2016 of $29.6 million as compared to a net purchase of marketable securities of $78.4 million in fiscal 2015, (ii) proceeds received from maturity of fixed deposits was $8.8 million in fiscal 2016 as compared to an inflow of $Nil in fiscal 2015 from maturity of fixed deposits, (iii) investment in fixed deposits of $14.8 million in fiscal 2016 as compared to $9.6 million investments in fixed deposits in fiscal 2015, (iv) amount received from sale of FMPs was $30.1 million in fiscal 2016 as compared to an inflow of $ 66.1 million from sale of FMPs, (v) capital expenditure of $27.5 million incurred for leasehold improvements, including the purchase of computers, furniture, fixtures and other office equipment and software (classified as intangibles) associated with expanding the capacity of our delivery centers, for fiscal 2016, as compared to capital expenditure of $23.0 million in fiscal 2015, (vi) an amount of $2.6 million paid towards our Telkom business combination in fiscal 2016 as compared to $0.3 million paid towards acquisitions of certain assets and the related workforce from iSoftStone in fiscal 2015, and (vii) dividend received in fiscal 2016 increased to $5.0 million from $4.4 million in fiscal 2015.
Cash Flows from Financing Activities
Net cash provided by financing activities increased to $61.6 million for fiscal 2017 as compared to net cash used in financing activities of $55.2 million for fiscal 2016. This was primarily on account of an increase in cash inflow from long term debt of $ 118.0 million for fiscal 2017 as compared to a cash outflow of $13.2 million towards repayment of long term debt and $13.1 million towards net repayment of short term borrowings for fiscal 2016; an increase in cash inflow from the exercise of options by grantees under our share plans of $8.9 million for fiscal 2017 as compared to $ 1.3 million for fiscal 2016, which was partially offset by an increase in cash outflow towards share repurchase of $64.2 million for fiscal 2017 as compared to $30.5 million for fiscal 2016.
Net cash used in financing activities was $55.2 million in fiscal 2016, as compared to $54.9 million in fiscal 2015. Financing activities primarily consisted of (i) $30.5 million for share repurchase in fiscal 2016 as compared to $Nil in fiscal 2015, (ii) repayments of short term debt by WNS Global Services India Private Limited of $12.0 million and by WNS UK of $1.1 million in fiscal 2016 as compared to repayments of short term debt by WNS Global Services India Private Limited of $39.2 million and by WNS UK of $4.3 million in fiscal 2015, (iii) repayment of long term debt by WNS Global Services India Private Limited of $7.0 million and by WNS UK of $6.2 million in fiscal 2016 as compared to repayment of long term debt by WNS UK of $12.0 million and by WNS Global Services India Private Limited of $ Nil in fiscal 2015, and (iv) proceeds from exercise of employee stock options of $1.3 million in fiscal 2016 as compared to $0.5 million in fiscal 2015.
Share Repurchases
In March 2016, our shareholders authorized a share repurchase program for the repurchase of up to 3.3 million of our ADSs, each representing one share, at a price range of $10 to $50 per ADS. Pursuant to the terms of the repurchase program, our ADSs may be purchased in the open market from time to time for 36 months from March 16, 2016, the date the shareholders resolution approving the repurchase program was passed. In fiscal 2017 we repurchased 2.2 million ADSs under the repurchase program. We intend to fund the repurchase of the remaining 1.1 million ADSs under the repurchase program with cash on hand. We are not obligated under the repurchase program to repurchase a specific number of ADSs, and the repurchase program may be suspended at any time at our discretion. We intend to hold the shares underlying any such repurchased ADSs as treasury shares.
In March 2015, our shareholders authorized a share repurchase program for the repurchase of up to 1.1 million of our ADSs at a price range of $10 to $30 per ADS, in the open market from time to time for 12 months from April 1, 2015. In fiscal 2016, we purchased 1.1 million ADSs in the open market at the average price per ADS of $27.65 for a total consideration of $30.5 million (including transaction costs). The shares underlying these purchased ADSs have been accounted for as treasury stock, at cost. These share repurchases were funded with cash on hand.
139
New Accounting Pronouncements Not Yet Adopted by our Company
Certain new standards, interpretations and amendments to existing standards have been published that are mandatory for our accounting periods beginning on or after April 1, 2017 or later periods. Those which are considered to be relevant to our operations are set out below.
| i. | In May 2014, the IASB issued IFRS 15 “Revenue from Contracts with Customers” (“IFRS 15”). This standard provides a single, principle-based five-step model to be applied to all contracts with customers. Guidance is provided on topics such as the point at which revenue is recognized, accounting for variable consideration, costs of fulfilling and obtaining a contract and various other related matters. IFRS 15 also introduced new disclosure requirements with respect to revenue. |
The five steps in the model under IFRS 15 are: (i) identify the contract with the customer; (ii) identify the performance obligations in the contract; (iii) determine the transaction price; (iv) allocate the transaction price to the performance obligations in the contracts; and (v) recognize revenue when (or as) the entity satisfies a performance obligation.
IFRS 15 replaces the following standards and interpretations:
| | • | | IAS 11 “Construction Contracts” |
| | • | | IFRIC 13 “Customer Loyalty Programmes” |
| | • | | IFRIC 15 “Agreements for the Construction of Real Estate” |
| | • | | IFRIC 18 “Transfers of Assets from Customers” |
| | • | | SIC-31 “Revenue - Barter Transactions Involving Advertising Services” |
When first applying IFRS 15, it should be applied in full for the current period, including retrospective application to all contracts that were not yet complete at the beginning of that period. In respect of prior periods, the transition guidance allows an option to either:
| | • | | apply IFRS 15 in full to prior periods (with certain limited practical expedients being available); or |
| | • | | retain prior period figures as reported under the previous standards, recognizing the cumulative effect of applying IFRS 15 as an adjustment to the opening balance of equity as at the date of initial application (beginning of current reporting period). |
140
In April 2016, the IASB issued amendments to IFRS 15, clarifying some requirements and providing additional transitional relief for companies. The amendments do not change the underlying principles of IFRS 15 but clarify how those principles should be applied. The amendments clarify how to:
| | • | | identify a performance obligation (the promise to transfer a good or a service to a customer) in a contract; |
| | • | | determine whether a company is a principal (the provider of a good or service) or an agent (responsible for arranging for the good or service to be provided); and |
| | • | | determine whether the revenue from granting a license should be recognized at a point in time or over time. |
In addition to the clarifications, the amendments include two additional reliefs to reduce cost and complexity for a company when it first applies IFRS 15. The amendments have the same effective date as IFRS 15.
IFRS 15 is effective for fiscal years beginning on or after January 1, 2018. Earlier application is permitted. We expect to apply this standard retrospectively with the cumulative effect of initially applying this standard recognized at April 1, 2018 (i.e. the date of initial application in accordance with this standard). Further, we are currently evaluating the impact that this new standard will have on our consolidated financial statements.
| ii. | In July 2014, the IASB finalized and issued IFRS 9 – “Financial Instruments” (“IFRS 9”). IFRS 9 replaces IAS 39 “Financial instruments: recognition and measurement” (“IAS 39”), the previous Standard which dealt with the recognition and measurement of financial instruments in its entirety upon former’s effective date. |
Key requirements of IFRS 9:
Replaces IAS 39’s measurement categories with the following three categories:
| | • | | fair value through profit or loss (“FVTPL”) |
| | • | | fair value through other comprehensive income (“FVTOCI”) |
Eliminates the requirement for separation of embedded derivatives from hybrid financial assets, the classification requirements to be applied to the hybrid financial asset in its entirety.
Requires an entity to present the amount of change in fair value due to change in entity’s own credit risk in other comprehensive income.
Introduces new impairment model, under which the “expected” credit loss are required to be recognized as compared to the existing “incurred” credit loss model of IAS 39.
Fundamental changes in hedge accounting by introduction of new general hedge accounting model which:
| | • | | Increases the eligibility of hedged item and hedging instruments; |
| | • | | Introduces a more principles–based approach to assess hedge effectiveness. |
IFRS 9 is effective for annual periods beginning on or after January 1, 2018.
Earlier application is permitted provided that all the requirements in the Standard are applied at the same time with two exceptions:
| (1) | The requirement to present changes in the fair value of a liability due to changes in own credit risk may be applied early in isolation; |
| (2) | Entity may choose as its accounting policy choice to continue to apply hedge accounting requirements of IAS 39 instead of new general hedge accounting model as provided in IFRS 9. |
We are currently evaluating the impact of this new standard on our consolidated financial statements.
141
| iii. | In January 2016, the IASB has issued IFRS 16 “Leases” (“IFRS 16”). Key changes in IFRS 16 include: |
| | • | | eliminates the requirement to classify a lease as either operating or finance lease in the books of lessee. |
| | • | | introduces a single lessee accounting model, which requires lessee to recognize assets and liabilities for all leases, initially measured at the present value of unavoidable future lease payment. Entity may elect not to apply this accounting requirement to short term leases and leases for which underlying asset is of low value. |
| | • | | replaces the straight-line operating lease expense model with a depreciation charge for the lease asset (included within operating costs) and an interest expense on the lease liability (included within finance costs). |
| | • | | requires lessee to classify cash payments for principal and interest portion of lease arrangement within financing activities and financing/operating activities respectively in the cash flow statements. |
| | • | | requires entities to determine whether a contract conveys the right to control the use of an identified asset for a period of time to assess whether that contract is, or contains, a lease. |
IFRS 16 replaces IAS 17, “Leases and related interpretations” viz. IFRIC 4, “Determining whether an Arrangement contains a Lease”;SIC-15, “Operating Leases—Incentives”; andSIC-27, “Evaluating the Substance of Transactions Involving the Legal Form of a Lease.”
IFRS 16 substantially carries forward lessor accounting requirements in IAS 17, “Leases.” Disclosures, however, have been enhanced.
IFRS 16 is effective for annual reporting periods beginning on or after 1 January 2019. Early application is permitted for entities that apply IFRS 15, “Revenue from Contracts with Customers” at or before the date of initial application of IFRS 16.
A lessee shall apply IFRS 16 either retrospectively to each prior reporting period presented or record a cumulative effect of initial application of IFRS 16 as an adjustment to opening balance of equity at the date of initial application.
We are currently evaluating the impact of this new standard on our consolidated financial statements.
| iv. | In January 2016, the IASB issued amendments to IAS 12 – “Income taxes” to clarify the following: |
| | • | | the carrying value of an asset does not limit the estimation of probable future taxable profits. |
| | • | | estimates for future taxable profits exclude tax deductions resulting from the reversal of deductible temporary differences. |
| | • | | an entity assesses a deferred tax asset in combination with other deferred tax assets. Where tax law restricts the utilization of tax losses, an entity would assess a deferred tax asset in combination with other deferred tax assets of the same type. |
The amendments are effective for annual periods beginning on or after January 1, 2017. Earlier application is permitted.
We expect the adoption of these amendments will have no impact on our consolidated financial statements.
| v. | In January 2016, the IASB issued amendments in IAS 7 – “Statement of Cash Flows” to clarify and improve information provided to users of financial statements about an entity’s financing activities. |
The IASB requires that the following changes in liabilities arising from financing activities to be disclosed (to the extent necessary):
| | • | | changes from financing cash flows; |
| | • | | changes arising from obtaining and losing control of subsidiaries or other businesses; |
| | • | | the effect of changes of foreign exchange rates; |
| | • | | changes in fair value; and |
The amendments are effective for annual periods beginning on or after January 1, 2017. Earlier application is permitted. Entities need not present comparative information when they first apply the amendments.
142
We are currently evaluating the effect of this amendment on our consolidated financial statements.
| vi. | In June 2016, the IASB issued amendments in IFRS 2 – “Share-based Payment” to clarify the following: |
| | • | | the accounting for cash-settled share-based payment transactions that include a performance condition should follow the same approach as for equity-settled share-based payment; |
| | • | | the classification of share-based payment transactions with net settlement features for withholding tax obligations should be classified as equity-settled in its entirety, provided the share-based payment would have been classified as equity-settled had it not included the net settlement feature; and |
| | • | | modifications of a share-based payment that changes the transaction from cash-settled to equity-settled to be accounted for as follows: |
| | i. | the original liability is derecognized; |
| | ii. | the equity-settled share-based payment is recognized at the modification date fair value of the equity instrument granted to the extent that services have been rendered up to the modification date; and |
| | iii. | any difference between the carrying amount of the liability at the modification date and the amount recognized in equity should be recognized in the statement of income immediately. |
The above amendments are effective for annual periods beginning on or after January 1, 2018. Earlier application is permitted. The amendments are to be applied prospectively. However, if an entity applies the amendments retrospectively, it must do so for all of the amendments described above.
We are currently evaluating the impact of these amendments on our consolidated financial statements.
| vii. | In December 2016, the IFRS Interpretations Committee (“IFRIC”) issued amendments to IFRIC 22 – “Foreign Currency Transactions and Advance Consideration” to clarify the exchange rate to use for translation when payments are made or received in advance of the related asset, expense or income (or part of it) in foreign currency. |
The exchange rate in this case will be the rate prevalent on the date on which an entity initially recognizes thenon-monetary asset ornon-monetary liability arising from the payment or receipt of advance consideration. If there are multiple payments or receipts in advance, the entity shall determine a date of the transaction for each payment or receipt of advance consideration.
IFRIC 22 is effective for annual reporting periods beginning on or after January 1, 2018. Earlier application is permitted.
On initial application, entities have the choice to apply the Interpretation either retrospectively or, alternatively, prospectively to all assets, expenses and income in the scope of the Interpretation initially recognized on or after:
| | • | | the beginning of the reporting period in which the entity first applies the Interpretation; or |
| | • | | the beginning of a prior reporting period presented as comparative information in the financial statements of the reporting period in which the entity first applies the Interpretation. |
We are currently evaluating the impact of these amendments on our consolidated financial statements.
| viii. | In June 2017, the IFRIC issued IFRIC 23 – “Uncertainty over Income Tax Treatments” to clarify the accounting for uncertainties in income taxes, by specifically addressing the following: |
| | • | | the determination of whether to consider each uncertain tax treatment separately or together with one or more uncertain tax treatments; |
| | • | | the assumptions an entity makes about the examination of tax treatments by taxations authorities; |
| | • | | the determination of taxable profit (tax loss), tax bases, unused tax losses, unused tax credits and tax rates where there is an uncertainty regarding the treatment of an item; and |
| | • | | the reassessment of judgements and estimates if facts and circumstances change. |
IFRIC 23 is effective for annual reporting periods beginning on or after 1 January 2019. Earlier application is permitted.
On initial application, the requirements are to be applied by recognizing the cumulative effect of initially applying them in retained earnings, or in other appropriate components of equity, at the start of the reporting period in which an entity first applies them, without adjusting comparative information. Full retrospective application is permitted, if an entity can do so without using hindsight.
We are currently evaluating the impact of this pronouncement on our consolidated financial statements.
143
ITEM 6. DIRECTORS, SENIOR MANAGEMENT AND EMPLOYEES
A. Directors and Executive Officers
Our Board of Directors consists of eight directors.
The following table sets forth the name, age (as at March 31, 2017) and position of each of our directors and executive officers as at the date hereof.
| | | | | | | | |
Name | | Age | | | Designation | |
Directors | | | | | | | | |
Adrian T. Dillon(1)(2) | | | 63 | | | | Non-Executive Chairman | |
Albert Aboody(3) | | | 69 | | | | Director | |
Gareth Williams(2)(4) | | | 64 | | | | Director | |
John Freeland(5) | | | 63 | | | | Director | |
Keshav R. Murugesh | | | 53 | | | | Director and Group Chief Executive Officer | |
Michael Menezes(5) | | | 64 | | | | Director | |
Renu S. Karnad(1)(6) | | | 64 | | | | Director | |
Francoise Gri(5) | | | 59 | | | | Director | |
Executive Officers | | | | | | | | |
Keshav R. Murugesh | | | 53 | | | | Group Chief Executive Officer | |
Sanjay Puria | | | 43 | | | | Group Chief Financial Officer | |
Ronald Gillette | | | 60 | | | | Chief Operating Officer | |
Swaminathan Rajamani | | | 40 | | | | Chief People Officer | |
Notes:
| (1) | Member of our Compensation Committee. |
| (2) | Member of our Nominating and Corporate Governance Committee. |
| (3) | Chairman of our Audit Committee. |
| (4) | Chairman of our Compensation Committee. |
| (5) | Member of our Audit Committee. |
| (6) | Chairman of our Nominating and Corporate Governance Committee. |
Summarized below is relevant biographical information covering at least the past five years for each of our directors and executive officers.
144
Directors
Adrian T. Dillon was appointed to our Board of Directors in September 2012 and was designated asNon-Executive Vice Chairman of the Board in January 2013. In January 2014 he was appointed as theNon-Executive Chairman of the Board. He is currently a member of the Board of Directors and a member of the Audit Committee of HealthEquity, Inc and also a member of the Board of Directors and Chairman of the Audit and Finance Committees of Williams-Sonoma, Inc. During his career, he has served as a member of the Board of Wonga Group Limited, from 2013 to 2015, NDS Group Limited, from 2011 to 2012, Verigy Pty, from 2006 to 2007 and LumiLeds Inc., from 2002 to 2007. He has also held key finance roles including Chief Financial and Administrative Officer at Skype Limited, from 2010 to 2011, Executive Vice President - Finance & Administration and Chief Financial Officer at Agilent Technologies, Inc., from 2001 to 2010 and held various positions at Eaton Corporation, from 1979 to 2001, including Executive Vice President and Chief Financial and Planning Officer from 1995-2001. He was a member and past Chairman of The Conference Board Council of Financial Executives. Mr. Dillon graduated from Amherst College with a Bachelor of Arts degree in economics. The business address of Mr. Dillon is 5872 Cottage Ridge Road, Santa Rosa, CA 95403, USA.
Albert Aboody was appointed to our Board of Directors in June 2010 and also serves as the chairman of our Audit Committee. Mr. Aboody is based in the US. Prior to his appointment as our director, he was a partner with KPMG, US. In this role, he served on the Board of KPMG, India, including as Deputy Chairman and as head of its audit department. He alsoco-authored chapters on the Commission’s reporting requirements in the 2001-2008 annual editions of the Corporate Controller’s Manual. Mr. Aboody is a member of the American Institute of Certified Public Accountants. He was a post-graduate research scholar at Cambridge University and received a Bachelor of Arts degree from Princeton University. The business address of Mr. Aboody is 424 E 57th St. # 3D, New York, NY 10022.
Gareth Williams was appointed to our Board of Directors in January 2014. Currently Mr. Williams serves as the Chairman of YSC and as an independent director of SAGA plc. He served as a member of the Board of YSC from 2013 to 2016. He also served as the advisor to the CEO of Diageo plc till June 2014. Prior to his appointment to our Board, he was Director, Human Resources at Diageo plc, one of the world’s leading premium drink companies. Prior to taking over as Head of Human Resources at Diageo in January 1999, Mr. Williams held a series of key positions in HR at Grand Metropolitan, plc in North America and the UK from 1984 to 1998, leading up to the merger with Guinness that formed Diageo. Before joining Grand Metropolitan, he spent 10 years with Ford of Britain in a number of HR roles. Mr. Williams graduated with a Bachelor of Arts degree in Economics from the Warwick University. The business address of Mr. Williams is High Tees, Wildernesse Avenue, Sevenoaks, Kent TN15 0EA, UK.
John Freeland was appointed to our Board of Directors in September 2014. Mr. Freeland is the Chairman andCo-founder of Surface Architectural Supply Inc. He is also the founder of JF Fitness of North America. He was on the Board of Compuware Corporation during the year 2014. He brings over 35 years of experience to WNS. Most recently he was the CEO of Symphony Information Resources, Inc. from October 2007 to May 2012, a leading global provider of information, insights and decision solutions. In his previous roles, he was President - Worldwide Operations for salesforce.com and a Managing Partner at Accenture in the areas of global Insurance and global Customer Relationship Management. During his26-year career at Accenture, he was also appointed a member of Accenture’s executive committee. Mr. Freeland has a Bachelor of Arts degree in Economics and a Master of Business Administration from Columbia University. The business address of Mr. Freeland is 435 East 52nd Street, Apartment 8B, NY, NY 10022.
145
Keshav R. Murugesh was appointed as our Group Chief Executive Officer and director in February 2010. Mr. Murugesh is based out of Mumbai. Prior to joining WNS, Mr. Murugesh was the Chief Executive Officer of Syntel Inc., a Nasdaq-listed information technology company, and its subsidiaries. He holds a Bachelor of Commerce degree and is a Fellow of The Institute of Chartered Accountants of India. Prior to Syntel, he worked in various capacities with ITC Limited, an affiliate of BAT Plc. between 1989 and 2002. Most recently, he was appointed as the Honorary Chairman of The Confederation of Indian Industry - Western India’s Education Committee. He is the former chairman of the BPM Council of NASSCOM and an elected member of the NASSCOM Executive Council. NASSCOM is the industry association for theIT-BPM sector in India. He is on the Board of WNS Cares Foundation, a company that focuses on sustainability initiatives. He was the Chairman of SIFE (Students in Free Enterprise) India, which is a global organization involved in educational outreach projects in partnership with businesses across the globe, from 2005 to 2011. The business address of Mr. Murugesh is Gate 4, Godrej & Boyce Complex, Pirojshanagar, Vikhroli West, Mumbai 400 079, India.
Michael Menezes was appointed to our Board of Directors in January 2014. Mr. Menezes presently serves as the advisor to Fairfax India and also as an Executive-in-Residence to the MBA students at Ryerson University in Toronto on a voluntary basis. He is the President of Acumentor Inc. a sole proprietary business engaged in providing consulting and other services. Most recently, he was the special advisor to the Continental Bank of Canada. He was also CFO, Technology, Operations and Corporate Group at Bank of Montreal from 2000 to 2012. Mr. Menezes has over two decades of global exposure, both as CEO and CFO in the Financial Services, Consumer Goods and Agri-business sectors. In his previous stints, he has been the CFO for ONIC (Holding), CEO of ITC Agro Tech Ltd., India, apart from holding various senior finance roles at ITC Ltd. in India. Mr. Menezes received a Bachelor of Arts Degree in Economics from University of Delhi, India, a Master’s degree in Economics from London School of Economics, UK and qualified as a Member of the Institute of Chartered Accountants of India. The business address of Mr. Menezes is 220 Cummer Avenue, Toronto, Canada M2M 2E7.
Renu S Karnad was appointed to our Board of Directors in September 2012. Mrs. Karnad had joined Housing Development Finance Corporation Limited (HDFC Limited) in 1978 and is currently serving as the Managing Director of HDFC Limited. She is also a director on several other Boards, including BOSCH Limited, Gruh Finance Limited, HDFC Bank Limited, HDFC Asset Management Company Limited, HDFC Ergo General Insurance Company Limited, HDFC Standard Life Insurance Company Limited, Indraprastha Medical Corporation Limited, Feedback Infrastructure Services Private Limited, EIH Limited, HIREF International LLC, ABB India Limited, H T Parekh Foundation, HIREF International Fund II Pte. Limited, HIREF International Fund Pte Limited and HDFC Plc (Maldives). Mrs. Karnad holds a Master’s degree in Economics from the University of Delhi and is a graduate in law from the University of Mumbai. She has also been a Parvin Fellow at Princeton University’s Woodrow Wilson School of International Affairs. The business address of Mrs. Karnad is HDFC Limited, Capital Court, 1st Floor, Munirka, Off Palme Marg, New Delhi 110067, India.
Françoise Gri was appointed to our Board of Directors in May 2015. Ms. Gri brings over 30 years of international business experience to WNS, most recently as CEO of Pierre & Vacances-Center Parcs Group, a European leader in local tourism. In her previous roles, she was Executive Vice President - France, and then for all of Southern Europe, at Manpower, Inc., a workforce solutions company which she joined in 2007. During her26-year career at IBM, she served in the role of President and Country GM for IBM France. She is a member of the Board of Directors at Credit Agricole and Edenred. Ms. Gri has a Master of Science degree in Computer Engineering from Ecole Nationale Superieure d’Informatique et Mathematiques Appliquees ENSIMAG) in Grenoble, France. The business address of Ms. Gri is 25, Rue des Vaussourds, 92500 Rueil Malmaison, France.
Executive Officers
Keshav R. Murugesh is our Group Chief Executive Officer. Please see “— Directors” above for Mr. Murugesh’s biographical information.
Sanjay Puria serves as our Group Chief Financial Officer. He is based out of Mumbai, India and leads WNS’s global finance function. Presently, he serves on the Board of WNS Cares Foundation. Mr. Puria has over 18 years of experience, out of which over 14 years have been in the offshore services industry. He is a veteran at WNS, having managed several key finance functions including corporate strategy, mergers and acquisitions, financial planning and analysis, and strategic business development before taking over as the Group CFO. Prior to WNS, he was at the helm of operations for a global provider of integrated information technology and knowledge process outsourcing solutions, where his role centered around managing acquisitions, joint ventures, complex and multi-year contracts, strategizing on geographical expansion, revenue and cost management, pricing & commercials and implementation of LEAN initiatives. Mr. Puria is a Chartered Accountant from the Institute of Chartered Accountants of India and has passed the Certified Public Accountant examination from the American Institute of Certified Public Accountants. The business address of Mr. Puria is Gate 4, Godrej & Boyce Complex, Pirojshanagar, Vikhroli, (West) Mumbai 400 079, India.
146
Ronald Gillette is our Chief Operating Officer and is responsible for WNS’s global sales, operations and capability creation. Based in Mumbai, he drives WNS’s strategic plans and operating results. Prior to joining WNS, Mr. Gillette worked with Xerox in the US and Europe. Previously, he was the Group President, Xerox Business Services in Europe with responsibility for all Financial Services and Insurance clients and had led Xerox’s global FAO business. Before joining Xerox Services, Gillette was a senior partner at Accenture, responsible for growing its BPM business. He has also worked with Deloitte Consulting, Ernst & Young and EDS in various leadership roles with a focus on building outsourcing businesses. He has a Bachelor of Science degree from the United States Military Academy, at West Point. He holds a Master of Business Administration degree from Marymount University in Arlington, Virginia. The business address of Mr. Gillette is Gate 4, Godrej & Boyce Complex, Pirojshanagar, Vikhroli, (West) Mumbai 400 079, India.
Swaminathan Rajamani is our Chief People Officer. Presently, he serves on the Board of WNS Cares Foundation. He leads WNS’s Human Resources function, and is responsible for the entire gamut of people-oriented processes. Prior to joining WNS, he was with CA Technologies, where he served as Vice President — Human Resources and was the Country Head — HR for India. He has also served as Head of HR Operations at Syntel and thereafter, for a short while, was its Global HR Head. Prior to Syntel, he had a long tenure at GE spanning multiple roles such as Master Black Belt — HR and Assistant Vice President and Head — Operations for HR, Customer Research and Operational Analytics, apart from other roles in mergers and acquisitions. He is a certified Change Acceleration Coach and a keen practitioner of Six Sigma. He has a Masters in Social Work degree from the University of Madras. The business address of Mr. Rajamani is Gate 4, Godrej & Boyce Complex, Pirojshanagar, Vikhroli, (West) Mumbai 400 079, India.
B. Compensation
Compensation Discussion and Analysis
Compensation Objectives
Our compensation philosophy is to align employee compensation with our business objectives, so that compensation is used as a strategic tool that helps us recruit, motivate and retain highly talented individuals who are committed to our core values: clients first, integrity, respect, collaboration, learning and excellence. We believe that our compensation programs are integral to achieving our goal of “One WNS One Goal—Outperform!”
Our Compensation Committee is responsible for reviewing the overall goals and objectives of our executive compensation programs, as well as our compensation plans, and making changes to such goals, objectives and plans. Our Compensation Committee bases our executive compensation programs on the following objectives, which guide us in establishing and maintaining all of our compensation programs:
| | • | | Pay Differentiation: Based on the Job Responsibility, Individual Performance and Company Performance. As employees progress to higher levels in our company, their ability to directly impact our results and strategic initiatives increases. Therefore, as employees progress, an increasing proportion of their pay is linked to company performance and tied to creation of shareholder value. |
| | • | | Pay for Performance. Our compensation is designed to pay for performance and thus we provide higher compensation for strong performance and, conversely, lower compensation for poor performance and/or where company performance falls short of expectations. Our compensation programs are designed to ensure that successful, high-performing employees remain motivated and committed during periods of temporary downturns in our performance. |
| | • | | Balanced in Focus on Long Term versus Short Term Goals. As part of our compensation philosophy, we believe that equity-based compensation should be higher for employees with greater levels of responsibility and influence on our long term results. Therefore, a significant portion of these individuals’ total compensation is dependent on our long term share price appreciation. In addition, our compensation philosophy seeks to incentivize our executives to focus on achieving short term performance goals in a manner that supports and encourages long term success and profitability. |
| | • | | Competitive Value of the Job in the Marketplace. In order to attract and retain a highly skilled work force in a global market space, we remain competitive with the pay of other employers who compete with us for talent in relevant markets. |
147
| | • | | Easy to understand. We believe that all aspects of executive compensation should be clearly, comprehensibly and promptly disclosed to employees in order to effectively motivate them. Employees need to easily understand how their efforts can affect their pay, both directly through individual performance accomplishments and indirectly through contributions to achieving our strategic, financial and operational goals. We also believe that compensation for our employees should be administered uniformly across our company withclear-cut objectives and performance metrics to eliminate the potential for individual supervisor bias. |
Our Compensation Committee also considers risk when developing our compensation programs and believes that the design of our compensation programs should not encourage excessive or inappropriate risk taking.
Components of Executive Compensation
The compensation of our executive officers consists of the following five primary components:
| | • | | Base salary or, in the case of executive officers based in India, fixed compensation; |
| | • | | Cash bonus or variable incentive; |
| | • | | Equity incentive grants of RSUs; |
| | • | | Other benefits and perquisites; and |
The following is a discussion of our considerations in determining each of the compensation components for our executive officers.
Base Salary or Fixed Compensation
Base salary is a fixed element of our executives’ annual cash compensation, which is not tied to any performance criteria. We consider base salary an important part of an executive’s compensation and our Compensation Committee reviews each executive officer’s base salary annually as well as at the time of a promotion or other change in responsibility. Any base salary adjustments are usually approved early in the fiscal year, effective as at April 1, or as set out in the relevant employment agreement. The specific amount of base salary for each executive officer depends on the executive’s role, scope of responsibilities, experience and skills. Market practices are also considered in setting base salaries. Base salaries are intended to assist us in attracting executives and recognizing differing levels of responsibility and contribution among executives.
Cash Bonus or Variable Incentive
In addition to base salary, annual cash bonuses are another important piece of total compensation for our executive officers. Annual bonus opportunities are intended to support the achievement of our business strategies by tying a meaningful portion of compensation to the achievement of established objectives for the year. These objectives are discussed in more detail below. Annual bonus opportunities also are a key tool in attracting highly sought-after executives, and cash bonuses add a variable component to our overall compensation structure.
148
Equity Incentive Grants of RSUs
Our equity-based incentive program, through which we grant RSUs, is a key element of the total compensation for our executive officers. This equity-based incentive program is intended to attract and retain highly qualified individuals, align their long term interests with those of our shareholders, avoid short term focus and effectively execute our long term business strategies. Our equity-based compensation is subject to multi-year vesting requirements by which executives’ gains can either be realized through (i) the achievement of set performance criteria and continued employment through the vesting period, or, simply, (ii) continued employment through the vesting period.
We believe that our executive officers should also own and hold our equity to further align their interests with the long-term interests of our shareholders and further promote our commitment to sound corporate governance practices. To achieve this, we have adopted share ownership guidelines, pursuant to which each executive officer is required to achieve their respective target share ownership level over a period of five years. For further details see “Part I – Item 6E Share Ownership – Share Ownership Guidelines.”
Other Benefits and Perquisites
We provide benefits and perquisites to our executive officers that are generally available to and consistent with those provided to our other employees in the country in which the executive officer is located. We believe these benefits are consistent with the objectives of our compensation philosophy and allow our executive officers to work more efficiently. Such benefits and perquisites are intended to enhance the competitiveness of our overall compensation program. Such benefits normally include medical, accidental and life insurance coverage, retirement benefits, club membership, reimbursement of telephone expenses, a car and related maintenance expenses, leased residential accommodation and other miscellaneous benefits which are customary in the location where the executive officer resides and are generally available to other employees in the country. All executive officers are covered by the directors’ and officers’ liability insurance policy maintained by us.
Severance Benefits
Under the terms of our employment agreements, we are sometimes obligated to pay severance or other enhanced benefits to our executive officers upon termination of their employment.
Our executive officers globally have enhanced levels of benefits based on their job level, seniority and probable loss of employment after a change in control. Executive officers generally are paid severance for a longer period as compared to other employees.
| | • | | Accelerated vesting of equity awards. All granted but unvested share options and RSUs would vest immediately and become exercisable (in the case of share options) by our executive officers subject to certain conditions set out in the applicable equity incentive plans or their individual employment agreements. |
| | • | | Severance and notice payment. Eligible terminated executive officers would receive severance and notice payments as reflected in their individual employment agreements. |
| | • | | Benefit continuation. Eligible terminated executive officers would receive basic employee benefits such as medical and life insurance and other perquisites as reflected in their individual employment agreements. |
In addition, we provide change in control severance protection to certain executive officers. Our Compensation Committee believes that such protection is intended to preserve employee morale and productivity and encourage retention in the face of the disruptive impact of an actual or rumored change in control. In addition, for executive officers, the program is intended to align executive officers’ and shareholders’ interests by enabling executive officers to consider corporate transactions that are in the best interests of our shareholders and other constituents without undue concern over whether the transactions may jeopardize the executive officers’ own interest or employment.
149
Our Assessment Process
Our Compensation Committee has established a number of processes to assist it in ensuring that our executive compensation programs are achieving their objectives. Our Compensation Committee typically reviews each component of compensation at least every 12 months with the goal of allocating compensation between long term and currently paid compensation and between cash andnon-cash compensation, and combining the compensation elements for each executive in a manner we believe best fulfills the objectives of our compensation programs.
Our Compensation Committee is responsible for reviewing the performance of each of our executive officers, approving the compensation level of each of our executive officers, establishing criteria for the grant of equity awards for each of our executive officers and approving such equity grants. Each of these tasks is generally performed annually by our Compensation Committee.
There are no predetermined individual or corporate performance factors or goals that are used by our Compensation Committee to establish the amounts or mix of any elements of compensation for the executive officers. Our Compensation Committee works closely with our Group Chief Executive Officer, discussing with him our company’s overall performance and his evaluation of and compensation recommendations for our executive officers. From time to time, our Compensation Committee also seeks the advice and recommendations of an external compensation consultant to benchmark certain components of our compensation practices against those of its peers. The companies selected for such benchmarking include companies in similar industries and generally of similar sizes and market capitalizations. Where compensation information is not available for any specific position an executive officer holds for companies that provide business and technology services, our Compensation Committee reviews data corresponding to the most comparable position and also considers the comparative experience of executives.
Our Compensation Committee then utilizes its judgment and experience in making all compensation determinations. Our Compensation Committee’s determination of compensation levels is based upon what the members of the committee deem appropriate, considering information such as the factors listed above, as well as input from our Group Chief Executive Officer and, from time to time, information and advice provided by an independent compensation consultant.
Other processes that our Compensation Committee has established to assist in ensuring that our compensation programs operate in line with their objectives are:
| | • | | Assessment of Company Performance: Our Compensation Committee uses financial performance measures to determine a significant portion of the size of payouts under our cash bonus program. The financial performance measures, adopted on improving both top line (which refers to our revenue less repair payments(non-GAAP) as described in “Part I — Item 5. Operating and Financial Review and Prospects — Overview”) and bottom line (which refers to our adjusted net income (“ANI”)(non-GAAP), which is calculated as our profit excluding impairment of goodwill, share-based compensation expense and amortization of intangible assets) and other measures, such as operating margin arepre-established by our Compensation Committee annually at the beginning of the fiscal year. When thepre-determined financial measures are achieved, executive officers receive amounts that are set for these targets. These measures reflect targets that are intended to be aggressive but attainable. The remainder of an individual’s payout under our cash bonus program is determined by the achievement of individual performance objectives. |
150
| | • | | Assessment of Individual Performance: Individual performance has a strong impact on the compensation of all employees, including our executive officers. The evaluation of an individual’s performance determines a portion of the size of payouts under our cash bonus program and also influences any changes in base salary. At the beginning of each fiscal year, our Compensation Committee, along with our Group Chief Executive Officer, set the respective performance objectives for the fiscal year for the executive officers. The performance objectives are initially proposed by our Group Chief Executive Officer and modified, as appropriate, by our Compensation Committee based on the performance assessment conducted for the preceding fiscal year and also looking at goals for the current fiscal year. Every evaluation metric is supplemented with key performance indicators. At the end of the fiscal year, our Group Chief Executive Officer discusses individuals’ respective achievement of thepre-established objectives as well as their contribution to our company’s overall performance and other leadership accomplishments. This evaluation is shared with our Compensation Committee. After the discussion, our Compensation Committee, in discussion with our Group Chief Executive Officer, assigns a corresponding numerical performance rating that translates into specific payouts under our cash bonus program and also influences any changes in base salary. |
The Compensation Committee approves awards under our cash bonus or variable incentive program consistent with the achievement of applicable goals. The Committee on occasion makes exceptions to payments in strict accordance with achievement of goals based on unusual or extraordinary circumstances. Executive officers must be on the payroll of our company on the last day of the fiscal year, March 31, to be eligible for payment under our cash bonus or variable incentive program.
Although most of our compensation decisions are taken in the first quarter of the fiscal year, our compensation planning process neither begins nor ends with any particular Compensation Committee meeting. Compensation decisions are designed to promote our fundamental business objectives and strategy. Our Compensation Committee periodically reviews related matters such as succession planning, evaluation of management performance and consideration of the business environment and considers such matters in making compensation decisions.
Benchmarking and Use of Compensation Consultant for Fiscal 2017
During fiscal 2017, our Compensation Committee reviewed compensation programs for our executive officers against publicly available compensation data, which was compiled directly by our external compensation consultant. The companies selected by our external compensation consultant for its survey for benchmarking our executive officers’ compensation included companies in similar industries and generally of similar sizes and market capitalizations.
The list of peer companies against which we benchmarked the compensation of our executive officers in fiscal 2017 included the following:
| | • | | EXL Service Holdings Inc.; |
| | • | | Wipro Technologies (BPO); and |
| | • | | Tata Consultancy Services (BPO). |
151
Our Compensation Committee used the data derived by our external compensation consultant primarily to ensure that our executive compensation programs are competitive. A selected subset of peer companies from those listed above that were found most closely comparable as benchmark for a particular position were considered to arrive at the compensation benchmark review of individual executive officers. Where compensation information was not publicly disclosed for a specific management position in the relevant industry, our Compensation Committee reviewed data corresponding to the most comparable position and also considered the comparative experience of the relevant executive officers.
There is enough flexibility in the existing compensation programs to respond and adjust to the evolving business environment. Accordingly, an individual’s compensation elements could be changed by our Compensation Committee based on changes in job responsibilities of the executive. In addition to input from our external compensation consultant’s survey, our Compensation Committee also took into consideration our performance and industry indicators in deciding our compensation for fiscal 2017.
Based on the elements listed above and in line with our compensation philosophy, in fiscal 2017 our Compensation Committee adjusted our executive officers compensation as described in “—Executive Compensation for Fiscal 2017” below.
Executive Compensation for Fiscal 2017
Total Compensation of Executive Officers
The following table sets forth the total compensation paid or proposed to be paid to each of our Chief Executive Officer, Chief Financial Officer and other named executive officers for services rendered in fiscal 2017 (excluding grants of RSUs which are described below).
| | | | | | | | | | | | | | | | |
Name | | Base Salary(1) | | | Benefits | | | Bonus | | | Total | |
Keshav R. Murugesh | | $ | 618,761 | | | $ | 59,989 | | | $ | 1,470,040 | | | $ | 2,148,790 | |
Sanjay Puria | | $ | 238,136 | | | $ | 12,837 | | | $ | 375,050 | | | $ | 626,023 | |
Ronald Gillette | | $ | 388,518 | | | $ | 20,922 | | | $ | 500,885 | | | $ | 910,325 | |
Swaminathan Rajamani | | $ | 194,023 | | | $ | 10,606 | | | $ | 177,713 | | | $ | 382,342 | |
| | | | | | | | | | | | | | | | |
Total | | $ | 1,439,438 | | | $ | 104,354 | | | $ | 2,523,688 | | | $ | 4,067,480 | |
| | | | | | | | | | | | | | | | |
Note:
| (1) | Base salary does not include amount contributed towards provident fund which is set out in the table under “—Other Benefits and Perquisites.” |
Base Salary or Fixed Compensation
In reviewing base salaries for executive officers, our Compensation Committee reviewed compensation programs for our executive officers against publicly available compensation data compiled by our external compensation consultant and considered local market conditions, market data, the executive officer’s experience and responsibilities, the perceived risk of having to replace the named executive officer and the fact that the executive officers for fiscal 2017 had satisfactorily performed against their prior year’s individual performance objectives.
152
Our Compensation Committee has made the following changes to the base salary:
| | • | | Mr. Keshav R. Murugesh’s base salary (including employer contribution towards Provident Fund (Retirement Benefit)) was revised to $733,901 from $658,207 in fiscal 2017. The salary revision was effective February 19, 2017. |
| | • | | Mr. Sanjay Puria’s base salary (including employer contribution towards Provident Fund (Retirement Benefit)) was revised to $250,143 from $223,342 in fiscal 2017. The salary revision was effective April 1, 2016. |
| | • | | Mr. Ronald Gillette’s base salary (including employer contribution towards Provident Fund (Retirement Benefit)) was revised to $408,107 from $386,832 in fiscal 2017. The salary revision was effective April 1, 2016. |
| | • | | Mr. Swaminathan Rajamani’s base salary (including employer contribution towards Provident Fund (Retirement Benefit)) was revised to $203,806 from $183,609 in fiscal 2017. The salary revision was effective April 1, 2016. |
Cash Bonus or Variable Incentive
Our Compensation Committee believes that the executive officers must work as a team and focus primarily on company goals rather than solely on individual goals. Our Compensation Committee believes that enhancing the long term value of our company requires increased revenue (both from existing and new clients), improved contribution and increased ANI(non-GAAP). Finally our Compensation Committee believes it must also reward and encourage individual performance and therefore assigned certain weightages of the variable incentive to company and individual objectives, including achievement of targets for our revenue less repair payments(non-GAAP), ANI(non-GAAP), operating margin and certain individual goals for various executive officers. Such bonuses are typically paid in April and/or May each year. The aggregate amount of all cash bonuses to be paid for fiscal 2017 does not exceed the aggregate cash bonus pool approved by our Compensation Committee for fiscal year 2017. Each of our executive officers’ variable incentive packages for fiscal 2017 are as described below:
Our Compensation Committee set Mr. Murugesh’s target variable incentive, or cash bonus, for 2017 at $ 917,376 for 100% achievement of objectives. Our Compensation Committee assigned as Mr. Murugesh’s performance objectives the achievement of targets for our revenue less repair payments(non-GAAP) and ANI(non-GAAP), and individual performance objectives. Mr. Murugesh earned 176.4% of his variable incentive amount on an overall basis.
Our Compensation Committee set Mr. Puria’s target variable incentive for 2017 at $ 212,621 for 100% achievement of objectives. Our Compensation Committee assigned as Mr. Puria’s performance objectives the achievement of targets for our revenue less repair payments(non-GAAP) and ANI(non-GAAP), and individual performance objectives. Based on actual performance against these various objectives, Mr. Puria earned 176.4% of his variable incentive amount on an overall basis.
Our Compensation Committee set Mr. Gillette’s target variable incentive for 2017 at $ 408,107 for 100% achievement of objectives. Our Compensation Committee assigned as Mr. Gillette’s performance objectives the achievement of targets for revenue less repair payments(non-GAAP), ANI(non-GAAP) and operating margins for our various vertical business units, and individual performance objectives. Based on actual performance against these various objectives, Mr. Gillette earned 122.7% of his variable incentive amount on an overall basis.
Our Compensation Committee set Mr. Swaminathan’s target variable incentive for 2017 at $ 101,903 for 100% achievement of objectives. Our Compensation Committee assigned as Mr. Swaminathan’s performance objectives the achievement of targets for our revenue less repair payments(non-GAAP) and ANI(non-GAAP), and individual performance objectives. Based on actual performance against these various objectives, Mr. Swaminathan earned 174.4% of his variable incentive amount on an overall basis.
153
Equity Incentive Grants of RSUs
During fiscal 2017, we continued the equity incentive scheme which has a vesting schedule linked to continued employment with our company through vesting date, achievement of financial performance targets and achievement of a certain level of share price appreciation.
Consistent with our philosophy on equity grants to our executive officers, we awarded the following number of RSUs to our executive officers during fiscal 2017:
| | | | | | | | | | | | |
Name | | Date of grant | | | Total RSUs
granted for
fiscal 2017 | | | Grant date
fair value
($)(1) | |
Keshav R. Murugesh | | | 27-Apr-16 | | | | 195,840 | (2) | | | 31.21 | (2) |
| | | 27-Apr-16 | | | | 54,400 | (3)(4) | | | 12.56 | (3)(4) |
Sanjay Puria | | | 27-Apr-16 | | | | 22,200 | (5) | | | 31.21 | (5) |
| | | 27-Apr-16 | | | | 5,000 | (3)(6) | | | 12.56 | (3)(6) |
Ronald Gillette | | | 27-Apr-16 | | | | 27,360 | (5) | | | 31.21 | (5) |
| | | 27-Apr-16 | | | | 5,000 | (3)(6) | | | 12.56 | (3)(6) |
Swaminathan Rajamani | | | 27-Apr-16 | | | | 15,120 | (5) | | | 31.21 | (5) |
| | | 27-Apr-16 | | | | 5,000 | (3)(6) | | | 12.56 | (3)(6) |
Notes:
| (1) | The amounts shown under this column reflect the dollar amount of the grant date fair value of equity-based RSUs granted during the year. |
| (2) | These RSUs vest according to the following schedule: 8,160 RSUs vest quarterly on the completion of each of the first eight quarters following the grant date; 5,440 RSUs vest quarterly on the completion of each of the four quarters following the first eight quarters following the grant date; and 108,800 RSUs vest on the third anniversary of the grant date, subject to Mr. Murugesh’s continued employment with our company through the vesting date and the achievement of certain conditions relating to financial performance. The fair value of these RSUs is generally the market price of our shares on the date of grant. |
| (3) | Following the referendum in the United Kingdom in June 2016 in which voters decided to withdraw from the EU, financial markets experienced increased volatility and we experienced a decline in the price of our ADSs. Consequently, our Compensation Committee decided to extend the timeframe (including the condition of being in the employment) in which RSUs with vesting linked to ADS price performance granted to the executive officer could meet specified ADS price targets. |
| (4) | Pursuant to amendment agreements dated March 15, 2017 between our company and Mr. Murugesh, the following amendments to the vesting schedule were made to previously granted RSUs, the vesting of which were originally scheduled on the third anniversary of the grant date subject to the achievement of a specified target ADS price over a period of time prior to a date determined by reference to the vesting date and Mr. Murugesh’s continued employment with our company through the vesting date: |
| | • | | With respect to 70,551 RSUs granted in April 2014, the vesting date (and accordingly the date by which the specified target ADS price condition must be met) has been extended to the fifth anniversary of the grant date (that is, April 2019). These RSUs granted in April 2014 are not included in the table above which sets out RSUs granted during fiscal 2017. |
| | • | | With respect to 59,039 RSUs granted in April 2015, the vesting date (and accordingly the date by which the specified target ADS price condition must be met) has been extended to the fourth anniversary of the grant date (that is, April 2019). These RSUs granted in April 2015 are not included in the table above which sets out RSUs granted during fiscal 2017. |
| | • | | With respect to 54,400 RSUs granted in April 2016, the vesting date (and accordingly the date by which the target ADS price condition must be met) has been extended to the fourth anniversary of the grant date (that is, April 2020). These RSUs, as amended, are included in the table above. |
As a result of these amendments, the fair values of these RSUs, which have been determined using Monte-Carlo simulation, have been revised as follows and the additional cost of $1.2 million is amortized over the period from the modification date until the vesting date of the modified RSU, which differs from the vesting date of the original RSU.
| | | | | | | | |
Date of Grant | | Original grant date fair value
($) | | | Revised grant date fair value
($) | |
April 2014 | | | 2.82 | | | | 13.37 | |
April 2015 | | | 6.37 | | | | 11.65 | |
April 2016 | | | 12.56 | | | | 14.30 | |
| (5) | These RSUs include a base grant and a supplemental grant of 20% of the base grant. The RSUs in the base grant vest according to the following schedule: 5% of the RSUs awarded vest quarterly on the completion of each of the first twelve quarters following the grant date and 40% of the RSUs awarded vest on the third anniversary of the grant date, subject to awardee’s continued employment with our company through the vesting date and the achievement of conditions of financial performance. The awardee will be eligible for the additional vesting of up to 20% of the base grant pursuant to the supplemental grant, with the RSUs awarded pursuant to such supplemental grant vesting on the third anniversary of the grant date, subject to awardee’s continued employment with our company through the vesting date and the achievement of conditions of financial performance as determined by our Compensation Committee. The fair value of these RSUs is generally the market price of our shares on the date of grant. |
154
| (6) | Pursuant to an amendment agreement dated March 15, 2017 between our company and the executive officer, amendments to the vesting schedule were made to the 5,000 RSUs granted to the executive officer in April 2016, the vesting of which were originally scheduled on the third anniversary of the grant date subject to the achievement of a specified target ADS price over a period of time prior to a date determined by reference to the vesting date and the executive officer’s continued employment with our company through the vesting date. The vesting date (and accordingly the date by which the target ADS price condition must be met) has been extended to the fourth anniversary of the grant date (that is, April 2020) (and, for the RSUs of Mr. Ronald Gillette, such extension is conditional upon the target ADS price not being met by the original reference date). As a result of these amendments, the fair values of these RSUs, which have been determined using Monte-Carlo simulation, have been revised from $12.56 to $14.30 and the additional cost is amortized over the period from the modification date until the vesting date of the modified RSU, which differs from the vesting date of the original RSU. |
Other Benefits and Perquisites
The retirement plans, health and welfare benefits provided to executive officers are the same plans and benefits available to all other employees of our company.
All directors and officers, including executive officers, are covered by the directors’ and officers’ liability insurance policy maintained by our company.
Additional perquisites provided to executive officers in fiscal 2017 are summarized below:
| | | | | | | | | | | | | | | | |
Name | | Provident
fund | | | Insurance
benefits | | | Club
membership | | | Total | |
Keshav R. Murugesh | | $ | 48,007 | | | $ | 1,956 | | | $ | 10,026 | | | $ | 59,989 | |
Sanjay Puria | | $ | 12,007 | | | $ | 830 | | | $ | — | | | $ | 12,837 | |
Ronald Gillette | | $ | 19,589 | | | $ | 1,333 | | | $ | — | | | $ | 20,922 | |
Swaminathan Rajamani | | $ | 9,783 | | | $ | 823 | | | $ | — | | | $ | 10,606 | |
| | | | | | | | | | | | | | | | |
Total | | $ | 89,386 | | | $ | 4,942 | | | $ | 10,026 | | | $ | 104,354 | |
| | | | | | | | | | | | | | | | |
155
Non-executive Director Compensation for Fiscal 2017
Total Compensation ofNon-executive Directors
The following table sets forth the compensation paid or proposed to be paid to ournon-executive directors for services rendered in fiscal 2017 (excluding grants of RSUs which are described below):
| | | | | | | | | | | | |
Name | | Retainership
fees | | | Retainership fees for
Board/Committee Chairman | | | Total | |
Adrian Dillon | | $ | — | | | $ | 160,000 | (1) | | $ | 160,000 | |
Albert Aboody | | $ | 63,000 | | | $ | 30,000 | (2) | | $ | 93,000 | |
Gareth Williams | | $ | 63,000 | | | $ | 20,000 | (3) | | $ | 83,000 | |
John Freeland | | $ | 63,000 | | | $ | — | | | $ | 63,000 | |
Michael Menezes | | $ | 63,000 | | | $ | — | | | $ | 63,000 | |
Renu S. Karnad | | $ | 63,000 | | | $ | 5,109 | (4) | | $ | 68,109 | |
Francoise Gri | | $ | 63,000 | | | $ | — | | | $ | 63,000 | |
Sir Anthony Greener(5) | | $ | 30,815 | | | $ | 4,891 | (4) | | $ | 35,706 | |
| | | | | | | | | | | | |
| | $ | 408,815 | | | $ | 220,000 | | | $ | 628,815 | |
| | | | | | | | | | | | |
Notes:
| (1) | Fee paid to Mr. Adrian T. Dillon for serving as chairman of our Board of Directors in fiscal 2017. |
| (2) | Fee paid to Mr. Albert Aboody for serving as chairman of our Audit Committee in fiscal 2017. |
| (3) | Fee paid to Mr. Gareth Williams for serving as chairman of our Compensation Committee in fiscal 2017. |
| (4) | Fee paid to Sir Anthony Greener and Renu S. Karnad for serving as chairman of our Nominating and Corporate Governance Committee from April 1, 2016 to September 26, 2016 and from September 27, 2016 to March 31, 2017, respectively, in fiscal 2017. |
| (5) | Sir Anthony Greener retired as a director of our Company with effect from September 27, 2016. |
Equity Incentive Grants of RSUs toNon-executive Directors
The following table sets forth information concerning RSUs awarded to ournon-executive directors in fiscal 2017 with a vesting period of one year. No options were granted in fiscal 2017.
| | | | | | | | | | | | | | | | |
Name | | Date of grant | | | Total RSUs
granted for
fiscal 2017 | | | Grant date
fair value
($)(1) | | | Expiration
date | |
Adrian T. Dillon | | | 13-Jul-16 | | | | 8,702 | | | $ | 27.58 | | | | 12-Jul-26 | |
Albert Aboody | | | 13-Jul-16 | | | | 3,426 | | | $ | 27.58 | | | | 12-Jul-26 | |
Gareth Williams | | | 13-Jul-16 | | | | 3,426 | | | $ | 27.58 | | | | 12-Jul-26 | |
John Freeland | | | 13-Jul-16 | | | | 3,426 | | | $ | 27.58 | | | | 12-Jul-26 | |
Michael Menezes | | | 13-Jul-16 | | | | 3,426 | | | $ | 27.58 | | | | 12-Jul-26 | |
Renu S. Karnad | | | 13-Jul-16 | | | | 3,426 | | | $ | 27.58 | | | | 12-Jul-26 | |
Françoise Gri | | | 13-Jul-16 | | | | 3,426 | | | $ | 27.58 | | | | 12-Jul-26 | |
Sir Anthony Greener(2) | | | 13-Jul-16 | | | | 3,426 | | | $ | 27.58 | | | | 12-Jul-26 | |
Notes:
| (1) | The amounts shown under this column reflect the dollar amount of the aggregate grant date fair value of equity-based RSUs granted during the year. The fair value of RSUs is generally the market price of our shares on the date of grant. |
| (2) | Sir Anthony Greener retired as a director of our company with effect from September 27, 2016. |
156
Future grants of awards will continue to be determined by our Board of Directors or our Compensation Committee under the 2016 Incentive Award Plan.
Employment Agreement of our Executive Director
We entered into an employment agreement with Mr. Keshav R. Murugesh in February 2010, which was amended with effect from February 19, 2013, to serve as our Group Chief Executive Officer for a five-year term, which will renew automatically for three additional successive terms of three years each, unless either we or Mr. Murugesh elects not to renew the term. Our employment agreement with Mr. Murugesh was further amended effective February 19, 2014 and February 19, 2017 to revise Mr. Murugesh’s compensation (including share grants).
Under the terms of the amended agreement, Mr. Murugesh is entitled to receive compensation, health and other benefits and perquisites commensurate with his position. Pursuant to the agreement, Mr. Murugesh will be eligible to receive annually such number of RSUs to be computed based on our average share price (taking the daily US dollar closing price) during March of the fiscal year preceding the date of such determination and the value of such grant shall not be less than eight times the sum of his annual base salary. Mr. Murugesh is entitled to receive additional performance-based grants for meeting additional performance-based criteria, the value of such grant being up to 50% of eight times the sum of his annual base salary. Any grants of RSUs to Mr. Murugesh will be made pursuant to and in accordance with our 2016 Incentive Award Plan.
If Mr. Murugesh’s employment is terminated by us without cause or by Mr. Murugesh for good reason (each as defined in the amended agreement) or is terminated for any reason other than those specified in the amended agreement (including without limitation, expiration of his employment period or we elect not to extend his employment), he would be entitled to all accrued and unpaid salary, accrued and unused vacation and any unreimbursed expenses. Mr. Murugesh would also be entitled to vested benefits and other amounts due to him under our employee benefit plans. Further, where Mr. Murugesh’s employment is terminated for any reason other than those specified in the amended agreement (including without limitation, expiration of his employment period or we elect not to extend his employment), he will also be entitled to his base salary for a period of 12 months from the effective date of termination and his target bonus for the year in which the termination occurs, both of which will be paid immediately, and all of the share options and RSUs granted to him will vest and the share options and RSUs would become exercisable on a fully accelerated basis.
Further, where Mr. Murugesh’s employment is terminated for reasons of death, disability or retirement as specified in the amended agreement, he would be entitled to all accrued and unpaid salary and bonus, accrued and unused vacation, any unreimbursed expenses and vested benefits and other amounts due to him under our employee benefit plans, and all of the share options and RSUs granted to him will vest and the share options and RSUs would become exercisable on a fully accelerated basis.
In addition to the above, if Mr. Murugesh’s employment is terminated by us without cause or by Mr. Murugesh for good reason, and Mr. Murugesh executes and delivers anon-revocable general release of claims in favor of our company, subject to his continued compliance with certainnon-competition and confidentiality obligations, Mr. Murugesh would be entitled to receive the following severance payments and benefits from us:
| 1. | His base salary for a period of 12 months from the effective date of termination, which will be paid immediately; |
| 2. | His target bonus for the year in which the termination occurs, which will be paid immediately; and |
| 3. | Automatic accelerated vesting of RSUs or share options granted him that would have vested with him through the next two vesting dates of each grant from the effective date of termination. Full accelerated vesting will occur in case of termination of employment for good reason. |
If we experience a change in control (as defined in our Third Amended and Restated 2006 Incentive Award Plan for awards granted under that plan or as defined in our 2016 Incentive Award Plan for awards granted under that plan) while Mr. Murugesh is employed under the employment agreement, all of the share options and RSUs granted to Mr. Murugesh under the employment agreement will vest and the share options and RSUs would become exercisable on a fully accelerated basis.
157
Employee Benefit Plans
Third Amended and Restated 2006 Incentive Award Plan
We adopted our 2006 Incentive Award Plan on June 1, 2006. The purpose of the 2006 Incentive Award Plan was to promote the success and enhance the value of our company by linking the personal interests of the directors, employees and consultants of our company and our subsidiaries to those of our shareholders and by providing these individuals with an incentive for outstanding performance. The 2006 Incentive Award Plan was further intended to provide us with the ability to motivate, attract and retain the services of these individuals. On February 13, 2009, we adopted the Amended and Restated 2006 Incentive Award Plan. The Amended and Restated 2006 Incentive Award Plan reflects, among other changes to our 2006 Incentive Award Plan, an increase in the number of ordinary shares and ADSs available for grant under the plan from 3.0 million to 4.0 million shares/ADSs, subject to specified adjustments under the plan. On September 13, 2011, we adopted the Second Amended and Restated 2006 Incentive Award Plan that reflects an increase in the number of ordinary shares and ADSs available for granted under the plan to 6.2 million shares/ADSs, subject to specified adjustments under the plan. On September 25, 2013, we adopted the Third Amended and Restated 2006 Incentive Award Plan that reflects an increase in the number of ordinary shares and ADSs available for grant under the plan to 8.6 million shares/ADSs, subject to specified adjustments under the plan. On May 31, 2016, our Third Amended and Restated 2006 Incentive Award Plan expired pursuant to its terms.
Shares Available for Awards
Subject to certain adjustments set forth in the Third Amended and Restated 2006 Incentive Award Plan, the maximum number of shares that could be issued or awarded under the Third Amended and Restated 2006 Incentive Award Plan was equal to the sum of (x) 8,600,000 shares, (y) any shares that remained available for issuance under our 2002 Stock Incentive Plan (which was adopted on July 3, 2002 and terminated upon the effective date of our 2006 Incentive Award Plan), and (z) any shares subject to awards under the 2002 Stock Incentive Plan which terminated, expired or lapsed for any reason or were settled in cash on or after the effective date of our 2006 Incentive Award Plan. As of the date of termination of the 2002 Stock Incentive Plan on July 25, 2006, the day immediately preceding the date of pricing of our initial public offering, an aggregate of 6,082,042 of our ordinary shares had been authorized for grant under the 2002 Stock Incentive Plan. The maximum number of shares which could be subject to awards granted to any one participant during any calendar year was 500,000 shares and the maximum amount that could be paid to a participant in cash during any calendar year with respect to cash-based awards was $10,000,000. To the extent that an award terminated or was settled in cash, any shares subject to the award would again be available for the grant. Any shares tendered or withheld to satisfy the grant or exercise price or tax withholding obligation with respect to any award would not be available for subsequent grant. Except as described below with respect to independent directors, no determination was made as to the types or amounts of awards that would be granted to specific individuals pursuant to the Third Amended and Restated 2006 Incentive Award Plan.
Administration. The Third Amended and Restated 2006 Incentive Award Plan is administered by our Board of Directors, which may delegate its authority to a committee. We anticipate that our Compensation Committee will administer the Third Amended and Restated 2006 Incentive Award Plan, except that our Board of Directors will administer the plan with respect to awards granted to our independent directors. The plan administrator determined eligibility, the types and sizes of awards, the price and timing of awards and the acceleration or waiver of any vesting restriction, provided that the plan administrator would not have the authority to accelerate vesting or waive the forfeiture of any performance-based awards.
Eligibility. Our employees, consultants and directors and those of our subsidiaries were eligible to be granted awards, except that only employees of our company and our qualifying corporate subsidiaries were eligible to be granted options that are intended to qualify as “incentive share options” under Section 422 of the United States Internal Revenue Code of 1986, as amended (the “Code”).
Awards
Options: The plan administrator was able to grant options on shares. The per share option exercise price of all options granted pursuant to the Third Amended and Restated 2006 Incentive Award Plan would not be less than 100% of the fair market value of a share on the date of grant. No incentive share option could be granted to a grantee who owned more than 10% of our outstanding shares unless the exercise price was at least 110% of the fair market value of a share on the date of grant. To the extent that the aggregate fair market value of the shares subject to an incentive share option became exercisable for the first time by any option holder during any calendar year exceeded $100,000, such excess would be treated as anon-qualified option. The plan administrator would determine the methods of payment of the exercise price of an option, which could include cash, shares or other property acceptable to the plan administrator (and could involve a cashless exercise of the option). The plan administrator designated in the award agreement evidencing each share option grant whether such share option would be exercisable for shares or ADSs. The award agreement could, in the sole discretion of the plan administrator, permit the option holder to elect, at the time of exercise, whether to receive shares or ADSs in respect of the exercised share option or a portion thereof. The term of options granted under the Third Amended and Restated 2006 Incentive Award Plan could not exceed ten years from the date of grant. However, the term of an incentive share option granted to a person who owns more than 10% of our outstanding shares on the date of grant could not exceed five years. Under the Third Amended and Restated 2006 Incentive Award Plan, the number of awards to be granted to our independent directors was determined by our Board of Directors or our Compensation Committee.
158
Restricted Shares. The plan administrator could grant shares subject to various restrictions, including restrictions on transferability, limitations on the right to vote and/or limitations on the right to receive dividends.
Share Appreciation Rights. The plan administrator could grant share appreciation rights representing the right to receive payment of an amount equal to the excess of the fair market value of a share on the date of exercise over the fair market value of a share on the date of grant. The term of share appreciation rights granted could not exceed ten years from the date of grant. The plan administrator could elect to pay share appreciation rights in cash, in shares or in a combination of cash and shares.
Performance Shares and Performance Share Units. The plan administrator could grant awards of performance shares denominated in a number of shares and/or awards of performance share units denominated in unit equivalents of shares and/or units of value, including dollar value of shares. These awards could be linked to performance criteria measured over performance periods as determined by the plan administrator.
Share Payments. The plan administrator could grant share payments, including payments in the form of shares or options or other rights to purchase shares. Share payments could be based upon specific performance criteria determined by the plan administrator on the date such share payments were made or on any date thereafter.
Deferred Shares. The plan administrator could grant awards of deferred shares linked to performance criteria determined by the plan administrator. Shares underlying deferred share awards would not be issued until the deferred share awards have vested, pursuant to a vesting schedule or upon the satisfaction of any vesting conditions or performance criteria set by the plan administrator. Recipients of deferred share awards generally have no rights as shareholders with respect to such deferred shares until the shares underlying the deferred share awards have been issued.
Restricted Share Units. The plan administrator could grant RSUs, subject to various vesting conditions. On the maturity date, we will transfer to the participant one unrestricted, fully transferable share for each vested RSU scheduled to be paid out on such date. The plan administrator specified the purchase price, if any, to be paid by the participant for such shares. Generally, a participant will have to be employed by us on the date of payment of vested RSUs to be eligible to receive the payment of shares issuable upon vesting of the RSUs.
Performance Bonus Awards. The plan administrator could grant a cash bonus payable upon the attainment of performance goals based on performance criteria and measured over a performance period determined appropriate by the plan administrator. Any such cash bonus paid to a “covered employee” within the meaning of Section 162(m) of the Code could be a performance-based award as described below.
Performance-Based Awards. The plan administrator could grant awards other than options and share appreciation rights to employees who are or may be “covered employees,” as defined in Section 162(m) of the Code, that are intended to be performance-based awards within the meaning of Section 162(m) of the Code in order to preserve the deductibility of these awards for federal income tax purposes. Participants are only entitled to receive payment for performance-based awards for any given performance period to the extent thatpre-established performance goals set by the plan administrator for the period are satisfied. The plan administrator determined the type of performance-based awards to be granted, the performance period and the performance goals. Generally, a participant will have to be employed by us on the date the performance-based award is paid to be eligible for a performance-based award for any period.
Adjustments. In the event of certain changes in our capitalization, the plan administrator has broad discretion to adjust awards, including without limitation, (i) the aggregate number and type of shares that could be issued under the Third Amended and Restated 2006 Incentive Award Plan, (ii) the terms and conditions of any outstanding awards, and (iii) the grant or exercise price per share for any outstanding awards under such plan to account for such changes. The plan administrator also has the authority to cash out, terminate or provide for the assumption or substitution of outstanding awards in the event of a corporate transaction.
Change in Control. In the event of a change in control of our company in which outstanding awards are not assumed by the successor, such awards will generally become fully exercisable and all forfeiture restrictions on such awards will lapse. Upon, or in anticipation of, a change in control, the plan administrator may cause any awards outstanding to terminate at a specific time in the future and give each participant the right to exercise such awards during such period of time as the plan administrator, in its sole discretion, determines.
159
Vesting of Full Value Awards. Full value awards (generally, any award other than an option or share appreciation right) will vest over a period of at least three years (or, in the case of vesting based upon attainment of certain performance goals, over a period of at least one year). However, full value awards that result in the issuance of an aggregate of up to 5% to the total issuable shares under the Third Amended and Restated 2006 Incentive Award Plan may be granted without any minimum vesting periods. In addition, full value awards may vest on an accelerated basis in the event of a participant’s death, disability, or retirement, or in the event of our change in control or other special circumstances.
Non-transferability. Awards granted under the Third Amended and Restated 2006 Incentive Award Plan are generally not transferable.
Withholding. We have the right to withhold, deduct or require a participant to remit to us an amount sufficient to satisfy federal, state, local or foreign taxes (including the participant’s employment tax obligations) required by law to be withheld with respect to any tax concerning the participant as a result of the Third Amended and Restated 2006 Incentive Award Plan.
Termination or Amendment. On May 31, 2016, our Third Amended and Restated 2006 Incentive Award Plan expired pursuant to its terms.
Outstanding Awards. As at March 31, 2017, options or RSUs to purchase an aggregate of 3,160,644 ordinary shares were outstanding, out of which options or RSUs to purchase 1,423,417 ordinary shares were held by all our directors and executive officers as a group. The exercise prices of these options range from $15.32 to $35.30 and the expiration dates of these options range from April 1, 2017 to April 26, 2026. The weighted average grant date fair value of RSUs granted during fiscal 2017, 2016 and 2015 were $30.26, $25.16 and $19.19 per ADS, respectively. There is no purchase price for the RSUs.
RSU Grants Outside of our Plans
On June 1, 2016, June 14, 2016 and July 13, 2016, we issued an aggregate of 44,284 restricted share units to certain of our employees and directors pursuant to an exemption from registration under the United States federal securities laws. We did not seek shareholder approval for these issuances as they are not required under the laws of Jersey.
2016 Incentive Award Plan
We adopted 2016 Incentive Award Plan on September 27, 2016. The purpose of the 2016 Incentive Award Plan is to promote the success and enhance the value of our company by linking the personal interests of the directors, employees, and consultants of our company and our subsidiaries to those of our shareholders and by providing such individuals with an incentive for outstanding performance to generate superior returns to our shareholders. The 2016 Incentive Award Plan is further intended to provide us with flexibility in our ability to motivate, attract, and retain the services of these individuals, upon whose judgment, interest, and special effort the successful conduct of our company’s operation is largely dependent.
Shares Available for Awards
Subject to certain adjustments set forth in the 2016 Incentive Award Plan, the maximum number of shares and ADSs, in the aggregate, which may be issued or transferred pursuant to awards under the 2016 Incentive Award Plan is equal to the sum of (x) 2,500,000 shares, and (y) any shares or ADSs which immediately prior to the expiration of the Third Amended and Restated 2006 Incentive Award Plan were available for issuance or transfer as new awards under the Third Amended and Restated 2006 Incentive Award Plan, and (z) any shares or ADSs subject to awards under the Third Amended and Restated 2006 Plan which terminate, expire, forfeit, lapse for any reason or are settled in cash on or after the effective date of the 2016 Incentive Award Plan. Immediately prior to the expiration of the Third Amended and Restated 2006 Incentive Award Plan, 1,112,825 shares were available for issuance or transfer as new awards thereunder. To the extent that an award terminates, expires, or lapses for any reason, or is settled in cash, any shares or ADSs subject to the award shall again be available for the grant of an award pursuant to the 2016 Incentive Award Plan. Any shares or ADSs tendered or withheld to satisfy the grant or exercise price or tax withholding obligation pursuant to any award shall not subsequently be available for grant of an award pursuant to the 2016 Incentive Award Plan.
Administration. The 2016 Incentive Award Plan is administered by our Board of Directors, which may delegate its authority to a committee. We anticipate that our Compensation Committee will administer The 2016 Incentive Award Plan, except that our Board of Directors will administer the plan with respect to awards granted to our independent directors. The plan administrator will determine eligibility, the types and sizes of awards, the price and timing of awards and the acceleration or waiver of any vesting restriction, provided that the plan administrator will not have the authority to accelerate vesting or waive the forfeiture of any performance-based awards.
Eligibility. Our employees, consultants and directors and those of our subsidiaries are eligible to be granted awards, except that only employees of our company and our qualifying corporate subsidiaries are eligible to be granted options that are intended to qualify as “incentive share options” under Section 422 of the Code.
160
Awards
Options: The plan administrator may grant options on shares. The per share option exercise price of all options granted pursuant to the 2016 Incentive Award Plan will not be less than 100% of the fair market value of a share on the date of grant. No incentive share option may be granted to a grantee who owns more than 10% of our outstanding shares unless the exercise price is at least 110% of the fair market value of a share on the date of grant. To the extent that the aggregate fair market value of the shares subject to an incentive share option become exercisable for the first time by any option holder during any calendar year exceeds $100,000, such excess will be treated as anon-qualified option. The plan administrator will determine the methods of payment of the exercise price of an option, which may include cash, shares or other property acceptable to the plan administrator (and may involve a cashless exercise of the option). The plan administrator shall designate in the award agreement evidencing each share option grant whether such share option shall be exercisable for shares or ADSs. The award agreement may, in the sole discretion of the plan administrator, permit the option holder to elect, at the time of exercise, whether to receive shares or ADSs in respect of the exercised share option or a portion thereof. The term of options granted under The 2016 Incentive Award Plan may not exceed ten years from the date of grant. However, the term of an incentive share option granted to a person who owns more than 10% of our outstanding shares on the date of grant may not exceed five years. Under The 2016 Incentive Award Plan, the number of awards to be granted to our independent directors will be determined by our Board of Directors or our Compensation Committee.
161
Restricted Shares. The plan administrator may grant shares subject to various restrictions, including restrictions on transferability, limitations on the right to vote and/or limitations on the right to receive dividends.
Share Appreciation Rights. The plan administrator may grant share appreciation rights representing the right to receive payment of an amount equal to the excess of the fair market value of a share on the date of exercise over the fair market value of a share on the date of grant. The term of share appreciation rights granted may not exceed ten years from the date of grant. The plan administrator may elect to pay share appreciation rights in cash, in shares or in a combination of cash and shares.
Performance Shares and Performance Share Units. The plan administrator may grant awards of performance shares denominated in a number of shares and/or awards of performance share units denominated in unit equivalents of shares and/or units of value, including dollar value of shares. These awards may be linked to performance criteria measured over performance periods as determined by the plan administrator.
Share Payments. The plan administrator may grant share payments, including payments in the form of shares or options or other rights to purchase shares. Share payments may be based upon specific performance criteria determined by the plan administrator on the date such share payments are made or on any date thereafter.
Deferred Shares. The plan administrator may grant awards of deferred shares linked to performance criteria determined by the plan administrator. Shares underlying deferred share awards will not be issued until the deferred share awards have vested, pursuant to a vesting schedule or upon the satisfaction of any vesting conditions or performance criteria set by the plan administrator. Recipients of deferred share awards generally will have no rights as shareholders with respect to such deferred shares until the shares underlying the deferred share awards have been issued.
Restricted Share Units. The plan administrator may grant RSUs, subject to various vesting conditions. On the maturity date, we will transfer to the participant one unrestricted, fully transferable share for each vested RSU scheduled to be paid out on such date. The plan administrator will specify the purchase price, if any, to be paid by the participant for such shares. Generally, a participant will have to be employed by us on the date of payment of vested RSUs to be eligible to receive the payment of shares issuable upon vesting of the RSUs.
Performance Bonus Awards. The plan administrator may grant a cash bonus payable upon the attainment of performance goals based on performance criteria and measured over a performance period determined appropriate by the plan administrator. Any such cash bonus paid to a “covered employee” within the meaning of Section 162(m) of the Code may be a performance-based award as described below.
Performance-Based Awards. The plan administrator may grant awards other than options and share appreciation rights to employees who are or may be “covered employees,” as defined in Section 162(m) of the Code, that are intended to be performance-based awards within the meaning of Section 162(m) of the Code in order to preserve the deductibility of these awards for federal income tax purposes. Participants are only entitled to receive payment for performance-based awards for any given performance period to the extent thatpre-established performance goals set by the plan administrator for the period are satisfied. The plan administrator will determine the type of performance-based awards to be granted, the performance period and the performance goals. Generally, a participant will have to be employed by us on the date the performance-based award is paid to be eligible for a performance-based award for any period.
Adjustments. In the event of certain changes in our capitalization, the plan administrator has broad discretion to adjust awards, including without limitation, (i) the aggregate number and type of shares that may be issued under The 2006 Incentive Award Plan, (ii) the terms and conditions of any outstanding awards, and (iii) the grant or exercise price per share for any outstanding awards under such plan to account for such changes. The plan administrator also has the authority to cash out, terminate or provide for the assumption or substitution of outstanding awards in the event of a corporate transaction.
Change in Control. In the event of a change in control of our company in which outstanding awards are not assumed by the successor, such awards will generally become fully exercisable and all forfeiture restrictions on such awards will lapse. Upon, or in anticipation of, a change in control, the plan administrator may cause any awards outstanding to terminate at a specific time in the future and give each participant the right to exercise such awards during such period of time as the plan administrator, in its sole discretion, determines.
162
Vesting of Full Value Awards. Full value awards (generally, any award other than an option or share appreciation right) will vest over a period of at least three years (or, in the case of vesting based upon attainment of certain performance goals, over a period of at least one year). However, full value awards that result in the issuance of an aggregate of up to 5% to the total issuable shares under the Third Amended and Restated 2006 Incentive Award Plan may be granted without any minimum vesting periods. In addition, full value awards may vest on an accelerated basis in the event of a participant’s death, disability, or retirement, or in the event of our change in control or other special circumstances.
Non-transferability. Awards granted under The 2016 Incentive Award Plan are generally not transferable.
Withholding. We have the right to withhold, deduct or require a participant to remit to us an amount sufficient to satisfy federal, state, local or foreign taxes (including the participant’s employment tax obligations) required by law to be withheld with respect to any tax concerning the participant as a result of The 2016 Incentive Award Plan.
Termination or Amendment. An Award of Performance Shares, Performance Share Units, Deferred Shares, Share Payments and Restricted Share Units shall only vest or be exercisable or payable while the Participant is an Employee, Consultant or a member of the Board, as applicable;provided, however, that the Committee in its sole and absolute discretion may provide that an Award of Performance Shares, Performance Share Units, Share Payments, Deferred Shares or Restricted Share Units may vest or be exercised or paid subsequent to a termination of employment or service, as applicable, or following a Change in Control of the Company, or because of the Participant’s retirement, death or Disability, or otherwise;provided, however, that, to the extent required to preserve tax deductibility under Section 162(m) of the Code, any such provision with respect to Performance Shares or Performance Share Units that are intended to constitute Qualified Performance-Based Compensation shall be subject to the requirements of Section 162(m) of the Code that apply to Qualified Performance-Based Compensation.
Outstanding Awards. As at March 31, 2017, options or RSUs to purchase an aggregate of 235,510 ordinary shares were outstanding, out of which options or RSUs to purchase Nil ordinary shares were held by all our directors and executive officers as a group. The expiration dates of these RSUs range from November 30, 2026 to March 22, 2027. The weighted average grant date fair value of RSUs granted during fiscal 2017, 2016 and 2015 were $30.26, $25.16 and $19.19 per ADS, respectively. There is no purchase price for the RSUs.
Other Employee Benefits
We also maintain other employee benefit plans in the form of certain statutory and incentive plans covering substantially all of our employees. For fiscal 2017, the total amount accrued by us to provide for pension, retirement or similar benefits was $12.9 million.
Provident Fund
In accordance with Indian, Philippines and Sri Lankan laws, all of our employees in these countries are entitled to receive benefits under the respective government provident fund, a defined contribution plan to which both we and the employee contribute monthly at apre-determined rate (for India and Sri Lanka, currently 12% of the employee’s base salary and for the Philippines, 100 Philippines pesos per month for every employee). These contributions are made to the respective government provident fund and we have no further obligation under this fund apart from our monthly contributions. We contributed an aggregate of $8.4 million, $5.9 million and $5.8 million in each of fiscal 2017, 2016 and 2015, respectively, to the government provident fund.
US Savings Plan
Eligible employees in the US participate in a savings plan (the “US Savings Plan”), pursuant to Section 401(k) of the Code. The US Savings Plan allows our employees to defer a portion of their annual earnings on apre-tax basis through voluntary contributions there under. The US Savings Plan provides that we can make optional contributions up to the maximum allowable limit under the Code.
163
UK Pension Scheme
Eligible employees in the UK contribute to a defined contribution pension scheme operated in the UK. The assets of the scheme are held separately from ours in an independently administered fund. The pension expense represents contributions payable to the fund by us.
Gratuity
In accordance with Indian, the Philippines and Sri Lankan laws, we provide for gratuity liability pursuant to a defined benefit retirement plan covering all our employees in India, the Philippines and Sri Lanka. Our gratuity plan provides for a lump sum payment to eligible employees on retirement, death, incapacitation or on termination of employment (provided such employee has worked for at least five years with our company) which is computed on the basis of employee’s salary and length of service with us (subject to a maximum of approximately $15,420 per employee in India). In India, we provide the gratuity benefit through determined contributions pursuant to anon-participating annuity contract administered and managed by the Life Insurance Corporation of India (“LIC”) and Aviva Life Insurance Company Private Limited. Under this plan, the obligation to pay gratuity remains with us although LIC and Aviva Life Insurance Company Private Limited administer the plan. We contributed an aggregate of $1.1 million, $0.9 million and $0.9 million in fiscal 2017, 2016 and 2015, respectively, to LIC and Aviva Life Insurance Company Private Limited.
Compensated Absence
Our liability for compensated absences, which are expected to be utilized or settled within one year, is determined on an accrual basis for the carried forward unused vacation balances standing to the credit of each employee as atyear-end and is charged to income in the year in which they accrue.
Our liability for compensated absences, which are expected to be utilized after one year is determined on the basis of an actuarial valuation using the projected unit credit method and is charged to income in the year in which they accrue.
C. Board Practices
Composition of the Board of Directors
Our Memorandum and Articles of Association provide that our Board of Directors consists of not less than three directors and such maximum number as our directors may determine from time to time. Our Board of Directors currently consists of eight directors. Each of Messrs. Dillon, Aboody, Williams, Freeland and Menezes, Mrs. Karnad, and Ms. Gri satisfies the “independence” requirements of the NYSE rules.
All directors hold office until the expiry of their term of office, their resignation or removal from office for gross negligence or criminal conduct by a resolution of our shareholders or until they cease to be directors by virtue of any provision of law or they are disqualified by law from being directors or they become bankrupt or make any arrangement or composition with their creditors generally or they become of unsound mind. The term of office of the directors is divided into three classes:
| | • | | Class I, whose term will expire at the annual general meeting to be held in fiscal 2020; |
| | • | | Class II, whose term will expire at the annual general meeting to be held in fiscal 2018; and |
| | • | | Class III, whose term will expire at the annual general meeting to be held in fiscal 2019. |
Our directors for fiscal 2017 are classified as follows:
| | • | | Class I: Mr. Gareth Williams and Mr. Adrian T. Dillon; |
| | • | | Class II: Mr. Keshav R. Murugesh, Mr. Albert Aboody and Mr. Michael Menezes; and |
| | • | | Class III: Ms. Francoise Gri, Mr. John Freeland and Mrs. Renu S. Karnad. |
The appointments of Messrs. Murugesh, Aboody and Menezes will expire at the next annual general meeting, which we expect to hold in September 2017. Messrs. Murugesh, and Mr. Menezes have expressed their willingness to bere-elected and, accordingly, we propose to seek shareholders’ approval for theirre-election at the next annual general meeting. Mr. Aboody has decided not to stand forre-election and his term of directorship will expire at the next annual general meeting. We are currently in the process of identifying a new director candidate.
164
At each annual general meeting after the initial classification or special meeting in lieu thereof, the successors to directors whose terms will then expire serve from the time of election until the third annual meeting following election or special meeting held in lieu thereof. Any additional directorships resulting from an increase in the number of directors will be distributed among the three classes so that, as nearly as possible, each class will consist ofone-third of the directors. This classification of the Board of Directors may have the effect of delaying or preventing changes in control of management of our company.
There are no family relationships among any of our directors or executive officers. The employment agreement governing the services of one of our directors provide for benefits upon termination of employment as described above.
Our Board of Directors held seven meetings in fiscal 2017.
Board Leadership Structure and Board Oversight of Risk
Different individuals currently serve in the roles of Chairman of the Board and Group Chief Executive Officer of our company. Our Board believes that splitting the roles of Chairman of the Board and Group Chief Executive Officer is currently the most appropriate leadership structure for our company. This leadership structure will bring in greater efficiency as a result of vesting two important leadership roles in separate individuals and increased independence for the Board of Directors.
Board’s Role in Risk Oversight
Our Board of Directors is primarily responsible for overseeing our risk management processes. The Board of Directors receives and reviews periodic reports from the Head of Risk Management and Audit as considered appropriate regarding our company’s assessment of risks. The Board of Directors focuses on the most significant risks facing our company and our company’s general risk management strategy, and also ensures that risks undertaken by our company are consistent with the Board’s appetite for risk. While the Board oversees our company’s risk management, management is responsible forday-to-day risk management processes. We believe this division of responsibilities is the most effective approach for addressing the risks facing our company and that our Board leadership structure supports this approach.
The Audit Committee has special responsibilities with respect to financial risks, and regularly reports to the full Board of Directors on these issues. Among other responsibilities, the Audit Committee reviews our company’s policies with respect to contingent liabilities and risks that may be material to our company, our company’s policies and procedures designed to promote compliance with laws, regulations, and internal policies and procedures, and major legislative and regulatory developments which could materially impact our company.
The Compensation Committee also plays a role in risk oversight as it relates to our company’s compensation policies and practices. Among other responsibilities, the Compensation Committee designs and evaluates our company’s executive compensation policies and practices so that our company’s compensation programs promote accountability among employees and the interests of employees are properly aligned with the interests of our shareholders.
Committees of the Board
Our Board of Directors has three standing committees: an Audit Committee, a Compensation Committee and a Nominating and Corporate Governance Committee.
165
Audit Committee
The Audit Committee comprises four directors: Messrs. Albert Aboody (Chairman), Michael Menezes and John Freeland and Ms. Francoise Gri. Each of Messrs. Aboody, Menezes and Freeland and Ms. Gri satisfies the “independence” requirements ofRule 10A-3 of the Securities Exchange Act of 1934, as amended (the “Exchange Act”), and the NYSE listing standards. The principal duties and responsibilities of our Audit Committee are as follows:
| | • | | to serve as an independent and objective party to monitor our financial reporting process and internal control systems; |
| | • | | to review and appraise the audit efforts of our independent accountants and exercise ultimate authority over the relationship between us and our independent accountants; and |
| | • | | to provide an open avenue of communication among the independent accountants, financial and senior management and the Board of Directors. |
The Audit Committee has the power to investigate any matter brought to its attention within the scope of its duties. It also has the authority to retain counsel and advisors to fulfill its responsibilities and duties. Messrs. Aboody and Menezes serve as our Audit Committee financial experts, within the requirements of the rules promulgated by the Commission relating to listed-company audit committees.
We have posted our Audit Committee charter on our website at www.wns.com. Information contained in our website does not constitute a part of this annual report.
The Audit Committee held four meetings in fiscal 2017.
Compensation Committee
The Compensation Committee comprises three directors: Messrs. Gareth Williams (Chairman) and Adrian T. Dillon and Mrs. Renu S. Karnad. Each of Messrs. Williams and Dillon and Mrs. Karnad satisfies the “independence” requirements of the NYSE listing standards. The scope of this committee’s duties includes determining the compensation of our executive officers and other key management personnel. The Compensation Committee also administers the Third Amended and Restated 2006 Incentive Award Plan and the 2016 Incentive Award Plan, reviews performance appraisal criteria and sets standards for and decides on all employee shares options allocations when delegated to do so by our Board of Directors.
We have posted our Compensation Committee charter on our website at www.wns.com. Information contained in our website does not constitute a part of this annual report.
The Compensation Committee held five meetings in fiscal 2017.
Nominating and Corporate Governance Committee
The Nominating and Corporate Governance Committee comprises three directors: Mrs. Renu S. Karnad (Chairman) and Messrs. Adrian T. Dillon and Gareth Williams. Each of Mrs. Karnad and Messrs. Dillon and Williams satisfies the “independence” requirements of the NYSE listing standards. The principal duties and responsibilities of the nominating and governance committee are as follows:
| | • | | to assist the Board of Directors by identifying individuals qualified to become board members and members of board committees, to recommend to the Board of Directors nominees for the next annual meeting of shareholders, and to recommend to the Board of Directors nominees for each committee of the Board of Directors; |
| | • | | to monitor our corporate governance structure; and |
| | • | | to periodically review and recommend to the Board of Directors any proposed changes to the corporate governance guidelines applicable to us. |
166
We have posted our Nominating and Corporate Governance Committee charter on our website at www.wns.com. Information contained in our website does not constitute a part of this annual report.
The Nominating and Corporate Governance Committee uses its judgment to identify well qualified individuals who are willing and able to serve on our Board of Directors. Pursuant to its charter, the Nominating and Corporate Governance Committee may consider a variety of criteria in recommending candidates for election to our board, including an individual’s personal and professional integrity, ethics and values; experience in corporate management, such as serving as an officer or former officer of a publicly held company, and a general understanding of marketing, finance and other elements relevant to the success of a publicly-traded company in today’s business environment; experience in our company’s industry and with relevant social policy concerns; experience as a board member of another publicly held company; academic expertise in an area of our company’s operations; and practical and mature business judgment, including ability to make independent analytical inquiries.
While the Nominating and Corporate Governance Committee does not have a formal policy with respect to the consideration of diversity in identifying director nominees, it nevertheless considers director nominees with a diverse range of backgrounds, skills, national origins, values, experiences, and occupations.
The Nominating and Corporate Governance Committee held four meetings in fiscal 2017.
Executive Sessions
Ournon-executive directors meet regularly in executive session without executive directors or management present. The purpose of these executive sessions is to promote open and candid discussion among thenon-executive directors. Ournon-executive directors held four executive sessions in fiscal 2017.
Shareholders and other interested parties may communicate directly with the presiding director or with ournon-executive directors as a group by writing to the following address: WNS (Holdings) Limited, Attention:Non-Executive Directors, Gate 4, Godrej & Boyce Complex, Pirojshanagar, Vikhroli (W), Mumbai 400 079, India.
D. Employees
For a description of our employees, see “Part I — Item 4. Information on the Company — Business Overview — Human Capital.”
167
E. Share Ownership
The following table sets forth information with respect to the beneficial ownership of our ordinary shares by each of our directors and by all our directors and executive officers as a group as at March 31, 2017. As used in this table, beneficial ownership means the sole or shared power to vote or direct the voting or to dispose of or direct the sale of any security. A person is deemed to be the beneficial owner of securities that can be acquired within 60 days upon the exercise of any option, warrant or right. Ordinary shares subject to options, warrants or rights that are currently exercisable or exercisable within 60 days are deemed outstanding for computing the ownership percentage of the person holding the options, warrants or rights, but are not deemed outstanding for computing the ownership percentage of any other person. The amounts and percentages as at March 31, 2017 are based on an aggregate of 50,012,559 ordinary shares (excluding 3,300,000 treasury shares) outstanding as at that date.
| | | | | | | | |
| | | Number of Ordinary Shares
Beneficially Owned | |
Name | | Number | | | Percent | |
Directors | | | | | | | | |
Adrian T. Dillon(1) | | | 54,700 | | | | 0.109 | |
Albert Aboody | | | 24,903 | | | | 0.050 | |
Gareth Williams | | | 10,427 | | | | 0.021 | |
John Freeland(2) | | | 10,027 | | | | 0.020 | |
Keshav R. Murugesh | | | 669,375 | | | | 1.338 | |
Michael Menezes | | | 10,427 | | | | 0.021 | |
Renu S. Karnad | | | 18,656 | | | | 0.037 | |
Francoise Gri | | | 7,905 | | | | 0.016 | |
Executive Officers | | | | | | | | |
Sanjay Puria | | | 60,401 | | | | 0.121 | |
Ronald Gillette | | | 70,932 | | | | 0.142 | |
Swaminathan Rajamani | | | 42,391 | | | | 0.085 | |
| | | | | | | | |
All our directors and executive officers as a group (11 persons as of March 31, 2017) | | | 980,144 | | | | 1.96 | |
| | | | | | | | |
Notes:
| (1) | Of the 54,700 shares beneficially owned by Mr. Adrian T. Dillon, 16,765 shares are in the form of ADSs. |
| (2) | Of the 10,027 shares beneficially owned by Mr. John Freeland, 4,000 shares are in the form of ADSs. |
168
As at March 31, 2017, there were no options held by our directors and executive officers. The following table sets forth information concerning RSUs held by our directors and executive officers as at March 31, 2017:
| | | | | | | | | | | | | | | | |
| | | RSU Summary | |
Name | | Number of shares
underlying
unexercised RSUs
held that have vested
but unexercised | | | Number of shares underlying
RSUs vesting within 60 days
from March 31, 2017 | | | Vesting dates | | | Number of shares underlying
RSUs vesting after 60 days from
March 31, 2017 | |
Non-executive Directors | | | | | | | | | | | | | | | | |
Adrian T. Dillon | | | — | | | | — | | | | — | | | | 14,066 | |
Albert Aboody | | | — | | | | — | | | | — | | | | 5,712 | |
Gareth Williams | | | — | | | | — | | | | — | | | | 5,273 | |
John Freeland | | | — | | | | — | | | | — | | | | 7,167 | |
Michael Menezes | | | — | | | | — | | | | — | | | | 5,273 | |
Renu S. Karnad | | | — | | | | — | | | | — | | | | 5,273 | |
Françoise Gri | | | — | | | | — | | | | — | | | | 3,426 | |
Executive Officers | | | | | | | | | | | | | | | | |
Keshav R. Murugesh | | | 388,317 | | | | 35,424 | | | | 22-Apr-17 | | | | 418,332 | |
| | | — | | | | 8,160 | | | | 27-Apr-17 | | | | — | |
| | | — | | | | 237,474 | | | | 29-Apr-17 | | | | — | |
Sanjay Puria | | | 35,389 | | | | 4,300 | | | | 22-Apr-17 | | | | 40,700 | |
| | | — | | | | 925 | | | | 27-Apr-17 | | | | — | |
| | | — | | | | 19,787 | | | | 29-Apr-17 | | | | — | |
Ronald Gillette | | | 45,479 | | | | 6,900 | | | | 22-Apr-17 | | | | 55,400 | |
| | | — | | | | 1,140 | | | | 27-Apr-17 | | | | — | |
| | | — | | | | 17,413 | | | | 29-Apr-17 | | | | — | |
Swaminathan Rajamani | | | 24,414 | | | | 3,100 | | | | 22-Apr-17 | | | | 30,000 | |
| | | — | | | | 630 | | | | 27-Apr-17 | | | | — | |
| | | — | | | | 14,247 | | | | 29-Apr-17 | | | | — | |
Share Ownership Guidelines
In July 2014, our Board of Directors adopted a share ownership policy, which was amended in January 2015 and effective from April 1, 2015, outlining the share ownership guidelines for, among other employees, our directors and executive officers. We believe that this policy further aligns the interests of our directors and executive officers with the long-term interests of our shareholders and promotes our commitment to sound corporate governance practices.
169
Under our amended policy, each of ournon-executive directors must hold at least the amount of vested shares of our company by the fifth anniversary of such director’s initial election to the Board as shown in the table below:
| | |
Position | | Share Ownership Guidelines |
ForNon-Executive Directors (except Board Chairman) | | 3.0 x value of annual share grant in $ |
For the Board Chairman | | 4.0 x value of annual share grant in $ |
In the event anon-executive director holds at least the required valued of our ordinary shares during the required time period, but the value of the director’s shares decreases below the shareholding requirement due to a decline in the price of our ADSs, the director shall be deemed to have complied with this policy so long as the director does not sell any shares.
Our amended policy provides that our executive officers are required to hold a multiple of their annual base salary in shares of our company as shown in the table below.
| | |
Position | | Share Ownership Guidelines |
Group Chief Executive Officer | | 4.0 x annual base salary |
Chief Operating Officer | | 2.0 x annual base salary |
Chief Financial Officer | | 1.5 x annual base salary |
Chief People Officer | | 1.0 x annual base salary |
Executive officers have five years to achieve the specified ownership level according to the followingbuild-up schedule: achieving a share ownership level equivalent to 5%, 15%, 30%, 60% and 100% of their specified ownership level in the first, second, third, fourth and fifth year, respectively.
Shares owned by immediate family members and any trust for the benefit only of the executive officer/director or his or her family members are included in the determination of such executive officer/director’s share ownership level.
170
ITEM 7. MAJOR SHAREHOLDERS AND RELATED PARTY TRANSACTIONS
A. Major Shareholders
The following table sets forth information regarding beneficial ownership of our ordinary shares as at March 31, 2017 held by each person who is known to us to have a 5.0% or more beneficial share ownership based on an aggregate of 50,012,559 ordinary shares (excluding 3,300,000 treasury shares) outstanding as of that date. Beneficial ownership is determined in accordance with the rules of the Commission and includes shares over which the indicated beneficial owner exercises voting and/or investment power or receives the economic benefit of ownership of such securities. Ordinary shares subject to options currently exercisable or exercisable within 60 days are deemed outstanding for the purposes of computing the percentage ownership of the person holding the options but are not deemed outstanding for the purposes of computing the percentage ownership of any other person.
| | | | | | | | |
Name of Beneficial Owner | | Number of Shares
Beneficially Owned | | | Percentage
Beneficially
Owned (1) | |
Waddell & Reed Financial Inc.(2) | | | 10,161,688 | | | | 20.32 | % |
FMR LLC(3) | | | 5,227,599 | | | | 10.45 | % |
Nalanda India Fund Limited(4) | | | 5,211,410 | | | | 10.42 | % |
Notes:
| (1) | Based on an aggregate of 50,012,559 ordinary shares (excluding 3,300,000 treasury shares) outstanding as at March 31, 2017. |
| (2) | Information is based on Amendment No. 6 to a report on Schedule 13G jointly filed with the Commission on February 14, 2017 by (i) Waddell & Reed Financial, Inc. (“WRF”), a publicly traded company; (ii) Waddell & Reed Financial Services, Inc. (“WRFSI”), a subsidiary of WRF; (iii) Waddell & Reed Inc. (“WRI”), a broker-dealer and underwriting subsidiary of WRFSI; (iv) Waddell & Reed Investment Management Company (“WRIMCO”), an investment advisory subsidiary of WRI; and (v) Ivy Investment Management Company (“IICO”), an investment advisory subsidiary of WRF. IICO and WRIMCO are investment advisors orsub-advisors to one or moreopen-end investment companies or other managed accounts which are beneficial owners of our ordinary shares. According to this Amendment No. 6, the investment advisory contracts grant IICO and WRIMCO all investment and/or voting power over securities owned by their advisory clients and the investmentsub-advisory contracts grant IICO and WRIMCO investment power over securities owned by theirsub-advisory clients and, in most cases, voting power. Any investment restriction of asub-advisory contract does not restrict investment discretion or power in a material manner. Therefore, IICO and/or WRIMCO may be deemed the beneficial owner of the securities covered by this statement under Rule13d-3 of the Exchange Act. WRF, WRFSI, WRI, WRIMCO and IICO are of the view that they are not acting as a “group” for purposes of Section 13(d) under the Exchange Act. Indirect “beneficial ownership” is attributed to the respective parent companies solely because of the parent companies’ control relationship to WRIMCO and IICO. |
| (3) | Information is based on Amendment No. 12 to a report on Schedule 13G jointly filed with the Commission on February 14, 2017 by FMR LLC and Abigail P. Johnson. FMR LLC and Abigail P. Johnson jointly filed Amendment No. 13 to a report on Schedule 13G with the Commission on April 10, 2017, reporting beneficial ownership of 5,223,499 ordinary shares. Abigail P. Johnson is a Director, the Chairman and the Chief Executive Officer of FMR LLC. According to this Amendment No. 12, members of the Johnson family, including Abigail P. Johnson, are the predominant owners, directly or through trusts, of Series B voting common shares of FMR LLC, representing 49% of the voting power of FMR LLC. The Johnson family group and all other Series B shareholders have entered into a shareholders’ voting agreement under which all Series B voting common shares will be voted in accordance with the majority vote of Series B voting common shares. Accordingly, through their ownership of voting common shares and the execution of the shareholders’ voting agreement, members of the Johnson family may be deemed, under the US Investment Company Act of 1940, to form a controlling group with respect to FMR LLC. Neither FMR LLC nor Abigail P. Johnson has the sole power to vote or direct the voting of the shares owned directly by the various investment companies registered under the Investment Company Act of 1940 (“Fidelity Funds”), advised by Fidelity Management & Research Company (“FMR Co”), a wholly owned subsidiary of FMR LLC. Such power resides with the Fidelity Funds’ Boards of Trustees. FMR Co carries out the voting of the shares under written guidelines established by the Fidelity Funds’ Boards of Trustees. |
| (4) | Information is based on a report on Schedule 13G filed with the Commission on February 2, 2011 by Nalanda India Fund Limited. |
171
The following summarizes the significant changes in the percentage ownership held by our major shareholders during the past three years:
| | • | | WRF, WRFSI, WRI, WRIMCO and IICO jointly reported their percentage ownership of our ordinary shares to be 20.6% (based on the then number of our ordinary shares reported as outstanding at that time) in Amendment No. 3 and 4 to a report on Schedule 13G filed with the Commission on December 10, 2014 and February 13, 2015, respectively, 21.1% (based on the then number of our ordinary shares reported as outstanding at that time) in Amendment No. 5 to a report on Schedule 13G filed with the Commission on February 12, 2016 and 19.8% (based on the then number of our ordinary shares reported as outstanding at that time) in Amendment No. 6 to a report on Schedule 13G filed with the Commission on February 14, 2017. |
| | • | | FMR LLC reported its percentage ownership of our ordinary shares to be 14.081% (based on the then number of our ordinary shares reported as outstanding at that time) in Amendment No. 10 to a report on Schedule 13G jointly filed with the Commission on February 13, 2015, 9.425% (based on the then number of our ordinary shares reported as outstanding at that time) in Amendment No. 11 to a report on Schedule 13G jointly filed with the Commission on February 12, 2016 9.989% (based on the then number of our ordinary shares reported as outstanding at that time) in Amendment No. 12 to a report on Schedule 13G jointly filed with the Commission on February 14, 2017 and10.458% (based on the then number of our ordinary shares reported as outstanding at that time) in Amendment No. 13 to a report on Schedule 13G jointly filed with the Commission on April 10, 2017. |
None of our major shareholders have different voting rights from our other shareholders.
As at March 31, 2017, 15,466,970 of our ordinary shares, representing 30.93% of our outstanding ordinary shares, were held by a total of 11 holders of record with addresses in the US. As at the same date, 49,721,174 of our ADSs (representing 49,721,174 ordinary shares), representing 99.42% of our outstanding ordinary shares, were held by one registered holder of record with addresses in and outside of the US. Since certain of these ordinary shares and ADSs were held by brokers or other nominees, the number of record holders in the US may not be representative of the number of beneficial holders or where the beneficial holders are resident. All holders of our ordinary shares are entitled to the same voting rights.
172
B. Related Party Transactions
(Amounts in thousands)
The following is a description of our related party transactions, determined in accordance with the rules and regulations promulgated under the Exchange Act, that were either material to us or the related party, or otherwise unusual or outside the ordinary course of business.
During fiscal 2015, Mr. Gareth Williams was appointed as a Non-Executive director of SAGA Plc. who is our client. During fiscal 2017, we earned a net revenue of $4,675 from this client.
C. Interests of Experts and Counsel
Not applicable.
173
ITEM 8. FINANCIAL INFORMATION
A. Consolidated Statements and Other Financial Information
Please see “Part III — Item 18. Financial Statements” for a list of the financial statements filed as part of this annual report.
Tax Assessment Orders
Transfer pricing regulations to which we are subject require that any international transaction among the WNS group enterprises be onarm’s-length terms. We believe that the international transactions among the WNS group enterprises are onarm’s-length terms. If, however, the applicable tax authorities determine that the transactions among the WNS group enterprises do not meetarm’s-length criteria, we may incur increased tax liability, including accrued interest and penalties. This would cause our tax expense to increase, possibly materially, thereby reducing our profitability and cash flows. We have signed an advance pricing agreement with the Government of India providing for the agreement on transfer pricing matters over certain transactions covered thereunder for a period of five years starting from April 2013. The applicable tax authorities may also disallow deductions or tax holiday benefits claimed by us and assess additional taxable income on us in connection with their review of our tax returns.
From time to time, we receive orders of assessment from the Indian tax authorities assessing additional taxable income on us and/or our subsidiaries in connection with their review of our tax returns. We currently have orders of assessment for fiscal 2004 through fiscal 2013 pending before various appellate authorities. These orders assess additional taxable income that could in the aggregate give rise to an estimated 2,394.3 million ($36.9 million based on the exchange rate on March 31, 2017) in additional taxes, including interest of 891.3 million ($13.7 million based on the exchange rate on March 31, 2017).
174
The following sets forth the details of these orders of assessment:
| | | | | | | | | | | | | | | | | | | | |
Entities | | Tax year(s) | | | Amount
demanded
(including
interest) | | | Interest on amount
Demanded | |
| | | (₹ and US dollars��in millions) | |
WNS Global | | | Fiscal 2004 | | | ₹ | 12.5 | | | $ | (0.2 | )(1) | | ₹ | 3.1 | | | $ | (0.1 | )(1) |
WNS Global | | | Fiscal 2005 | | | ₹ | 27.4 | | | $ | (0.4 | )(1) | | ₹ | 8.6 | | | $ | (0.1 | )(1) |
WNS Global | | | Fiscal 2006 | | | ₹ | 527.1 | | | $ | (8.1 | )(1) | | ₹ | 194.9 | | | $ | (2.9 | )(1) |
Permanent establishment of WNS North America Inc. and WNS UK in India | | | Fiscal 2006 | | | ₹ | 67.9 | | | $ | (1.0 | )(1) | | ₹ | 24.1 | | | $ | (0.4 | )(1) |
WNS Global | | | Fiscal 2007 | | | ₹ | 98.7 | | | $ | (1.5 | )(1) | | ₹ | 31.9 | | | $ | (0.5 | )(1) |
Permanent establishment of WNS North America Inc. and WNS UK in India | | | Fiscal 2007 | | | ₹ | 34.3 | | | $ | (0.5 | )(1) | | ₹ | 10.8 | | | $ | (0.2 | )(1) |
WNS Global | | | Fiscal 2008 | | | ₹ | 819.7 | | | $ | (12.7 | )(1) | | ₹ | 344.3 | | | $ | (5.3 | )(1) |
WNS BCS | | | Fiscal 2009 | | | ₹ | 7.1 | | | $ | (0.1 | )(1) | | ₹ | 2.3 | | | $ | (0.1 | )(1) |
WNS Global | | | Fiscal 2010 | | | ₹ | 60.2 | | | $ | (0.9 | )(1) | | ₹ | 23.5 | | | $ | (0.4 | )(1) |
WNS BCS | | | Fiscal 2010 | | | ₹ | 1.0 | | | $ | (0.1 | )(1) | | | — | | | | — | |
WNS BCS | | | Fiscal 2011 | | | ₹ | 9.7 | | | $ | (0.1 | )(1) | | ₹ | 3.2 | | | $ | (0.1 | )(1) |
WNS Global | | | Fiscal 2012 | | | ₹ | 305.7 | | | $ | (4.7 | )(1) | | ₹ | 107.4 | | | $ | (1.6 | )(1) |
WNS Global | | | Fiscal 2013 | | | ₹ | 423.0 | | | $ | (6.6 | )(1) | | ₹ | 137.2 | | | $ | (2.0 | )(1) |
| | | | | | | | | | | | | | | | | | | | |
Total | | | | | | ₹ | 2,394.3 | | | $ | (36.9 | )(1) | | ₹ | 891.3 | | | $ | (13.7 | )(1) |
| | | | | | | | | | | | | | | | | | | | |
Note:
| (1) | Based on the exchange rate as at March 31, 2017. |
175
The aforementioned orders of assessment allege that the transfer prices we applied to certain of the international transactions between WNS Global or WNS BCS (each of which is one of our Indian subsidiaries), as the case may be, and our other wholly-owned subsidiaries named above were not onarm’s-length terms, disallow a tax holiday benefit claimed by us, deny theset-off of brought forward business losses and unabsorbed depreciation and disallow certain expenses claimed as tax deductible by WNS Global or WNS BCS, as the case may be. As at March 31, 2017, we have provided a tax reserve of₹806.2 million ($12.4 million based on the exchange rate on March 31, 2017) primarily on account of the Indian tax authorities’ denying the set off of brought forward business losses and unabsorbed depreciation. We have appealed against these orders of assessment before higher appellate authorities.
In addition, we currently have orders of assessment pertaining to similar issues that have been decided in our favor by first level appellate authorities, vacating tax demands of₹2,890.6 million ($44.6 million based on the exchange rate on March 31, 2017) in additional taxes, including interest of₹891.1 million ($13.7 million based on the exchange rate on March 31, 2017). The income tax authorities have filed appeals against these orders at higher appellate authorities.
In case of disputes, the Indian tax authorities may require us to deposit with them all or a portion of the disputed amounts pending resolution of the matters on appeal. Any amount paid by us as deposits will be refunded to us with interest if we succeed in our appeals. We have deposited some portion of the disputed amount with the tax authorities and may be required to deposit the remaining portion of the disputed amount with the tax authorities pending final resolution of the respective matters.
As at March 31, 2017, corporate tax returns for fiscal years 2014 (for certain legal entities) and thereafter remain subject to examination by tax authorities in India.
After consultation with our Indian tax advisors and based on the facts of these cases, certain legal opinions from counsel, the nature of the tax authorities’ disallowances and the orders from first level appellate authorities deciding similar issues in our favor in respect of assessment orders for earlier fiscal years, we believe these orders are unlikely to be sustained at the higher appellate authorities and we intend to vigorously dispute the orders of assessment.
In March 2009, we also received an assessment order from the Indian Service Tax Authority demanding payment of₹348.1 million ($5.4 million based on the exchange rate on March 31, 2017) of service tax and related penalty for the period from March 1, 2003 to January 31, 2005. The assessment order alleges that service tax is payable in India on BPM services provided by WNS Global to clients based abroad as the export proceeds are repatriated outside India by WNS Global. In response to an appeal filed by us with the appellate tribunal against the assessment order in April 2009, the appellate tribunal has remanded the matter back to the lower tax authorities to be adjudicated afresh. Based on consultations with our Indian tax advisors, we believe this order of assessment is more likely than not to be upheld in our favor. We intend to continue to vigorously dispute the assessment.
In 2016, we also received an assessment order from the Sri Lankan Tax Authority, demanding payment of LKR 25.2 million ($0.2 million based on the exchange rate on March 31, 2017) in connection with the review of our tax return for fiscal year 2012. The assessment order challenges the tax exemption that we have claimed for export business. We have filed an appeal against the assessment order with the Sri Lankan Tax Appeal Commission in this regard. Based on consultations with our tax advisors, we believe this order of assessment is more likely than not to be upheld in our favor. We intend to continue to vigorously dispute the assessment.
No assurance can be given, however, that we will prevail in our tax disputes. If we do not prevail, payment of additional taxes, interest and penalties may adversely affect our results of operations, financial condition and cash flows. There can also be no assurance that we will not receive similar or additional orders of assessment in the future.
176
Dividend Policy
Subject to the provisions of the 1991 Law and our Articles of Association, we may by ordinary resolution declare dividends to be paid to our shareholders according to their respective rights. Any dividends we may declare must not exceed the amount recommended by our Board of Directors. Our Board may declare and pay an interim dividend or dividends, including a dividend payable at a fixed rate, if paying an interim dividend or dividends appears to the Board to be justified. See “Part I — Item 10. Additional Information — B. Memorandum and Articles of Association.” We can only declare dividends if our directors who are to authorize the distribution make a prior statement that, having made full enquiry into our affairs and prospects, they have formed the opinion that:
| | • | | immediately following the date on which the distribution is proposed to be made, we will be able to discharge our liabilities as they fall due; and |
| | • | | having regard to our prospects and to the intentions of our directors with respect to the management of our business and to the amount and character of the financial resources that will in their view be available to us, we will be able to continue to carry on business and we will be able to discharge our liabilities as they fall due until the expiry of the period of 12 months immediately following the date on which the distribution is proposed to be made or until we are dissolved under Article 150 of the 1991 Law, whichever first occurs. |
We have never declared or paid any dividends on our ordinary shares. Any future determination to pay cash dividends will be at the discretion of our Board of Directors and will be dependent upon our results of operations and cash flows, our financial position and capital requirements, general business conditions, legal, tax, regulatory and any contractual restrictions on the payment of dividends and any other factors our Board of Directors deems relevant at the time.
Subject to the deposit agreement governing the issuance of our ADSs, holders of ADSs will be entitled to receive dividends paid on the ordinary shares represented by such ADSs.
B. Significant Changes
There have been no significant subsequent events following the close of the last fiscal year up to the date of this annual report that are known to us and require disclosure in this document for which disclosure was not made in this annual report.
177
ITEM 9. THE OFFER AND LISTING
A. Offer and Listing Details
Our ADSs, commenced trading on the NYSE on July 26, 2006. The ADSs were issued by our depositary, Deutsche Bank Trust Company Americas, pursuant to a deposit agreement. The number of our outstanding ordinary shares (including the ordinary shares underlying ADSs) as at March 31, 2017 was 50,012,559 (excluding 3,300,000 treasury shares). As at March 31, 2017, there were 49,721,174 ADSs outstanding (representing 49,721,174 ordinary shares).
The high and low last reported sale prices per ADS for the periods indicated are as shown below:
| | | | | | | | |
| | | Price per ADS on NYSE | |
| | | High | | | Low | |
Fiscal year: | | | | | | | | |
2013 | | $ | 15.01 | | | $ | 9.07 | |
2014 | | $ | 22.61 | | | $ | 13.37 | |
2015 | | $ | 25.97 | | | $ | 17.11 | |
2016 | | $ | 34.36 | | | $ | 23.28 | |
2017 | | $ | 32.82 | | | $ | 24.82 | |
Fiscal Quarter: | | | | | | | | |
2016 | | | | | | | | |
First quarter | | $ | 27.99 | | | $ | 23.28 | |
Second quarter | | $ | 31.50 | | | $ | 26.11 | |
Third quarter | | $ | 34.36 | | | $ | 27.94 | |
Fourth quarter | | $ | 31.03 | | | $ | 25.09 | |
2017 | | | | | | | | |
First quarter | | $ | 32.82 | | | $ | 26.04 | |
Second quarter | | $ | 30.87 | | | $ | 25.98 | |
Third quarter | | $ | 30.01 | | | $ | 24.82 | |
Fourth quarter | | $ | 30.12 | | | $ | 26.68 | |
Month: | | | | | | | | |
December 2016 | | $ | 27.83 | | | $ | 24.92 | |
January 2017 | | $ | 30.12 | | | $ | 26.68 | |
February 2017 | | $ | 29.42 | | | $ | 27.54 | |
March 2017 | | $ | 29.11 | | | $ | 27.43 | |
April 2017 | | $ | 32.99 | | | $ | 27.69 | |
May 2017 | | $ | 33.97 | | | $ | 31.20 | |
B. Plan of Distribution
Not applicable.
C. Markets
Our ADSs are listed on the NYSE under the symbol “WNS.”
D. Selling Shareholders
Not applicable.
E. Dilution
Not applicable.
F. Expenses of the Issue
Not applicable.
178
ITEM 10. ADDITIONAL INFORMATION
A. Share Capital
Not applicable.
B. Memorandum and Articles of Association
General
We were incorporated in Jersey, Channel Islands, as a private limited company (with registered number 82262) on February 18, 2002 pursuant to the 1991 Law. We converted from a private limited company to a public limited company on January 4, 2006 when we acquired more than 30 shareholders as calculated in accordance with Article 17A of the 1991 Law. We gave notice of this to the JFSC in accordance with Article 17(3) of the 1991 Law on January 12, 2006.
The address of our secretary and share registrar is Mourant Ozannes Corporate Services (Jersey) Limited or Mourant, at 22 Grenville Street, St Helier, Jersey JE4 8PX. Our share register is maintained at the premises of Mourant.
Our activities are regulated by our Memorandum and Articles of Association. We adopted an amended and restated Memorandum and Articles of Association by special resolution of our shareholders passed on May 22, 2006. This amended and restated Memorandum and Articles of Association came into effect immediately prior to the completion of our initial public offering in July 2006. The material provisions of our amended and restated Memorandum and Articles of Association are described below. In addition to our Memorandum and Articles of Association, our activities are regulated by (among other relevant legislation) the 1991 Law. Our Memorandum of Association states our company name, that we are a public company, that we are a par value company, our authorized share capital and that the liability of our shareholders is limited to the amount (if any) unpaid on their shares. Below is a summary of some of the provisions of our Articles of Association. It is not, nor does it purport to be, complete or to identify all of the rights and obligations of our shareholders. The summary is qualified in its entirety by reference to our Memorandum and Articles of Association. See “Part III — Item 19. Exhibits — Exhibit 1.1” and “Part III — Item 19. Exhibits — Exhibit 1.2.”
The rights of shareholders described in this section are available only to persons who hold our certificated shares. ADS holders do not hold our certificated shares and therefore are not directly entitled to the rights conferred on our shareholders by our Articles of Association or the rights conferred on shareholders of a Jersey company by the 1991 Law, including, without limitation: the right to receive dividends and the right to attend and vote at shareholders meetings; the rights described in “— Other Jersey Law Considerations — Mandatory Purchases and Acquisitions” and “— Other Jersey Law Considerations — Compromises and Arrangements,” the right to apply to a Jersey court for an order on the grounds that the affairs of a company are being conducted in a manner which is unfairly prejudicial to the interests of its shareholders; and the right to apply to the JFSC to have an inspector appointed to investigate the affairs of a company. ADS holders are entitled to receive dividends and to exercise the right to vote only in accordance with the deposit agreement.
179
Share Capital
As at March 31, 2017, the authorized share capital is £6,100,000, divided into 60,000,000 ordinary shares of 10 pence each and 1,000,000 preferred shares of 10 pence each. As at March 31, 2017, 2016 and 2015, we had 50,012,559 (excluding 3,300,000 treasury shares), 51,306,304 (excluding 1,100,000 treasury shares) and 51,950,662 ordinary shares outstanding, respectively. The increase in the number of ordinary shares outstanding during the last three fiscal years resulted from the issuance of ordinary shares pursuant to our three share-based incentive plans: our 2002 Stock Incentive Plan, our 2006 Incentive Award Plan (as amended and restated) and our 2016 Incentive Award Plan. We have not issued any shares for consideration other than cash. There are no preferred shares outstanding.
Pursuant to Jersey law and our Memorandum and Articles of Association, our Board of Directors by resolution may establish one or more classes of preferred shares having such number of shares, designations, dividend rates, relative voting rights, liquidation rights and other relative participation, optional or other special rights, qualifications, limitations or restrictions as may be fixed by the board without any further shareholder approval. Such rights, preferences, powers and limitations as may be established could also have the effect of discouraging an attempt to obtain control of us. None of our shares have any redemption rights.
Capacity
Under the 1991 Law, the doctrine of ultra vires in its application to companies is abolished and accordingly the capacity of a Jersey company is not limited by anything in its memorandum or articles or by any act of its members.
Changes in Capital or our Memorandum and Articles of Association
Subject to the 1991 Law and our Articles of Association, we may by special resolution at a general meeting:
| | • | | increase our authorized orpaid-up share capital; |
| | • | | consolidate and divide all or any part of our shares into shares of a larger amount than is fixed by our Memorandum of Association; |
| | • | | sub-divide all or any part of our shares into shares of smaller amount than is fixed by our Memorandum of Association; |
| | • | | convert any of our issued or unissued shares into shares of another class; |
| | • | | convert all our issued par value shares into no par value shares and vice versa; |
| | • | | convert any of ourpaid-up shares into stock, and reconvert any stock into any number ofpaid-up shares of any denomination; |
| | • | | convert any of our issued limited shares into redeemable shares which can be redeemed; |
| | • | | cancel shares which, at the date of passing of the resolution, have not been taken or agreed to be taken by any person, and diminish the amount of the authorized share capital by the amount of the shares so cancelled; |
| | • | | reduce our issued share capital; or |
| | • | | alter our Memorandum or Articles of Association. |
General Meetings of Shareholders
We may at any time convene general meetings of shareholders. We hold an annual general meeting for each fiscal year. Under the 1991 Law, no more than 18 months may elapse between the date of one annual general meeting and the next.
180
Our Articles of Association provide that annual general meetings and meetings calling for the passing of a special resolution require 21 days’ notice of the place, day and time of the meeting in writing to our shareholders. Any other general meeting requires no less than 14 days’ notice in writing. Our directors may, at their discretion, and upon a request made in accordance with the 1991 Law by shareholders holding not less than one tenth of our total voting rights our directors shall, convene a general meeting. Our business may be transacted at a general meeting only when a quorum of shareholders is present. Two shareholders entitled to attend and to vote on the business to be transacted (or a proxy for a shareholder or a duly authorized representative of a corporation which is a shareholder) and holding shares conferring not less thanone-third of the total voting rights, constitute a quorum provided that if at any time all of our issued shares are held by one shareholder, such quorum shall consist of the shareholder present in person or by proxy.
The annual general meetings deal with and dispose of all matters prescribed by our Articles of Association and by the 1991 Law including:
| | • | | the consideration of our annual financial statements and report of our directors and auditors; |
| | • | | the election of directors (if necessary); |
| | • | | the appointment of auditors and the fixing of their remuneration; |
| | • | | the sanction of dividends; and |
| | • | | the transaction of any other business of which notice has been given. |
Failure to hold an annual general meeting is an offence by our company and our directors under the 1991 Law and carries a potential fine of up to £5,000 for our company and each director.
Voting Rights
Subject to any special terms as to voting on which any shares may have been issued or may from time to time be held, at a general meeting, every shareholder who is present in person (including any corporation present by its duly authorized representative) shall on a show of hands have one vote and every shareholder present in person or by proxy shall on a poll have one vote for each share of which he is a holder. In the case of joint holders only one of them may vote and in the absence of election as to who is to vote, the vote of the senior who tenders a vote, whether in person or by proxy, shall be accepted to the exclusion of the votes of the other joint holders.
A shareholder may appoint any person (whether or not a shareholder) to act as his proxy at any meeting of shareholders (or of any class of shareholders) in respect of all or a particular number of the shares held by him. A shareholder may appoint more than one person to act as his proxy and each such person shall act as proxy for the shareholder for the number of shares specified in the instrument appointing the person a proxy. If a shareholder appoints more than one person to act as his proxy, each instrument appointing a proxy shall specify the number of shares held by the shareholder for which the relevant person is appointed his proxy. Each duly appointed proxy has the same rights as the shareholder by whom he was appointed to speak at a meeting and vote at a meeting in respect of the number of shares held by the shareholder for which the relevant proxy is appointed his proxy.
For the purpose of determining shareholders entitled to notice of or to vote at any meeting of shareholders or any adjournment thereof or in order to make a determination of shareholders for any other proper purpose, our directors may fix in advance a date as the record date for any such determination of shareholders.
Shareholder Resolutions
An ordinary resolution requires the affirmative vote of a simple majority (i.e., more than 50%) of our shareholders entitled to vote in person (or by corporate representative in case of a corporate entity) or by proxy at a general meeting.
A special resolution requires the affirmative vote of a majority of not less thantwo-thirds of our shareholders entitled to vote in person (or by corporate representative in the case of a corporate entity) or by proxy at a general meeting.
Our Articles of Association prohibit the passing of shareholder resolutions by written consent to remove an auditor or to remove a director before the expiry of his term of office.
181
Dividends
Subject to the provisions of the 1991 Law and of the Articles of Association, we may, by ordinary resolution, declare dividends to be paid to shareholders according to their respective rights and interests in our distributable reserves. However, no dividend shall exceed the amount recommended by our directors.
Subject to the provisions of the 1991 Law, we may declare and pay an interim dividend or dividends, including a dividend payable at a fixed rate, if an interim dividend or dividends appears to us to be justified by our distributable reserves.
Except as otherwise provided by the rights attached to any shares, all dividends shall be declared and paid according to the amounts paid up (as to both par and any premium) otherwise than in advance of calls, on the shares on which the dividend is paid. All dividends unclaimed for a period of ten years after having been declared or become due for payment shall, if the directors so resolve, be forfeited and shall cease to remain owing by us and shall henceforth belong to us absolutely.
We may, with the authority of an ordinary resolution, direct that payment of any dividend declared may be satisfied wholly or partly by the distribution of assets, and in particular ofpaid-up shares or debentures of any other company, or in any one or more of those ways.
We may also with the prior authority of an ordinary resolution, and subject to such conditions as we may determine, offer to holders of shares the right to elect to receive shares, credited as fully paid, instead of the whole, or some part, to be determined by us, of any dividend specified by the ordinary resolution.
For the purposes of determining shareholders entitled to receive a dividend or distribution, our directors may fix a record date for any such determination of shareholders. A record date for any dividend or distribution may be on or at any time before any date on which such dividend or distribution is paid or made and on or at any time before or after any date on which such dividend or distribution is declared.
Ownership Limitations
Our Articles of Association and the 1991 Law do not contain limits on the number of shares that a shareholder may own.
Transfer of Shares
Every shareholder may transfer all or any of his shares by instrument of transfer in writing in any usual form or in any form approved by us. The instrument must be executed by or on behalf of the transferor and, in the case of a transfer of a share which is not fully paid up, by or on behalf of the transferee. The transferor is deemed to remain the holder until the transferee’s name is entered in the register of shareholders.
We may, in our absolute discretion and without giving any reason, refuse to register any transfer of a share or renunciation of a renounceable letter of allotment unless:
| | • | | it is in respect of a share which is fullypaid-up; |
| | • | | it is in respect of only one class of shares; |
| | • | | it is in favor of a single transferee or not more than four joint transferees; |
| | • | | it is duly stamped, if so required; and |
| | • | | it is delivered for registration to our registered office for the time being or another place that we may from time to time determine accompanied by the certificate for the shares to which it relates and any other evidence as we may reasonably require to prove the right of the transferor or person renouncing to make the transfer or renunciation. |
Share Register
We maintain our register of members in Jersey. It is open to inspection during business hours by shareholders without charge and by other persons upon payment of a fee not exceeding £5. Any person may obtain a copy of our register of members upon payment of a fee not exceeding £0.50 per page and providing a declaration under oath as required by the 1991 Law.
182
Variation of Rights
If at any time our share capital is divided into different classes of shares, the special rights attached to any class, unless otherwise provided by the terms of issue of the shares of that class, may be varied or abrogated with the consent in writing of the holders of the majority of the issued shares of that class, or with the sanction of an ordinary resolution passed at a separate meeting of the holders of shares of that class, but not otherwise. To every such separate meeting all the provisions of our Articles of Association and of the 1991 Law relating to general meetings or to the proceedings thereat shall apply,mutatis mutandis, except that the necessary quorum shall be two persons holding or representing at leastone-third in nominal amount of the issued shares of that class but so that if at any adjourned meeting of such holders a quorum as above defined is not present, those holders who are present in person shall be a quorum.
The special rights conferred upon the holders of any class of shares issued with preferred or other special rights shall be deemed to be varied by the reduction of the capital paid up on such shares and by the creation of further shares ranking in priority thereto, but shall not (unless otherwise expressly provided by our Articles of Association or by the conditions of issue of such shares) be deemed to be varied by the creation or issue of further shares ranking after or pari passu therewith. The rights conferred on holders of ordinary shares shall be deemed not to be varied by the creation, issue or redemption of any preferred or preference shares.
Capital Calls
We may, subject to the provisions of our Articles of Association and to any conditions of allotment, from time to time make calls upon the members in respect of any monies unpaid on their shares (whether on account of the nominal value of the shares or by way of premium) provided that (except as otherwise fixed by the conditions of application or allotment) no call on any share shall be payable within 14 days of the date appointed for payment of the last preceding call, and each member shall (subject to being given at least 14 clear days’ notice specifying the time or times and place of payment) pay us at the time or times and place so specified the amount called on his shares.
If a member fails to pay any call or installment of a call on or before the day appointed for payment thereof, we may serve a notice on him requiring payment of so much of the call or installment as is unpaid, together with any interest (at a rate not exceeding 10% per annum to be determined by us) which may have accrued and any expenses which may have been incurred by us by reason of suchnon-payment. The notice shall name a further day (not earlier than 14 days from the date of service thereof) on or before which and the place where the payment required by the notice is to be made, and shall state that in the event ofnon-payment at or before the time and at the place appointed, the shares on which the call was made will be liable to be forfeited.
Borrowing Powers
Our Articles of Association contain no restrictions on our power to borrow money or to mortgage or charge all or any part of our undertaking, property and assets.
Issue of Shares and Preemptive Rights
Subject to the provisions of the 1991 Law and to any special rights attached to any shares, we may allot or issue shares with those preferred, deferred or other special rights or restrictions regarding dividends, voting, return of capital or other matters as our directors from time to time determine. We may issue shares that are redeemable or are liable to be redeemed at our option or the option of the holder in accordance with our Articles of Association. Subject to the provisions of the 1991 Law, the unissued shares at the date of adoption of our Articles of Association and shares created thereafter shall be at the disposal of our directors. We cannot issue shares at a discount to par value. Securities, contracts, warrants or other instruments evidencing any preferred shares, option rights, securities having conversion or option rights or obligations may also be issued by the directors without the approval of the shareholders or entered into by us upon a resolution of the directors to that effect on such terms, conditions and other provisions as are fixed by the directors, including, without limitation, conditions that preclude or limit any person owning or offering to acquire a specified number or percentage of shares in us in issue, other shares, option rights, securities having conversion or option rights or obligations of us or the transferee of such person from exercising, converting, transferring or receiving the shares, option rights, securities having conversion or option rights or obligations.
183
There are nopre-emptive rights for the transfer of our shares either within the 1991 Law or our Articles of Association.
Directors’ Powers
Our business shall be managed by the directors who may exercise all of the powers that we are not by the 1991 Law or our Articles of Association required to exercise in a general meeting. Accordingly, the directors may (among other things) borrow money, mortgage or charge all of our property and assets (present and future) and issue securities.
Meetings of the Board of Directors
A director may, and the secretary on the requisition of a director shall, at any time, summon a meeting of the directors by giving to each director and alternate director not less than 24 hours’ notice of the meeting provided that any meeting may be convened at shorter notice and in such manner as each director or his alternate director shall approve provided further that unless otherwise resolved by the directors notices of directors’ meetings need not be in writing.
Subject to our Articles of Association, our Board of Directors may meet for the conducting of business, adjourn and otherwise regulate its proceedings as it sees fit. The quorum necessary for the transaction of business may be determined by the Board of Directors and unless otherwise determined shall be three persons, each being a director or an alternate director of whom two shall not be executive directors. Where more than three directors are present at a meeting, a majority of them must not be executive directors in order for the quorum to be constituted at the meeting. A duly convened meeting of the Board of Directors at which a quorum is present is necessary to exercise all or any of the board’s authorities, powers and discretions.
Our Board of Directors may from time to time appoint one or more of their number to be the holder of any executive office on such terms and for such periods as they may determine. The appointment of any director to any executive office shall be subject to termination if he ceases to be a director. Our Board of Directors may entrust to and confer upon a director holding any executive office any of the powers exercisable by the directors, upon such terms and conditions and with such restrictions as they think fit, and either collaterally with or to the exclusion of their own powers and may from time to time revoke, withdraw, alter or vary all or any of such powers.
Remuneration of Directors
Our directors shall be entitled to receive by way of fees for their services as directors any sum that we may, by ordinary resolution in general meeting from time to time determine. That sum, unless otherwise directed by the ordinary resolution by which it is voted, shall be divided among the directors in the manner that they agree or, failing agreement, equally. The remuneration (if any) of an alternate director shall be payable out of the remuneration payable to the director appointing him as may be agreed between them. The directors shall be repaid their traveling and other expenses properly and necessarily expended by them in attending meetings of the directors or members or otherwise on our affairs.
If any director shall be appointed agent or to perform extra services or to make any special exertions, the directors may remunerate such director therefor either by a fixed sum or by commission or participation in profits or otherwise or partly one way and partly in another as they think fit, and such remuneration may be either in addition to or in substitution for his above mentioned remuneration.
Directors’ Interests in Contracts
Subject to the provisions of the 1991 Law, a director may hold any other office or place of profit under us (other than the office of auditor) in conjunction with his office of director and may act in a professional capacity to us on such terms as to tenure of office, remuneration and otherwise as we may determine and, provided that he has disclosed to us the nature and extent of any of his interests which conflict or may conflict to a material extent with our interests at the first meeting of the directors at which a transaction is considered or as soon as practical after that meeting by notice in writing to the secretary or has otherwise previously disclosed that he is to be regarded as interested in a transaction with a specific person, a director notwithstanding his office (1) may be a party to, or otherwise interested in, any transaction or arrangement with us or in which we are otherwise interested, (2) may be a director or other officer of, or employed by, or a party to any transaction or arrangement with, or otherwise interested in, any body corporate promoted by us or in which we are otherwise interested, and (3) shall not, by reason of his office, be accountable to us for any benefit which he derives from any such office or employment or from any such transaction or arrangement or from any interest in any such body corporate and no such transaction or arrangement shall be liable to be avoided on the ground of any such interest or benefit.
184
Restrictions on Directors’ Voting
A director, notwithstanding his interest, may be counted in the quorum present at any meeting at which any contract or arrangement in which he is interested is considered and, subject as provided above, he may vote in respect of any such contract or arrangement. A director, notwithstanding his interest, may be counted in the quorum present at any meeting at which he is appointed to hold any office or place of profit under us, or at which the terms of his appointment are arranged, but the director may not vote on his own appointment or the terms thereof or any proposal to select that director forre-election.
Number of Directors
Our board shall determine the maximum and minimum number of directors provided that the minimum number of directors shall be not less than three.
Directors’ Appointment, Resignation, Disqualification and Removal
Our board is divided into three classes that are, as nearly as possible, of equal size. Each class of directors (other than initially) is elected for a three-year term of office but the terms are staggered so that the term of only one class of directors expires at each annual general meeting. Any additional directorships resulting from an increase in the number of directors will be distributed among the three classes so that, as nearly as possible, each class will consist ofone-third of the directors. This classification of the Board of Directors may have the effect of delaying or preventing changes in control of management of our company. Our Board of Directors shall have power (unless they determine that any vacancy should be filled by us in general meeting) at any time and from time to time to appoint any person to be a director, either to fill any vacancy or as an addition to the existing directors. A vacancy for these purposes only will be deemed to exist if a director dies, resigns, ceases or becomes prohibited or disqualified by law from acting as a director, becomes bankrupt or enters into an arrangement or composition with his creditors, becomes of unsound mind or is removed by us from office for gross negligence or criminal conduct by ordinary resolution. A vacancy for these purposes will not be deemed to exist upon the expiry of the term of office of a director. At any general meeting at which a director retires or at which a director’s period of office expires we shall elect, by ordinary resolution of the general meeting, a director to fill the vacancy, unless our directors resolve to reduce the number of directors in office. Where the number of persons validly proposed for election orre-election as a director is greater than the number of directors to be elected, the persons receiving the most votes (up to the number of directors to be elected) shall be elected as directors and an absolute majority of the votes cast shall not be apre-requisite to the election of such directors.
The directors shall hold office until they resign, they cease to be a director by virtue of a provision of the 1991 Law, they become disqualified by law or the terms of our Articles of Association from being a director, they become bankrupt or make any arrangement or composition with their creditors generally or they become of unsound mind or they are removed from office by us for gross negligence or criminal conduct by ordinary resolution in general meeting.
A director is not required to hold any of our shares.
Capitalization of Profits and Reserves
Subject to our Articles of Association, we may, upon the recommendation of our directors, by ordinary resolution resolve to capitalize any of our undistributed profits (including profits standing to the credit of any reserve account), any sum standing to the credit of any reserve account as a result of the sale or revaluation of an asset (other than goodwill) and any sum standing to the credit of our share premium account or capital redemption reserve.
Any sum which is capitalized shall be appropriated among our shareholders in the proportion in which such sum would have been divisible amongst them had the same been applied in paying dividends and applied in (1) paying up the amount (if any) unpaid on the shares held by the shareholders, or (2) issuing to shareholders, fully paid shares (issued either at par or a premium) or (subject to our Articles of Association) our debentures.
185
Unclaimed Dividends
Any dividend which has remained unclaimed for a period of ten years from the date of declaration thereof shall, if the directors so resolve, be forfeited and cease to remain owing by us and shall thenceforth belong to us absolutely.
Indemnity, Limitation of Liability and Officers Liability Insurance
Insofar as the 1991 Law allows and, to the fullest extent permitted thereunder, we may indemnify any person who was or is involved in any manner (including, without limitation, as a party or a witness), or is threatened to be made so involved, in any threatened, pending or completed investigation, claim, action, suit or proceeding, whether civil, criminal, administrative or investigative including, without limitation, any proceeding by or in the right of ours to procure a judgment in our favor, but excluding any proceeding brought by such person against us or any affiliate of ours by reason of the fact that he is or was an officer, secretary, servant, employee or agent of ours, or is or was serving at our request as an officer, secretary, servant, employee or agent of another corporation, partnership, joint venture, trust or other enterprise against all expenses (including attorney’s fees), judgments, fines and amounts paid in settlement actually and reasonably incurred by him in connection with such proceeding. Such indemnification shall be a contract right and shall include the right to receive payment in advance of any expenses incurred by the indemnified person in connection with such proceeding, provided always that this right is permitted by the 1991 Law.
Subject to the 1991 Law, we may enter into contracts with any officer, secretary, servant, employee or agent of ours and may create a trust fund, grant a security interest, make a loan or other advancement or use other means (including, without limitation, a letter of credit) to ensure the payment of such amounts as may be necessary to effect indemnification as provided in the indemnity provisions in our Articles of Association.
Our directors are empowered to arrange for the purchase and maintenance in our name and at our expense of insurance cover for the benefit of any current or former officer of ours, our secretary and any current or former agent, servant or employee of ours against any liability which is incurred by any such person by reason of the fact that he is or was an officer of ours, our secretary or an agent, servant or employee of ours.
Subject to the 1991 Law, the right of indemnification, loan or advancement of expenses provided in our Articles of Association is not exclusive of any other rights to which a person seeking indemnification may otherwise be entitled, under any statute, memorandum or articles of association, agreement, vote of shareholders or disinterested directors or otherwise, both as to action in his official capacity and as to action in another capacity while holding such office. The provisions of our Articles of Association inure for the benefit of the heirs and legal representatives of any person entitled to indemnity under our Articles of Association and are applicable to proceedings commenced or continuing after the adoption of our Articles of Association whether arising from acts or omissions occurring before or after such adoption.
If any provision or provisions of our Articles of Association relative to indemnity are held to be invalid, illegal or unenforceable for any reason whatsoever: (i) the validity, legality and enforceability of the remaining provisions thereof shall not in any way be affected or impaired; and (ii) to the fullest extent possible, the provisions of our Articles of Association relative to indemnity shall be construed so as to give effect to the intent manifested by the provision held invalid, illegal or unenforceable.
Nothing in our Articles of Association prohibits us from making loans to officers, our secretary, servants, employees or agents to fund litigation expenses prior to such expenses being incurred.
186
Distribution of Assets on aWinding-up
Subject to any particular rights or limitations attached to any shares, if we are wound up, our assets available for distribution among our shareholders shall be applied first in repaying to our shareholders the amount paid up (as to both par and any premium) on their shares respectively, and if such assets shall be more than sufficient to repay to our shareholders the whole amount paid up (as to both par and any premium) on their shares, the balance shall be distributed among our shareholders in proportion to the amount which at the time of the commencement of the winding up had been actually paid up (as to both par and any premium) on their shares respectively.
If we are wound up, we may, with the approval of a special resolution and any other sanction required by the 1991 Law, divide the whole or any part of our assets among our shareholders in specie and our liquidator or, where there is no liquidator, our directors, may, for that purpose, value any assets and determine how the division shall be carried out as between our shareholders or different classes of shareholders. Similarly, with the approval of a special resolution and subject to any other sanction required by the 1991 Law, all or any of our assets may be vested in trustees for the benefit of our shareholders.
Other Jersey Law Considerations
Purchase of Own Shares
The 1991 Law provides that we may, with the sanction of a special resolution and subject to certain conditions, purchase any of our shares which are fully paid.
We may fund the purchase of our own shares from any source provided that our directors are satisfied that immediately after the date on which the purchase is made, we will be able to discharge our liabilities as they fall due and that having regard to (i) our prospects and to the intentions of our directors with respect to the management of our business and (ii) the amount and character of the financial resources that will in their view be available to us, we will be able to (a) continue to carry on our business and (b) discharge our liabilities as they fall due until the expiry of the period of 12 months immediately following the date on which the purchase was made or until we are dissolved, whichever occurs first.
We cannot purchase our shares if, as a result of such purchase, only redeemable shares would be in issue. Any shares that we purchase (other than shares that are, immediately after being purchased, held as treasury shares) are treated as cancelled upon purchase.
Mandatory Purchases and Acquisitions
The 1991 Law provides that where a person (which we refer to as the “offeror”) makes an offer to acquire all of the shares (or all of the shares of any class of shares) (other than treasury shares and any shares already held by the offeror and its associates at the date of the offer), if the offeror has by virtue of acceptances of the offer acquired or contracted to acquire not less than 90% in nominal value of the shares (or class of shares) to which the offer relates, the offeror by notice may compulsorily acquire the remaining shares. A holder of any such shares may apply to the Jersey court for an order that the offeror not be entitled to purchase the holder’s shares or that the offeror purchase the holder’s shares on terms different to those of the offer.
Where, prior to the expiry of the offer period, the offeror has by virtue of acceptances of the offer acquired or contracted to acquire not less than 90% in nominal value of all of the shares of the target company (other than treasury shares and any shares already held by the offeror and its associates at the date of the offer), the holder of any shares (or class of shares) to which the offer relates who has not accepted the offer may require the offeror to acquire those shares. In such circumstances, each of the offeror and the holder of the shares are entitled to apply to the Jersey court for an order that the offeror purchase the holder’s shares on terms different to those of the offer.
187
Compromises and Arrangements
Where a compromise or arrangement is proposed between a company and its creditors, or a class of them, or between the company and its shareholders, or a class of them, the Jersey court may on the application of the company or a creditor or member of it or, in the case of a company being wound up, of the liquidator, order a meeting of the creditors or class of creditors, or of the shareholders of the company or class of shareholders (as the case may be), to be called in a manner as the court directs.
If a majority in number representing 3/4ths in value of the creditors or class of creditors, or 3/4ths of the voting rights of shareholders or class of shareholders (as the case may be), present and voting either in person or by proxy at the meeting agree to a compromise or arrangement, the compromise or arrangement, if sanctioned by the court, is binding on all creditors or the class of creditors or on all the shareholders or class of shareholders, and also on the company or, in the case of a company in the course of being wound up, on the liquidator and contributories of the company.
NoPre-Emptive Rights
Neither our Articles of Association nor the 1991 Law confers anypre-emptive rights on our shareholders.
No Mandatory Offer Requirements
In some countries, the trading and securities legislation contains mandatory offer requirements when shareholders have reached certain share ownership thresholds. There are no mandatory offer requirements under Jersey legislation. The Companies (Takeovers and Mergers Panel) (Jersey) Law 2009 empowers the Minister for Economic Development in Jersey ( the “Minister”) to appoint a Panel on Takeovers and Mergers (the “Jersey Panel”) as the body responsible for regulating takeovers and mergers of companies incorporated in Jersey. The Minister has appointed the UK Panel on Takeovers and Mergers (the “UK Panel”) to carry out the functions of the Jersey Panel. The Jersey Panel will be empowered to promulgate rules regulating takeovers and mergers of Jersey companies (the “Jersey Code”). The rules applicable to the regulation of takeovers and mergers promulgated by the UK Panel as set out in The City Code on Takeovers and Mergers (the “UK Code”) have been adopted as the Jersey Code. Rule 9 of the UK Code contains rules relative to mandatory offers. However, the UK Code only applies to (i) offers for Jersey companies if any of their securities are admitted to trading on a regulated market in the United Kingdom or any stock exchange in the Channel Islands or the Isle of Man and (ii) to public or certain private Jersey companies which are considered by the Panel to have their place of central management and control in the United Kingdom, the Channel Islands or the Isle of Man. As none of our securities are listed on a regulated market in the United Kingdom or on any stock exchange in the Channel Islands or the Isle of Man and as we are not centrally managed and controlled in the United Kingdom, the Channel Islands or the Isle of Man, it is not anticipated that the UK Code (which has been adopted as the Jersey Code) will apply to us.
In 2012, the UK Panel published consultation paper ‘PCP 2012/3: Companies subject to the Takeover Code’, which sought views on proposed amendments to the rules for determining the companies that are subject to the UK Code. No changes have yet been made to the UK Code on the basis of that consultation. It is possible that future changes to the rules for determining the companies that are subject to the UK Code, made on the basis of that consultation or otherwise, could result in the UK Code (which has been adopted as the Jersey Code) applying to us.
Non-Jersey Shareholders
There are no limitations imposed by Jersey law or by our Articles of Association on the rights ofnon-Jersey shareholders to hold or vote on our ordinary shares or securities convertible into our ordinary shares.
Rights of Minority Shareholders
Under Article 141 of the 1991 Law, a shareholder may apply to court for relief on the ground that our affairs are being conducted or have been conducted in a manner which is unfairly prejudicial to the interests of our shareholders generally or of some part of our shareholders (including at least the shareholder making the application) or that an actual or proposed act or omission by us (including an act or omission on our behalf) is or would be so prejudicial. What amounts to unfair prejudice is not defined in the 1991 Law. There may also be common law personal actions available to our shareholders.
188
Under Article 143 of the 1991 Law (which sets out the types of relief a court may grant in relation to an action brought under Article 141 of the 1991 Law), the court may make an order regulating our affairs, requiring us to refrain from doing or continuing to do an act complained of, authorizing civil proceedings and providing for the purchase of shares by us or by any of our other shareholders.
Jersey Law and our Memorandum and Articles of Association
The content of our Memorandum and Articles of Association reflects the requirements of the 1991 Law. Jersey company law draws very heavily from company law in England and there are various similarities between the 1991 Law and English company law. However, the 1991 Law is considerably more limited in content than English company law and there are some notable differences between English and Jersey company law. There are, for example, no provisions under Jersey law (as there are under English law):
| | • | | controlling possible conflicts of interests between us and our directors, such as loans by us or directors, and contracts between us and our directors other than a duty on our directors to disclose an interest in any transaction to be entered into by us or any of our subsidiaries which to a material extent conflicts with our interest; |
| | • | | specifically requiring particulars to be shown in our accounts of the amount of loans to officers or directors’ emoluments and pensions, although these would probably be required to be shown in our accounts in conformity to the requirement that accounts must be prepared in accordance with generally accepted accounting principles; |
| | • | | requiring us to file details of charges other than charges of Jersey realty; or |
| | • | | as regards statutory preemption provisions in relation to further issues of shares. |
Comparison of Shareholders’ Rights
We are incorporated under the laws of Jersey, Channel Islands. The following discussion summarizes certain material differences between the rights of holders of our ordinary shares and the rights of holders of the common stock of a typical corporation incorporated under the laws of the State of Delaware which result from differences in governing documents and the laws of Jersey, Channel Islands and Delaware. The rights of holders of our ADSs differ in certain respects from those of holders of our ordinary shares.
This discussion does not purport to be a complete statement of the rights of holders of our ordinary shares under applicable law in Jersey, Channel Islands and our Memorandum and Articles of Association or the rights of holders of the common stock of a typical corporation under applicable Delaware law and a typical certificate of incorporation and bylaws.
| | | | |
Corporate Law Issue | | Delaware Law | | Jersey Law |
| Special Meetings of Shareholders | | Shareholders of a Delaware corporation generally do not have the right to call meetings of shareholders unless that right is granted in the certificate of incorporation orby-laws. However, if a corporation fails to hold its annual meeting within a period of 30 days after the date designated for the annual meeting, or if no date has been designated for a period of 13 months after its last annual meeting, the Delaware Court of Chancery may order a meeting to be held upon the application of a shareholder. | | Under the 1991 Law, directors shall, notwithstanding anything in a Jersey company’s articles of association, call a general meeting on a shareholders’ requisition. A shareholders’ requisition is a requisition of shareholders holding not less thanone-tenth of the total voting rights of the shareholders of the company who have the right to vote at the meeting requisitioned. Failure to call an annual general meeting in accordance with the requirements of the 1991 Law is a criminal offense on the part of a Jersey company and its directors. The JFSC may, on the application of any officer, secretary or shareholder call, or direct the calling of, an annual general meeting. |
189
| | | | |
Corporate Law Issue | | Delaware Law | | Jersey Law |
| Interested Director Transactions | | Interested director transactions are not voidable if (i) the material facts as to the interested director’s relationship or interests are disclosed or are known to the Board of Directors and the board in good faith authorizes the transaction by the affirmative vote of a majority of the disinterested directors, (ii) the material facts are disclosed or are known to the shareholders entitled to vote on such transaction and the transaction is specifically approved in good faith by vote of the majority of shares entitled to vote on the matter or (iii) the transaction is fair as to the corporation as of the time it is authorized, approved or ratified by the Board of Directors, a committee or the shareholders. | | A director of a Jersey company who has an interest in a transaction entered into or proposed to be entered into by the company or by a subsidiary which conflicts or may conflict with the interests of the company and of which the director is aware, must disclose the interest to the company. Failure to disclose an interest entitles the company or a member to apply to the court for an order setting aside the transaction concerned and directing that the director account to the company for any profit. A transaction is not voidable and a director is not accountable notwithstanding a failure to disclose if the transaction is confirmed by special resolution and the nature and extent of the director’s interest in the transaction are disclosed in reasonable detail in the notice calling the meeting at which the resolution is passed. Without prejudice to its power to order that a director account for any profit, a court shall not set aside a transaction unless it is satisfied that the interests of third parties who have acted in good faith thereunder would not thereby be unfairly prejudiced and the transaction was not reasonable and fair in the interests of the company at the time it was entered into. |
190
| | | | |
Corporate Law Issue | | Delaware Law | | Jersey Law |
| Cumulative Voting | | Delaware law does not require that a Delaware corporation provide for cumulative voting. However, the certificate of incorporation of a Delaware corporation may provide that shareholders of any class or classes or of any series may vote cumulatively either at all elections or at elections under specified circumstances. | | There are no provisions in the 1991 Law relating to cumulative voting. |
| | |
| Approval of Corporate Matters by Written Consent | | Unless otherwise specified in a Delaware corporation’s certificate of incorporation, action required or permitted to be taken by shareholders at an annual or special meeting may be taken by shareholders without a meeting, without notice and without a vote, if consents in writing setting forth the action, are signed by shareholders with not less than the minimum number of votes that would be necessary to authorize the action at a meeting. All consents must be dated. No consent is effective unless, within 60 days of the earliest dated consent delivered to the corporation, written consents signed by a sufficient number of holders to take action are delivered to the corporation. | | Insofar as the memorandum or articles of a Jersey company do not make other provision in that behalf, anything which may be done at a meeting of the company (other than remove an auditor) or at a meeting of any class of its shareholders may be done by a resolution in writing signed by or on behalf of each shareholder who, at the date when the resolution is deemed to be passed, would be entitled to vote on the resolution if it were proposed at a meeting. A resolution shall be deemed to be passed when the instrument, or the last of several instruments, is last signed or on such later date as is specified in the resolution. |
| | |
| Business Combinations | | With certain exceptions, a merger, consolidation or sale of all or substantially all the assets of a Delaware corporation must be approved by the Board of Directors and a majority of the outstanding shares entitled to vote thereon. | | A sale or disposal of all or substantially all the assets of a Jersey company must be approved by the Board of Directors and, only if the Articles of Association of the company require, by the shareholders in general meeting. A merger involving a Jersey company must be generally documented in a merger agreement which must be approved by special resolution of that company. |
191
| | | | |
Corporate Law Issue | | Delaware Law | | Jersey Law |
| Limitations on Directors Liability | | A Delaware corporation may include in its certificate of incorporation provisions limiting the personal liability of its directors to the corporation or its shareholders for monetary damages for many types of breach of fiduciary duty. However, these provisions may not limit liability for any breach of the director’s duty of loyalty, acts or omissions not in good faith or that involve intentional misconduct or a knowing violation of law, the authorization of unlawful dividends, or unlawful share purchase or redemption, or any transaction from which a director derived an improper personal benefit. Moreover, these provisions would not be likely to bar claims arising under US federal securities laws. | | The 1991 Law does not contain any provisions permitting Jersey companies to limit the liability of directors for breach of fiduciary duty. Any provision, whether contained in the articles of association of, or in a contract with, a Jersey company or otherwise, whereby the company or any of its subsidiaries or any other person, for some benefit conferred or detriment suffered directly or indirectly by the company, agrees to exempt any person from, or indemnify any person against, any liability which by law would otherwise attach to the person by reason of the fact that the person is or was an officer of the company is void (subject to what is said below). |
| | |
| Indemnification of Directors and Officers | | A Delaware corporation may indemnify a director or officer of the corporation against expenses (including attorneys’ fees), judgments, fines and amounts paid in settlement actually and reasonably incurred in defense of an action, suit or proceeding by reason of his or her position if (i) the director or officer acted in good faith and in a manner he or she reasonably believed to be in or not opposed to the best interests of the corporation and (ii) with respect to any criminal action or proceeding, the director or officer had no reasonable cause to believe his or her conduct was unlawful. | | The prohibition referred to above does not apply to a provision for exempting a person from or indemnifying the person against (a) any liabilities incurred in defending any proceedings (whether civil or criminal) (i) in which judgment is given in the person’s favor or the person is acquitted, (ii) which are discontinued otherwise than for some benefit conferred by the person or on the person’s behalf or some detriment suffered by the person, or (iii) which are settled on terms which include such benefit or detriment and, in the opinion of a majority of the directors of the company (excluding any director who conferred such benefit or on whose behalf such benefit was conferred or who suffered such detriment), the person was substantially successful on the merits in the person’s resistance to the proceedings, (b) any liability incurred otherwise than to the company if the person acted in good faith with a view to the best interests of the company, (c) any liability incurred in connection with an application made to the court for relief from liability for negligence, default, breach of duty or breach of trust under Article 212 of the 1991 Law in which relief is granted to the person by the court or (d) any liability against which the company normally maintains insurance for persons other than directors. |
192
| | | | |
Corporate Law Issue | | Delaware Law | | Jersey Law |
| Appraisal Rights | | A shareholder of a Delaware corporation participating in certain major corporate transactions may, under certain circumstances, be entitled to appraisal rights pursuant to which the shareholder may receive cash in the amount of the fair value of the shares held by that shareholder (as determined by a court) in lieu of the consideration the shareholder would otherwise receive in the transaction. | | The 1991 Law does not confer upon shareholders any appraisal rights. |
| | |
| Shareholder Suits | | Class actions and derivative actions generally are available to the shareholders of a Delaware corporation for, among other things, breach of fiduciary duty, corporate waste and actions not taken in accordance with applicable law. In such actions, the court has discretion to permit the winning party to recover attorneys’ fees incurred in connection with such action. | | Under Article 141 of the 1991 Law, a shareholder may apply to court for relief on the ground that a company’s affairs are being conducted or have been conducted in a manner which is unfairly prejudicial to the interests of its shareholders generally or of some part of its shareholders (including at least the shareholder making the application) or that an actual or proposed act or omission by the company (including an act or omission on its behalf) is or would be so prejudicial. There may also be common law personal actions available to shareholders. Under Article 143 of the 1991 Law (which sets out the types of relief a court may grant in relation to an action brought under Article 141 of the 1991 Law), the court may make an order regulating the affairs of a company, requiring a company to refrain from doing or continuing to do an act complained of, authorizing civil proceedings and providing for the purchase of shares by a company or by any of its other shareholders. |
| | |
| Inspection of Books and Records | | All shareholders of a Delaware corporation have the right, upon written demand under oath stating the purpose thereof, to inspect or obtain copies of the corporation’s shares ledger and its other books and records for any proper purpose. | | The register of shareholders and books containing the minutes of general meetings or of meetings of any class of shareholders of a Jersey company must during business hours be open to the inspection of a shareholder of the company without charge. The register of directors and secretaries must during business hours (subject to such reasonable restrictions as the company may by its articles or in general meeting impose, but so that not less than two hours in each business day be allowed for inspection) be open to the inspection of a shareholder or director of the company without charge. |
193
| | | | |
Corporate Law Issue | | Delaware Law | | Jersey Law |
| Amendments to Charter | | Amendments to the certificate of incorporation of a Delaware corporation require the affirmative vote of the holders of a majority of the outstanding shares entitled to vote thereon or such greater vote as is provided for in the certificate of incorporation; a provision in the certificate of incorporation requiring the vote of a greater number or proportion of the directors or of the holders of any class of shares than is required by Delaware corporate law may not be amended, altered or repealed except by such greater vote. | | The memorandum and articles of association of a Jersey company may only be amended by special resolution (being atwo-third majority if the articles of association of the company do not specify a greater majority) passed by shareholders in general meeting or by written resolution signed by all the shareholders entitled to vote. |
Transfer Agent and Registrar
The transfer agent and registrar for our ADSs is Deutsche Bank Trust Company Americas.
C. Material Contracts
The following is a summary of each contract that is or was material to us during the last two years.
(1) Stock Purchase Agreement dated as of January 10, 2017 by and among WNS North America Inc. and the Sellers, the Optionholders and the Sellers Representative (each as defined therein).
In January 2017, WNS North America Inc. entered into the stock purchase agreement dated as of January 10, 2017 with the Sellers, the Optionholders and the Sellers Representative (each as defined therein). Under the agreement, we acquired all outstanding shares of Denali, a provider of strategic procurement BPM solutions for a purchase consideration of $39.6 million (including contingent consideration of up to $6.6 million, dependent on the achievement of revenue targets over a period of three years and deferred consideration of $0.5 million payable in the first quarter of fiscal 2018), subject to adjustments for cash and working capital. We have funded the acquisition through a three year secured term loan with BNP Paribas, Hong Kong, described in item 5 below.
194
(2) Stock Purchase Agreement and Plan of Merger dated as of March 15, 2017 by and among WNS Global Services Private Limited, WNS North America Inc., WNS Healthcare North America LLC, HealthHelp Holdings, LLC, MTS HealthHelp Inc., the stockholders of MTS HealthHelp Inc., Cherrill Farnsworth and the Sellers’ Representative (as defined therein).
In March 2017, WNS Global Services Private Limited, WNS North America Inc. and WNS Healthcare North America LLC entered into the stock purchase agreement and plan of merger dated as of March 15, 2017 with HealthHelp Holdings, LLC, MTS HealthHelp Inc., the stockholders of MTS HealthHelp Inc., Cherrill Farnsworth and the Sellers’ Representative (as defined therein). Under the agreement, we acquired all ownership interests of HealthHelp, which provides benefits management across several specialty healthcare areas, including radiology, cardiology, oncology, sleep care, orthopedics, and pain management, for a total consideration of $68.3 million, subject to adjustments for cash and working capital, including contingent consideration of up to $8.9 million, payable over a period of two years and dependent on the achievement of revenue targets and continuation of a specified client contract. We have funded the acquisition primarily with a five year term loan with HSBC Bank (Mauritius) Limited, and Standard Chartered Bank, UK, described in item 6 below.
(3) Share Purchase Agreement dated March 11, 2016 between WNS Global Services Private Limited, the Sellers (as defined therein) and Value Edge Research Services Private Limited and (4) Amendment Agreement dated May 25, 2016 between WNS Global Services Private Limited, the Sellers (as defined therein) and Value Edge Research Services Private Limited.
In March 2016, WNS Global Services Private Limited entered into the share purchase agreement dated March 11, 2016 with the Sellers (as defined therein) and Value Edge Research Services Private Limited. Under the agreement, we acquired all outstanding equity shares of Value Edge, which provides business research and analytics reports and databases across the domains of pharmaceutical, biotech and medical devices. The purchase price payable by us was $17.5 million (plus adjustments for cash and working capital), including contingent consideration of $5.1 million, subject to compliance with certain conditions and payable over a period of three years. We funded this acquisition with cash on hand.
(4) Facility Agreement dated January 18, 2017 between WNS North America Inc. and BNP Paribas, Hong Kong.
In January 2017, WNS North America Inc. obtained a term loan facility for $34.0 million from BNP Paribas, Hong Kong. The proceeds from this loan facility were used to finance our acquisition of Denali. The loan bears interest at a rate equivalent to the three-month US dollar LIBOR plus a margin of 1.27% per annum. WNS North America Inc.’s obligations under the term loan are guaranteed by WNS. The term loan is secured by a pledge of shares of Denali held by WNS North America Inc. and security over substantially all of the assets of WNS North America Inc. The facility agreement for the term loan contains certain covenants, including restrictive covenants relating to our indebtedness and financial covenants relating to our debt service to EBITDA ratio and total borrowings to EBITDA ratio, each as defined in the facility agreement. The loan matures in January 2020 and the principal is repayable in six semi-annual instalments. The first five repayment instalments are $5.65 million each and the sixth and final repayment instalment is $5.75 million. The first scheduled repayment date is in July 2017.
(5) Facility Agreement dated March 10, 2017 among WNS (Mauritius) Limited, HSBC Bank (Mauritius) Limited, and Standard Chartered Bank, UK.
In March 2017, WNS (Mauritius) Limited obtained a term loan facility for $84.0 million from HSBC Bank (Mauritius) Limited and Standard Chartered Bank, UK. The proceeds from this loan facility were used to finance our acquisition of HealthHelp. The loan bears interest at a rate equivalent to the three-month US dollar LIBOR plus a margin of 0.95% per annum. WNS (Mauritius) Limited’s obligations under the term loan are guaranteed by WNS. The term loan is secured by a pledge of shares of WNS (Mauritius) Limited held by WNS. The facility agreement for the term loan contains certain covenants, including restrictive covenants relating to our indebtedness and financial covenants relating to our debt service to EBITDA ratio and total borrowings to EBITDA ratio, each as defined in the facility agreement. The loan matures in March 2022 and the principal is repayable in 10 semi-annual instalments of $8.4 million each. The first scheduled repayment date is in September 2017.
(6) Employment Agreement dated February 1, 2010 between Keshav R. Murugesh and WNS Global Services Private Limited, as amended on February 19, 2017.
Please see “Part I — Item 6. Directors, Senior Management and Employees — B. Compensation — Employment Agreement of our Executive Director.”
195
D. Exchange Controls
There are currently no Jersey or United Kingdom foreign exchange control restrictions on the payment of dividends on our ordinary shares or on the conduct of our operations. Jersey is in a monetary union with the United Kingdom. There are currently no limitations under Jersey law or our Articles of Association prohibiting persons who are not residents or nationals of United Kingdom from freely holding, voting or transferring our ordinary shares in the same manner as United Kingdom residents or nationals.
Exchange Rates
Substantially all of our revenue is denominated in pound sterling or US dollars and large part of our expenses, other than payments to repair centers, are incurred and paid in Indian rupees. We report our financial results in US dollars. The exchange rates among the Indian rupee, the pound sterling and the US dollar have changed substantially in recent years and may fluctuate substantially in the future. The results of our operations are affected as the Indian rupee and the pound sterling appreciate or depreciate against the US dollar and, as a result, any such appreciation or depreciation will likely affect the market price of our ADSs in the US.
The following table sets forth, for the periods indicated, information concerning the exchange rates between Indian rupees and US dollars based on the spot rate released by the Federal Reserve Board:
| | | | | | | | | | | | | | | | |
Fiscal year: | | Period End(1) | | | Average(2) | | | High | | | Low | |
2013 | | | ₹54.52 | | | | ₹54.36 | | | | ₹57.13 | | | | ₹50.64 | |
2014 | | | 60.00 | | | | 60.35 | | | | 68.80 | | | | 53.65 | |
2015 | | | 62.31 | | | | 61.11 | | | | 63.67 | | | | 58.30 | |
2016 | | | 66.25 | | | | 65.39 | | | | 68.84 | | | | 61.99 | |
2017 | | | 64.85 | | | | 67.01 | | | | 68.86 | | | | 64.85 | |
2018 (until June 23, 2017) | | | 64.47 | | | | 64.46 | | | | 65.10 | | | | 64.03 | |
Notes:
| (1) | The spot rate at each period end and the average rate for each period may differ from the exchange rates used in the preparation of financial statements included elsewhere in this annual report. |
| (2) | Represents the average of the daily exchange rates during the period. |
The following table sets forth, for the periods indicated, information concerning the exchange rates between Indian rupees and US dollars based on the spot rate released by the Federal Reserve Board:
| | | | | | | | |
Month: | | High | | | Low | |
December 2016 | | | ₹68.29 | | | | ₹67.38 | |
January 2017 | | | 68.39 | | | | 67.48 | |
February 2017 | | | 67.40 | | | | 66.67 | |
March 2017 | | | 66.83 | | | | 64.85 | |
April 2017 | | | 65.10 | | | | 64.08 | |
May 2017 | | | 64.87 | | | | 64.03 | |
June 2017 (until June 23, 2017) | | | 64.60 | | | | 64.23 | |
196
The following table sets forth, for the periods indicated, information concerning the exchange rates between the pound sterling and US dollars based on the spot rate released by the Federal Reserve Board:
| | | | | | | | | | | | | | | | |
Fiscal year: | | Period End(1) | | | Average(2) | | | High | | | Low | |
2013 | | £ | 0.66 | | | £ | 0.63 | | | £ | 0.67 | | | £ | 0.61 | |
2014 | | | 0.60 | | | | 0.63 | | | | 0.67 | | | | 0.60 | |
2015 | | | 0.67 | | | | 0.62 | | | | 0.68 | | | | 0.58 | |
2016 | | | 0.70 | | | | 0.66 | | | | 0.72 | | | | 0.63 | |
2017 | | | 0.80 | | | | 0.77 | | | | 0.83 | | | | 0.68 | |
2018 (until June 23, 2017) | | | 0.79 | | | | 0.78 | | | | 0.83 | | | | 0.77 | |
Notes:
| (1) | The spot rate at each period end and the average rate for each period may differ from the exchange rates used in the preparation of financial statements included elsewhere in this annual report. |
| (2) | Represents the average of the daily exchange rates during the period. |
The following table sets forth, for the periods indicated, information concerning the exchange rates between the pound sterling and US dollars based on the spot rate released by the Federal Reserve Board:
| | | | | | | | |
Month: | | High | | | Low | |
December 2016 | | £ | 0.82 | | | £ | 0.79 | |
January 2017 | | | 0.83 | | | | 0.79 | |
February 2017 | | | 0.80 | | | | 0.79 | |
March 2017 | | | 0.82 | | | | 0.79 | |
April 2017 | | | 0.81 | | | | 0.77 | |
May 2017 | | | 0.83 | | | | 0.77 | |
June 2017 (until June 23, 2017) | | | 0.79 | | | | 0.77 | |
197
E. Taxation
Jersey Tax Consequences
General
Jersey tax considerations
The following summary of the anticipated treatment of the company and holders of ordinary shares (other than residents of Jersey) is based on Jersey taxation law and practice as it is understood to apply at the date of this annual report. It does not constitute legal or tax advice and does not address all aspects of Jersey tax law and practice. Holders of our ordinary shares (or ADSs) should consult their professional advisers on the implications of acquiring, buying, holding, selling or otherwise disposing of ordinary shares (or ADSs) under the laws of the jurisdictions in which they may be liable to taxation. Shareholders (and holders of ADSs) should be aware that tax laws, rules and practice and their interpretation may change.
Taxation of the company
Jersey taxation legislation provides that the general basic rate of income tax on the profits of companies regarded as resident in Jersey or having a permanent establishment in Jersey will be 0% and that only a limited number of financial services companies shall be subject to income tax at a rate of 10%.
Under the Income Tax (Jersey) Law 1961, we are regarded as tax resident in Jersey but, not being a financial services company nor a specified utility company for the purposes of Jersey taxation legislation, are subject to the general basic rate of income tax on profits of 0%.
If the company derives any income from the ownership, disposal or exploitation of land in Jersey or the importation into Jersey or supplying in Jersey of hydrocarbon oil, such income will be subject to Jersey income tax at the rate of 20%. It is not expected that the company will derive any such income.
A 5% goods and services tax is generally paid in Jersey on the sale or exchange of goods and services in Jersey. All businesses with a12-month taxable turnover in excess of £300,000 must, by Jersey law, register for this tax unless they are an international services entity (“ISE”). For so long as the company is an ISE within the meaning of the Goods and Services (Jersey) Law 2007, having satisfied the requirements of the Goods and Services Tax (International Services Entities) (Jersey) Regulations 2008, as amended, a supply of goods or services made by or to the company shall not be a taxable supply for the purposes of Jersey law.
Taxation of holders of ordinary shares and ADSs
The company will be entitled to pay dividends to holders of ordinary shares and ADSs without any withholding or deduction for, or on account of, Jersey tax. The holders of ordinary shares and ADSs (other than residents of Jersey) will not be subject to any tax in Jersey in respect of the holding, sale or other disposition of such ordinary shares or ADSs.
Foreign Account Tax Compliance Act (“FATCA”)
FATCA was enacted by the United States Congress in March 2010 and came into effect in 2014 (albeit with staggered implementation dates). FATCA requires Financial Institutions (“FIs”) to use enhanced due diligence procedures to identify US persons who have invested in eithernon-US financial accounts ornon-US entities. Pursuant to FATCA, certain payments of (or attributable to)US-source income, and the proceeds of sales of property that give rise toUS-source payments made to the company, would be subject to 30% withholding tax unless the company agrees to adopt certain reporting and withholding requirements. Although we will use reasonable efforts to avoid the imposition of such withholding tax, no assurance can be given that we will be able to do so.
On December 13, 2013 the Chief Minister of Jersey signed theUS-Jersey Intergovernmental Agreement (“IGA”), which imposes certain due diligence and reporting requirements on Jersey FIs. Where applicable information regarding shareholders, their ultimate beneficial owners and/or controlling persons, and their investment in and returns from the company, may need to be reported to the local States of Jersey tax authority. As Jersey has implemented FATCA under a Model 1 IGA, no withholding tax, such as that outlined under the US Regulations applies.
Following the US implementation of FATCA, the UK introduced their own information reporting regime with certain Crown Dependencies and Overseas Territories such as Jersey. On October 22, 2013 the Chief Minister of Jersey signed theUK-Jersey IGA. The application of this UK FATCA regime is similar to US FATCA except that it imposes disclosure requirements in respect of certain shareholders who are, or are entities that are controlled by one or more, residents of the UK.
Both the US and UK FATCA IGAs are implemented through Jersey’s domestic legislation, in accordance with guidance notes which are published in draft form and updated on a regular basis. The first reporting deadline under the US FATCA IGA was June 30, 2015 and that under the UK FATCA IGA was June 30, 2016. Reporting is due annually thereafter with UK FATCA merging fully into Common Reporting Standard (“CRS”) over the coming years.
198
Common Reporting Standard (CRS)
On February 13, 2014, the Organisation for EconomicCo-operation and Development (“OECD”) released the CRS. This global standard for the automatic exchange of financial account information was modelled largely on the US FATCA regime but with some notable differences. On October 29, 2014,fifty-one jurisdictions signed the Multilateral Agreement that activates this automatic exchange of FATCA-like information in line with the CRS. There are now in excess of 90 jurisdictions signed up for implementation. Pursuant to the Multilateral Agreement, certain disclosure requirements may be imposed in respect of certain shareholders who are, or are entities that are controlled by one or more, residents of any of the signatory jurisdictions. It is expected that, where applicable, information that would need to be disclosed will include certain information about shareholders, their ultimate beneficial owners and/or controllers, and their investment in and returns from the company. Both Jersey and the UK have signed up to the Multilateral Agreement. To date the US has shown no intent to participate in the regime. Implementation for early adopters (including Jersey) began on January 1, 2016, with jurisdictions pledging to work towards the first information exchanges taking place by September 2017. Others are expected to follow with information exchange starting in 2018.
Jersey has released domestic CRS regulations as well as CRS guidance notes which are again in draft form. The first reporting under CRS in Jersey will be required by June 30, 2017.
Stamp duty
No stamp duty is payable in Jersey on the issue or inter vivos transfer of ordinary shares or ADSs.
Upon the death of a holder of ordinary shares or ADSs, a grant of probate or letters of administration will be required to transfer ordinary shares or ADSs of the deceased person to the extent that the ordinary shares or ADSs are considered moveable estate situated in Jersey, except that, where the deceased person was domiciled outside of Jersey at the time of death, the company may (at its discretion) dispense with this requirement where the value of the deceased’s movable estate in Jersey does not exceed £10,000.
Upon the death of a holder of ordinary shares or ADSs (and to the extent that the ordinary shares or ADSs are considered movable estate situated in Jersey), Jersey probate stamp duty will be payable on the registration in Jersey of a grant of probate or letters of administration, which will be required in order to transfer or otherwise deal with:
| (A) | (where the deceased person was domiciled in Jersey at the time of death) the deceased person’s personal estate wherever situated (including any ordinary shares or ADSs to the extent that the ordinary shares or ADSs are considered movable estate situated in Jersey) if the net value of such personal estate exceeds £10,000; or |
| (B) | (if the deceased person was domiciled outside of Jersey at the time of death) the deceased person’s personal estate situated in Jersey (including any ordinary shares or ADSs to the extent that the ordinary shares or ADSs are considered movable estate situated in Jersey) if the net value of such personal estate exceeds £10,000. |
The rate of probate stamp duty payable is:
| (A) | (where the net value of the deceased person’s relevant personal estate does not exceed £100,000) 0.5% of the net value of the deceased person’s relevant personal estate; |
| (B) | (where the net value of the deceased person’s relevant personal estate exceeds £100,000) £500 for the first £100,000 plus 0.75% of the net value of the deceased person’s relevant personal estate which exceeds £100,000; or |
| (C) | (where the net value of the deceased person’s relevant personal estate exceeds £13,360,000) the sum of £100,000. |
In addition, application and other fees may be payable. Jersey does not otherwise levy taxes upon capital, inheritances, capital gains or gifts, nor are there any other estate duties
US Federal Income Taxation
The following discussion describes certain material US federal income tax consequences to US Holders (defined below) under present law of an investment in the ADSs or ordinary shares. This summary applies only to US Holders that hold the ADSs or ordinary shares as capital assets and that have the US dollar as their functional currency. This discussion is based on the tax laws of the US as in effect on the date of this annual report and on US Treasury regulations in effect or, in some cases, proposed, as of the date of this annual report, as well as judicial and administrative interpretations thereof available on or before such date. All of the foregoing authorities are subject to change, which change could apply retroactively and could affect the tax consequences described below.
199
The following discussion does not address the Medicare contribution tax on net investment income or the tax consequences to any particular investor or to persons in special tax situations, such as:
| | • | | certain financial institutions; |
| | • | | traders that elect tomark-to-market; |
| | • | | persons liable for alternative minimum tax; |
| | • | | real estate investment trusts; |
| | • | | regulated investment companies; |
| | • | | persons holding ADSs or ordinary shares as part of a straddle, hedging, conversion or integrated transaction; |
| | • | | entities treated as partnerships or other pass-through entities, or persons holding ADSs or ordinary shares through such entities; or |
| | • | | persons that actually or constructively own 10% or more of our voting share; or |
| | • | | persons who acquired ADSs or ordinary shares pursuant to the exercise of any employee share option or otherwise as compensation. |
US HOLDERS OF OUR ADSs OR ORDINARY SHARES ARE URGED TO CONSULT THEIR TAX ADVISORS ABOUT THE APPLICATION OF THE US FEDERAL TAX RULES TO THEIR PARTICULAR CIRCUMSTANCES AS WELL AS THE STATE AND LOCAL ANDNON-US TAX CONSEQUENCES TO THEM OF THE PURCHASE, OWNERSHIP AND DISPOSITION OF OUR ADSs OR ORDINARY SHARES.
The discussion below of the US federal income tax consequences to “US Holders” will apply to you if you are a beneficial owner of ADSs or ordinary shares and you are, for US federal income tax purposes:
| | • | | an individual who is a citizen or resident of the US; |
| | • | | a corporation (or other entity taxable as a corporation) organized under the laws of the United States, any State thereof or the District of Columbia; |
| | • | | an estate whose income is subject to US federal income taxation regardless of its source; or |
| | • | | a trust that (1) is subject to the primary supervision of a court within the United States and the control of one or more US persons for all substantial decisions of the trust or (2) has a valid election in effect under applicable US Treasury regulations to be treated as a US person. |
If you are a partner in an entity treated as a partnership that holds ADSs or ordinary shares, your tax treatment will depend on your status and the activities of such entity.
200
The discussion below assumes that the representations contained in the deposit agreement are true and that the obligations in the deposit agreement and any related agreement will be complied with in accordance with their terms. If you hold ADSs, you should be treated as the holder of the underlying ordinary shares represented by those ADSs for US federal income tax purposes. The US Treasury has expressed concerns that intermediaries in the chain of ownership between the holder of an ADS and the issuer of the security underlying the ADS may be taking actions that are inconsistent with the beneficial ownership of the underlying security (for example,pre-releasing ADSs to persons that do not have the beneficial ownership of the securities underlying the ADSs). Accordingly, the creditability of any foreign taxes paid and the availability of the reduced tax rate for any dividends received by certainnon-corporate US Holders, including individuals US Holders (as discussed below), could be affected by actions taken by intermediaries in the chain of ownership between the holders of ADSs and us if as a result of such actions the holders of ADSs are not properly treated as beneficial owners of the underlying ordinary shares.
Distributions
Subject to the rules applicable to PFICs, discussed below, the gross amount of distributions made by us with respect to the ADSs or ordinary shares (including the amount of any taxes withheld therefrom) will be includable in your gross income in the year received (or deemed received) as dividend income to the extent that such distributions are paid out of our current or accumulated earnings and profits as determined under US federal income tax principles. To the extent the amount of the distribution exceeds our current and accumulated earnings and profits (as determined under US federal income tax principles), such excess amount will be treated first as atax-free return of your tax basis in your ADSs or ordinary shares, and then, to the extent such excess amount exceeds your tax basis in your ADSs or ordinary shares, as capital gain. We do not intend to calculate our earnings and profits under US federal income tax principles. Therefore, a US Holder should expect that a distribution will be treated as a dividend. No dividends received deduction will be allowed for US federal income tax purposes with respect to dividends paid by us.
With respect tonon-corporate US Holders, including individual US Holders, under current law dividends may be “qualified dividend income” that is taxed at the lower applicable capital gains rate provided that (1) we are neither a PFIC nor treated as such with respect to you (as discussed below) for either our taxable year in which the dividend is paid or the preceding taxable year, (2) certain holding period requirements are met, and (3) the ADSs or ordinary shares, as applicable, are readily tradable on an established securities market in the US. Under US Internal Revenue Service (“IRS”) authority, common shares, or ADSs representing such shares, are considered to be readily tradable on an established securities market in the US if they are listed on the NYSE, as our ADSs are. However, based on existing guidance, it is not entirely clear whether any dividends you receive with respect to the ordinary shares will be taxed as qualified dividend income, because the ordinary shares are not themselves listed on US exchange. You should consult your tax advisors regarding the availability of the lower rate for dividends paid with respect to ADSs or ordinary shares, including the effects of any change in law after the date of this annual report.
The amount of any distribution paid in a currency other than the US dollar (a foreign currency) will be equal to the US dollar value of such foreign currency on the date such distribution is received by the depositary, in the case of ADSs, or by you, in the case of ordinary shares, regardless of whether the payment is in fact converted into US dollars at that time. Gain or loss, if any, realized on the sale or other disposition of such foreign currency will be US source ordinary income or loss, subject to certain exceptions and limitations. If such foreign currency is converted into US dollars on the date of receipt, a US Holder generally should not be required to recognize foreign currency gain or loss in respect of the dividend. The amount of any distribution of property other than cash will be the fair market value of such property on the date of distribution.
Subject to certain exceptions, for foreign tax credit purposes, dividends distributed by us with respect to ADSs or ordinary shares generally will constitute foreign source income. The limitation on foreign taxes eligible for credit is calculated separately with respect to specific classes of income. For this purpose, dividends distributed by us with respect to the ADSs or ordinary shares will generally constitute “passive category income.” To the extent the dividends would be taxable as qualified dividend income with respect tonon-corporate US Holders, including individual US Holders (subject to the discussion above), the amount of the dividends taken into account for purposes of calculating the foreign tax credit limitation will in general be limited to the gross amount of the dividend, multiplied by the reduced tax rate applicable to qualified dividend income and divided by the highest tax rate normally applicable to dividends. You are urged to consult your tax advisors regarding the foreign tax credit limitation and source of income rules with respect to distributions on the ADSs or ordinary shares.
201
Sale or Other Disposition of ADSs or Ordinary Shares
Subject to the PFIC rules discussed below, upon a sale or other taxable disposition of ADSs or ordinary shares, you generally will recognize a capital gain or loss for US federal income tax purposes in an amount equal to the difference between the US dollar value of the amount realized and your tax basis in such ADSs or ordinary shares. If the consideration you receive for the ADSs or ordinary shares is not paid in US dollars, the amount realized will be the US dollar value of the payment received determined by reference to the spot rate of exchange on the date of the sale or other disposition. However, if the ADSs or ordinary shares, as applicable, are treated as traded on an “established securities market” and you are either a cash basis taxpayer or an accrual basis taxpayer that has made a special election (which must be applied consistently from year to year and cannot be changed without the consent of the IRS), you will determine the US dollar value of the amount realized in a foreign currency by translating the amount received at the spot rate of exchange on the settlement date of the sale. Your initial tax basis in your ADSs or ordinary shares will equal the US dollar value of the cost of such ADSs or ordinary shares, as applicable. If you use foreign currency to purchase ADSs or ordinary shares, the cost of such ADSs or ordinary shares will be the US dollar value of the foreign currency purchase price determined by reference to the spot rate of exchange on the date of purchase. However, if the ADSs or ordinary shares, as applicable, are treated as traded on an established securities market and you are either a cash basis taxpayer or an accrual basis taxpayer who has made the special election described above, you will determine the US dollar value of the cost of such ADSs or ordinary shares, as applicable, by translating the amount paid at the spot rate of exchange on the settlement date of the purchase.
Subject to certain exceptions and limitations, capital gain or loss on a sale or other taxable disposition of ADSs or ordinary shares generally will be US source gain or loss and treated as long-term capital gain or loss, if your holding period in the ADSs or ordinary shares exceeds one year. Subject to the PFIC rules discussed below and other limitations, if you are anon-corporate US Holder, including an individual US Holder, any long-term capital gain will be subject to US federal income tax at preferential rates. The deductibility of capital losses is subject to significant limitations.
Passive Foreign Investment Company
Anon-US corporation is considered a PFIC for any taxable year if either:
| | • | | at least 75% of its gross income for such year is passive income, or |
| | • | | at least 50% of its value of assets (determined on the basis of a quarterly average) during such year is attributable to assets that produce or are held for the production of passive income. |
We will be treated as owning our proportionate share of the assets and earning our proportionate share of the income of any other corporation in which we own, directly or indirectly, 25% or more (by value) of the stock.
Based on our financial statements and relevant market and shareholder data, we believe that we should not be treated as a PFIC with respect to our most recently closed taxable year. If we were treated as a PFIC for any year during which you held ADSs or ordinary shares, we will continue to be treated as a PFIC for all succeeding years during which you hold ADS or ordinary shares, absent a special election as discussed below. The application of the PFIC rules is subject to uncertainty in several respects, and we cannot assure you we will not be a PFIC for any taxable year.
If we are a PFIC for any taxable year during which you hold ADSs or ordinary shares, you will be subject to special tax rules with respect to any “excess distribution” you receive and any gain you recognize from a sale or other disposition (including a pledge) of the ADSs or ordinary shares, unless you make a“mark-to-market” or qualified electing fund (“QEF”) election (if available) as discussed below. Distributions you receive in a taxable year that are greater than 125% of the average annual distributions you received during the shorter of the three preceding taxable years or your holding period for the ADSs or ordinary shares will be treated as an excess distribution.
202
Under these special tax rules:
| | • | | the excess distribution or gain will be allocated ratably over your holding period for the ADSs or ordinary shares, |
| | • | | the amount allocated to the current taxable year, and any taxable year prior to the first taxable year in which we became a PFIC, will be treated as ordinary income, and |
| | • | | the amount allocated to each other year will be subject to tax at the highest tax rate in effect for that year and the interest charge normally applicable to underpayments of tax will be imposed on the resulting tax attributable to each such year. |
The tax liability for amounts allocated to years prior to the year of disposition or “excess distribution” cannot be offset by any net operating losses for such years, and gains (but not losses) realized on the sale of the ADSs or ordinary shares cannot be treated as capital, even if you hold the ADSs or ordinary shares as capital assets.
In addition, if we are a PFIC, to the extent any of our subsidiaries are also PFICs, you may be deemed to own shares in such subsidiaries that are directly or indirectly owned by us in that proportion which the value of the shares you own so bears to the value of all of our shares, and may be subject to the adverse tax consequences described above with respect to the shares of such subsidiaries you would be deemed to own.
If we are a PFIC, you may avoid taxation under the rules described above by making a QEF election to include your share of our income on a current basis in any taxable year that we are a PFIC, provided we agree to furnish you annually with certain tax information. However, we do not presently intend to prepare or provide such information.
Alternatively, if the ADSs are “marketable stock” (as defined below), you can avoid taxation under the unfavorable PFIC rules described above in respect of the ADSs by making amark-to-market election in respect of the ADSs by the due date (determined with regard to extensions) for your tax return in respect of your first taxable year during which we are treated as a PFIC. If you make amark-to-market election for the ADSs or ordinary shares, you will include in income in each of your taxable years during which we are a PFIC an amount equal to the excess, if any, of the fair market value of the ADSs or ordinary shares as of the close of your taxable year over your adjusted basis in such ADSs or ordinary shares. You are allowed a deduction for the excess, if any, of the adjusted basis of the ADSs or ordinary shares over their fair market value as of the close of the taxable year. However, deductions are allowable only to the extent of any netmark-to-market gains on the ADSs or ordinary shares included in your income for prior taxable years. Amounts included in your income under amark-to-market election, as well as gain on the actual sale or other disposition of the ADSs or ordinary shares, are treated as ordinary income. Ordinary loss treatment also applies to the deductible portion of anymark-to-market loss on the ADSs or ordinary shares, as well as to any loss realized on the actual sale or disposition of the ADSs or ordinary shares, to the extent that the amount of such loss does not exceed the netmark-to-market gains previously included for such ADSs or ordinary shares. Your basis in the ADSs or ordinary shares will be adjusted to reflect any such income or loss amounts. Further, distributions would be taxed as described above under “— Distributions,” except the preferential dividend rates with respect to “qualified dividend income” would not apply. You will not be required to recognizemark-to-market gain or loss in respect of your taxable years during which we were not at any time a PFIC.
Themark-to-market election is available only for “marketable stock,” which is stock that is traded in other than de minimis quantities on at least 15 days during each calendar quarter on a qualified exchange, including the NYSE, or other market, as defined in the applicable US Treasury regulations. Our ADSs are listed on the NYSE and consequently, if you hold ADSs themark-to-market election would be available to you, provided the ADSs are traded in sufficient quantities. US Holders of ADSs or ordinary shares should consult their tax advisors as to whether the ADSs or ordinary shares would qualify for themark-to-market election.
You also generally can make a “deemed sale” election in respect of any time we cease being a PFIC, in which case you will be deemed to have sold, at fair market value, your ADSs or ordinary shares (and shares of our PFIC subsidiaries, if any, that you are deemed to own) on the last day of our taxable year immediately prior to our taxable year in respect of which we are not a PFIC. If you make this deemed sale election, you generally would be subject to the unfavorable PFIC rules described above in respect of any gain realized on such deemed sale, but as long as we are not a PFIC for future years, you would not be subject to the PFIC rules for those future years.
If you hold ADSs or ordinary shares in any year in which we or any of our subsidiaries are a PFIC, you would be required to file an annual information report with the US Internal Revenue Service, for each entity that is a PFIC, regarding distributions received on the ADSs or ordinary shares and any gain realized on the disposition of the ADSs or ordinary shares. You should consult your tax advisors regarding the potential application of the PFIC rules to your ownership of ADSs or ordinary shares and the elections discussed above.
203
US Information Reporting and Backup Withholding
Dividend payments with respect to ADSs or ordinary shares and proceeds from the sale, exchange or redemption of ADSs or ordinary shares may be subject to information reporting to the IRS and possible US backup withholding. Backup withholding will not apply, however, to a US Holder who furnishes a correct taxpayer identification number and makes any other required certification or who is otherwise exempt from backup withholding and establishes such exempt status. US Holders should consult their tax advisors regarding the application of the US information reporting and backup withholding rules.
Backup withholding is not an additional tax. Amounts withheld as backup withholding may be credited against your US federal income tax liability, and you may obtain a refund of any excess amounts withheld under the backup withholding rules by filing the appropriate claim for refund with the IRS and furnishing any required information.
Additional Reporting Requirements
US individuals that own “specified foreign financial assets” with an aggregate value in excess of certain amounts are generally required to file an information report with respect to such assets with their tax returns. “Specified foreign financial assets” include any financial accounts maintained by foreign financial institutions, as well as any of the following, but only if they are not held in accounts maintained by financial institutions: (i) stocks and securities issued bynon-US persons, (ii) financial instruments and contracts held for investment that havenon-US issuers or counterparties, and (iii) interests in foreign entities. Under certain circumstances, an entity may be treated as an individual for purposes of these rules. Our ADSs or ordinary shares may be subject to these rules. US Holders should consult their tax advisers regarding the application of this requirement to their ownership of our shares.
F. Dividends and Paying Agents
Not applicable.
G. Statement by Experts
Not applicable.
H. Documents on Display
Publicly filed documents concerning our company which are referred to in this annual report may be inspected and copied at the public reference facilities maintained by the Commission at 100 F Street, N.E., Washington, D.C. 20549. Copies of these materials can also be obtained from the Public Reference Room at the Commission’s principal office, 100 F Street, N.E., Washington D.C. 20549, after payment of fees at prescribed rates.
The Commission maintains a website at www.sec.gov that contains reports, proxy and information statements and other information regarding registrants that make electronic filings through its Electronic Data Gathering, Analysis, and Retrieval (“EDGAR”) system. We have made all our filings with the Commission using the EDGAR system.
I. Subsidiary Information
For more information on our subsidiaries, please see “Part I—Item 4. Information on the Company — C. Organizational Structure.”
204
ITEM 11. QUANTITATIVE AND QUALITATIVE DISCLOSURES ABOUT MARKET RISK
A. General
Market risk is attributable to all market sensitive financial instruments including foreign currency receivables and payables. The value of a financial instrument may change as a result of changes in the interest rates, foreign currency exchange rates, commodity prices, equity prices and other market changes that affect market risk sensitive instruments.
Our exposure to market risk is primarily a function of our revenue generating activities and any future borrowings in foreign currency. The objective of market risk management is to avoid excessive exposure of our earnings to losses. Most of our exposure to market risk arises from our revenue and expenses that are denominated in different currencies.
The following risk management discussion and the estimated amounts generated from analytical techniques are forward-looking statements of market risk assuming certain market conditions. Our actual results in the future may differ materially from these projected results due to actual developments in the global financial markets.
B. Risk Management Procedures
We manage market risk through our treasury operations. Our senior management and our Board of Directors approve our treasury operations’ objectives and policies. The activities of our treasury operations include management of cash resources, implementation of hedging strategies for foreign currency exposures, implementation of borrowing strategies and monitoring compliance with market risk limits and policies. Our Foreign Exchange Committee, comprising the Chairman of the Board, our Group Chief Executive Officer and our Group Chief Financial Officer, is the approving authority for all our hedging transactions.
Components of Market Risk
Exchange Rate Risk
Our exposure to market risk arises principally from exchange rate risk. Although substantially all of our revenue less repair payments(non-GAAP) is denominated in pound sterling and US dollars, approximately 51.1% of our expenses (net of payments to repair centers made as part of our WNS Auto Claims BPM segment) in fiscal 2017 were incurred and paid in Indian rupees. The exchange rates between each of the pound sterling, the Indian rupee, the Australian dollar, the South African rand and the Philippines peso, on the one hand, and the US dollar, on the other hand, have changed substantially in recent years and may fluctuate substantially in the future. See “Part I — Item 5 Operating and Financial Review Prospects — Foreign Exchange — Exchange Rates.”
Our exchange rate risk primarily arises from our foreign currency-denominated receivables. Based upon our level of operations for fiscal 2017, a sensitivity analysis shows that a 10% appreciation or depreciation in the pound sterling against the US dollar would have increased or decreased revenue by approximately $22.9 million and increased or decreased revenue less repair payments(non-GAAP) by approximately $20.5 million for fiscal 2017, a 10% appreciation or depreciation in the Australian dollar against the US dollar would have increased or decreased revenue and revenue less repair payments(non-GAAP) by approximately $4.3 million for fiscal 2017, and a 10% appreciation or depreciation in the South African rand against the US dollar would have increased or decreased revenue and revenue less repair payments(non-GAAP) by approximately $4.1 million for fiscal 2017. Similarly, a 10% appreciation or depreciation in the Indian rupee against the US dollar would have increased or decreased our expenses incurred and paid in Indian rupee for fiscal 2017 by approximately $25.4 million, a 10% appreciation or depreciation in the South African rand against the US dollar would have increased or decreased our expenses incurred and paid in South African rand for fiscal 2017 by approximately $6.0 million and a 10% appreciation or depreciation in the Philippines peso against the US dollar would have increased or decreased our expenses incurred and paid in Philippines peso for fiscal 2017 by approximately $4.9 million.
To protect against foreign exchange gains or losses on forecasted revenue and inter-company revenue, we have instituted a foreign currency cash flow hedging program. We hedge a part of our forecasted revenue and inter-company revenue denominated in foreign currencies with forward contracts and options.
Interest Rate Risk
Our exposure to interest rate risk arises from our borrowings which have a floating rate of interest, which is linked to the US dollar LIBOR. We manage this risk by maintaining an appropriate mix between fixed and floating rate borrowings and through the use of interest rate swap contracts. The costs of floating rate borrowings may be affected by the fluctuations in the interest rates. In connection with the term loan facilities entered into in fiscal 2017, we entered into interest rate swap agreements with the banks in fiscal 2017. These swap agreements effectively convert the term loans from a variable US dollar LIBOR interest rate to a fixed rate, thereby managing our exposure to changes in market interest rates under the term loans. The outstanding swap agreements as at March 31, 2017 aggregated to $118,000.
We monitor our positions and do not anticipatenon-performance by the counterparties. We intend to selectively use interest rate swaps, options and other derivative instruments to manage our exposure to interest rate movements. These exposures are reviewed by appropriate levels of management on a periodic basis. We do not enter into hedging agreements for speculative purposes.
205
ITEM 12. DESCRIPTION OF SECURITIES OTHER THAN EQUITY SECURITIES
A. Debt Securities
Not applicable.
B. Warrants and Rights
Not applicable.
C. Other Securities
Not applicable.
D. American Depositary Shares
Our ADR facility is maintained with Deutsche Bank Trust Company Americas, (the “Depositary”), pursuant to a Deposit Agreement, dated as at July 18, 2006, among us, our Depositary and the holders and beneficial owners of ADSs. We use the term “holder” in this discussion to refer to the person in whose name an ADR is registered on the books of the Depositary.
In accordance with the Deposit Agreement, the Depositary may charge fees up to the amounts described below:
| | | | |
| | | Type of Service | | Fees |
| 1. | | Issuance of ADSs, including upon the deposit of ordinary shares or to any person to whom an ADS distribution is made pursuant to share dividends or other free distributions of shares, bonus distributions, share splits or other distributions (except where converted to cash) | | $5.00 per 100 ADSs (or any portion thereof) |
| | |
| 2. | | Surrender of ADSs for cancellation and withdrawal of ordinary shares underlying such ADSs (including cash distributions made pursuant to a cancellation or withdrawal) | | $5.00 per 100 ADSs (or any portion thereof) |
| | |
| 3. | | Distribution of cash proceeds, including cash dividends or sale of rights and other entitlements, not made pursuant to a cancellation or withdrawal | | $2.00 per 100 ADSs (or any portion thereof) |
| | |
| 4. | | Issuance of ADSs upon the exercise of rights | | $5.00 per 100 ADSs (or any portion thereof) |
| | |
| 5. | | Operations and maintenance costs in administering the ADSs (provided that the total fees assessed under this item, combined with the total fees assessed under item 3 above, should not exceed $0.02 per ADS in any calendar year) | | $0.02 per ADS per calendar year |
In addition, holders or beneficial owners of our ADS, persons depositing ordinary shares for deposit and persons surrendering ADSs for cancellation and withdrawal of deposited securities will be required to pay the following charges:
| | • | | taxes (including applicable interest and penalties) and other governmental charges; |
| | • | | registration fees for the registration of ordinary shares or other deposited securities with applicable registrar and applicable to transfers of ordinary shares or other deposited securities in connection with the deposit or withdrawal of ordinary shares or other deposited securities; |
| | • | | certain cable, telex, facsimile and electronic transmission and delivery expenses; |
| | • | | expenses and charges incurred by the Depositary in the conversion of foreign currency into US dollars; |
| | • | | fees and expenses incurred by the Depositary in connection with compliance with exchange control regulations and other regulatory requirements applicable to ordinary shares, deposited securities, ADSs and ADRs; |
| | • | | fees and expenses incurred by the Depositary in connection with the delivery of deposited securities; and |
| | • | | any additional fees, charges, costs or expenses that may be incurred by the Depositary from time to time. |
206
In the case of cash distributions, the applicable fees, charges, expenses and taxes will be deducted from the cash being distributed. In the case of distributions other than cash, such as share dividends, the distribution generally will be subject to appropriate adjustments for the deduction of the applicable fees, charges, expenses and taxes. In certain circumstances, the Depositary may dispose of all or a portion of such distribution and distribute the net proceeds of such sale to the holders of ADS, after deduction of applicable fees, charges, expenses and taxes.
If the Depositary determines that any distribution in property is subject to any tax or other governmental charge which the Depositary is obligated to withhold, the Depositary may withhold the amount required to be withheld and may dispose of all or a portion of such property in such amounts and in such manner as the Depositary deems necessary and appropriate to pay such taxes or charges and the Depositary will distribute the net proceeds of any such sale after deduction of such taxes or charges to the holders of ADSs entitled to the distribution.
During fiscal 2011, the Depository has made a payment of $5,500 to IPREO (Hemscott Holdings Limited) on behalf of our company in consideration for our access to the Bigdough investor relations tool.
207
PART II
ITEM 13. DEFAULTS, DIVIDEND ARREARAGES AND DELINQUENCIES
None.
ITEM 14. MATERIAL MODIFICATIONS TO THE RIGHTS OF SECURITY HOLDERS AND USE OF PROCEEDS
Not applicable.
ITEM 15. CONTROLS AND PROCEDURES
Evaluation of Disclosure Controls and Procedures
As required by Rules13a-15 and15d-15 under the Exchange Act, management has evaluated, with the participation of our Group Chief Executive Officer and Group Chief Financial Officer, the effectiveness of our disclosure controls and procedures as of the end of the period covered by this annual report. Disclosure controls and procedures refer to controls and other procedures designed to ensure that information required to be disclosed in the reports we file or submit under the Exchange Act is recorded, processed, summarized and reported, within the time periods specified in the rules and forms of the Commission. Disclosure controls and procedures include, without limitation, controls and procedures designed to ensure that information required to be disclosed by us in our reports that we file or submit under the Exchange Act is accumulated and communicated to management, including our Group Chief Executive Officer and Group Chief Financial Officer, as appropriate to allow timely decisions regarding our required disclosure.
Based on the foregoing, our Group Chief Executive Officer and Group Chief Financial Officer have concluded that, as at March 31, 2017, our disclosure controls and procedures were effective and provide a reasonable level of assurance.
Management’s Report on Internal Control over Financial Reporting
Management is responsible for establishing and maintaining adequate internal control over financial reporting.
Internal control over financial reporting refers to a process designed by, or under the supervision of, our Group Chief Executive Officer and Group Chief Financial Officer and effected by our Board of Directors, management and other personnel, to provide reasonable assurance regarding the reliability of financial reporting and the preparation of financial statements for external purposes in accordance with generally accepted accounting principles and includes those policies and procedures that:
| | • | | pertain to the maintenance of records that in reasonable detail accurately and fairly reflect the transactions and dispositions of our assets; |
| | • | | provide reasonable assurance that transactions are recorded as necessary to permit preparation of financial statements in accordance with generally accepted accounting principles, and that our receipts and expenditures are being made only in accordance with authorizations of our management and members of our Board of Directors; and |
| | • | | provide reasonable assurance regarding prevention or timely detection of unauthorized acquisition, use, or disposition of our assets that could have a material effect on our financial statements. |
Management recognizes that there are inherent limitations in the effectiveness of any system of internal control over financial reporting, including the possibility of human error and the circumvention or override of internal control. Accordingly, even effective internal control over financial reporting can provide only reasonable assurance with respect to financial statement preparation, and may not prevent or detect all misstatements. Also, projections of any evaluation of effectiveness to future periods are subject to the risk that controls may become inadequate due to changes in conditions, or that the degree of compliance with the policies or procedures may deteriorate.
Management assessed the effectiveness of internal control over financial reporting as at March 31, 2017, based on the criteria established in the 2013 Internal Control — Integrated Framework issued by the Committee of Sponsoring Organizations of the Treadway Commission. The scope of management’s assessment of the effectiveness of internal control over financial reporting includes all of WNS’ consolidated operations except for the acquired operations of Value Edge Research Services Private Limited and its subsidiaries, Denali Sourcing Services Inc., and MTS HealthHelp Inc. and its subsidiaries (collectively, the “Acquired Operations”), which were acquired in June 2016, January 2017 and March 2017 respectively and whose financial statements collectively reflected total assets and revenues constituting 3.9% and 1.9%, respectively, of the related consolidated financial statements amounts as at and for the year ended March 31, 2017.
Based on the above criteria, and as a result of this assessment, management concluded that, as at March 31, 2017, our internal control over financial reporting was effective in providing reasonable assurance regarding the reliability of financial reporting and the preparation of financial statements for external purposes in accordance with generally accepted accounting principles.
208
The effectiveness of our internal control over financial reporting as at March 31, 2017, has been audited by Grant Thornton India LLP, an independent registered public accounting firm, as stated in their report set out below.
209
REPORT OF INDEPENDENT REGISTERED PUBLIC ACCOUNTING FIRM
Board of Directors and Shareholders of
WNS (Holdings) Limited
We have audited the internal control over financial reporting of WNS (Holdings) Limited and subsidiaries (the “Company”) as of March 31, 2017, based on criteria established in the 2013Internal Control—Integrated Framework issued by the Committee of Sponsoring Organizations of the Treadway Commission (COSO). The Company’s management is responsible for maintaining effective internal control over financial reporting and for its assessment of the effectiveness of internal control over financial reporting, included in the accompanying Management’s Report on Internal Control over Financial Reporting. Our responsibility is to express an opinion on the Company’s internal control over financial reporting based on our audit. Our audit of, and opinion on, the Company’s internal control over financial reporting does not include the internal control over financial reporting of Value Edge Research Services Private Limited and its subsidiaries, Denali Sourcing Services Inc., and MTS HealthHelp Inc. and its subsidiaries (collectively, the “Acquired Operations”), whose financial statements reflect total assets and revenues constituting 3.9 and 1.9 percent, respectively, of the related consolidated financial statement amounts as of and for the year ended March 31, 2017. As indicated in Management’s Report, the Acquired Operations were acquired during the year ended March 31, 2017. Management’s assertion on the effectiveness of the Company’s internal control over financial reporting excluded internal control over financial reporting of the Acquired Operations.
We conducted our audit in accordance with the standards of the Public Company Accounting Oversight Board (United States). Those standards require that we plan and perform the audit to obtain reasonable assurance about whether effective internal control over financial reporting was maintained in all material respects. Our audit included obtaining an understanding of internal control over financial reporting, assessing the risk that a material weakness exists, testing and evaluating the design and operating effectiveness of internal control based on the assessed risk, and performing such other procedures as we considered necessary in the circumstances. We believe that our audit provides a reasonable basis for our opinion.
A company’s internal control over financial reporting is a process designed to provide reasonable assurance regarding the reliability of financial reporting and the preparation of financial statements for external purposes in accordance with generally accepted accounting principles. A company’s internal control over financial reporting includes those policies and procedures that (1) pertain to the maintenance of records that, in reasonable detail, accurately and fairly reflect the transactions and dispositions of the assets of the company; (2) provide reasonable assurance that transactions are recorded as necessary to permit preparation of financial statements in accordance with generally accepted accounting principles, and that receipts and expenditures of the company are being made only in accordance with authorizations of management and directors of the company; and (3) provide reasonable assurance regarding prevention or timely detection of unauthorized acquisition, use, or disposition of the company’s assets that could have a material effect on the financial statements.
Because of its inherent limitations, internal control over financial reporting may not prevent or detect misstatements. Also, projections of any evaluation of effectiveness to future periods are subject to the risk that controls may become inadequate because of changes in conditions, or that the degree of compliance with the policies or procedures may deteriorate.
In our opinion, the Company maintained, in all material respects, effective internal control over financial reporting as of March 31, 2017, based on criteria established in the 2013Internal Control—Integrated Framework issued by COSO.
We also have audited, in accordance with the standards of the Public Company Accounting Oversight Board (United States), the consolidated financial statements of the Company as of and for the year ended March 31, 2017, and our report dated June 29, 2017 expressed an unqualified opinion on those financial statements.
|
|
| /s/ GRANT THORNTON INDIA LLP |
|
Mumbai, India |
June 29, 2017 |
210
Changes in Internal Control over Financial Reporting
Management has evaluated, with the participation of our Group Chief Executive Officer and Group Chief Financial Officer, whether any changes in our internal control over financial reporting that occurred during the period covered by this annual report on Form20-F have materially affected, or are reasonably likely to materially affect, our internal control over financial reporting. Based on the evaluation we conducted, management has concluded that no such changes have occurred.
ITEM 16A. AUDIT COMMITTEE FINANCIAL EXPERT
Our Audit Committee members are Messrs. Albert Aboody (Chairman), John Freeland and Michael Menezes, and Ms. Francoise Gri. Each of Messrs. Aboody, Freeland and Menezes and Ms. Gri is an independent director pursuant to the applicable rules of the Commission and the NYSE. See “Part I — Item 6. Directors, Senior Management and Employees — A. Directors and Executive Officers” for the experience and qualifications of the members of the Audit Committee. Our Board of Directors has determined that Messrs. Aboody and Menezes each qualifies as an “audit committee financial expert” as defined in Item 16A ofForm 20-F.
ITEM 16B. CODE OF ETHICS
We have adopted a Code of Business Ethics and Conduct that is applicable to all of our directors, senior management and employees. The Code of Business Ethics and Conduct was amended in October 2016 to refresh our core purposes and values. We have posted the code on our website at www.wns.com. Information contained in our website does not constitute a part of this annual report. We will also make available a copy of the Code of Business Ethics and Conduct to any person, without charge, if a written request is made to our General Counsel at our principal executive offices at Gate 4, Godrej & Boyce Complex, Pirojshanagar, Vikhroli (W), Mumbai 400 079, India.
ITEM 16C. PRINCIPAL ACCOUNTANT FEES AND SERVICES
Principal Accountant Fees and Services
Grant Thornton India LLP has served as our independent public accountant for the fiscal year ended March 31, 2017. The following table shows the fees we paid or accrued for audit and other services provided by Grant Thornton India LLP and Grant Thornton member firms for the years ended March 31, 2017 and March 31, 2016.
| | | | | | | | |
| | | Fiscal | |
| | | 2017 | | | 2016 | |
Audit fees | | $ | 559,780 | | | $ | 527,500 | |
Audit-related fees | | | 119,700 | | | | 28,959 | |
Tax fees | | | 32,000 | | | | 32,000 | |
Notes:
Audit fees: This category consists of fees billed for the audit of financial statements, quarterly review of financial statements and other audit services, which are normally provided by the independent auditors in connection with statutory and accounting matters that arose during, or as a result of, the audit or the review of interim financial statements and include the group audit; statutory audits required bynon-US jurisdictions; consents and attest services.
Audit-related fees: This category consists of fees billed for assurance and related services that are reasonably related to the performance of the audit or review of our financial statements or that are traditionally performed by an external auditor, and includes service tax certifications and out of pocket expenses.
Tax fees: This category includes fees billed for tax audits.
Audit CommitteePre-approval Process
Our Audit Committee reviews andpre-approves the scope and the cost of all audit and permissiblenon-audit services performed by our independent auditor. All of the services provided by Grant Thornton India LLP and Grant Thornton member firms during the last fiscal year have beenpre-approved by our Audit Committee.
211
ITEM 16D. EXEMPTIONS FROM THE LISTING STANDARDS FOR AUDIT COMMITTEES
Not applicable.
ITEM 16E. PURCHASES OF EQUITY SECURITIES BY THE ISSUER AND AFFILIATED PURCHASERS
In March 2016, our shareholders authorized a share repurchase program for the repurchase of up to 3.3 million of our ADSs, each representing one ordinary share, at a price range of $10 to $50 per ADS. Pursuant to the terms of the repurchase program, our ADSs may be purchased in the open market from time to time for 36 months from March 16, 2016, the date the shareholders resolution approving the repurchase program was passed. Purchases of ADSs under the repurchase program during fiscal 2017 (as set out in the table below) were funded with cash on hand. We intend to fund further purchases of ADSs under the repurchase program with cash on hand. We are not obligated under the repurchase program to repurchase a specific number of ADSs, and the repurchase program may be suspended at any time at our discretion. We intend to hold the shares underlying any such repurchased ADSs as treasury shares.
The table below sets forth the details of ADSs repurchased during fiscal 2017 under the above mentioned share repurchase program:
| | | | | | | | | | | | | | | | |
Period | | No. of
ADSs
purchased | | | Average price
paid per ADS
(in $) * | | | Total number of ADSs
purchased as part of
publicly announced
plans or programs | | | Approximate U.S
dollar value (in 000s) of
ADSs that may yet
be repurchased
under the program
(assuming purchase
price of $50 per
ADS) | |
April 1 to April 30, 2016 | | | — | | | | — | | | | — | | | $ | 165,000 | |
May 1 to May 31, 2016 | | | 39,732 | | | | 30.39 | | | | 39,732 | | | | 163,013 | |
June 1 to June 30, 2016 | | | 710,268 | | | | 30.49 | | | | 710,268 | | | | 127,500 | |
July 1 to July 31, 2016 | | | — | | | | — | | | | — | | | | 127,500 | |
August 1 to August 31, 2016 | | | 395,444 | | | | 29.43 | | | | 395,444 | | | | 107,728 | |
September 1 to September 30, 2016 | | | — | | | | — | | | | — | | | | 107,728 | |
October 1 to October 31, 2016 | | | 898,366 | | | | 28.09 | | | | 898,366 | | | | 62,810 | |
November 1 to November 30, 2016 | | | 156,190 | | | | 27.47 | | | | 156,190 | | | | 55,000 | |
December 1 to December 31, 2016 | | | — | | | | — | | | | — | | | | 55,000 | |
January 1 to January 31, 2017 | | | — | | | | — | | | | — | | | | 55,000 | |
February 1 to February 28, 2017 | | | — | | | | — | | | | — | | | | 55,000 | |
March 1 to March 31, 2017 | | | — | | | | — | | | | — | | | | 55,000 | |
Total | | | 2,200,000 | | | | 29.10 | | | | 2,200,000 | | | $ | 55,000 | |
| * | excludes transaction costs |
ITEM 16F. CHANGE IN REGISTRANT’S CERTIFYING ACCOUNTANT
Not applicable.
ITEM 16G. CORPORATE GOVERNANCE
We have posted our Corporate Governance Guidelines on our website at www.wns.com. Information contained in our website does not constitute a part of this annual report.
Messrs. Adrian T. Dillon and Gareth Williams and Mrs. Renu S. Karnad are members of our Board of Directors and they serve on each of our Compensation Committee and Nominating and Corporate Governance Committee. Messrs. Albert Aboody, Michael Menezes and John Freeland and Ms. Francoise Gri serve on our Audit Committee. Each of Messrs. Dillon, Freeland, Menezes, Williams and Aboody, Ms. Gri and Mrs. Karnad satisfies the “independence” requirements of the NYSE listing standards and the “independence” requirements ofRule 10A-3 of the Exchange Act.
212
On May 31, 2016, our Third Amended and Restated 2006 Incentive Award Plan expired pursuant to its terms. On June 1, 2016, June 14, 2016 and July 13, 2016, we issued an aggregate 44,284 restricted share units to certain of our employees and directors pursuant to an exemption from registration under the United States federal securities laws. We did not seek shareholder approval for these issuances as they are not required under the laws of Jersey.
Except as disclosed in the preceding paragraph, we are not aware of any significant differences between our corporate governance practices and those required to be followed by US issuers under the NYSE listing standards.
As a foreign private issuer, we are exempt from the rules under the Exchange Act governing the furnishing and content of proxy statements, including disclosure relating to any conflicts of interests concerning the issuer’s compensation consultants, and our directors, senior management and principal shareholders are exempt from the reporting and “short-swing profit” recovery provisions contained in Section 16 of the Exchange Act.
ITEM 16H. MINE SAFETY DISCLOSURE
Not applicable.
213
PART III
ITEM 17. FINANCIAL STATEMENTS
See “Part III — Item 18. Financial Statements” for a list of our consolidated financial statements included elsewhere in this annual report.
ITEM 18. FINANCIAL STATEMENTS
The following statements are filed as part of this annual report, together with the report of the independent registered public accounting firm:
| | • | | Report of Independent Registered Public Accounting Firm |
| | • | | Consolidated Statements of Financial Position as at March 31, 2017 and 2016 |
| | • | | Consolidated Statements of Income for the years ended March 31, 2017, 2016 and 2015 |
| | • | | Consolidated Statements of Comprehensive Income for the years ended March 31, 2017, 2016 and 2015 |
| | • | | Consolidated Statements of Changes in Equity for the years ended March 31, 2017, 2016 and 2015 |
| | • | | Consolidated Statements of Cash Flows for the years ended March 31, 2017, 2016 and 2015 |
| | • | | Notes to Consolidated Financial Statements |
214
ITEM 19. EXHIBITS
The following exhibits are filed as part of this annual report:
| | |
| 1.1 | | Memorandum of Association of WNS (Holdings) Limited, as amended — incorporated by reference to Exhibit 3.1 of the Registration Statement onForm F-1 (FileNo. 333-135590) of WNS (Holdings) Limited, as filed with the Commission on July 3, 2006. |
| |
| 1.2 | | Articles of Association of WNS (Holdings) Limited, as amended — incorporated by reference to Exhibit 3.2 of the Registration Statement onForm F-1 (FileNo. 333-135590) of WNS (Holdings) Limited, as filed with the Commission on July 3, 2006. |
| |
| 2.1 | | Form of Deposit Agreement among WNS (Holdings) Limited, Deutsche Bank Trust Company Americas, as Depositary, and the holders and beneficial owners of American Depositary Shares evidenced by American Depositary Receipts, or ADR, issued thereunder (including the Form of ADR) — incorporated by reference to Exhibit 4.1 of the Registration Statement onForm F-1 (FileNo. 333-135590) of WNS (Holdings) Limited, as filed with the Commission on July 3, 2006. |
| |
| 2.2 | | Specimen Ordinary Share Certificate of WNS (Holdings) Limited — incorporated by reference to Exhibit 4.4 of the Registration Statement onForm 8-A (FileNo. 001-32945) of WNS (Holdings) Limited, as filed with the Commission on July 14, 2006. |
| |
| 4.1 | | Form of the Third Amended and Restated WNS (Holdings) Limited 2006 Incentive Award Plan — incorporated by reference to Appendix A to WNS (Holdings) Limited’s Proxy Statement which was furnished as Exhibit 99.3 of its Report onForm 6-K (FileNo. 001-32945), as furnished to the Commission on August 23, 2013. |
| |
| 4.2 | | Form of the WNS (Holdings) Limited 2016 Incentive Award Plan — incorporated by reference to Appendix A to WNS (Holdings) Limited’s Proxy Statement which was furnished as Exhibit 99.3 of its Report onForm 6-K (FileNo. 001-32945), as furnished to the Commission on September 1, 2016. |
| |
| 4.3 | | Lease Deed dated January 20, 2012 between Sri Divi Satya Mohan, Sri Attaluri Praveen and Sri Divi Satya Sayee Babu, on the one hand, and WNS Global Services Private Limited, on the other hand, with respect to lease of office premises — incorporated by reference to Exhibit 4.8 of the Annual Report on Form20-F for fiscal 2012 (FileNo. 001-32945) of WNS (Holdings) Limited, as filed with the Commission on April 26, 2012. |
| |
| 4.4 | | Addendum to Lease Deed dated July 23, 2012 between Sri Divi Satya Mohan, Sri Attaluri Praveen and Sri Divi Satya Sayee Babu, on the one hand, and WNS Global Services Private Limited and WNS Business Consulting Services Private Limited, on the other hand. — incorporated by reference to Exhibit 4.5 of the Annual Report on Form20-F for fiscal 2013 (FileNo. 001-32945) of WNS (Holdings) Limited, as filed with the Commission on May 2, 2013. |
| |
| 4.5 | | Contract of Lease dated September 27, 2012 between Megaworld Corporation and WNS Global Services Philippines, Inc. with respect to lease of office premises — incorporated by reference to Exhibit 4.6 of the Annual Report on Form20-F for fiscal 2013 (FileNo. 001-32945) of WNS (Holdings) Limited, as filed with the Commission on May 2, 2013. |
| |
| 4.6 | | Lease Deed commencing April 28, 2014 between WNS Global Services Private Limited and DLF Assets Private Limited with respect to the lease of office premises on the 10th floor of Blocks A2 and A3 at World Tech Park — incorporated by reference to Exhibit 4.12 of the Annual Report on Form20-F for fiscal 2015 (FileNo. 001-32945) of WNS (Holdings) Limited, as filed with the Commission on May 5, 2015. |
| |
| 4.7 | | Lease Deed commencing April 28, 2014 between WNS Global Services Private Limited and DLF Assets Private Limited with respect to the lease of office premises on the 8th, 9th and 11th floors of Blocks A2 and A3 at World Tech Park — incorporated by reference to Exhibit 4.13 of the Annual Report onForm 20-F for fiscal 2015 (FileNo. 001-32945) of WNS (Holdings) Limited, as filed with the Commission on May 5, 2015. |
| |
| 4.8 | | Lease Deed commencing April 1, 2016 between WNS Global Services Private Limited and DLF Assets Private Limited with respect to the lease of office premises on the 10th floor of Block 10 at DLF IT Park incorporated by reference to Exhibit 4.8 of the Annual Report on Form20-F for fiscal 2016 (FileNo. 001-32945) of WNS (Holdings) Limited, as filed with the Commission on May 12, 2016. |
| |
| 4.9 | | Leave and License Agreement dated March 8, 2016 between Godrej and Boyce Manufacturing Company Limited and WNS Global Services Private Limited with respect to the lease of the office premises with an aggregate area of 84,429 square feet at plant 10 — incorporated by reference to Exhibit 4.9 of the Annual Report on Form20-F for fiscal 2016 (FileNo. 001-32945) of WNS (Holdings) Limited, as filed with the Commission on May 12, 2016. |
| |
| 4.10 | | Leave and License Agreement dated March 8, 2016 between Godrej and Boyce Manufacturing Company Limited and WNS Global Services Private Limited with respect to the lease of the office premises with an aggregate area of 108,000 square feet at plant 5—incorporated by reference to Exhibit 4.10 of the Annual Report on Form20-F for fiscal 2016 (FileNo. 001-32945) of WNS (Holdings) Limited, as filed with the Commission on May 12, 2016. |
215
| | |
| |
| 4.11 | | Leave and License Agreement dated March 8, 2016 between Godrej and Boyce Manufacturing Company Limited and WNS Global Services Private Limited with respect to the lease of the office premises with an aggregate area of 84,934 square feet at plant 11 incorporated by reference to Exhibit 4.11 of the Annual Report on Form20-F for fiscal 2016 (FileNo. 001-32945) of WNS (Holdings) Limited, as filed with the Commission on May 12, 2016. |
| |
| 4.12 | | Stock Purchase Agreement dated as of January 10, 2017 by and among WNS North America Inc., the Sellers, the Optionholders and the Sellers Representative (each as defined therein).** |
| |
| 4.13 | | Stock Purchase Agreement and Plan of Merger dated as of March 15, 2017 by and among WNS Global Services Private Limited, WNS North America Inc., WNS Healthcare North America LLC, HealthHelp Holdings, LLC, MTS HealthHelp Inc., the stockholders of MTS HealthHelp Inc., Cherrill Farnsworth and the Sellers’ Representative (as defined therein).** # |
| |
| 4.14 | | Facility Agreement dated January 18, 2017 between WNS North America Inc. and BNP Paribas, Hong Kong.** |
| |
| 4.15 | | Facility Agreement dated March 10, 2017 among WNS (Mauritius) Limited, HSBC Bank (Mauritius) Limited, and Standard Chartered Bank, UK.** |
| |
| 8.1 | | List of subsidiaries of WNS (Holdings) Limited.** |
| |
| 12.1 | | Certification by the Chief Executive Officer to 17 CFR 240,15d-14(a), as adopted pursuant to Section 302 of the Sarbanes-Oxley Act of 2002.** |
| |
| 12.2 | | Certification by the Chief Financial Officer to 17 CFR 240,15d-14(a), as adopted pursuant to Section 302 of the Sarbanes-Oxley Act of 2002.** |
| |
| 13.1 | | Certification by the Chief Executive Officer to 18 U.S.C. Section 1350, as adopted pursuant to Section 906 of the Sarbanes-Oxley Act of 2002.** |
| |
| 13.2 | | Certification by the Chief Financial Officer to 18 U.S.C. Section 1350, as adopted pursuant to Section 906 of the Sarbanes-Oxley Act of 2002.** |
| |
| 15.1 | | Consent of Grant Thornton India LLP, independent registered public accounting firm.** |
| # | Certain portions of this exhibit have been omitted pursuant to a confidential treatment order of the Commission. The omitted portions have been separately filed with the Commission. |
216
SIGNATURES
The registrant hereby certifies that it meets all of the requirements for filing onForm 20-F and that it has duly caused and authorized the undersigned to sign this annual report on its behalf.
Date: June 29, 2017
| | | | | | |
| | | | WNS (HOLDINGS) LIMITED |
| | | |
| | | | By: | | /s/ Keshav R. Murugesh |
| | | | Name: | | Keshav R. Murugesh |
| | | | Title: | | Group Chief Executive Officer |
217
INDEX TO WNS (HOLDINGS) LIMITED’S CONSOLIDATED FINANCIAL STATEMENTS
F-1
REPORT OF INDEPENDENT REGISTERED PUBLIC ACCOUNTING FIRM
Board of Directors and Shareholders of
WNS (Holdings) Limited
We have audited the accompanying consolidated statements of financial position of WNS (Holdings) Limited and subsidiaries (the “Company”) as of March 31, 2017 and 2016, and the related consolidated statements of income, comprehensive income, changes in equity, and cash flows for each of the three years in the period ended March 31, 2017. These financial statements are the responsibility of the Company’s management. Our responsibility is to express an opinion on these financial statements based on our audits.
We conducted our audits in accordance with the standards of the Public Company Accounting Oversight Board (United States). Those standards require that we plan and perform the audit to obtain reasonable assurance about whether the financial statements are free of material misstatement. An audit includes examining, on a test basis, evidence supporting the amounts and disclosures in the financial statements. An audit also includes assessing the accounting principles used and significant estimates made by management, as well as evaluating the overall financial statement presentation. We believe that our audits provide a reasonable basis for our opinion.
In our opinion, the consolidated financial statements referred to above present fairly, in all material respects, the financial position of WNS (Holdings) Limited and subsidiaries as of March 31, 2017 and 2016, and the results of their operations and their cash flows for each of the three years in the period ended March 31, 2017, in conformity with International Financial Reporting Standards, as issued by the International Accounting Standards Board.
We also have audited, in accordance with the standards of the Public Company Accounting Oversight Board (United States), the Company’s internal control over financial reporting as of March 31, 2017, based on criteria established in the 2013 Internal Control — Integrated Framework issued by the Committee of Sponsoring Organizations of the Treadway Commission (COSO), and our report dated June 29, 2017 expressed an unqualified opinion on the Company’s internal control over financial reporting.
|
| /s/ GRANT THORNTON INDIA LLP |
|
| Mumbai, India |
| June 29, 2017 |
F-2
WNS (HOLDINGS) LIMITED
CONSOLIDATED STATEMENTS OF FINANCIAL POSITION
(Amounts in thousands, except share and per share data)
| | | | | | | | | | | | |
| | | | | | As at | |
| | | Notes | | | March 31,
2017 | | | March 31,
2016 | |
ASSETS | | | | | | | | | | | | |
Current assets: | | | | | | | | | | | | |
Cash and cash equivalents | | | 5 | | | $ | 69,803 | | | $ | 41,854 | |
Investments | | | 6 | | | | 111,992 | | | | 132,989 | |
Trade receivables, net | | | 7 | | | | 60,423 | | | | 54,911 | |
Unbilled revenue | | | | | | | 48,915 | | | | 44,318 | |
Funds held for clients | | | | | | | 9,135 | | | | 11,895 | |
Derivative assets | | | 13 | | | | 35,401 | | | | 13,890 | |
Prepayments and other current assets | | | 8 | | | | 27,385 | | | | 22,601 | |
| | | | | | | | | | | | |
Total current assets | | | | | | | 363,054 | | | | 322,458 | |
Non-current assets: | | | | | | | | | | | | |
Goodwill | | | 9 | | | | 134,008 | | | | 76,242 | |
Intangible assets | | | 10 | | | | 96,624 | | | | 27,117 | |
Property and equipment | | | 11 | | | | 54,796 | | | | 50,417 | |
Derivative assets | | | 13 | | | | 6,581 | | | | 4,847 | |
Deferred tax assets | | | 23 | | | | 16,687 | | | | 22,522 | |
Investments | | | 6 | | | | 429 | | | | — | |
Othernon-current assets | | | 8 | | | | 31,944 | | | | 21,848 | |
| | | | | | | | | | | | |
Totalnon-current assets | | | | | | | 341,069 | | | | 202,993 | |
| | | | | | | | | | | | |
TOTAL ASSETS | | | | | | $ | 704,123 | | | $ | 525,451 | |
| | | | | | | | | | | | |
LIABILITIES AND EQUITY | | | | | | | | | | | | |
Current liabilities: | | | | | | | | | | | | |
Trade payables | | | | | | $ | 14,239 | | | $ | 19,862 | |
Provisions and accrued expenses | | | 15 | | | | 27,217 | | | | 24,741 | |
Derivative liabilities | | | 13 | | | | 3,947 | | | | 3,259 | |
Pension and other employee obligations | | | 14 | | | | 52,933 | | | | 44,814 | |
Current portion of long term debt | | | 12 | | | | 27,613 | | | | — | |
Deferred revenue | | | 16 | | | | 5,478 | | | | 2,924 | |
Current taxes payable | | | | | | | 1,322 | | | | 1,746 | |
Other liabilities | | | 17 | | | | 16,015 | | | | 5,985 | |
| | | | | | | | | | | | |
Total current liabilities | | | | | | | 148,764 | | | | 103,331 | |
Non-current liabilities: | | | | | | | | | | | | |
Derivative liabilities | | | 13 | | | | 836 | | | | 451 | |
Pension and other employee obligations | | | 14 | | | �� | 10,680 | | | | 6,899 | |
Long term debt | | | 12 | | | | 89,130 | | | | — | |
Deferred revenue | | | 16 | | | | 378 | | | | 256 | |
Othernon-current liabilities | | | 17 | | | | 18,469 | | | | 4,536 | |
Deferred tax liabilities | | | 23 | | | | 20,800 | | | | 1,789 | |
| | | | | | | | | | | | |
Totalnon-current liabilities | | | | | | | 140,293 | | | | 13,931 | |
| | | | | | | | | | | | |
TOTAL LIABILITIES | | | | | | $ | 289,057 | | | $ | 117,262 | |
| | | | | | | | | | | | |
Shareholders’ equity: | | | | | | | | | | | | |
Share capital (ordinary shares $0.16 (10 pence) par value, authorized 60,000,000 shares; issued: 53,312,559 shares and 52,406,304 shares each as at March 31, 2017 and March 31, 2016, respectively) | | | 18 | | | | 8,333 | | | | 8,211 | |
Share premium | | | | | | | 338,284 | | | | 306,874 | |
Retained earnings | | | | | | | 277,988 | | | | 240,225 | |
Other components of equity | | | | | | | (114,854 | ) | | | (116,660 | ) |
| | | | | | | | | | | | |
Total shareholder’s equity, including shares held in treasury | | | | | | | 509,751 | | | | 438,650 | |
| | | | | | | | | | | | |
Less: 3,300,000 shares as at March 31, 2017 and 1,100,000 shares as at March 31, 2016, held in treasury, at cost | | | 18 | | | | (94,685 | ) | | | (30,461 | ) |
| | | | | | | | | | | | |
Total shareholders’ equity | | | | | | | 415,066 | | | | 408,189 | |
| | | | | | | | | | | | |
TOTAL LIABILITIES AND EQUITY | | | | | | $ | 704,123 | | | $ | 525,451 | |
| | | | | | | | | | | | |
See accompanying notes.
F-3
WNS (HOLDINGS) LIMITED
CONSOLIDATED STATEMENTS OF INCOME
(Amounts in thousands, except share and per share data)
| | | | | | | | | | | | | | | | |
| | | | | | Year ended March 31, | |
| | | Notes | | | 2017 | | | 2016 | | | 2015 | |
Revenue | | | | | | $ | 602,546 | | | $ | 562,179 | | | $ | 533,893 | |
Cost of revenue | | | 19 | | | | 403,324 | | | | 365,360 | | | | 342,715 | |
| | | | | | | | | | | | | | | | |
Gross profit | | | | | | | 199,222 | | | | 196,819 | | | | 191,178 | |
Operating expenses: | | | | | | | | | | | | | | | | |
Selling and marketing expenses | | | 19 | | | | 32,631 | | | | 30,844 | | | | 31,073 | |
General and administrative expenses | | | 19 | | | | 91,742 | | | | 78,902 | | | | 70,013 | |
Foreign exchange gain, net | | | | | | | (14,514 | ) | | | (10,969 | ) | | | (4,551 | ) |
Impairment of goodwill | | | 9 | | | | 21,673 | | | | — | | | | — | |
Amortization of intangible assets | | | 10 | | | | 20,539 | | | | 25,198 | | | | 24,192 | |
| | | | | | | | | | | | | | | | |
Operating profit | | | | | | | 47,151 | | | | 72,844 | | | | 70,451 | |
Other income, net | | | 21 | | | | (8,689 | ) | | | (8,494 | ) | | | (11,912 | ) |
Finance expense | | | 20 | | | | 547 | | | | 278 | | | | 1,332 | |
| | | | | | | | | | | | | | | | |
Profit before income taxes | | | | | | | 55,293 | | | | 81,060 | | | | 81,031 | |
Provision for income taxes | | | 23 | | | | 17,530 | | | | 21,180 | | | | 22,417 | |
| | | | | | | | | | | | | | | | |
Profit | | | | | | $ | 37,763 | | | $ | 59,880 | | | $ | 58,614 | |
| | | | | | | | | | | | | | | | |
Earnings per share of ordinary share | | | 24 | | | | | | | | | | | | | |
| | | | | | | | | | | | | | | | |
Basic | | | | | | $ | 0.75 | | | $ | 1.17 | | | $ | 1.14 | |
| | | | | | | | | | | | | | | | |
Diluted | | | | | | $ | 0.71 | | | $ | 1.12 | | | $ | 1.10 | |
| | | | | | | | | | | | | | | | |
See accompanying notes.
F-4
WNS (HOLDINGS) LIMITED
CONSOLIDATED STATEMENTS OF COMPREHENSIVE INCOME
(Amounts in thousands, except share and per share data)
| | | | | | | | | | | | | | | | |
| | | | | | Year ended March 31, | |
| | | Notes | | | 2017 | | | 2016 | | | 2015 | |
Profit | | | | | | $ | 37,763 | | | $ | 59,880 | | | $ | 58,614 | |
Other comprehensive income/(loss), net of taxes | | | | | | | | | | | | | | | | |
Items that will not be reclassified to profit or loss: | | | | | | | | | | | | | | | | |
Pension adjustment | | | | | | | (1,804 | ) | | | (130 | ) | | | (380 | ) |
Items that will be reclassified subsequently to profit or loss: | | | | | | | | | | | | | | | | |
Changes in fair value of cash flow hedges: | | | | | | | | | | | | | | | | |
Current period gain | | | | | | | 43,118 | | | | 446 | | | | 33,176 | |
Reclassification to profit/(loss) | | | | | | | (24,777 | ) | | | (14,222 | ) | | | (7,745 | ) |
Foreign currency translation | | | | | | | (7,810 | ) | | | (20,828 | ) | | | (21,588 | ) |
Income tax (provision)/benefit relating to above | | | 23 | | | | (6,921 | ) | | | 4,259 | | | | (8,242 | ) |
| | | | | | | | | | | | | | | | |
| | | | | | $ | 3,610 | | | $ | (30,345 | ) | | $ | (4,399 | ) |
| | | | | | | | | | | | | | | | |
Total other comprehensive income/(loss), net of taxes | | | | | | $ | 1,806 | | | $ | (30,475 | ) | | $ | (4,779 | ) |
| | | | | | | | | | | | | | | | |
Total comprehensive income | | | | | | $ | 39,569 | | | $ | 29,405 | | | $ | 53,835 | |
| | | | | | | | | | | | | | | | |
See accompanying notes.
F-5
WNS (HOLDINGS) LIMITED
CONSOLIDATED STATEMENTS OF CHANGES IN EQUITY
(Amounts in thousands, except share and per share data)
| | | | | | | | | | | | | | | | | | | | | | | | | | | | | | | | |
| | | | | | | | | | | | | | | Other components of equity | | | | |
| | | Share capital | | | Share
premium | | | Retained
Earnings | | | Foreign
currency
translation
reserve | | | Cash flow
hedging
reserve | | | Pension
adjustments | | | Total
shareholders’
equity | |
| | | Number | | | Par value | | | | | | | |
Balance as at April 1, 2014 | | | 51,347,538 | | | $ | 8,044 | | | $ | 276,601 | | | $ | 121,731 | | | $ | (81,941 | ) | | $ | (1,744 | ) | | $ | 2,279 | | | $ | 324,970 | |
Shares issued for exercised options and RSUs (Refer note 22) | | | 603,124 | | | | 97 | | | | 437 | | | | — | | | | — | | | | — | | | | — | | | | 534 | |
Share-based compensation expense (Refer note 22) | | | — | | | | — | | | | 9,499 | | | | — | | | | — | | | | — | | | | — | | | | 9,499 | |
Excess tax benefits from exercise of share-based options and RSUs (Refer note 23) | | | — | | | | — | | | | 268 | | | | — | | | | — | | | | — | | | | — | | | | 268 | |
| | | | | | | | | | | | | | | | | | | | | | | | | | | | | | | | |
Transactions with owners | | | 603,124 | | | | 97 | | | | 10,204 | | | | — | | | | — | | | | — | | | | — | | | | 10,301 | |
| | | | | | | | | | | | | | | | | | | | | | | | | | | | | | | | |
Profit | | | — | | | | — | | | | — | | | | 58,614 | | | | — | | | | — | | | | — | | | | 58,614 | |
Other comprehensive income/(loss), net of taxes | | | — | | | | — | | | | — | | | | — | | | | (21,588 | ) | | | 17,189 | | | | (380 | ) | | | (4,779 | ) |
| | | | | | | | | | | | | | | | | | | | | | | | | | | | | | | | |
Total comprehensive income for the year | | | — | | | | — | | | | — | | | | 58,614 | | | | (21,588 | ) | | | 17,189 | | | | (380 | ) | | | 53,835 | |
| | | | | | | | | | | | | | | | | | | | | | | | | | | | | | | | |
Balance as at March 31, 2015 | | | 51,950,662 | | | $ | 8,141 | | | $ | 286,805 | | | $ | 180,345 | | | $ | (103,529 | ) | | $ | 15,445 | | | $ | 1,899 | | | $ | 389,106 | |
| | | | | | | | | | | | | | | | | | | | | | | | | | | | | | | | |
See accompanying notes.
F-6
WNS (HOLDINGS) LIMITED
CONSOLIDATED STATEMENTS OF CHANGES IN EQUITY (Cont’d)
(Amounts in thousands, except share and per share data)
| | | | | | | | | | | | | | | | | | | | | | | | | | | | | | | | | | | | | | | | |
| | | | | | | | | | | | | | | Other components of equity | | | | | | | | | | |
| | | | | | | | | Share
premium | | | Retained
earnings | | | Foreign
currency
translation
reserve | | | Cash flow
hedging
reserve | | | Pension
adjustments | | | | | | | | | Total
shareholders’
equity | |
| | | Share capital | | | | | | | | Treasury shares | | |
| | | Number | | | Par value | | | | | | | | Number | | | Amount | | |
Balance as at April 1, 2015 | | | 51,950,662 | | | $ | 8,141 | | | $ | 286,805 | | | $ | 180,345 | | | $ | (103,529 | ) | | $ | 15,445 | | | $ | 1,899 | | | | — | | | $ | — | | | $ | 389,106 | |
Shares issued for exercised options and RSUs (Refer note 22) | | | 455,642 | | | | 70 | | | | 1,233 | | | | — | | | | — | | | | — | | | | — | | | | — | | | | — | | | | 1,303 | |
Purchase of treasury shares (Refer note 18) | | | — | | | | — | | | | — | | | | — | | | | — | | | | — | | | | — | | | | 1,100,000 | | | | (30,461 | ) | | | (30,461 | ) |
Share-based compensation expense (Refer note 22) | | | — | | | | — | | | | 17,919 | | | | — | | | | — | | | | — | | | | — | | | | — | | | | — | | | | 17,919 | |
Excess tax benefits relating to share-based options and RSUs (Refer note 23) | | | — | | | | — | | | | 917 | | | | — | | | | — | | | | — | | | | — | | | | — | | | | — | | | | 917 | |
| | | | | | | | | | | | | | | | | | | | | | | | | | | | | | | | | | | | | | | | |
Transactions with owners | | | 455,642 | | | | 70 | | | | 20,069 | | | | — | | | | — | | | | — | | | | — | | | | 1,100,000 | | | | (30,461 | ) | | | (10,322 | ) |
| | | | | | | | | | | | | | | | | | | | | | | | | | | | | | | | | | | | | | | | |
Profit | | | — | | | | — | | | | — | | | | 59,880 | | | | — | | | | — | | | | — | | | | — | | | | — | | | | 59,880 | |
Other comprehensive income/(loss), net of taxes | | | — | | | | — | | | | — | | | | — | | | | (20,828 | ) | | | (9,517 | ) | | | (130 | ) | | | — | | | | — | | | | (30,475 | ) |
| | | | | | | | | | | | | | | | | | | | | | | | | | | | | | | | | | | | | | | | |
Total comprehensive income/(loss) for the year | | | — | | | | — | | | | — | | | | 59,880 | | | | (20,828 | ) | | | (9,517 | ) | | | (130 | ) | | | — | | | | — | | | | 29,405 | |
| | | | | | | | | | | | | | | | | | | | | | | | | | | | | | | | | | | | | | | | |
Balance as at March 31, 2016 | | | 52,406,304 | | | | 8,211 | | | $ | 306,874 | | | $ | 240,225 | | | $ | (124,357 | ) | | | 5,928 | | | $ | 1,769 | | | | 1,100,000 | | | | (30,461 | ) | | $ | 408,189 | |
| | | | | | | | | | | | | | | | | | | | | | | | | | | | | | | | | | | | | | | | |
See accompanying notes.
| | | | | | | | | | | | | | | | | | | | | | | | | | | | | | | | | | | | | | | | |
| | | | | | | | | | | | | | | Other components of equity | | | | | | | | | | |
| | | | | | | | | | | | | | | Foreign currency | | | Cash flow | | | | | | | | | | | | Total | |
| | | Share capital | | | Share | | | Retained | | | translation | | | hedging | | | Pension | | | Treasury shares | | | shareholders’ | |
| | | Number | | | Par value | | | premium | | | earnings | | | reserve | | | reserve | | | adjustments | | | Number | | | Amount | | | equity | |
Balance as at April 1, 2016 | | | 52,406,304 | | | | 8,211 | | | $ | 306,874 | | | $ | 240,225 | | | $ | (124,357 | ) | | | 5,928 | | | $ | 1,769 | | | | 1,100,000 | | | | (30,461 | ) | | $ | 408,189 | |
Shares issued for exercised options and RSUs (Refer note 22) | | | 906,255 | | | | 122 | | | | 8,819 | | | | — | | | | — | | | | — | | | | — | | | | — | | | | — | | | | 8,941 | |
Purchase of treasury shares (Refer note 18) | | | — | | | | — | | | | — | | | | — | | | | — | | | | — | | | | — | | | | 2,200,000 | | | | (64,224 | ) | | | (64,224 | ) |
Share-based compensation expense (Refer note 22) | | | — | | | | — | | | | 23,036 | | | | — | | | | — | | | | — | | | | — | | | | — | | | | — | | | | 23,036 | |
Excess tax benefits relating to share-based options and RSUs (Refer note 23) | | | — | | | | — | | | | (445 | ) | | | — | | | | — | | | | — | | | | — | | | | — | | | | — | | | | (445 | ) |
| | | | | | | | | | | | | | | | | | | | | | | | | | | | | | | | | | | | | | | | |
Transactions with owners | | | 906,255 | | | | 122 | | | | 31,410 | | | | — | | | | — | | | | — | | | | — | | | | 2,200,000 | | | | (64,224 | ) | | | (32,692 | ) |
| | | | | | | | | | | | | | | | | | | | | | | | | | | | | | | | | | | | | | | | |
Profit | | | — | | | | — | | | | — | | | | 37,763 | | | | — | | | | — | | | | — | | | | — | | | | — | | | | 37,763 | |
Other comprehensive income/(loss), net of taxes | | | — | | | | — | | | | — | | | | — | | | | (7,810 | ) | | | 11,420 | | | | (1,804 | ) | | | — | | | | — | | | | 1,806 | |
| | | | | | | | | | | | | | | | | | | | | | | | | | | | | | | | | | | | | | | | |
Total comprehensive income/(loss) for the year | | | — | | | | — | | | | — | | | | 37,763 | | | | (7,810 | ) | | | 11,420 | | | | (1,804 | ) | | | — | | | | — | | | | 39,569 | |
| | | | | | | | | | | | | | | | | | | | | | | | | | | | | | | | | | | | | | | | |
Balance as at March 31, 2017 | | | 53,312,559 | | | | 8,333 | | | $ | 338,284 | | | $ | 277,988 | | | $ | (132,167 | ) | | | 17,348 | | | $ | (35 | ) | | | 3,300,000 | | | | (94,685 | ) | | $ | 415,066 | |
| | | | | | | | | | | | | | | | | | | | | | | | | | | | | | | | | | | | | | | | |
See accompanying notes.
F-7
WNS (HOLDINGS) LIMITED
CONSOLIDATED STATEMENTS OF CASH FLOWS
(Amounts in thousands)
| | | | | | | | | | | | | | | | |
| | | | | | Year ended March 31, | |
| | | Notes | | | 2017 | | | 2016 | | | 2015 | |
Cash flows from operating activities: | | | | | | | | | | | | | | | | |
Profit | | | | | | $ | 37,763 | | | $ | 59,880 | | | $ | 58,614 | |
Adjustments to reconcile profit to net cash generated from operating activities: | | | | | | | | | | | | | | | | |
Depreciation and amortization | | | | | | | 37,442 | | | | 40,633 | | | | 38,579 | |
Impairment of goodwill | | | 9 | | | | 21,673 | | | | — | | | | — | |
Share-based compensation expense | | | | | | | 23,036 | | | | 17,919 | | | | 9,499 | |
Amortization of debt issue cost | | | | | | | 52 | | | | 13 | | | | 81 | |
Allowance for doubtful accounts | | | | | | | (1,040 | ) | | | (774 | ) | | | 731 | |
Unrealized exchange loss/(gain), net | | | | | | | (11,123 | ) | | | 3,997 | | | | (1,665 | ) |
Current tax expense | | | | | | | 25,785 | | | | 19,615 | | | | 16,914 | |
Interest expense | | | | | | | 495 | | | | 265 | | | | 1,251 | |
Interest income | | | | | | | (2,083 | ) | | | (1,197 | ) | | | (389 | ) |
Dividend income | | | | | | | (4,131 | ) | | | (5,039 | ) | | | (4,396 | ) |
Unrealized gain on investments | | | | | | | (6 | ) | | | (41 | ) | | | (4,553 | ) |
Income from funds held in escrow | | | | | | | (280 | ) | | | — | | | | — | |
Loss/ (gain) on sale of property and equipment | | | | | | | 143 | | | | (100 | ) | | | (587 | ) |
Deferred income taxes | | | | | | | (8,255 | ) | | | 1,565 | | | | 5,503 | |
Deferred rent | | | | | | | 1,136 | | | | 631 | | | | 349 | |
Excess tax benefit from share-based compensation expense | | | | | | | (270 | ) | | | (229 | ) | | | (99 | ) |
Unrealized gain on derivative instruments | | | | | | | (1,930 | ) | | | (1,219 | ) | | | (3,148 | ) |
Others, net | | | | | | | 23 | | | | 98 | | | | 55 | |
Changes in operating assets and liabilities: | | | | | | | | | | | | | | | | |
Trade receivables and unbilled revenue | | | | | | | (1,630 | ) | | | (5,725 | ) | | | (7,874 | ) |
Other assets | | | | | | | (2,137 | ) | | | (9,162 | ) | | | 1,144 | |
Trade payables | | | | | | | (4,203 | ) | | | (2,290 | ) | | | (3,671 | ) |
Deferred revenue | | | | | | | 2,303 | | | | (1,050 | ) | | | (2,577 | ) |
Other liabilities | | | | | | | 6,914 | | | | 6,532 | | | | 11,336 | |
| | | | | | | | | | | | | | | | |
Cash generated from operating activities before interest and income taxes: | | | | | | | 119,677 | | | | 124,322 | | | | 115,097 | |
Income taxes paid | | | | | | | (29,462 | ) | | | (22,472 | ) | | | (18,685 | ) |
Interest paid | | | | | | | (84 | ) | | | (215 | ) | | | (1,328 | ) |
Interest received | | | | | | | 2,004 | | | | 1,232 | | | | 454 | |
| | | | | | | | | | | | | | | | |
Net cash provided by operating activities | | | | | | | 92,135 | | | | 102,867 | | | | 95,538 | |
| | | | | | | | | | | | | | | | |
Cash flows from investing activities: | | | | | | | | | | | | | | | | |
Acquisition of HealthHelp, net of cash acquired | | | 4(a) | | | | (56,674 | ) | | | — | | | | — | |
Repayment of long-term debt of HealthHelp | | | 4(a) | | | | (29,249 | ) | | | — | | | | — | |
Acquisition of Denali, net of cash acquired | | | 4(b) | | | | (31,886 | ) | | | — | | | | — | |
Acquisition of Value Edge, net of cash acquired | | | 4(c) | | | | (12,720 | ) | | | — | | | | — | |
Restricted cash, held in escrow | | | 4(c) | | | | (5,112 | ) | | | — | | | | — | |
Proceeds from restricted cash, held in escrow | | | | | | | 280 | | | | — | | | | — | |
Acquisition of iSoftStone assets and the related workforce | | | | | | | — | | | | — | | | | (328 | ) |
Purchase of property and equipment and intangible assets | | | | | | | (22,867 | ) | | | (27,455 | ) | | | (22,968 | ) |
Payment for Telkom business combination, net of cash acquired | | | 4(d) | | | | — | | | | (2,572 | ) | | | — | |
Investment in mutual funds | | | | | | | (462 | ) | | | — | | | | — | |
Marketable securities (purchased)/sold, net | | | | | | | 32,413 | | | | (29,616 | ) | | | (78,429 | ) |
Proceeds from sale of property and equipment | | | | | | | 443 | | | | 329 | | | | 606 | |
Investment in fixed deposits | | | | | | | (24,672 | ) | | | (14,791 | ) | | | (9,644 | ) |
Proceeds from maturity of fixed deposits | | | | | | | 15,112 | | | | 8,828 | | | | — | |
Dividends received | | | | | | | 4,127 | | | | 5,040 | | | | 4,392 | |
Proceeds from sale of fixed maturity plans (“FMPs”) | | | | | | | — | | | | 30,115 | | | | 66,126 | |
| | | | | | | | | | | | | | | | |
Net cash used in investing activities | | | | | | | (131,267 | ) | | | (30,122 | ) | | | (40,245 | ) |
| | | | | | | | | | | | | | | | |
Cash flows from financing activities: | | | | | | | | | | | | | | | | |
Buyback of shares | | | | | | | (64,224 | ) | | | (30,461 | ) | | | — | |
Proceeds from exercise of stock options | | | | | | | 8,941 | | | | 1,303 | | | | 534 | |
Proceeds from long term debt | | | 12 | | | | 118,000 | | | | — | | | | — | |
Payment of debt issuance cost | | | | | | | (953 | ) | | | — | | | | — | |
Repayment of long term debt | | | | | | | — | | | | (13,163 | ) | | | (12,007 | ) |
Proceeds from / (repayments of) short term borrowings, net | | | | | | | (475 | ) | | | (13,058 | ) | | | (43,521 | ) |
Excess tax benefit from share-based compensation expense | | | | | | | 270 | | | | 229 | | | | 99 | |
| | | | | | | | | | | | | | | | |
Net cash provided by/(used in) financing activities | | | | | | | 61,559 | | | | (55,150 | ) | | | (54,895 | ) |
| | | | | | | | | | | | | | | | |
Exchange difference on cash and cash equivalents | | | | | | | 5,522 | | | | (8,189 | ) | | | (1,641 | ) |
Net change in cash and cash equivalents | | | | | | | 27,949 | | | | 9,406 | | | | (1,243 | ) |
Cash and cash equivalents at the beginning of the year | | | | | | | 41,854 | | | | 32,448 | | | | 33,691 | |
| | | | | | | | | | | | | | | | |
Cash and cash equivalents at the end of the year | | | | | | $ | 69,803 | | | $ | 41,854 | | | $ | 32,448 | |
| | | | | | | | | | | | | | | | |
Non-cash transactions: | | | | | | | | | | | | | | | | |
Investing activities | | | | | | | | | | | | | | | | |
(i) Liability towards property and equipment and intangible assets purchased on credit | | | | | | $ | 4,292 | | | $ | 4,528 | | | $ | 2,431 | |
(ii) Contingent consideration payable towards acquisitions | | | 17 | | | | 19,678 | | | | — | | | | — | |
(iii) Liability towards deferred consideration. | | | 4(b) | | | | 522 | | | | — | | | | — | |
Financing activities | | | | | | | | | | | | | | | | |
(i) Short term line of credit of Denali Sourcing Services Inc. | | | 4(b) | | | | 475 | | | | — | | | | — | |
See accompanying notes.
F-8
WNS (HOLDINGS) LIMITED
NOTES TO CONSOLIDATED FINANCIAL STATEMENTS
(Amounts in thousands, except share and per share data)
1. Company overview
WNS (Holdings) Limited (“WNS Holdings”), along with its subsidiaries (collectively, “the Company”), is a global business process management (“BPM”) company with client service offices in Australia, Dubai (United Arab Emirates), London (UK), New Jersey (US), Switzerland, Germany and Singapore and delivery centers in the People’s Republic of China (“China”), Costa Rica, India, the Philippines, Poland, Romania, Republic of South Africa (“South Africa”), Sri Lanka, Turkey, the United Kingdom (“UK”) and the United States (“US”). The Company’s clients are primarily in the insurance; travel and leisure; diversified businesses including manufacturing, retail, consumer packaged goods (“CPG”), media and entertainment and telecommunications; utilities; consulting and professional services; banking and financial services; healthcare; and shipping and logistics industries. During the year ended March 31, 2017, the company completed certain acquisitions (refer note 4).
In the Auto Claims BPM segment (as defined in Note 26), effective July 1, 2015, WNS Legal Assistance LLP, a subsidiary of WNS Assistance Limited received an approval from Solicitors Regulatory Authority, UK to provide legal services in relation to personal injury claims.
WNS Holdings is incorporated in Jersey, Channel Islands and maintains a registered office in Jersey at 22, Grenville Street, St Helier, Jersey JE4 8PX.
These consolidated financial statements were approved by the Board of Directors and authorized for issue on June 29, 2017.
2. Summary of significant accounting policies
These consolidated financial statements have been prepared in compliance with International Financial Reporting Standards (“IFRS”) as issued by the International Accounting Standard Board.
These consolidated financial statements correspond to the classification provisions contained in IAS 1(revised), “Presentation of Financial Statements.”
Accounting policies have been applied consistently to all periods presented in these consolidated financial statements.
These consolidated financial statements have been prepared on a historical cost convention and on an accrual basis, except for the following material items that have been measured at fair value as required by relevant IFRS:-
| a. | Derivative financial instruments; |
| b. | Share-based payment transactions; |
| c. | Marketable securities and investments in mutual funds; |
| d. | Investments in fixed maturity plans (FMPs); and |
| e. | Contingent consideration. |
| c. | Use of estimates and judgments |
The preparation of financial statements in conformity with IFRS requires management to make judgments, estimates and assumptions that affect the application of accounting policies and the reported amount of assets, liabilities, income and expenses. Actual results may differ from those estimates.
Estimates and underlying assumptions are reviewed on an ongoing basis. Revisions to accounting estimates are recognized in the period in which the estimates are revised and in any future period affected. In particular, information about significant areas of estimation, uncertainty and critical judgments in applying accounting policies that have the most significant effect on the amount recognized in the consolidated financial statements is included in the following notes:
F-9
WNS (HOLDINGS) LIMITED
NOTES TO CONSOLIDATED FINANCIAL STATEMENTS
(Amounts in thousands, except share and per share data)
For certain agreements, the Company has retroactive discounts related to meeting agreed volumes. In such situations, the Company records revenue at the discounted rate, although the Company initially bills at the higher rate, unless the Company can determine that the agreed volumes will not be met, based on historic experience.
The Company provides automobile claims handling services, wherein the Company enters into contracts with its clients to process all their claims over the contract period and the fees are determined either on a per claim basis or as a fixed payment for the contract period. Where the contracts are on a per claim basis, the Company invoices the client at the inception of the claim process. The Company estimates the processing period for the claims and recognizes revenue over the estimated processing period. This processing period generally ranges between one to two months. The processing time may be greater for new clients and the estimated service period is adjusted accordingly. The processing period is estimated based on historical experience and other relevant factors, if any.
| | ii. | Allowance for doubtful accounts |
The allowance for doubtful accounts is evaluated on a regular basis and adjusted based upon management’s best estimate of probable losses inherent in accounts receivable. In estimating probable losses, the Company reviews accounts that are past due,non-performing or in bankruptcy. The Company determines an estimated loss for specific accounts and estimates an additional amount for the remainder of receivables based on historical trends and other factors. Adverse economic conditions or other factors that might cause deterioration of the financial health of customers could change the timing and levels of payments received and necessitate a change in estimated losses.
The major tax jurisdictions for the Company are India, UK and US, though the Company also files tax returns in other foreign jurisdictions. Significant judgments are involved in determining the provision for income taxes including judgment on whether tax positions are probable of being sustained in tax assessments. A tax assessment can involve complex issues, which can only be resolved over extended time periods. The recognition of taxes that are subject to certain legal or economic limits or uncertainties is assessed individually by management based on the specific facts and circumstances.
The assessment of the probability of future taxable profit in which deferred tax assets can be utilized is based on the Company’s latest approved budget forecast, which is adjusted for significantnon-taxable profit and expenses and specific limits to the use of any unused tax loss or credit. The tax rules in the numerous jurisdictions in which the Company operates are also carefully taken into consideration. If a positive forecast of taxable profit indicates the probable use of a deferred tax asset, especially when it can be utilized without a time limit, that deferred tax asset is usually recognized in full. The recognition of deferred tax assets that are subject to certain legal or economic limits or uncertainties is assessed individually by management based on the specific facts and circumstances.
An impairment loss is recognized for the amount by which an asset’s or cash-generating unit’s carrying amount exceeds its recoverable amount. To determine the recoverable amount, management estimates expected future cash flows from each asset or cash-generating unit and determines a suitable interest rate in order to calculate the present value of those cash flows. In the process of measuring expected future cash flows management makes assumptions about future operating results. These assumptions relate to future events and circumstances. The actual results may vary, and may cause significant adjustments to the Company’s assets within the next financial year. The calculation of impairment loss involves significant estimates and assumptions which includes revenue and earnings multiples, growth rates and net margins used to calculate projected future cash flows, risk-adjusted discount rate, future economic and market conditions.
F-10
WNS (HOLDINGS) LIMITED
NOTES TO CONSOLIDATED FINANCIAL STATEMENTS
(Amounts in thousands, except share and per share data)
In most cases, determining the applicable discount rate involves estimating the appropriate adjustment to market risk and the appropriate adjustment to asset-specific risk factors.
| | vi. | Valuation of derivative financial instruments |
Management uses valuation techniques in measuring the fair value of derivative financial instruments, where active market quotes are not available. In applying the valuation techniques, management makes maximum use of market inputs, and uses estimates and assumptions that are, as far as possible, consistent with observable data that market participants would use in pricing the instrument. Where applicable data is not observable, management uses its best estimate about the assumptions that market participants would make. These estimates may vary from the actual prices that would be achieved in an arm’s length transaction at the reporting date.
| | vii. | Accounting for defined benefit plans |
In accounting for pension and post-retirement benefits, several statistical and other factors that attempt to anticipate future events are used to calculate plan expenses and liabilities. These factors include expected return on plan assets, discount rate assumptions and rate of future compensation increases. To estimate these factors, actuarial consultants also use estimates such as withdrawal, turnover, and mortality rates which require significant judgment. The actuarial assumptions used by the Company may differ materially from actual results in future periods due to changing market and economic conditions, regulatory events, judicial rulings, higher or lower withdrawal rates, or longer or shorter participant life spans.
| | viii. | Share-based compensation expense |
The share-based compensation expense is determined based on the Company’s estimate of equity instruments that will eventually vest.
Business combinations are accounted for using the acquisition method under the provisions of IFRS 3 (Revised), “Business Combinations”.
The cost of an acquisition is measured at the fair value of the assets transferred, equity instruments issued and liabilities incurred at the date of acquisition. The cost of the acquisition also includes the fair value of any contingent consideration. Identifiable tangible and intangible assets acquired and liabilities and contingent liabilities assumed in a business combination are measured initially at their fair value on the date of acquisition. Significant estimates are required to be made in determining the value of contingent consideration and intangible assets.
The Company consolidates entities over which it has control. Control exists when the Company has existing rights that give the Company the current ability to direct the activities which affect the entity’s returns; the Company is exposed to or has rights to returns which may vary depending on the entity’s performance; and the Company has the ability to use its power to affect its own returns from its involvement with the entity. Subsidiaries are consolidated from the date control commences until the date control ceases.
Business combinations are accounted for using the acquisition method under the provisions of IFRS 3 (Revised), “Business Combinations”.
The cost of an acquisition is measured at the fair value of the assets transferred, equity instruments issued and liabilities incurred at the date of acquisition. The consideration of the acquisition also includes the fair value of any contingent consideration. Identifiable tangible and intangible assets acquired and liabilities and contingent liabilities assumed in a business combination are measured initially at their fair value on the date of acquisition. Significant estimates are required to be made in determining the value of contingent consideration and intangible assets.
Transaction costs that the Company incurs in connection with a business combination such as finders’ fees, legal fees, due diligence fees, and other professional and consulting fees are expensed as incurred.
F-11
WNS (HOLDINGS) LIMITED
NOTES TO CONSOLIDATED FINANCIAL STATEMENTS
(Amounts in thousands, except share and per share data)
| | ii. | Transactions eliminated on consolidation |
All significant intra-company balances, transactions, income and expenses including unrealized income or expenses are eliminated on consolidation.
| e. | Functional and presentation currency |
The financial statements of each of the Company’s subsidiaries are presented using the currency of the primary economic environment in which these entities operate (i.e. the functional currency). The consolidated financial statements are presented in US dollars (USD) which is the presentation currency of the Company and has been rounded off to the nearest thousands.
| f. | Foreign currency transactions and translation |
| | i. | Transactions in foreign currency |
Transactions in foreign currency are translated into the functional currency using the exchange rates prevailing at the dates of the transactions. Foreign exchange gains and losses resulting from the settlement of such transactions and from the translation at the exchange rates prevailing at the reporting date of monetary assets and liabilities denominated in foreign currencies are recognized in the consolidated statement of income. Gains/losses relating to translation or settlement of trading activities are disclosed under foreign exchange gains/losses and translation or settlements of financing activities are disclosed under finance expenses. In the case of foreign exchange gains/losses on borrowings that are considered as a natural economic hedge for the foreign currency monetary assets, such foreign exchange gains/losses, net are presented within results from operating activities.
For the purpose of presenting consolidated financial statements, the assets and liabilities of the Company’s foreign operations that have local functional currency are translated into US dollars using exchange rates prevailing at the reporting date. Income and expense are translated at the monthly average exchange rate for the respective period. Exchange differences arising, if any, are recorded in equity as part of the Company’s other comprehensive income. Such exchange differences are recognized in the consolidated statement of income in the period in which such foreign operations are disposed. Goodwill and fair value adjustments arising on the acquisition of foreign operation are treated as assets and liabilities of the foreign operation and translated at the exchange rate prevailing at the reporting date.
Foreign currency differences arising from intercompany receivables or payables relating to foreign operations, the settlement of which is neither planned nor likely to occur in the foreseeable future, are considered to form part of net investment in foreign operation and are recognized in foreign currency translation reserve.
| g. | Financial instruments — initial recognition and subsequent measurement |
Financial instruments are classified in the following categories:
| | • | | Non-derivative financial assets comprising loans and receivables, at fair value through profit or loss (“FVTPL”) oravailable-for-sale. |
| | • | | Non-derivative financial liabilities comprising long term and short term borrowings and trade and other payables under the amortized cost category. |
| | • | | Derivative financial instruments under the category of financial assets or financial liabilities at FVTPL. |
The classification of financial instruments depends on the purpose for which those were acquired. Management determines the classification of the Company’s financial instruments at initial recognition.
| | i. | Non-derivative financial assets |
Loans and receivables arenon-derivative financial assets with fixed or determinable payments that are not quoted in an active market. They are presented as current assets, except for those maturing later than 12 months after the balance sheet date which are presented asnon-current assets. Loans and receivables are measured initially at fair value plus transaction costs and subsequently carried at amortized cost using the effective interest rate method, less any impairment loss or provisions for doubtful accounts. Loans and receivables are represented by trade receivables, net of allowances for impairment, unbilled revenue, cash and cash equivalents, funds held for clients, investment in fixed deposits and other assets.
F-12
WNS (HOLDINGS) LIMITED
NOTES TO CONSOLIDATED FINANCIAL STATEMENTS
(Amounts in thousands, except share and per share data)
| | b) | Financial assets designated as FVTPL |
Financial assets at FVTPL include financial assets that are either classified as held for trading if acquired principally for the purpose of selling in the short term or that meet certain conditions and are designated at FVTPL upon initial recognition. Financial assets are initially measured at fair value. Transaction costs directly attributable to the acquisition of financial assets at fair value through profit or loss are recognized immediately in profit or loss. Assets in this category are measured at fair value with changes therein recognized in profit or loss. The fair values of financial assets in this category are determined by reference to active market transactions or using a valuation technique where no active market exists. Assets in this category are classified as current assets if expected to be settled within 12 months, otherwise they are classified asnon-current.
| | c) | Available-for-sale financial assets |
Available-for-sale financial assets arenon-derivative financial assets that are either designated in this category or are not classified in any of the other categories.Available-for-sale financial assets are recognized initially at fair value plus transactions costs. Subsequent to initial recognition, these are measured at fair value and changes therein, other than impairment losses, are recognized directly in other comprehensive income. When an investment is derecognized, the cumulative gain or loss in other comprehensive income is transferred to the consolidated statement of income. These are presented as current assets unless management intends to dispose of the assets after 12 months from the reporting date.
| | ii. | Non-derivative financial liabilities |
All financial liabilities are recognized initially at fair value, except in the case of loans and borrowings which are recognized at fair value net of directly attributable transaction costs. The Company’s financial liabilities include trade and other payables, bank overdrafts, loans and borrowings.
Trade and other payables maturing later than 12 months after the reporting date are presented asnon-current liabilities.
After initial recognition, interest bearing loans and borrowings are subsequently measured at amortized cost using the effective interest rate method. Gains and losses are recognized in the consolidated statement of income when the liabilities are derecognized as well as through the effective interest rate method amortization process.
| | iii. | Derivative financial instruments and hedge accounting |
The Company is exposed to foreign currency fluctuations on foreign currency assets, liabilities, net investment in foreign operations and forecasted cash flows denominated in foreign currency. The Company limits the effect of foreign exchange rate fluctuation by following established risk management policies including the use of derivatives. The Company enters into derivative financial instruments where the counter party is a bank. The Company holds derivative financial instruments such as foreign exchange forward, option contracts and interest rate swaps to hedge certain foreign currency and interest rate exposures.
Cash flow hedges
The Company recognizes derivative instruments as either assets or liabilities in the statement of financial position at fair value. Derivative instruments qualify for hedge accounting when the instrument is designated as a hedge; the hedged item is specifically identifiable and exposes the Company to risk; and it is expected that a change in fair value of the derivative instrument and an opposite change in the fair value of the hedged item will have a high degree of correlation.
For derivative instruments where hedge accounting is applied, the Company records the effective portion of derivative instruments that are designated as cash flow hedges in other comprehensive income (loss) in the statement of comprehensive income, which is reclassified into earnings in the same period during which the hedged item affects earnings. The remaining gain or loss on the derivative instrument in excess of the cumulative change in the present value of future cash flows of the hedged item, if any (i.e., the ineffective portion) or hedge components excluded from the assessment of effectiveness, and changes in fair value of other derivative instruments not designated as qualifying hedges is recorded as gains/losses, net in the consolidated statement of income. Gains/losses on cash flow hedges on intercompany forecasted revenue transactions are recorded in foreign exchange gains/losses and cash flow hedge on interest rate swaps are recorded in finance expense. Cash flows from the derivative instruments are classified within cash flows from operating activities in the statement of cash flows.
F-13
WNS (HOLDINGS) LIMITED
NOTES TO CONSOLIDATED FINANCIAL STATEMENTS
(Amounts in thousands, except share and per share data)
| | iv. | Offsetting of financial instruments |
Financial assets and financial liabilities are offset against each other and the net amount reported in the consolidated statement of financial position if, and only if, there is a currently enforceable legal right to offset the recognized amounts and there is an intention to settle on a net basis, or to realize the assets and settle the liabilities simultaneously.
| | v. | Fair value of financial instruments |
The fair value of financial instruments that are traded in active markets at each reporting date is determined by reference to quoted market prices or dealer price quotations, without any deduction for transaction costs. For financial instruments not traded in an active market, the fair value is determined using appropriate valuation models. Where applicable, these models project future cash flows and discount the future amounts to a present value using market-based observable inputs including interest rate curves, credit risk, foreign exchange rates, and forward and spot prices for currencies.
| | vi. | Impairment of financial assets |
The Company assesses at each reporting date whether there is objective evidence that a financial asset or a group of financial assets is impaired. A financial asset is considered impaired if objective evidence indicates that one or more events have had a negative effect on the estimated future cash flows of that asset. Individually significant financial assets are tested for impairment on an individual basis. The remaining financial assets are assessed collectively in groups that share similar credit risk characteristics.
Impairment loss in respect of loans and receivables measured at amortized cost are calculated as the difference between their carrying amount, and the present value of the estimated future cash flows discounted at the original effective interest rate. Such impairment loss is recognized in the consolidated statement of income.
| | b) | Available-for-sale financial assets |
Significant or prolonged decline in the fair value of the security below its cost and the disappearance of an active trading market for the security are objective evidence that the security is impaired. An impairment loss in respect of anavailable-for-sale financial asset is calculated by reference to its fair value. The cumulative loss that was recognized in equity is transferred to the consolidated statement of income upon impairment.
| h. | Equity and share capital |
| | i. | Share capital and share premium |
The Company has only one class of equity shares. Par value of the equity share is recorded as the share capital and the amount received in excess of par value is classified as share premium. The credit corresponding to the share-based compensation expense and excess tax benefit related to the exercise of share options is recorded in share premium.
Retained earnings comprise the Company’s undistributed earnings after taxes.
| | iii. | Other components of equity |
Other components of equity consist of the following:
Cash flow hedging reserve
Changes in fair value of derivative hedging instruments designated and effective as a cash flow hedge are recognized net of taxes.
F-14
WNS (HOLDINGS) LIMITED
NOTES TO CONSOLIDATED FINANCIAL STATEMENTS
(Amounts in thousands, except share and per share data)
Foreign currency translation reserve
Foreign currency translation consists of (i) the exchange difference arising from the translation of the financial statements of foreign subsidiaries and (ii) foreign currency differences arising from intercompany receivables or payables relating to foreign operations, the settlement of which is neither planned nor likely to occur in the foreseeable future, are considered to form part of net investment in foreign operation and are recognized in foreign currency translation reserve.
Pension adjustments
This reserve represents cumulative actuarial gain and losses recognized, net of taxes on defined benefits plans.
| i. | Cash and cash equivalents |
The Company considers all highly liquid investments with an initial maturity of up to three months to be cash equivalents. Cash equivalents are readily convertible into known amounts of cash and subject to an insignificant risk of changes in value.
| | i. | Marketable securities and mutual funds |
The Company’s marketable securities represent liquid investments and are acquired principally for the purpose of earning daily dividend income. All additions and redemptions of such investments are recognized on the trade date. Investments are initially measured at cost, which is the fair value of the consideration paid, including transaction costs. Marketable securities classified under theAvailable-for-sale category of financial instruments are recorded at fair value, with changes in fair value, if any recognized in the other comprehensive income. Dividend income earned on these investments is recorded in the consolidated statement of income.
Investments in mutual funds represent investments in mutual fund schemes wherein the mutual fund issuer has invested these funds in enterprise development funds. These investments are carried at fair value, with changes in fair value recognized in other comprehensive income. The fair value represents the original cost of the investment and the investment’s fair value at each reporting period. Investments in mutual funds have been designated as available for sale.
| | ii. | Investments in fixed maturity plans |
The Company’s investments in fixed maturity plans (“FMPs”) represent investments in mutual fund schemes wherein the mutual fund issuer has invested these funds in certificate of deposits with banks in India. The investments in FMPs are designated as fair value through profit or loss and change in fair value is recognized in the consolidated statement of income. The fair value represents original cost of an investment and the investment’s fair value at each reporting period or net asset value (“NAV”) as quoted.
The Company manages FMPs on a fair value basis in accordance with the entity’s documented risk management, investment strategy and information provided to the key managerial personnel. The returns on the investment are measured based on the fair value movement rather than looking at the overall returns on the maturity. The Company’s investment purchase and sale decisions are also based on the fair value fluctuations rather than a predetermined policy to hold the investment till maturity. Key management personnel believe that recording these investments through the consolidated statement of income would provide more relevant information to measure the performance of the investment.
| | iii. | Investments in fixed deposits |
Investments in fixed deposits consist of term deposits with original maturities of more than three months with banks. These are designated as Loans and Receivables.
Some of the Company’s agreements in the auto claims handling services allow the Company to temporarily hold funds on behalf of the client. The funds are segregated from the Company’s funds and there is usually a short period of time between when the Company receives these funds from the client and when the payments are made on their behalf.
F-15
WNS (HOLDINGS) LIMITED
NOTES TO CONSOLIDATED FINANCIAL STATEMENTS
(Amounts in thousands, except share and per share data)
Property and equipment are stated at historical cost. Cost includes expenditures directly attributable to the acquisition of the asset. Depreciation and amortization is computed using the straight-line method over the estimated useful lives of the assets, which are as follows:
| | | | |
Asset description | | Asset life (in years) | |
Buildings | | | 20 | |
Computers and software | | | 3-4 | |
Furniture, fixtures and office equipment | | | 2-5 | |
Vehicles | | | 3 | |
Leasehold improvements | | | Lesser of estimated useful life or lease term | |
F-16
WNS (HOLDINGS) LIMITED
NOTES TO CONSOLIDATED FINANCIAL STATEMENTS
(Amounts in thousands, except share and per share data)
Assets acquired under finance leases are capitalized as assets by the Company at an amount equal to the fair value of the leased asset or, if lower, the present value of the minimum lease payments, each determined at the inception of the lease. Assets under finance leases and leasehold improvements are depreciated over the shorter of the lease term or the estimated useful life of the assets.
Advances paid towards the acquisition of property and equipment and the cost of property and equipment not ready for use before the reporting date are disclosed as capitalwork-in-progress in note 11.
The Company assesses property and equipment for impairment whenever events or changes in circumstances indicate that the carrying amount of an asset or group of assets may not be recoverable. If any such indication exists, the Company estimates the recoverable amount of the asset. The recoverable amount of an asset or cash generating unit is the higher of its fair value less cost of disposal (“FVLCOD”) and itsvalue-in-use (“VIU”). If the recoverable amount of the asset or the recoverable amount of the cash generating unit to which the asset belongs is less than its carrying amount, the carrying amount is reduced to its recoverable amount. The reduction is treated as an impairment loss and is recognized in the consolidated statement of income. If at the reporting date there is an indication that a previously assessed impairment loss no longer exists, the recoverable amount is reassessed and the impairment losses previously recognized are reversed such that the asset is recognized at its recoverable amount but not exceeding written down value which would have been reported if the impairment losses had not been recognized initially.
Goodwill represents the excess of the cost of an acquisition over the fair value of the Company’s share of the net identifiable assets of the acquired subsidiary at the date of acquisition. Goodwill is allocated to the cash-generating units expected to benefit from the synergies of the combination for the purpose of impairment testing. Goodwill is tested, at the cash-generating unit (or group of cash generating units) level, for impairment annually or if events or changes in circumstances indicate that the carrying amount may not be recoverable. Goodwill is carried at cost less accumulated impairment losses. Impairment loss on goodwill is not reversed. See further discussion on impairment testing under “Impairment of intangible assets and goodwill” below.
Intangible assets are recognized only when it is probable that the expected future economic benefits attributable to the assets will accrue to the Company and the cost can be reliably measured. Intangible assets acquired in a business combination are recorded at fair value using generally accepted valuation methods appropriate for the type of intangible asset. Intangible assets with definite lives are amortized over the estimated useful lives and are reviewed for impairment, if indicators of impairment arise. Intangible assets with indefinite lives are not amortized but instead are tested for impairment at least annually and written down to the fair value. See further discussion on impairment testing under “Impairment of intangible assets and goodwill” below.
The Company’s definite lived intangible assets are amortized over the estimated useful life of the assets:
| | | | |
Asset description | | Weighted average
amortization period
(in months) | |
Customer contracts | | | 48 | |
Customer relationships | | | 217 | |
Covenantnot-to-compete | | | 48 | |
Trade names | | | 34 | |
Technology | | | 93 | |
Software | | | 57 | |
F-17
WNS (HOLDINGS) LIMITED
NOTES TO CONSOLIDATED FINANCIAL STATEMENTS
(Amounts in thousands, except share and per share data)
| o. | Impairment of intangible assets and goodwill |
Goodwill is not subject to amortization and tested at least annually for impairment or whenever events or changes in circumstances indicate that the carrying amount may not be recoverable. Intangible assets that are subject to amortization are reviewed for impairment whenever events or changes in circumstances indicate that the carrying amount may not be recoverable. An impairment loss is recognized for the amount by which the asset’s carrying amount exceeds its recoverable amount. The recoverable amount is the higher of an asset’s FVLCOD and VIU. For the purposes of assessing impairment, assets are grouped at the cash generating unit level which is the lowest level for which there are separately identifiable cash flows. Impairment losses recognized in respect of cash generating units are allocated first to reduce the carrying amount of any goodwill allocated to the cash generating units (or group of cash generating units) and then, to reduce the carrying amount of the other assets in the cash generating unit (or group of cash generating units) on a pro rata basis based on the carrying amount of each asset in the cash generating unit. Intangible assets that suffered impairment are reviewed for possible reversal of the impairment at each reporting date.
| i. | Defined contribution plans |
US Savings Plan
Eligible employees of the Company in the US participate in a savings plan (“the Plan”) under Section 401(k) of the United States Internal Revenue Code (“the Code”). The Plan allows for employees to defer a portion of their annual earnings on apre-tax basis through voluntary contributions to the Plan. The Plan provides that the Company can make optional contributions up to the maximum allowable limit under the Code.
UK Pension Scheme
Eligible employees in the UK contribute to a defined contribution pension scheme operated in the UK. The assets of the scheme are held separately in an independently administered fund. The pension expense represents contributions payable to the fund maintained by the Company.
Provident Fund
Eligible employees of the Company in India, the Philippines, South Africa, Sri Lanka and the UK participate in a defined contribution fund in accordance with the regulatory requirements in the respective jurisdictions. Both the employee and the Company contribute an equal amount to the fund which is equal to a specified percentage of the employee’s salary.
The Company has no further obligation under defined contribution plans beyond the contributions made under these plans. Contributions are charged to profit or loss and are included in the consolidated statement of income in the year in which they accrue.
Employees in India, the Philippines and Sri Lanka are entitled to a defined benefit retirement plan covering eligible employees of the Company. The plan provides for alump-sum payment to eligible employees, at retirement, death, and incapacitation or on termination of employment, of an amount based on the respective employees’ salary and tenure of employment (subject to a maximum of approximately $15 per employee in India). In India contributions are made to funds administered and managed by the Life Insurance Corporation of India (“LIC”) and Aviva Life Insurance Company Private Limited (“ALICPL”) (together, the “Fund Administrators”) to fund the gratuity liability of an Indian subsidiary. Under this scheme, the obligation to pay gratuity remains with the Company, although the Fund Administrators administer the scheme. The Company’s Sri Lanka subsidiary, Philippines subsidiary and one Indian subsidiary have unfunded gratuity obligations.
Gratuity liabilities are determined by actuarial valuation, performed by an independent actuary, at each reporting date using the projected unit credit method. The Company recognizes the net obligation of a defined benefit plan in its balance sheet as an asset or liability, as the case may be, in accordance with IAS 19, “Employee Benefits.” The discount rate is based on the government securities yield. Actuarial gains and losses arising from experience adjustments and changes in actuarial assumptions are recorded in other comprehensive income in the statement of comprehensive income in the period in which they arise.
F-18
WNS (HOLDINGS) LIMITED
NOTES TO CONSOLIDATED FINANCIAL STATEMENTS
(Amounts in thousands, except share and per share data)
The Company’s liability for compensated absences, which are expected to be utilized or settled within one year, is determined on an accrual basis for the carried forward unused vacation balances standing to the credit of each employee as atyear-end and is charged to income in the year in which they accrue.
The Company’s liability for compensated absences, which are expected to be utilized after one year is determined on the basis of an actuarial valuation using the projected unit credit method and is charged to consolidated statement of income in the year in which they accrue.
The Company accounts for share-based compensation expense relating to share-based payments using a fair value method in accordance with IFRS 2 “Share-based Payments.” Grants issued by the Company vest in a graded manner. Under the fair value method, the estimated fair value of awards is charged to income over the requisite service period, which is generally the vesting period of the award, for each separately vesting portion of the award as if the award was, in substance, multiple awards. The Company includes a forfeiture estimate in the amount of compensation expense being recognized based on the Company’s estimate of equity instruments that will eventually vest.
| r. | Provisions and accrued expenses |
A provision is recognized in the statement of financial position when the Company has a present legal or constructive obligation as a result of a past event, and it is probable that an outflow of economic benefits will be required to settle the obligation. If the effect is material, provisions are recognized at present value by discounting the expected future cash flows at apre-tax rate that reflects current market assessments of the time value of money.
Provisions for onerous contracts are recognized when the expected benefits to be derived by the Company from a contract are lower than the unavoidable costs of meeting the future obligations under the contract. The provision is measured at the present value of the lower of the expected cost of terminating the contract and the expected net cost of continuing with the contract. Before a provision is established, the Company recognizes any impairment loss on the assets associated with that contract.
The Company derives revenue from BPM services comprising of back office administration, data management, customer interaction services management and auto claims handling services.
Revenue is recognized to the extent it is probable that the economic benefit will flow to the Company, the amount of revenue can be measured reliably, collection is probable, and the cost incurred or to be incurred can be measured reliably. Revenue from rendering services is recognized on an accrual basis when services are performed and revenue from the end of last billing to the reporting date is recognized as unbilled revenue. Revenue is net of value-added taxes and includes reimbursements ofout-of-pocket expenses.
Revenue earned by back office administration, data management and customer interaction services management services
Back office administration, data management and customer interaction services contracts are based on the following pricing models:
| | a) | per full-time-equivalent arrangements, which typically involve billings based on the number of full-time employees (or equivalent) deployed on the execution of the business process outsourced; |
| | b) | per transaction arrangements, which typically involve billings based on the number of transactions processed (such as the number ofe-mail responses, or airline coupons or insurance claims processed); |
| | c) | fixed-price arrangements, which typically involve billings based on achievements ofpre-defined deliverables or milestones; |
| | d) | outcome-based arrangements, which typically involve billings based on the business result achieved by our clients through our service efforts (such as measured based on a reduction in days sales outstanding, improvement in working capital, increase in collections or a reduction in operating expenses); or |
| | e) | other pricing arrangements, including cost-plus arrangements, which typically involve billing the contractually agreed direct and indirect costs and a fee based on the number of employees deployed under the arrangement. |
F-19
WNS (HOLDINGS) LIMITED
NOTES TO CONSOLIDATED FINANCIAL STATEMENTS
(Amounts in thousands, except share and per share data)
Revenues from the Company’s services are recognized primarily on atime-and-material, cost-plus or unit-priced basis. Revenues undertime-and-material contracts are recognized as the services are performed. Revenues are recognized on cost-plus contracts on the basis of contractually agreed direct and indirect costs incurred on a client contract plus an agreed upon profitmark-up. Revenues are recognized on unit-price based contracts based on the number of specified units of work delivered to a client. Such revenues are recognized as the related services are provided in accordance with the client contract.
Amounts billed or payments received, where revenue recognition criteria have not been met, are recorded as deferred revenue and are recognized as revenue when all the recognition criteria have been met. However, the costs related to the performance of BPM services unrelated to transition services (see discussion below) are recognized in the period in which the services are rendered. An upfront payment received towards future services is recognized ratably over the period when such services are provided.
The Company has certain minimum commitment arrangements that provide for a minimum revenue commitment on an annual basis. Any revenue shortfall as compared to minimum commitment is invoiced and recognized at the reporting period end.
For certain BPM customers, the Company performs transition activities at the outset of entering into a new contract. The Company has determined these transition activities do not meet the criteria using the guidance in IAS 18 “Revenue” (“IAS 18”), to be accounted for as a separate unit of accounting with stand-alone value separate from the ongoing BPM contract. Accordingly, transition revenue and costs are subsequently recognized ratably over the period in which the BPM services are performed. Further, the deferral of costs is limited to the amount of the deferred revenue. Any costs in excess of the deferred transition revenue are recognized in the period incurred.
Revenue earned by auto claims handling services
Auto claims handling services include claims handling and administration (“Claims Handling”), car hire and arranging for repairs with repair centers across the UK and the related payment processing for such repairs (“Accident Management”).With respect to Claims Handling, the Company receives either aper-claim fee or a fixed fee. Revenue for per claim fee is recognized over the estimated processing period of the claim, which currently ranges from one to two months and revenue for fixed fee is recognized on a straight line basis over the period of the contract. In certain cases, the fee is contingent upon the successful recovery of a claim on behalf of the customer. In these circumstances, the revenue is deferred until the contingency is resolved. Revenue in respect of car hire is recognized over the car hire term.
In order to provide Accident Management services, the Company arranges for the repair through a network of repair centers. The repair costs are invoiced to customers. In determining whether the receipt from the customers related to payments to repair centers should be recognized as revenue, the Company considers the criteria established by IAS 18, Illustrative example (“IE”) 21 — “Determining whether an entity is acting as a principal or as an agent.” When the Company determines that it is the principal in providing Accident Management services, amounts received from customers are recognized and presented as third party revenue and the payments to repair centers are recognized as cost of revenue in the consolidated statement of income. Factors considered in determining whether the Company is the principal in the transaction include whether:
| | a) | the Company has the primary responsibility for providing the services, |
| | b) | the Company negotiates labor rates with repair centers, |
| | c) | the Company is responsible for timely and satisfactory completion of repairs, and |
| | d) | the Company bears the risk that the customer may not pay for the services provided (credit risk). |
If there are circumstances where the above criteria are not met and therefore the Company is not the principal in providing Accident Management services, amounts received from customers are recognized and presented net of payments to repair centers in the consolidated statement of income. Revenue from Accident Management services is recorded net of the repairer referral fees passed on to customers.
Revenue from legal services in the Auto claims BPM segment is recognized on the admission of liability by the third party to the extent of fixed fees earned at each stage and any further income on the successful settlement of the claim.
Incremental and direct costs incurred to contract with a claimant are amortized over the estimated period of provision of services, not exceeding 15 months. All other costs to the Company are expensed as incurred.
F-20
WNS (HOLDINGS) LIMITED
NOTES TO CONSOLIDATED FINANCIAL STATEMENTS
(Amounts in thousands, except share and per share data)
The Company leases most of its delivery centers and office facilities under operating lease agreements that are renewable on a periodic basis at the option of the lessor and the lessee. The lease agreements contain rent free periods and rent escalation clauses. Rental expenses for operating leases with step rents are recognized on a straight-line basis over the lease term. When a lease agreement undergoes a substantial modification of the existing terms, it would be accounted as a new lease agreement with the resultant deferred rent liability credited to the consolidated statement of income.
Leases under which the Company assumes substantially all the risks and rewards of ownership are classified as finance leases. When acquired, such assets are capitalized at fair value or present value of the minimum lease payments at the inception of the lease, whichever is lower.
Income tax comprises current and deferred tax. Income tax expense is recognized in consolidated statement of income except to the extent it relates to items directly recognized in equity, in which case it is recognized in equity.
Current income tax for the current and prior periods are measured at the amount expected to be recovered from or paid to the taxation authorities based on the taxable profit for the period. The tax rates and tax laws used to compute the amount are those that are enacted by the reporting date and applicable for the period. The Company offsets current tax assets and current tax liabilities, where it has a legally enforceable right to set off the recognized amounts and where it intends either to settle on a net basis, or to realize the asset and liability simultaneously.
Significant judgments are involved in determining the provision for income taxes including judgment on whether tax positions are probable of being sustained in tax assessments. A tax assessment can involve complex issues, which can only be resolved over extended time periods. The recognition of taxes that are subject to certain legal or economic limits or uncertainties is assessed individually by management based on the specific facts and circumstances. Though the Company has considered all these issues in estimating its income taxes, there could be an unfavorable resolution of such issues that may affect results of the Company’s operations.
Deferred income tax is recognized using the balance sheet approach. Deferred income tax assets and liabilities are recognized for all deductible and taxable temporary differences arising between the tax bases of assets and liabilities and their carrying amount in financial statements, except when the deferred income tax arises from the initial recognition of goodwill or an asset or liability in a transaction that is not a business combination and affects neither accounting nor taxable profits or loss at the time of transaction.
Deferred income tax assets and liabilities are measured at the tax rates that are expected to apply in the period when the asset is realized or the liability is settled, based on tax rates (and tax laws) that have been enacted or substantively enacted at the reporting date.
Deferred income tax asset in respect of carry forward of unused tax credits and unused tax losses are recognized to the extent that it is probable that taxable profit will be available against which the deductible temporary differences, and the carry forward of unused tax credits and unused tax losses can be utilized.
The carrying amount of deferred income tax assets is reviewed at each reporting date and reduced to the extent that it is no longer probable that sufficient taxable profit will be available to allow all or part of the deferred income tax asset to be utilized.
The Company recognizes deferred tax liabilities for all taxable temporary differences except those associated with the investments in subsidiaries where the timing of the reversal of the temporary difference can be controlled and it is probable that the temporary difference will not reverse in the foreseeable future.
F-21
WNS (HOLDINGS) LIMITED
NOTES TO CONSOLIDATED FINANCIAL STATEMENTS
(Amounts in thousands, except share and per share data)
Finance expense comprises interest cost on borrowings, transaction costs and the gains/losses on settlement of related derivative instruments. The foreign exchange gains/losses on borrowings are considered as a natural economic hedge for the foreign currency monetary assets which are classified as foreign exchange gains/losses, net within results from operating activities. Borrowing costs are recognized in the consolidated statement of income using the effective interest method.
Basic earnings per share are computed using the weighted-average number of ordinary shares outstanding during the period. Diluted earnings per share is computed by considering the impact of the potential issuance of ordinary shares, using the treasury stock method, on the weighted average number of shares outstanding during the period, except where the results would be anti-dilutive.
The Company recognizes government grants only when there is reasonable assurance that the conditions attached to them shall be complied with, and the grants will be received. Government grants related to depreciable assets are treated as deferred income and are recognized in the consolidated statement of income on a systematic and rational basis over the useful life of the asset. Government grants related to revenue are recognized on a systematic basis in the consolidated statement of income over the periods necessary to match them with the related costs that they are intended to compensate.
3. New accounting pronouncements not yet adopted by the Company
Certain new standards, interpretations and amendments to existing standards have been published that are mandatory for the Company’s accounting periods beginning on or after April 1, 2017 or later periods. Those which are considered to be relevant to the Company’s operations are set out below.
| i. | In May 2014, the IASB issued IFRS 15 “Revenue from Contracts with Customers” (IFRS 15). This standard provides a single, principle-based five-step model to be applied to all contracts with customers. Guidance is provided on topics such as the point at which revenue is recognized, accounting for variable consideration, costs of fulfilling and obtaining a contract and various other related matters. IFRS 15 also introduced new disclosure requirements with respect to revenue. |
The five steps in the model under IFRS 15 are: (i) identify the contract with the customer; (ii) identify the performance obligations in the contract; (iii) determine the transaction price; (iv) allocate the transaction price to the performance obligations in the contracts; and (v) recognize revenue when (or as) the entity satisfies a performance obligation.
IFRS 15 replaces the following standards and interpretations:
| | • | | IAS 11 “Construction Contracts” |
| | • | | IFRIC 13 “Customer Loyalty Programmes” |
| | • | | IFRIC 15 “Agreements for the Construction of Real Estate” |
| | • | | IFRIC 18 “Transfers of Assets from Customers” |
| | • | | SIC-31 “Revenue - Barter Transactions Involving Advertising Services” |
When first applying IFRS 15, it should be applied in full for the current period, including retrospective application to all contracts that were not yet complete at the beginning of that period. In respect of prior periods, the transition guidance allows an option to either:
| | • | | apply IFRS 15 in full to prior periods (with certain limited practical expedients being available); or |
| | • | | retain prior period figures as reported under the previous standards, recognizing the cumulative effect of applying IFRS 15 as an adjustment to the opening balance of equity as at the date of initial application (beginning of current reporting period). |
F-22
WNS (HOLDINGS) LIMITED
NOTES TO CONSOLIDATED FINANCIAL STATEMENTS
(Amounts in thousands, except share and per share data)
In April 2016, the IASB issued amendments to IFRS 15, clarifying some requirements and providing additional transitional relief for companies. The amendments do not change the underlying principles of IFRS 15 but clarify how those principles should be applied. The amendments clarify how to:
| | • | | identify a performance obligation (the promise to transfer a good or a service to a customer) in a contract; |
| | • | | determine whether a company is a principal (the provider of a good or service) or an agent (responsible for arranging for the good or service to be provided); and |
| | • | | determine whether the revenue from granting a license should be recognized at a point in time or over time. |
In addition to the clarifications, the amendments include two additional reliefs to reduce cost and complexity for a company when it first applies IFRS 15. The amendments have the same effective date as IFRS 15.
IFRS 15 is effective for fiscal years beginning on or after January 1, 2018. Earlier application is permitted. The Company expects to apply this standard retrospectively with the cumulative effect of initially applying this standard recognized at April 1, 2018 (i.e. the date of initial application in accordance with this standard). Further, the Company is currently evaluating the impact that this new standard will have on its consolidated financial statements.
| ii. | In July 2014, the IASB finalized and issued IFRS 9 – “Financial Instruments” (IFRS 9). IFRS 9 replaces IAS 39 “Financial instruments: recognition and measurement,” the previous Standard which dealt with the recognition and measurement of financial instruments in its entirety upon former’s effective date. |
Key requirements of IFRS 9:
Replaces IAS 39’s measurement categories with the following three categories:
| | • | | fair value through profit or loss (“FVTPL”) |
| | • | | fair value through other comprehensive income (“FVTOCI”) |
Eliminates the requirement for separation of embedded derivatives from hybrid financial assets, the classification requirements to be applied to the hybrid financial asset in its entirety.
Requires an entity to present the amount of change in fair value due to change in entity’s own credit risk in other comprehensive income.
Introduces new impairment model, under which the “expected” credit loss are required to be recognized as compared to the existing “incurred” credit loss model of IAS 39.
Fundamental changes in hedge accounting by introduction of new general hedge accounting model which:
| | • | | Increases the eligibility of hedged item and hedging instruments; |
| | • | | Introduces a more principles–based approach to assess hedge effectiveness. |
IFRS 9 is effective for annual periods beginning on or after January 1, 2018.
Earlier application is permitted provided that all the requirements in the Standard are applied at the same time with two exceptions:
| (1) | The requirement to present changes in the fair value of a liability due to changes in own credit risk may be applied early in isolation; |
| (2) | Entity may choose as its accounting policy choice to continue to apply hedge accounting requirements of IAS 39 instead of new general hedge accounting model as provided in IFRS 9. |
The Company is currently evaluating the impact of this new standard on its consolidated financial statements.
F-23
WNS (HOLDINGS) LIMITED
NOTES TO CONSOLIDATED FINANCIAL STATEMENTS
(Amounts in thousands, except share and per share data)
| iii. | In January 2016, the IASB has issued IFRS 16 “Leases” (“IFRS 16”). Key changes in IFRS 16 include: |
| | • | | eliminates the requirement to classify a lease as either operating or finance lease in the books of lessee. |
| | • | | introduces a single lessee accounting model, which requires lessee to recognize assets and liabilities for all leases, initially measured at the present value of unavoidable future lease payment. Entity may elect not to apply this accounting requirement to short term leases and leases for which underlying asset is of low value. |
| | • | | replaces the straight-line operating lease expense model with a depreciation charge for the lease asset (included within operating costs) and an interest expense on the lease liability (included within finance costs). |
| | • | | requires lessee to classify cash payments for principal and interest portion of lease arrangement within financing activities and financing/operating activities respectively in the cash flow statements. |
| | • | | requires entities to determine whether a contract conveys the right to control the use of an identified asset for a period of time to assess whether that contract is, or contains, a lease. |
IFRS 16 replaces IAS 17, Leases and related interpretations viz. IFRIC 4, “Determining whether an Arrangement contains a Lease;”SIC-15, “Operating Leases—Incentives;” andSIC-27, “Evaluating the Substance of Transactions Involving the Legal Form of a Lease.”
IFRS 16 substantially carries forward lessor accounting requirements in IAS 17, “Leases.” Disclosures, however, have been enhanced.
IFRS 16 is effective for annual reporting periods beginning on or after 1 January 2019. Early application is permitted for entities that apply IFRS 15, “Revenue from Contracts with Customers” at or before the date of initial application of IFRS 16.
A lessee shall apply IFRS 16 either retrospectively to each prior reporting period presented or record a cumulative effect of initial application of IFRS 16 as an adjustment to opening balance of equity at the date of initial application.
The Company is currently evaluating the impact of this new standard on its consolidated financial statements.
| iv. | In January 2016, the IASB issued amendments to IAS 12 – “Income taxes” to clarify the following: |
| | • | | the carrying value of an asset does not limit the estimation of probable future taxable profits. |
| | • | | estimates for future taxable profits exclude tax deductions resulting from the reversal of deductible temporary differences. |
| | • | | an entity assesses a deferred tax asset in combination with other deferred tax assets. Where tax law restricts the utilization of tax losses, an entity would assess a deferred tax asset in combination with other deferred tax assets of the same type. |
The amendments are effective for annual periods beginning on or after January 1, 2017. Earlier application is permitted.
The Company expects the adoption of these amendments will have no impact on its consolidated financial statements.
| v. | In January 2016, the IASB issued amendments in IAS7- “Statement of Cash Flows” to clarify and improve information provided to users of financial statements about an entity’s financing activities. |
The IASB requires that the following changes in liabilities arising from financing activities to be disclosed (to the extent necessary):
| | • | | changes from financing cash flows; |
| | • | | changes arising from obtaining and losing control of subsidiaries or other businesses; |
| | • | | the effect of changes of foreign exchange rates; |
| | • | | changes in fair value; and |
The amendments are effective for annual periods beginning on or after January 1, 2017. Earlier application is permitted. Entities need not present comparative information when they first apply the amendments.
F-24
WNS (HOLDINGS) LIMITED
NOTES TO CONSOLIDATED FINANCIAL STATEMENTS
(Amounts in thousands, except share and per share data)
The Company is currently evaluating the effect of this amendment on its consolidated financial statements.
| vi. | In June 2016, the IASB issued amendments in IFRS 2 – “Share-based Payment” to clarify the following: |
| | • | | the accounting for cash-settled share-based payment transactions that include a performance condition should follow the same approach as for equity-settled share-based payment; |
| | • | | the classification of share-based payment transactions with net settlement features for withholding tax obligations should be classified as equity-settled in its entirety, provided the share-based payment would have been classified as equity-settled had it not included the net settlement feature; and |
| | • | | modifications of a share-based payment that changes the transaction from cash-settled to equity-settled to be accounted for as follows: |
| | i. | the original liability is derecognized; |
| | ii. | the equity-settled share-based payment is recognized at the modification date fair value of the equity instrument granted to the extent that services have been rendered up to the modification date; and |
| | iii. | any difference between the carrying amount of the liability at the modification date and the amount recognized in equity should be recognized in the statement of income immediately. |
The above amendments are effective for annual periods beginning on or after January 1, 2018. Earlier application is permitted. The amendments are to be applied prospectively. However, if an entity applies the amendments retrospectively, it must do so for all of the amendments described above.
| The | Company is currently evaluating the impact of these amendments on its consolidated financial statements. |
| vii. | In December 2016, the IFRS Interpretations Committee (‘IFRIC’) issued amendments to IFRIC 22 – “Foreign Currency Transactions and Advance Consideration” to clarify the exchange rate to use for translation when payments are made or received in advance of the related asset, expense or income (or part of it) in foreign currency. |
The exchange rate in this case will be the rate prevalent on the date on which an entity initially recognizes thenon-monetary asset ornon-monetary liability arising from the payment or receipt of advance consideration. If there are multiple payments or receipts in advance, the entity shall determine a date of the transaction for each payment or receipt of advance consideration.
IFRIC 22 is effective for annual reporting periods beginning on or after January 1, 2018. Earlier application is permitted.
On initial application, entities have the choice to apply the Interpretation either retrospectively or, alternatively, prospectively to all assets, expenses and income in the scope of the Interpretation initially recognized on or after:
| | • | | the beginning of the reporting period in which the entity first applies the Interpretation; or |
| | • | | the beginning of a prior reporting period presented as comparative information in the financial statements of the reporting period in which the entity first applies the Interpretation. |
The Company is currently evaluating the impact of these amendments on its consolidated financial statements.
| viii. | In June 2017, the IFRIC issued IFRIC 23 – “Uncertainty over Income Tax Treatments” to clarify the accounting for uncertainties in income taxes, by specifically addressing the following: |
| | • | | the determination of whether to consider each uncertain tax treatment separately or together with one or more uncertain tax treatments; |
| | • | | the assumptions an entity makes about the examination of tax treatments by taxations authorities; |
| | • | | the determination of taxable profit (tax loss), tax bases, unused tax losses, unused tax credits and tax rates where there is an uncertainty regarding the treatment of an item; and |
| | • | | the reassessment of judgements and estimates if facts and circumstances change. |
IFRIC 23 is effective for annual reporting periods beginning on or after 1 January 2019. Earlier application is permitted.
On initial application, the requirements are to be applied by recognizing the cumulative effect of initially applying them in retained earnings, or in other appropriate components of equity, at the start of the reporting period in which an entity first applies them, without adjusting comparative information. Full retrospective application is permitted, if an entity can do so without using hindsight.
The Company is currently evaluating the impact of this pronouncement on its consolidated financial statements.
F-25
WNS (HOLDINGS) LIMITED
NOTES TO CONSOLIDATED FINANCIAL STATEMENTS
(Amounts in thousands, except share and per share data)
4. Business Combinations
a) HealthHelp
On March 15, 2017 (“Acquisition date”), the Company acquired all ownership interests of MTS HealthHelp Inc. and its subsidiaries (“HealthHelp”), which provides benefits management across several specialty healthcare areas, including radiology, cardiology, oncology, sleep care, orthopedics, and pain management, for a total consideration of $68,337, subject to adjustments for cash and working capital, including a contingent consideration of $8,545, payable over a period of two years linked to revenue targets and continuation of an identified client contract. The fair value of the contingent consideration liability was estimated using level 3 inputs which included an assumption for discount rate of 2.5%. The potential undiscounted amount of all future payments that the Company could be required to make under the contingent consideration arrangement is between $0 and $8,876.
The Company has funded the acquisition primarily with a five year secured term loan. The Company is expected to leverage HealthHelp’s capability in care management to address the needs of payor, provider and insurance organizations.
The Company has incurred acquisition related costs of $1,809, which have been included in “General and administrative expenses” in the consolidated statement of income.
The purchase price has been allocated on a provisional basis, as set out below, to the assets acquired and liabilities assumed in the business combination.
| | | | |
| | | Amount | |
Cash | | $ | 3,119 | |
Trade receivables | | | 4,910 | |
Unbilled revenue | | | 1,854 | |
Prepayments and other current assets | | | 1,070 | |
Property and equipment | | | 4,612 | |
Intangible assets | | | | |
- Software | | | 1,274 | |
- Customer contracts | | | 4,537 | |
- Customer relationships | | | 49,584 | |
- Service mark | | | 400 | |
- Covenantnot-to-compete | | | 4,693 | |
- Technology | | | 4,852 | |
Non-current assets | | | 96 | |
Term loan | | | (29,249 | ) |
Current liabilities | | | (2,688 | ) |
Non-current liabilities | | | (1,423 | ) |
Deferred tax liability | | | (18,146 | ) |
| | | | |
Net assets acquired | | $ | 29,495 | |
Less: Purchase consideration | | | 68,337 | |
| | | | |
Goodwill on acquisition | | $ | 38,842 | |
| | | | |
The trade receivables comprise gross contractual amounts due of $4,910 and the Company, based on its best estimate at the acquisition date, expects to collect the entire amount. The unbilled revenue comprises gross contractual amounts of $1,854 and the Company, based on its best estimate at the acquisition date, expects to invoice the entire amount and collect it. Goodwill of $14,643 arising from this acquisition is expected to be deductible for tax purposes.
Goodwill is attributable mainly to expected synergies and assembled workforce arising from the acquisition.
The purchase consideration has been allocated on a provisional basis based on management’s estimates. The Company is in the process of making a final determination of the fair value of assets and liabilities. Finalization of the purchase price allocation may result in certain adjustments to the above allocation and revision of amounts recorded as of March 31, 2017 to reflect the final valuation of assets acquired or liabilities assumed.
F-26
WNS (HOLDINGS) LIMITED
NOTES TO CONSOLIDATED FINANCIAL STATEMENTS
(Amounts in thousands, except share and per share data)
Impact of acquisition on the results of the Company:
The acquisition of HealthHelp contributed $2,417 to the Company’s revenue and a loss of $286 to the Company’s profit for the year ended March 31, 2017.
b) Denali Sourcing Services Inc.
On January 20, 2017 (“Acquisition Date”), the Company acquired all outstanding shares of Denali Sourcing Services Inc. (“Denali”), a provider of strategic procurement BPM solutions for a purchase consideration of $39,635 (including the contingent consideration of $6,277, dependent on the achievement of revenue targets over a period of three years and deferred consideration of $522 payable in first quarter of fiscal 2018), subject to adjustments for cash and working capital. The fair value of the contingent consideration liability was estimated using level 3 inputs which included an assumption for discount rate of 2.5%. The potential undiscounted amount of all future payments that the Company could be required to make under the contingent consideration arrangement is between $0 and $6,578. The payment was funded through a three year secured term loan.
Denali delivers global sourcing and procurement services to high-tech, retail and CPG, banking and financial services, utilities, and healthcare verticals. The acquisition of Denali is expected to add a strategic procurement capability to the Company’s existing Finance and Accounting services and will enable the Company to offer procurement solutions to its clients.
The Company has incurred acquisition related costs of $502, which have been included in “General and administrative expenses” in the consolidated statement of income.
The purchase price has been allocated on a provisional basis, as set out below, to the assets acquired and liabilities assumed in the business combination.
| | | | |
| | | Amount | |
Cash | | $ | 1,204 | |
Trade receivables | | | 2,891 | |
Unbilled revenue | | | 1,258 | |
Prepayments and other current assets | | | 95 | |
Property and equipment | | | 53 | |
Deferred tax asset | | | 18 | |
Intangible assets | | | | |
- Software | | | 3 | |
- Customer contracts | | | 3,025 | |
- Customer relationships | | | 8,000 | |
- Trade name | | | 545 | |
- Covenantnot-to-compete | | | 1,718 | |
Non-current assets | | | 27 | |
Current liabilities | | | (3,238 | ) |
Short-term line of credit | | | (475 | ) |
Non-current liabilities | | | (343 | ) |
Deferred tax liability | | | (5,020 | ) |
| | | | |
Net assets acquired | | $ | 9,761 | |
Less: Purchase consideration | | | 39,635 | |
| | | | |
Goodwill on acquisition | | $ | 29,874 | |
| | | | |
F-27
WNS (HOLDINGS) LIMITED
NOTES TO CONSOLIDATED FINANCIAL STATEMENTS
(Amounts in thousands, except share and per share data)
The trade receivables comprise gross contractual amounts due of $2,891 and the Company, based on its best estimate at the acquisition date, expects to collect the entire amount. The unbilled revenue comprises gross contractual amounts of $1,258 and the Company, based on its best estimate at the acquisition date, expects to invoice the entire amount and collect it. Goodwill arising from this acquisition is not expected to be deductible for tax purposes.
Goodwill is attributable mainly to expected synergies and assembled workforce arising from the acquisition.
The purchase consideration has been allocated on a provisional basis based on management’s estimates. The Company is in the process of making a final determination of the fair value of assets and liabilities. Finalization of the purchase price allocation may result in certain adjustments to the above allocation and revision of amounts recorded as of March 31, 2017 to reflect the final valuation of assets acquired or liabilities assumed.
Impact of acquisition on the results of the Company:
The acquisition of Denali contributed $5,195 to the Company’s revenue and a loss of $227 to the Company’s profit for the year ended March 31, 2017.
c) Value Edge
On June 14, 2016 (“Acquisition Date”), the Company acquired all outstanding equity shares of Value Edge Research Services Private Limited (“Value Edge”) which provides business research and analytics reports and databases across the domains of pharmaceutical, biotech and medical devices, for a total consideration of $18,265 including working capital adjustments of $765 and contingent consideration of $5,112 (held in escrow), subject to compliance with certain conditions, payable over a period of three years. The acquisition is expected to deepen the Company’s domain and specialized analytical capabilities in the growing pharma market, and provide the Company with a technology asset, which is leverageable across clients and industries.
The Company has incurred acquisition related costs of $24, which have been included in “General and administrative expenses” in the consolidated statement of income.
The purchase price has been allocated, as set out below, to the assets acquired and liabilities assumed in the business combination.
| | | | |
| | | Amount | |
Cash | | $ | 432 | |
Trade receivables | | | 370 | |
Unbilled revenue | | | 706 | |
Investments | | | 87 | |
Prepayments and other current assets | | | 99 | |
Property and equipment | | | 78 | |
Deferred tax asset | | | 49 | |
Intangible assets | | | | |
- Software | | | 10 | |
- Customer contracts | | | 701 | |
- Customer relationships | | | 1,894 | |
- Trade name | | | 104 | |
- Covenantnot-to-compete | | | 2,655 | |
- Technology | | | 1,238 | |
Non-current assets | | | 74 | |
Current liabilities | | | (1,236 | ) |
Non-current liabilities | | | (126 | ) |
Deferred tax liability | | | (2,281 | ) |
| | | | |
Net assets acquired | | $ | 4,854 | |
Less: Purchase consideration | | | 18,265 | |
| | | | |
Goodwill on acquisition | | $ | 13,411 | |
| | | | |
F-28
WNS (HOLDINGS) LIMITED
NOTES TO CONSOLIDATED FINANCIAL STATEMENTS
(Amounts in thousands, except share and per share data)
The trade receivables comprise gross contractual amounts due of $370 and the Company, based on its best estimate at the acquisition date, expects to collect the entire amount. The unbilled revenue comprises gross contractual amounts of $706 and the Company, based on its best estimate at the acquisition date, expects to invoice the entire amount and collect it. Goodwill arising from this acquisition is not expected to be deductible for tax purposes.
Goodwill is attributable mainly to expected synergies and assembled workforce arising from the acquisition.
Impact of acquisition on the results of the Company:
The acquisition of Value Edge contributed $3,957 to the Company’s revenue and a profit of $237 to the Company’s profit for the year ended March 31, 2017.
Impact of all acquisitions on the results of the Company:
Had the acquisitions occurred on April 1, 2016, the Company’s revenue and profit for the year ended March 31, 2017 would have been $681,635 (unaudited) and $44,661 (unaudited), respectively.
F-29
WNS (HOLDINGS) LIMITED
NOTES TO CONSOLIDATED FINANCIAL STATEMENTS
(Amounts in thousands, except share and per share data)
d) Telkom
On April 10, 2015, the Company entered into an agreement with Telkom SA SOC LIMITED (“Telkom”), a leading provider of communication services in South Africa, pursuant to which the Company agreed to acquire a contract and the related workforce of Telkom effective May 1, 2015 (“Acquisition Date”). The net purchase price of the transaction, which was paid in cash, was ZAR 35,639 ($2,572 based on the exchange rate on September 30, 2015).
The purchase price has been allocated as follows:
| | | | |
| | | Amount | |
Customer contract- intangible assets | | $ | 2,990 | |
Cash | | | 411 | |
Accrued leave liability | | | (411 | ) |
Deferred tax liabilities | | | (837 | ) |
| | | | |
Net assets acquired | | $ | 2,153 | |
Less: Purchase consideration | | | 3,331 | |
| | | | |
Goodwill on acquisition | | $ | 1,178 | |
| | | | |
Goodwill arising from this acquisition is not expected to be deductible for tax purposes. Goodwill is attributable mainly to benefit from expected synergies and the assembled workforce of Telkom.
F-30
WNS (HOLDINGS) LIMITED
NOTES TO CONSOLIDATED FINANCIAL STATEMENTS
(Amounts in thousands, except share and per share data)
5. Cash and cash equivalents
The Company considers all highly liquid investments with an initial maturity of up to three months to be cash equivalents. Cash and cash equivalents consist of the following:
| | | | | | | | |
| | | As at | |
| | | March 31, | | | March 31, | |
| | | 2017 | | | 2016 | |
Cash and bank balances | | $ | 46,110 | | | $ | 25,194 | |
Short term deposits with banks | | | 23,693 | | | | 16,660 | |
| | | | | | | | |
Total | | $ | 69,803 | | | $ | 41,854 | |
| | | | | | | | |
Short term deposits can be withdrawn by the Company at any time without prior notice and are readily convertible into known amounts of cash with an insignificant risk of changes in value.
6. Investments
Investments consist of the following:
| | | | | | | | |
| | | As at | |
| | | March 31, | | | March 31, | |
| | | 2017 | | | 2016 | |
Investments in marketable securities and mutual funds(1) | | $ | 87,652 | | | $ | 118,198 | |
Investments in FMPs | | | 96 | | | | — | |
Investment in fixed deposits | | | 24,673 | | | | 14,791 | |
| | | | | | | | |
Total | | $ | 112,421 | | | $ | 132,989 | |
| | | | | | | | |
Note:
(1) Marketable securities represent short term investments made principally for the purpose of earning dividend income.
| | | | | | | | |
| | | As at | |
| | | March 31,
2017 | | | March 31,
2016 | |
Current investments | | $ | 111,992 | | | $ | 132,989 | |
Non-current investment | | | 429 | | | | — | |
| | | | | | | | |
Total | | $ | 112,421 | | | $ | 132,989 | |
| | | | | | | | |
F-31
WNS (HOLDINGS) LIMITED
NOTES TO CONSOLIDATED FINANCIAL STATEMENTS
(Amounts in thousands, except share and per share data)
7. Trade receivables, net
Trade receivables consist of the following:
| | | | | | | | |
| | | As at | |
| | | March 31, | | | March 31, | |
| | | 2017 | | | 2016 | |
Trade receivables | | $ | 62,136 | | | $ | 59,357 | |
Less: Allowances for doubtful accounts receivable | | | (1,713 | ) | | | (4,446 | ) |
| | | | | | | | |
Total | | $ | 60,423 | | | $ | 54,911 | |
| | | | | | | | |
The movement in the allowances for doubtful accounts receivable is as follows:
| | | | | | | | | | | | |
| | | Year ended March 31, | |
| | | 2017 | | | 2016 | | | 2015 | |
Balance at the beginning of the year | | $ | 4,446 | | | $ | 5,336 | | | $ | 4,999 | |
Charged to operations | | | 777 | | | | 1,010 | | | | 2,534 | |
Write-offs, net of collections | | | (2,571 | ) | | | (936 | ) | | | (621 | ) |
Reversals | | | (664 | ) | | | (904 | ) | | | (1,182 | ) |
Translation adjustment | | | (275 | ) | | | (60 | ) | | | (394 | ) |
| | | | | | | | | | | | |
Balance at the end of the year | | $ | 1,713 | | | $ | 4,446 | | | $ | 5,336 | |
| | | | | | | | | | | | |
F-32
WNS (HOLDINGS) LIMITED
NOTES TO CONSOLIDATED FINANCIAL STATEMENTS
(Amounts in thousands, except share and per share data)
8. Prepayments and other assets
Prepayment and other assets consist of the following:
| | | | | | | | |
| | | As at | |
| | | March 31,
2017 | | | March 31,
2016 | |
Current: | | | | | | | | |
Service tax and other tax receivables | | $ | 8,029 | | | $ | 5,871 | |
Deferred transition cost | | | 423 | | | | 191 | |
Employee receivables | | | 1,215 | | | | 1,319 | |
Advances to suppliers | | | 2,087 | | | | 2,015 | |
Prepaid expenses | | | 8,819 | | | | 6,278 | |
Restricted cash, held in escrow (Refer note 4(c)) | | | 1,611 | | | | — | |
Other assets | | | 5,201 | | | | 6,927 | |
| | | | | | | | |
Total | | $ | 27,385 | | | $ | 22,601 | |
| | | | | | | | |
Non-current: | | | | | | | | |
Deposits | | $ | 7,569 | | | $ | 6,348 | |
Income tax assets | | | 10,202 | | | | 6,697 | |
Service tax and other tax receivables | | | 6,236 | | | | 5,419 | |
Deferred transition cost | | | 365 | | | | 223 | |
Restricted cash, held in escrow (Refer note 4(c)) | | | 3,222 | | | | — | |
Others assets | | | 4,350 | | | | 3,161 | |
| | | | | | | | |
Total | | $ | 31,944 | | | $ | 21,848 | |
| | | | | | | | |
9. Goodwill
| | | | | | | | |
| | | As at | |
| | | March 31, | | | March 31, | |
| | | 2017 | | | 2016 | |
Gross carrying amount | | $ | 155,681 | | | $ | 76,242 | |
Accumulated impairment of goodwill | | | (21,673 | ) | | | — | |
| | | | | | | | |
Total | | $ | 134,008 | | | $ | 76,242 | |
| | | | | | | | |
The movement in goodwill balance by reportable segment as at March 31, 2017 and 2016 is as follows:
Gross carrying amount
| | | | | | | | | | | | |
| | | WNS | | | WNS Auto | | | | |
| | | Global BPM | | | Claims BPM | | | Total | |
Balance as at April 1, 2015 | | $ | 48,519 | | | $ | 30,539 | | | $ | 79,058 | |
Goodwill arising from business combination of Telkom contract and the related workforce (Refer Note 4(d)) | | | 1,178 | | | | — | | | | 1,178 | |
Foreign currency translation | | | (3,194 | ) | | | (800 | ) | | | (3,994 | ) |
| | | | | | | | | | | | |
Balance as at March 31, 2016 | | $ | 46,503 | | | $ | 29,739 | | | $ | 76,242 | |
| | | | | | | | | | | | |
Goodwill arising on acquisitions (Refer Note 4(a), 4(b) & 4(c)) | | | 82,127 | | | | — | | | | 82,127 | |
Foreign currency translation | | | 1,248 | | | | (3,936 | ) | | | (2,688 | ) |
| | | | | | | | | | | | |
Balance as at March 31, 2017 | | $ | 129,878 | | | $ | 25,803 | | | $ | 155,681 | |
| | | | | | | | | | | | |
F-33
WNS (HOLDINGS) LIMITED
NOTES TO CONSOLIDATED FINANCIAL STATEMENTS
(Amounts in thousands, except share and per share data)
Accumulated impairment losses
| | | | | | | | | | | | |
| | | WNS | | | WNS Auto | | | | |
| | | Global BPM | | | Claims BPM | | | Total | |
Balance as at April 1, 2015 | | $ | — | | | $ | — | | | $ | — | |
Impairment of goodwill recognized during the year | | | — | | | | — | | | | — | |
| | | | | | | | | | | | |
Balance as at March 31, 2016 | | $ | — | | | $ | — | | | $ | — | |
| | | | | | | | | | | | |
Impairment of goodwill recognized during the year | | | — | | | | 21,673 | | | | 21,673 | |
| | | | | | | | | | | | |
Balance as at March 31, 2017 | | | — | | | | 21,673 | | | | 21,673 | |
| | | | | | | | | | | | |
The carrying value of goodwill allocated to the cash generating units (“CGU”) is as follows:
| | | | | | | | |
| | | As at | |
| | | March 31, | | | March 31, | |
| | | 2017 | | | 2016 | |
WNS Global BPM* | | $ | 3,815 | | | $ | 3,765 | |
South Africa | | | 4,963 | | | | 4,485 | |
Research & Analytics | | | 49,146 | | | | 34,522 | |
Technology services | | | 3,238 | | | | 3,731 | |
WNS Auto Claims BPM | | | 4,130 | | | | 29,739 | |
Finance and accounting | | | 29,874 | | | | — | |
Healthcare | | | 38,842 | | | | — | |
| | | | | | | | |
| | $ | 134,008 | | | $ | 76,242 | |
| | | | | | | | |
| * | Excluding South Africa, Research & analytics, Technology services, Finance and accounting and Healthcare goodwill. |
F-34
WNS (HOLDINGS) LIMITED
NOTES TO CONSOLIDATED FINANCIAL STATEMENTS
(Amounts in thousands, except share and per share data)
Key assumptions on which the Company has based its determination of VIUs include:
| a) | Estimated cash flows for five years based on approved internal management budgets with extrapolation for the remaining period, wherever such budgets were shorter than five years period. |
| b) | Terminal value arrived by extrapolating last forecasted year cash flows to perpetuity using long-term growth rates. These long-term growth rates take into consideration external macro-economic sources of data. Such long-term growth rate considered does not exceed that of the relevant business and industry sector. |
| c) | The discount rates used are based on weighted average cost of capital of a comparable market participant, which are adjusted for specific country risks. |
The key assumptions used in performing the impairment test, by each CGU, were as follows:
| | | | | | | | | | | | | | | | | | | | | | | | | | | | |
| | | CGU’s | |
| | | WNS Global
BPM* | | | South Africa | | | Finance &
accounting | | | Research &
analytics | | | Healthcare | | | Technology
services | | | WNS Auto
Claims BPM | |
Discount rate | | | 17.7 | % | | | 19.0 | % | | | 16.3 | % | | | 17.7 | % | | | 15.3 | % | | | 13.0 | % | | | 13.0 | % |
Perpetual growth rate | | | 3.0 | % | | | 3.0 | % | | | 2.0 | % | | | 3.0 | % | | | 2.5 | % | | | 3.0 | % | | | 1.0 | % |
| * | Excluding South Africa, Research & analytics, Technology services, Healthcare and Finance & Accounting. |
The assumptions used were based on the Company’s internal budget. The Company projected revenue, operating margins and cash flows for a period of five years, and applied a perpetual long-term growth rate thereafter.
In arriving at its forecasts, the Company considered past experience, economic trends and inflation as well as industry and market trends. The projections also took into account factors such as the expected impact from new client wins and expansion from existing clients businesses and efficiency initiatives, and the maturity of the markets in which each business operates.
During the fourth quarter of fiscal 2017, the proposed changes in UK laws with respect to personal injury market and the associated uncertainty of the future earnings trajectory of the legal services business and downward revision in the expectation for future performance within WNS Auto Claims reportable segment due to contract renegotiations and loss of certain clients caused the financial projections and estimates of WNS Auto Claims BPM reportable segment to significantly decrease from the previous estimates which led to an impairment loss during fiscal 2017. These factors arising in the fourth quarter of fiscal 2017 had a significant and negative impact on the VIU of the WNS Auto Claims BPM reportable segment, and the Company determined that the carrying value of the reportable segment for WNS Auto Claims BPM exceeded the VIU as of the date of its annual impairment review. The Company further performed the valuation of FVLCOD of the impairment test.
The Company determined the FVLCOD of reportable segment using the “Income Approach — Discounted Cash Flow Analysis” method.
Under the “Income Approach — Discounted Cash Flow Analysis” method the key assumptions consider projected sales, cost of sales, and operating expenses for five years. These assumptions were determined by management utilizing our internal operating plan, growth rates for revenues and operating expenses, and margin assumptions using market participant perspective. An additional key assumption under this approach is the discount rate, which represents the expected return on capital and is based on the estimated weighted average cost of capital for a market participant. If our assumptions relative to growth rates were to change, our fair value calculation may change, which could impact the results.
The fair value of the WNS Auto Claims BPM reportable segment was determined using level 3 inputs through an income approach which includes assumptions for discount rate of 13.0% with annual and perpetual growth rate of 2.5% and 2.0% respectively. The Company used the “Market approach-Guideline Public Company Method” to corroborate the results of the income approach. The FVLCOD was higher than the VIU, which is considered as the recoverable amount of the CGU amounting to $37,836. The next step of the goodwill impairment test resulted in an impairment charge of $21,673 for goodwill related to the WNS Auto Claims BPM reportable segment in fiscal 2017. This impairment charge of $21,673 was recorded in operating expenses in the Consolidated Statement of Income, which reduced the goodwill in WNS Auto Claims BPM to $4,130 as at March 31, 2017.
The Company did not recognize any impairment charge for goodwill related to WNS Global BPM reportable segment. An analysis of the calculation’s sensitivity to a change in the key parameters (revenue growth, operating margin, discount rate and long-term growth rate) did not identify any probable scenarios where the other CGU’s recoverable amount would fall below its carrying amount.
F-35
WNS (HOLDINGS) LIMITED
NOTES TO CONSOLIDATED FINANCIAL STATEMENTS
(Amounts in thousands, except share and per share data)
10. Intangible assets
The changes in the carrying value of intangible assets for the year ended March 31, 2016 are as follows:
| | | | | | | | | | | | | | | | | | | | | | | | | | | | |
| | | | | | | | | Intellectual | | | | | | Covenant | | | | | | | |
Gross carrying value | | Customer
contracts | | | Customer
relationships | | | property
rights | | | Leasehold
benefits | | | not-to-
compete | | | Software | | | Total | |
Balance as at April 1, 2015 | | $ | 158,753 | | | $ | 63,928 | | | $ | 4,569 | | | $ | 1,835 | | | $ | 332 | | | $ | 12,411 | | | $ | 241,828 | |
Additions | | | — | | | | — | | | | — | | | | — | | | | — | | | | 8,574 | | | | 8,574 | |
On business combination (Refer note 4(d)) | | | 2,990 | | | | — | | | | — | | | | — | | | | — | | | | — | | | | 2,990 | |
Disposals | | | | | | | | | | | | | | | | | | | | | | | (342 | ) | | | (342 | ) |
Translation adjustments | | | (4,957 | ) | | | (781 | ) | | | (119 | ) | | | — | | | | (6 | ) | | | (883 | ) | | | (6,746 | ) |
| | | | | | | | | | | | | | | | | | | | | | | | | | | | |
Balance as at March 31, 2016 | | $ | 156,786 | | | $ | 63,147 | | | $ | 4,450 | | | $ | 1,835 | | | $ | 326 | | | $ | 19,760 | | | $ | 246,304 | |
| | | | | | | | | | | | | | | | | | | | | | | | | | | | |
Accumulated amortization | | | | | | | | | | | | | | | | | | | | | | | | | | | | |
Balance as at April 1, 2015 | | $ | 133,191 | | | $ | 53,909 | | | $ | 4,569 | | | $ | 1,835 | | | $ | 332 | | | $ | 4,718 | | | $ | 198,554 | |
Amortization | | | 15,657 | | | | 5,688 | | | | — | | | | — | | | | — | | | | 3,853 | | | | 25,198 | |
Disposals | | | | | | | | | | | | | | | | | | | | | | | (157 | ) | | | (157 | ) |
Translation adjustments | | | (3,365 | ) | | | (605 | ) | | | (119 | ) | | | — | | | | (6 | ) | | | (313 | ) | | | (4,408 | ) |
| | | | | | | | | | | | | | | | | | | | | | | | | | | | |
Balance as at March 31, 2016 | | $ | 145,483 | | | $ | 58,992 | | | $ | 4,450 | | | $ | 1,835 | | | $ | 326 | | | $ | 8,101 | | | $ | 219,187 | |
| | | | | | | | | | | | | | | | | | | | | | | | | | | | |
Net carrying value as at March 31, 2016 | | $ | 11,303 | | | $ | 4,155 | | | $ | — | | | $ | — | | | $ | — | | | $ | 11,659 | | | $ | 27,117 | |
| | | | | | | | | | | | | | | | | | | | | | | | | | | | |
F-36
WNS (HOLDINGS) LIMITED
NOTES TO CONSOLIDATED FINANCIAL STATEMENTS
(Amounts in thousands, except share and per share data)
The changes in the carrying value of intangible assets for the year ended March 31, 2017 are as follows:
| | | | | | | | | | | | | | | | | | | | | | | | | | | | | | | | | | | | | | | | |
| | | | | | | | | Intellectual | | | | | | | | | | | | Covenant | | | | | | | | | | |
Gross carrying value | | Customer
contracts | | | Customer
relationships | | | property
rights | | | Trade
names | | | Technology | | | Leasehold
benefits | | | not-to-
compete | | | Service
mark | | | Software | | | Total | |
Balance as at April 1, 2016 | | $ | 156,786 | | | $ | 63,147 | | | $ | 4,450 | | | $ | — | | | $ | — | | | $ | 1,835 | | | $ | 326 | | | $ | — | | | $ | 19,760 | | | $ | 246,304 | |
Additions | | | — | | | | — | | | | — | | | | — | | | | — | | | | — | | | | — | | | | — | | | | 4,611 | | | | 4,611 | |
On acquisition (Refer Note (4(a),(b),(c)) | | | 8,263 | | | | 59,478 | | | | — | | | | 649 | | | | 6,090 | | | | — | | | | 9,066 | | | | 400 | | | | 1,287 | | | | 85,233 | |
Translation adjustments | | | 1,952 | | | | (703 | ) | | | (589 | ) | | | 4 | | | | 41 | | | | — | | | | 59 | | | | — | | | | (72 | ) | | | 692 | |
| | | | | | | | | | | | | | | | | | | | | | | | | | | | | | | | | | | | | | | | |
Balance as at March 31, 2017 | | $ | 167,001 | | | $ | 121,922 | | | $ | 3,861 | | | $ | 653 | | | $ | 6,131 | | | $ | 1,835 | | | $ | 9,451 | | | $ | 400 | | | $ | 25,586 | | | $ | 336,840 | |
| | | | | | | | | | | | | | | | | | | | | | | | | | | | | | | | | | | | | | | | |
Accumulated amortization | | | | | | | | | | | | | | | | | | | | | | | | | | | | | | | | | | | | | | | | |
Balance as at April 1, 2016 | | $ | 145,483 | | | $ | 58,992 | | | $ | 4,450 | | | $ | — | | | $ | — | | | $ | 1,835 | | | $ | 326 | | | $ | — | | | $ | 8,101 | | | $ | 219,187 | |
Amortization | | | 10,653 | | | | 4,016 | | | | — | | | | 78 | | | | 167 | | | | — | | | | 650 | | | | — | | | | 4,975 | | | | 20,539 | |
Translation adjustments | | | 1,840 | | | | (833 | ) | | | (589 | ) | | | 2 | | | | 5 | | | | — | | | | (12 | ) | | | — | | | | 77 | | | | 490 | |
| | | | | | | | | | | | | | | | | | | | | | | | | | | | | | | | | | | | | | | | |
Balance as at March 31, 2017 | | $ | 157,976 | | | $ | 62,175 | | | $ | 3,861 | | | $ | 80 | | | $ | 172 | | | $ | 1,835 | | | $ | 964 | | | $ | — | | | $ | 13,153 | | | $ | 240,216 | |
| | | | | | | | | | | | | | | | | | | | | | | | | | | | | | | | | | | | | | | | |
Net carrying value as at March 31, 2017 | | $ | 9,025 | | | $ | 59,747 | | | $ | — | | | $ | 573 | | | $ | 5,959 | | | $ | — | | | $ | 8,487 | | | $ | 400 | | | $ | 12,433 | | | $ | 96,624 | |
| | | | | | | | | | | | | | | | | | | | | | | | | | | | | | | | | | | | | | | | |
As at March 31, 2017, the estimated remaining weighted average amortization periods for intangible assets are as follows:
| | | | |
| | | Balance life | |
| | | (In months) | |
Customer contracts | | | 40 | |
Customer relationships | | | 216 | |
Covenantnot-to-compete | | | 44 | |
Trade names | | | 29 | |
Technology | | | 92 | |
Software | | | 28 | |
The estimated annual amortization expense based on remaining weighted average amortization periods for intangible assets and exchange rates, each as at March 31, 2017 are as follows:
| | | | |
| | | Amount | |
2018 | | $ | 13,980 | |
2019 | | | 12,525 | |
2020 | | | 11,532 | |
2021 | | | 8,310 | |
2022 | | | 5,843 | |
Thereafter | | | 44,034 | |
| | | | |
| | $ | 96,224 | * |
| | | | |
| * | excludes service mark, as it has an indefinite useful life |
F-37
WNS (HOLDINGS) LIMITED
NOTES TO CONSOLIDATED FINANCIAL STATEMENTS
(Amounts in thousands, except share and per share data)
11. Property and equipment
The changes in the carrying value of property and equipment for the year ended March 31, 2016 are as follows:
| | | | | | | | | | | | | | | | | | | | | | | | |
Gross carrying value | | Buildings | | | Computers
and
software | | | Furniture,
fixtures and
office
equipment | | | Vehicles | | | Leasehold
improvements | | | Total | |
Balance as at April 1, 2015 | | $ | 10,405 | | | $ | 67,515 | | | $ | 58,641 | | | $ | 455 | | | $ | 49,358 | | | $ | 186,374 | |
Additions | | | — | | | | 6,866 | | | | 5,914 | | | | 29 | | | | 6,288 | | | | 19,097 | |
Disposals/retirements | | | — | | | | (1,808 | ) | | | (588 | ) | | | | | | | (457 | ) | | | (2,853 | ) |
Translation adjustments | | | (255 | ) | | | (3,370 | ) | | | (3,107 | ) | | | (25 | ) | | | (2,600 | ) | | | (9,357 | ) |
| | | | | | | | | | | | | | | | | | | | | | | | |
Balance as at March 31, 2016 | | $ | 10,150 | | | $ | 69,203 | | | $ | 60,860 | | | $ | 459 | | | $ | 52,589 | | | $ | 193,261 | |
| | | | | | | | | | | | | | | | | | | | | | | | |
Accumulated depreciation | | | | | | | | | | | | | | | | | | | | | | | | |
Balance as at April 1, 2015 | | $ | 3,232 | | | $ | 58,068 | | | $ | 45,397 | | | $ | 289 | | | $ | 34,316 | | | $ | 141,302 | |
Depreciation | | | 510 | | | | 5,172 | | | | 4,834 | | | | 75 | | | | 4,844 | | | | 15,435 | |
Disposals/retirements | | | — | | | | (1,715 | ) | | | (535 | ) | | | — | | | | (454 | ) | | | (2,704 | ) |
Translation adjustments | | | (81 | ) | | | (2,757 | ) | | | (2,321 | ) | | | (17 | ) | | | (1,832 | ) | | | (7,008 | ) |
| | | | | | | | | | | | | | | | | | | | | | | | |
Balance as at March 31, 2016 | | $ | 3,661 | | | $ | 58,768 | | | $ | 47,375 | | | $ | 347 | | | $ | 36,874 | | | $ | 147,025 | |
| | | | | | | | | | | | | | | | | | | | | | | | |
Capitalwork-in-progress | | | | | | | | | | | | | | | | | | | | | | | 4,181 | |
| | | | | | | | | | | | | | | | | | | | | | | | |
Net carrying value as at March 31, 2016 | | | | | | | | | | | | | | | | | | | | | | $ | 50,417 | |
| | | | | | | | | | | | | | | | | | | | | | | | |
The changes in the carrying value of property and equipment for the year ended March 31, 2017 are as follows:
| | | | | | | | | | | | | | | | | | | | | | | | |
Gross carrying value | | Buildings | | | Computers
and
software | | | Furniture,
fixtures and
office
equipment | | | Vehicles | | | Leasehold
improvements | | | Total | |
Balance as at April 1, 2016 | | $ | 10,150 | | | $ | 69,203 | | | $ | 60,860 | | | $ | 459 | | | $ | 52,589 | | | $ | 193,261 | |
Additions | | | — | | | | 4,411 | | | | 7,455 | | | | 135 | | | | 8,105 | | | | 20,106 | |
On acquisition (Refer Note 4(a),(b),(c)) | | | — | | | | 1,014 | | | | 1,895 | | | | 14 | | | | 1,820 | | | | 4,743 | |
Disposals/retirements | | | — | | | | (3,407 | ) | | | (1,619 | ) | | | (33 | ) | | | (1,723 | ) | | | (6,782 | ) |
Translation adjustments | | | 96 | | | | (1,350 | ) | | | 286 | | | | 12 | | | | 201 | | | | (755 | ) |
| | | | | | | | | | | | | | | | | | | | | | | | |
Balance as at March 31, 2017 | | $ | 10,246 | | | $ | 69,871 | | | $ | 68,877 | | | $ | 587 | | | $ | 60,992 | | | $ | 210,573 | |
| | | | | | | | | | | | | | | | | | | | | | | | |
Accumulated depreciation | | | | | | | | | | | | | | | | | | | | | | | | |
Balance as at April 1, 2016 | | $ | 3,661 | | | $ | 58,768 | | | $ | 47,375 | | | $ | 347 | | | $ | 36,874 | | | $ | 147,025 | |
Depreciation | | | 505 | | | | 5,742 | | | | 5,126 | | | | 92 | | | | 5,438 | | | | 16,903 | |
Disposals/retirements | | | — | | | | (3,327 | ) | | | (1,241 | ) | | | (20 | ) | | | (1,354 | ) | | | (5,942 | ) |
Translation adjustments | | | 42 | | | | (1,372 | ) | | | 171 | | | | 10 | | | | 222 | | | | (927 | ) |
| | | | | | | | | | | | | | | | | | | | | | | | |
Balance as at March 31, 2017 | | $ | 4,208 | | | $ | 59,811 | | | $ | 51,431 | | | $ | 429 | | | $ | 41,180 | | | $ | 157,059 | |
| | | | | | | | | | | | | | | | | | | | | | | | |
Capitalwork-in-progress | | | | | | | | | | | | | | | | | | | | | | | 1,282 | |
| | | | | | | | | | | | | | | | | | | | | | | | |
Net carrying value as at March 31, 2017 | | | | | | | | | | | | | | | | | | | | | | $ | 54,796 | |
| | | | | | | | | | | | | | | | | | | | | | | | |
Certain property and equipment are pledged as collateral against borrowings with a carrying amount of $170 and $Nil as at March 31, 2017 and 2016, respectively.
F-38
WNS (HOLDINGS) LIMITED
NOTES TO CONSOLIDATED FINANCIAL STATEMENTS
(Amounts in thousands, except share and per share data)
12. Loans and borrowings
Long-term debt
The long-term loans and borrowings consist of the following:
| | | | | | | | | | | | | | | | | | | | | | |
| | | | | | | | As at | |
| | | | | | | | March 31, 2017 | | | March 31, 2016 | |
Currency | | Interest rate | | Final
maturity
( fiscal year) | | | Foreign
currency | | | Total | | | Foreign
currency | | | Total | |
US dollars | | 3M USD Libor +1.27% | | | 2020 | | | $ | — | | | | 34,000 | | | | — | | | | — | |
US dollars | | 3M USD Libor +0.95% | | | 2022 | | | $ | — | | | | 84,000 | | | | — | | | | — | |
Total | | | | | | | | | | | | | 118,000 | | | | | | | | | |
Less: Debt issuance cost | | | | | | | | | | | | | 1,257 | | | | | | | | | |
Total | | | | | | | | | | | | | 116,743 | | | | | | | | | |
Current portion of long term debt | | | | | | | | | | | | $ | 27,613 | | | | — | | | | — | |
Long term debt | | | | | | | | | | | | $ | 89,130 | | | | | | | | — | |
The Company has entered into a floating to fixed interest rate swap in relation to these debts.
In January 2017, WNS North America Inc. obtained from BNP Paribas, Hong Kong, a three year term loan facility of $34,000 at an interest rate equal to the three-month US dollar LIBOR plus a margin of 1.27% per annum to finance the acquisition of Denali Sourcing Services Inc. WNS North America Inc. has pledged shares of Denali Sourcing Services Inc. as security for the loan. In connection with the term loan, the Company has entered into an interest rate swap with a bank to swap the variable portion of the interest based on US dollar LIBOR to a fixed rate. This term loan is repayable in six semi-annual installments. The first five repayment instalments are $5,650 each and the sixth and final repayment instalment is $5,750. The first scheduled repayment is in July, 2017.
In March 2017, WNS (Mauritius) Limited obtained from HSBC Bank (Mauritius) Ltd. and Standard Chartered Bank, UK five-year term loan facility of $84,000 at an interest rate equal to the three month US dollar LIBOR plus a margin of 0.95% per annum to finance the acquisition of HealthHelp. The Company has pledged shares of WNS (Mauritius) Limited as security for the loan. In connection with the term loan, the Company has entered into an interest rate swap with banks to swap the variable portion of the interest based on US dollar LIBOR to a fixed rate. This term loan is repayable in ten semi-annual installments of $8,400 each. The first scheduled repayment is in September, 2017.
The Company has pledged trade receivables, other financial assets and property and equipment with an aggregate amount of $88,730 and Nil as of March 31, 2017 and March 31, 2016 respectively, as collateral for the above borrowings.
Short-term lines of credit
The Company’s Indian subsidiary, WNS Global Services Private Limited (“WNS Global”), has unsecured lines of credit with banks amounting to $62,957. The Company has also established a line of credit in the UK amounting to £9,880 ($12,337 based on the exchange rate on March 31, 2017). Further the Company has also established a line of credit in South Africa amounting to ZAR 30,000 ($2,254 based on the exchange rate on March 31, 2017).
As at March 31, 2017, no amounts were drawn under these lines of credit.
F-39
WNS (HOLDINGS) LIMITED
NOTES TO CONSOLIDATED FINANCIAL STATEMENTS
(Amounts in thousands, except share and per share data)
13. Financial instruments
Financial instruments by category
The carrying value and fair value of financial instruments by class as at March 31, 2017 are as follows:
Financial assets
| | | | | | | | | | | | | | | | | | | | | | | | |
| | | Loans and
receivables | | | Financial
assets at
FVTPL | | | Derivative
designated
as cash flow
hedges (carried
at fair value) | | | Available
for
sale | | | Total
carrying
value | | | Total fair
value | |
Cash and cash equivalents | | $ | 69,803 | | | $ | — | | | $ | — | | | $ | — | | | $ | 69,803 | | | $ | 69,803 | |
Investment in fixed deposits | | | 24,673 | | | | — | | | | — | | | | — | | | | 24,673 | | | | 24,673 | |
Investments in marketable securities and mutual funds | | | — | | | | — | | | | — | | | | 87,652 | | | | 87,652 | | | | 87,652 | |
Investment in FMPs | | | — | | | | 96 | | | | — | | | | — | | | | 96 | | | | 96 | |
Trade receivables | | | 60,423 | | | | — | | | | — | | | | — | | | | 60,423 | | | | 60,423 | |
Unbilled revenue | | | 48,915 | | | | — | | | | — | | | | — | | | | 48,915 | | | | 48,915 | |
Funds held for clients | | | 9,135 | | | | — | | | | — | | | | — | | | | 9,135 | | | | 9,135 | |
Prepayments and other assets (1) | | | 4,262 | | | | — | | | | — | | | | — | | | | 4,262 | | | | 4,262 | |
Other non-current assets (2) | | | 10,791 | | | | — | | | | — | | | | — | | | | 10,791 | | | | 10,791 | |
Derivative assets | | | — | | | | 5,041 | | | | 36,941 | | | | — | | | | 41,982 | | | | 41,982 | |
| | | | | | | | | | | | | | | | | | | | | | | | |
Total carrying value | | $ | 228,002 | | | $ | 5,137 | | | $ | 36,941 | | | $ | 87,652 | | | $ | 357,732 | | | $ | 357,732 | |
| | | | | | | | | | | | | | | | | | | | | | | | |
Financial liabilities
| | | | | | | | | | | | | | | | | | | | |
| | | Financial
liabilities at
FVTPL | | | Derivative
designated
as cash flow
hedges (carried
at fair value) | | | Financial
liabilities at
amortized
cost | | | Total
carrying
value | | | Total
fair
value | |
Trade payables | | $ | — | | | $ | — | | | $ | 14,239 | | | $ | 14,239 | | | $ | 14,239 | |
Long term debt (includes current portion) (3) | | | — | | | | — | | | | 118,000 | | | | 118,000 | | | | 118,000 | |
Other employee obligations (4) | | | — | | | | — | | | | 46,701 | | | | 46,701 | | | | 46,701 | |
Provision and accrued expenses | | | — | | | | — | | | | 27,217 | | | | 27,217 | | | | 27,217 | |
Other liabilities (5) | | | 19,678 | | | | — | | | | 1,086 | | | | 20,764 | | | | 20,764 | |
Derivative liabilities | | | 26 | | | | 4,757 | | | | — | | | | 4,783 | | | | 4,783 | |
| | | | | | | | | | | | | | | | | | | | |
Total carrying value | | $ | 19,704 | | | $ | 4,757 | | | $ | 207,243 | | | $ | 231,704 | | | $ | 231,704 | |
| | | | | | | | | | | | | | | | | | | | |
Notes:
| (1) | Excludingnon-financial assets $ 23,123. |
| (2) | Excludingnon-financial assets $ 21,153. |
| (3) | Excludingnon-financial asset (unamortized debt issuance cost) $1,257. |
| (4) | Excludingnon-financial liabilities $16,912. |
| (5) | Excludingnon-financial liabilities $13,720. |
F-40
WNS (HOLDINGS) LIMITED
NOTES TO CONSOLIDATED FINANCIAL STATEMENTS
(Amounts in thousands, except share and per share data)
The carrying value and fair value of financial instruments by class as at March 31, 2016 are as follows:
Financial assets
| | | | | | | | | | | | | | | | | | | | | | | | |
| | | Loans and
receivables | | | Financial
assets at
FVTPL | | | Derivative
designated
as cash flow
hedges (carried
at fair value) | | | Available
for
sale | | | Total
carrying
value | | | Total
fair
value | |
Cash and cash equivalents | | $ | 41,854 | | | $ | — | | | $ | — | | | $ | — | | | $ | 41,854 | | | $ | 41,854 | |
Investment in fixed deposits and marketable securities | | | 14,791 | | | | — | | | | — | | | | 118,198 | | | | 132,989 | | | | 132,989 | |
Trade receivables | | | 54,911 | | | | — | | | | — | | | | — | | | | 54,911 | | | | 54,911 | |
Unbilled revenue | | | 44,318 | | | | — | | | | — | | | | — | | | | 44,318 | | | | 44,318 | |
Funds held for clients | | | 11,895 | | | | — | | | | — | | | | — | | | | 11,895 | | | | 11,895 | |
Prepayments and other assets (1) | | | 6,147 | | | | — | | | | — | | | | — | | | | 6,147 | | | | 6,147 | |
Other non-current assets (2) | | | 6,348 | | | | — | | | | — | | | | — | | | | 6,348 | | | | 6,348 | |
Derivative assets | | | — | | | | 2,492 | | | | 16,245 | | | | — | | | | 18,737 | | | | 18,737 | |
| | | | | | | | | | | | | | | | | | | | | | | | |
Total carrying value | | $ | 180,264 | | | $ | 2,492 | | | $ | 16,245 | | | $ | 118,198 | | | $ | 317,199 | | | $ | 317,199 | |
| | | | | | | | | | | | | | | | | | | | | | | | |
Financial liabilities
| | | | | | | | | | | | | | | | | | | | |
| | | Financial
liabilities at
FVTPL | | | Derivative
designated
as cash flow
hedges (carried
at fair value) | | | Financial
liabilities at
amortized
cost | | | Total
carrying
value | | | Total
fair
value | |
Trade payables | | $ | — | | | $ | — | | | $ | 19,862 | | | $ | 19,862 | | | $ | 19,862 | |
Other employee obligations (3) | | | — | | | | — | | | | 39,604 | | | | 39,604 | | | | 39,604 | |
Provision and accrued expenses | | | — | | | | — | | | | 24,741 | | | | 24,741 | | | | 24,741 | |
Other liabilities (4) | | | — | | | | — | | | | 231 | | | | 231 | | | | 231 | |
Derivative liabilities | | | 870 | | | | 2,840 | | | | — | | | | 3,710 | | | | 3,710 | |
| | | | | | | | | | | | | | | | | | | | |
Total carrying value | | $ | 870 | | | $ | 2,840 | | | $ | 84,438 | | | $ | 88,148 | | | $ | 88,148 | |
| | | | | | | | | | | | | | | | | | | | |
Notes:
| (1) | Excludingnon-financial assets $16,454. |
| (2) | Excludingnon-financial assets $15,500. |
| (3) | Excludingnon-financial liabilities $12,109. |
| (4) | Excludingnon-financial liabilities $10,290. |
F-41
WNS (HOLDINGS) LIMITED
NOTES TO CONSOLIDATED FINANCIAL STATEMENTS
(Amounts in thousands, except share and per share data)
For the financial assets and liabilities subject to offsetting or similar arrangements, each agreement between the Company and the counterparty allows for net settlement of the relevant financial assets and liabilities when both elect to settle on a net basis. In the absence of such an election, financial assets and liabilities will be settled on a gross basis.
Financial assets and liabilities subject to offsetting, enforceable master netting arrangements or similar agreements as at March 31, 2017 are as follows:
| | | | | | | | | | | | | | | | | | | | | | | | |
Description of types of financial assets | | Gross
amounts of
recognized
financial
assets | | | Gross amounts
of recognized
financial
liabilities offset
in the
statement of
financial
position | | | Net amounts
of financial
assets
presented in
the statement
of financial
position | | | Related amount not set off in
financial instruments | | | Net
Amount | |
| | | | | Financial
instruments | | | Cash
collateral
received | | |
Derivative assets | | $ | 41,982 | | | $ | — | | | $ | 41,982 | | | $ | (1,712 | ) | | $ | — | | | $ | 40,270 | |
| | | | | | | | | | | | | | | | | | | | | | | | |
Total | | $ | 41,982 | | | $ | — | | | $ | 41,982 | | | $ | (1,712 | ) | | $ | — | | | $ | 40,270 | |
| | | | | | | | | | | | | | | | | | | | | | | | |
| | | | | | | | | | | | | | | | | | | | | | | | |
Description of types of financial liabilities | | Gross
amounts of
recognized
financial
liabilities | | | Gross amounts
of recognized
financial assets
offset in the
statement of
financial
position | | | Net amounts
of financial
liabilities
presented in
the statement
of financial
position | | | Related amount not set off in
financial instruments | | | Net
Amount | |
| | | | | Financial
instruments | | | Cash
collateral
pledged | | |
Derivative liabilities | | $ | 4,783 | | | $ | — | | | $ | 4,783 | | | $ | (1,712 | ) | | $ | — | | | $ | 3,071 | |
| | | | | | | | | | | | | | | | | | | | | | | | |
Total | | $ | 4,783 | | | $ | — | | | $ | 4,783 | | | $ | (1,712 | ) | | $ | — | | | $ | 3,071 | |
| | | | | | | | | | | | | | | | | | | | | | | | |
F-42
WNS (HOLDINGS) LIMITED
NOTES TO CONSOLIDATED FINANCIAL STATEMENTS
(Amounts in thousands, except share and per share data)
Financial assets and liabilities subject to offsetting, enforceable master netting arrangements or similar agreements as at March 31, 2016 are as follows:
| | | | | | | | | | | | | | | | | | | | | | | | |
Description of types of financial assets | | Gross
amounts of
recognized
financial
assets | | | Gross amounts
of recognized
financial
liabilities offset
in the
statement of
financial
position | | | Net amounts
of financial
assets
presented in
the statement
of financial
position | | | Related amount not set off in
financial instruments | | | Net
amount | |
| | | | | Financial
instruments | | | Cash
collateral
received | | |
Derivative assets | | $ | 18,737 | | | $ | — | | | $ | 18,737 | | | $ | (3,040 | ) | | $ | — | | | $ | 15,697 | |
| | | | | | | | | | | | | | | | | | | | | | | | |
Total | | $ | 18,737 | | | $ | — | | | $ | 18,737 | | | $ | (3,040 | ) | | $ | — | | | $ | 15,697 | |
| | | | | | | | | | | | | | | | | | | | | | | | |
| | | | | |
Description of types of financial liabilities | | Gross
amounts of
recognized
financial
liabilities | | | Gross amounts
of recognized
financial assets
offset in the
statement of
financial
position | | | Net amounts
of financial
liabilities
presented in
the statement
of financial
position | | | Related amount not set off in
financial instruments | | | Net
Amount | |
| | | | | Financial
instruments | | | Cash
collateral
pledged | | |
Derivative liabilities | | $ | 3,710 | | | $ | — | | | $ | 3,710 | | | $ | (3,040 | ) | | $ | — | | | $ | 607 | |
| | | | | | | | | | | | | | | | | | | | | | | | |
Total | | $ | 3,710 | | | $ | — | | | $ | 3,710 | | | $ | (3,040 | ) | | $ | — | | | $ | 607 | |
| | | | | | | | | | | | | | | | | | | | | | | | |
Fair value hierarchy
The following is the hierarchy for determining and disclosing the fair value of financial instruments by valuation technique:
Level 1 — quoted prices (unadjusted) in active markets for identical assets or liabilities.
Level 2 — other techniques for which all inputs have a significant effect on the recorded fair value are observable, either directly or indirectly.
Level 3 — techniques which use inputs that have a significant effect on the recorded fair value that are not based on observable market data.
F-43
WNS (HOLDINGS) LIMITED
NOTES TO CONSOLIDATED FINANCIAL STATEMENTS
(Amounts in thousands, except share and per share data)
The assets and liabilities measured at fair value on a recurring basis as at March 31, 2017 are as follows:-
| | | | | | | | | | | | | | | | |
Description | | March 31,
2017 | | | Fair value measurement at reporting date using | |
| | | Quoted
prices in
active
markets
for identical
assets
(Level 1) | | | Significant
other
observable
inputs
(Level 2) | | | Significant
unobservable
inputs
(Level 3) | |
Assets | | | | | | | | | | | | | | | | |
Financial assets at FVTPL | | | | | | | | | | | | | | | | |
Foreign exchange contracts | | $ | 5,041 | | | $ | — | | | $ | 5,041 | | | $ | — | |
Investment in FMPs | | | 96 | | | | 96 | | | | — | | | | — | |
Financial assets at fair value through other comprehensive income | | | | | | | | | | | | | | | | |
Foreign exchange contracts | | | 36,733 | | | | — | | | | 36,733 | | | | — | |
Interest rate swaps | | | 208 | | | | — | | | | 208 | | | | — | |
Investments in marketable securities and mutual funds | | | 87,652 | | | | 87,223 | | | | 429 | | | | — | |
| | | | | | | | | | | | | | | | |
Total assets | | $ | 129,730 | | | $ | 87,319 | | | $ | 42,411 | | | $ | — | |
| | | | | | | | | | | | | | | | |
Liabilities | | | | | | | | | | | | | | | | |
Financial liabilities at FVTPL | | | | | | | | | | | | | | | | |
Foreign exchange contracts | | $ | 26 | | | $ | — | | | $ | 26 | | | $ | — | |
Contingent consideration | | | 19,678 | | | | — | | | | — | | | | 19,678 | |
Financial liabilities at fair value through other comprehensive income | | | | | | | | | | | | | | | | |
Foreign exchange contracts | | | 4,136 | | | | — | | | | 4,136 | | | | — | |
Interest rate swaps | | | 621 | | | | — | | | | 621 | | | | — | |
| | | | | | | | | | | | | | | | |
Total liabilities | | $ | 24,461 | | | $ | — | | | $ | 4,783 | | | $ | 19,678 | |
| | | | | | | | | | | | | | | | |
Description of significant unobservable inputs to Level 3 valuation
The fair value of the contingent consideration liability was estimated using a probability weighted method and achievement of revenue target with a discount rate of 2.5%. One percentage point change in the unobservable inputs used in fair valuation of the contingent consideration does not have a significant impact on its value.
F-44
WNS (HOLDINGS) LIMITED
NOTES TO CONSOLIDATED FINANCIAL STATEMENTS
(Amounts in thousands, except share and per share data)
The assets and liabilities measured at fair value on a recurring basis as at March 31, 2016 are as follows:-
| | | | | | | | | | | | | | | | |
| | | | | | Fair value measurement at reporting date using | |
Description | | March 31,
2016 | | | Quoted
prices in
active
markets
for identical
assets
(Level 1) | | | Significant
other
observable
inputs
(Level 2) | | | Significant
unobservable
inputs
(Level 3) | |
Assets | | | | | | | | | | | | | | | | |
Financial assets at FVTPL | | | | | | | | | | | | | | | | |
Foreign exchange contracts | | $ | 2,492 | | | $ | — | | | $ | 2,492 | | | $ | — | |
Financial assets at fair value through other comprehensive income | | | | | | | | | | | | | | | | |
Foreign exchange contracts | | | 16,245 | | | | — | | | | 16,245 | | | | — | |
Investments in marketable securities | | | 118,198 | | | | 118,198 | | | | — | | | | — | |
| | | | | | | | | | | | | | | | |
Total assets | | $ | 136,935 | | | $ | 118,198 | | | $ | 18,737 | | | $ | — | |
| | | | | | | | | | | | | | | | |
Liabilities | | | | | | | | | | | | | | | | |
Financial liabilities at FVTPL | | | | | | | | | | | | | | | | |
Foreign exchange contracts | | $ | 870 | | | $ | — | | | $ | 870 | | | $ | — | |
Financial liabilities at fair value through other comprehensive income | | | | | | | | | | | | | | | | |
Foreign exchange contracts | | | 2,840 | | | | — | | | | 2,840 | | | | — | |
| | | | | | | | | | | | | | | | |
Total liabilities | | $ | 3,710 | | | $ | — | | | $ | 3,710 | | | $ | — | |
| | | | | | | | | | | | | | | | |
The fair value is estimated using discounted cash flow approach which involves assumptions and judgments regarding risk characteristics of the instruments, discount rates, future cash flows, foreign exchange spot, forward premium rates and market rates of interest. During the year ended March 31, 2017 and 2016, there were no transfers between Level 1 and Level 2 fair value measurements, and no transfers into and out of Level 3 fair value measurements.
F-45
WNS (HOLDINGS) LIMITED
NOTES TO CONSOLIDATED FINANCIAL STATEMENTS
(Amounts in thousands, except share and per share data)
Fair value on anon-recurring basis as at March 31, 2017
Thenon-recurring fair value measurement for the Auto Claim BPM CGU of $38,492 (before cost of disposal of $656) has been categorized as level 3 fair value based on the inputs to the valuation technique used (refer note 9).
Derivative financial instruments
The primary risks managed by using derivative instruments are foreign currency exchange risk and interest rate risk. Forward and option contracts up to 24 months on various foreign currencies are entered into to manage the foreign currency exchange rate risk on forecasted revenue denominated in foreign currencies and monetary assets and liabilities held innon-functional currencies. Interest rate swaps are entered to manage interest rate risk associated with the Company’s floating rate borrowings. The Company’s primary exchange rate exposure is with the US dollars and pound sterling against the Indian rupee. For derivative instruments which qualify for cash flow hedge accounting, the Company records the effective portion of gain or loss from changes in the fair value of the derivative instruments in other comprehensive income (loss), which is reclassified into earnings in the same period during which the hedged item affects earnings. Derivative instruments qualify for hedge accounting when the instrument is designated as a hedge; the hedged item is specifically identifiable and exposes the Company to risk; and it is expected that a change in fair value of the derivative instrument and an opposite change in the fair value of the hedged item will have a high degree of correlation. Determining the high degree of correlation between the change in fair value of the hedged item and the derivative instruments involves significant judgment including the probability of the occurrence of the forecasted transaction. When it is highly probable that a forecasted transaction will not occur, the Company discontinues the hedge accounting and recognizes immediately in the consolidated statement of income, the gains and losses attributable to such derivative instrument that were accumulated in other comprehensive income (loss).
The following table presents the notional values of outstanding foreign exchange forward contracts, foreign exchange option contracts and interest rate swap contracts:
| | | | | | | | |
| | | As at | |
| | | March 31,
2017 | | | March 31,
2016 | |
Forward contracts (Sell) | | | | | | | | |
In US dollars | | $ | 241,673 | | | $ | 151,884 | |
In United Kingdom Pound Sterling | | | 126,441 | | | | 148,386 | |
In Euro | | | 14,769 | | | | 10,349 | |
In Australian dollars | | | 43,474 | | | | 31,099 | |
Others | | | 3,511 | | | | 4,682 | |
| | | | | | | | |
| | $ | 429,868 | | | $ | 346,400 | |
| | | | | | | | |
Option contracts (Sell) | | | | | | | | |
In US dollars | | $ | 84,490 | | | $ | 81,827 | |
In United Kingdom Pound Sterling | | | 94,094 | | | | 103,863 | |
In Euro | | | 14,494 | | | | 10,314 | |
In Australian dollars | | | 19,412 | | | | 18,935 | |
Others | | | 1,978 | | | | 2,412 | |
| | | | | | | | |
| | $ | 214,468 | | | $ | 217,351 | |
| | | | | | | | |
Interest Rate Swap contracts | | | | | | | | |
In US dollars | | | 118,000 | | | | — | |
The amount of gain/(loss) reclassified from other comprehensive income into consolidated statement of income in respective line items for the years ended March 31, 2017, 2016 and 2015 are as follows:
| | | | | | | | | | | | |
| | | Year ended March 31, | |
| | | 2017 | | | 2016 | | | 2015 | |
Revenue | | $ | 7,952 | | | $ | 7,941 | | | $ | 4,347 | |
Foreign exchange gain/(loss), net | | | 16,896 | | | | 6,281 | | | | 3,399 | |
Finance expense | | | (71 | ) | | | — | | | | — | |
Income tax related to amounts reclassified into consolidated statement of income | | | (8,998 | ) | | | (5,230 | ) | | | (2,764 | ) |
| | | | | | | | | | | | |
Total | | $ | 15,779 | | | $ | 8,992 | | | $ | 4,982 | |
| | | | | | | | | | | | |
F-46
WNS (HOLDINGS) LIMITED
NOTES TO CONSOLIDATED FINANCIAL STATEMENTS
(Amounts in thousands, except share and per share data)
As at March 31, 2017, the gain amounting to $17,694 on account of cash flow hedges in relation to forward and option contracts entered is expected to be reclassified from other comprehensive income into consolidated statement of income over a period of 24 months and loss amounting to $346 on account of cash flow hedges in relation to interest rate swaps is expected to be reclassified from other comprehensive income into consolidated statement of income over a period of 60 months.
Due to the discontinuation of cash flow hedge accounting on account ofnon-occurrence of original forecasted transactions by the end of the originally specified time period, the Company recognized in the consolidated statement of income for the years ended March 31, 2017, 2016 and 2015 gains of $666, $125 and $13, respectively.
Financial risk management
Financial risk factors
The Company’s activities expose it to a variety of financial risks: market risk, interest risk, credit risk and liquidity risk. The Company’s primary focus is to foresee the unpredictability of financial markets and seek to minimize potential adverse effects on its financial performance. The primary market risk to the Company is foreign exchange risk. The Company uses derivative financial instruments to mitigate foreign exchange related risk exposures. The Company’s exposure to credit risk is influenced mainly by the individual characteristic of each customer and the concentration of risk from the top few customers. The demographics of the customer including the default risk of the industry and country in which the customer operates also has an influence on credit risk assessment. The Company does not enter into or trade financial instruments, including derivative financial instruments, for speculative purposes.
Risk management procedures
The Company manages market risk through treasury operations. Senior management and Board of Directors approve the Company’s treasury operations’ objectives and policies. The activities of treasury operations include management of cash resources, implementation of hedging strategies for foreign currency exposures, implementation of borrowing strategies and monitoring compliance with market risk limits and policies. The Company’s foreign exchange committee, comprising the Chairman of the Board, Group Chief Executive Officer and Group Chief Financial Officer, is the approving authority for all hedging transactions.
Components of market risk
Exchange rate or currency risk:
The Company’s exposure to market risk arises principally from exchange rate risk. Although substantially all of revenue is denominated in pound sterling and US dollars, a significant portion of expenses for the year ended March 31, 2017 (net of payments to repair centers made as part of the Company’s WNS Auto Claims BPM segment) were incurred and paid in Indian rupees. The exchange rates among the Indian rupee, the pound sterling and the US dollar have changed substantially in recent years and may fluctuate substantially in the future. The Company hedges a portion of forecasted external and inter-company revenue denominated in foreign currencies with forward contracts and options.
Based upon the Company’s level of operations for the year ended March 31, 2017, a sensitivity analysis shows that a 10% appreciation or depreciation in the pound sterling against the US dollar would have increased or decreased, respectively, the Company’s revenue for the year ended March 31, 2017 by approximately $22,924. Similarly, a 10% appreciation or depreciation in the Indian rupee against the US dollar would have increased or decreased, respectively, the Company’s expenses incurred and paid in Indian rupee for the year ended March 31, 2017 by approximately $25,426.
F-47
WNS (HOLDINGS) LIMITED
NOTES TO CONSOLIDATED FINANCIAL STATEMENTS
(Amounts in thousands, except share and per share data)
The foreign currency risk fromnon-derivative financial instruments as at March 31, 2017 is as follows:
| | | | | | | | | | | | | | | | | | | | | | | | | | | | |
| | | As at March 31, 2017 | |
| | | US Dollar | | | Pound
Sterling | | | Indian
Rupees | | | Australian
Dollar | | | Euro | | | Other
Currencies | | | Total | |
Cash and cash equivalents | | $ | 599 | | | | 253 | | | | — | | | | 2,606 | | | | 1,323 | | | | 35 | | | | 4,816 | |
Trade receivables | | | 98,713 | | | | 53,668 | | | | 2,996 | | | | 23,373 | | | | 5,370 | | | | 3,192 | | | | 187,312 | |
Unbilled revenue | | | 4,656 | | | | 1,241 | | | | | | | | 3,062 | | | | 3,205 | | | | 494 | | | | 12,658 | |
Prepayments and other current assets | | | 428 | | | | 130 | | | | 3 | | | | 66 | | | | 30 | | | | 14 | | | | 671 | |
Othernon-current assets | | | 3 | | | | — | | | | — | | | | — | | | | — | | | | 16 | | | | 19 | |
Trade payables | | | (40,600 | ) | | | (71,039 | ) | | | (3,986 | ) | | | (19,205 | ) | | | (1,140 | ) | | | (312 | ) | | | (136,282 | ) |
Provisions and accrued expenses | | | (1,706 | ) | | | (504 | ) | | | (105 | ) | | | (128 | ) | | | (68 | ) | | | (208 | ) | | | (2,719 | ) |
Pension and other employee obligations | | | (56 | ) | | | — | | | | — | | | | — | | | | (31 | ) | | | (165 | ) | | | (252 | ) |
Other liabilities | | | (5 | ) | | | (2 | ) | | | — | | | | — | | | | — | | | | 14 | | | | 7 | |
| | | | | | | | | | | | | | | | | | | | | | | | | | | | |
Net assets/ (liabilities) | | $ | 62,032 | | | | (16,253 | ) | | | (1,092 | ) | | | 9,774 | | | | 8,689 | | | | 3,080 | | | | 66,230 | |
| | | | | | | | | | | | | | | | | | | | | | | | | | | | |
The foreign currency risk fromnon-derivative financial instruments as at March 31, 2016 is as follows:
| | | | | | | | | | | | | | | | | | | | | | | | | | | | |
| | | As at March 31, 2016 | |
| | | US Dollar | | | Pound
Sterling | | | Indian
Rupees | | | Australian
Dollar | | | Euro | | | Other
Currencies | | | Total | |
Cash and cash equivalents | | $ | 868 | | | $ | 222 | | | $ | — | | | $ | 856 | | | $ | 430 | | | $ | 203 | | | $ | 2,579 | |
Trade receivables | | | 91,389 | | | | 72,348 | | | | 2,739 | | | | 11,995 | | | | 3,382 | | | | 1,729 | | | | 183,582 | |
Unbilled revenue | | | 4,508 | | | | (814 | ) | | | — | | | | 2,788 | | | | 2,294 | | | | 420 | | | | 9,196 | |
Prepayments and other current assets | | | 331 | | | | 200 | | | | 3 | | | | 61 | | | | 31 | | | | 16 | | | | 642 | |
Othernon-current assets | | | 3 | | | | — | | | | — | | | | — | | | | — | | | | 16 | | | | 19 | |
Trade payables | | | (51,270 | ) | | | (19,809 | ) | | | (4,284 | ) | | | (7,866 | ) | | | (1,083 | ) | | | 228 | | | | (84,084 | ) |
Provisions and accrued expenses | | | (1,932 | ) | | | (513 | ) | | | (100 | ) | | | — | | | | (445 | ) | | | 14 | | | | (2,976 | ) |
Pension and other employee obligations | | | 1 | | | | — | | | | — | | | | — | | | | (21 | ) | | | (258 | ) | | | (278 | ) |
Other liabilities | | | — | | | | — | | | | — | | | | — | | | | — | | | | (2 | ) | | | (2 | ) |
| | | | | | | | | | | | | | | | | | | | | | | | | | | | |
Net assets/ (liabilities) | | $ | 43,898 | | | $ | 51,634 | | | $ | (1,642 | ) | | $ | 7,834 | | | $ | 4,588 | | | $ | 2,366 | | | $ | 108,678 | |
| | | | | | | | | | | | | | | | | | | | | | | | | | | | |
F-48
WNS (HOLDINGS) LIMITED
NOTES TO CONSOLIDATED FINANCIAL STATEMENTS
(Amounts in thousands, except share and per share data)
Other currencies reflect currencies such as Philippines Peso (PHP), Canadian Dollar (CAD), Polish Zloty (PLN), Sri Lankan Rupee (LKR), Romanian Leu (RON) and South African Rand (ZAR) etc.
As at March 31, 2017, every 5% appreciation or depreciation of the respective foreign currencies compared to the functional currency of the Company would impact the Company’s profit before tax from operating activities by approximately $2,779.
Interest rate risk:The Company’s exposure to interest rate risk arises from borrowings which have a floating rate of interest, which is linked to the US dollar LIBOR. The risk is managed by the Company by maintaining an appropriate mix between fixed and floating rate borrowings and by the use of interest rate swap contracts. The costs of floating rate borrowings may be affected by the fluctuations in the interest rates. In connection with the term loan facilities entered in fiscal 2017, the Company entered into interest rate swap agreements with the banks in fiscal 2017. These swap agreements effectively convert the term loans from variable US dollar LIBOR interest rates to fixed rates, thereby managing the Company’s exposure to changes in market interest rates under the term loans. The outstanding swap agreements as at March 31, 2017 aggregated $118,000.
The Company monitors its positions and does not anticipatenon-performance by the counterparties. The Company intends to selectively use interest rate swaps, options and other derivative instruments to manage exposure to interest rate movements. These exposures are reviewed by appropriate levels of management on a periodic basis. The Company does not enter into hedging agreements for speculative purposes.
Credit risk:
Credit risk arises from the possibility that customers may not be able to settle their obligations as agreed. Trade receivables are typically unsecured and are derived from revenue earned from customers primarily located in the United Kingdom and the United States. Credit risk is managed through periodical assessment of the financial reliability of customers, taking into account the financial condition, current economic trends, analysis of historical bad debts and ageing of accounts receivable. The credit risk on marketable securities, FMPs, mutual funds, bank deposits and derivative financial instruments is limited because the counterparties are banks and mutual funds with high credit-ratings assigned by international credit-rating agencies.
F-49
WNS (HOLDINGS) LIMITED
NOTES TO CONSOLIDATED FINANCIAL STATEMENTS
(Amounts in thousands, except share and per share data)
The following table gives details in respect of the percentage of revenue generated from the Company’s top customer and top five customers:
| | | | | | | | | | | | |
| | | Year Ended March 31, | |
| | | 2017 | | | 2016 | | | 2015 | |
Revenue from top customer | | | 9.0 | % | | | 10.9 | % | | | 13.4 | % |
Revenue from top five customers | | | 32.1 | % | | | 30.7 | % | | | 33.0 | % |
Financial assets that are neither past due nor impaired
Cash equivalents, bank deposits, marketable securities and investments in mutual funds, investment in FMPs, unbilled revenue and other assets, are neither past due nor impaired except trade receivables as described below.
Financial assets that are past due but not impaired
There is no other class of financial assets that is past due but not impaired, except for trade receivables, which forms part of the class “Loans and receivables.” The Company’s credit period generally ranges from30-60 days. Theage-wise break up of trade receivables, net of allowances that are past due beyond credit period, are as follows:
| | | | | | | | |
| | | As at | |
| | | March 31,
2017 | | | March 31,
2016 | |
Neither past due nor impaired | | $ | 45,939 | | | $ | 43,771 | |
Past due but not impaired | | | | | | | | |
Past due0-30 days | | | 8,260 | | | | 7,995 | |
Past due31-60 days | | | 2,544 | | | | 1,006 | |
Past due61-90 days | | | 1,174 | | | | 928 | |
Past due over 90 days | | | 2,506 | | | | 1,212 | |
Past due and impaired | | | 1,713 | | | | 4,446 | |
| | | | | | | | |
Total | | $ | 62,136 | | | $ | 59,358 | |
Allowances for doubtful account receivables | | $ | (1,713 | ) | | $ | (4,446 | ) |
| | | | | | | | |
Trade receivables, net of allowances for doubtful accounts receivable | | $ | 60,423 | | | $ | 54,912 | |
| | | | | | | | |
Liquidity risk:
Liquidity risk is the risk that the Company will encounter difficulty in meeting the obligations associated with its financial liabilities that are settled by delivering cash or another financial asset. The Company’s approach to managing liquidity is to ensure, as far as possible, that it will always have sufficient liquidity to meet its liabilities when due, under normal and stressed conditions, without incurring unacceptable losses or risking damage to the reputation. Typically the Company ensures that it has sufficient cash on demand to meet expected operational expenses and service financial obligations. In addition, the Company has concluded arrangements with well reputed banks and has unused lines of credit of $77,548 as of March 31, 2017 that could be drawn upon should there be a need.
F-50
WNS (HOLDINGS) LIMITED
NOTES TO CONSOLIDATED FINANCIAL STATEMENTS
(Amounts in thousands, except share and per share data)
The contractual maturities of financial liabilities are as follows:
| | | | | | | | | | | | | | | | |
| | | As at March 31, 2017 | |
| | | Less than
1 Year | | | 1-2 years | | | 2-5 years | | | Total | |
Long term debt (includes current portion)(1) | | $ | 28,100 | | | $ | 28,100 | | | $ | 61,800 | | | $ | 118,000 | |
Trade payables | | | 14,239 | | | | — | | | | — | | | | 14,239 | |
Provision and accrued expenses | | | 27,217 | | | | — | | | | — | | | | 27,217 | |
Other liabilities | | | 9,338 | | | | 8,195 | | | | 3,231 | | | | 20,764 | |
Other employee obligations | | | 46,701 | | | | — | | | | — | | | | 46,701 | |
Derivative financial instruments | | | 3,947 | | | | 836 | | | | — | | | | 4,783 | |
| | | | | | | | | | | | | | | | |
Total(2) | | $ | 129,542 | | | $ | 37,131 | | | $ | 65,031 | | | $ | 231,704 | |
| | | | | | | | | | | | | | | | |
Notes:
| (1) | Before netting off debt issuance cost of $1,257. |
| (2) | Non-financial liabilities are explained in the financial instruments categories table above. |
| | | | | | | | | | | | | | | | |
| | | As at March 31, 2016 | |
| | | Less than
1 Year | | | 1-2 years | | | 2-5 years | | | Total | |
Long term debt | | $ | — | | | $ | — | | | $ | — | | | $ | — | |
Trade payables | | | 19,862 | | | | — | | | | — | | | | 19,862 | |
Short term line of credit | | | — | | | | — | | | | — | | | | — | |
Provision and accrued expenses | | | 24,741 | | | | — | | | | — | | | | 24,741 | |
Other liabilities | | | 231 | | | | — | | | | — | | | | 231 | |
Other employee obligations | | | 39,604 | | | | — | | | | — | | | | 39,604 | |
Derivative financial instruments | | | 3,259 | | | | 451 | | | | — | | | | 3,710 | |
| | | | | | | | | | | | | | | | |
Total(1) | | $ | 87,697 | | | $ | 451 | | | $ | — | | | $ | 88,148 | |
| | | | | | | | | | | | | | | | |
Note:
| (1) | Non-financial liabilities are explained in the financial instruments categories table above. |
The balanced view of liquidity and financial indebtedness is stated in the table below. This calculation of the net cash position is used by the management:
| | | | | | | | |
| | | As at | |
| | | March 31,
2017 | | | March 31,
2016 | |
Cash and cash equivalents | | $ | 69,803 | | | $ | 41,854 | |
Investments | | | 112,421 | | | | 132,989 | |
Long term debt (includes current portion)(1) | | | (118,000 | ) | | | — | |
| | | | | | | | |
Net cash position | | $ | 64,224 | | | $ | 174,843 | |
| | | | | | | | |
Note:
| (1) | Before netting off debt issuance cost of $ 1,257. |
F-51
WNS (HOLDINGS) LIMITED
NOTES TO CONSOLIDATED FINANCIAL STATEMENTS
(Amounts in thousands, except share and per share data)
14. Pension and other employee obligations
Pension and other employee obligations consist of the following:
| | | | | | | | |
| | | As at | |
| | | March 31,
2017 | | | March 31,
2016 | |
Current: | | | | | | | | |
Salaries and bonus | | $ | 46,701 | | | $ | 39,522 | |
Pension | | | 770 | | | | 746 | |
Withholding taxes on salary and statutory payables | | | 5,462 | | | | 4,464 | |
Other employee payables | | | — | | | | 82 | |
| | | | | | | | |
Total | | $ | 52,933 | | | $ | 44,814 | |
| | | | | | | | |
Non-current: | | | | | | | | |
Pension and other obligations | | $ | 10,680 | | | $ | 6,899 | |
| | | | | | | | |
Total | | $ | 10,680 | | | $ | 6,899 | |
| | | | | | | | |
Employee benefit costs consist of the following:
| | | | | | | | | | | | |
| | | Year ended March 31, | |
| | | 2017 | | | 2016 | | | 2015 | |
Salaries and bonus | | $ | 307,378 | | | $ | 272,017 | | | $ | 252,420 | |
Employee benefit plans: | | | | | | | | | | | | |
Defined contribution plan | | | 10,265 | | | | 7,458 | | | | 7,396 | |
Defined benefit plan | | | 2,639 | | | | 2,184 | | | | 1,874 | |
Share-based compensation expense (Refer note 22) | | | 23,036 | | | | 17,919 | | | | 9,499 | |
| | | | | | | | | | | | |
Total | | $ | 343,318 | | | $ | 299,578 | | | $ | 271,189 | |
| | | | | | | | | | | | |
Employee benefit costs is recognized in the following line items in the consolidated statement of income:
| | | | | | | | | | | | |
| | | Year ended March 31, | |
| | | 2017 | | | 2016 | | | 2015 | |
Cost of revenue | | $ | 249,701 | | | $ | 217,098 | | | $ | 199,766 | |
Selling and marketing expenses | | | 24,717 | | | | 22,336 | | | | 23,073 | |
General and administrative expenses | | | 68,900 | | | | 60,144 | | | | 48,350 | |
| | | | | | | | | | | | |
Total | | $ | 343,318 | | | $ | 299,578 | | | $ | 271,189 | |
| | | | | | | | | | | | |
Defined contribution plan
The Company’s contributions to defined contribution plans are as follows:
| | | | | | | | | | | | |
| | | Year ended March 31, | |
| | | 2017 | | | 2016 | | | 2015 | |
India | | $ | 7,587 | | | $ | 5,173 | | | $ | 5,115 | |
Philippines | | | 106 | | | | 83 | | | | 63 | |
South Africa | | | 715 | | | | 617 | | | | 518 | |
Sri Lanka | | | 661 | | | | 612 | | | | 577 | |
United Kingdom | | | 780 | | | | 681 | | | | 831 | |
United States | | | 416 | | | | 292 | | | | 292 | |
| | | | | | | | | | | | |
Total | | | 10,265 | | | | 7,458 | | | | 7,396 | |
| | | | | | | | | | | | |
F-52
WNS (HOLDINGS) LIMITED
NOTES TO CONSOLIDATED FINANCIAL STATEMENTS
(Amounts in thousands, except share and per share data)
Defined benefit plan
The net periodic cost recognized by the Company in respect of gratuity payments under the Company’s gratuity plans covering eligible employees of the Company in India, the Philippines and Sri Lanka is as follows:
| | | | | | | | | | | | |
| | | Year ended March 31, | |
| | | 2017 | | | 2016 | | | 2015 | |
Service cost | | $ | 2,188 | | | $ | 1,765 | | | $ | 1,351 | |
Interest on the net defined benefit liability | | | 451 | | | | 419 | | | | 523 | |
| | | | | | | | | | | | |
Net gratuity cost | | $ | 2,639 | | | $ | 2,184 | | | $ | 1,874 | |
| | | | | | | | | | | | |
| | | | | | | | |
| | | As at | |
| | | March
2017 | | | March
2016 | |
Change in projected benefit obligations | | | | | | | | |
Obligation at beginning of the year | | $ | 8,450 | | | $ | 7,322 | |
Foreign currency translation | | | (30 | ) | | | (404 | ) |
Service cost | | | 2,188 | | | | 1,765 | |
Interest cost | | | 513 | | | | 475 | |
Business combinations | | | 95 | | | | — | |
Benefits paid | | | (1,283 | ) | | | (871 | ) |
Actuarial (gain)/loss | | | | | | | | |
From changes in demographic assumptions | | | 463 | | | | (75 | ) |
From changes in financial assumptions | | | (126 | ) | | | 166 | |
From actual experience compared to assumptions | | | 1,506 | | | | 72 | |
| | | | | | | | |
Benefit obligation at end of the year | | $ | 11,776 | | | $ | 8,450 | |
| | | | | | | | |
Change in plan assets | | | | | | | | |
Plan assets at beginning of the year | | $ | 849 | | | $ | 756 | |
Foreign currency translation | | | 22 | | | | (42 | ) |
Expected return on plan assets | | | 62 | | | | 56 | |
Actuarial gain | | | 39 | | | | 33 | |
Actual contributions | | | 1,148 | | | | 881 | |
Benefits paid | | | (1,144 | ) | | | (835 | ) |
| | | | | | | | |
Plan assets at end of the year | | $ | 976 | | | $ | 849 | |
| | | | | | | | |
Accrued pension liability | | | | | | | | |
Current | | $ | 770 | | | $ | 746 | |
Non-current | | | 10,030 | | | | 6,856 | |
| | | | | | | | |
Net amount recognized | | $ | 10,800 | | | $ | 7,602 | |
| | | | | | | | |
Present value of funded defined benefit obligation | | $ | 8,766 | | | $ | 5,770 | |
Fair value of plan assets | | | (976 | ) | | | (849 | ) |
| | | | | | | | |
| | | 7,790 | | | | 4,921 | |
| | | | | | | | |
Present value of unfunded defined benefit obligation | | $ | 3,010 | | | $ | 2,681 | |
| | | | | | | | |
Weighted average duration of defined benefit obligation (both funded and unfunded) | | | 8.30 years | | | | 8.17 years | |
Net amount recognized relating to the Company’s India plan, Philippines plan and Sri Lanka plan was $7,973, $2,341 and $486 as at March 31, 2017 and $4,924, $2,294 and $384 as at March 31, 2016, respectively.
F-53
WNS (HOLDINGS) LIMITED
NOTES TO CONSOLIDATED FINANCIAL STATEMENTS
(Amounts in thousands, except share and per share data)
The assumptions used in accounting for the gratuity plans are as follows:
| | | | | | | | | | | | |
| | | Year ended March 31, | |
| | | 2017 | | | 2016 | | | 2015 | |
Discount rate: | | | | | | | | | | | | |
India | | | 7.05% | | | | 7.35% | | | | 8.00% | |
Philippines | | | 5.45% | | | | 4.75% | | | | 5.03% | |
Sri Lanka | | | 12.8% | | | | 12.30% | | | | 9.85% | |
Rate of increase in compensation level | | | 7% to 15% | | | | 6% to 8% | | | | 6% to 8% | |
Expected rate of return on plan assets | | | 7.05% | | | | 7.35% | | | | 8.00% | |
The Company evaluates these assumptions annually based on its long-term plans of growth and industry standards. The discount rates are based on current market yields on government securities adjusted for a suitable risk premium to reflect the additional risk for high quality corporate bonds.
As at March 31, 2017, for each of the Company’s defined benefit plans, the sensitivity of the defined benefit obligation to a change in each significant actuarial assumption is as follows:
| | | | | | | | | | | | |
| | | India | | | Philippines | | | Sri Lanka | |
Discount rate: | | | | | | | | | | | | |
Increase in discount rate by 1% | | | (4.1 | )% | | | (19.8 | )% | | | (6.1 | )% |
Decrease in discount rate by 1% | | | 4.9 | % | | | 25.6 | % | | | 6.9 | % |
Rate of increase in compensation level: | | | | | | | | | | | | |
Increase in salary escalation rate by 1% | | | 3.6 | % | | | 24.3 | % | | | 6.6 | % |
Decrease in salary escalation rate by 1% | | | (3.4 | )% | | | (19.3 | )% | | | (5.8 | )% |
Each sensitivity amount is calculated assuming that all other assumptions are held constant. The Company is not able to predict the extent of likely future changes in these assumptions, but based on past experience, the discount rate for each plan could change by up to 1% within a 12 month period.
As at March 31, 2017, $4 and $973 ($3 and $846 as at March 31, 2016) of the fund assets are invested with LIC and ALICPL, respectively. Of the funds invested with LIC, approximately 40% and 60% of the funds are invested in unquoted government securities and money market instruments, respectively. Of the funds invested with ALICPL, approximately 58% and 42% are invested in unquoted government securities and money market instruments, respectively. Since the Company’s plan assets are managed by third party fund administrators, the contributions made by the Company are pooled with the corpus of the funds managed by such fund administrators and invested in accordance with regulatory guidelines. The Company’s funding policy is to contribute to the Plan amounts necessary on an actuarial basis to, at a minimum, satisfy the minimum funding requirements. Additional discretionary contributions above the minimum funding requirement can be made and are generally based on adjustment for any over or under funding.
The expected benefits are based on the same assumptions used to measure the Company’s defined benefit obligations as at March 31, 2017. The Company expects to contribute $1,648 for the year ending March 31, 2018. The maturity analysis of the Company’s defined benefit payments is as follows:
| | | | |
| | | Amount | |
2018 | | $ | 1,746 | |
2019 | | | 1,772 | |
2020 | | | 1,823 | |
2021 | | | 1,922 | |
2022 | | | 2,077 | |
Thereafter | | | 9,437 | |
| | | | |
| | $ | 18,777 | |
| | | | |
F-54
WNS (HOLDINGS) LIMITED
NOTES TO CONSOLIDATED FINANCIAL STATEMENTS
(Amounts in thousands, except share and per share data)
15. Provisions and accrued expenses
Provisions and accrued expenses consist of the following:
| | | | | | | | |
| | | As at | |
| | | March 31,
2017 | | | March 31,
2016 | |
Provisions | | $ | — | | | $ | — | |
Accrued expenses | | | 27,217 | | | | 24,741 | |
| | | | | | | | |
Total | | $ | 27,217 | | | $ | 24,741 | |
| | | | | | | | |
A summary of activity for provisions is as follows:
| | | | | | | | |
| | | As at | |
| | | March 31,
2017 | | | March 31,
2016 | |
Balance at the beginning of the year | | $ | — | | | $ | 753 | |
Additional provision | | | — | | | | — | |
Provision used | | | — | | | | (751 | ) |
Translation adjustments | | | — | | | | (2 | ) |
| | | | | | | | |
Balance at the end of the year | | $ | — | | | $ | — | |
| | | | | | | | |
16. Deferred revenue
Deferred revenue consists of the following:
| | | | | | | | |
| | | As at | |
| | | March 31,
2017 | | | March 31,
2016 | |
Current: | | | | | | | | |
Payments in advance of services | | $ | 717 | | | $ | 685 | |
Advance billings | | | 4,014 | | | | 1,706 | |
Others | | | 747 | | | | 533 | |
| | | | | | | | |
Total | | $ | 5,478 | | | $ | 2,924 | |
| | | | | | | | |
| |
| | | As at | |
| | | March 31,
2017 | | | March 31,
2016 | |
Non-current: | | | | | | | | |
Payments in advance of services | | $ | 359 | | | $ | 238 | |
Others | | | 19 | | | | 18 | |
| | | | | | | | |
Total | | $ | 378 | | | $ | 256 | |
| | | | | | | | |
F-55
WNS (HOLDINGS) LIMITED
NOTES TO CONSOLIDATED FINANCIAL STATEMENTS
(Amounts in thousands, except share and per share data)
17. Other liabilities
Other liabilities consist of the following:
| | | | | | | | |
| | | As at | |
| | | March 31,
2017 | | | March 31,
2016 | |
Current: | | | | | | | | |
Withholding taxes and value added tax payables | | $ | 5,356 | | | $ | 3,801 | |
Contingent consideration (Refer note 4(a), 4(b) and 4(c)) | | | 8,252 | | | | — | |
Deferred rent | | | 677 | | | | 547 | |
Other liabilities | | | 1,730 | | | | 1,637 | |
| | | | | | | | |
Total | | $ | 16,015 | | | $ | 5,985 | |
| | | | | | | | |
Non-current: | | | | | | | | |
Deferred rent | | $ | 5,292 | | | $ | 4,162 | |
Contingent consideration (Refer note 4(a), 4(b) and 4(c)) | | | 11,426 | | | | — | |
Other liabilities | | | 1,751 | | | | 374 | |
| | | | | | | | |
Total | | $ | 18,469 | | | $ | 4,536 | |
| | | | | | | | |
18. Share capital
As at March 31, 2017, the authorized share capital was £6,100 divided into 60,000,000 ordinary shares of 10 pence each and 1,000,000 preferred shares of 10 pence each. The Company had 50,012,559 ordinary shares (excluding 3,300,000 treasury shares) outstanding as at March 31, 2017. There were no preferred shares outstanding as at March 31, 2017.
As at March 31, 2016, the authorized share capital was £6,100 divided into 60,000,000 ordinary shares of 10 pence each and 1,000,000 preferred shares of 10 pence each. The Company had 51,306,304 ordinary shares (excluding 1,100,000 treasury shares) outstanding as at March 31, 2016. There were no preferred shares outstanding as at March 31, 2016.
Treasury shares
| (i) | On March 16, 2016, the Company’s shareholders authorized a share repurchase program for the repurchase of up to 3.3 million of the Company’s American Depositary Shares (ADSs), each representing one ordinary share, at a price range of $10 to $50 per ADS. Pursuant to the terms of the repurchase program, the Company’s ADSs may be purchased in the open market from time to time for 36 months from March 16, 2016, the date of shareholders’ approval. The Company is not obligated under the repurchase program to repurchase a specific number of ADSs, and the repurchase program may be suspended at any time at the Company’s discretion. |
During the year ended March 31, 2017, the Company purchased 2,200,000 ADSs in the open market for a total consideration of $64,224 (including transaction costs of $33 for share repurchase of 2,200,000 ADS, $111 paid towards cancellation fees for ADSs in relation to share repurchase of 2,200,000 ADSs which was completed during the year ended March 31, 2017, and $55 paid towards cancellation fees for ADSs in relation to share repurchase of 1,100,000 ADSs, which was completed during the year ended March 31, 2016). The shares underlying these purchased ADSs are recorded as treasury shares.
| (ii) | In March 2015, the Company’s shareholders authorized a share repurchase program for the repurchase of up to 1,100,000 of the Company’s ADSs, each representing one ordinary share, at a price range of $10 to $30 per ADS. |
During the year ended March 31, 2016, the Company completed the repurchase of 1,100,000 ADSs in the open market for a total consideration of $30,461 (including transaction cost of $50 for share repurchase of 1,100,000 ADS). The shares underlying these purchased ADSs are recorded as treasury shares.
F-56
WNS (HOLDINGS) LIMITED
NOTES TO CONSOLIDATED FINANCIAL STATEMENTS
(Amounts in thousands, except share and per share data)
19. Expenses by nature
Expenses by nature consist of the following:
| | | | | | | | | | | | |
| | | Year ended March 31, | |
| | | 2017 | | | 2016 | | | 2015 | |
Employee cost | | $ | 343,318 | | | $ | 299,578 | | | $ | 271,189 | |
Repair payments | | | 24,102 | | | | 31,170 | | | | 30,877 | |
Facilities cost | | | 75,383 | | | | 67,689 | | | | 70,801 | |
Depreciation | | | 16,903 | | | | 15,435 | | | | 14,387 | |
Legal and professional expenses | | | 15,902 | | | | 13,227 | | | | 13,108 | |
Travel expenses | | | 18,563 | | | | 17,972 | | | | 15,806 | |
Others | | | 33,526 | | | | 30,035 | | | | 27,633 | |
| | | | | | | | | | | | |
Total cost of revenue, selling and marketing and general and administrative expenses | | $ | 527,697 | | | $ | 475,106 | | | $ | 443,801 | |
| | | | | | | | | | | | |
20. Finance expense
Finance expense consists of the following:
| | | | | | | | | | | | |
| | | Year ended March 31, | |
| | | 2017 | | | 2016 | | | 2015 | |
Interest expense | | $ | 424 | | | $ | 265 | | | $ | 1,251 | |
Interest rate swaps | | | 71 | | | | — | | | | — | |
Debt issue cost | | | 52 | | | | 13 | | | | 81 | |
| | | | | | | | | | | | |
Total | | $ | 547 | | | $ | 278 | | | $ | 1,332 | |
| | | | | | | | | | | | |
21. Other income, net
Other income, net consists of the following:
| | | | | | | | | | | | |
| | | Year ended March 31, | |
| | | 2017 | | | 2016 | | | 2015 | |
Interest income | | $ | 2,083 | | | $ | 1,197 | | | $ | 389 | |
Dividend income | | | 4,131 | | | | 5,039 | | | | 4,396 | |
Net gain arising on financial assets designated as FVTPL | | | 6 | | | | 41 | | | | 4,553 | |
Others, net | | | 2,469 | | | | 2,217 | | | | 2,574 | |
| | | | | | | | | | | | |
Total | | $ | 8,689 | | | $ | 8,494 | | | $ | 11,912 | |
| | | | | | | | | | | | |
F-57
WNS (HOLDINGS) LIMITED
NOTES TO CONSOLIDATED FINANCIAL STATEMENTS
(Amounts in thousands, except share and per share data)
22. Share-based payments
The Company has three share-based incentive plans: the 2002 Stock Incentive Plan adopted on July 1, 2002 (which has expired), the 2006 Incentive Award Plan adopted on June 1, 2006, as amended and restated in February 2009, September 2011 and September 2013 (which has expired), and the 2016 Incentive Award Plan effective from September 27, 2016 (collectively referred to as the “Plans”). Under the Plans, share-based options and RSUs may be granted to eligible participants. Options and RSUs are generally granted for a term of ten years and have a graded vesting period of up to three years. The Company settles employee share-based option exercises with newly issued ordinary shares. As at March 31, 2017, the Company had 3,559,498 ordinary shares available for future grants.
Share-based compensation expense during the years ended March 31, 2017, 2016 and 2015 are as follows:
| | | | | | | | | | | | |
| | | Year ended March 31, | |
| | | 2017 | | | 2016 | | | 2015 | |
Share-based compensation expense recorded in | | $ | | | | $ | | | | $ | | |
Cost of revenue | | | 2,765 | | | | 1,923 | | | | 856 | |
Selling and marketing expenses | | | 1,723 | | | | 1,370 | | | | 779 | |
General and administrative expenses | | | 18,548 | | | | 14,626 | | | | 7,864 | |
| | | | | | | | | | | | |
Total share-based compensation expense | | $ | 23,036 | | | $ | 17,919 | | | $ | 9,499 | |
| | | | | | | | | | | | |
Upon exercise of share options and RSUs, the Company issued 906,255; 455,642; and 603,124 shares during the years ended March 31, 2017, 2016 and 2015, respectively.
F-58
WNS (HOLDINGS) LIMITED
NOTES TO CONSOLIDATED FINANCIAL STATEMENTS
(Amounts in thousands, except share and per share data)
Share-based options
Movements in the number of options outstanding under the 2006 Incentive Award Plan and their related weighted average exercise prices are as follow:
| | | | | | | | | | | | | | | | |
| | | Shares | | | Weighted
average
exercise
price | | | Weighted
average
remaining
contract term
(in years) | | | Aggregate
intrinsic
value | |
Outstanding as at March 31, 2015 | | | 816,286 | | | $ | 22.80 | | | | 1.53 | | | $ | 2,407 | |
Exercised | | | (76,667 | ) | | | 10.50 | | | | | | | | | |
Lapsed | | | (1 | ) | | | 5.65 | | | | | | | | | |
| | | | | | | | | | | | | | | | |
Outstanding as at March 31, 2016 | | | 739,618 | | | $ | 23.34 | | | | 0.54 | | | $ | 5,419 | |
| | | | | | | | | | | | | | | | |
Exercised | | | (425,941 | ) | | | 10.52 | | | | | | | | | |
Lapsed | | | (196,498 | ) | | | 13.44 | | | | | | | | | |
| | | | | | | | | | | | | | | | |
Outstanding as at March 31, 2017 | | | 117,179 | | | | 27.25 | | | | 0.10 | | | | 163 | |
Options exercisable | | | 117,179 | | | $ | 27.25 | | | | 0.10 | | | $ | 163 | |
The aggregate intrinsic value of options exercised during the year ended March 31, 2017, 2016 and 2015 was $2,697, $856 and $306, respectively. The total grant date fair value of options vested during the year ended March 31, 2017, 2016 and 2015 was $Nil for each year. Total cash received as a result of options exercised during the year ended March 31, 2017, 2016 and 2015 was $8,941, $1,302 and $535, respectively.
The fair value of options granted is estimated on the date of grant using the Black-Scholes-Merton option-pricing model. No options were granted during the years ended March 31, 2017, 2016 and 2015.
The weighted average share price of options exercised during the year ended March 31, 2017, 2016 and 2015 was $27.46, $28.19 and $21.13 respectively. The options outstanding at March 31, 2017 had an exercise price per option in the range of $15.68 to $29.21 (March 31, 2016: $15.68 to $35.3) and a weighted average remaining contractual term of 0.10 years (March 31, 2016: 0.54 years)
Restricted Share Units
The 2006 Incentive Award Plan and the 2016 Incentive Award Plan also allow for grant of RSUs. Each RSU represents the right to receive one ordinary share and vests over a period of up to three years.
| (i) | Movements in the number of RSUs dependent onnon-market performance condition outstanding under the 2006 Incentive Award Plan and the 2016 Incentive Award Plan and their related weighted average fair values are as follow: |
| | | | | | | | | | | | | | | | |
| | | Shares | | | Weighted
average
fair value | | | Weighted
average
remaining
contract term
(in years) | | | Aggregate
intrinsic
value | |
Outstanding as at March 31, 2015 | | | 1,323,498 | | | $ | 15.37 | | | | 7.86 | | | $ | 32,187 | |
Granted | | | 592,348 | | | | 25.16 | | | | | | | | | |
Exercised | | | (360,900 | ) | | | 14.07 | | | | | | | | | |
Forfeited | | | (15,920 | ) | | | 21.41 | | | | | | | | | |
Lapsed | | | — | | | | — | | | | | | | | | |
| | | | | | | | | | | | | | | | |
Outstanding as at March 31, 2016 | | | 1,539,026 | | | $ | 19.38 | | | | 7.82 | | | $ | 47,156 | |
| | | | | | | | | | | | | | | | |
Granted | | | 516,264 | | | | 30.26 | | | | | | | | | |
Exercised | | | (343,623 | ) | | | 20.18 | | | | | | | | | |
Forfeited | | | (47,707 | ) | | | 25.50 | | | | | | | | | |
Lapsed | | | — | | | | — | | | | | | | | | |
| | | | | | | | | | | | | | | | |
Outstanding as at March 31, 2017 | | | 1,663,960 | | | | 22.41 | | | | 7.50 | | | | 47,606 | |
RSUs exercisable | | | 728,722 | | | $ | 17.72 | | | | 6.28 | | | $ | 20,849 | |
F-59
WNS (HOLDINGS) LIMITED
NOTES TO CONSOLIDATED FINANCIAL STATEMENTS
(Amounts in thousands, except share and per share data)
The fair value of RSUs is generally the market price of the Company’s shares on the date of grant. As at March 31, 2017, there was $7,522 of unrecognized compensation cost related to unvested RSUs. This amount is expected to be recognized over a weighted average period of 2.7 years. To the extent the actual forfeiture rate is different than what the Company has anticipated, share-based compensation expense related to these RSUs will be different from the Company’s expectations.
The weighted average grant date fair value of RSUs granted during the year ended March 31, 2017, 2016 and 2015 was $30.26, $25.16, and $19.19 per ADS, respectively. The aggregate intrinsic value of RSUs exercised during the year ended March 31, 2017, 2016 and 2015 was $9,991, $10,294 and $9,529, respectively. The total grant date fair value of RSUs vested during the year ended March 31, 2017, 2016 and 2015 was $14,631, $6,824 and $5,878, respectively.
The weighted average share price of RSU exercised during the year ended March 31, 2017, 2016 and 2015 was $29.08, $28.52 and $18.46, respectively.
| (ii) | The 2006 Incentive Award Plan and the 2016 Incentive Award Plan also allow for grant of RSUs based on the market price of the Company’s shares achieving a specified target over a period of time. The fair value of market-based share awards is determined using Monte-Carlo simulation. |
Movements in the number of RSUs dependent on market performance condition outstanding under the 2006 Incentive Award Plan and the 2016 Incentive Award Plan and their related weighted average fair values are as follows:
| | | | | | | | | | | | | | | | |
| | | Shares | | | Weighted
average
fair value | | | Weighted
average
remaining
contract term
(in years) | | | Aggregate
intrinsic
value | |
Outstanding as at March 31, 2015 | | | 70,551 | | | $ | 2.82 | | | | 9.09 | | | $ | 1,716 | |
Granted | | | 59,039 | | | | 6.37 | | | | | | | | | |
Exercised | | | — | | | | — | | | | | | | | | |
Forfeited | | | — | | | | — | | | | | | | | | |
Lapsed | | | — | | | | — | | | | | | | | | |
| | | | | | | | | | | | | | | | |
Outstanding as at March 31, 2016 | | | 129,590 | | | $ | 4.44 | | | | 8.53 | | | $ | 3,971 | |
| | | | | | | | | | | | | | | | |
Granted | | | 74,400 | | | | 12.56 | | | | | | | | | |
Exercised | | | — | | | | | | | | | | | | | |
Forfeited | | | — | | | | | | | | | | | | | |
Lapsed | | | — | | | | | | | | | | | | | |
| | | | | | | | | | | | | | | | |
Outstanding as at March 31, 2017 | | | 203,990 | | | | 13.21 | | | | 8.10 | | | | 5,836 | |
RSUs exercisable | | | — | | | $ | — | | | | — | | | $ | — | |
On March 15, 2017, the Company modified the vesting period in respect of the RSUs as below:
| a. | for RSUs granted in April 2014, the vesting date has been extended to the fifth anniversary of the grant date (i.e. April 2019) |
| b. | for RSUs granted in April 2015, the vesting date has been extended to the fourth anniversary of the grant date (i.e. April 2019) |
| c. | for RSUs granted in April 2016, the vesting date has been extended to the fourth anniversary of the grant date (i.e. April 2020) |
Subsequent vesting of RSUs for each of the remaining years would be subject to continued employment.
F-60
WNS (HOLDINGS) LIMITED
NOTES TO CONSOLIDATED FINANCIAL STATEMENTS
(Amounts in thousands, except share and per share data)
The incremental fair value was determined using Monte-Carlo simulation by reference to the difference between fair value of original RSUs as of modification date and the fair value of modified RSUs as of modification date. The additional cost as a result of such modification in respect of modified share awards amounted to $ 1,185. The additional cost is spread over the period from the modification date until the vesting date of the modified award, which differ from the vesting date of the original award. The incremental cost recognized in the current year in respect of such modified options amounted to $24.
As at March 31, 2017, there was $ 1,848 of unrecognized compensation cost related to unvested market based RSUs. This amount is expected to be recognized over a weighted average period of 2.2 years. The weighted average grant date fair value of the RSUs granted during the years ended March 31, 2017, 2016 and 2015 was $12.56, $6.37 and $2.82 per ADS, respectively.
Performance share units
The 2006 Incentive Award Plan and 2016 Incentive Award Plan also allow for grant of performance share units (“PSUs”). Each PSU represents the right to receive one ordinary share-based on the Company’s performance against specifiednon-market performance condition and vests over a period of three years.
Movements in the number of PSUs outstanding under the 2006 Incentive Award Plan and the 2016 Incentive Award Plan and their related weighted average fair values are as follow:
| | | | | | | | | | | | | | | | |
| | | Shares | | | Weighted
average
fair value | | | Weighted
average
remaining
contract term
(in years) | | | Aggregate
intrinsic
value | |
Outstanding as at March 31, 2015 | | | 559,570 | | | $ | 14.98 | | | | 8.16 | | | $ | 13,609 | |
Granted | | | 466,417 | | | | 20.12 | | | | | | | | | |
Exercised | | | (18,077 | ) | | | 9.54 | | | | | | | | | |
Forfeited | | | (56,322 | ) | | | 10.53 | | | | | | | | | |
| | | | | | | | | | | | | | | | |
Outstanding as at March 31, 2016 | | | 951,588 | | | $ | 17.83 | | | | 7.77 | | | $ | 29,157 | |
| | | | | | | | | | | | | | | | |
Granted | | | 422,062 | | | | 31.12 | | | | | | | | | |
Exercised | | | (141,741 | ) | | | 14.11 | | | | | | | | | |
Forfeited | | | (47,057 | ) | | | 26.27 | | | | | | | | | |
| | | | | | | | | | | | | | | | |
Outstanding as at March 31, 2017 | | | 1,184,852 | | | | 21.00 | | | | 7.36 | | | | 33,899 | |
PSUs exercisable | | | 308,173 | | | $ | 14.65 | | | | 6.02 | | | $ | 8,817 | |
The fair value of PSUs is generally the market price of the Company’s shares on the date of grant, and assumes that performance targets will be achieved. As at March 31, 2017, there was $10,793 of unrecognized compensation cost related to unvested PSUs, net of forfeitures. This amount is expected to be recognized over a weighted average period of 2.4 years. Over the performance period, the number of shares that will be issued will be adjusted upward or downward based upon the probability of achievement of the performance targets. The ultimate number of shares issued and the related compensation cost recognized as expense will be based on a comparison of the final performance metrics to the specified targets.
The weighted average grant date fair value of PSUs granted during the years ended March 31, 2017, 2016 and 2015 was $31.12, $20.12, and $19.02 per ADS, respectively. The aggregate intrinsic value of PSUs exercised during the year ended March 31, 2017, 2016 and 2015 was $4,237, $532 and $ 1,000, respectively. The total grant date fair value of PSUs vested during the year ended March 31, 2017, 2016 and 2015 was $6,280, $Nil and $388, respectively.
The weighted average share price of PSU exercised during the year ended March 31, 2017, 2016 and 2015 was $29.89, $29.45 and $21.23, respectively.
F-61
WNS (HOLDINGS) LIMITED
NOTES TO CONSOLIDATED FINANCIAL STATEMENTS
(Amounts in thousands, except share and per share data)
23. Income taxes
The domestic and foreign source component of profit / (loss) before income taxes is as follows:
| | | | | | | | | | | | |
| | | Year ended March 31, | |
| | | 2017 | | | 2016 | | | 2015 | |
Domestic | | $ | (5,342 | ) | | $ | (4,121 | ) | | $ | (3,351 | ) |
Foreign | | | 60,635 | | | | 85,181 | | | | 84,382 | |
| | | | | | | | | | | | |
Profit before income taxes | | $ | 55,293 | | | $ | 81,060 | | | $ | 81,031 | |
| | | | | | | | | | | | |
The Company’s provision for income taxes consists of the following:
| | | | | | | | | | | | |
| | | Year ended March 31, | |
| | | 2017 | | | 2016 | | | 2015 | |
Current taxes | | | | | | | | | | | | |
Domestic taxes | | $ | — | | | $ | — | | | $ | — | |
Foreign taxes | | | 25,785 | | | | 19,615 | | | | 16,914 | |
| | | | | | | | | | | | |
| | | 25,785 | | | | 19,615 | | | | 16,914 | |
| | | | | | | | | | | | |
Deferred taxes | | | | | | | | | | | | |
Domestic taxes | | | — | | | | — | | | | — | |
Foreign taxes | | | (8,255 | ) | | | 1,565 | | | | 5,503 | |
| | | | | | | | | | | | |
| | | (8,255 | ) | | | 1,565 | | | | 5,503 | |
| | | | | | | | | | | | |
| | | | | | | | | | | | |
| | | | | | | | | | | | |
Provision for income taxes | | $ | 17,530 | | | $ | 21,180 | | | $ | 22,417 | |
| | | | | | | | | | | | |
Domestic taxes are nil as the Company is subject to income tax in Jersey, Channel Islands at a rate of 0%. Foreign taxes are based on applicable tax rates in each subsidiary’s jurisdiction.
The Company has a delivery center located in Gurgaon, India registered under the Special Economic Zone (“SEZ”) scheme, and is eligible for 50% income tax exemption from fiscal 2013 to fiscal 2022. The Company in fiscal 2012 started operations in delivery centers in Pune, Mumbai and Chennai, India registered under the SEZ scheme which was eligible for 100% income tax exemption until fiscal 2016 and is eligible for a 50% income tax exemption from fiscal 2017 to fiscal 2026. During fiscal 2015, the Company started its operations in new delivery centers in Gurgaon and Pune, India registered under the SEZ scheme that are eligible for 100% income tax exemption until fiscal 2019, and 50% income tax exemption from fiscal 2020 to fiscal 2029. The Government of India pursuant to the Indian Finance Act, 2011 has also levied a minimum alternate tax (“MAT”) on the book profits earned by the SEZ units at the prevailing rate which is currently 21.34%. The Company’s operations in Costa Rica are eligible for a 100% income tax exemption until fiscal 2017 and 50% income tax exemption from fiscal 2018 to fiscal 2021. The Company’s operations in one of the units located in the Philippines were eligible for tax exemptions which expired in fiscal 2016. During fiscal 2013, the Company started operations in delivery center in Techno Plaza II, Manila which was eligible for tax exemption which expired in fiscal 2017. During fiscal 2016, the Company started its operations in new delivery center in the Philippines which is eligible for tax exemption until fiscal 2020. During fiscal 2017, the Company opened two additional delivery centers in Iloilo, Manila and Alabang, Philippines which are eligible for 100% tax exemption until fiscal 2021. The Government of Sri Lanka has exempted the profits earned from export revenue from tax, which enables the Company’s Sri Lankan subsidiary to continue to claim a tax exemption.
If the income tax exemption was not available, the additional income tax expense at the respective statutory rates in India, Sri Lanka and Philippines would have been approximately $5,171, $5,072 and $3,011 for the years ended March 31, 2017, 2016 and 2015, respectively. Such additional tax would have decreased the basic and diluted earnings per share for the year ended March 31, 2017 by $0.10 and $0.10, respectively ($0.10 and $0.09, respectively for the year ended March 31, 2016 and $0.06 and $0.06, respectively, for the year ended March 31, 2015).
F-62
WNS (HOLDINGS) LIMITED
NOTES TO CONSOLIDATED FINANCIAL STATEMENTS
(Amounts in thousands, except share and per share data)
Income taxes recognized directly in equity are as follows:
| | | | | | | | | | | | |
| | | Year ended March 31, | |
| | | 2017 | | | 2016 | | | 2015 | |
Current taxes: | | | | | | | | | | | | |
Excess tax deductions related to share-based payments | | | (270 | ) | | | (229 | ) | | | (99 | ) |
| | | | | | | | | | | | |
| | $ | (270 | ) | | $ | (229 | ) | | $ | (99 | ) |
| | | | | | | | | | | | |
Deferred taxes: | | | | | | | | | | | | |
Excess tax deductions related to share-based payments | | | 715 | | | | (688 | ) | | | (169 | ) |
| | | | | | | | | | | | |
| | $ | 715 | | | $ | (688 | ) | | $ | (169 | ) |
| | | | | | | | | | | | |
Total income tax recognized directly in equity | | $ | 445 | | | $ | (917 | ) | | $ | (268 | ) |
| | | | | | | | | | | | |
Income taxes recognized in other comprehensive income are as follows:
| | | | | | | | | | | | |
| | | Year ended March 31, | |
| | | 2017 | | | 2016 | | | 2015 | |
Current taxes | | | — | | | | — | | | | — | |
Deferred taxes: | | | | | | | | | | | | |
Unrealized gain/(loss) on cash flow hedging derivatives | | | 6,921 | | | | (4,259 | ) | | | 8,242 | |
| | | | | | | | | | | | |
Total income tax recognized directly in other comprehensive income | | $ | 6,921 | | | $ | (4,259 | ) | | $ | 8,242 | |
| | | | | | | | | | | | |
The reconciliation of estimated income tax to provision for income taxes:
| | | | | | | | | | | | |
| | | Year ended March 31, | |
| | | 2017 | | | 2016 | | | 2015 | |
Profit before income taxes | | $ | 55,293 | | | $ | 81,060 | | | $ | 81,031 | |
Income tax expense at tax rates applicable to individual entities | | | 21,765 | | | | 28,067 | | | | 26,749 | |
Effect of: | | | | | | | | | | | | |
Items not deductible for tax | | | 455 | | | | 771 | | | | 228 | |
Exempt income | | | (7,706 | ) | | | (6,845 | ) | | | (5,228 | ) |
Non tax deductible goodwill impairment | | | 4,335 | | | | — | | | | — | |
(Gain)/Loss in respect of which deferred tax (liability)/asset not recognized due to uncertainty and ineligibility to carry forward | | | (105 | ) | | | 259 | | | | 318 | |
Recognition of unutilized tax benefits / Unrecognized losses utilized | | | (1,220 | ) | | | (294 | ) | | | — | |
Temporary difference that will reverse during tax holiday period | | | 1,580 | | | | 30 | | | | 1,175 | |
Change in tax rate and law | | | 78 | | | | (152 | ) | | | 268 | |
Provision for uncertain tax position | | | (1,499 | ) | | | 2 | | | | (345 | ) |
State taxes | | | 14 | | | | 12 | | | | 17 | |
Others, net | | | (167 | ) | | | (670 | ) | | | (765 | ) |
| | | | | | | | | | | | |
Provision for income taxes | | $ | 17,530 | | | $ | 21,180 | | | $ | 22,417 | |
| | | | | | | | | | | | |
F-63
WNS (HOLDINGS) LIMITED
NOTES TO CONSOLIDATED FINANCIAL STATEMENTS
(Amounts in thousands, except share and per share data)
Deferred taxes for the year ended March 31, 2017 arising from temporary differences and unused tax losses can be summarized below:
| | | | | | | | | | | | | | | | | | | | | | | | | | | | |
| | | Opening
balance | | | Additions
due to
acquisition
during the
year | | | Recognized
in
statement of
income | | | Recognized
in equity | | | Recognized in/
Reclassified
from other
comprehensive
income | | | Foreign
currency
translation | | | Closing
balance | |
Deferred tax assets: | | | | | | | | |
Property and equipment | | $ | 5,512 | | | $ | (873 | ) | | $ | 932 | | | $ | — | | | $ | — | | | $ | 77 | | | $ | 5,648 | |
Net operating loss carry forward | | | 3,684 | | | | — | | | | 2,026 | | | | — | | | | — | | | | 12 | | | | 5,722 | |
Accruals deductible on actual payment | | | 5,352 | | | | 70 | | | | (1 | ) | | | — | | | | — | | | | 220 | | | | 5,641 | |
Share-based compensation expense | | | 11,008 | | | | — | | | | 1,781 | | | | (715 | ) | | | — | | | | 190 | | | | 12,264 | |
Minimum alternate tax | | | 68 | | | | — | | | | 96 | | | | — | | | | — | | | | 3 | | | | 167 | |
Others | | | 362 | | | | — | | | | 679 | | | | — | | | | — | | | | (66 | ) | | | 975 | |
| | | | | | | | | | | | | | | | | | | | | | | | | | | | |
Total deferred tax assets | | $ | 25,986 | | | $ | (803 | ) | | $ | 5,513 | | | $ | (715 | ) | | $ | | | | $ | 436 | | | $ | 30,417 | |
Deferred tax liabilities: | | | | | | | | |
Intangibles | | | (712 | ) | | | 24,577 | | | | (2,769 | ) | | | — | | | | — | | | | 27 | | | | 21,123 | |
Unrealized gain/(loss) on cash flow hedging and investments | | | 4,857 | | | | — | | | | 27 | | | | — | | | | 6,921 | | | | 489 | | | | 12,294 | |
Others | | | 1,108 | | | | — | | | | | | | | — | | | | — | | | | 5 | | | | 1,113 | |
| | | | | | | | | | | | | | | | | | | | | | | | | | | | |
Total deferred tax liabilities | | $ | 5,253 | | | $ | 24,577 | | | $ | (2,742 | ) | | $ | — | | | $ | 6,921 | | | $ | 521 | | | $ | 34,530 | |
| | | | | | | | | | | | | | | | | | | | | | | | | | | | |
Net deferred tax assets/(liabilities) | | $ | 20,733 | | | $ | (25,380 | ) | | $ | 8,255 | | | $ | (715 | ) | | $ | (6,921 | ) | | $ | (85 | ) | | $ | (4,113 | ) |
| | | | | | | | | | | | | | | | | | | | | | | | | | | | |
F-64
WNS (HOLDINGS) LIMITED
NOTES TO CONSOLIDATED FINANCIAL STATEMENTS
(Amounts in thousands, except share and per share data)
Deferred taxes for the year ended March 31, 2016 arising from temporary differences and unused tax losses can be summarized below:
| | | | | | | | | | | | | | | | | | | | | | | | | | | | |
| | | Opening
balance | | | Additions
due to
acquisition
during the
year | | | Recognized
in
statement of
income | | | Recognized
in equity | | | Recognized in/
Reclassified
from other
comprehensive
income | | | Foreign
currency
translation | | | Closing
balance | |
Deferred tax assets: | | | | | | | | |
Property and equipment | | $ | 6,538 | | | $ | — | | | $ | (724 | ) | | $ | — | | | $ | — | | | $ | (302 | ) | | $ | 5,512 | |
Net operating loss carry forward | | | 4,304 | | | | — | | | | (448 | ) | | | — | | | | — | | | | (172 | ) | | | 3,684 | |
Accruals deductible on actual payment | | | 4,201 | | | | — | | | | 1,443 | | | | — | | | | — | | | | (292 | ) | | | 5,352 | |
Share-based compensation expense | | | 6,110 | | | | — | | | | 4,480 | | | | 688 | | | | — | | | | (270 | ) | | | 11,008 | |
Minimum alternate tax | | | 8,327 | | | | — | | | | (7,941 | ) | | | | | | | — | | | | (318 | ) | | | 68 | |
Others | | | 1,444 | | | | — | | | | (1,179 | ) | | | | | | | — | | | | 97 | | | | 362 | |
| | | | | | | | | | | | | | | | | | | | | | | | | | | | |
Total deferred tax assets | | $ | 30,924 | | | $ | — | | | $ | (4,369 | ) | | $ | 688 | | | $ | — | | | $ | (1,257 | ) | | $ | 25,986 | |
| | | | | | | | | | | | | | | | | | | | | | | | | | | | |
Deferred tax liabilities: | | | | | | | | | | | | | | | | | | | | | | | | | | | | |
Intangibles | | | 2,045 | | | | 837 | | | | (3,477 | ) | | | — | | | | — | | | | (118 | ) | | | (712 | ) |
Unrealized gain/(loss) on cash flow hedging and investments | | | 9,821 | | | | — | | | | (436 | ) | | | | | | | (4,259 | ) | | | (269 | ) | | | 4,857 | |
Others | | | — | | | | — | | | | 1,108 | | | | — | | | | | | | | — | | | | 1,108 | |
| | | | | | | | | | | | | | | | | | | | | | | | | | | | |
Total deferred tax liabilities | | $ | 11,866 | | | $ | 837 | | | $ | (2,804 | ) | | $ | — | | | $ | (4,259 | ) | | $ | (387 | ) | | $ | 5,253 | |
| | | | | | | | | | | | | | | | | | | | | | | | | | | | |
| | | | | | | | | | | | | | | | | | | | | | | | | | | | |
| | | | | | | | | | | | | | | | | | | | | | | | | | | | |
Net deferred tax assets/(liabilities) | | $ | 19,058 | | | $ | (837 | ) | | $ | (1,565 | ) | | $ | 688 | | | $ | 4,259 | | | $ | (870 | ) | | $ | 20,733 | |
| | | | | | | | | | | | | | | | | | | | | | | | | | | | |
F-65
WNS (HOLDINGS) LIMITED
NOTES TO CONSOLIDATED FINANCIAL STATEMENTS
(Amounts in thousands, except share and per share data)
Deferred taxes for the year ended March 31, 2015 arising from temporary differences and unused tax losses can be summarized below:
| | | | | | | | | | | | | | | | | | | | | | | | | | | | |
| | | Opening
balance | | | Additions
due to
acquisition
during the
year | | | Recognized
in
statement of
income | | | Recognized
in equity | | | Recognized in/
Reclassified
from other
comprehensive
income | | | Foreign
currency
translation | | | Closing
balance | |
Deferred tax assets: | | | | | | | | |
Property and equipment | | $ | 8,280 | | | $ | — | | | $ | (1,386 | ) | | $ | — | | | $ | — | | | $ | (356 | ) | | $ | 6,538 | |
Net operating loss carry forward | | | 4,363 | | | | — | | | | 246 | | | | — | | | | — | | | | (305 | ) | | | 4,304 | |
Accruals deductible on actual payment | | | 3,720 | | | | — | | | | 639 | | | | — | | | | — | | | | (158 | ) | | | 4,201 | |
Share-based compensation expense | | | 5,356 | | | | — | | | | 803 | | | | 169 | | | | — | | | | (218 | ) | | | 6,110 | |
Minimum alternate tax | | | 15,289 | | | | — | | | | (6,405 | ) | | | | | | | — | | | | (557 | ) | | | 8,327 | |
Others | | | 1,710 | | | | — | | | | (160 | ) | | | | | | | — | | | | (106 | ) | | | 1,444 | |
| | | | | | | | | | | | | | | | | | | | | | | | | | | | |
Total deferred tax assets | | $ | 38,718 | | | $ | — | | | $ | (6,263 | ) | | $ | 169 | | | $ | — | | | $ | (1,700 | ) | | $ | 30,924 | |
| | | | | | | | | | | | | | | | | | | | | | | | | | | | |
Deferred tax liabilities: | | | | | | | | | | | | | | | | | | | | | | | | | | | | |
Intangibles | | | 4,886 | | | | — | | | | (2,751 | ) | | | — | | | | — | | | | (90 | ) | | | 2,045 | |
Unrealized gain/(loss) on cash flow hedging and investments | | | (285 | ) | | | — | | | | 1,991 | | | | — | | | | 8,242 | | | | (127 | ) | | | 9,821 | |
| | | | | | | | | | | | | | | | | | | | | | | | | | | | |
Total deferred tax liabilities | | $ | 4,601 | | | $ | — | | | $ | (760 | ) | | $ | — | | | $ | 8,242 | | | $ | (217 | ) | | $ | 11,866 | |
| | | | | | | | | | | | | | | | | | | | | | | | | | | | |
| | | | | | | | | | | | | | | | | | | | | | | | | | | | |
| | | | | | | | | | | | | | | | | | | | | | | | | | | | |
Net deferred tax assets/(liabilities) | | $ | 34,117 | | | $ | — | | | $ | (5,503 | ) | | $ | 169 | | | $ | (8,242 | ) | | $ | (1,483 | ) | | $ | 19,058 | |
| | | | | | | | | | | | | | | | | | | | | | | | | | | | |
F-66
WNS (HOLDINGS) LIMITED
NOTES TO CONSOLIDATED FINANCIAL STATEMENTS
(Amounts in thousands, except share and per share data)
Deferred tax presented in the statement of financial position is as follows:
| | | | | | | | |
| | | As at | |
| | | March 31,
2017 | | | March 31,
2016 | |
Deferred tax assets | | | 16,687 | | | | 22,522 | |
Deferred tax liabilities | | | (20,800 | ) | | | (1,789 | ) |
| | | | | | | | |
Net deferred tax assets | | $ | (4,113 | ) | | $ | 20,733 | |
| | | | | | | | |
There are unused tax losses amounting to $21,976 as at March 31, 2017 for which no deferred tax asset has been recognized as these losses relate to a tax jurisdiction where the group entity has had past losses and there is no conclusive evidence to support the view that sufficient taxable profit will be generated by such group entity in the future to offset such losses. The expiry dates of the tax benefit for these losses depend on the local tax laws of the jurisdiction and, if not utilized, would expire on various dates starting from financial year 2018 to 2022.
Deferred income tax liabilities on earnings of Company’s subsidiaries have not been provided as such earnings are deemed to be permanently reinvested in the business and the Company is able to control the timing of the reversals of temporary differences associated with these investments. Accordingly, temporary difference on which deferred tax liability has not been recognized amounts to $401,857, $301,043 and $233,214 as at March 31, 2017, 2016 and 2015, respectively.
F-67
WNS (HOLDINGS) LIMITED
NOTES TO CONSOLIDATED FINANCIAL STATEMENTS
(Amounts in thousands, except share and per share data)
From time to time, the Company receives orders of assessment from the Indian tax authorities assessing additional taxable income on the Company and/or its subsidiaries in connection with their review of their tax returns. The Company currently has orders of assessment outstanding for various years through fiscal 2013, which assess additional taxable income that could in the aggregate give rise to an estimated $37,085 in additional taxes, including interest of $13,744. These orders of assessment allege that the transfer prices the Company applied to certain of the international transactions between WNS Global and its other wholly-owned subsidiaries were not on arm’s length terms, disallow a tax holiday benefit claimed by the Company, deny the set off of brought forward business losses and unabsorbed depreciation and disallow certain expenses claimed as tax deductible by WNS Global. The Company has appealed against these orders of assessment before higher appellate authorities.
In addition, the Company has orders of assessment pertaining to similar issues that have been decided in favor of the Company by first level appellate authorities, vacating the tax demands of $44,573 in additional taxes, including interest of $13,740. The income tax authorities have filed appeals against these orders at higher appellate authorities.
Uncertain tax positions are reflected at the amount likely to be paid to the taxation authorities. A liability is recognized in connection with each item that is not probable of being sustained on examination by taxing authority. The liability is measured using single best estimate of the most likely outcome for each position taken in the tax return. Thus the provision would be the aggregate liability in connection with all uncertain tax positions. As of March 31, 2017, the Company has provided a tax reserve of $12,432 primarily on account of the Indian tax authorities’ denying the set off of brought forward business losses and unabsorbed depreciation.
As at March 31, 2017, corporate tax returns for years ended March 31, 2014 (for certain legal entities) and onward remain subject to examination by tax authorities in India.
Based on the facts of these cases, the nature of the tax authorities’ disallowances and the orders from first level appellate authorities deciding similar issues in favor of the Company in respect of assessment orders for earlier fiscal years and after consultation with the Company’s external tax advisors, the Company believe these orders are unlikely to be sustained at the higher appellate authorities. The Company has deposited $12,031 of the disputed amounts with the tax authorities and may be required to deposit the remaining portion of the disputed amounts with the tax authorities pending final resolution of the respective matters.
Others
On March 21, 2009, the Company received an assessment order from the Indian service tax authority, demanding payment of $5,368 of service tax and related penalty for the period from March 1, 2003 to January 31, 2005. The assessment order alleges that service tax is payable in India on BPM services provided by the Company to clients based abroad as the export proceeds are repatriated outside India by the Company. In response to the appeal filed by the Company with appellate tribunal against the assessment order in April 2009, the appellate tribunal has remanded the matter back to lower tax authorities to be adjudicated afresh. After consultation with Indian tax advisors, the Company believes this order of assessment is more likely than not to be upheld in favor of the Company. The Company intends to continue to vigorously dispute the assessment.
F-68
WNS (HOLDINGS) LIMITED
NOTES TO CONSOLIDATED FINANCIAL STATEMENTS
(Amounts in thousands, except share and per share data)
24. Earnings per share
The following table sets forth the computation of basic and diluted earnings per share:
| | | | | | | | | | | | |
| | | Year ended March 31, | |
| | | 2017 | | | 2016 | | | 2015 | |
Numerator: | | | | | | | | | | | | |
Profit | | $ | 37,763 | | | $ | 59,880 | | | $ | 58,614 | |
Denominator: | | | | | | | | | | | | |
Basic weighted average ordinary shares outstanding | | | 50,582,852 | | | | 51,372,117 | | | | 51,633,516 | |
Dilutive impact of equivalent stock options and RSUs | | | 2,357,456 | | | | 2,267,553 | | | | 1,795,465 | |
Diluted weighted average ordinary shares outstanding | | | 52,940,308 | | | | 53,639,670 | | | | 53,428,981 | |
The computation of earnings per ordinary share (“EPS”) was determined by dividing profit by the weighted average ordinary shares outstanding during the respective periods.
The Company excludes options with exercise prices that are greater than the average market price from the calculation of diluted EPS because their effect would be anti-dilutive. In the years ended March 31, 2017, 2016 and 2015, the Company excluded from the calculation of diluted EPS options to purchase 5,200; 46,033; and 314,454 shares, respectively.
F-69
WNS (HOLDINGS) LIMITED
NOTES TO CONSOLIDATED FINANCIAL STATEMENTS
(Amounts in thousands, except share and per share data)
25. Related party
The following is a list of the Company’s subsidiaries as at March 31, 2017:
| | | | |
Direct subsidiaries | | Step subsidiaries | | Place of incorporation |
| | |
| WNS Global Services Netherlands Cooperatief U.A. | | | | The Netherlands |
| | |
| | WNS Global Services Philippines Inc. | | Philippines |
| | |
| | WNS Global Services (Romania) S.R.L. | | Romania |
| | |
| WNS North America Inc. | | | | Delaware, USA |
| | |
| | WNS Business Consulting Services Private Limited | | India |
| | |
| | WNS Global Services Inc. | | Delaware, USA |
| | |
| | WNS BPO Services Costa Rica, S.R.L | | Costa Rica |
| | |
| | Denali Sourcing Services Inc. (1) | | Delaware, USA |
| | |
| WNS Global Services (UK) Limited (2) | | | | United Kingdom |
| | |
| | WNS Global Services SA (Pty) Limited | | South Africa |
| | |
| | - Ucademy (Pty) Limited (3) | | South Africa |
| | |
| WNS Assistance Limited (previously WNS Workflow Technologies Limited) | | | | United Kingdom |
| | |
| | WNS Assistance (Legal) Limited (4) | | United Kingdom |
| | |
| | Accidents Happen Assistance Limited | | United Kingdom |
| | |
| | WNS Legal Assistance LLP (5) | | United Kingdom |
| | |
| WNS (Mauritius) Limited | | | | Mauritius |
| | |
| | WNS Capital Investment Limited | | Mauritius |
| | |
| | - WNS Customer Solutions (Singapore) Private Limited | | Singapore |
| | |
| | -WNS Global Services (Australia) Pty Ltd | | Australia |
| | |
| | -Business Applications Associates Beijing Ltd | | China |
| | |
| | WNS Global Services Private Limited (6) | | India |
| | |
| | - MTS HealthHelp Inc. (7) | | Delaware, USA |
| | |
| | - HealthHelp Holdings LLC (7) | | Delaware, USA |
| | |
| | - HealthHelp LLC (7) | | Delaware, USA |
| | |
| | - Value Edge Research Services Private Limited (8) | | India |
| | |
| | - Value Edge Inc. (8) | | Delaware, USA |
| | |
| | - Value Edge AG. (8) | | Switzerland |
| | |
| | - Value Edge GmbH (8) | | Germany |
| | |
| | WNS Global Services (Private) Limited | | Sri Lanka |
| | |
| | WNS Global Services (Dalian) Co. Ltd. | | China |
Notes:
| (1) | On January 20, 2017, the Company acquired all outstanding equity shares of Denali Sourcing Services Inc. |
| (2) | WNS Global Services (UK) is being jointly held by WNS Holdings Limited and WNS Global Services Private Limited. The percentage of holding for WNS Holdings Limited is 64.0% and for WNS Global Services Private Limited is 36.0%. |
| (3) | Ucademy (Pty) Limited has been incorporated as a subsidiary of WNS Global Services SA (Pty) Limited with effect from June 20, 2016. |
| (4) | WNS Assistance (Legal) Limited, a wholly owned subsidiary of WNS Assistance Limited, was incorporated on April 20, 2016. |
| (5) | All the above subsidiaries are wholly owned except WNS Legal Assistance LLP, a limited liability partnership, organized under the laws of England and Wales in November 2014. WNS Legal Assistance LLP provides legal services in relation to personal injury claims within the Auto Claims BPM (as defined in Note 26) segment in the UK. WNS Legal Assistance LLP is 79% owned by WNS Assistance Limited, 1% owned by WNS Assistance (Legal) Limited and 20% owned by Prettys Solicitors LLP, UK. |
| (6) | WNS Global Services Private Limited is being held jointly by WNS (Mauritius) Limited and WNS Customer Solutions (Singapore) Private Limited. The percentage of holding for WNS (Mauritius) Limited is 80% and for WNS Customer Solutions (Singapore) Private Limited is 20%. |
| (7) | On March 15, 2017, the Company acquired all ownership interests of MTS HealthHelp Inc. and its subsidiaries, which existed on that date. HealthHelp Holdings LLC is 63.5% owned by MTS HealthHelp Inc. and 36.5% owned by WNS North America Inc. |
| (8) | On June 14, 2016, the Company acquired all outstanding equity shares of Value Edge Research Services Private Limited. As part of the acquisition, the Company also acquired the three subsidiaries of Value Edge Research Services Private Limited, which existed on that date. |
F-70
WNS (HOLDINGS) LIMITED
NOTES TO CONSOLIDATED FINANCIAL STATEMENTS
(Amounts in thousands, except share and per share data)
| | |
Name of the related party | | Relationship |
| Acumentor Inc. (w.e.f. April 1, 2014) | | An entity of which a member of key management is the sole proprietor |
| |
| Razmatazz Events | | A company which a close relative of the member of key management owns and controls |
| |
| Surface Architectural Supply Inc. (w.e.f. September 1, 2014) | | A company in which a member of key management has a controlling stake |
| |
| J F Fitness of North America (w.e.f. September 1, 2014) | | A company in which a member of key management has a controlling stake |
| |
| Sheron LLC (w.e.f. April 1, 2014) | | A company which a close relative of the member of key management owns and controls |
| |
Key management personnel | | |
| Adrian T. Dillon | | Chairman (Appointed as Chairman effective January 1, 2014, wasNon-Executive Vice Chairman till December 31, 2013) |
| |
| Keshav R. Murugesh | | Director and Group Chief Executive Officer |
| |
| Jeremy Young (Ceased to be director from September 29, 2015) | | Director |
| |
| Renu S. Karnad | | Director |
| |
| Eric B. Herr (Ceased to be director from April 30, 2014) | | Director (Ceased to be Chairman from January 1, 2014) |
| |
| Anthony A. Greener (Ceased to be director from September 27, 2016) | | Director |
| |
| Albert Aboody | | Director |
| |
| Swaminathan Rajamani | | Chief People Officer |
| |
| Ronald Gillette | | Chief Operating Officer |
| |
| Sanjay Puria | | Group Chief Financial Officer |
| |
| Gareth Williams | | Director |
| |
| Michael Menezes | | Director |
| |
| John Freeland (Appointed on September 1, 2014) | | Director |
| |
| Francoise Gri (Appointed on May 6, 2015) | | Director |
F-71
WNS (HOLDINGS) LIMITED
NOTES TO CONSOLIDATED FINANCIAL STATEMENTS
(Amounts in thousands, except share and per share data)
| | | | | | | | | | | | |
| | | Year ended March 31, | |
Nature of transaction with related parties | | 2017 | | | 2016 | | | 2015 | |
Key management personnel* | | | | |
Remuneration and short-term benefits | | | 4,592 | | | | 4,671 | | | | 3,763 | |
Defined contribution plan | | | 89 | | | | 84 | | | | 82 | |
Other benefits | | | 15 | | | | 14 | | | | 14 | |
Share-based compensation expense | | | 13,347 | | | | 8,674 | | | | 5,759 | |
| * | Defined benefit plan is not disclosed as these are determined for the Company as a whole. |
F-72
WNS (HOLDINGS) LIMITED
NOTES TO CONSOLIDATED FINANCIAL STATEMENTS
(Amounts in thousands, except share and per share data)
26. Operating segments
The Company has several operating segments based on a mix of industry and the types of services. The composition and organization of these operating segments currently is designed in such a way that the back office shared processes, i.e. the horizontal structure, delivers service to industry specific back office and front office processes i.e. the vertical structure. These structures represent a matrix form of organization structure, accordingly operating segments have been determined based on the core principle of segment reporting in accordance with IFRS 8 “Operating segments” (“IFRS 8”). These operating segments include travel, insurance, banking and financial services, healthcare, utilities, retail and consumer products groups, auto claims and others. The Company believes that the business process outsourcing services that it provides to customers in industries other than auto claims such as travel, insurance, banking and financial services, healthcare, utilities, retail and consumer products groups and others that are similar in terms of services, service delivery methods, use of technology, and long-term gross profit and hence meet the aggregation criteria in accordance with IFRS 8. WNS Assistance and Accidents Happen Assistance Limited (which provide automobile repair through a network of third party repair centers), and WNS Legal Assistance LLP (which provides legal services in relation to personal injury claims), which constitute WNS Auto Claims BPM, do not meet the aggregation criteria. Accordingly, the Company has determined that it has two reportable segments “WNS Global BPM” and “WNS Auto Claims BPM.”
The Group Chief Executive Officer has been identified as the Chief Operating Decision Maker (“CODM”). The CODM evaluates the Company’s performance and allocates resources based on revenue growth of vertical structure.
In order to provide accident management services, the Company arranges for the repair through a network of repair centers. Repair costs paid to automobile repair centers are invoiced to customers and recognized as revenue except in cases where the Company has concluded that it is not the principal in providing claims handling services and hence it would be appropriate to record revenue from repair services on a net basis i.e. net of repair cost. The Company uses revenue less repair payments(non-GAAP) for “Fault” repairs as a primary measure to allocate resources and measure segment performance. Revenue less repair payments is anon-GAAP measure which is calculated as (a) revenue less (b) in the Company’s auto claims business, payments to repair centers for “Fault” repair cases where the Company acts as the principal in its dealings with the third party repair centers and its clients. For“Non-fault repairs,” revenue including repair payments is used as a primary measure. As the Company provides a consolidated suite of accident management services including credit hire and credit repair for its“Non-fault” repairs business, the Company believes that measurement of that line of business has to be on a basis that includes repair payments in revenue.
F-73
WNS (HOLDINGS) LIMITED
NOTES TO CONSOLIDATED FINANCIAL STATEMENTS
(Amounts in thousands, except share and per share data)
The segment results for the year ended March 31, 2017 are as follows:
| | | | | | | | | | | | | | | | |
| | | Year ended March 31, 2017 | |
| | | WNS
Global BPM | | | WNS Auto
Claims BPM | | | Inter
segments* | | | Total | |
Revenue from external customers | | $ | 557,904 | | | $ | 44,642 | | | $ | — | | | $ | 602,546 | |
Segment revenue | | $ | 557,983 | | | $ | 44,642 | | | $ | (79 | ) | | $ | 602,546 | |
Payments to repair centers | | | | | | | 24,102 | | | | — | | | | 24,102 | |
| | | | | | | | | | | | | | | | |
Revenue less repair payments(non-GAAP) | | | 557,983 | | | | 20,540 | | | | (79 | ) | | | 578,444 | |
Depreciation | | | 16,598 | | | | 305 | | | | — | | | | 16,903 | |
Other costs | | | 429,074 | | | | 20,147 | | | | (79 | ) | | | 449,142 | |
Impairment of goodwill (Refer note 9) | | | — | | | | 21,673 | | | | — | | | | 21,673 | |
| | | | | | | | | | | | | | | | |
Segment operating profit/(loss) | | | 112,311 | | | | (21,585 | ) | | | — | | | | 90,726 | |
Other income, net | | | (7,785 | ) | | | (904 | ) | | | — | | | | (8,689 | ) |
Finance expense | | | 547 | | | | | | | | — | | | | 547 | |
| | | | | | | | | | | | | | | | |
Segment profit/(loss) before income taxes | | | 119,549 | | | | (20,681 | ) | | | — | | | | 98,868 | |
Provision for income taxes | | | 17,441 | | | | 89 | | | | — | | | | 17,530 | |
| | | | | | | | | | | | | | | | |
Segment profit/(loss) | | | 102,108 | | | | (20,770 | ) | | | — | | | | 81,338 | |
Amortization of intangible assets | | | | | | | | | | | | | | | 20,539 | |
Share-based compensation expense | | | | | | | | | | | | | | | 23,036 | |
| | | | | | | | | | | | | | | | |
Profit/(loss) | | | | | | | | | | | | | | $ | 37,763 | |
| | | | | | | | | | | | | | | | |
Addition tonon-current assets | | $ | 111,280 | | | $ | 453 | | | $ | — | | | $ | 111,733 | |
Total assets, net of elimination | | | 590,974 | | | | 113,149 | | | | — | | | | 704,123 | |
Total liabilities, net of elimination | | $ | 214,155 | | | $ | 74,902 | | | $ | — | | | $ | 289,057 | |
| * | Transactions between inter segments represent invoices raised by WNS Global BPM on WNS Auto Claims BPM for business process outsourcing services rendered by the former to latter. |
One customer in the WNS Global BPM segment accounted for 9.0% of the Company’s total revenue for the year ended March 31, 2017. The receivables from this customer comprised 7.1% of the Company’s total accounts receivables as at March 31, 2017.
F-74
WNS (HOLDINGS) LIMITED
NOTES TO CONSOLIDATED FINANCIAL STATEMENTS
(Amounts in thousands, except share and per share data)
The segment results for the year ended March 31, 2016 are as follows:
| | | | | | | | | | | | | | | | |
| | | Year ended March 31, 2016 | |
| | | WNS
Global BPM | | | WNS Auto
Claims BPM | | | Inter
segments* | | | Total | |
Revenue from external customers | | $ | 508,864 | | | $ | 53,315 | | | $ | — | | | $ | 562,179 | |
Segment revenue | | $ | 509,268 | | | $ | 53,315 | | | $ | (404 | ) | | $ | 562,179 | |
Payments to repair centers | | | — | | | | 31,170 | | | | — | | | | 31,170 | |
| | | | | | | | | | | | | | | | |
Revenue less repair payments(non-GAAP) | | | 509,268 | | | | 22,145 | | | | (404 | ) | | | 531,009 | |
Depreciation | | | 15,090 | | | | 345 | | | | — | | | | 15,435 | |
Other costs | | | 377,051 | | | | 22,966 | | | | (404 | ) | | | 399,613 | |
| | | | | | | | | | | | | | | | |
Segment operating profit/(loss) | | | 117,127 | | | | (1,166 | ) | | | — | | | | 115,961 | |
Other income, net | | | (7,461 | ) | | | (1,033 | ) | | | — | | | | (8,494 | ) |
Finance expense | | | 278 | | | | — | | | | — | | | | 278 | |
| | | | | | | | | | | | | | | | |
Segment profit/(loss) before income taxes | | | 124,310 | | | | (133 | ) | | | — | | | | 124,177 | |
Provision for income taxes | | | 20,905 | | | | 275 | | | | — | | | | 21,180 | |
| | | | | | | | | | | | | | | | |
Segment profit/(loss) | | | 103,405 | | | | (408 | ) | | | — | | | | 102,997 | |
Amortization of intangible assets | | | | | | | | | | | | | | | 25,198 | |
Share-based compensation expense | | | | | | | | | | | | | | | 17,919 | |
| | | | | | | | | | | | | | | | |
Profit/(loss) | | | | | | | | | | | | | | $ | 59,880 | |
| | | | | | | | | | | | | | | | |
Addition tonon-current assets | | $ | 30,757 | | | $ | 1,101 | | | $ | — | | | $ | 31,858 | |
Total assets, net of elimination | | | 373,195 | | | | 152,256 | | | | — | | | | 525,451 | |
Total liabilities, net of elimination | | $ | 36,660 | | | $ | 80,602 | | | $ | — | | | $ | 117,262 | |
| * | Transactions between inter segments represent invoices raised by WNS Global BPM on WNS Auto Claims BPM for business process outsourcing services rendered by the former to latter. |
One customer in the WNS Global BPM segment accounted for 10.9% of the Company’s total revenue for the year ended March 31, 2016. The receivables from this customer comprised 10.0% of the Company’s total accounts receivables as at March 31, 2016.
F-75
WNS (HOLDINGS) LIMITED
NOTES TO CONSOLIDATED FINANCIAL STATEMENTS
(Amounts in thousands, except share and per share data)
The segment results for the year ended March 31, 2015 are as follows:
| | | | | | | | | | | | | | | | |
| | | Year ended March 31, 2015 | |
| | | WNS
Global BPM | | | WNS Auto
Claims BPM | | | Inter
segments* | | | Total | |
Revenue from external customers | | $ | 472,840 | | | $ | 61,053 | | | $ | — | | | $ | 533,893 | |
Segment revenue | | $ | 473,056 | | | $ | 61,053 | | | $ | (216 | ) | | $ | 533,893 | |
Payments to repair centers | | | — | | | | 30,878 | | | | — | | | | 30,878 | |
| | | | | | | | | | | | | | | | |
Revenue less repair payments(non-GAAP) | | | 473,056 | | | | 30,175 | | | | (216 | ) | | | 503,015 | |
Depreciation | | | 14,027 | | | | 360 | | | | — | | | | 14,387 | |
Other costs | | | 360,299 | | | | 24,403 | | | | (216 | ) | | | 384,486 | |
| | | | | | | | | | | | | | | | |
Segment operating profit | | | 98,730 | | | | 5,412 | | | | — | | | | 104,142 | |
Other income, net | | | (11,140 | ) | | | (772 | ) | | | — | | | | (11,912 | ) |
Finance expense | | | 1,332 | | | | — | | | | — | | | | 1,332 | |
| | | | | | | | | | | | | | | | |
Segment profit before income taxes | | | 108,538 | | | | 6,184 | | | | — | | | | 114,722 | |
Provision for income taxes | | | 21,246 | | | | 1,171 | | | | — | | | | 22,417 | |
| | | | | | | | | | | | | | | | |
Segment profit | | | 87,292 | | | | 5,013 | | | | — | | | | 92,305 | |
Amortization of intangible assets | | | | | | | | | | | | | | | 24,192 | |
Share-based compensation expense | | | | | | | | | | | | | | | 9,499 | |
| | | | | | | | | | | | | | | | |
Profit | | | | | | | | | | | | | | $ | 58,614 | |
| | | | | | | | | | | | | | | | |
Addition tonon-current assets | | $ | 20,923 | | | $ | 1,785 | | | $ | — | | | $ | 22,708 | |
Total assets, net of elimination | | | 393,152 | | | | 137,149 | | | | — | | | | 530,301 | |
Total liabilities, net of elimination | | $ | 78,539 | | | $ | 62,656 | | | $ | — | | | $ | 141,195 | |
| * | Transactions between inter segments represent invoices raised by WNS Global BPM on WNS Auto Claims BPM for business process outsourcing services rendered by the former to latter. |
One customer in the WNS Global BPM segment accounted for 13.4% of the Company’s total revenue for the year ended March 31, 2015. The receivables from this customer comprised 9.8% of the Company’s total accounts receivables as at March 31, 2015.
F-76
WNS (HOLDINGS) LIMITED
NOTES TO CONSOLIDATED FINANCIAL STATEMENTS
(Amounts in thousands, except share and per share data)
External Revenue
Revenues from the geographic segments based on domicile of the customer. The Company’s external revenue by geographic area is as follows:
| | | | | | | | | | | | |
| | | Year ended March 31, | |
| | | 2017 | | | 2016 | | | 2015 | |
Jersey, Channel Islands | | $ | | | | $ | — | | | $ | — | |
UK | | | 248,588 | | | | 264,889 | | | | 281,928 | |
US | | | 196,193 | | | | 155,345 | | | | 138,501 | |
Europe (excluding UK) | | | 37,494 | | | | 34,732 | | | | 28,758 | |
South Africa | | | 42,717 | | | | 30,086 | | | | 17,405 | |
Australia | | | 49,053 | | | | 40,308 | | | | 34,193 | |
Rest of the world | | | 28,501 | | | | 36,819 | | | | 33,108 | |
| | | | | | | | | | | | |
Total | | $ | 602,546 | | | $ | 562,179 | | | $ | 533,893 | |
| | | | | | | | | | | | |
The Company’snon-current assets (excluding goodwill and intangible assets) by geographic area are as follows:
| | | | | | | | |
| | | As at
March 31, | |
| | | 2017 | | | 2016 | |
Jersey, Channel Islands | | $ | — | | | $ | — | |
UK | | | 1,228 | | | | 2,114 | |
North America | | | 6,493 | | | | 2,923 | |
India | | | 21,944 | | | | 25,744 | |
South Africa | | | 11,449 | | | | 8,705 | |
Philippines | | | 10,583 | | | | 6,781 | |
Rest of the world | | | 3,099 | | | | 4,150 | |
| | | | | | | | |
Total | | $ | 54,796 | | | $ | 50,417 | |
| | | | | | | | |
27. Commitment and Contingencies
Leases
The Company has entered into variousnon-cancelable operating lease agreements for certain delivery centers and offices with original lease periods expiring between fiscal 2017 and 2028, that are renewable on a periodic basis at the option of the lessor and the lessee and have rent escalation clause. The details of future minimum lease payments undernon-cancelable operating leases as at March 31, 2017 are as follows:
| | | | |
| | | Operating lease | |
Less than 1 year | | $ | 23,657 | |
1-3 years | | | 37,939 | |
3-5 years | | | 24,601 | |
More than 5 years | | | 23,057 | |
| | | | |
Total minimum lease payments | | $ | 109,254 | |
| | | | |
Rental expenses were $27,712, $24,313 and $23,794 for the years ended March 31, 2017, 2016, and 2015, respectively.
F-77
WNS (HOLDINGS) LIMITED
NOTES TO CONSOLIDATED FINANCIAL STATEMENTS
(Amounts in thousands, except share and per share data)
Capital commitments
As at March 31, 2017 and 2016, the Company had committed to spend approximately $6,257 and $4,389, respectively, under agreements to purchase property and equipment. These amounts are net of capital advances paid in respect of these purchases.
Bank guarantees and others
Certain subsidiaries of the Company hold bank guarantees aggregating $1,190 and $868 as at March 31, 2017 and 2016, respectively. These guarantees have a remaining expiry term ranging from one to five years.
Restricted time deposits placed with bankers as security for guarantees given by them to regulatory authorities aggregating $355 and $400 as at March 31, 2017 and 2016, respectively, are included in other current assets. These deposits represent cash collateral against bank guarantees issued by the banks on behalf of the Company to third parties.
Contingencies
In the ordinary course of business, the Company is involved in lawsuits, claims and administrative proceedings. While uncertainties are inherent in the final outcome of these matters, the Company believes, after consultation with counsel, that the disposition of these proceedings will not have a material adverse effect on the Company’s financial position, results of operations or cash flows.
F-78
WNS (HOLDINGS) LIMITED
NOTES TO CONSOLIDATED FINANCIAL STATEMENTS
(Amounts in thousands, except share and per share data)
28. Additional capital disclosures
The key objective of the Company’s capital management is to ensure that it maintains a stable capital structure with the focus on total equity to uphold investor, creditor, and customer confidence and to ensure future development of its business. The Company focuses on keeping a strong total equity base to ensure independence, security, as well as a high financial flexibility for potential future borrowings, if required, without impacting the risk profile of the Company.
The capital structure as at March 31, 2017 and 2016 was as follows:
| | | | | | | | | | | | |
| | | As at March 31, | |
| | | 2017 | | | 2016 | | | %
Change | |
Total equity attributable to the equity shareholders of the Company | | $ | 415,066 | | | $ | 408,189 | | | | 2 | % |
As percentage of total capital | | | 78 | % | | | 100 | % | | | | |
Long term debt(1) | | | 118,000 | | | | — | | | | 100 | % |
Total debt | | $ | 118,000 | | | $ | — | | | | 100 | % |
As percentage of total capital | | | 22 | % | | | 0 | % | | | | |
| | | | | | | | | | | | |
Total capital (debt and equity) | | $ | 533,066 | | | $ | 408,189 | | | | 30 | % |
| | | | | | | | | | | | |
Note:
| (1) | Before netting off debt issuance cost of $1,257 and Nil, respectively. |
The Company is predominantly equity-financed. This is also evident from the fact that debt represents 22% and 0% of total capital as at March 31, 2017 and 2016, respectively.
F-79