|
Exhibit F
March 11, 2014
Valuation Perspectives on Riverbed Offer
|
Disclaimer
This presentation has been prepared by Elliott Management Corporation (“Elliott”) and its financial advisor Moelis & Company LLC (“Moelis”) based on publicly available information. Moelis has not assumed any responsibility for independently verifying the information herein, Moelis makes no representation or warranty as to the accuracy, completeness or reasonableness of the information herein and Moelis disclaims any liability with respect to the information herein. In this presentation, Moelis, at Elliott’s direction, has used certain projections, forecasts or other forward-looking statements with respect to Riverbed Technology, Inc. (“Riverbed” or the “Company”) and/or other parties involved in the transaction from public sources which Moelis has assumed, at Elliott’s direction, were prepared based on the best available estimates and judgments of the preparer as to the future performance of the Company and/or such other parties. This presentation speaks only as of its date and Moelis assumes no obligation to update it or to advise any person that its views have changed.
This presentation is solely for informational purposes. This presentation is not intended to provide the sole basis for any decision on any transaction and is not a recommendation with respect to any transaction. The recipient should make its own independent business decision based on all other information, advice and the recipient’s own judgment. This presentation is not an offer to sell or a solicitation of an indication of interest to purchase any security, option, commodity, future, loan or currency. It is not a commitment to underwrite any security, to loan any funds or to make any investment. Moelis does not offer tax, accounting or legal advice.
Moelis provides mergers and acquisitions, restructuring and other advisory services to clients and its affiliates manage private investment partnerships. Its personnel may make statements or provide advice that is contrary to information contained in this material. Our proprietary interests may conflict with your interests. Moelis may from time to time have positions in or effect transactions in securities described in this presentation. Moelis may have advised, may seek to advise and may in the future advise or invest in companies mentioned in this presentation.
Cautionary Statement Regarding Forward-Looking Statements
The information herein contains “forward-looking statements.” Specific forward-looking statements can be identified by the fact that they do not relate strictly to historical or current facts and include, without limitation, words such as “may,” “will,” “expects,” “believes,” “anticipates,” “plans,” “estimates,” “projects,” “targets,” “forecasts,” “seeks,” “could,” “should” or the negative of such terms or other variations on such terms or comparable terminology. Similarly, statements that describe Elliott’s objectives, plans or goals are forward-looking. Forward-looking statements are based on current intent, belief, expectations, estimates and projections regarding the Company and projections regarding the industry in which it operates. These statements are not guarantees of future performance and involve risks, uncertainties, assumptions and other factors that are difficult to predict and that could cause actual results to differ materially. Accordingly, you should not rely upon forward-looking statements as a prediction of actual results and actual results may vary materially from what is expressed in or indicated by the forward-looking statements.
[ 1 ]
|
Summary of Elliott’s Transaction Proposal
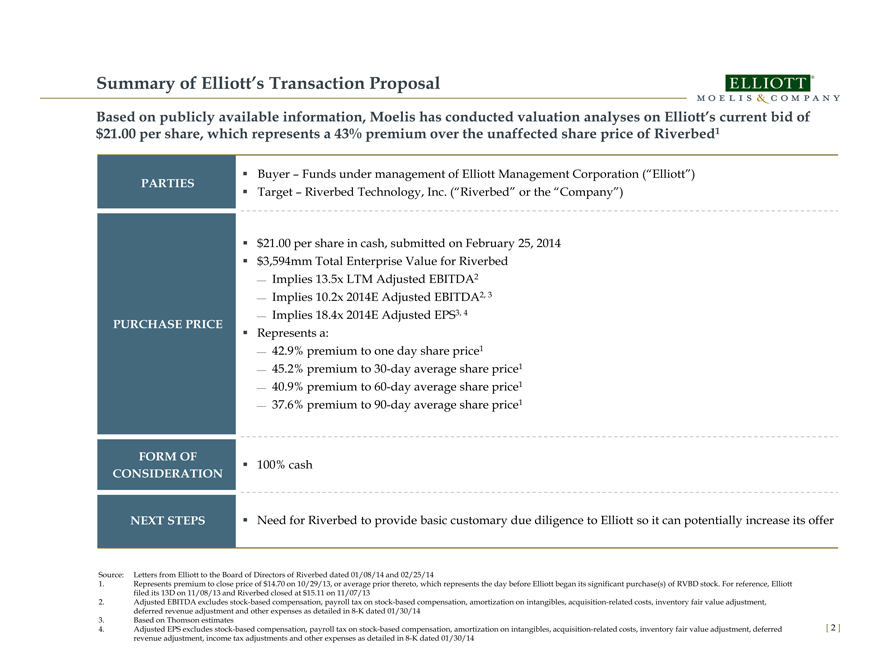
Based on publicly available information, Moelis has conducted valuation analyses on Elliott’s current bid of $21.00 per share, which represents a 43% premium over the unaffected share price of Riverbed1
Buyer – Funds under management of Elliott Management Corporation (“Elliott”)
PARTIES
Target – Riverbed Technology, Inc. (“Riverbed” or the “Company”)
$21.00 per share in cash, submitted on February 25, 2014
$3,594mm Total Enterprise Value for Riverbed
Implies 13.5x LTM Adjusted EBITDA2
Implies 10.2x 2014E Adjusted EBITDA2, 3
Implies 18.4x 2014E Adjusted EPS3, 4
PURCHASE PRICE
Represents a:
42.9% premium to one day share price1
45.2% premium to 30-day average share price1
40.9% premium to 60-day average share price1
37.6% premium to 90-day average share price1
FORM OF 100% cash
CONSIDERATION
NEXT STEPS Need for Riverbed to provide basic customary due diligence to Elliott so it can potentially increase its offer
Source: Letters from Elliott to the Board of Directors of Riverbed dated 01/08/14 and 02/25/14
1. Represents premium to close price of $14.70 on 10/29/13, or average prior thereto, which represents the day before Elliott began its significant purchase(s) of RVBD stock. For reference, Elliott filed its 13D on 11/08/13 and Riverbed closed at $15.11 on 11/07/13
2. Adjusted EBITDA excludes stock-based compensation, payroll tax on stock-based compensation, amortization on intangibles, acquisition-related costs, inventory fair value adjustment, deferred revenue adjustment and other expenses as detailed in 8-K dated 01/30/14
3. Based on Thomson estimates
4. Adjusted EPS excludes stock-based compensation, payroll tax on stock-based compensation, amortization on intangibles, acquisition-related costs, inventory fair value adjustment, deferred revenue adjustment, income tax adjustments and other expenses as detailed in 8-K dated 01/30/14
[ 2 ]
|
Riverbed Business Update – Application Acceleration
SUMMARY DESCRIPTION
Includes the following products:
Steelhead (WAN optimization)
Granite (branch converged infrastructure)
Stingray (application delivery controller)
Whitewater (cloud storage appliance)
Growth concerns around portfolio of products
COMMENTARY
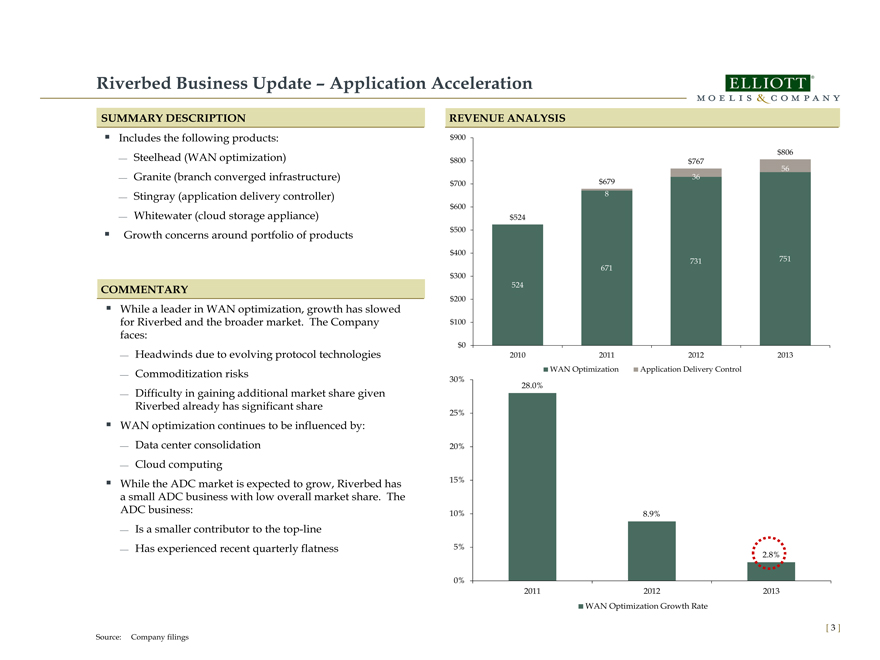
While a leader in WAN optimization, growth has slowed for Riverbed and the broader market. The Company faces:
Headwinds due to evolving protocol technologies
Commoditization risks
Difficulty in gaining additional market share given Riverbed already has significant share
WAN optimization continues to be influenced by:
Data center consolidation
Cloud computing
While the ADC market is expected to grow, Riverbed has a small ADC business with low overall market share. The ADC business:
Is a smaller contributor to the top-line
Has experienced recent quarterly flatness
Revenue Analysis
$900
$806
$800 $767
56
$700 $679 36
8
$600
$524
$500
$400
731 751
671
$300
524
$200
$100
$0
2010 2011 2012 2013
WAN Optimization Application Delivery Control
30%
28.0%
25%
20%
15%
10% 8.9%
5%
2.8%
0%
2011 2012 2013
WAN Optimization Growth Rate
Source: Company filings
[ 3 ]
|
Riverbed Business Update – Performance Management
SUMMARY DESCRIPTION
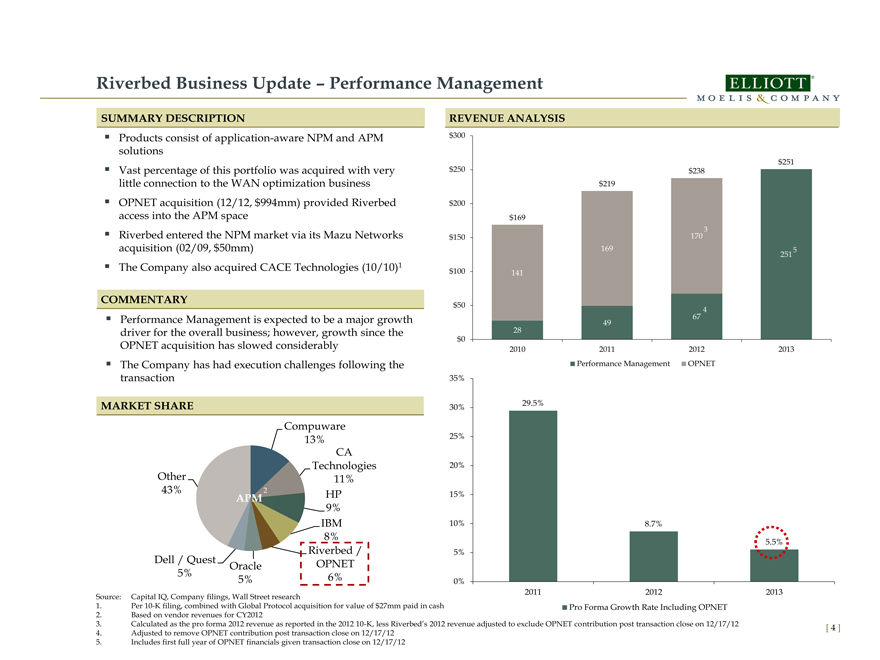
Products consist of application-aware NPM and APM solutions
Vast percentage of this portfolio was acquired with very little connection to the WAN optimization business
OPNET acquisition (12/12, $994mm) provided Riverbed access into the APM space
Riverbed entered the NPM market via its Mazu Networks acquisition (02/09, $50mm)
The Company also acquired CACE Technologies (10/10)1
COMMENTARY
Performance Management is expected to be a major growth driver for the overall business; however, growth since the OPNET acquisition has slowed considerably
The Company has had execution challenges following the transaction
MARKET SHARE
Compuware 13% CA
Technologies Other 11% 43% 2 HP
APM 9% IBM
8% Riverbed / Dell / Quest OPNET
Oracle
5% 6% 5%
Source: Capital IQ, Company filings, Wall Street research
1. Per 10-K filing, combined with Global Protocol acquisition for value of $27mm paid in cash
2. Based on vendor revenues for CY2012
3. Calculated as the pro forma 2012 revenue as reported in the 2012 10-K, less Riverbed’s 2012 revenue adjusted to exclude OPNET contribution post transaction close on 12/17/12
4. Adjusted to remove OPNET contribution post transaction close on 12/17/12
5. Includes first full year of OPNET financials given transaction close on 12/17/12
$300
$250 $251 $238 $219
$200 $169
170 3 $150
169 5 251
$100 141
$50
67 4
28 49 $0
2010 2011 2012 2013 Performance Management OPNET
35%
29.5% 30%
25%
20%
15%
10%
5%
8.7%
5.5%
0%
2011 2012 2013 Pro Forma Growth Rate Including OPNET
REVENUE ANALYSIS
[ 4 ]
|
Riverbed Observations and Challenges
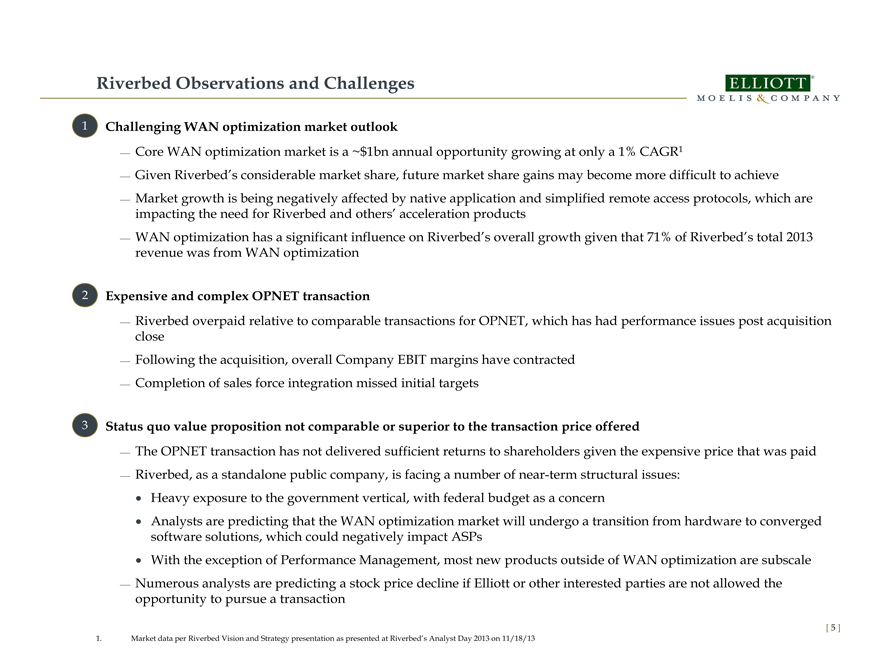
1 Challenging WAN optimization market outlook
Core WAN optimization market is a ~$1bn annual opportunity growing at only a 1% CAGR1
Given Riverbed’s considerable market share, future market share gains may become more difficult to achieve
Market growth is being negatively affected by native application and simplified remote access protocols, which are impacting the need for Riverbed and others’ acceleration products
WAN optimization has a significant influence on Riverbed’s overall growth given that 71% of Riverbed’s total 2013 revenue was from WAN optimization
2 Expensive and complex OPNET transaction
Riverbed overpaid relative to comparable transactions for OPNET, which has had performance issues post acquisition close
Following the acquisition, overall Company EBIT margins have contracted
Completion of sales force integration missed initial targets
3 Status quo value proposition not comparable or superior to the transaction price offered
The OPNET transaction has not delivered sufficient returns to shareholders given the expensive price that was paid
Riverbed, as a standalone public company, is facing a number of near-term structural issues:
Heavy exposure to the government vertical, with federal budget as a concern
Analysts are predicting that the WAN optimization market will undergo a transition from hardware to converged software solutions, which could negatively impact ASPs
With the exception of Performance Management, most new products outside of WAN optimization are subscale
Numerous analysts are predicting a stock price decline if Elliott or other interested parties are not allowed the opportunity to pursue a transaction
1. Market data per Riverbed Vision and Strategy presentation as presented at Riverbed’s Analyst Day 2013 on 11/18/13
[ 5 ]
|
Relative Price Performance—LTM Prior to Elliott Involvement
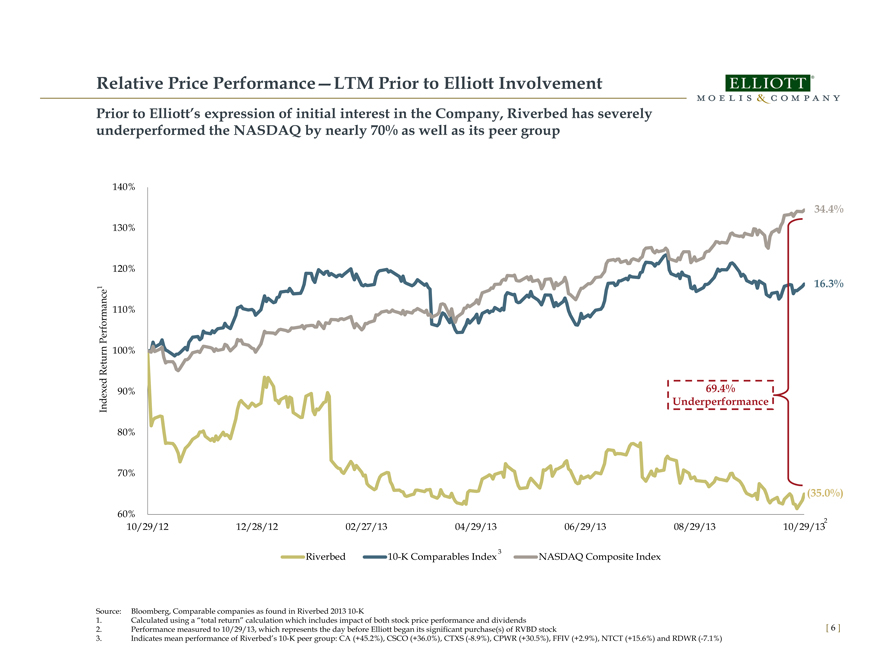
Prior to Elliott’s expression of initial interest in the Company, Riverbed has severely underperformed the NASDAQ by nearly 70% as well as its peer group
140%
1
34.4%
130%
120%
16.3%
formance 110% Per Return 100%
90% 69.4% Indexed Underperformance
80%
70%
(35.0%)
60% 2 10/29/12 12/28/12 02/27/13 04/29/13 06/29/13 08/29/13 10/29/13
3
Riverbed 10-K Comparables Index NASDAQ Composite Index
Source: Bloomberg, Comparable companies as found in Riverbed 2013 10-K
1. Calculated using a “total return” calculation which includes impact of both stock price performance and dividends
2. Performance measured to 10/29/13, which represents the day before Elliott began its significant purchase(s) of RVBD stock
3. Indicates mean performance of Riverbed’s 10-K peer group: CA (+45.2%), CSCO (+36.0%), CTXS (-8.9%), CPWR (+30.5%), FFIV (+2.9%), NTCT (+15.6%) and RDWR (-7.1%)
[ 6 ]
|
Share Price Performance—LTM Prior to Elliott Involvement
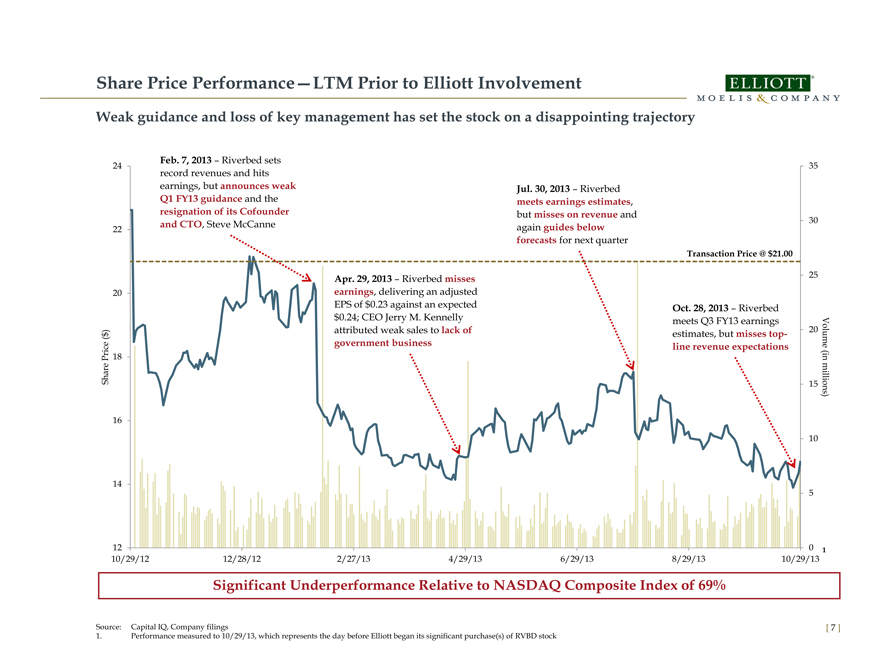
Weak guidance and loss of key management has set the stock on a disappointing trajectory
Feb. 7, 2013 –Riverbed sets
24 35 record revenues and hits earnings, but announces weak Jul. 30, 2013 – Riverbed Q1 FY13 guidance and the meets earnings estimates, resignation of its Cofounder but misses on revenue and 30 and CTO, Steve McCanne again guides below
22 forecasts for next quarter
Transaction Price @ $21.00
Apr. 29, 2013 – Riverbed misses 25 20 earnings, delivering an adjusted EPS of $0.23 against an expected Oct. 28, 2013 – Riverbed $0.24; CEO Jerry M. Kennelly meets Q3 FY13 earnings
20 attributed weak sales to lack of estimates, but misses top-
government business line revenue expectations 18 (in millions)15 16
Share Price ($)
Volume (in million)
10
14
5
12 0 1 10/29/12 12/28/12 2/27/13 4/29/13 6/29/13 8/29/13 10/29/13
Significant Underperformance Relative to NASDAQ Composite Index of 69%
Source: Capital IQ, Company filings
1. Performance measured to 10/29/13, which represents the day before Elliott began its significant purchase(s) of RVBD stock
[ 7 ]
|
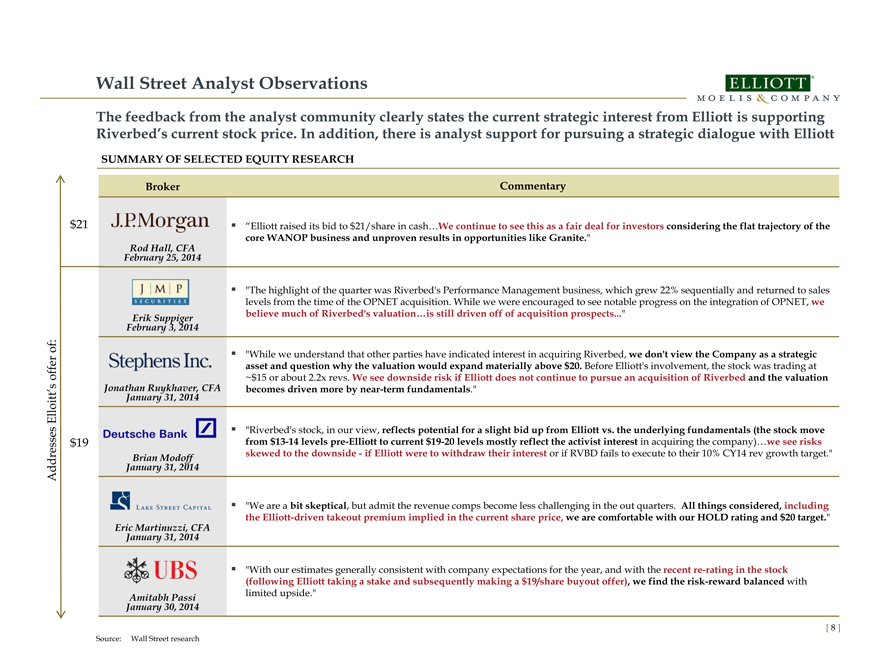
Wall Street Analyst Observations
The feedback from the analyst community clearly states the current strategic interest from Elliott is supporting Riverbed’s current stock price. In addition, there is analyst support for pursuing a strategic dialogue with Elliott
SUMMARY OF SELECTED EQUITY RESEARCH
Broker Commentary
“Elliott raised its bid to $21/share in cash…We continue to see this as a fair deal for investors considering the flat trajectory of the
core WANOP business and unproven results in opportunities like Granite.”
February Rod Hall, 25, CFA 2014
“The highlight of the quarter was Riverbed’s Performance Management business, which grew 22% sequentially and returned to sales
levels from the time of the OPNET acquisition. While we were encouraged to see notable progress on the integration of OPNET, we
believe much of Riverbed’s valuation…is still driven off of acquisition prospects...”
February Erik Suppiger 3, 2014
“While we understand that other parties have indicated interest in acquiring Riverbed, we don’t view the Company as a strategic
asset and question why the valuation would expand materially above $20. Before Elliott’s involvement, the stock was trading at
~$15 or about 2.2x revs. We see downside risk if Elliott does not continue to pursue an acquisition of Riverbed and the valuation
Jonathan January Ruykhaver, 31, 2014 CFA becomes driven more by near-term fundamentals.”
“Riverbed’s stock, in our view, reflects potential for a slight bid up from Elliott vs. the underlying fundamentals (the stock move
from $13-14 levels pre-Elliott to current $19-20 levels mostly reflect the activist interest in acquiring the company)…we see risks
skewed to the downside—if Elliott were to withdraw their interest or if RVBD fails to execute to their 10% CY14 rev growth target.”
January Brian Modoff 31, 2014
“We are a bit skeptical, but admit the revenue comps become less challenging in the out quarters. All things considered, including
the Elliott-driven takeout premium implied in the current share price, we are comfortable with our HOLD rating and $20 target.”
Eric January Martinuzzi, 31, 2014 CFA
“With our estimates generally consistent with company expectations for the year, and with the recent re-rating in the stock
(following Elliott taking a stake and subsequently making a $19/share buyout offer), we find the risk-reward balanced with
limited upside.”
January Amitabh 30, Passi 2014
Source: Wall Street research
Addresses Elloitt’s offer of:
19 $ 21 $
[ 8 ]
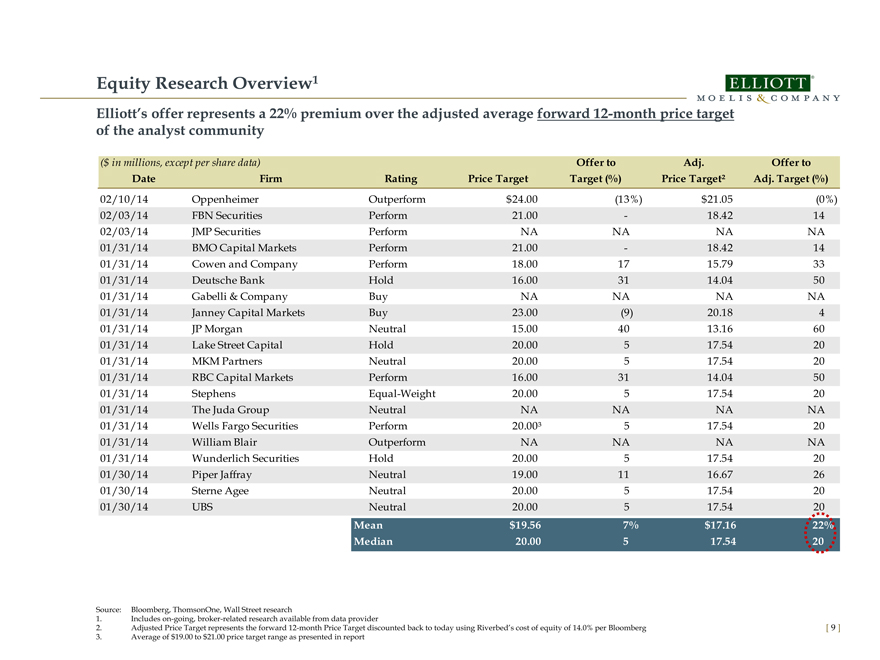
Equity Research Overview1
Elliott’s offer represents a 22% premium over the adjusted average forward 12-month price target of the analyst community
($ in millions, except per share data) Offer to Adj. Offer to
Date Firm Rating Price Target Target (%) Price Target² Adj. Target (%)
02/10/14 Oppenheimer Outperform $24.00 (13%) $21.05 (0%)
02/03/14 FBN Securities Perform 21.00 - 18.42 14
02/03/14 JMP Securities Perform NA NA NA NA
01/31/14 BMO Capital Markets Perform 21.00 - 18.42 14
01/31/14 Cowen and Company Perform 18.00 17 15.79 33
01/31/14 Deutsche Bank Hold 16.00 31 14.04 50
01/31/14 Gabelli & Company Buy NA NA NA NA
01/31/14 Janney Capital Markets Buy 23.00 (9) 20.18 4
01/31/14 JP Morgan Neutral 15.00 40 13.16 60
01/31/14 Lake Street Capital Hold 20.00 5 17.54 20
01/31/14 MKM Partners Neutral 20.00 5 17.54 20
01/31/14 RBC Capital Markets Perform 16.00 31 14.04 50
01/31/14 Stephens Equal-Weight 20.00 5 17.54 20
01/31/14 The Juda Group Neutral NA NA NA NA
01/31/14 Wells Fargo Securities Perform 20.00³ 5 17.54 20
01/31/14 William Blair Outperform NA NA NA NA
01/31/14 Wunderlich Securities Hold 20.00 5 17.54 20
01/30/14 Piper Jaffray Neutral 19.00 11 16.67 26
01/30/14 Sterne Agee Neutral 20.00 5 17.54 20
01/30/14 UBS Neutral 20.00 5 17.54 20
Mean $19.56 7% $17.16 22%
Median 20.00 5 17.54 20
Source: Bloomberg, ThomsonOne, Wall Street research
1. Includes on-going, broker-related research available from data provider
2. Adjusted Price Target represents the forward 12-month Price Target discounted back to today using Riverbed’s cost of equity of 14.0% per Bloomberg
3. Average of $19.00 to $21.00 price target range as presented in report
[ 9 ]
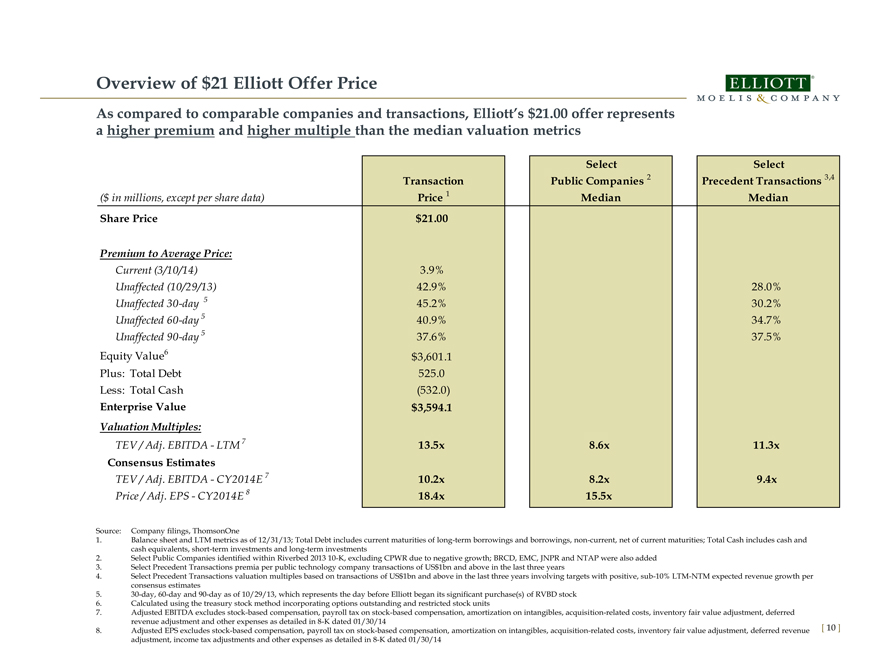
Overview of $21 Elliott Offer Price
As compared to comparable companies and transactions, Elliott’s $21.00 offer represents
a higher premium and higher multiple than the median valuation metrics
Select Select
Transaction Public Companies 2 Precedent Transactions 3,4
($ in millions, except per share data) Price 1 Median Median
Share Price $21.00
Premium to Average Price:
Current (3/10/14) 3.9%
Unaffected (10/29/13) 42.9% 28.0%
Unaffected 30-day 5 45.2% 30.2%
Unaffected 60-day 5 40.9% 34.7%
Unaffected 90-day 5 37.6% 37.5%
Equity Value6 $3,601.1
Plus: Total Debt 525.0
Less: Total Cash (532.0)
Enterprise Value $3,594.1
Valuation Multiples:
TEV / Adj. EBITDA—LTM 7 13.5x 8.6x 11.3x
Consensus Estimates
TEV / Adj. EBITDA—CY2014E 7 10.2x 8.2x 9.4x
Price / Adj. EPS—CY2014E 8 18.4x 15.5x
Source: Company filings, ThomsonOne
1. Balance sheet and LTM metrics as of 12/31/13; Total Debt includes current maturities of long-term borrowings and borrowings, non-current, net of current maturities; Total Cash includes cash and
cash equivalents, short-term investments and long-term investments
2. Select Public Companies identified within Riverbed 2013 10-K, excluding CPWR due to negative growth; BRCD, EMC, JNPR and NTAP were also added
3. Select Precedent Transactions premia per public technology company transactions of US$1bn and above in the last three years
4. Select Precedent Transactions valuation multiples based on transactions of US$1bn and above in the last three years involving targets with positive, sub-10% LTM-NTM expected revenue growth per
consensus estimates
5. 30-day, 60-day and 90-day as of 10/29/13, which represents the day before Elliott began its significant purchase(s) of RVBD stock
6. Calculated using the treasury stock method incorporating options outstanding and restricted stock units
7. Adjusted EBITDA excludes stock-based compensation, payroll tax on stock-based compensation, amortization on intangibles, acquisition-related costs, inventory fair value adjustment, deferred
revenue adjustment and other expenses as detailed in 8-K dated 01/30/14
8. Adjusted EPS excludes stock-based compensation, payroll tax on stock-based compensation, amortization on intangibles, acquisition-related costs, inventory fair value adjustment, deferred revenue
adjustment, income tax adjustments and other expenses as detailed in 8-K dated 01/30/14
[10]
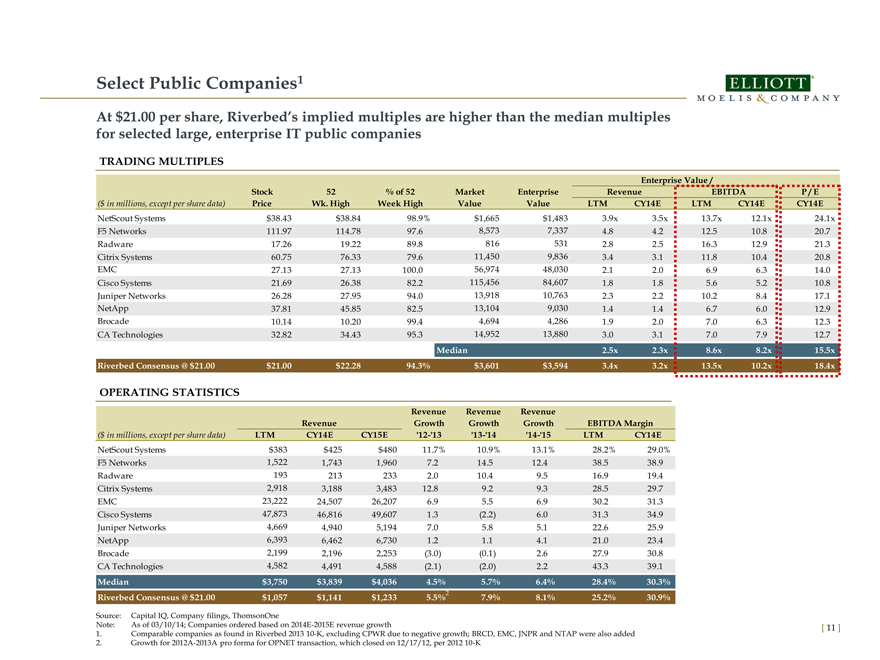
Select Public Companies1
At $21.00 per share, Riverbed’s implied multiples are higher than the median multiples
for selected large, enterprise IT public companies
TRADING MULTIPLES
Enterprise Value /
Stock 52 % of 52 Market Enterprise Revenue EBITDA P / E
($ in millions, except per share data) Price Wk. High Week High Value Value LTM CY14E LTM CY14E CY14E
NetScout Systems $38.43 $38.84 98.9% $1,665 $1,483 3.9x 3.5x 13.7x 12.1x 24.1x
F5 Networks 111.97 114.78 97.6 8,573 7,337 4.8 4.2 12.5 10.8 20.7
Radware 17.26 19.22 89.8 816 531 2.8 2.5 16.3 12.9 21.3
Citrix Systems 60.75 76.33 79.6 11,450 9,836 3.4 3.1 11.8 10.4 20.8
EMC 27.13 27.13 100.0 56,974 48,030 2.1 2.0 6.9 6.3 14.0
Cisco Systems 21.69 26.38 82.2 115,456 84,607 1.8 1.8 5.6 5.2 10.8
Juniper Networks 26.28 27.95 94.0 13,918 10,763 2.3 2.2 10.2 8.4 17.1
NetApp 37.81 45.85 82.5 13,104 9,030 1.4 1.4 6.7 6.0 12.9
Brocade 10.14 10.20 99.4 4,694 4,286 1.9 2.0 7.0 6.3 12.3
CA Technologies 32.82 34.43 95.3 14,952 13,880 3.0 3.1 7.0 7.9 12.7
Median 2.5x 2.3x 8.6x 8.2x 15.5x
Riverbed Consensus @ $21.00 $21.00 $22.28 94.3% $3,601 $3,594 3.4x 3.2x 13.5x 10.2x 18.4x
OPERATING STATISTICS
Revenue Revenue Revenue
Revenue Growth Growth Growth EBITDA Margin
($ in millions, except per share data) LTM CY14E CY15E ‘12-‘13 ‘13-‘14 ‘14-‘15 LTM CY14E
NetScout Systems $383 $425 $480 11.7% 10.9% 13.1% 28.2% 29.0%
F5 Networks 1,522 1,743 1,960 7.2 14.5 12.4 38.5 38.9
Radware 193 213 233 2.0 10.4 9.5 16.9 19.4
Citrix Systems 2,918 3,188 3,483 12.8 9.2 9.3 28.5 29.7
EMC 23,222 24,507 26,207 6.9 5.5 6.9 30.2 31.3
Cisco Systems 47,873 46,816 49,607 1.3 (2.2) 6.0 31.3 34.9
Juniper Networks 4,669 4,940 5,194 7.0 5.8 5.1 22.6 25.9
NetApp 6,393 6,462 6,730 1.2 1.1 4.1 21.0 23.4
Brocade 2,199 2,196 2,253 (3.0) (0.1) 2.6 27.9 30.8
CA Technologies 4,582 4,491 4,588 (2.1) (2.0) 2.2 43.3 39.1
2 |
|
Median $3,750 $3,839 $4,036 4.5% 5.7% 6.4% 28.4% 30.3%
Riverbed Consensus @ $21.00 $1,057 $1,141 $1,233 5.5% 7.9% 8.1% 25.2% 30.9%
Source: Capital IQ, Company filings, ThomsonOne
Note: As of 03/10/14; Companies ordered based on 2014E-2015E revenue growth [ 11 ]
1. Comparable companies as found in Riverbed 2013 10-K, excluding CPWR due to negative growth; BRCD, EMC, JNPR and NTAP were also added
2. Growth for 2012A-2013A pro forma for OPNET transaction, which closed on 12/17/12, per 2012 10-K
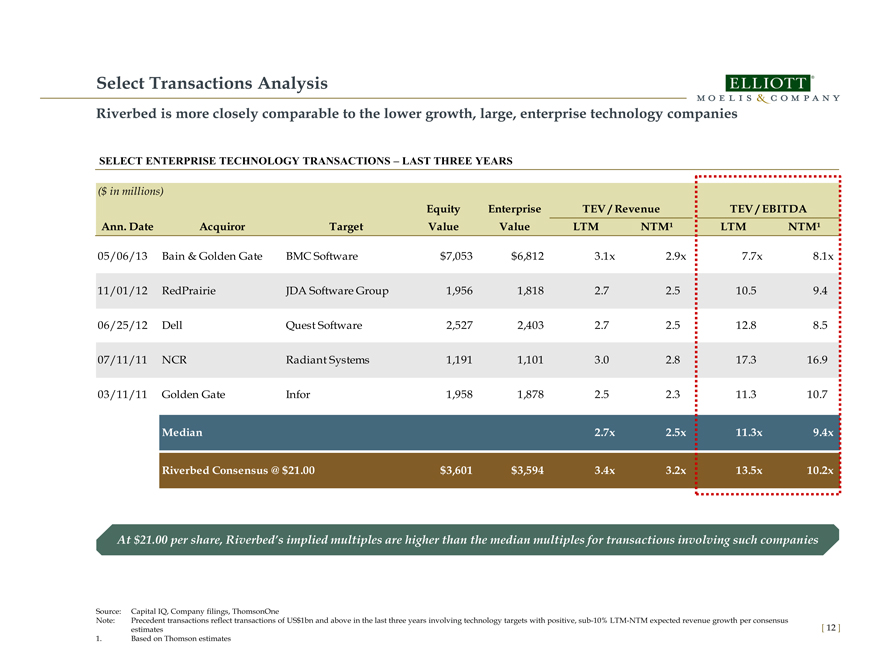
Select Transactions Analysis
Riverbed is more closely comparable to the lower growth, large, enterprise technology companies
SELECT ENTERPRISE TECHNOLOGY TRANSACTIONS – LAST THREE YEARS
($ in millions)
Equity Enterprise TEV / Revenue TEV / EBITDA
Ann. Date Acquiror Target Value Value LTM NTM¹ LTM NTM¹
05/06/13 Bain & Golden Gate BMC Software $ 7,053 $ 6,812 3.1x 2.9x 7.7x 8.1x
11/01/12 RedPrairie JDA Software Group 1,956 1,818 2.7 2.5 10.5 9.4
06/25/12 Dell Quest Software 2,527 2,403 2.7 2.5 12.8 8.5
07/11/11 NCR Radiant Systems 1,191 1,101 3.0 2.8 17.3 16.9
03/11/11 Golden Gate Infor 1,958 1,878 2.5 2.3 11.3 10.7
Median 2.7x 2.5x 11.3x 9.4x
Riverbed Consensus @ $21.00 $ 3,601 $ 3,594 3.4x 3.2x 13.5x 10.2x
At $21.00 per share, Riverbed’s implied multiples are higher than the median multiples for transactions involving such companies
Source: Capital IQ, Company filings, ThomsonOne
Note: Precedent transactions reflect transactions of US$1bn and above in the last three years involving technology targets with positive, sub-10% LTM-NTM expected revenue growth per consensus
estimates [ 12 ]
1. Based on Thomson estimates
|
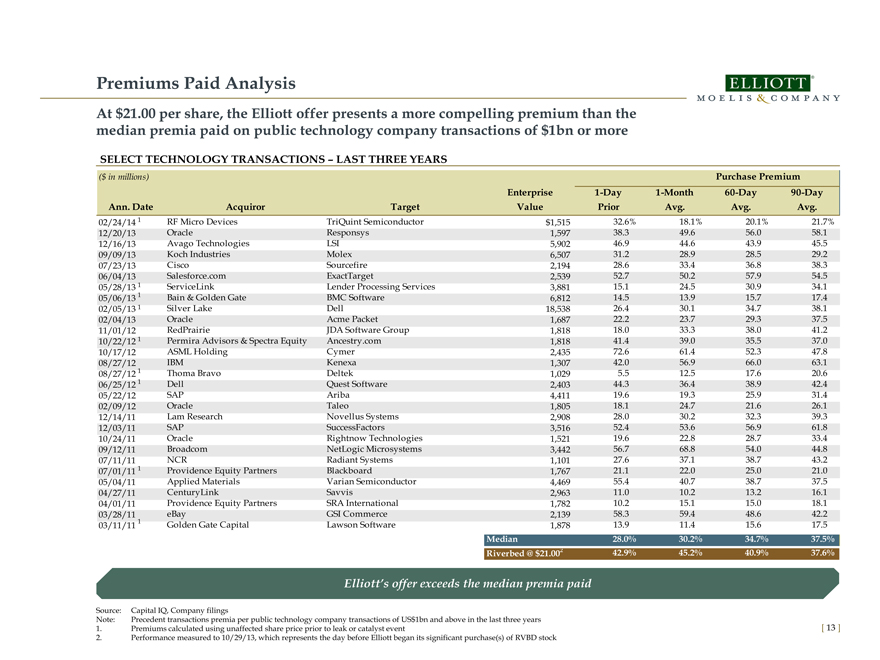
Premiums Paid Analysis
At $21.00 per share, the Elliott offer presents a more compelling premium than the median premia paid on public technology company transactions of $1bn or more
SELECT TECHNOLOGY TRANSACTIONS – LAST THREE YEARS
($ in millions) Purchase Premium
Enterprise 1-Day 1-Month 60-Day 90-Day
Ann. Date Acquiror Target Value Prior Avg. Avg. Avg.
02/24/14 1 RF Micro Devices TriQuint Semiconductor $1,515 32.6% 18.1% 20.1% 21.7%
12/20/13 Oracle Responsys 1,597 38.3 49.6 56.0 58.1
12/16/13 Avago Technologies LSI 5,902 46.9 44.6 43.9 45.5
09/09/13 Koch Industries Molex 6,507 31.2 28.9 28.5 29.2
07/23/13 Cisco Sourcefire 2,194 28.6 33.4 36.8 38.3
06/04/13 Salesforce.com ExactTarget 2,539 52.7 50.2 57.9 54.5
05/28/13 1 ServiceLink Lender Processing Services 3,881 15.1 24.5 30.9 34.1
05/06/13 1 Bain & Golden Gate BMC Software 6,812 14.5 13.9 15.7 17.4
02/05/13 1 Silver Lake Dell 18,538 26.4 30.1 34.7 38.1
02/04/13 Oracle Acme Packet 1,687 22.2 23.7 29.3 37.5
11/01/12 RedPrairie JDA software Group 1,818 18.0 33.3 38.0 41.2
10/22/12 1 Permira Advisors & Spectra Equity Ancestry.com 1,818 41.4 39.0 35.5 37.0
10/17/12 ASML Holding Cymer 2,435 72.6 61.4 52.3 47.8
08/27/12 IBM Kenexa 1,307 42.0 56.9 66.0 63.1
08/27/12 1 Thoma Bravo Deltek 1,029 5.5 12.5 17.6 20.6
06/25/12 1 Dell Quest Software 2,403 44.3 36.4 38.9 42.4
05/22/12 SAP Ariba 4,411 19.6 19.3 25.9 31.4
02/09/12 Oracle Taleo 1,805 18.1 24.7 21.6 26.1
12/14/11 Lam Research Novellus Systems 2,908 28.0 30.2 32.3 39.3
12/03/11 SAP SuccessFactors 3,516 52.4 53.6 56.9 61.8
10/24/11 Oracle Rightnow Technologies 1,521 19.6 22.8 28.7 33.4
09/12/11 Broadcom NetLogic Microsystems 3,442 56.7 68.8 54.0 44.8
07/11/11 NCR Radiant Systems 1,101 27.6 37.1 38.7 43.2
07/01/11 1 Providence Equity Partners Blackboard 1,767 21.1 22.0 25.0 21.0
05/04/11 Applied Materials Varian Semiconductor 4,469 55.4 40.7 38.7 37.5
04/27/11 CenturyLink Savvis 2,963 11.0 10.2 13.2 16.1
04/01/11 Providence Equity Partners SRA International 1,782 10.2 15.1 15.0 18.1
03/28/11 eBay GSI Commerce 2,139 58.3 59.4 48.6 42.2
03/11/11 1 Golden Gate Capital Lawson Software 1,878 13.9 11.4 15.6 17.5
Median 28.0% 30.2% 34.7% 37.5%
Riverbed @ $21.002 42.9% 45.2% 40.9% 37.6%
Elliott’s offer exceeds the median premia paid
Source: Capital IQ, Company filings
Note: Precedent transactions premia per public technology company transactions of US$1bn and above in the last three years
1. Premiums calculated using unaffected share price prior to leak or catalyst event
2. Performance measured to 10/29/13, which represents the day before Elliott began its significant purchase(s) of RVBD stock
[ 13 ]
