UNITED STATES
SECURITIES AND EXCHANGE COMMISSION
Washington, DC 20549
SCHEDULE 14A
(Rule 14A-101)
PROXY STATEMENT PURSUANT TO SECTION 14(a) OF THE
SECURITIES EXCHANGE ACT OF 1934
Filed by the Registrant x Filed by a Party other than the Registrant ¨
Check the appropriate box:
| ¨ | Preliminary Proxy Statement | |
| ¨ | Confidential, For Use of the Commission Only (as permitted by Rule 14a-6(e)(2)) | |
| ¨ | Definitive Proxy Statement | |
| x | Definitive Additional Materials | |
| ¨ | Soliciting Materials Pursuant to Section 240.14a-12 | |
RIVERBED TECHNOLOGY, INC.
(Name of Registrant as Specified in its Charter)
(Name of Person(s) Filing Proxy Statement, if other than the Registrant)
Payment of Filing Fee (Check the appropriate box):
| x | No fee required. | |||
| ¨ | Fee computed on table below per Exchange Act Rules 14a-6(i)(1) and 0-11. | |||
| 1) | Title of each class of securities to which the transaction applies:
| |||
| 2) | Aggregate number of securities to which transaction applies:
| |||
| 3) | Per unit price or other underlying value of transaction computed pursuant to Exchange Act Rule 0-11 (set forth the amount on which the filing fee is calculated and state how it was determined):
| |||
| 4) | Proposed maximum aggregate value of transaction:
| |||
| 5) | Total fee paid:
| |||
| ¨ | Fee paid previously with preliminary materials. | |||
| ¨ | Check box if any part of the fee is offset as provided by Exchange Act Rule 0-11(a)(2) and identify the filing for which the offsetting fee was paid previously. Identify the previous filing by registration statement number, or the Form or Schedule and the date of its filing. | |||
| 1) | Amount Previously Paid:
| |||
| 2) | Form, Schedule or Registration Statement No.:
| |||
| 3) | Filing Party:
| |||
| 4) | Date Filed:
| |||
Riverbed Technology, Inc.
2014 Annual Meeting Proxy Matters
May 2014
|
Pay-for-Performance Philosophy
Vast majority of Riverbed executive officers’ compensation is “at risk” and based
upon pay-for-performance metrics approved by independent Compensation
Committee designed to promote creation of long-term stockholder value by
aligning executive officers’ interests with those of our stockholders
Riverbed’s compensation philosophy has helped deliver superior long term
performance. While our 1 and 3 year Total Shareholder Return metrics fall short of
the returns Riverbed strives to deliver to stockholders, Riverbed has outperformed
over a 5 year period. Our business and operational performance in 2013 and
through the first quarter of 2014 demonstrate significant progress toward creating
value appreciation and industry leading returns to stockholders
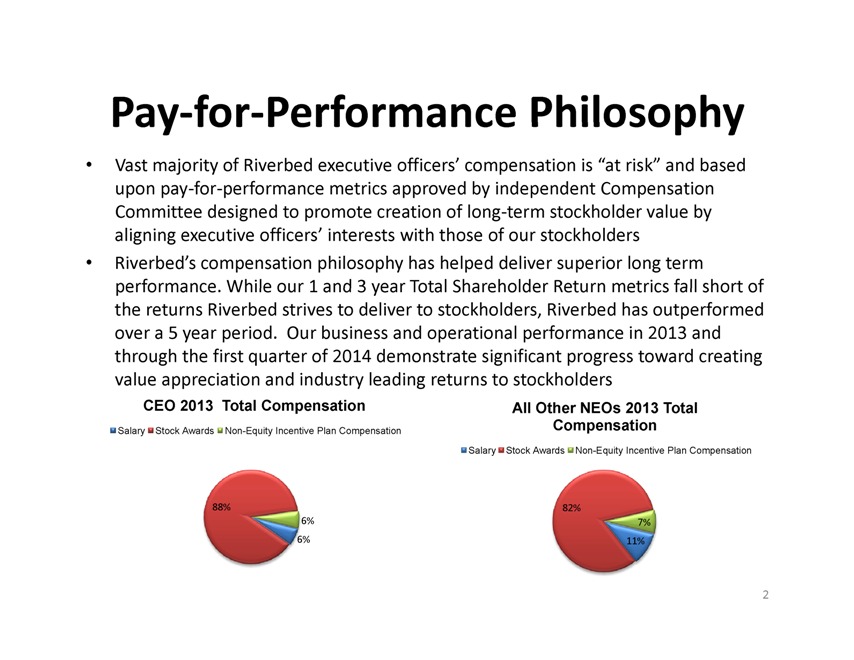
CEO 2013 Total Compensation
Salary Stock Awards Non-Equity Incentive Plan Compensation
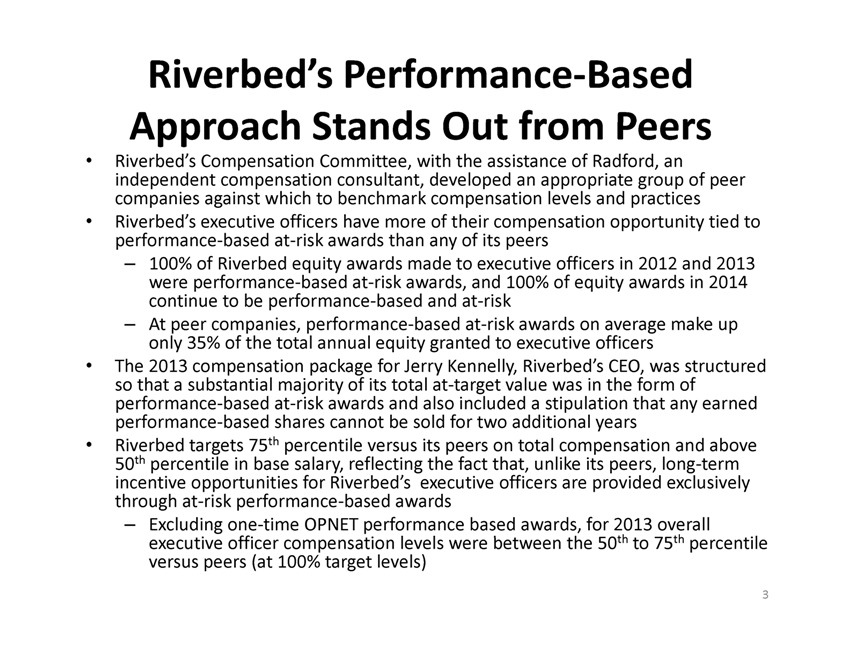
All Other NEOs 2013 Total
Compensation
Salary Stock Awards Non-Equity Incentive Plan Compensation
6%
88%
6%
11%
82%
7%
2
|
Riverbed’s Performance-Based
Approach Stands Out from Peers
Riverbed’s Compensation Committee, with the assistance of Radford, an
independent compensation consultant, developed an appropriate group of peer
companies against which to benchmark compensation levels and practices
Riverbed’s executive officers have more of their compensation opportunity tied to
performance-based at-risk awards than any of its peers
– 100% of Riverbed equity awards made to executive officers in 2012 and 2013
were performance-based at-risk awards, and 100% of equity awards in 2014
continue to be performance-based and at-risk
– At peer companies, performance-based at-risk awards on average make up
only 35% of the total annual equity granted to executive officers
The 2013 compensation package for Jerry Kennelly, Riverbed’s CEO, was structured
so that a substantial majority of its total at-target value was in the form of
performance-based at-risk awards and also included a stipulation that any earned
performance-based shares cannot be sold for two additional years
Riverbed targets 75th percentile versus its peers on total compensation and above
50th percentile in base salary, reflecting the fact that, unlike its peers, long-term
incentive opportunities for Riverbed’s executive officers are provided exclusively
through at-risk performance-based awards
– Excluding one-time OPNET performance based awards, for 2013 overall
executive officer compensation levels were between the 50th to 75th percentile
versus peers (at 100% target levels)
3
|
Selection of Relevant Peer Group is
Critical to Assessing Pay Practices
Peer group developed by Riverbed’s Compensation Committee includes technology
companies that (1) have similar financial profiles to Riverbed (based primarily on market
capitalization and industry, as well as revenue scale, projected growth and profitability),
(2) have similar business models, and/or (3) compete with Riverbed for talent
ISS’ list of 24 peers disregards 5 of Riverbed’s selected peers and includes 14 additional
companies that have profiles fundamentally different from Riverbed and the peer group
developed by the Riverbed Compensation Committee :
–6 of the 14 companies have declining year over year revenue
–13 of 14 have a lower market capitalization than Riverbed with an average market cap
of less than half of Riverbed’s
–13 of 14 are companies that Riverbed does not compete with for either business or
talent
The peer group chosen has a substantial effect on benchmarking comparisons:
–Riverbed CEO pay multiple relative to ISS designated peer group median is 3.26x
–Riverbed CEO pay multiple relative to Riverbed’s peer group median is 1.59x and if the
one-time OPNET performance award is excluded is 1.10x
4
|
Performance-Based Means At-Risk
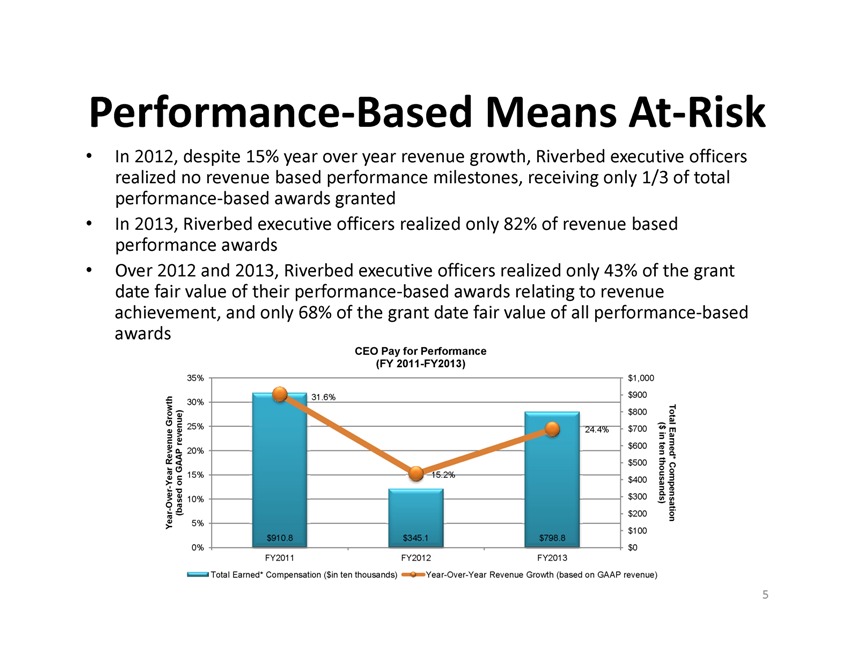
In 2012, despite 15% year over year revenue growth, Riverbed executive officers
realized no revenue based performance milestones, receiving only 1/3 of total
performance-based awards granted
In 2013, Riverbed executive officers realized only 82% of revenue based
performance awards
Over 2012 and 2013, Riverbed executive officers realized only 43% of the grant
date fair value of their performance-based awards relating to revenue
achievement, and only 68% of the grant date fair value of all performance-based
awards
CEO Pay for Performance
(FY 2011-FY2013)
31.6%
24.4%
$600
$700
$800
$900
$1,000
20%
25%
30%
35%
Total Earned
($ in ten
evenue Growth
AP revenue)
15.2%
$100
$200
$300
$400
$500
5%
10%
15%
* Compensation
thousands)
Year-Over-Year R
(based on GAA
910.8 345.1 798.8
0% $0
FY2011 FY2012 FY2013
Total Earned* Compensation ($in ten thousands) Year-Over-Year Revenue Growth (based on GAAP revenue)
5 |
|
|
OPNET Performance Awards were One-Time
Grants in Context of a Transformational
Transaction
Riverbed Compensation Committee designed one-time equity awards to
executive officers to achieve performance on OPNET integration in 2013
Performance metric of non-GAAP EPS for 2013 was 13% higher than non-
GAAP EPS performance target for 2013 LTIP designed to drive synergies of
expense savings through successful OPNET integration
Riverbed executive officers realized only 88% of the OPNET performance-based
equity awards as these were at-risk awards
Continued employment through 2014 also required in order to receive the
one-time OPNET performance awards
Compensation Committee understands the impact of the OPNET
performance awards--which were structured to address the largest
acquisition and resulting integration in Riverbed’s history—on overall
executive compensation levels, and does not expect such an award to
recur.
6
|
2014 Equity Incentive Plan
Consolidates existing stockholder – approved equity plans into a single
plan for more efficient use of equity awards but does not increase number
of shares available for equity awards
– The 12.4 million shares proposed to be made available under the 2014
Plan are already available under existing stock plans
2014 Plan relinquishes evergreen provisions that remained in the 2012
Stock Plan and Directors Plan, including an additional 9 million shares that
would have automatically been made available over the remaining terms
of those plans
Riverbed continues to promote creation of stockholder value by issuing
equity awards to our employees to align their interests with those of our
stockholders
Availability of shares under 2014 Plan is critical to employee recruitment
and retention
7
|
Equity Awards vs. Repurchases
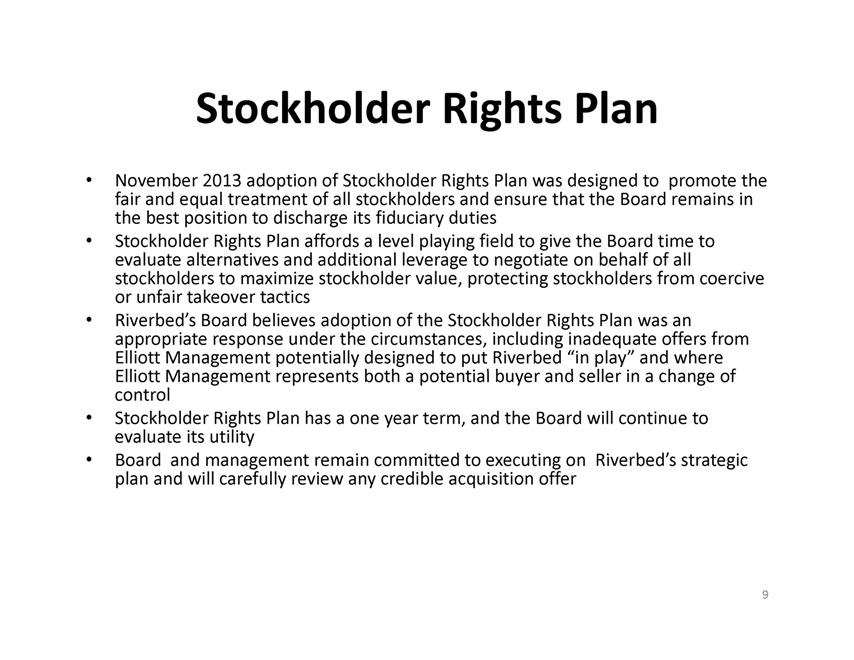
Through its active $750 million open market repurchase program,
Riverbed has been careful to ensure that equity awards have not
been dilutive to stockholders
– Riverbed has repurchased more stock than it has granted under
all of its stock plans since the Company’s repurchase program
was announced in August 2011
Annual Equity Grants vs Stock Repurchase Program
Stock Repurchase
0 Program
5,000,000
10,000,000
15,000,000
Shares
2013 Total Equity Plans
2012
2011*
2013 2012 2011*
Total Equity Plans 11,242,467 6,605,500 2,124,555
Stock Repurchase Program 12,417,354 7,376,859 1,499,931
8
|
Stockholder Rights Plan
November 2013 adoption of Stockholder Rights Plan was designed to promote the
fair and equal treatment of all stockholders and ensure that the Board remains in
the best position to discharge its fiduciary duties
Stockholder Rights Plan affords a level playing field to give the Board time to
evaluate alternatives and additional leverage to negotiate on behalf of all
stockholders to maximize stockholder value, protecting stockholders from coercive
or unfair takeover tactics
Riverbed’s Board believes adoption of the Stockholder Rights Plan was an
appropriate response under the circumstances, including inadequate offers from
Elliott Management potentially designed to put Riverbed “in play” and where
Elliott Management represents both a potential buyer and seller in a change of
control
Stockholder Rights Plan has a one year term, and the Board will continue to
evaluate its utility
Board and management remain committed to executing on Riverbed’s strategic
plan and will carefully review any credible acquisition offer
9
