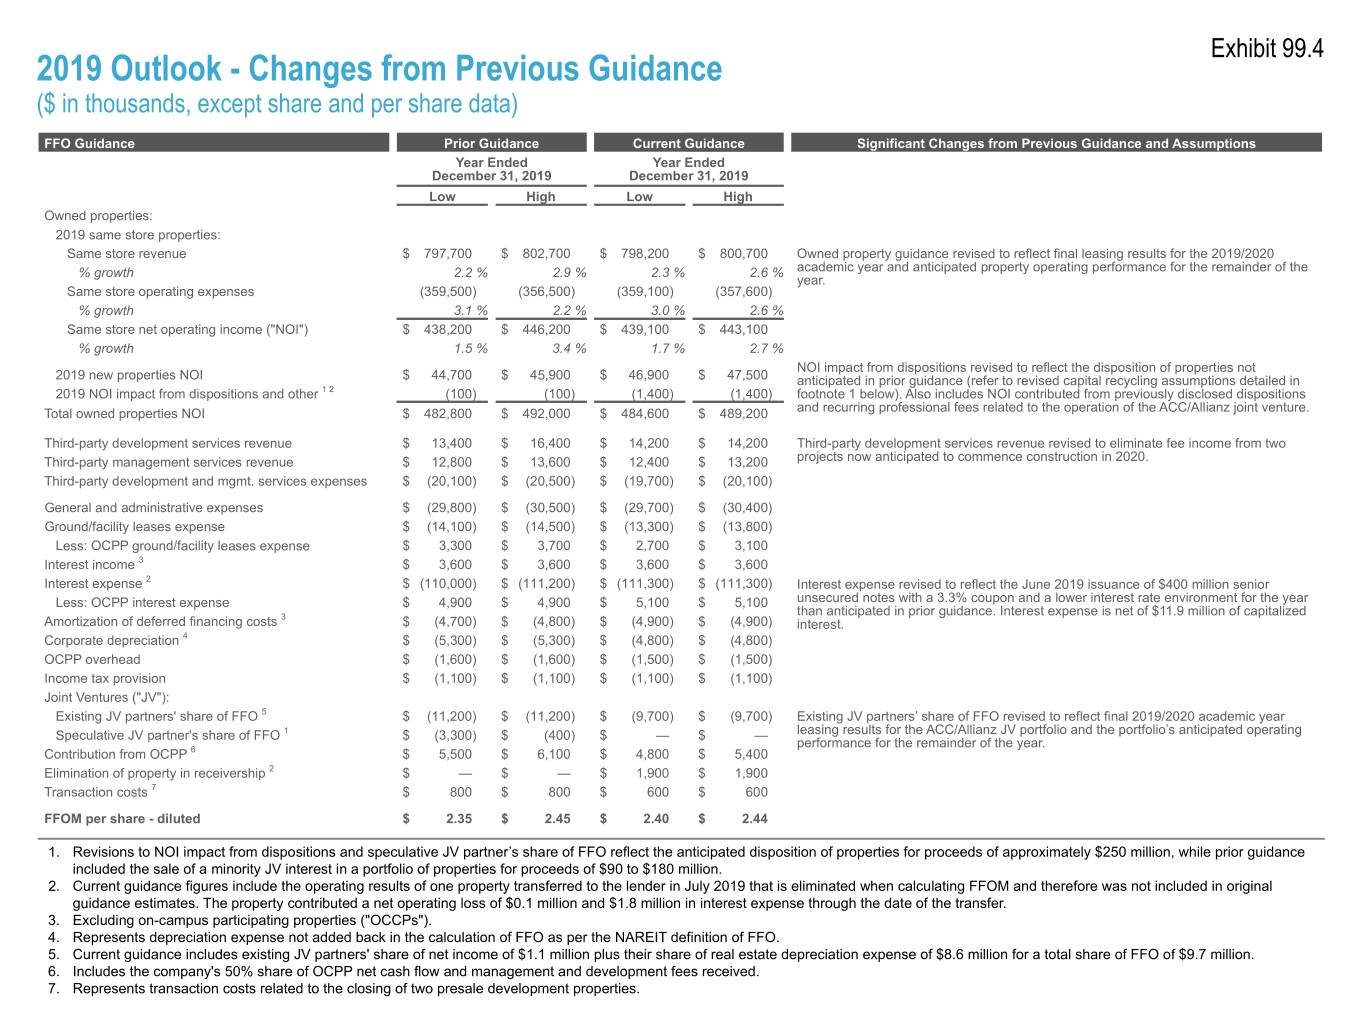
Exhibit 99.4 2019 Outlook - Changes from Previous Guidance ($ in thousands, except share and per share data) FFO Guidance Prior Guidance Current Guidance Significant Changes from Previous Guidance and Assumptions Year Ended Year Ended December 31, 2019 December 31, 2019 Low High Low High Owned properties: 2019 same store properties: Same store revenue $ 797,700 $ 802,700 $ 798,200 $ 800,700 Owned property guidance revised to reflect final leasing results for the 2019/2020 % growth 2.2 % 2.9 % 2.3 % 2.6 % academic year and anticipated property operating performance for the remainder of the year. Same store operating expenses (359,500) (356,500) (359,100) (357,600) % growth 3.1 % 2.2 % 3.0 % 2.6 % Same store net operating income ("NOI") $ 438,200 $ 446,200 $ 439,100 $ 443,100 % growth 1.5 % 3.4 % 1.7 % 2.7 % NOI impact from dispositions revised to reflect the disposition of properties not 2019 new properties NOI $ 44,700 $ 45,900 $ 46,900 $ 47,500 anticipated in prior guidance (refer to revised capital recycling assumptions detailed in 2019 NOI impact from dispositions and other 1 2 (100) (100) (1,400) (1,400) footnote 1 below). Also includes NOI contributed from previously disclosed dispositions Total owned properties NOI $ 482,800 $ 492,000 $ 484,600 $ 489,200 and recurring professional fees related to the operation of the ACC/Allianz joint venture. Third-party development services revenue $ 13,400 $ 16,400 $ 14,200 $ 14,200 Third-party development services revenue revised to eliminate fee income from two Third-party management services revenue $ 12,800 $ 13,600 $ 12,400 $ 13,200 projects now anticipated to commence construction in 2020. Third-party development and mgmt. services expenses $ (20,100) $ (20,500) $ (19,700) $ (20,100) General and administrative expenses $ (29,800) $ (30,500) $ (29,700) $ (30,400) Ground/facility leases expense $ (14,100) $ (14,500) $ (13,300) $ (13,800) Less: OCPP ground/facility leases expense $ 3,300 $ 3,700 $ 2,700 $ 3,100 Interest income 3 $ 3,600 $ 3,600 $ 3,600 $ 3,600 Interest expense 2 $ (110,000) $ (111,200) $ (111,300) $ (111,300) Interest expense revised to reflect the June 2019 issuance of $400 million senior Less: OCPP interest expense $ 4,900 $ 4,900 $ 5,100 $ 5,100 unsecured notes with a 3.3% coupon and a lower interest rate environment for the year 3 than anticipated in prior guidance. Interest expense is net of $11.9 million of capitalized Amortization of deferred financing costs $ (4,700) $ (4,800) $ (4,900) $ (4,900) interest. Corporate depreciation 4 $ (5,300) $ (5,300) $ (4,800) $ (4,800) OCPP overhead $ (1,600) $ (1,600) $ (1,500) $ (1,500) Income tax provision $ (1,100) $ (1,100) $ (1,100) $ (1,100) Joint Ventures ("JV"): Existing JV partners' share of FFO 5 $ (11,200) $ (11,200) $ (9,700) $ (9,700) Existing JV partners’ share of FFO revised to reflect final 2019/2020 academic year Speculative JV partner's share of FFO 1 $ (3,300) $ (400) $ — $ — leasing results for the ACC/Allianz JV portfolio and the portfolio’s anticipated operating performance for the remainder of the year. Contribution from OCPP 6 $ 5,500 $ 6,100 $ 4,800 $ 5,400 Elimination of property in receivership 2 $ — $ — $ 1,900 $ 1,900 Transaction costs 7 $ 800 $ 800 $ 600 $ 600 FFOM per share - diluted $ 2.35 $ 2.45 $ 2.40 $ 2.44 1. Revisions to NOI impact from dispositions and speculative JV partner’s share of FFO reflect the anticipated disposition of properties for proceeds of approximately $250 million, while prior guidance included the sale of a minority JV interest in a portfolio of properties for proceeds of $90 to $180 million. 2. Current guidance figures include the operating results of one property transferred to the lender in July 2019 that is eliminated when calculating FFOM and therefore was not included in original guidance estimates. The property contributed a net operating loss of $0.1 million and $1.8 million in interest expense through the date of the transfer. 3. Excluding on-campus participating properties ("OCCPs"). 4. Represents depreciation expense not added back in the calculation of FFO as per the NAREIT definition of FFO. 5. Current guidance includes existing JV partners' share of net income of $1.1 million plus their share of real estate depreciation expense of $8.6 million for a total share of FFO of $9.7 million. 6. Includes the company's 50% share of OCPP net cash flow and management and development fees received. 7. Represents transaction costs related to the closing of two presale development properties.
