UNITED STATES
SECURITIES AND EXCHANGE COMMISSION
WASHINGTON, D.C. 20549
FORM N-CSR
CERTIFIED SHAREHOLDER REPORT OF REGISTERED
MANAGEMENT INVESTMENT COMPANIES
Investment Company Act file number 811-21881
Oppenheimer Rochester Minnesota Municipal Fund
(Exact name of registrant as specified in charter)
6803 South Tucson Way, Centennial, Colorado 80112-3924
(Address of principal executive offices) (Zip code)
Arthur S. Gabinet
OFI Global Asset Management, Inc.
Two World Financial Center, New York, New York 10281-1008
(Name and address of agent for service)
Registrant’s telephone number, including area code: (303) 768-3200
Date of fiscal year end: March 31
Date of reporting period: 3/28/2013
Item 1. Reports to Stockholders.
ANNUAL REPORT
Oppenheimer Rochester Minnesota Municipal Fund

Table of Contents
Class A Shares
AVERAGE ANNUAL TOTAL RETURNS AT 3/28/13*
| | | | | | | | | | | | |
| | | Class A Shares of the Fund | | | Barclays
Municipal Bond
Index | |
| | | Without Sales Charge | | | With Sales Charge | | |
| 1-Year | | | 7.45 | % | | | 2.35 | % | | | 5.25 | % |
| 5-Year | | | 6.62 | | | | 5.58 | | | | 6.10 | |
| Since Inception (11/7/06) | | | 4.60 | | | | 3.81 | | | | 5.30 | |
The performance data quoted represents past performance, which does not guarantee future results. The investment return and principal value of an investment in the Fund will fluctuate so that an investor’s shares, when redeemed, may be worth more or less than their original cost. Fund returns include changes in share price, reinvested distributions, and a 4.75% maximum applicable sales charge except where “without sales charge” is indicated. Current performance may be lower or higher than the performance quoted. Returns do not consider capital gains or income taxes on an individual’s investment. For performance data current to the most recent month-end, visit oppenheimerfunds.com or call 1.800.CALL OPP (225.5677).
OppenheimerFunds/Rochester is using social media to provide timely information related to muni market developments at www.twitter.com/RochesterFunds.
*March 28, 2013, was the last business day of the Fund’s reporting period. Index returns are calculated through March 31, 2013.
| | |
| 2 | | OPPENHEIMER ROCHESTER MINNESOTA MUNICIPAL FUND |
Fund Performance Discussion
The Fund’s Class A shares produced an annual total return of 7.45% (without sales charge) for the 12 months ended March 28, 2013, the last business day of the reporting period. By comparison, the annual total return of the Fund’s benchmark, the Barclays Municipal Bond Index, was 5.25% for the same period. Despite a challenging interest-rate environment this reporting period, the Fund generated a tax-free yield of 3.66% at net asset value, based on the 35-day accrual period ended March 26, 2013.
MARKET OVERVIEW
The municipal market continued to rally for much of this reporting period, despite sluggish economic growth and declining muni prices in the first quarter of 2013. For the first nine months of this reporting period, investor demand remained strong and net inflows were the norm as income-seeking investors redirected assets into municipal bond funds.
AAA-rated municipal securities remained “cheap to Treasuries” during this reporting period, a condition that exists when nominal, pre-tax muni yields exceed available Treasury yields. As of March 28, 2013, the average yield on 30-year, AAA-rated muni bonds was
3.19%, down 32 basis points from March 30, 2012, the last business day of the Fund’s previous 12-month reporting period. On March 28, 2013, the average yield on 10-year, AAA-rated muni bonds was 1.96%, down 18 basis points from the March 2012 date, and the average yield on 2-year, AAA-rated muni bonds was 0.33%, down 6 basis points from the March 2012 date. The current market conditions allow investors to earn higher nominal yields on their muni holdings than on Treasuries and to benefit further from the federal, state and, where applicable, local tax exemptions on municipal investment income.
YIELDS & DISTRIBUTIONS FOR CLASS A SHARES
| | | | |
| Dividend Yield w/o sales charge | | | 3.66 | % |
| Dividend Yield with sales charge | | | 3.49 | |
| Standardized Yield | | | 2.52 | |
| Taxable Equivalent Yield | | | 4.83 | |
| Last distribution (3/26/13) | | | $0.040 | |
| Total distributions (4/1/12 to 3/31/13) | | | $0.528 | |
Endnotes for this discussion begin on page 11 of this report
| | | | |
| OPPENHEIMER ROCHESTER MINNESOTA MUNICIPAL FUND | | | 3 | |
The Federal Reserve (the “Fed”) also provided good news for current muni bondholders this reporting period as it repeatedly extended its timeframe for changing the Fed Funds target rate, the short-term interest rate it controls. At the outset of this reporting period, the rate stood at zero to 0.25% and the Fed’s expectation was that the rate would likely remain very low until late 2014.
In September 2012, this timeframe was lengthened to mid-2015 and then, in December 2012, linked to the unemployment rate. Rates will not move until unemployment is below 6.5%, the Fed announced, unless inflation rises above 2.5%. Given the current rates, the only plausible change would be an increase. We remind investors that a change in the Fed Funds rate does not automatically translate into a change in longer-term interest rates, which are determined by the marketplace.
At a March 20, 2013, press conference, Federal Reserve Chairman Ben S. Bernanke discussed the Fed’s thinking: “We’re not measuring success in terms of the stock market. We’re measuring success in terms of our mandate, which is stable employment and price stability.”
In February 2013, Minnesota’s economic forecast brightened a bit with new revenue projections that added $295 million to the state’s surplus and chopped $463 million off its projected $1.1 billion deficit for its next 2-year budget. The new forecast projects the
state will close the current fiscal year with a positive balance of $295 million. Under state law, most will be used to continue to pay off school aid that was delayed to help close the fiscal 2012-2013 budget deficit. The new forecast cites higher-than-expected revenues and a decrease in spending as contributing factors.
In response to rosier revenue projections, Governor Mark Dayton revised his $38 billion 2-year budget proposal for fiscal 2014-2015 in March. The state’s sales tax will remain unchanged but a proposed increase on the income tax rate for top earners remains intact. Revenue from this proposed tax would help close a $1 billion deficit, pay for property tax relief and provide an additional $640 million for education. The budget also provides an additional $240 million for local and county government aid.
Minnesota is banking on electronic bingo games to bolster gambling revenues, which are being used to repay the state’s $348 million share of borrowing for the new $900 million football stadium for the Vikings. In March 2013, the Minnesota Gambling Control Board approved the new charitable games and hopes to lure gamblers by offering prizes up to $75,000. Earlier, the state launched electronic pull-tab games to help finance the stadium but revenues have so far fallen short of projections. The taxes that the state collects on gambling profits are given to charities.
| | |
| 4 | | OPPENHEIMER ROCHESTER MINNESOTA MUNICIPAL FUND |
At the end of this reporting period, Minnesota’s general obligation debt was rated Aa1 by Moody’s Investors Service and AA-plus by Standard & Poor’s and Fitch Ratings.
The average distribution yield in Lipper’s Minnesota Municipal Debt Funds category was 2.76% at the end of this reporting period. At 3.66%, the distribution yield for this Fund’s Class A shares was 90 basis points higher than the category average.
Successful investors, we have found, maintain a long-term perspective regardless of the specific developments associated with any given reporting period. To maximize the benefits of municipal bond fund investing, many investors reinvest their dividends and allow the income generated from their investments to compound over time.
FUND PERFORMANCE
Oppenheimer Rochester Minnesota Municipal Fund held nearly 290 securities as of March 28, 2013. The Fund was invested in a broad range of sectors, providing shareholders with a diversity of holdings that we believe would be difficult and costly to replicate in an individual portfolio.
As bond prices rose this reporting period, declining municipal interest rates put pressure on the Class A dividend. Beginning with the August payout, the dividend was lowered to 4.4 cents per Class A share, from 4.8
cents per share, and lowered again, to 4.0 cents per Class A share, beginning with the December payout.
During this reporting period, refundings became increasingly common, which heightened dividend pressure throughout the muni bond fund industry. In refundings, municipal issuers seek to reduce their debt service obligations by exercising the call feature on their higher coupon bonds and then borrowing at lower interest rates. During this reporting period, these types of transactions made it difficult for the Fund to replace the called bonds with bonds that had equally attractive coupons. If the current climate persists, we believe that muni fund dividends industry wide will continue to be similarly pressured.
Despite this pressure, Oppenheimer Rochester Minnesota Municipal Fund’s Class A shares generated a distribution yield of 3.66% at NAV at the end of this reporting period, which placed them in the top 10% of share classes in Lipper’s Minnesota Municipal Debt Funds category. The average distribution yield in Lipper’s Minnesota category was 2.76% at month’s end.
The Fund was invested in the hospital/healthcare sector, representing 17.5% of the Fund’s total assets at the end of this reporting period and contributing positively to Fund performance. Our holdings in this sector consist of securities across the credit spectrum. For most of this reporting period, the debate about the Affordable Care Act of 2010 continued, even though the Supreme
| | | | |
| OPPENHEIMER ROCHESTER MINNESOTA MUNICIPAL FUND | | | 5 | |

The Rochester portfolio management team
Court had upheld the Act’s “individual mandate” in late June 2012. The voices of those who were suggesting that Congress would revisit and perhaps seek to override the legislation were largely silenced after Election Day.
The Fund’s investments in the multifamily housing sector represented 13.7% of the Fund’s total assets at the end of this reporting period. These securities continued to provide competitive levels of tax-free income and contributed positively to the Fund’s total return, despite the difficult conditions in the national housing market this reporting period. We continue to believe that long-term investors should ultimately benefit from this Fund’s carefully selecting holdings in the housing sectors.
The adult living facilities sector represented 13.5% of the Fund’s total assets at the end of this reporting period and contributed positively to Fund performance. These bonds finance various projects at senior living centers and tend to outperform in densely populated geographies with strong real estate values.
Tax increment financing (TIF) bonds constituted 10.4% of the Fund’s total assets this reporting period. Traditionally, this type of financing has been used for urban and suburban renewal projects. When tax collections increase, driven either by an improving economy or inflation, the credit quality of these types of securities generally improves and can lead to enhanced performance.
The Fund continued to favor the higher education sector this reporting period, which
| | |
| 6 | | OPPENHEIMER ROCHESTER MINNESOTA MUNICIPAL FUND |

The Rochester credit research team
represented 8.1% of the Fund’s total assets and contributed positively to Fund performance. The investment-grade bonds we hold in this sector have regularly provided high levels of tax-free income with what we believe to be far less credit risk than their external ratings would suggest.
The Fund’s holdings in municipal bonds issued by electric utilities represented 7.8% of total assets as of March 28, 2013. Our holdings in this sector, which contributed positively to the Fund’s performance this reporting period, consist of securities in the mid-range of the credit spectrum.
During this reporting period, the Fund remained invested in municipal inverse-floating rate securities, which are tax-exempt securities with interest payments that move inversely to changes in short-term interest
rates. “Inverse floaters” generally offer higher tax-free yields than fixed-rate bonds of comparable maturity and credit quality, but they face greater price volatility, too. During this reporting period, “inverse floaters” provided attractive levels of tax-free income and contributed positively to the Fund’s total return. This outcome illustrates why we believe that “inverse floaters” belong in this Fund’s portfolio.
Our approach to municipal bond investing is flexible and responsive to market conditions. Shareholders should note that market conditions during this reporting period did not affect the Fund’s overall investment objectives or cause it to pay any capital gain distributions. In closing, we believe that our time-tested strategies and the Fund’s structure and sector composition will continue to
| | | | |
| OPPENHEIMER ROCHESTER MINNESOTA MUNICIPAL FUND | | | 7 | |
benefit fixed-income investors through interest rate and economic cycles.
INVESTMENT STRATEGY
The Rochester investment team focuses exclusively on municipal bonds and has consistently used a time-tested, value-oriented and security-specific approach to fund management. We know that market conditions can and do fluctuate, but we do not waver in our belief in the power of tax-free yield to help investors achieve their long-term objectives.
Our approach to municipal bond investing is flexible and responsive to market conditions.
The Fund invests primarily in investment-grade municipal securities and may invest up to 25% of its total assets in below-investment grade securities, or “junk” bonds; the percentage of assets is measured at the time of purchase and the credit quality of the securities is based on Nationally Recognized Statistical Rating Organization (“NRSRO”) ratings or, if no NRSRO rating, on internal ratings.
Our team continually searches for undervalued bonds that we believe will provide a meaningful level of tax-free income until maturity. Rather than making allocation shifts based on expected market conditions, we search the marketplace for what we believe to be the best values for generating income. It remains important to note that we do not manage our funds based on predictions of interest rate changes.
Instead, our investment approach involves scouring the market for municipal securities that meet our stringent credit criteria and buying bonds that we believe will deliver above-average yields relative to peer funds. We focus on identifying inefficiencies in market pricing that can lead to investment advantages. We seek to maintain a thoughtful mix of industry sectors, maturities and credit ratings in this Fund’s portfolio.
The Rochester team also prospects for yield-enhancing opportunities in the secondary market, often picking up odd lots that we believe can add significant incremental yield to our portfolios. We will also look for non-rated issues with solid credit qualities, which we believe can often help enhance a fund’s tax-free yield. Investors should note that non-rated or unrated securities may or may not be the equivalent of investment-grade securities.
The Rochester Way, we believe, distinguishes our approach to municipal investing from those of our competitors.
Daniel G. Loughran,
Senior Vice President, Senior Portfolio Manager and Team Leader, on behalf of the rest of the Rochester portfolio management team: Scott S. Cottier, Troy E. Willis, Mark R. DeMitry, Michael L. Camarella, Charles S. Pulire and research analyst Elizabeth S. Mossow.
| | |
| 8 | | OPPENHEIMER ROCHESTER MINNESOTA MUNICIPAL FUND |
Top Holdings and Allocations
| | | | |
| TOP TEN CATEGORIES | | | |
| Hospital/Healthcare | | | 17.5 | % |
| Multifamily Housing | | | 13.7 | |
| Adult Living Facilities | | | 13.5 | |
| Tax Increment Financing (TIF) | | | 10.4 | |
| Higher Education | | | 8.1 | |
| Electric Utilities | | | 7.8 | |
| Education | | | 6.2 | |
| Marine/Aviation Facilities | | | 4.9 | |
| Municipal Leases | | | 3.5 | |
| General Obligation | | | 2.8 | |
Portfolio holdings are subject to change. Percentages are as of March 28, 2013, and are based on total assets. March 28, 2013, was the last business day of the Fund’s reporting period. See Note 1 of the accompanying Notes to Financial Statements.
| | | | | | | | | | | | |
| CREDIT ALLOCATION | |
| | | NRSRO-
Rated | | | Manager-
Rated | | | Total | |
| AAA | | | 9.6 | % | | | 0.0 | % | | | 9.6 | % |
| AA | | | 23.3 | | | | 0.0 | | | | 23.3 | |
| A | | | 15.9 | | | | 0.0 | | | | 15.9 | |
| BBB | | | 14.8 | | | | 15.4 | | | | 30.2 | |
| BB or lower | | | 1.8 | | | | 19.2 | | | | 21.0 | |
| Total | | | 65.4 | % | | | 34.6 | % | | | 100.0 | % |
The percentages above are based on the market value of the securities as of March 28, 2013, and are subject to change. OppenheimerFunds, Inc. determines the credit allocation of the Fund’s assets using ratings by nationally recognized statistical rating organizations (NRSROs), such as Standard & Poor’s. For any security rated by an NRSRO other than S&P, OppenheimerFunds, Inc. converts that security’s rating to the equivalent S&P rating. If two or more NRSROs have assigned a rating to a security, the highest rating is used. For securities not rated by an NRSRO, OppenheimerFunds, Inc. uses its own credit analysis to assign ratings in categories similar to those of S&P. The use of similar categories is not an indication that OppenheimerFunds, Inc.’s credit analysis process is consistent or comparable with any NRSRO’s process were that NRSRO to rate the same security.
For the purposes of this Credit Allocation table, securities rated within the NRSROs’ four highest categories – AAA, AA, A and BBB – are investment-grade securities. For further details, please consult the Fund’s prospectus or Statement of Additional Information.
| | | | |
| OPPENHEIMER ROCHESTER MINNESOTA MUNICIPAL FUND | | | 9 | |
Performance
| | | | | | | | |
| DISTRIBUTION YIELDS | |
| As of 3/28/13 | | | | | | |
| | | Without Sales Chg. | | | With Sales Chg. | |
| Class A | | | 3.66 | % | | | 3.49 | % |
| Class B | | | 2.80 | | | | N/A | |
| Class C | | | 2.80 | | | | N/A | |
| Class Y | | | 3.68 | | | | N/A | |
| | | | | | | | | | | | |
| STANDARDIZED YIELDS | | | | | TAXABLE EQUIVALENT YIELDS | |
| For the 30 Days Ended 3/31/13 | | | | | As of 3/31/13 | | | | |
| Class A | | | 2.52 | % | | | | Class A | | | 4.83 | % |
| Class B | | | 1.91 | | | | | Class B | | | 3.66 | |
| Class C | | | 1.90 | | | | | Class C | | | 3.64 | |
| Class Y | | | 2.62 | | | | | Class Y | | | 5.02 | |
AVERAGE ANNUAL TOTAL RETURNS WITHOUT SALES CHARGE AS OF 3/28/13
| | | | | | | | | | | | | | | | | | | | |
| | | | | | Inception Date | | | 1-Year | | | 5-Year | | | Since Inception | |
| Class A | | | (OPAMX) | | | | 11/7/06 | | | | 7.45 | % | | | 6.62 | % | | | 4.60 | % |
| Class B | | | (OPBMX) | | | | 11/7/06 | | | | 6.58 | | | | 5.81 | | | | 3.86 | |
| Class C | | | (OPCMX) | | | | 11/7/06 | | | | 6.66 | | | | 5.81 | | | | 3.79 | |
| Class Y | | | (OPYMX) | | | | 7/29/11 | | | | 7.53 | | | | N/A | | | | 10.78 | |
|
| AVERAGE ANNUAL TOTAL RETURNS WITH SALES CHARGE AS OF 3/28/13 | |
| | | | Inception Date | | | 1-Year | | | 5-Year | | | Since Inception | |
| Class A | | | (OPAMX) | | | | 11/7/06 | | | | 2.35 | % | | | 5.58 | % | | | 3.81 | % |
| Class B | | | (OPBMX) | | | | 11/7/06 | | | | 1.58 | | | | 5.49 | | | | 3.86 | |
| Class C | | | (OPCMX) | | | | 11/7/06 | | | | 5.66 | | | | 5.81 | | | | 3.79 | |
| Class Y | | | (OPYMX) | | | | 7/29/11 | | | | 7.53 | | | | N/A | | | | 10.78 | |
| | |
| 10 | | OPPENHEIMER ROCHESTER MINNESOTA MUNICIPAL FUND |
COMPARISON OF CHANGE IN VALUE OF $10,000 HYPOTHETICAL INVESTMENTS IN:
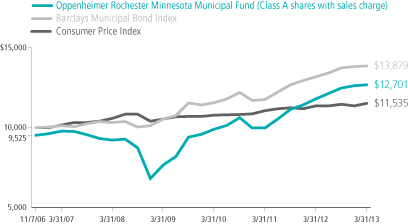
The performance data quoted represents past performance, which does not guarantee future results. The investment return and principal value of an investment in the Fund will fluctuate so that an investor’s shares, when redeemed, may be worth more or less than their original cost. Current performance may be lower or higher than the performance quoted. Returns do not consider capital gains or income taxes on an individual’s investment. For performance data current to the most recent month-end, visit oppenheimerfunds.com or call 1.800.CALL OPP (225.5677). Fund returns include changes in share price, reinvested distributions, and the applicable sales charge: for Class A shares, the current maximum initial sales charge of 4.75%; for Class B shares, the contingent deferred sales charge of 5% (1-year) and 2% (5-year); and for Class C, the contingent deferred sales charge of 1% for the 1-year period. There is no sales charge for Class Y shares.
March 28, 2013, was the last business day of the Fund’s reporting period. See Note 1 of the accompanying Notes to Financial Statements. Index returns are calculated through March 31, 2013.
The Fund’s performance is compared to the performance of that of the Barclays Municipal Bond Index, an unmanaged index of a broad range of investment-grade municipal bonds that is a measure of the general municipal bond market. Indices are unmanaged and cannot be purchased by investors. Index performance includes reinvestment of income, but does not reflect transaction costs, fees, expenses or taxes. Index performance is shown for illustrative purposes only as a benchmark for the Fund’s performance, and does not predict or depict performance of the Fund. The Fund’s performance reflects the effects of the Fund’s business and operating expenses.
| | | | |
| OPPENHEIMER ROCHESTER MINNESOTA MUNICIPAL FUND | | | 11 | |
Distribution yields for Class A shares are based on dividends of $0.040 for the 35-day accrual period ended March 26, 2013. The yield without sales charge for Class A shares is calculated by dividing annualized dividends by the Class A net asset value on March 26, 2013; for the yield with sales charge, the denominator is the Class A maximum offering price on that date. Distribution yields for Class B, C and Y are annualized based on dividends of $0.0306, $0.0305 and $0.0401, respectively, for the 35-day accrual period ended March 26, 2013, and on the corresponding net asset values on that date.
Standardized yield is based on the Fund’s net investment income for the 30-day period ended March 31, 2013, and either that date’s maximum offering price (for Class A shares) or net asset value (for the other classes). Each result is compounded semiannually and annualized. Falling share prices artificially increase yields.
The average distribution yield in this Fund’s Lipper category was calculated based on the distributions and the final net asset values (NAVs) of the reporting period for the funds in each category. The average yield at NAV in Lipper’s Minnesota Municipal Debt Funds category is based on 43 NAVs, one for each class of each fund in the category; a fund can have up to 4 classes. Lipper yields do not include sales charges—which, if included, would reduce results.
Taxable equivalent yield is based on the standardized yield and the 2013 combined federal and Minnesota tax rate of 47.8%. Calculations factor in the 3.8% tax on unearned income under the Patient Protection and Affordable Care Act, as applicable. A portion of the Fund’s distributions may be subject to tax; distributions may also increase an investor’s exposure to the alternative minimum tax. Capital gains distributions are taxable as capital gains. Tax treatments of the Fund’s distributions and capital gains may vary by state; investors should consult a tax advisor to determine if the Fund is appropriate for them. Each result is compounded semiannually and annualized. Falling share prices artificially increase yields. This Report must be preceded or accompanied by a Fund prospectus.
The average yields for AAA-rated municipal securities are provided by Municipal Market Advisors and are based on its benchmark of general obligation bonds structured with a 5% coupon. The MMA 5% benchmark is constructed using yields from the leading underwriters, who represent a significant percentage of the primary activity of the top 10 underwriters and therefore the total issuance. The benchmark that was used in shareholder reports before December 31, 2012, was based on par coupon yields and included a broader set of participants; the 5% benchmark is now considered the industry standard.
The Fund’s investment strategy and focus can change over time. The mention of specific fund holdings does not constitute a recommendation by OppenheimerFunds, Inc. or its affiliates.
Before investing in any of the Oppenheimer funds, investors should carefully consider a fund’s investment objectives, risks, charges and expenses. Fund
| | |
| 12 | | OPPENHEIMER ROCHESTER MINNESOTA MUNICIPAL FUND |
prospectuses and summary prospectuses contain this and other information about the funds, and may be obtained by asking your financial advisor, visiting oppenheimerfunds.com, or calling 1.800.CALL OPP (225.5677). Read prospectuses and summary prospectuses carefully before investing.
Shares of Oppenheimer funds are not deposits or obligations of any bank, are not guaranteed by any bank, are not insured by the FDIC or any other agency, and involve investment risks, including the possible loss of the principal amount invested.
| | | | |
| OPPENHEIMER ROCHESTER MINNESOTA MUNICIPAL FUND | | | 13 | |
Fund Expenses
Fund Expenses. As a shareholder of the Fund, you incur two types of costs: (1) transaction costs, which may include sales charges (loads) on purchase payments, contingent deferred sales charges on redemptions and (2) ongoing costs, including management fees; distribution and service fees; and other Fund expenses. These examples are intended to help you understand your ongoing costs (in dollars) of investing in the Fund and to compare these costs with the ongoing costs of investing in other mutual funds.
The examples are based on an investment of $1,000.00 invested at the beginning of the period and held for the entire 6-month period ended March 28, 2013.
Actual Expenses. The first section of the table provides information about actual account values and actual expenses. You may use the information in this section for the class of shares you hold, together with the amount you invested, to estimate the expense that you paid over the period. Simply divide your account value by $1,000.00 (for example, an $8,600.00 account value divided by $1,000.00 = 8.60), then multiply the result by the number in the first section under the heading entitled “Expenses Paid During Period” to estimate the expenses you paid on your account during this period.
Hypothetical Example for Comparison Purposes. The second section of the table provides information about hypothetical account values and hypothetical expenses based on the Fund’s actual expense ratio for each class of shares, and an assumed rate of return of 5% per year for each class before expenses, which is not the actual return. The hypothetical account values and expenses may not be used to estimate the actual ending account balance or expenses you paid for the period. You may use this information to compare the ongoing costs of investing in the Fund and other funds. To do so, compare this 5% hypothetical example for the class of shares you hold with the 5% hypothetical examples that appear in the shareholder reports of the other funds.
Please note that the expenses shown in the table are meant to highlight your ongoing costs only and do not reflect any transactional costs, such as front-end or contingent deferred sales charges (loads), or a $12.00 fee imposed annually on accounts valued at less than $500.00 (subject to exceptions described in the Statement of Additional Information). Therefore, the “hypothetical” section of the table is useful in comparing ongoing costs only, and will not help you determine the relative total costs of owning different funds. In addition, if these transactional costs were included, your costs would have been higher.
| | |
| 14 | | OPPENHEIMER ROCHESTER MINNESOTA MUNICIPAL FUND |
Fund Expenses Continued
| | | | | | | | | | | | |
| Actual | | Beginning
Account
Value
October 1, 2012 | | | Ending
Account
Value
March 28, 2013 | | | Expenses
Paid During
6 Months Ended
March 28, 2013 | |
| Class A | | $ | 1,000.00 | | | $ | 1,016.60 | | | $ | 4.31 | |
| Class B | | | 1,000.00 | | | | 1,012.10 | | | | 8.07 | |
| Class C | | | 1,000.00 | | | | 1,012.80 | | | | 8.03 | |
| Class Y | | | 1,000.00 | | | | 1,016.90 | | | | 4.01 | |
| | | |
Hypothetical
(5% return before expenses) | | | | | | | | | |
| Class A | | | 1,000.00 | | | | 1,020.25 | | | | 4.32 | |
| Class B | | | 1,000.00 | | | | 1,016.53 | | | | 8.09 | |
| Class C | | | 1,000.00 | | | | 1,016.58 | | | | 8.04 | |
| Class Y | | | 1,000.00 | | | | 1,020.55 | | | | 4.02 | |
Expenses are equal to the Fund’s annualized expense ratio for that class, multiplied by the average account value over the period, multiplied by 179/365 (to reflect the one-half year period). Those annualized expense ratios based on the 6-month period ended March 28, 2013 are as follows:
| | | | |
| Class | | Expense Ratios | |
| Class A | | | 0.87 | % |
| Class B | | | 1.63 | |
| Class C | | | 1.62 | |
| Class Y | | | 0.81 | |
The expense ratios reflect voluntary waivers and/or reimbursements of expenses by the Fund’s Manager. Some of these undertakings may be modified or terminated at any time, as indicated in the Fund’s prospectus. The “Financial Highlights” tables in the Fund’s financial statements, included in this report, also show the gross expense ratios, without such waivers or reimbursements and reduction to custodian expenses, if applicable.
| | | | |
| OPPENHEIMER ROCHESTER MINNESOTA MUNICIPAL FUND | | | 15 | |
STATEMENT OF INVESTMENTS March 28, 2013*
| | | | | | | | | | | | | | | | |
Principal
Amount | | | | | Coupon | | | Maturity | | | Value | |
| | | | | | | | | | | | | | | | | |
| | Municipal Bonds and Notes—103.6% | | | | | |
| | Minnesota—100.3% | | | | | |
| $ | 120,000 | | | Aitkin, MN Health Care Facilities (Riverwood Healthcare Center) | | | 5.600 | % | | | 02/01/2032 | | | $ | 123,845 | |
| | 290,000 | | | Anoka County, MN Charter School1 | | | 5.000 | | | | 06/01/2027 | | | | 305,846 | |
| | 300,000 | | | Anoka County, MN Charter School1 | | | 5.000 | | | | 06/01/2032 | | | | 310,881 | |
| | 1,000,000 | | | Anoka County, MN Charter School1 | | | 5.000 | | | | 06/01/2043 | | | | 1,013,890 | |
| | 25,000 | | | Anoka County, MN Hsg. & Redevel. Authority (Premier FMC) | | | 6.625 | | | | 05/01/2030 | | | | 27,532 | |
| | 1,000,000 | | | Anoka County, MN Hsg. & Redevel. Authority (Woodland Park Apts.)1 | | | 5.000 | | | | 04/01/2027 | | | | 1,097,110 | |
| | 500,000 | | | Anoka, MN Health Care Facility (Homestead Anoka) | | | 7.000 | | | | 11/01/2046 | | | | 539,435 | |
| | 250,000 | | | Apple Valley, MN Hsg. & Health Care (Seasons at Apple Valley) | | | 6.750 | | | | 03/01/2040 | | | | 270,470 | |
| | 25,000 | | | Austin, MN GO1 | | | 5.000 | | | | 10/01/2018 | | | | 25,064 | |
| | 750,000 | | | Austin, MN Hsg. & Redevel. Authority (Chauncey & Courtyard Apts.)1 | | | 5.000 | | | | 01/01/2031 | | | | 828,960 | |
| | 850,000 | | | Austin, MN Hsg. & Redevel. Authority (St. Marks Lutheran Home) | | | 7.000 | | | | 12/01/2046 | | | | 920,100 | |
| | 250,000 | | | Baytown, MN Township (Friends of St. Croix Preparatory Academy/St. Croix Preparatory Academy1 | | | 5.750 | | | | 08/01/2042 | | | | 252,263 | |
| | 430,000 | | | Baytown, MN Township (St. Croix Preparatory Academy)1 | | | 7.000 | | | | 08/01/2038 | | | | 458,341 | |
| | 85,000 | | | Blue Earth County, MN Economic Devel. Authority1 | | | 5.000 | | | | 12/01/2027 | | | | 92,075 | |
| | 20,000 | | | Brainerd, MN Hsg. & Redevel. Authority, Series A1 | | | 5.000 | | | | 02/01/2019 | | | | 20,048 | |
| | 20,000 | | | Brainerd, MN Hsg. & Redevel. Authority, Series A1 | | | 5.000 | | | | 02/01/2022 | | | | 20,039 | |
| | 150,000 | | | Breckenridge, MN (Catholic Health Initiatives)1 | | | 5.000 | | | | 05/01/2030 | | | | 155,853 | |
| | 1,025,000 | | | Buffalo, MN Health Care (Central Minnesota Senior Hsg.) | | | 5.375 | | | | 09/01/2026 | | | | 1,057,892 | |
| | 1,230,000 | | | Buffalo, MN Independent School District No. 8771 | | | 4.000 | | | | 02/01/2024 | | | | 1,390,195 | |
| | 1,150,000 | | | Central Minnesota Muni Power Agency (Brookings-Southeast Twin Cities Transmissions)1 | | | 5.000 | | | | 01/01/2032 | | | | 1,300,869 | |
| | 1,500,000 | | | Central Minnesota Muni Power Agency (Brookings-Southeast Twin Cities Transmissions)1 | | | 5.000 | | | | 01/01/2042 | | | | 1,657,065 | |
| | 1,100,000 | | | Chippewa County, MN Gross Revenue (Montevideo Hospital) | | | 5.500 | | | | 03/01/2037 | | | | 1,146,156 | |
| | 240,000 | | | Cloquet, MN Pollution Control (Potlach Corp.)1 | | | 5.900 | | | | 10/01/2026 | | | | 240,895 | |
| | 645,000 | | | Cokato, MN Senior Hsg. (Cokato Charitable Trust) | | | 4.000 | | | | 12/01/2027 | | | | 621,690 | |
| | 200,000 | | | Cokato, MN Senior Hsg. (Cokato Charitable Trust) | | | 5.250 | | | | 12/01/2026 | | | | 203,110 | |
| | 224,000 | | | Columbia Heights, MN EDA Tax Increment (Huset Park Area Redevel.) | | | 5.000 | | | | 02/15/2017 | | | | 223,052 | |
| | 1,000,000 | | | Columbia Heights, MN EDA Tax Increment (Huset Park Area Redevel.) | | | 5.375 | | | | 02/15/2032 | | | | 901,680 | |
| | |
| 16 | | OPPENHEIMER ROCHESTER MINNESOTA MUNICIPAL FUND |
| | | | | | | | | | | | | | | | |
Principal
Amount | | | | | Coupon | | | Maturity | | | Value | |
| | | | | | | | | | | | | | | | | |
| | Minnesota Continued | | | | | |
| $ | 25,000 | | | Columbia Heights, MN Multifamily & Health Care Facilities (Crest View Corp.) | | | 5.300 | % | | | 07/01/2017 | | | $ | 23,995 | |
| | 1,400,000 | | | Columbia Heights, MN Multifamily & Health Care Facilities (Crest View Corp.) | | | 5.700 | | | | 07/01/2042 | | | | 1,104,152 | |
| | 750,000 | | | Cottage Grove, MN Senior Hsg. | | | 5.250 | | | | 12/01/2046 | | | | 755,138 | |
| | 50,000 | | | Cromwell, MN Independent Schoool District No. 951 | | | 4.500 | | | | 02/01/2014 | | | | 50,169 | |
| | 180,000 | | | Crookston, MN Nursing Home & Multifamily Hsg. (Villa St. Vincent) | | | 6.625 | | | | 09/01/2024 | | | | 180,238 | |
| | 200,000 | | | Cuyuna Range, MN Hospital District Health Facilities | | | 5.000 | | | | 06/01/2029 | | | | 207,960 | |
| | 3,565,000 | | | Dakota County, MN Community Devel. Agency (Grande Market Place)1 | | | 5.350 | | | | 05/20/2034 | | | | 3,590,383 | |
| | 50,000 | | | Dakota County, MN Community Devel. Agency (Grande Market Place)1 | | | 5.400 | | | | 11/20/2043 | | | | 50,050 | |
| | 50,000 | | | Dakota County, MN Community Devel. Agency (Southfork Apts.)1 | | | 5.400 | | | | 08/01/2018 | | | | 50,132 | |
| | 100,000 | | | Dakota County, MN Community Devel. Agency (Southfork Apts.)1 | | | 5.625 | | | | 02/01/2026 | | | | 100,094 | |
| | 5,000 | | | Douglas County, MN Alexandria Hsg. & Redevel. Authority (Windmill Ponds) | | | 2.810 | 2 | | | 07/01/2015 | | | | 4,987 | |
| | 200,000 | | | Douglas County, MN Hsg. & Redevel. Authority1 | | | 5.600 | | | | 02/01/2024 | | | | 244,286 | |
| | 500,000 | | | Duluth, MN EDA Health Care Facilities (St. Luke’s Hospital) | | | 6.000 | | | | 06/15/2039 | | | | 539,575 | |
| | 1,460,000 | | | Duluth, MN Hsg. & Redevel. Authority (Benedictine Health Center) | | | 5.875 | | | | 11/01/2033 | | | | 1,526,664 | |
| | 500,000 | | | Duluth, MN Hsg. & Redevel. Authority (Public Schools Academy)1 | | | 5.875 | | | | 11/01/2040 | | | | 531,220 | |
| | 300,000 | | | Duluth, MN Independent School District No. 709 COP1 | | | 5.000 | | | | 03/01/2025 | | | | 307,062 | |
| | 725,000 | | | Duluth, MN Independent School District No. 709 COP1 | | | 5.000 | | | | 03/01/2027 | | | | 735,969 | |
| | 785,000 | | | Duluth, MN Independent School District No. 709 COP1 | | | 5.125 | | | | 03/01/2029 | | | | 797,230 | |
| | 1,315,000 | | | Duluth, MN Independent School District No. 709 COP1 | | | 5.250 | | | | 03/01/2032 | | | | 1,339,512 | |
| | 100,000 | | | East Central, MN Independent School District No. 25801 | | | 5.000 | | | | 02/01/2022 | | | | 100,389 | |
| | 500,000 | | | Eveleth, MN Health Care (Arrowhead Senior Living Community) | | | 5.200 | | | | 10/01/2027 | | | | 502,870 | |
| | 1,270,000 | | | Eveleth, MN Multifamily (Manor House Woodland) | | | 5.700 | | | | 10/01/2036 | | | | 1,079,640 | |
| | 1,150,000 | | | Falcon Heights, MN (Kaleidoscope Charter School) | | | 6.000 | | | | 11/01/2037 | | | | 1,183,764 | |
| | 50,000 | | | Farmington, MN Independent School District No. 1921 | | | 4.000 | | | | 06/01/2017 | | | | 50,311 | |
| | 400,000 | | | Fergus Falls, MN Health Care Facilities (Lake Region Healthcare)1 | | | 5.400 | | | | 08/01/2040 | | | | 418,604 | |
| | 280,000 | | | Glencoe, MN Healthcare Facilities (Glencoe Regional Health Services)1 | | | 4.000 | | | | 04/01/2031 | | | | 283,704 | |
| | 375,000 | | | Grand Rapids, MN Hsg. and Redevel. Authority (Lakeshore)1 | | | 5.200 | | | | 10/01/2019 | | | | 376,324 | |
| | | | |
| OPPENHEIMER ROCHESTER MINNESOTA MUNICIPAL FUND | | | 17 | |
STATEMENT OF INVESTMENTS Continued
| | | | | | | | | | | | | | | | |
Principal
Amount | | | | | Coupon | | | Maturity | | | Value | |
| | | | | | | | | | | | | | | | | |
| | Minnesota Continued | | | | | |
| $ | 115,000 | | | Grand Rapids, MN Hsg. and Redevel. Authority (Lakeshore)1 | | | 5.700 | % | | | 10/01/2029 | | | $ | 115,061 | |
| | 385,000 | | | Hopkins, MN Hsg. & Redevel. Authority (Excelsior Crossings) | | | 5.625 | | | | 02/01/2030 | | | | 407,827 | |
| | 300,000 | | | Hutchinson, MN Public Utility1 | | | 5.000 | | | | 12/01/2022 | | | | 364,752 | |
| | 400,000 | | | Hutchinson, MN Public Utility1 | | | 5.000 | | | | 12/01/2025 | | | | 476,284 | |
| | 110,000 | | | International Falls, MN Pollution Control (Boise Cascade Corp.)1 | | | 5.500 | | | | 04/01/2023 | | | | 109,799 | |
| | 180,000 | | | International Falls, MN Pollution Control (Boise Cascade Corp.) | | | 5.650 | | | | 12/01/2022 | | | | 179,917 | |
| | 115,000 | | | International Falls, MN Solid Waste Disposal (Boise Cascade Corp.)1 | | | 6.850 | | | | 12/01/2029 | | | | 115,573 | |
| | 1,100,000 | | | Lake Crystal, MN Hsg. (Ecumen-Second Century) | | | 5.700 | | | | 09/01/2036 | | | | 1,123,243 | |
| | 525,000 | | | Lake Crystal, MN Hsg. (Ecumen-Second Century) | | | 6.250 | | | | 09/01/2040 | | | | 578,981 | |
| | 500,000 | | | Lamberton, MN Solid Waste (Highwater Ethanol) | | | 8.500 | | | | 12/01/2022 | | | | 377,225 | |
| | 500,000 | | | Litchfield, MN Electric Utility1 | | | 5.000 | | | | 02/01/2029 | | | | 546,975 | |
| | 250,000 | | | Little Canada, MN Senior Hsg. (PHS/Mayfield) | | | 6.000 | | | | 12/01/2030 | | | | 259,653 | |
| | 630,000 | | | Maple Grove, MN Health Care Facilities (North Care)1 | | | 5.000 | | | | 09/01/2029 | | | | 642,430 | |
| | 335,000 | | | Maple Grove, MN Health Care Facilities (North Memorial Health Care)1 | | | 5.000 | | | | 09/01/2035 | | | | 340,528 | |
| | 285,000 | | | Maple Grove, MN Health Care Systems (Maple Grove Hospital Corp.)1 | | | 5.250 | | | | 05/01/2037 | | | | 296,947 | |
| | 500,000 | | | Maplewood, MN Health Care Facility (VOA Care Centers) | | | 5.375 | | | | 10/01/2024 | | | | 507,245 | |
| | 490,000 | | | Maplewood, MN Hsg. & Health Care (Ecumen Headquarters) | | | 6.375 | | | | 03/01/2040 | | | | 535,247 | |
| | 495,000 | | | Meeker County, MN (Memorial Hospital) | | | 5.750 | | | | 11/01/2027 | | | | 540,857 | |
| | 670,000 | | | Meeker County, MN (Memorial Hospital) | | | 5.750 | | | | 11/01/2037 | | | | 722,206 | |
| | 3,000,000 | | | Minneapolis & St. Paul, MN Hsg. & Redevel. Authority (CHC) | | | 0.140 | 2 | | | 08/15/2025 | | | | 3,000,000 | |
| | 35,000 | | | Minneapolis & St. Paul, MN Hsg. & Redevel. Authority (CHC/CHCS Obligated Group)1 | | | 5.000 | | | | 08/15/2034 | | | | 38,091 | |
| | 35,000 | | | Minneapolis & St. Paul, MN Hsg. & Redevel. Authority (CHC/CHCS Obligated Group)1 | | | 5.250 | | | | 08/15/2035 | | | | 39,621 | |
| | 25,000 | | | Minneapolis & St. Paul, MN Hsg. & Redevel. Authority (GHP/HPA/HP Obligated Group)1 | | | 5.125 | | | | 12/01/2015 | | | | 25,774 | |
| | 650,000 | | | Minneapolis & St. Paul, MN Hsg. & Redevel. Authority (GHP/HPA/HP Obligated Group)1 | | | 5.875 | | | | 12/01/2029 | | | | 671,067 | |
| | 72,978 | | | Minneapolis & St. Paul, MN Hsg. Finance Board (Single Family Mtg.)1 | | | 5.000 | | | | 12/01/2038 | | | | 75,104 | |
| | 445,697 | | | Minneapolis & St. Paul, MN Hsg. Finance Board (Single Family Mtg.)1 | | | 5.250 | | | | 12/01/2040 | | | | 471,463 | |
| | |
| 18 | | OPPENHEIMER ROCHESTER MINNESOTA MUNICIPAL FUND |
| | | | | | | | | | | | | | | | |
Principal
Amount | | | | | Coupon | | | Maturity | | | Value | |
| | | | | | | | | | | | | | | | | |
| | Minnesota Continued | | | | | |
| $ | 78,435 | | | Minneapolis & St. Paul, MN Hsg. Finance Board (Single Family Mtg.)1 | | | 5.450 | % | | | 04/01/2027 | | | $ | 83,165 | |
| | 110,000 | | | Minneapolis & St. Paul, MN Hsg. Finance Board (Single Family Mtg.)1 | | | 5.520 | | | | 03/01/2041 | | | | 117,930 | |
| | 1,000,000 | | | Minneapolis & St. Paul, MN Metropolitan Airports Commission1 | | | 5.000 | | | | 01/01/2020 | | | | 1,155,020 | |
| | 25,000 | | | Minneapolis & St. Paul, MN Metropolitan Airports Commission1 | | | 5.000 | | | | 01/01/2020 | | | | 26,713 | |
| | 1,000,000 | | | Minneapolis & St. Paul, MN Metropolitan Airports Commission1 | | | 5.000 | | | | 01/01/2022 | | | | 1,146,960 | |
| | 85,000 | | | Minneapolis & St. Paul, MN Metropolitan Airports Commission1 | | | 5.000 | | | | 01/01/2022 | | | | 90,671 | |
| | 160,000 | | | Minneapolis & St. Paul, MN Metropolitan Airports Commission1 | | | 5.000 | | | | 01/01/2023 | | | | 181,422 | |
| | 100,000 | | | Minneapolis & St. Paul, MN Metropolitan Airports Commission1 | | | 5.000 | | | | 01/01/2023 | | | | 106,853 | |
| | 50,000 | | | Minneapolis & St. Paul, MN Metropolitan Airports Commission1 | | | 5.000 | | | | 01/01/2025 | | | | 53,246 | |
| | 30,000 | | | Minneapolis & St. Paul, MN Metropolitan Airports Commission1 | | | 5.000 | | | | 01/01/2025 | | | | 33,746 | |
| | 40,000 | | | Minneapolis & St. Paul, MN Metropolitan Airports Commission1 | | | 5.000 | | | | 01/01/2027 | | | | 42,380 | |
| | 8,000,000 | | | Minneapolis & St. Paul, MN Metropolitan Airports Commission3 | | | 5.000 | | | | 01/01/2035 | | | | 8,948,480 | |
| | 30,000 | | | Minneapolis, MN (Carechoice Member) | | | 5.875 | | | | 04/01/2024 | | | | 30,016 | |
| | 475,000 | | | Minneapolis, MN Collateralized Multifamily Hsg. (Vantage Flats)1 | | | 5.200 | | | | 10/20/2048 | | | | 488,571 | |
| | 10,000 | | | Minneapolis, MN Community Devel. Agency (Cord-Sets)1 | | | 5.500 | | | | 06/01/2018 | | | | 10,050 | |
| | 525,000 | | | Minneapolis, MN Community Devel. Agency (Riverside Homes of Minneapolis)1 | | | 6.200 | | | | 09/01/2029 | | | | 525,924 | |
| | 500,000 | | | Minneapolis, MN Devel. (Limited Tax Supported Community Bond Fund)1 | | | 6.000 | | | | 12/01/2040 | | | | 580,365 | |
| | 40,000 | | | Minneapolis, MN Health Care System (Fairview Health Services)1 | | | 5.000 | | | | 05/15/2021 | | | | 40,481 | |
| | 1,340,000 | | | Minneapolis, MN Health Care System (Fairview Health Services/FSP/FSH/FRCS/RRHS/FRWHS Obligated Group)1 | | | 6.500 | | | | 11/15/2038 | | | | 1,638,606 | |
| | 175,000 | | | Minneapolis, MN Health Care System (Fairview Health System/FSP/FSH/FRCS/RRHS/FRWHS Obligated Group)1 | | | 5.000 | | | | 11/15/2030 | | | | 180,490 | |
| | 50,000 | | | Minneapolis, MN Health Care System (Fairview Health System/FSP/FSH/FRCS/RRHS/FRWHS Obligated Group)1 | | | 5.000 | | | | 11/15/2034 | | | | 51,430 | |
| | | | |
| OPPENHEIMER ROCHESTER MINNESOTA MUNICIPAL FUND | | | 19 | |
STATEMENT OF INVESTMENTS Continued
| | | | | | | | | | | | | | | | |
Principal
Amount | | | | | Coupon | | | Maturity | | | Value | |
| | | | | | | | | | | | | | | | | |
| | Minnesota Continued | | | | | |
| $ | 600,000 | | | Minneapolis, MN Health Care System (Fairview Health System/FSP/FSH/FRCS/RRHS/FRWHS Obligated Group)1 | | | 6.375 | % | | | 11/15/2023 | | | $ | 729,084 | |
| | 105,000 | | | Minneapolis, MN Health Care System (Fairview Health System/FSP/FSH/FRCS/RRHS/FRWHS Obligated Group)1 | | | 6.625 | | | | 11/15/2028 | | | | 128,298 | |
| | 550,000 | | | Minneapolis, MN Multifamily Hsg. (Blaisdell Apartments) | | | 5.400 | | | | 04/01/2028 | | | | 522,863 | |
| | 200,000 | | | Minneapolis, MN Multifamily Hsg. (Blaisdell Apartments) | | | 5.500 | | | | 04/01/2042 | | | | 183,516 | |
| | 20,000 | | | Minneapolis, MN Multifamily Hsg. (East Village Hsg. Corp.)1 | | | 5.750 | | | | 10/20/2042 | | | | 20,027 | |
| | 25,000 | | | Minneapolis, MN Multifamily Hsg. (Seward Towers)1 | | | 5.000 | | | | 05/20/2036 | | | | 25,552 | |
| | 4,000,000 | | | Minneapolis, MN Multifamily Hsg. (Shingle Creek Senior Hsg.) | | | 5.550 | | | | 10/20/2042 | | | | 4,082,000 | |
| | 1,575,000 | | | Minneapolis, MN Multifamily Hsg. (Sumner Field Phase II)1 | | | 5.150 | | | | 02/20/2045 | | | | 1,582,954 | |
| | 745,000 | | | Minneapolis, MN Revenue (Walker Minnesota Campus) | | | 5.000 | | | | 11/15/2024 | | | | 782,131 | |
| | 100,000 | | | Minneapolis, MN Student Hsg. (Riverton Community Hsg.) | | | 5.600 | | | | 08/01/2026 | | | | 100,244 | |
| | 250,000 | | | Minneapolis, MN Supported Devel. (Common Bond Fund)1 | | | 5.000 | | | | 06/01/2028 | | | | 261,863 | |
| | 380,000 | | | Minneapolis, MN Tax Increment (East River/Unocal Site) | | | 5.250 | | | | 02/01/2026 | | | | 380,502 | |
| | 600,000 | | | Minneapolis, MN Tax Increment (Grant Park) | | | 5.200 | | | | 02/01/2022 | | | | 601,266 | |
| | 1,750,000 | | | Minneapolis, MN Tax Increment (Grant Park) | | | 5.350 | | | | 02/01/2030 | | | | 1,726,935 | |
| | 500,000 | | | Minneapolis, MN Tax Increment (Ivy Tower) | | | 5.500 | | | | 02/01/2022 | | | | 482,000 | |
| | 1,250,000 | | | Minneapolis, MN Tax Increment (St. Anthony Falls) | | | 5.750 | | | | 02/01/2027 | | | | 1,247,525 | |
| | 635,000 | | | Minneapolis, MN Tax Increment (Unocal Site) | | | 5.400 | | | | 02/01/2031 | | | | 632,790 | |
| | 40,000 | | | Minnetonka, MN Multifamily Hsg. (Cedar Hills East/ Cedar Hills West)1 | | | 5.900 | | | | 10/20/2019 | | | | 40,100 | |
| | 25,000 | | | MN Agricultural & Economic Devel. Board (Benedictine Care Centers) | | | 5.750 | | | | 02/01/2030 | | | | 25,022 | |
| | 25,000 | | | MN Agricultural & Economic Devel. Board (Essentia Health/ECHC Obligated Groups)1 | | | 5.000 | | | | 02/15/2030 | | | | 27,379 | |
| | 100,000 | | | MN Agricultural & Economic Devel. Board (Essentia Health/ECHC Obligated Groups)1 | | | 5.500 | | | | 02/15/2025 | | | | 116,992 | |
| | 155,000 | | | MN Agricultural & Economic Devel. Board (Fairview Health Services/FRRHS/FRWHS Obligated Group)1 | | | 6.375 | | | | 11/15/2022 | | | | 155,673 | |
| | 115,000 | | | MN Agricultural & Economic Devel. Board (Fairview Health Services/FRRHS/FRWHS Obligated Group)1 | | | 6.375 | | | | 11/15/2029 | | | | 115,459 | |
| | 495,000 | | | MN Agricultural & Economic Devel. Board (Fairview Hospital and Healthcare Service)1 | | | 5.750 | | | | 11/15/2026 | | | | 495,856 | |
| | |
| 20 | | OPPENHEIMER ROCHESTER MINNESOTA MUNICIPAL FUND |
| | | | | | | | | | | | | | | | |
Principal
Amount | | | | | Coupon | | | Maturity | | | Value | |
| | | | | | | | | | | | | | | | | |
| | Minnesota Continued | | | | | |
| $ | 25,000 | | | MN Agricultural & Economic Devel. Board (SMDCHS/SJMC Obligated Group)1 | | | 4.750 | % | | | 02/15/2016 | | | $ | 25,065 | |
| | 250,000 | | | MN HEFA (Ausburg College)1 | | | 5.000 | | | | 05/01/2036 | | | | 253,930 | |
| | 410,000 | | | MN HEFA (Bethel University) | | | 5.500 | | | | 05/01/2022 | | | | 435,846 | |
| | 600,000 | | | MN HEFA (Bethel University) | | | 5.500 | | | | 05/01/2037 | | | | 626,952 | |
| | 275,000 | | | MN HEFA (College of St. Benedict)1 | | | 5.125 | | | | 03/01/2036 | | | | 291,242 | |
| | 400,000 | | | MN HEFA (College of St. Scholastica)1 | | | 4.250 | | | | 12/01/2027 | | | | 418,300 | |
| | 875,000 | | | MN HEFA (College of St. Scholastica)1 | | | 5.125 | | | | 12/01/2040 | | | | 941,938 | |
| | 1,000,000 | | | MN HEFA (College of St. Scholastica)1 | | | 5.250 | | | | 12/01/2035 | | | | 1,089,960 | |
| | 150,000 | | | MN HEFA (College of St. Scholastica)1 | | | 6.000 | | | | 12/01/2028 | | | | 171,231 | |
| | 500,000 | | | MN HEFA (College of St. Scholastica)1 | | | 6.300 | | | | 12/01/2040 | | | | 571,315 | |
| | 500,000 | | | MN HEFA (Hamline University)1 | | | 5.000 | | | | 10/01/2029 | | | | 544,495 | |
| | 500,000 | | | MN HEFA (Hamline University)1 | | | 6.000 | | | | 10/01/2032 | | | | 589,480 | |
| | 500,000 | | | MN HEFA (Macalester College)1 | | | 5.000 | | | | 06/01/2035 | | | | 569,120 | |
| | 300,000 | | | MN HEFA (St. Catherine University)1 | | | 5.000 | | | | 10/01/2025 | | | | 342,567 | |
| | 280,000 | | | MN HEFA (St. Catherine University)1 | | | 5.000 | | | | 10/01/2026 | | | | 318,086 | |
| | 200,000 | | | MN HEFA (St. Catherine University)1 | | | 5.000 | | | | 10/01/2027 | | | | 225,120 | |
| | 500,000 | | | MN HEFA (St. Catherine University)1 | | | 5.000 | | | | 10/01/2032 | | | | 557,430 | |
| | 25,000 | | | MN HEFA (University of St. Thomas)1 | | | 4.000 | | | | 10/01/2014 | | | | 25,075 | |
| | 500,000 | | | MN HEFA (University of St. Thomas)1 | | | 5.000 | | | | 04/01/2023 | | | | 615,300 | |
| | 160,000 | | | MN HEFA (University of St. Thomas)1 | | | 5.250 | | | | 10/01/2034 | | | | 168,706 | |
| | 750,000 | | | MN HEFA (University of St. Thomas)1 | | | 5.250 | | | | 04/01/2039 | | | | 834,255 | |
| | 130,000 | | | MN HFA (Homeownership)1 | | | 5.000 | | | | 01/01/2031 | | | | 141,153 | |
| | 100,000 | | | MN HFA (Rental Hsg.)1 | | | 5.000 | | | | 08/01/2040 | | | | 102,108 | |
| | 210,000 | | | MN HFA (Residential Hsg.)1 | | | 3.750 | | | | 01/01/2022 | | | | 226,664 | |
| | 590,000 | | | MN HFA (Residential Hsg.)1 | | | 3.750 | | | | 07/01/2022 | | | | 627,347 | |
| | 120,000 | | | MN HFA (Residential Hsg.)1 | | | 4.600 | | | | 07/01/2022 | | | | 124,908 | |
| | 65,000 | | | MN HFA (Residential Hsg.)1 | | | 5.000 | | | | 07/01/2023 | | | | 68,630 | |
| | 560,000 | | | MN HFA (Residential Hsg.)1 | | | 5.050 | | | | 07/01/2034 | | | | 605,758 | |
| | 240,000 | | | MN HFA (Residential Hsg.)1 | | | 5.100 | | | | 07/01/2031 | | | | 248,242 | |
| | 75,000 | | | MN HFA (Residential Hsg.) | | | 5.100 | | | | 07/01/2038 | | | | 80,126 | |
| | 635,000 | | | MN HFA (Residential Hsg.)1 | | | 5.100 | | | | 01/01/2040 | | | | 681,730 | |
| | 20,000 | | | MN HFA (Residential Hsg.)1 | | | 5.150 | | | | 07/01/2028 | | | | 21,087 | |
| | 55,000 | | | MN HFA (Residential Hsg.)1 | | | 5.200 | | | | 01/01/2023 | | | | 58,178 | |
| | 80,000 | | | MN HFA (Residential Hsg.)1 | | | 5.250 | | | | 07/01/2033 | | | | 84,307 | |
| | 45,000 | | | MN HFA (Residential Hsg.)1 | | | 5.500 | | | | 01/01/2038 | | | | 47,300 | |
| | 10,000 | | | MN HFA (Residential Hsg.)1 | | | 5.650 | | | | 07/01/2033 | | | | 10,522 | |
| | 5,000 | | | MN HFA (Residential Hsg.)1 | | | 5.750 | | | | 01/01/2038 | | | | 5,079 | |
| | 15,000 | | | MN HFA (Residential Hsg.)1 | | | 5.900 | | | | 07/01/2028 | | | | 16,387 | |
| | | | |
| OPPENHEIMER ROCHESTER MINNESOTA MUNICIPAL FUND | | | 21 | |
STATEMENT OF INVESTMENTS Continued
| | | | | | | | | | | | | | | | |
Principal
Amount | | | | | Coupon | | | Maturity | | | Value | |
| | | | | | | | | | | | | | | | | |
| | Minnesota Continued | | | | | |
| $ | 765,000 | | | MN Municipal Power Agency1 | | | 5.000 | % | | | 10/01/2025 | | | $ | 874,632 | |
| | 25,000 | | | MN Municipal Power Agency1 | | | 5.000 | | | | 10/01/2034 | | | | 26,410 | |
| | 10,000 | | | MN Municipal Power Agency1 | | | 5.000 | | | | 10/01/2035 | | | | 10,734 | |
| | 2,000,000 | | | MN Municipal Power Agency1 | | | 5.250 | | | | 10/01/2024 | | | | 2,136,980 | |
| | 750,000 | | | MN Municipal Power Agency1 | | | 5.250 | | | | 10/01/2035 | | | | 836,790 | |
| | 655,000 | | | MN Office of Higher Education (Supplemental Student Loan)1 | | | 5.000 | | | | 11/01/2029 | | | | 727,594 | |
| | 430,000 | | | MN Seaway Port Authority of Duluth (Northstar Aerospace) | | | 5.000 | | | | 04/01/2017 | | | | 430,533 | |
| | 1,410,000 | | | MN Seaway Port Authority of Duluth (Northstar Aerospace) | | | 5.200 | | | | 04/01/2027 | | | | 1,384,564 | |
| | 3,250,000 | | | MN State General Fund1 | | | 5.000 | | | | 03/01/2029 | | | | 3,823,755 | |
| | 100,000 | | | Moorhead, MN Health Care (Evercare Senior Living) | | | 5.000 | | | | 09/01/2032 | | | | 101,109 | |
| | 500,000 | | | Moorhead, MN Health Care (Evercare Senior Living) | | | 5.125 | | | | 09/01/2037 | | | | 503,755 | |
| | 150,000 | | | New Hope, MN Hsg. & Health Care Facilities (Minnesota Masonic Home North Ridge) | | | 5.875 | | | | 03/01/2029 | | | | 150,081 | |
| | 1,100,000 | | | North Oaks, MN Senior Hsg. (Presbyterian Homes of North Oaks) | | | 6.500 | | | | 10/01/2047 | | | | 1,178,903 | |
| | 40,000 | | | Northfield, MN Senior Hsg. (Northfield Manor) | | | 6.000 | | | | 07/01/2033 | | | | 40,029 | |
| | 300,000 | | | Norwood Young America MN EDA (Harbor at Peace Village) | | | 4.000 | | | | 08/01/2026 | | | | 287,652 | |
| | 100,000 | | | Norwood Young America MN EDA (Harbor at Peace Village) | | | 4.100 | | | | 08/01/2027 | | | | 96,262 | |
| | 150,000 | | | Oakdale, MN Revenue (Oak Meadows Senior Hsg.) | | | 4.000 | | | | 04/01/2022 | | | | 147,548 | |
| | 250,000 | | | Oakdale, MN Revenue (Oak Meadows Senior Hsg.) | | | 4.250 | | | | 04/01/2025 | | | | 243,570 | |
| | 600,000 | | | Oakdale, MN Revenue (Oak Meadows Senior Hsg.) | | | 5.000 | | | | 04/01/2034 | | | | 607,896 | |
| | 205,000 | | | Oronoco, MN Multifamily Hsg. (Wedum Shorewood Campus) | | | 5.400 | | | | 06/01/2041 | | | | 206,431 | |
| | 750,000 | | | Otter Tail County, MN (Prairie Lakes Municipal Solid Waste Authority)1 | | | 5.000 | | | | 11/01/2030 | | | | 837,338 | |
| | 100,000 | | | Park Rapids, MN Health Facilities (Mankato Lutheran Homes) | | | 5.600 | | | | 08/01/2036 | | | | 100,806 | |
| | 170,000 | | | Pine City, MN Health Care & Hsg. (North Branch)1 | | | 5.000 | | | | 10/20/2047 | | | | 172,327 | |
| | 200,000 | | | Pine City, MN Health Care & Hsg. (North Branch) | | | 6.125 | | | | 10/20/2047 | | | | 202,196 | |
| | 125,000 | | | Prior Lake, MN Senior Hsg. (Shepherds Path Senior Hsg.) | | | 5.750 | | | | 08/01/2041 | | | | 125,799 | |
| | 10,000 | | | Ramsey County, MN Hsg. & Redevel. Authority (Hanover Townhouses)1 | | | 5.625 | | | | 07/01/2016 | | | | 10,009 | |
| | 425,000 | | | Red Wing, MN Senior Hsg. (Deer Crest) | | | 5.000 | | | | 11/01/2027 | | | | 448,286 | |
| | 330,000 | | | Red Wing, MN Senior Hsg. (Deer Crest) | | | 5.000 | | | | 11/01/2032 | | | | 337,049 | |
| | 1,250,000 | | | Red Wing, MN Senior Hsg. (Deer Crest) | | | 5.000 | | | | 11/01/2042 | | | | 1,251,825 | |
| | 1,000,000 | | | Redwood Falls, MN (Redwood Area Hospital) | | | 5.125 | | | | 12/01/2036 | | | | 1,022,860 | |
| | 250,000 | | | Rochester, MN Health Care & Hsg. (Samaritan Bethany) | | | 7.375 | | | | 12/01/2041 | | | | 280,880 | |
| | |
| 22 | | OPPENHEIMER ROCHESTER MINNESOTA MUNICIPAL FUND |
| | | | | | | | | | | | | | | | |
Principal
Amount | | | | | Coupon | | | Maturity | | | Value | |
| | | | | | | | | | | | | | | | | |
| | Minnesota Continued | | | | | |
| $ | 750,000 | | | Rochester, MN Health Care Facilities (Olmstead Medical Center)1 | | | 5.875 | % | | | 07/01/2030 | | | $ | 820,238 | |
| | 5,000 | | | Rosemount, MN GO1 | | | 5.400 | | | | 02/01/2016 | | | | 5,022 | |
| | 15,000 | | | Saint Cloud, MN Health Care (CCHS/CCHSM/CCHSLP/StCH Obligated Group)1 | | | 5.125 | | | | 05/01/2030 | | | | 16,553 | |
| | 195,000 | | | Sartell, MN Environmental Improvement, Series A1 | | | 5.200 | | | | 06/01/2027 | | | | 196,347 | |
| | 1,000,000 | | | Sartell, MN Health Care & Hsg. Facilities (Country Manor Campus) | | | 5.250 | | | | 09/01/2027 | | | | 1,042,230 | |
| | 795,000 | | | Sartell, MN Health Care & Hsg. Facilities (Country Manor Campus) | | | 5.250 | | | | 09/01/2030 | | | | 814,263 | |
| | 500,000 | | | Sauk Rapids, MN Health Care Housing Facilities (Good Shepard Lutheran Home) | | | 5.125 | | | | 01/01/2039 | | | | 498,185 | |
| | 800,000 | | | Sauk Rapids, MN Health Care Housing Facilities (Good Shepard Lutheran Home) | | | 6.000 | | | | 01/01/2034 | | | | 804,600 | |
| | 250,000 | | | Sauk Rapids, MN Health Care Housing Facilities (Good Shepard Lutheran Home) | | | 7.500 | | | | 01/01/2039 | | | | 264,900 | |
| | 15,000 | | | South Washington County, MN Independent School District No. 833 COP | | | 5.250 | | | | 12/01/2014 | | | | 15,049 | |
| | 10,000 | | | Southern MN Municipal Power Agency1 | | | 5.000 | | | | 01/01/2024 | | | | 11,405 | |
| | 750,000 | | | Southern MN Municipal Power Agency1 | | | 5.250 | | | | 01/01/2030 | | | | 838,388 | |
| | 1,000,000 | | | St. Anthony, MN Hsg. & Redevel. Authority (Silver Lake Village) | | | 5.000 | | | | 02/01/2031 | | | | 972,330 | |
| | 750,000 | | | St. Anthony, MN Hsg. & Redevel. Authority (Silver Lake Village) | | | 5.625 | | | | 02/01/2031 | | | | 758,918 | |
| | 250,000 | | | St. Louis Park, MN EDA (Hoigaard Village) | | | 5.000 | | | | 02/01/2023 | | | | 261,643 | |
| | 2,455,000 | | | St. Louis Park, MN Health Care Facilities (PNHS)1 | | | 5.750 | | | | 07/01/2039 | | | | 2,756,302 | |
| | 100,000 | | | St. Louis Park, MN Health Care Facilities (PNHS)1 | | | 5.500 | | | | 07/01/2029 | | | | 111,534 | |
| | 30,000 | | | St. Louis Park, MN Health Care Facilities (PNHS/PNMC Obligated Group)1 | | | 5.750 | | | | 07/01/2030 | | | | 33,574 | |
| | 50,000 | | | St. Louis Park, MN Health Care Facilities (PNMH/PNMC Holdings/PNI Obligated Group)1 | | | 5.500 | | | | 07/01/2023 | | | | 56,166 | |
| | 100,000 | | | St. Paul, MN Hsg. & Redevel. Authority (Achieve Language Academy) | | | 6.750 | | | | 12/01/2022 | | | | 101,095 | |
| | 55,000 | | | St. Paul, MN Hsg. & Redevel. Authority (Allina Health System)1 | | | 5.000 | | | | 11/15/2020 | | | | 63,127 | |
| | 495,000 | | | St. Paul, MN Hsg. & Redevel. Authority (Allina Health System)1 | | | 5.000 | | | | 11/15/2021 | | | | 566,245 | |
| | 50,000 | | | St. Paul, MN Hsg. & Redevel. Authority (Allina Health System)1 | | | 5.250 | | | | 11/15/2028 | | | | 55,926 | |
| | 600,000 | | | St. Paul, MN Hsg. & Redevel. Authority (Bridgecreek Senior Place) | | | 7.000 | | | | 09/15/2037 | | | | 599,940 | |
| | 30,000 | | | St. Paul, MN Hsg. & Redevel. Authority (Civic Center) | | | 5.450 | | | | 11/01/2013 | | | | 30,117 | |
| | 585,000 | | | St. Paul, MN Hsg. & Redevel. Authority (Community of Peace Building Company)1 | | | 5.000 | | | | 12/01/2036 | | | | 586,849 | |
| | | | |
| OPPENHEIMER ROCHESTER MINNESOTA MUNICIPAL FUND | | | 23 | |
STATEMENT OF INVESTMENTS Continued
| | | | | | | | | | | | | | | | |
Principal
Amount | | | | | Coupon | | | Maturity | | | Value | |
| | | | | | | | | | | | | | | | | |
| | Minnesota Continued | | | | | |
| $ | 25,000 | | | St. Paul, MN Hsg. & Redevel. Authority (Franciscan Health and Hsg. Services)1 | | | 5.350 | % | | | 11/20/2027 | | | $ | 25,039 | |
| | 300,000 | | | St. Paul, MN Hsg. & Redevel. Authority (Great Northern Lofts) | | | 6.250 | | | | 03/01/2029 | | | | 308,568 | |
| | 400,000 | | | St. Paul, MN Hsg. & Redevel. Authority (HealthEast/HESJH/HSJH Obligation Group)1 | | | 6.000 | | | | 11/15/2025 | | | | 432,736 | |
| | 215,000 | | | St. Paul, MN Hsg. & Redevel. Authority (HealthEast/HESJH/HSJH Obligation Group)1 | | | 6.000 | | | | 11/15/2035 | | | | 230,259 | |
| | 150,000 | | | St. Paul, MN Hsg. & Redevel. Authority (Hmong Academy)1 | | | 6.000 | | | | 09/01/2036 | | | | 153,855 | |
| | 750,000 | | | St. Paul, MN Hsg. & Redevel. Authority (Minneapolis Public Radio)1 | | | 5.000 | | | | 12/01/2025 | | | | 845,873 | |
| | 250,000 | | | St. Paul, MN Hsg. & Redevel. Authority (Nova Classical Academy)1 | | | 6.375 | | | | 09/01/2031 | | | | 277,835 | |
| | 500,000 | | | St. Paul, MN Hsg. & Redevel. Authority (Package Facilities)1 | | | 5.000 | | | | 08/01/2035 | | | | 545,255 | |
| | 500,000 | | | St. Paul, MN Hsg. & Redevel. Authority (Rossy & Richard Shaller) | | | 5.250 | | | | 10/01/2042 | | | | 502,285 | |
| | 750,000 | | | St. Paul, MN Hsg. & Redevel. Authority (Selby Grotto Hsg.)1 | | | 5.500 | | | | 09/20/2044 | | | | 755,130 | |
| | 950,000 | | | St. Paul, MN Hsg. & Redevel. Authority (Smith Avenue)1 | | | 5.000 | | | | 08/01/2035 | | | | 1,035,339 | |
| | 1,000,000 | | | St. Paul, MN Hsg. & Redevel. Authority (St. Paul Conservatory for Performing Arts)1 | | | 4.625 | | | | 03/01/2043 | | | | 987,980 | |
| | 2,965,000 | | | St. Paul, MN Hsg. & Redevel. Authority (University Dale Apartments) | | | 4.820 | | | | 07/20/2046 | | | | 3,064,802 | |
| | 180,000 | | | St. Paul, MN Hsg. & Redevel. Authority (Upper Landing) | | | 5.000 | | | | 03/01/2019 | | | | 191,653 | |
| | 185,000 | | | St. Paul, MN Hsg. & Redevel. Authority (Upper Landing) | | | 5.000 | | | | 09/01/2019 | | | | 197,872 | |
| | 185,000 | | | St. Paul, MN Hsg. & Redevel. Authority (Upper Landing) | | | 5.000 | | | | 03/01/2020 | | | | 196,433 | |
| | 220,000 | | | St. Paul, MN Hsg. & Redevel. Authority (Upper Landing) | | | 5.000 | | | | 09/01/2020 | | | | 234,443 | |
| | 225,000 | | | St. Paul, MN Hsg. & Redevel. Authority (Upper Landing) | | | 5.000 | | | | 03/01/2021 | | | | 238,264 | |
| | 235,000 | | | St. Paul, MN Hsg. & Redevel. Authority (Upper Landing) | | | 5.000 | | | | 09/01/2021 | | | | 249,586 | |
| | 140,000 | | | St. Paul, MN Hsg. & Redevel. Authority (Upper Landing) | | | 5.000 | | | | 03/01/2022 | | | | 148,047 | |
| | 240,000 | | | St. Paul, MN Hsg. & Redevel. Authority (Upper Landing) | | | 5.000 | | | | 09/01/2022 | | | | 253,795 | |
| | 1,000,000 | | | St. Paul, MN Hsg. & Redevel. Authority (Upper Landing) | | | 5.000 | | | | 09/01/2026 | | | | 1,053,670 | |
| | 935,000 | | | St. Paul, MN Hsg. & Redevel. Authority (Upper Landing) | | | 5.000 | | | | 03/01/2029 | | | | 978,113 | |
| | 1,500,000 | | | St. Paul, MN Hsg. & Redevel. Authority Charter School (Hmong College Prep Academy)1 | | | 5.500 | | | | 09/01/2043 | | | | 1,527,540 | |
| | 500,000 | | | St. Paul, MN Hsg. & Redevel. Authority Health Care Facilities (Carondelet Village) | | | 6.000 | | | | 08/01/2035 | | | | 533,405 | |
| | 1,000,000 | | | St. Paul, MN Hsg. & Redevel. Authority Health Care Facilities (Episcopal Senior Homes) | | | 5.150 | | | | 11/01/2042 | | | | 1,004,880 | |
| | 25,000 | | | St. Paul, MN Hsg. & Redevel. Authority Health Care Facility (GHP/RH/MAC Obligated Group)1 | | | 5.250 | | | | 05/15/2017 | | | | 28,071 | |
| | |
| 24 | | OPPENHEIMER ROCHESTER MINNESOTA MUNICIPAL FUND |
| | | | | | | | | | | | | | | | |
Principal
Amount | | | | | Coupon | | | Maturity | | | Value | |
| | | | | | | | | | | | | | | | | |
| | Minnesota Continued | | | | | |
| $ | 920,000 | | | St. Paul, MN Hsg. & Redevel. Authority Health Care Facility (GHP/RH/MAC Obligated Group)1 | | | 5.250 | % | | | 05/15/2036 | | | $ | 961,777 | |
| | 50,000 | | | St. Paul, MN Hsg. & Redevel. Authority Health Care Facility (RH)1 | | | 5.250 | | | | 05/15/2018 | | | | 50,134 | |
| | 560,000 | | | St. Paul, MN Hsg. & Redevel. Authority Health Care Facility (RH)1 | | | 5.300 | | | | 05/15/2028 | | | | 560,644 | |
| | 75,000 | | | St. Paul, MN Port Authority (Amherst H Wilder Foundation)1 | | | 5.000 | | | | 12/01/2036 | | | | 83,714 | |
| | 500,000 | | | St. Paul, MN Port Authority (Gerdau Ameristeel)1 | | | 4.500 | | | | 10/01/2037 | | | | 504,430 | |
| | 2,430,000 | | | St. Paul, MN Port Authority (Great Northern) | | | 6.000 | | | | 03/01/2030 | | | | 2,467,519 | |
| | 125,000 | | | St. Paul, MN Port Authority (Office Building At Robert Street)1 | | | 5.000 | | | | 12/01/2027 | | | | 128,619 | |
| | 1,500,000 | | | St. Paul, MN Port Authority (Office Building At Robert Street)1 | | | 5.250 | | | | 12/01/2020 | | | | 1,551,030 | |
| | 145,000 | | | St. Paul, MN Port Authority (Office Building)1 | | | 5.250 | | | | 12/01/2027 | | | | 145,551 | |
| | 200,000 | | | St. Paul, MN Port Authority (Office Building)1 | | | 5.250 | | | | 12/01/2027 | | | | 200,760 | |
| | 1,375,000 | | | St. Paul, MN Port Authority (RH Parking Ramp) | | | 5.000 | | | | 08/01/2036 | | | | 1,393,686 | |
| | 900,000 | | | Stillwater, MN Multifamily (Orleans Homes) | | | 5.375 | | | | 02/01/2032 | | | | 875,520 | |
| | 510,000 | | | Stillwater, MN Multifamily (Orleans Homes) | | | 5.500 | | | | 02/01/2042 | | | | 491,411 | |
| | 1,000,000 | | | University of Minnesota1 | | | 5.000 | | | | 08/01/2036 | | | | 1,149,380 | |
| | 500,000 | | | University of Minnesota1 | | | 5.000 | | | | 12/01/2036 | | | | 575,665 | |
| | 750,000 | | | University of Minnesota1 | | | 5.250 | | | | 12/01/2031 | | | | 897,540 | |
| | 500,000 | | | Victoria, MN Private School Facility (Holy Family Catholic High School) | | | 5.000 | | | | 09/01/2029 | | | | 527,270 | |
| | 35,000 | | | Virginia, MN Hsg. & Redevel. Authority Health Care Facilities1 | | | 5.375 | | | | 10/01/2030 | | | | 36,490 | |
| | 250,000 | | | Wayzata, MN Senior Hsg. (Folkstone Senior Living Community) | | | 5.500 | | | | 11/01/2032 | | | | 266,090 | |
| | 250,000 | | | Wayzata, MN Senior Hsg. (Folkstone Senior Living Community) | | | 5.750 | | | | 11/01/2039 | | | | 268,488 | |
| | 500,000 | | | Wayzata, MN Senior Hsg. (Folkstone Senior Living Community) | | | 6.000 | | | | 05/01/2047 | | | | 540,744 | |
| | 1,250,000 | | | Western, MN Municipal Power Agency1 | | | 5.000 | | | | 01/01/2029 | | | | 1,480,413 | |
| | 1,000,000 | | | Western, MN Municipal Power Agency1 | | | 5.000 | | | | 01/01/2030 | | | | 1,180,590 | |
| | 180,000 | | | Willmar, MN Hsg. & Redevel. Authority (Highlands Apts.)1 | | | 5.850 | | | | 06/01/2019 | | | | 180,234 | |
| | 750,000 | | | Winona, MN Health Care Facilities (Winona Health Services)1 | | | 5.000 | | | | 07/01/2034 | | | | 785,325 | |
| | 210,000 | | | Woodbury, MN Charter School (MSA Building Company)1 | | | 5.000 | | | | 12/01/2027 | | | | 221,846 | |
| | 220,000 | | | Woodbury, MN Charter School (MSA Building Company)1 | | | 5.000 | | | | 12/01/2032 | | | | 228,171 | |
| | | | |
| OPPENHEIMER ROCHESTER MINNESOTA MUNICIPAL FUND | | | 25 | |
STATEMENT OF INVESTMENTS Continued
| | | | | | | | | | | | | | | | |
Principal
Amount | | | | | Coupon | | | Maturity | | | Value | |
| | | | | | | | | | | | | | | | | |
| | Minnesota Continued | | | | | |
| $ | 885,000 | | | Woodbury, MN Charter School (MSA Building Company)1 | | | 5.000 | % | | | 12/01/2043 | | | $ | 897,142 | |
| | | | | | | | | | | | | | | | 152,200,597 | |
| | U.S. Possessions—3.3% | |
| | 1,000,000 | | | Puerto Rico Commonwealth GO1 | | | 5.500 | | | | 07/01/2039 | | | | 966,890 | |
| | 1,000,000 | | | Puerto Rico Commonwealth GO1 | | | 5.750 | | | | 07/01/2041 | | | | 1,004,140 | |
| | 250,000 | | | Puerto Rico Electric Power Authority, Series CCC1 | | | 5.250 | | | | 07/01/2028 | | | | 248,810 | |
| | 250,000 | | | Puerto Rico Highway & Transportation Authority1 | | | 5.300 | | | | 07/01/2035 | | | | 242,823 | |
| | 100,000 | | | Puerto Rico ITEMECF (Ana G. Mendez University)1 | | | 5.000 | | | | 04/01/2027 | | | | 101,084 | |
| | 100,000 | | | Puerto Rico ITEMECF (Ana G. Mendez University)1 | | | 5.125 | | | | 04/01/2032 | | | | 100,178 | |
| | 100,000 | | | Puerto Rico ITEMECF (Ana G. Mendez University)1 | | | 5.375 | | | | 04/01/2042 | | | | 100,888 | |
| | 90,000 | | | Puerto Rico Sales Tax Financing Corp., Series A1 | | | 5.750 | | | | 08/01/2037 | | | | 95,911 | |
| | 2,000,000 | | | Puerto Rico Sales Tax Financing Corp., Series A | | | 6.160 | 4 | | | 08/01/2034 | | | | 589,000 | |
| | 2,000,000 | | | Puerto Rico Sales Tax Financing Corp., Series A | | | 6.160 | 4 | | | 08/01/2036 | | | | 512,060 | |
| | 500,000 | | | Puerto Rico Sales Tax Financing Corp., Series C1 | | | 5.250 | | | | 08/01/2041 | | | | 507,110 | |
| | 500,000 | | | Puerto Rico Sales Tax Financing Corp., Series C1 | | | 6.000 | | | | 08/01/2039 | | | | 541,055 | |
| | | | | | | | | | | | | | | | 5,009,949 | |
| | Total Investments, at Value (Cost $149,237,311)—103.6% | | | | 157,210,546 | |
| | Liabilities in Excess of Other Assets—(3.6) | | | | (5,487,303 | ) |
| | Net Assets—100.0% | | | | | | | | | | $ | 151,723,243 | |
| | | | | | | | | | | | | | |
|
|
|
Footnotes to Statement of Investments
*March 28, 2013 represents the last business day of the Fund’s 2013 fiscal year. See Note 1 of the accompanying Notes.
1. All or a portion of the security position has been segregated for collateral to cover borrowings. See Note 6 of the accompanying Notes.
2. Represents the current interest rate for a variable or increasing rate security.
3. Security represents the underlying municipal bond with respect to an inverse floating rate security held by the Fund. The bond was purchased by the Fund and subsequently transferred to a trust, which issued the related inverse floating rate security. See Note 1 of the accompanying Notes.
4. Zero coupon bond reflects effective yield on the date of purchase.
| | |
| 26 | | OPPENHEIMER ROCHESTER MINNESOTA MUNICIPAL FUND |
Footnotes to Statement of Investments Continued
To simplify the listings of securities, abbreviations are used per the table below:
| | |
| CCHS | | Centracare Health System |
| CCHSLP | | Centracare Health Services of Long Prairie |
| CCHSM | | Centracare Health Services of Melrose |
| CHC | | Children’s Health Care |
| CHCS | | Children’s Health Care Services |
| COP | | Certificates of Participation |
| ECHC | | Essentia Community Hospitals & Clinics |
| EDA | | Economic Devel. Authority |
| FRCS | | Fairview Regional Community Services |
| FRRHS | | Fairview Range Regional Health Services |
| FRWHS | | Fairview Red Wing Health Services |
| FSH | | Fairview Seminary Home |
| FSP | | Fairview Seminary Plaza |
| GHP | | Group Health Plan |
| GO | | General Obligation |
| HEFA | | Higher Education Facilities Authority |
| HESJH | | HealthEast St. John’s Hospital |
| | |
| HFA | | Housing Finance Agency |
| HP | | Healthpartners |
| HPA | | Healthpartners Administrators |
| HSJH | | HealthEast St. Joseph’s Hospital |
| ITEMECF | | Industrial, Tourist, Educational, Medical and Environmental Community Facilities |
| MAC | | Midwest Assurance Company |
| MSA | | Math & Science Academy |
| PHS | | Pinnacle Health System |
| PNHS | | Park Nicollet Health Services |
| PNI | | Park Nicollet Institute |
| PNMH | | Park Nicollet Methodist Hospital |
| RH | | Regions Hospital |
| ROLs | | Residual Option Longs |
| RRHS | | Range Regional Health Services |
| SJMC | | St. Joseph’s Medical Center |
| SMDCHS | | St. Mary’s Duluth Clinic Health System |
| StCH | | St. Cloud Hospital |
| VOA | | Volunteers of America |
See accompanying Notes to Financial Statements.
| | | | |
| OPPENHEIMER ROCHESTER MINNESOTA MUNICIPAL FUND | | | 27 | |
STATEMENT OF ASSETS AND LIABILITIES March 28, 20131
| | | | |
| Assets | | | |
| Investments, at value (cost $149,237,311)—see accompanying statement of investments | | $ | 157,210,546 | |
| Cash | | | 405,525 | |
| Receivables and other assets: | | | | |
| Interest | | | 2,115,018 | |
| Shares of beneficial interest sold | | | 456,789 | |
| Investments sold | | | 100,000 | |
| Other | |
| 40,071
|
|
| Total assets | | | 160,327,949 | |
| Liabilities | | | |
| Payables and other liabilities: | | | | |
| Payable for short-term floating rate notes issued (See Note 1) | | | 6,000,000 | |
| Payable on borrowings (See Note 6) | | | 2,200,000 | |
| Shares of beneficial interest redeemed | | | 180,782 | |
| Dividends | | | 78,361 | |
| Investments purchased | | | 52,939 | |
| Distribution and service plan fees | | | 31,388 | |
| Shareholder communications | | | 11,814 | |
| Transfer and shareholder servicing agent fees | | | 7,207 | |
| Trustees’ compensation | | | 3,312 | |
| Interest expense on borrowings | | | 65 | |
| Other | |
| 38,838
|
|
| Total liabilities | | | 8,604,706 | |
| Net Assets | | $
| 151,723,243
|
|
| Composition of Net Assets | | | |
| Par value of shares of beneficial interest | | $ | 11,571 | |
| Additional paid-in capital | | | 145,358,916 | |
| Accumulated net investment income | | | 526,861 | |
| Accumulated net realized loss on investments | | | (2,147,340 | ) |
| Net unrealized appreciation on investments | |
| 7,973,235
|
|
| Net Assets | | $
| 151,723,243
|
|
1. March 28, 2013 represents the last business day of the Fund’s 2013 fiscal year. See Note 1 of the accompanying Notes.
| | |
| 28 | | OPPENHEIMER ROCHESTER MINNESOTA MUNICIPAL FUND |
| | | | |
| Net Asset Value Per Share | | | |
| Class A Shares: | | | | |
Net asset value and redemption price per share (based on net assets of $108,373,084
and 8,262,354 shares of beneficial interest outstanding) | | $ | 13.12 | |
| Maximum offering price per share (net asset value plus sales charge of 4.75% of offering price) | | $ | 13.77 | |
| Class B Shares: | | | | |
Net asset value, redemption price (excludes applicable contingent deferred sales charge)
and offering price per share (based on net assets of $3,604,748 and 275,085 shares of beneficial interest outstanding) | | $ | 13.10 | |
| Class C Shares: | | | | |
Net asset value, redemption price (excludes applicable contingent deferred sales charge)
and offering price per share (based on net assets of $36,355,271 and 2,774,649 shares of beneficial interest outstanding) | | $ | 13.10 | |
| Class Y Shares: | | | | |
Net asset value, redemption price and offering price per share (based on net assets of
$3,390,140 and 258,432 shares of beneficial interest outstanding) | | $ | 13.12 | |
See accompanying Notes to Financial Statements.
| | | | |
| OPPENHEIMER ROCHESTER MINNESOTA MUNICIPAL FUND | | | 29 | |
STATEMENT OF OPERATIONS For the Year Ended March 28, 20131
| | | | |
| Investment Income | | | |
| Interest | | $ | 6,207,247 | |
| Other income | |
| 12
|
|
| Total investment income | | | 6,207,259 | |
| Expenses | | | |
| Management fees | | | 707,088 | |
| Distribution and service plan fees: | | | | |
| Class A | | | 230,406 | |
| Class B | | | 36,300 | |
| Class C | | | 304,155 | |
| Transfer and shareholder servicing agent fees: | | | | |
| Class A | | | 51,745 | |
| Class B | | | 3,247 | |
| Class C | | | 23,405 | |
| Class Y | | | 2,005 | |
| Shareholder communications: | | | | |
| Class A | | | 25,231 | |
| Class B | | | 1,515 | |
| Class C | | | 11,455 | |
| Class Y | | | 1,037 | |
| Interest expense and fees on short-term floating rate notes issued (See Note 1) | | | 53,865 | |
| Borrowing fees | | | 33,551 | |
| Trustees’ compensation | | | 2,258 | |
| Interest expense on borrowings | | | 986 | |
| Custodian fees and expenses | | | 728 | |
| Other | |
| 54,601
|
|
| Total expenses | | | 1,543,578 | |
| Less waivers and reimbursements of expenses | |
| (169,251
| )
|
| Net expenses | | | 1,374,327 | |
| Net Investment Income | | | 4,832,932 | |
| Realized and Unrealized Gain | | | |
| Net realized gain on investments | | | 637,034 | |
| Net change in unrealized appreciation/depreciation on investments | | | 2,793,927 | |
| Net Increase in Net Assets Resulting from Operations | | $
| 8,263,893
|
|
1. March 28, 2013 represents the last business day of the Fund’s 2013 fiscal year. See Note 1 of the accompanying Notes.
See accompanying Notes to Financial Statements.
| | |
| 30 | | OPPENHEIMER ROCHESTER MINNESOTA MUNICIPAL FUND |
STATEMENTS OF CHANGES IN NET ASSETS
| | | | | | | | |
| | | Year Ended
March 28,
20131 | | | Year Ended
March 30,
20121 | |
| Operations | | | | | | |
| Net investment income | | $ | 4,832,932 | | | $ | 3,927,910 | |
| Net realized gain (loss) | | | 637,034 | | | | (98,326 | ) |
| Net change in unrealized appreciation/depreciation | |
| 2,793,927
|
| |
| 9,069,982
|
|
| Net increase in net assets resulting from operations | | | 8,263,893 | | | | 12,899,566 | |
| Dividends and/or Distributions to Shareholders | | | | | | | | |
| Dividends from net investment income: | | | | | | | | |
| Class A | | | (3,694,500 | ) | | | (2,983,328 | ) |
| Class B | | | (119,976 | ) | | | (97,442 | ) |
| Class C | | | (986,347 | ) | | | (744,336 | ) |
| Class Y | |
| (88,207
| )
| |
| (19,162
| )
|
| | | | (4,889,030 | ) | | | (3,844,268 | ) |
| Beneficial Interest Transactions | | | | | | |
| Net increase in net assets resulting from beneficial interest transactions: | | | | | | | | |
| Class A | | | 32,254,225 | | | | 17,151,877 | |
| Class B | | | 190,509 | | | | 1,129,197 | |
| Class C | | | 11,983,996 | | | | 7,210,236 | |
| Class Y | |
| 2,063,091
|
| |
| 1,267,519
|
|
| | | | 46,491,821 | | | | 26,758,829 | |
| Net Assets | | | | | | |
| Total increase | | | 49,866,684 | | | | 35,814,127 | |
| Beginning of period | |
| 101,856,559
|
| |
| 66,042,432
|
|
End of period (including accumulated net investment income
of $526,861 and $571,668, respectively) | | $
| 151,723,243
|
| | $
| 101,856,559
|
|
1. March 28, 2013 and March 30, 2012 represent the last business days of the Fund’s respective reporting periods. See Note 1 of the accompanying Notes.
See accompanying Notes to Financial Statements.
| | | | |
| OPPENHEIMER ROCHESTER MINNESOTA MUNICIPAL FUND | | | 31 | |
STATEMENT OF CASH FLOWS For the Year Ended March 28, 20131
| | | | |
| Cash Flows from Operating Activities | | | |
| Net increase in net assets from operations | | $ | 8,263,893 | |
Adjustments to reconcile net increase in net assets from operations
to net cash used in operating activities: | | | | |
Purchase of investment securities | | | (58,146,714 | ) |
Proceeds from disposition of investment securities | | | 15,988,751 | |
Short-term investment securities, net | | | (10,633,482 | ) |
Premium amortization | | | 720,250 | |
Discount accretion | | | (97,444 | ) |
Net realized gain on investments | | | (637,034 | ) |
Net change in unrealized appreciation/depreciation on investments | | | (2,793,927 | ) |
| Change in assets: | | | | |
Decrease in receivable for securities sold | | | 659,423 | |
Increase in other assets | | | (26,690 | ) |
Increase in interest receivable | | | (663,186 | ) |
| Change in liabilities: | | | | |
Increase in other liabilities | | | 17,672 | |
Decrease in payable for securities purchased | |
| (817,061
| )
|
| Net cash used in operating activities | | | (48,165,549 | ) |
| Cash Flows from Financing Activities | | | | |
| Proceeds from bank borrowings | | | 24,700,000 | |
| Payments on bank borrowings | | | (22,500,000 | ) |
| Proceeds from shares sold | | | 59,759,097 | |
| Payments on shares redeemed | | | (17,516,426 | ) |
| Cash distributions paid | |
| (377,306
| )
|
| Net cash provided by financing activities | | | 44,065,365 | |
| Net decrease in cash | | | (4,100,184 | ) |
| Cash, beginning balance | |
| 4,505,709
|
|
| Cash, ending balance | | $
| 405,525
|
|
| Supplemental disclosure of cash flow information: | | | | |
| Noncash financing activities not included herein consist of reinvestment of dividends and distributions of $4,485,803. | | | | |
| Cash paid for interest on bank borrowings—$921. | | | | |
| Cash paid for interest on short-term floating rate notes issued—$53,865. | | | | |
1. March 28, 2013 represents the last business day of the Fund’s 2013 fiscal year. See Note 1 of the accompanying Notes.
See accompanying Notes to Financial Statements.
| | |
| 32 | | OPPENHEIMER ROCHESTER MINNESOTA MUNICIPAL FUND |
FINANCIAL HIGHLIGHTS
| | | | | | | | | | | | | | | | | | | | |
| | | Year Ended
March 28, | | | Year Ended
March 30, | | | Year Ended
March 31, | | | Year Ended
March 31, | | | Year Ended
March 31, | |
| Class A | | 20131 | | | 20121 | | | 2011 | | | 2010 | | | 2009 | |
| Per Share Operating Data | | | | | | | | | | | | | | | |
| Net asset value, beginning of period | | $ | 12.71 | | | $ | 11.29 | | | $ | 11.81 | | | $ | 9.68 | | | $ | 12.38 | |
| Income (loss) from investment operations: | | | | | | | | | | | | | | | | | | | | |
| Net investment income2 | | | .52 | | | | .62 | | | | .63 | | | | .66 | | | | .73 | |
| Net realized and unrealized gain (loss) | |
| .42
|
| |
| 1.41
|
| |
| (.52
| )
| |
| 2.12
|
| |
| (2.78
| )
|
| Total from investment operations | | | .94 | | | | 2.03 | | | | .11 | | | | 2.78 | | | | (2.05 | ) |
| Dividends and/or distributions to shareholders: | | | | | | | | | | | | | | | | | | | | |
| Dividends from net investment income | | | (.53 | ) | | | (.61 | ) | | | (.63 | ) | | | (.65 | ) | | | (.65 | ) |
| Net asset value, end of period | | $
| 13.12
|
| | $
| 12.71
|
| | $
| 11.29
|
| | $
| 11.81
|
| | $
| 9.68
|
|
| Total Return, at Net Asset Value3 | | | 7.45 | % | | | 18.32 | % | | | 0.84 | % | | | 29.36 | % | | | (16.92 | )% |
| | | | | | | | | | | | | | | | | | | | | |
| Ratios/Supplemental Data | | | | | | | | | | | | | | | |
| Net assets, end of period (in thousands) | | | $108,373 | | | | $73,683 | | | | $49,725 | | | | $34,074 | | | | $25,181 | |
| Average net assets (in thousands) | | | $ 92,625 | | | | $60,122 | | | | $45,723 | | | | $30,488 | | | | $24,459 | |
| Ratios to average net assets:4 | | | | | | | | | | | | | | | | | | | | |
| Net investment income | | | 3.95 | % | | | 5.07 | % | | | 5.35 | % | | | 6.00 | % | | | 6.71 | % |
| Expenses excluding interest and fees on short-term floating rate notes issued and interest and fees from borrowings | | | 0.92 | % | | | 0.95 | % | | | 1.01 | % | | | 1.04 | % | | | 1.03 | % |
| Interest and fees from borrowings | | | 0.03 | % | | | 0.08 | % | | | 0.08 | % | | | 0.29 | % | | | 0.71 | % |
| Interest and fees on short-term floating rate notes issued5 | |
| 0.04
| %
| |
| 0.06
| %
| |
| 0.06
| %
| |
| —
|
| |
| —
|
|
| Total expenses | | | 0.99 | % | | | 1.09 | % | | | 1.15 | % | | | 1.33 | % | | | 1.74 | % |
| Expenses after payments, waivers and/or reimbursements and reduction to custodian expenses6 | | | 0.87 | % | | | 0.94 | % | | | 0.94 | % | | | 1.03 | % | | | 0.80 | % |
| Portfolio turnover rate | | | 13 | % | | | 4 | % | | | 17 | % | | | 14 | % | | | 20 | % |
1. March 28, 2013 and March 30, 2012 represent the last business days of the Fund’s respective reporting periods. See Note 1 of the accompanying Notes.
2. Per share amounts calculated based on the average shares outstanding during the period.
3. Assumes an initial investment on the business day before the first day of the fiscal period, with all dividends and distributions reinvested in additional shares on the reinvestment date, and redemption at the net asset value calculated on the last business day of the fiscal period. Sales charges are not reflected in the total returns. Total returns are not annualized for periods less than one full year. Returns do not reflect the deduction of taxes that a shareholder would pay on fund distributions or the redemption of fund shares.
4. Annualized for periods less than one full year.
5. Interest and fee expense relates to the Fund’s liability for short-term floating rate notes issued in conjunction with inverse floating rate security transactions.
6. Prior to July 1, 2009, the Manager voluntarily agreed to waive management fees and/or reimburse the Fund for certain expenses so that “Expenses after payments, waivers and/or reimbursements and reduction to custodian expenses,” as a percentage of average annual net assets would not exceed 0.80%. Effective July 1, 2009, the Manager amended this voluntary undertaking so that this waiver would also exclude interest and fees from borrowings.
See accompanying Notes to Financial Statements.
| | | | |
| OPPENHEIMER ROCHESTER MINNESOTA MUNICIPAL FUND | | | 33 | |
FINANCIAL HIGHLIGHTS Continued
| | | | | | | | | | | | | | | | | | | | |
| | | Year Ended
March 28, | | | Year Ended
March 30, | | | Year Ended
March 31, | | | Year Ended
March 31, | | | Year Ended
March 31, | |
| Class B | | 20131 | | | 20121 | | | 2011 | | | 2010 | | | 2009 | |
| Per Share Operating Data | | | | | | | | | | | | | | | |
| Net asset value, beginning of period | | $ | 12.70 | | | $ | 11.28 | | | $ | 11.80 | | | $ | 9.67 | | | $ | 12.37 | |
| Income (loss) from investment operations: | | | | | | | | | | | | | | | | | | | | |
| Net investment income2 | | | .42 | | | | .52 | | | | .54 | | | | .58 | | | | .65 | |
| Net realized and unrealized gain (loss) | |
| .41
|
| |
| 1.42
|
| |
| (.52
| )
| |
| 2.12
|
| |
| (2.79
| )
|
| Total from investment operations | | | .83 | | | | 1.94 | | | | .02 | | | | 2.70 | | | | (2.14 | ) |
| Dividends and/or distributions to shareholders: | | | | | | | | | | | | | | | | | | | | |
| Dividends from net investment income | | | (.43 | ) | | | (.52 | ) | | | (.54 | ) | | | (.57 | ) | | | (.56 | ) |
| Net asset value, end of period | | $
| 13.10
|
| | $
| 12.70
|
| | $
| 11.28
|
| | $
| 11.80
|
| | $
| 9.67
|
|
| Total Return, at Net Asset Value3 | | | 6.58 | % | | | 17.45 | % | | | 0.09 | % | | | 28.43 | % | | | (17.57 | )% |
| | | | | | | | | | | | | | | | | | | | | |
| Ratios/Supplemental Data | | | | | | | | | | | | | | | |
| Net assets, end of period (in thousands) | | | $3,605 | | | | $3,300 | | | | $1,914 | | | | $1,406 | | | | $635 | |
| Average net assets (in thousands) | | | $3,649 | | | | $2,323 | | | | $1,842 | | | | $ 993 | | | | $622 | |
| Ratios to average net assets:4 | | | | | | | | | | | | | | | | | | | | |
| Net investment income | | | 3.23 | % | | | 4.29 | % | | | 4.60 | % | | | 5.19 | % | | | 5.96 | % |
| Expenses excluding interest and fees on short-term floating rate notes issued and interest and fees from borrowings | | | 1.72 | % | | | 1.76 | % | | | 1.82 | % | | | 1.95 | % | | | 2.09 | % |
| Interest and fees from borrowings | | | 0.03 | % | | | 0.08 | % | | | 0.08 | % | | | 0.29 | % | | | 0.71 | % |
| Interest and fees on short-term floating rate notes issued5 | |
| 0.04
| %
| |
| 0.06
| %
| |
| 0.06
| %
| |
| —
|
| |
| —
|
|
| Total expenses | | | 1.79 | % | | | 1.90 | % | | | 1.96 | % | | | 2.24 | % | | | 2.80 | % |
| Expenses after payments, waivers and/or reimbursements and reduction to custodian expenses6 | | | 1.62 | % | | | 1.69 | % | | | 1.69 | % | | | 1.80 | % | | | 1.55 | % |
| Portfolio turnover rate | | | 13 | % | | | 4 | % | | | 17 | % | | | 14 | % | | | 20 | % |
1. March 28, 2013 and March 30, 2012 represent the last business days of the Fund’s respective reporting periods. See Note 1 of the accompanying Notes.
2. Per share amounts calculated based on the average shares outstanding during the period.
3. Assumes an initial investment on the business day before the first day of the fiscal period, with all dividends and distributions reinvested in additional shares on the reinvestment date, and redemption at the net asset value calculated on the last business day of the fiscal period. Sales charges are not reflected in the total returns. Total returns are not annualized for periods less than one full year. Returns do not reflect the deduction of taxes that a shareholder would pay on fund distributions or the redemption of fund shares.
4. Annualized for periods less than one full year.
5. Interest and fee expense relates to the Fund’s liability for short-term floating rate notes issued in conjunction with inverse floating rate security transactions.
6. Prior to July 1, 2009, the Manager voluntarily agreed to waive management fees and/or reimburse the Fund for certain expenses so that “Expenses after payments, waivers and/or reimbursements and reduction to custodian expenses,” as a percentage of average annual net assets would not exceed 1.55%. Effective July 1, 2009, the Manager amended this voluntary undertaking so that this waiver would also exclude interest and fees from borrowings.
See accompanying Notes to Financial Statements.
| | |
| 34 | | OPPENHEIMER ROCHESTER MINNESOTA MUNICIPAL FUND |
| | | | | | | | | | | | | | | | | | | | |
| | | Year Ended
March 28, | | | Year Ended
March 30, | | | Year Ended
March 31, | | | Year Ended
March 31, | | | Year Ended
March 31, | |
| Class C | | 20131 | | | 20121 | | | 2011 | | | 2010 | | | 2009 | |
| Per Share Operating Data | | | | | | | | | | | | | | | |
| Net asset value, beginning of period | | $ | 12.69 | | | $ | 11.28 | | | $ | 11.79 | | | $ | 9.67 | | | $ | 12.37 | |
| Income (loss) from investment operations: | | | | | | | | | | | | | | | | | | | | |
| Net investment income2 | | | .42 | | | | .52 | | | | .54 | | | | .57 | | | | .65 | |
| Net realized and unrealized gain (loss) | |
| .42
|
| |
| 1.41
|
| |
| (.51
| )
| |
| 2.11
|
| |
| (2.79
| )
|
| Total from investment operations | | | .84 | | | | 1.93 | | | | .03 | | | | 2.68 | | | | (2.14 | ) |
| Dividends and/or distributions to shareholders: | | | | | | | | | | | | | | | | | | | | |
| Dividends from net investment income | | | (.43 | ) | | | (.52 | ) | | | (.54 | ) | | | (.56 | ) | | | (.56 | ) |
| Net asset value, end of period | | $
| 13.10
|
| | $
| 12.69
|
| | $
| 11.28
|
| | $
| 11.79
|
| | $
| 9.67
|
|
| Total Return, at Net Asset Value3 | | | 6.66 | % | | | 17.36 | % | | | 0.16 | % | | | 28.31 | % | | | (17.57 | )% |
| | | | | | | | | | | | | | | | | | | | | |
| Ratios/Supplemental Data | | | | | | | | | | | | | | | |
| Net assets, end of period (in thousands) | | | $36,355 | | | | $23,584 | | | | $14,403 | | | | $7,521 | �� | | | $2,029 | |
| Average net assets (in thousands) | | | $30,469 | | | | $17,708 | | | | $15,492 | | | | $4,019 | | | | $2,217 | |
| Ratios to average net assets:4 | | | | | | | | | | | | | | | | | | | | |
| Net investment income | | | 3.19 | % | | | 4.30 | % | | | 4.55 | % | | | 5.08 | % | | | 5.88 | % |
| Expenses excluding interest and fees on short-term floating rate notes issued and interest and fees from borrowings | | | 1.70 | % | | | 1.75 | % | | | 1.77 | % | | | 1.93 | % | | | 2.13 | % |
| Interest and fees from borrowings | | | 0.03 | % | | | 0.08 | % | | | 0.08 | % | | | 0.29 | % | | | 0.71 | % |
| Interest and fees on short-term floating rate notes issued5 | |
| 0.04
| %
| |
| 0.06
| %
| |
| 0.06
| %
| |
| —
|
| |
| —
|
|
| Total expenses | | | 1.77 | % | | | 1.89 | % | | | 1.91 | % | | | 2.22 | % | | | 2.84 | % |
| Expenses after payments, waivers and/or reimbursements and reduction to custodian expenses6 | | | 1.62 | % | | | 1.68 | % | | | 1.69 | % | | | 1.82 | % | | | 1.55 | % |
| Portfolio turnover rate | | | 13 | % | | | 4 | % | | | 17 | % | | | 14 | % | | | 20 | % |
1. March 28, 2013 and March 30, 2012 represent the last business days of the Fund’s respective reporting periods. See Note 1 of the accompanying Notes.
2. Per share amounts calculated based on the average shares outstanding during the period.
3. Assumes an initial investment on the business day before the first day of the fiscal period, with all dividends and distributions reinvested in additional shares on the reinvestment date, and redemption at the net asset value calculated on the last business day of the fiscal period. Sales charges are not reflected in the total returns. Total returns are not annualized for periods less than one full year. Returns do not reflect the deduction of taxes that a shareholder would pay on fund distributions or the redemption of fund shares.
4. Annualized for periods less than one full year.
5. Interest and fee expense relates to the Fund’s liability for short-term floating rate notes issued in conjunction with inverse floating rate security transactions.
6. Prior to July 1, 2009, the Manager voluntarily agreed to waive management fees and/or reimburse the Fund for certain expenses so that “Expenses after payments, waivers and/or reimbursements and reduction to custodian expenses,” as a percentage of average annual net assets would not exceed 1.55%. Effective July 1, 2009, the Manager amended this voluntary undertaking so that this waiver would also exclude interest and fees from borrowings.
See accompanying Notes to Financial Statements.
| | | | |
| OPPENHEIMER ROCHESTER MINNESOTA MUNICIPAL FUND | | | 35 | |
FINANCIAL HIGHLIGHTS Continued
| | | | | | | | |
| Class Y | | Year Ended
March 28,
20131 | | | Period Ended
March 30,
20121,2 | |
| | | | | | | | | |
| Per Share Operating Data | | | | | | |
| Net asset value, beginning of period | | $ | 12.71 | | | $ | 11.91 | |
| Income (loss) from investment operations: | | | | | | | | |
| Net investment income3 | | | .52 | | | | .40 | |
| Net realized and unrealized gain | |
| .43
|
| |
| .81
|
|
| Total from investment operations | | | .95 | | | | 1.21 | |
| Dividends and/or distributions to shareholders: | | | | | | | | |
| Dividends from net investment income | | | (.54 | ) | | | (.41 | ) |
| Net asset value, end of period | | $
| 13.12
|
| | $
| 12.71
|
|
| Total Return, at Net Asset Value4 | | | 7.53 | % | | | 10.36 | % |
| | | | | | | | | |
| Ratios/Supplemental Data | | | | | | |
| Net assets, end of period (in thousands) | | | $3,390 | | | | $1,290 | |
| Average net assets (in thousands) | | | $2,208 | | | | $ 600 | |
| Ratios to average net assets:5 | | | | | | | | |
| Net investment income | | | 3.99 | % | | | 4.75 | % |
| Expenses excluding interest and fees on short-term floating rate notes issued and interest and fees from borrowings | | | 0.73 | % | | | 0.72 | % |
| Interest and fees from borrowings | | | 0.03 | % | | | 0.03 | % |
| Interest and fees on short-term floating rate notes issued6 | |
| 0.04
| %
| |
| 0.06
| %
|
| Total expenses | | | 0.80 | % | | | 0.81 | % |
| Expenses after payments, waivers and/or reimbursements and reduction to custodian expenses | | | 0.80 | % | | | 0.81 | % |
| Portfolio turnover rate | | | 13 | % | | | 4 | % |
1. March 28, 2013 and March 30, 2012 represent the last business days of the Fund’s respective reporting periods. See Note 1 of the accompanying Notes.
2. For the period from July 29, 2011 (inception of offering) to March 30, 2012.
3. Per share amounts calculated based on the average shares outstanding during the period.
4. Assumes an initial investment on the business day before the first day of the fiscal period, with all dividends and distributions reinvested in additional shares on the reinvestment date, and redemption at the net asset value calculated on the last business day of the fiscal period. Sales charges are not reflected in the total returns. Total returns are not annualized for periods less than one full year. Returns do not reflect the deduction of taxes that a shareholder would pay on fund distributions or the redemption of fund shares.
5. Annualized for periods less than one full year.
6. Interest and fee expense relates to the Fund’s liability for short-term floating rate notes issued in conjunction with inverse floating rate security transactions.
See accompanying Notes to Financial Statements.
| | |
| 36 | | OPPENHEIMER ROCHESTER MINNESOTA MUNICIPAL FUND |
NOTES TO FINANCIAL STATEMENTS March 28, 2013
1. Significant Accounting Policies
Oppenheimer Rochester Minnesota Municipal Fund (the “Fund”) is registered under the Investment Company Act of 1940, as amended as a diversified, open-end management investment company. The investment objective of the Fund is to seek a high level of current interest income exempt from federal and Minnesota state income taxes for individual investors as is consistent with preservation of capital. The Fund’s investment adviser was OppenheimerFunds, Inc. (“OFI” or the “Sub-Adviser”), through December 31, 2012. Effective January 1, 2013, the Fund’s investment adviser is OFI Global Asset Management, Inc. (“OFI Global” or the “Manager”), a wholly-owned subsidiary of OFI. The Manager has entered into a sub-advisory agreement with OFI, as of the same effective date.
The Fund offers Class A, Class C and Class Y shares, and previously offered Class B shares for new purchase through June 29, 2012. Subsequent to that date, no new purchases of Class B shares are permitted, however reinvestment of dividend and/or capital gain distributions and exchanges of Class B shares into and from other Oppenheimer funds will be allowed. Class A shares are sold at their offering price, which is normally net asset value plus a front-end sales charge. Class C shares are sold, and Class B shares were sold, without a front-end sales charge but may be subject to a contingent deferred sales charge (“CDSC”). Class Y shares are sold to certain institutional investors or intermediaries without either a front-end sales charge or a CDSC, however, the intermediaries may impose charges on their accountholders who beneficially own Class Y shares. All classes of shares have identical rights and voting privileges with respect to the Fund in general and exclusive voting rights on matters that affect that class alone. Earnings, net assets and net asset value per share may differ due to each class having its own expenses, such as transfer and shareholder servicing agent fees and shareholder communications, directly attributable to that class. Class A, B and C shares have separate distribution and/or service plans under which they pay fees. Class Y shares do not pay such fees. Class B shares will automatically convert to Class A shares 72 months after the date of purchase.
The following is a summary of significant accounting policies consistently followed by the Fund.
Annual Periods. The last day of the Fund’s current and prior fiscal year was the last day the New York Stock Exchange was open for trading. The Fund’s financial statements have been presented through those dates to maintain consistency with the Fund’s net asset value calculations used for shareholder transactions.
Inverse Floating Rate Securities. The Fund invests in inverse floating rate securities that pay interest at a rate that varies inversely with short-term interest rates. Because inverse floating rate securities are leveraged instruments, the value of an inverse floating rate security will change more significantly in response to changes in interest rates and other market fluctuations than the market value of a conventional fixed-rate municipal security of similar maturity and credit quality, including the municipal bond underlying an inverse floating rate security.
| | | | |
| OPPENHEIMER ROCHESTER MINNESOTA MUNICIPAL FUND | | | 37 | |
NOTES TO FINANCIAL STATEMENTS Continued
1. Significant Accounting Policies Continued
An inverse floating rate security is created as part of a financial transaction referred to as a “tender option bond” transaction. In most cases, in a tender option bond transaction the Fund sells a fixed-rate municipal bond (the “underlying municipal bond”) to a broker dealer (the “sponsor”). The sponsor creates a trust (the “Trust”) into which it deposits the underlying municipal bond. The Trust then issues and sells short-term floating rate securities with a fixed principal amount representing a senior interest in the underlying municipal bond to third parties and a residual, subordinate interest in the underlying municipal bond (referred to as an “inverse floating rate security”) to the Fund. The interest rate on the short-term floating rate securities resets periodically, usually weekly, to a prevailing market rate and holders of these securities are granted the option to tender their securities back to the Trust for repurchase at their principal amount plus accrued interest thereon (the “purchase price”) periodically, usually daily or weekly. A remarketing agent for the Trust is required to attempt to re-sell any tendered short-term floating rate securities to new investors for the purchase price. If the remarketing agent is unable to successfully re-sell the tendered short-term floating rate securities, a liquidity provider to the Trust (typically an affiliate of the sponsor) must contribute cash to the Trust to ensure that the tendering holders receive the purchase price of their securities on the repurchase date.
Because holders of the short-term floating rate securities are granted the right to tender their securities to the Trust for repurchase at frequent intervals for the purchase price, with such payment effectively guaranteed by the liquidity provider, the securities generally bear short-term rates of interest commensurate with money market instruments. When interest is paid on the underlying municipal bond to the Trust, such proceeds are first used to pay the Trust’s administrative expenses and accrued interest to holders of the short-term floating rate securities, with any remaining amounts being paid to the Fund, as the holder of the inverse floating rate security. Accordingly, the amount of such interest on the underlying municipal bond paid to the Fund is inversely related to the rate of interest on the short-term floating rate securities. Additionally, because the principal amount of the short-term floating rate securities is fixed and is not adjusted in response to changes in the market value of the underlying municipal bond, any change in the market value of the underlying municipal bond is reflected entirely in a change to the value of the inverse floating rate security.
Typically, the terms of an inverse floating rate security grant certain rights to the Fund, as holder. For example, the Fund may have the right upon request to require that the Trust compel a tender of the short-term floating rate securities to facilitate the Fund’s acquisition of the underlying municipal bond. Following such a request, the Fund pays the Trust the purchase price of the short-term floating rate securities and a specified portion of any market value gain on the underlying municipal bond since its deposit into the Trust, which the Trust uses to redeem the short-term floating rate securities. The Trust then distributes the underlying municipal bond to the Fund. Similarly, the Fund may have the right to directly purchase the underlying municipal bond from the Trust by paying to
| | |
| 38 | | OPPENHEIMER ROCHESTER MINNESOTA MUNICIPAL FUND |
the Trust the purchase price of the short-term floating rate securities and a specified portion of any market value gain on the underlying municipal bond since its deposit into the Trust, which the Trust uses to redeem the short-term floating rate securities. Through the exercise of either of these rights, the Fund can voluntarily terminate or “collapse” the Trust, terminate its investment in the related inverse floating rate security and obtain the underlying municipal bond. Additionally, the Fund also typically has the right to exchange with the Trust (i) a principal amount of short-term floating rate securities held by the Fund for a corresponding additional principal amount of the inverse floating rate security or (ii) a principal amount of the inverse floating rate security held by the Fund for a corresponding additional principal amount of short-term floating rate securities (which are typically then sold to other investors). Through the exercise of this right, the Fund may increase (or decrease) the principal amount of short-term floating rate securities outstanding, thereby increasing (or decreasing) the amount of leverage provided by the short-term floating rate securities to the Fund’s investment exposure to the underlying municipal bond.
The Fund’s investments in inverse floating rate securities involve certain risks. As short-term interest rates rise, an inverse floating rate security produces less current income (and, in extreme cases, may pay no income) and as short-term interest rates fall, an inverse floating rate security produces more current income. Thus, if short-term interest rates rise after the issuance of the inverse floating rate security, any yield advantage is reduced or eliminated. All inverse floating rate securities entail some degree of leverage represented by the outstanding principal amount of the related short-term floating rate securities. The value of, and income earned on, an inverse floating rate security that has a higher degree of leverage will fluctuate more significantly in response to changes in interest rates and to changes in the market value of the related underlying municipal bond than that of an inverse floating rate security with a lower degree of leverage, and is more likely to be eliminated entirely under adverse market conditions. Changes in the value of an inverse floating rate security will also be more significant than changes in the market value of the related underlying municipal bond because the leverage provided by the related short-term floating rate securities increases the sensitivity of an inverse floating rate security to changes in interest rates and to the market value of the underlying municipal bond. An inverse floating rate security can be expected to underperform fixed-rate municipal bonds when the difference between long-term and short-term interest rates is decreasing (or is already small) or when long-term interest rates are rising, but can be expected to outperform fixed-rate municipal bonds when the difference between long-term and short-term interest rates is increasing (or is already large) or when long-term interest rates are falling. Additionally, a tender option bond transaction typically provides for the automatic termination or “collapse” of a Trust upon the occurrence of certain adverse events, usually referred to as “mandatory tender events” or “tender option termination events.” These events may include, among others, a credit ratings downgrade of the underlying municipal bond below a specified level, a decrease in the market value of the underlying municipal bond below a specified amount, a bankruptcy of the liquidity provider or the inability of
| | | | |
| OPPENHEIMER ROCHESTER MINNESOTA MUNICIPAL FUND | | | 39 | |
NOTES TO FINANCIAL STATEMENTS Continued
1. Significant Accounting Policies Continued
the remarketing agent to re-sell to new investors short-term floating rate securities that have been tendered for repurchase by holders thereof. Following the occurrence of such an event, the underlying municipal bond is generally sold for current market value and the proceeds distributed to holders of the short-term floating rate securities and inverse floating rate security, with the holder of the inverse floating rate security (the Fund) generally receiving the proceeds of such sale only after the holders of the short-term floating rate securities have received proceeds equal to the purchase price of their securities (and the liquidity provider is generally required to contribute cash to the Trust only in an amount sufficient to ensure that the holders of the short-term floating rate securities receive the purchase price of their securities in connection with such termination of the Trust). Following the occurrence of such events, the Fund could potentially lose the entire amount of its investment in the inverse floating rate security.
Finally, the Fund may enter into shortfall/reimbursement agreements with the liquidity provider of certain tender option bond transactions in connection with certain inverse floating rate securities held by the Fund. These agreements commit the Fund to reimburse the liquidity provider to the extent that the liquidity provider must provide cash to a Trust, including following the termination of a Trust resulting from the occurrence of a “mandatory tender event.” In connection with the occurrence of such an event and the termination of the Trust triggered thereby, the shortfall/reimbursement agreement will make the Fund liable for the amount of the negative difference, if any, between the liquidation value of the underlying municipal bond and the purchase price of the short-term floating rate securities issued by the Trust. Under the standard terms of a tender option bond transaction, absent such a shortfall/reimbursement agreement, the Fund, as holder of the inverse floating rate security, would not be required to make such a reimbursement payment to the liquidity provider. The Sub-Adviser monitors the Fund’s potential exposure with respect to these agreements on a daily basis and intends to take action to terminate the Fund’s investment in related inverse floating rate securities, if it deems it appropriate to do so. As of March 28, 2013, the Fund’s maximum exposure under such agreements is estimated at $6,000,000.
When the Fund creates an inverse floating rate security in a tender option bond transaction by selling an underlying municipal bond to a sponsor for deposit into a Trust, the transaction is considered a secured borrowing for financial reporting purposes. As a result of such accounting treatment, the Fund includes the underlying municipal bond on its Statement of Investments and as an asset on its Statement of Assets and Liabilities (but does not separately include the related inverse floating rate security on either). The Fund also includes a liability on its Statement of Assets and Liabilities equal to the outstanding principal amount and accrued interest on the related short-term floating rate securities issued by the Trust. Interest on the underlying municipal bond is recorded as investment income on the Fund’s Statement of Operations, while interest payable on the related short-term floating rate securities is recorded as interest expense. At March 28, 2013, municipal bond holdings with a value of $8,948,480 shown on the Fund’s Statement of
| | |
| 40 | | OPPENHEIMER ROCHESTER MINNESOTA MUNICIPAL FUND |
Investments are held by such Trusts and serve as the underlying municipal bonds for the related $6,000,000 in short-term floating rate securities issued and outstanding at that date.
At March 28, 2013, the inverse floating rate securities associated with tender option bond transactions accounted for as secured borrowings were as follows:
| | | | | | | | | | | | | | |
Principal
Amount | | Inverse Floater1 | | Coupon
Rate2 | | | Maturity
Date | | | Value | |
| $2,000,000 | | Minneapolis & St. Paul, MN Metropolitan Airports Commission ROLs3 | | | 15.241 | % | | | 1/1/35 | | | $ | 2,948,480 | |
1. For a list of abbreviations used in the Inverse Floater table see the Portfolio Abbreviations table at the end of the Statement of Investments.
2. Represents the current interest rate for the inverse floating rate security.
3. Represents an inverse floating rate security that is subject to a shortfall/reimbursement agreement.
The Fund may also purchase an inverse floating rate security created as part of a tender option bond transaction not initiated by the Fund when a third party, such as a municipal issuer or financial institution, transfers an underlying municipal bond to a Trust. For financial reporting purposes, the Fund includes the inverse floating rate security related to such transaction on its Statement of Investments and as an asset on its Statement of Assets and Liabilities, and interest on the security is recorded as investment income on the Fund’s Statement of Operations.
The Fund may invest in inverse floating rate securities with any degree of leverage (as measured by the outstanding principal amount of related short-term floating rate securities). However, the Fund may only expose up to 20% of its total assets to the effects of leverage from its investments in inverse floating rate securities. This limitation is measured by comparing the aggregate principal amount of the short-term floating rate securities that are related to the inverse floating rate securities held by the Fund to the total assets of the Fund. The Fund’s exposure to the effects of leverage from its investments in inverse floating rate securities amounts to $6,000,000 or 3.74% of its total assets as of March 28, 2013.
Concentration Risk. There are certain risks arising from geographic concentration in any state, commonwealth or territory. Certain economic, regulatory or political developments occurring in the state, commonwealth or territory may impair the ability of certain issuers of municipal securities to pay principal and interest on their obligations.
Allocation of Income, Expenses, Gains and Losses. Income, expenses (other than those attributable to a specific class), gains and losses are allocated on a daily basis to each class of shares based upon the relative proportion of net assets represented by such class. Operating expenses directly attributable to a specific class are charged against the operations of that class.
Federal Taxes. The Fund intends to comply with provisions of the Internal Revenue Code applicable to regulated investment companies and to distribute substantially all of its investment company taxable income, including any net realized gain on investments not offset by capital loss carryforwards, if any, to shareholders. Therefore, no federal income or
| | | | |
| OPPENHEIMER ROCHESTER MINNESOTA MUNICIPAL FUND | | | 41 | |
NOTES TO FINANCIAL STATEMENTS Continued
1. Significant Accounting Policies Continued
excise tax provision is required. The Fund files income tax returns in U.S. federal and applicable state jurisdictions. The statute of limitations on the Fund’s tax return filings generally remain open for the three preceding fiscal reporting period ends.
The tax components of capital shown in the following table represent distribution requirements the Fund must satisfy under the income tax regulations, losses the Fund may be able to offset against income and gains realized in future years and unrealized appreciation or depreciation of securities and other investments for federal income tax purposes.
| | | | | | | | | | | | |
Undistributed
Net Investment
Income | | Undistributed
Long-Term
Gain | | | Accumulated
Loss
Carryforward1,2,3 | | | Net Unrealized
Appreciation
Based on Cost of
Securities and Other
Investments for Federal
Income Tax Purposes | |
| $206,814 | | $— | | | | $ | 2,142,493 | | | $ | 7,537,050 | |
1. As of March 28, 2013, the Fund had $2,142,493 of net capital loss carryforwards available to offset future realized capital gains, if any, and thereby reduce future taxable gain distributions. Details of the capital loss carryforwards are included in the table below. Capital loss carryovers with no expiration, if any, must be utilized prior to those with expiration dates.
| | | | |
| Expiring | | | |
| 2016 | | $ | 1,825 | |
| 2017 | | | 190,675 | |
| 2018 | | | 1,937,724 | |
| 2019 | | | 12,269 | |
| | |
|
|
|
| Total | | $ | 2,142,493 | |
| | |
|
|
|
2. During the fiscal year ended March 28, 2013, the Fund utilized $625,744 of capital loss carryforward to offset capital gains realized in that fiscal year.
3. During the fiscal year ended March 30, 2012, the Fund did not utilize any capital loss carryforward.
Net investment income (loss) and net realized gain (loss) may differ for financial statement and tax purposes. The character of dividends and distributions made during the fiscal year from net investment income or net realized gains may differ from their ultimate characterization for federal income tax purposes. Also, due to timing of dividends and distributions, the fiscal year in which amounts are distributed may differ from the fiscal year in which the income or net realized gain was recorded by the Fund.
Accordingly, the following amounts have been reclassified for March 31, 2013. Net assets of the Fund were unaffected by the reclassifications.
| | | | |
Increase
to Accumulated
Net Investment
Income | | Increase to Accumulated Net
Realized Loss
on Investments | |
| $11,291 | | $ | 11,291 | |
| | |
| 42 | | OPPENHEIMER ROCHESTER MINNESOTA MUNICIPAL FUND |
The tax character of distributions paid during the years ended March 31, 2013 and March 31, 2012 was as follows:
| | | | | | | | |
| | | Year Ended
March 31, 2013 | | | Year Ended
March 31, 2012 | |
| Distributions paid from: | | | | | | | | |
| Exempt-interest dividends | | $ | 4,877,643 | | | $ | 3,840,426 | |
| Ordinary income | | | 11,387 | | | | 3,842 | |
| | |
|
|
| |
|
|
|
| Total | | $ | 4,889,030 | | | $ | 3,844,268 | |
| | |
|
|
| |
|
|
|
The aggregate cost of securities and other investments and the composition of unrealized appreciation and depreciation of securities and other investments for federal income tax purposes as of March 28, 2013 are noted in the following table. The primary difference between book and tax appreciation or depreciation of securities and other investments, if applicable, is attributable to the tax deferral of losses or tax realization of financial statement unrealized gain or loss.
| | | | |
| Federal tax cost of securities | | $ | 143,708,6501 | |
| | |
|
|
|
| Gross unrealized appreciation | | $ | 9,050,909 | |
| Gross unrealized depreciation | | | (1,513,859 | ) |
| | |
|
|
|
| Net unrealized appreciation | | $ | 7,537,050 | |
| | |
|
|
|
1. The Federal tax cost of securities does not include cost of $5,964,846, which has otherwise been recognized for financial reporting purposes, related to bonds placed into trusts in conjunction with certain investment transactions. See the Inverse Floating Rate Securities note above.
Trustees’ Compensation. The Fund has adopted an unfunded retirement plan (the “Plan”) for the Fund’s independent trustees. Benefits are based on years of service and fees paid to each trustee during their period of service. The Plan was frozen with respect to adding new participants effective December 31, 2006 (the “Freeze Date”) and existing Plan Participants as of the Freeze Date will continue to receive accrued benefits under the Plan. Active independent trustees as of the Freeze Date have each elected a distribution method with respect to their benefits under the Plan. During the year ended March 28, 2013, the Fund’s projected benefit obligations, payments to retired trustees and accumulated liability were as follows:
| | | | |
| Projected Benefit Obligations Increased | | $ | 188 | |
| Payments Made to Retired Trustees | | | 126 | |
| Accumulated Liability as of March 28, 2013 | | | 926 | |
The Board of Trustees has adopted a compensation deferral plan for independent trustees that enables trustees to elect to defer receipt of all or a portion of the annual compensation they are entitled to receive from the Fund. For purposes of determining the amount owed to the Trustee under the plan, deferred amounts are treated as though equal dollar amounts had been invested in shares of the Fund or in other Oppenheimer funds selected by the Trustee. The Fund purchases shares of the funds selected for deferral by the Trustee in amounts equal to his or her deemed investment, resulting in a Fund asset equal to the deferred compensation liability. Such assets are included as a
| | | | |
| OPPENHEIMER ROCHESTER MINNESOTA MUNICIPAL FUND | | | 43 | |
NOTES TO FINANCIAL STATEMENTS Continued
1. Significant Accounting Policies Continued
component of “Other” within the asset section of the Statement of Assets and Liabilities. Deferral of trustees’ fees under the plan will not affect the net assets of the Fund, and will not materially affect the Fund’s assets, liabilities or net investment income per share. Amounts will be deferred until distributed in accordance with the compensation deferral plan.
Dividends and Distributions to Shareholders. Dividends and distributions to shareholders, which are determined in accordance with income tax regulations and may differ from U.S. generally accepted accounting principles, are recorded on the ex-dividend date. Income distributions, if any, are declared daily and paid monthly. Capital gain distributions, if any, are declared and paid annually.
Investment Income. Interest income is recognized on an accrual basis. Discount and premium, which are included in interest income on the Statement of Operations, are amortized or accreted daily.
Custodian Fees. “Custodian fees and expenses” in the Statement of Operations may include interest expense incurred by the Fund on any cash overdrafts of its custodian account during the period. Such cash overdrafts may result from the effects of failed trades in portfolio securities and from cash outflows resulting from unanticipated shareholder redemption activity. The Fund pays interest to its custodian on such cash overdraft at a rate equal to the 1 Month LIBOR Rate plus 2.00%. The “Reduction to custodian expenses” line item, if applicable, represents earnings on cash balances maintained by the Fund during the period. Such interest expense and other custodian fees may be paid with these earnings.
Security Transactions. Security transactions are recorded on the trade date. Realized gains and losses on securities sold are determined on the basis of identified cost.
Indemnifications. The Fund’s organizational documents provide current and former trustees and officers with a limited indemnification against liabilities arising in connection with the performance of their duties to the Fund. In the normal course of business, the Fund may also enter into contracts that provide general indemnifications. The Fund’s maximum exposure under these arrangements is unknown as this would be dependent on future claims that may be made against the Fund. The risk of material loss from such claims is considered remote.
Other. The preparation of financial statements in conformity with accounting principles generally accepted in the United States of America requires management to make estimates and assumptions that affect the reported amounts of assets and liabilities and disclosure of contingent assets and liabilities at the date of the financial statements and the reported amounts of increases and decreases in net assets from operations during the reporting period. Actual results could differ from those estimates.
| | |
| 44 | | OPPENHEIMER ROCHESTER MINNESOTA MUNICIPAL FUND |
2. Securities Valuation
The Fund calculates the net asset value of its shares as of the close of the New York Stock Exchange (the “Exchange”), normally 4:00 P.M. Eastern time, on each day the Exchange is open for trading.
The Fund’s Board has adopted procedures for the valuation of the Fund’s securities and has delegated the day-to-day responsibility for valuation determinations under those procedures to the Manager. The Manager has established a Valuation Committee which is responsible for determining a “fair valuation” for any security for which market quotations are not “readily available.” The Valuation Committee’s fair valuation determinations are subject to review, approval and ratification by the Fund’s Board at its next regularly scheduled meeting covering the calendar quarter in which the fair valuation was determined.
Valuation Methods and Inputs
Securities are valued using unadjusted quoted market prices, when available, as supplied primarily by third party pricing services or dealers.
The following methodologies are used to determine the market value or the fair value of the types of securities described below:
Securities traded on a registered U.S. securities exchange (including exchange-traded derivatives other than futures and futures options) are valued based on the last sale price of the security reported on the principal exchange on which it is traded, prior to the time when the Fund’s assets are valued. In the absence of a sale, the security is valued at the last sale price on the prior trading day, if it is within the spread of the current day’s closing “bid” and “asked” prices, and if not, at the current day’s closing bid price. A security of a foreign issuer traded on a foreign exchange but not listed on a registered U.S. securities exchange is valued based on the last sale price on the principal exchange on which the security is traded, as identified by the third party pricing service used by the Manager, prior to the time when the Fund’s assets are valued. If the last sale price is unavailable, the security is valued at the most recent official closing price on the principal exchange on which it is traded. If the last sales price or official closing price for a foreign security is not available, the security is valued at the mean between the bid and asked price per the exchange or, if not available from the exchange, obtained from two dealers. If bid and asked prices are not available from either the exchange or two dealers, the security is valued by using one of the following methodologies (listed in order of priority); (1) using a bid from the exchange, (2) the mean between the bid and asked price as provided by a single dealer, or (3) a bid from a single dealer.
Shares of a registered investment company that are not traded on an exchange are valued at that investment company’s net asset value per share.
Corporate and government debt securities (of U.S. or foreign issuers) and municipal debt securities, event-linked bonds, loans, mortgage-backed securities, collateralized mortgage obligations, and asset-backed securities are valued at the mean between the “bid” and “asked” prices utilizing evaluated prices obtained from third party pricing services or broker-dealers who may use matrix pricing methods to determine the evaluated prices.
| | | | |
| OPPENHEIMER ROCHESTER MINNESOTA MUNICIPAL FUND | | | 45 | |
NOTES TO FINANCIAL STATEMENTS Continued
2. Securities Valuation Continued
Short-term money market type debt securities with a remaining maturity of sixty days or less are valued at cost adjusted by the amortization of discount or premium to maturity (amortized cost), which approximates market value. Short-term debt securities with a remaining maturity in excess of sixty days are valued at the mean between the “bid” and “asked” prices utilizing evaluated prices obtained from third party pricing services or broker-dealers.
A description of the standard inputs that may generally be considered by the third party pricing vendors in determining their evaluated prices is provided below.
| | |
| Security Type | | Standard inputs generally considered by third-party pricing vendors |
| Corporate debt, government debt, municipal, mortgage-backed and asset-backed securities | | Reported trade data, broker-dealer price quotations, benchmark yields, issuer spreads on comparable securities, the credit quality, yield, maturity, and other appropriate factors. |
| Loans | | Information obtained from market participants regarding reported trade data and broker-dealer price quotations. |
| Event-linked bonds | | Information obtained from market participants regarding reported trade data and broker-dealer price quotations. |
If a market value or price cannot be determined for a security using the methodologies described above, or if, in the “good faith” opinion of the Manager, the market value or price obtained does not constitute a “readily available market quotation,” or a significant event has occurred that would materially affect the value of the security the security is fair valued either (i) by a standardized fair valuation methodology applicable to the security type or the significant event as previously approved by the Valuation Committee and the Fund’s Board or (ii) as determined in good faith by the Manager’s Valuation Committee. The Valuation Committee considers all relevant facts that are reasonably available, through either public information or information available to the Manager, when determining the fair value of a security. Fair value determinations by the Manager are subject to review, approval and ratification by the Fund’s Board at its next regularly scheduled meeting covering the calendar quarter in which the fair valuation was determined. Those fair valuation standardized methodologies include, but are not limited to, valuing securities at the last sale price or initially at cost and subsequently adjusting the value based on: changes in company specific fundamentals, changes in an appropriate securities index, or changes in the value of similar securities which may be further adjusted for any discounts related to security-specific resale restrictions. When possible, such methodologies use observable market inputs such as unadjusted quoted prices of similar securities, observable interest rates, currency rates and yield curves. The methodologies used for valuing securities are not necessarily an indication of the risks associated with investing in those securities nor can it be assured that the Fund can obtain the fair value assigned to a security if it were to sell the security.
To assess the continuing appropriateness of security valuations, the Manager, or its third party service provider who is subject to oversight by the Manager, regularly compares prior day prices, prices on comparable securities, and sale prices to the current day prices and challenges those prices exceeding certain tolerance levels with the third party pricing
| | |
| 46 | | OPPENHEIMER ROCHESTER MINNESOTA MUNICIPAL FUND |
service or broker source. For those securities valued by fair valuations, whether through a standardized fair valuation methodology or a fair valuation determination, the Valuation Committee reviews and affirms the reasonableness of the valuations based on such methodologies and fair valuation determinations on a regular basis after considering all relevant information that is reasonably available.
Classifications
Each investment asset or liability of the Fund is assigned a level at measurement date based on the significance and source of the inputs to its valuation. Various data inputs are used in determining the value of each of the Fund’s investments as of the reporting period end. These data inputs are categorized in the following hierarchy under applicable financial accounting standards:
| 1) | | Level 1—unadjusted quoted prices in active markets for identical assets or liabilities (including securities actively traded on a securities exchange) |
| 2) | | Level 2—inputs other than unadjusted quoted prices that are observable for the asset or liability (such as unadjusted quoted prices for similar assets and market corroborated inputs such as interest rates, prepayment speeds, credit risks, etc.) |
| 3) | | Level 3—significant unobservable inputs (including the Manager’s own judgments about assumptions that market participants would use in pricing the asset or liability). |
The inputs used for valuing securities are not necessarily an indication of the risks associated with investing in those securities.
The table below categorizes amounts that are included in the Fund’s Statement of Assets and Liabilities as of March 28, 2013 based on valuation input level:
| | | | | | | | | | | | | | | | | | | | |
| | | Level 1—
Unadjusted
Quoted Prices | | Level 2—
Other Significant
Observable Inputs | | Level 3—
Significant
Unobservable
Inputs | | Value |
| Assets Table | | | | | | | | | | | | | | | | | | | | |
| Investments, at Value: | | | | | | | | | | | | | | | | | | | | |
| Municipal Bonds and Notes | | | | | | | | | | | | | | | | | | | | |
Minnesota | | | $ | — | | | | $ | 152,200,597 | | | | $ | — | | | | $ | 152,200,597 | |
U.S. Possessions | | | | — | | | | | 5,009,949 | | | | | — | | | | | 5,009,949 | |
| | | |
|
|
|
| Total Assets | | | $ | — | | | | $ | 157,210,546 | | | | $ | — | | | | $ | 157,210,546 | |
| | | |
|
|
|
Currency contracts and forwards, if any, are reported at their unrealized appreciation/depreciation at measurement date, which represents the change in the contract’s value from trade date. Futures, if any, are reported at their variation margin at measurement date, which represents the amount due to/from the Fund at that date. All additional assets and liabilities included in the above table are reported at their market value at measurement date.
| | | | |
| OPPENHEIMER ROCHESTER MINNESOTA MUNICIPAL FUND | | | 47 | |
NOTES TO FINANCIAL STATEMENTS Continued
3. Shares of Beneficial Interest
The Fund has authorized an unlimited number of $0.001 par value shares of beneficial interest of each class. Transactions in shares of beneficial interest were as follows:
| | | | | | | | | | | | | | | | |
| | | Year Ended March 28, 2013 | | | Year Ended March 30, 20121 | |
| | | Shares | | | Amount | | | Shares | | | Amount | |
| Class A | | | | | | | | | | | | | | | | |
| Sold | | | 3,153,426 | | | $ | 41,344,411 | | | | 2,073,326 | | | $ | 25,453,245 | |
Dividends and/or
distributions reinvested | | | 260,581 | | | | 3,414,444 | | | | 220,540 | | | | 2,692,502 | |
| Redeemed | | | (950,639 | ) | | | (12,504,630 | ) | | | (899,826 | ) | | | (10,993,870 | ) |
| | |
|
|
|
| Net increase | | | 2,463,368 | | | $ | 32,254,225 | | | | 1,394,040 | | | $ | 17,151,877 | |
| | |
|
|
|
| | | | | | | | | | | | | | | | | |
| Class B | | | | | | | | | | | | | | | | |
| Sold | | | 27,551 | | | $ | 354,812 | | | | 102,746 | | | $ | 1,283,324 | |
Dividends and/or
distributions reinvested | | | 8,656 | | | | 113,203 | | | | 7,181 | | | | 87,646 | |
| Redeemed | | | (21,077 | ) | | | (277,506 | ) | | | (19,713 | ) | | | (241,773 | ) |
| | |
|
|
|
| Net increase | | | 15,130 | | | $ | 190,509 | | | | 90,214 | | | $ | 1,129,197 | |
| | |
|
|
|
| | | | | | | | | | | | | | | | | |
| Class C | | | | | | | | | | | | | | | | |
| Sold | | | 1,145,170 | | | $ | 14,969,250 | | | | 748,497 | | | $ | 9,220,335 | |
Dividends and/or
distributions reinvested | | | 67,081 | | | | 878,175 | | | | 51,749 | | | | 631,253 | |
| Redeemed | | | (295,583 | ) | | | (3,863,429 | ) | | | (219,413 | ) | | | (2,641,352 | ) |
| | |
|
|
|
| Net increase | | | 916,668 | | | $ | 11,983,996 | | | | 580,833 | | | $ | 7,210,236 | |
| | |
|
|
|
| | | | | | | | | | | | | | | | | |
| Class Y | | | | | | | | | | | | | | | | |
| Sold | | | 230,760 | | | $ | 3,031,015 | | | | 140,324 | | | $ | 1,759,991 | |
Dividends and/or
distributions reinvested | | | 6,092 | | | | 79,981 | | | | 1,021 | | | | 12,951 | |
| Redeemed | | | (79,879 | ) | | | (1,047,905 | ) | | | (39,886 | ) | | | (505,423 | ) |
| | |
|
|
|
| Net increase | | | 156,973 | | | $ | 2,063,091 | | | | 101,459 | | | $ | 1,267,519 | |
| | |
|
|
|
1. For the year ended March 30, 2012, for Class A, Class B and Class C shares, and for the period from July 29, 2011 (inception of offering) to March 30, 2012, for Class Y shares.
4. Purchases and Sales of Securities
The aggregate cost of purchases and proceeds from sales of securities, other than short-term obligations, for the year ended March 28, 2013, were as follows:
| | | | | | | | |
| | | Purchases | | | Sales | |
| Investment securities | | $ | 58,146,714 | | | $ | 15,988,751 | |
| | |
| 48 | | OPPENHEIMER ROCHESTER MINNESOTA MUNICIPAL FUND |
5. Fees and Other Transactions with Affiliates
Management Fees. Under the investment advisory agreement, the Fund pays the Manager a management fee based on the daily net assets of the Fund at an annual rate as shown in the following table:
| | | | |
| Fee Schedule | | | |
| Up to $500 million | | | 0.55 | % |
| Next $500 million | | | 0.50 | |
| Next $500 million | | | 0.45 | |
| Over $1.5 billion | | | 0.40 | |
Sub-Adviser Fees. The Manager has retained the Sub-Adviser to provide the day-to-day portfolio management of the Fund. Under the Sub-Advisory Agreement, the Manager pays the Sub-Adviser an annual fee in monthly installments, equal to a percentage of the investment management fee collected by the Manager from the Fund, which shall be calculated after any investment management fee waivers. The fee paid to the Sub-Adviser is paid by the Manager, not by the Fund.
Transfer Agent Fees. OppenheimerFunds Services (“OFS”), a division of OFI, acted as the transfer and shareholder servicing agent for the Fund through December 31, 2012. Effective January 1, 2013, OFI Global (the “Transfer Agent”) serves as the transfer and shareholder servicing agent for the Fund. The Fund pays the Transfer Agent a per account fee.
Additionally, Class Y shares are subject to minimum fees of $10,000 annually for assets of $10 million or more. The Class Y shares are subject to the minimum fees in the event that the per account fee does not equal or exceed the applicable minimum fees. The Transfer Agent may voluntarily waive the minimum fees.
Sub-Transfer Agent Fees. Effective January 1, 2013, the Transfer Agent has retained Shareholder Services, Inc., a wholly-owned subsidiary of OFI, (the “Sub-Transfer Agent”) to provide the day-to-day transfer agent and shareholder servicing of the Fund. Under the Sub-Transfer Agency Agreement, the Transfer Agent pays the Sub-Transfer Agent an annual fee in monthly installments, equal to a percentage of the transfer agent fee collected by the Transfer Agent from the Fund, which shall be calculated after any applicable fee waivers. The fee paid to the Sub-Transfer Agent is paid by the Transfer Agent, not by the Fund.
Distribution and Service Plan (12b-1) Fees. Under its General Distributor’s Agreement with the Fund, OppenheimerFunds Distributor, Inc. (the “Distributor”) acts as the Fund’s principal underwriter in the continuous public offering of the Fund’s classes of shares.
Service Plan for Class A Shares. The Fund has adopted a Service Plan (the “Plan”) for Class A shares under Rule 12b-1 of the Investment Company Act of 1940. Under the Plan, the Fund reimburses the Distributor for a portion of its costs incurred for services provided to accounts that hold Class A shares. Reimbursement is made periodically at an annual rate of up to 0.25% of the daily net assets of Class A shares of the Fund. The Distributor currently uses all of those fees to pay dealers, brokers, banks and other financial institutions periodically for providing personal service and maintenance of accounts of
| | | | |
| OPPENHEIMER ROCHESTER MINNESOTA MUNICIPAL FUND | | | 49 | |
NOTES TO FINANCIAL STATEMENTS Continued
5. Fees and Other Transactions with Affiliates Continued
their customers that hold Class A shares. Any unreimbursed expenses the Distributor incurs with respect to Class A shares in any fiscal year cannot be recovered in subsequent periods. Fees incurred by the Fund under the Plan are detailed in the Statement of Operations.
Distribution and Service Plans for Class B and Class C Shares. The Fund has adopted Distribution and Service Plans (the “Plans”) for Class B and Class C shares under Rule 12b-1 of the Investment Company Act of 1940 to compensate the Distributor for its services in connection with the distribution of those shares and servicing accounts. Under the Plans, the Fund pays the Distributor an annual asset-based sales charge of 0.75% on Class B and Class C shares daily net assets. The Distributor also receives a service fee of 0.25% per year under each plan. If either the Class B or Class C plan is terminated by the Fund or by the shareholders of a class, the Board of Trustees and its independent trustees must determine whether the Distributor shall be entitled to payment from the Fund of all or a portion of the service fee and/or asset-based sales charge in respect to shares sold prior to the effective date of such termination. Fees incurred by the Fund under the Plans are detailed in the Statement of Operations. The Distributor determines its uncompensated expenses under the Plans at calendar quarter ends. The Distributor’s aggregate uncompensated expenses under the Plans at March 31, 2013 were as follows:
| | | | |
| Class B | | $ | 90,784 | |
| Class C | | | 445,529 | |
Sales Charges. Front-end sales charges and contingent deferred sales charges (“CDSC”) do not represent expenses of the Fund. They are deducted from the proceeds of sales of Fund shares prior to investment or from redemption proceeds prior to remittance, as applicable. The sales charges retained by the Distributor from the sale of shares and the CDSC retained by the Distributor on the redemption of shares is shown in the following table for the period indicated.
| | | | | | | | | | | | | | | | |
| Year Ended | | Class A Front-End
Sales Charges
Retained by
Distributor | | | Class A
Contingent
Deferred
Sales Charges
Retained by
Distributor | | | Class B Contingent
Deferred
Sales Charges
Retained by
Distributor | | | Class C
Contingent
Deferred
Sales Charges
Retained by
Distributor | |
| March 28, 2013 | | $ | 150,593 | | | $ | 6,738 | | | $ | 2,585 | | | $ | 8,460 | |
Waivers and Reimbursements of Expenses. The Manager has voluntarily agreed to waive management fees and/or reimburse the Fund for certain expenses so that “Expenses after payments, waivers and/or reimbursements and reduction to custodian expenses”, excluding interest and fees from borrowings and interest and related expenses from inverse floaters, would not exceed 0.80% of average annual net assets for Class A shares, 1.55% of average annual net assets for both Class B and Class C shares and 0.80% of average annual net assets for Class Y shares. During the year ended March 28, 2013, the Manager reimbursed $115,681, $6,207, $47,335 and $28 for Class A, Class B, Class C and Class Y shares, respectively.
| | |
| 50 | | OPPENHEIMER ROCHESTER MINNESOTA MUNICIPAL FUND |
The Transfer Agent has voluntarily agreed to limit transfer and shareholder servicing agent fees for Classes B, C and Y shares to 0.35% of average annual net assets per class and for Class A shares to 0.30% of average annual net assets of the class.
Some of these undertakings may be modified or terminated at any time; some may not be modified or terminated until after one year from the date of the current prospectus, as indicated therein.
6. Borrowings
The Fund can borrow money from banks in amounts up to one third of its total assets (including the amount borrowed) less all liabilities and indebtedness other than borrowings (meaning that the value of those assets must be at least 300% of the amount borrowed). The Fund can use those borrowings for investment-related purposes such as purchasing portfolio securities. The Fund also may borrow to meet redemption obligations or for temporary and emergency purposes. When the Fund invests borrowed money in portfolio securities, it is using a speculative investment technique known as leverage and changes in the value of the Fund’s investments will have a larger effect on its share price than if it did not borrow because of the effect of leverage.
The Fund can also use the borrowings for other investment-related purposes, including in connection with the Fund’s inverse floater investments as discussed in Note 1. The Fund may use the borrowings to reduce the leverage amount of, or unwind or “collapse” trusts that issued “inverse floaters” owned by the Fund, or in circumstances in which the Fund has entered into a shortfall and forbearance agreement with the sponsor of the inverse floater trust to meet the Fund’s obligation to reimburse the sponsor of the inverse floater for the difference between the liquidation value of the underlying bond and the amount due to holders of the short-term floating rate notes issued by the Trust. See the discussion in Note 1 (Inverse Floating Rate Securities) for additional information.
The Fund will pay interest and may pay other fees in connection with loans. If the Fund does borrow, it will be subject to greater expenses than funds that do not borrow. The interest on borrowed money and the other fees incurred in conjunction with loans are an expense that might reduce the Fund’s yield and return. Expenses incurred by the Fund with respect to interest on borrowings and commitment fees are disclosed separately or as other expenses on the Statement of Operations.
The Fund entered into a Revolving Credit and Security Agreement (the “Agreement”) with conduit lenders and Citibank N.A. which enables it to participate with certain other Oppenheimer funds in a committed, secured borrowing facility that permits borrowings of up to $2.0 billion, collectively, by the Oppenheimer Rochester Funds. To secure the loan, the Fund pledges investment securities in accordance with the terms of the Agreement. Securities held in collateralized accounts to cover these borrowings are noted in the Statement of Investments. Interest is charged to the Fund, based on its borrowings, at current commercial paper issuance rates (0.1596% as of March 28, 2013). The Fund pays additional fees annually to its lender on its outstanding borrowings to manage and administer the facility and is allocated its pro-rata share of an annual structuring fee and
| | | | |
| OPPENHEIMER ROCHESTER MINNESOTA MUNICIPAL FUND | | | 51 | |
NOTES TO FINANCIAL STATEMENTS Continued
6. Borrowings Continued
ongoing commitment fees both of which are based on the total facility size. Total fees and interest that are included in expenses on the Fund’s Statement of Operations related to its participation in the borrowing facility during the year ended March 28, 2013 equal 0.02% of the Fund’s average net assets on an annualized basis. The Fund has the right to prepay such loans and terminate its participation in the conduit loan facility at any time upon prior notice.
As of March 28, 2013, the Fund had borrowings outstanding at an interest rate of 0.1596%. Details of the borrowings for the year ended March 28, 2013 are as follows:
| | | | |
| Average Daily Loan Balance | | $ | 477,260 | |
| Average Daily Interest Rate | | | 0.207 | % |
| Fees Paid | | $ | 49,948 | |
| Interest Paid | | $ | 921 | |
7. Reverse Repurchase Agreements
The Fund may engage in reverse repurchase agreements. A reverse repurchase agreement is the sale of one or more securities to a counterparty at an agreed-upon purchase price with the simultaneous agreement to repurchase those securities on a future date at a higher repurchase price. The repurchase price represents the repayment of the purchase price and interest accrued thereon over the term of the repurchase agreement. The cash received by the Fund in connection with a reverse repurchase agreement may be used for investment-related purposes such as purchasing portfolio securities or for other purposes such as those described in the preceding “Borrowings” note.
The Fund entered into a Committed Repurchase Transaction Facility (the “Facility”) with J.P. Morgan Securities LLC (the “counterparty’) which enables it to participate with certain other Oppenheimer funds in a committed reverse repurchase agreement facility that permits aggregate outstanding reverse repurchase agreements of up to $750 million, collectively. Interest is charged to the Fund on the purchase price of outstanding reverse repurchase agreements at current LIBOR rates plus an applicable spread. The Fund is also allocated its pro-rata share of an annual structuring fee based on the total Facility size and ongoing commitment fees based on the total unused amount of the Facility. The Fund retains the economic exposure to fluctuations in the value of securities subject to reverse repurchase agreements under the Facility and therefore these transactions are considered secured borrowings for financial reporting purposes. The Fund also continues to receive the economic benefit of interest payments received on securities subject to reverse repurchase agreements, in the form of a direct payment from the counterparty. These payments are included in interest income on the Statement of Operations. Total fees and interest related to the Fund’s participation in the Facility during the year ended March 28, 2013 are included in expenses on the Fund’s Statement of Operations and equal 0.01% of the Fund’s average net assets on an annualized basis.
The securities subject to reverse repurchase agreements under the Facility are valued on a daily basis. To the extent this value, after adjusting for certain margin requirements of the Facility, exceeds the cash proceeds received, the Fund may request the counterparty to
| | |
| 52 | | OPPENHEIMER ROCHESTER MINNESOTA MUNICIPAL FUND |
return securities equal in margin value to this excess. To the extent that the cash proceeds received exceed the margin value of the securities subject to the transaction, the counterparty may request additional securities from the Fund. The Fund has the right to declare the first or fifteenth day of any calendar month as the repurchase date for any outstanding reverse repurchase agreement upon delivery of advanced notification and may also recall any security subject to such a transaction by substituting eligible securities of equal or greater margin value according to the Facility’s terms.
The Fund executed no transactions under the Facility during the year ended March 28, 2013.
Details of reverse repurchase agreement transactions for the year ended March 28, 2013 are as follows:
8. Pending Litigation
Since 2009, a number of class action lawsuits have been pending in federal courts against OppenheimerFunds, Inc. (“OFI”), OppenheimerFunds Distributor, Inc., the Fund’s principal underwriter and distributor (the “Distributor”), and certain funds (but not including the Fund) advised by the Manager and distributed by the Distributor (the “Defendant Funds”). Several of these lawsuits also name as defendants certain officers and current and former trustees of the respective Defendant Funds. The lawsuits raise claims under federal securities law and allege, among other things, that the disclosure documents of the respective Defendant Funds contained misrepresentations and omissions and that the respective Defendant Funds’ investment policies were not followed. The plaintiffs in these actions seek unspecified damages, equitable relief and awards of attorneys’ fees and litigation expenses. The Defendant Funds’ Boards of Trustees have also engaged counsel to represent the Funds and the present and former Independent Trustees named in those suits.
Other class action and individual lawsuits have been filed since 2008 in various state and federal courts against OFI and certain of its affiliates by investors seeking to recover investments they allegedly lost as a result of the “Ponzi” scheme run by Bernard L. Madoff and his firm, Bernard L. Madoff Investment Securities, LLC (“BLMIS”). Plaintiffs in these suits allege that they suffered losses as a result of their investments in several funds managed by an affiliate of OFI and assert a variety of claims, including breach of fiduciary duty, fraud, negligent misrepresentation, unjust enrichment, and violation of federal and state securities laws and regulations, among others. They seek unspecified damages, equitable relief and awards of attorneys’ fees and litigation expenses. Neither the Distributor, nor any of the Oppenheimer mutual funds, their independent trustees or directors are named as defendants in these lawsuits. None of the Oppenheimer mutual funds invested in any funds or accounts managed by Madoff or BLMIS. On February 28, 2011, a stipulation of partial settlement of three groups of consolidated putative class action lawsuits relating to these matters was filed in the U.S. District Court for the Southern District of New York. On August 19, 2011, the court entered an order and final judgment approving the settlement
| | | | |
| OPPENHEIMER ROCHESTER MINNESOTA MUNICIPAL FUND | | | 53 | |
NOTES TO FINANCIAL STATEMENTS Continued
8. Pending Litigation Continued
as fair, reasonable and adequate. In September 2011, certain parties filed notices of appeal from the court’s order approving the settlement. The settlement does not resolve other outstanding lawsuits against OFI and its affiliates relating to BLMIS.
On April 16, 2010, a lawsuit was filed in New York state court against (i) OFI, (ii) an affiliate of OFI and (iii) AAArdvark IV Funding Limited (“AAArdvark IV”), an entity advised by OFI’s affiliate, in connection with investments made by the plaintiffs in AAArdvark IV. Plaintiffs allege breach of contract and common law fraud claims against the defendants and seek compensatory damages, costs and disbursements, including attorney fees. On April 11, 2013, the court granted defendants’ motion for summary judgment, dismissing plaintiffs’ fraud claim with prejudice and dismissing their contract claim without prejudice, and granted plaintiffs leave to replead their contract claim to assert a cause of action for specific performance within 30 days. The court’s decision is subject to appeal. On July 15, 2011, a lawsuit was filed in New York state court against OFI, an affiliate of OFI and AAArdvark Funding Limited (“AAArdvark I”), an entity advised by OFI’s affiliate, in connection with investments made by the plaintiffs in AAArdvark I. The complaint alleges breach of contract and common law fraud claims against the defendants and seeks compensatory damages, costs and disbursements, including attorney fees. On November 9, 2011, a lawsuit was filed in New York state court against OFI, an affiliate of OFI and AAArdvark XS Funding Limited (“AAArdvark XS”), an entity advised by OFI’s affiliate, in connection with investments made by the plaintiffs in AAArdvark XS. The complaint alleges breach of contract against the defendants and seeks compensatory damages, costs and disbursements, including attorney fees.
OFI believes the lawsuits and appeals described above are without legal merit and, with the exception of actions it has settled, is defending against them vigorously. While it is premature to render any opinion as to the outcome in these lawsuits, or whether any costs that the Defendant Funds may bear in defending the suits might not be reimbursed by insurance, OFI believes that these suits should not impair the ability of OFI or the Distributor to perform their respective duties to the Fund, and that the outcome of all of the suits together should not have any material effect on the operations of any of the Oppenheimer mutual funds.
| | |
| 54 | | OPPENHEIMER ROCHESTER MINNESOTA MUNICIPAL FUND |
REPORT OF INDEPENDENT REGISTERED PUBLIC ACCOUNTING FIRM
The Board of Trustees and Shareholders of Oppenheimer Rochester Minnesota Municipal Fund:
We have audited the accompanying statement of assets and liabilities of Oppenheimer Rochester Minnesota Municipal Fund, including the statement of investments, as of March 28, 2013, and the related statements of operations for the year then ended, the statements of changes in net assets for each of the years in the two-year period then ended, and the financial highlights for each of the years or periods in the five-year period then ended. These financial statements and financial highlights are the responsibility of the Fund’s management. Our responsibility is to express an opinion on these financial statements and financial highlights based on our audits.
We conducted our audits in accordance with the standards of the Public Company Accounting Oversight Board (United States). Those standards require that we plan and perform the audit to obtain reasonable assurance about whether the financial statements and financial highlights are free of material misstatement. An audit includes examining, on a test basis, evidence supporting the amounts and disclosures in the financial statements. Our procedures included confirmation of securities owned as of March 28, 2013, by correspondence with the custodian and brokers, or by other appropriate auditing procedures where replies from brokers were not received. An audit also includes assessing the accounting principles used and significant estimates made by management, as well as evaluating the overall financial statement presentation. We believe that our audits provide a reasonable basis for our opinion.
In our opinion, the financial statements and financial highlights referred to above present fairly, in all material respects, the financial position of Oppenheimer Rochester Minnesota Municipal Fund as of March 28, 2013, the results of its operations for the year then ended, the changes in its net assets for each of the years in the two-year period then ended, and the financial highlights for each of the years or periods in the five-year period then ended, in conformity with U.S. generally accepted accounting principles.
KPMGLLP
Denver, Colorado
May 16, 2013
| | | | |
| OPPENHEIMER ROCHESTER MINNESOTA MUNICIPAL FUND | | | 55 | |
FEDERAL INCOME TAX INFORMATION Unaudited
In early 2013, if applicable, shareholders of record received information regarding all dividends and distributions paid to them by the Fund during calendar year 2012.
None of the dividends paid by the Fund during the fiscal year ended March 28, 2013 are eligible for the corporate dividend-received deduction. 99.77% of the dividends were derived from interest on municipal bonds and are not subject to federal income taxes. To the extent a shareholder is subject to any state or local tax laws, some or all of the dividends received may be taxable.
The foregoing information is presented to assist shareholders in reporting distributions received from the Fund to the Internal Revenue Service. Because of the complexity of the federal regulations which may affect your individual tax return and the many variations in state and local tax regulations, we recommend that you consult your tax advisor for specific guidance.
| | |
| 56 | | OPPENHEIMER ROCHESTER MINNESOTA MUNICIPAL FUND |
PORTFOLIO PROXY VOTING POLICIES AND PROCEDURES;
UPDATES TO STATEMENTS OF INVESTMENTS Unaudited
The Fund has adopted Portfolio Proxy Voting Policies and Procedures under which the Fund votes proxies relating to securities (“portfolio proxies”) held by the Fund. A description of the Fund’s Portfolio Proxy Voting Policies and Procedures is available (i) without charge, upon request, by calling the Fund toll-free at 1.800.CALL OPP (225.5677), (ii) on the Fund’s website at oppenheimerfunds.com, and (iii) on the SEC’s website at www.sec.gov. In addition, the Fund is required to file Form N-PX, with its complete proxy voting record for the 12 months ended June 30th, no later than August 31st of each year. The Fund’s voting record is available (i) without charge, upon request, by calling the Fund toll-free at 1.800.CALL OPP (225.5677), and (ii) in the Form N-PX filing on the SEC’s website at www.sec.gov.
The Fund files its complete schedule of portfolio holdings with the SEC for the first quarter and the third quarter of each fiscal year on Form N-Q. The Fund’s Form N-Q filings are available on the SEC’s website at www.sec.gov. Those forms may be reviewed and copied at the SEC’s Public Reference Room in Washington, D.C. Information on the operation of the Public Reference Room may be obtained by calling 1-800-SEC-0330.
Householding—Delivery of Shareholder Documents
This is to inform you about OppenheimerFunds’ “householding” policy. If more than one member of your household maintains an account in a particular fund, OppenheimerFunds will mail only one copy of the fund’s prospectus (or, if available, the fund’s summary prospectus), annual and semiannual report and privacy policy. The consolidation of these mailings, called householding, benefits your fund through reduced mailing expense, and benefits you by reducing the volume of mail you receive from OppenheimerFunds. Householding does not affect the delivery of your account statements.
Please note that we will continue to household these mailings for as long as you remain an OppenheimerFunds shareholder, unless you request otherwise. If you prefer to receive multiple copies of these materials, please call us at 1.800.CALL-OPP (225-5677). You may also notify us in writing or via email. We will begin sending you individual copies of the prospectus (or, if available, the summary prospectus), reports and privacy policy within 30 days of receiving your request to stop householding.
| | | | |
| OPPENHEIMER ROCHESTER MINNESOTA MUNICIPAL FUND | | | 57 | |
TRUSTEES AND OFFICERS Unaudited
| | |
| Name, Position(s) Held with the Fund, Length of Service, Age | | Principal Occupation(s) During the Past 5 Years; Other Trusteeships/Directorships Held; Number of Portfolios in the Fund Complex Currently Overseen |
| |
| INDEPENDENT TRUSTEES | | The address of each Trustee in the chart below is 6803 S. Tucson Way, Centennial, Colorado 80112-3924. Each Trustee serves for an indefinite term, or until his or her resignation, retirement, death or removal. |
| |
Brian F. Wruble, Chairman of the Board of Trustees (since 2007) and Trustee (since 2006) Age: 69 | | Director of Community Foundation of the Florida Keys (non-profit) (since July 2012); Chairman Emeritus and Non-Voting Trustee of The Jackson Laboratory (non-profit) (since August 2011); Director of Special Value Opportunities Fund, LLC (registered investment company) (affiliate of the Sub-Adviser’s parent company) (since September 2004); Member of Zurich Insurance Advisory Council (insurance) (since 2004); Treasurer (since 2007) and Trustee of the Institute for Advanced Study (non-profit educational institute) (since May 1992); Chairman (August 2007-August 2011) and Trustee (since August 1991) of the Board of Trustees of The Jackson Laboratory (non-profit); General Partner of Odyssey Partners, L.P. (hedge fund) (September 1995-December 2007); Special Limited Partner of Odyssey Investment Partners, LLC (private equity investment) (January 1999-September 2004). Oversees 50 portfolios in the OppenheimerFunds complex. Mr. Wruble has served on the Boards of certain Oppenheimer funds since April 2001, during which time he has become familiar with the Fund’s (and other Oppenheimer funds’) financial, accounting, regulatory and investment matters and has contributed to the Boards’ deliberations. |
| |
David K. Downes, Trustee (since 2007) Age: 73 | | Director of THL Credit Inc. (since June 2009); Independent Chairman GSK Employee Benefit Trust (since April 2006); Trustee of Employee Trusts (since January 2006); Chief Executive Officer and Board Member of Community Capital Management (investment management company) (since January 2004); President of The Community Reinvestment Act Qualified Investment Fund (investment management company) (since 2004); Director of Internet Capital Group (information technology company) (since October 2003); Director of Correctnet (January 2006-2007); Independent Chairman of the Board of Trustees of Quaker Investment Trust (registered investment company) (2004-2007); Chief Operating Officer and Chief Financial Officer of Lincoln National Investment Companies, Inc. (subsidiary of Lincoln National Corporation, a publicly traded company) and Delaware Investments U.S., Inc. (investment management subsidiary of Lincoln National Corporation) (1993-2003); President, Chief Executive Officer and Trustee of Delaware Investment Family of Funds (1993-2003); President and Board Member of Lincoln National Convertible Securities Funds, Inc. and the Lincoln National Income Funds, TDC (1993-2003); Chairman and Chief Executive Officer of Retirement Financial Services, Inc. (registered transfer agent and investment adviser and subsidiary of Delaware Investments U.S., Inc.) (1993-2003); President and Chief Executive Officer of Delaware Service Company, Inc. (1995-2003); Chief Administrative Officer, Chief Financial Officer, Vice Chairman and Director of Equitable Capital Management Corporation (investment subsidiary of Equitable Life Assurance Society) (1985-1992); Corporate Controller of Merrill Lynch Company (financial services holding company) (1977-1985); held the following positions at the Colonial Penn Group, Inc. (insurance company): Corporate Budget Director (1974-1977), Assistant Treasurer (1972-1974) and Director of Corporate Taxes (1969-1972); held the following positions at Price Waterhouse Company (financial services firm): Tax Manager (1967-1969), Tax Senior (1965-1967) and Staff Accountant (1963-1965); United States Marine Corps (1957-1959). Oversees 50 portfolios in the OppenheimerFunds complex. Mr. Downes has served on the Boards of certain Oppenheimer funds since December 2005, |
| | |
| 58 | | OPPENHEIMER ROCHESTER MINNESOTA MUNICIPAL FUND |
| | |
David K. Downes,
Continued | | during which time he has become familiar with the Fund’s (and other Oppenheimer funds’) financial, accounting, regulatory and investment matters and has contributed to the Boards’ deliberations. |
| |
Matthew P. Fink, Trustee (since 2006) Age: 72 | | Trustee of the Committee for Economic Development (policy research foundation) (2005-2011); Director of ICI Education Foundation (education foundation) (October 1991-August 2006); President of the Investment Company Institute (trade association) (October 1991-June 2004); Director of ICI Mutual Insurance Company (insurance company) (October 1991-June 2004); Author of The Rise of Mutual Funds: An Insider’s View published by Oxford University Press (second edition 2010). Oversees 50 portfolios in the OppenheimerFunds complex. Mr. Fink has served on the Boards of certain Oppenheimer funds since January 2005, during which time he has become familiar with the Fund’s (and other Oppenheimer funds’) financial, accounting, regulatory and investment matters and has contributed to the Boards’ deliberations. |
| |
Edmund P. Giambastiani, Jr., Advisory Board Member (since 2013) Age: 64 | | Advisory Board Member of the Maxwell School of Citizenship and Public Affairs of Syracuse University (since April 2012); Director of Mercury Defense Systems Inc. (information technology) (August 2011-February 2013); Trustee of the U.S. Naval Academy Foundation (since November 2010); Advisory Board Member of the Massachusetts Institute of Technology Lincoln Laboratory (federally-funded research development center) (since May 2010); Director of The Boeing Company (aerospace and defense) (since October 2009); Trustee of MITRE Corporation (federally-funded research development center) (since September 2008); Independent Director of QinetiQ Group Plc (defense technology and security) (February 2008-August 2011); Director of Monster Worldwide, Inc. (on-line career services) (since January 2008, Lead Director since June 2011); Chairman of Alenia North America, Inc. (military and defense products) (January 2008-October 2009); Director of SRA International, Inc. (information technology and services) (January 2008-July 2011); President of Giambastiani Group LLC (national security and energy consulting) (since October 2007); United States Navy, career nuclear submarine officer (June 1970-October 2007), Vice Chairman of the Joint Chiefs of Staff (2005-October 2007), NATO Supreme Allied Commander Transformation (2003-2005), Commander, U.S. Joint Forces Command (2002-2005). Since his retirement from the U.S. Navy in October 2007, Admiral Giambastiani has also served on numerous U.S. Government advisory boards, investigations and task forces for the Secretaries of Defense, State and Interior and the Central Intelligence Agency. Oversees 50 portfolios in the OppenheimerFunds complex as an Advisory Board Member/Trustee/Director. Admiral Giambastiani has served on the Boards of certain Oppenheimer funds since February 2013, during which time he has become familiar with the Fund’s (and other Oppenheimer funds’) financial, accounting, regulatory and investment matters and has contributed to the Boards’ deliberations. |
| |
Phillip A. Griffiths, Trustee (since 2006) Age: 74 | | Fellow of the Carnegie Corporation (since 2007); Member of the National Academy of Sciences (since 1979); Council on Foreign Relations (since 2002); Foreign Associate of Third World Academy of Sciences (since 2002); Chair of Science Initiative Group (since 1999); Member of the American Philosophical Society (since 1996); Trustee of Woodward Academy (since 1983); Director of GSI Lumonics Inc. (precision technology products company) (2001-2010); Senior Advisor of The Andrew W. Mellon Foundation (2001-2010); Distinguished Presidential Fellow for International Affairs of the National Academy of Science (2002-2010); Director of the Institute for Advanced Study (1991-2004); Director of Bankers Trust New York Corporation (1994-1999); |
| | | | |
| OPPENHEIMER ROCHESTER MINNESOTA MUNICIPAL FUND | | | 59 | |
TRUSTEES AND OFFICERS Unaudited / Continued
| | |
Phillip A. Griffiths,
Continued | | Provost at Duke University (1983-1991). Oversees 50 portfolios in the OppenheimerFunds complex. Mr. Griffiths has served on the Boards of certain Oppenheimer funds since June 1999, during which time he has become familiar with the Fund’s (and other Oppenheimer funds’) financial, accounting, regulatory and investment matters and has contributed to the Boards’ deliberations. |
| |
Mary F. Miller, Trustee (since 2006) Age: 70 | | Trustee of International House (not-for-profit) (since June 2007); Trustee of the American Symphony Orchestra (not-for-profit) (October 1998-November 2011); and Senior Vice President and General Auditor of American Express Company (financial services company) (July 1998-February 2003). Oversees 50 portfolios in the OppenheimerFunds complex. Ms. Miller has served on the Boards of certain Oppenheimer funds since August 2004, during which time she has become familiar with the Fund’s (and other Oppenheimer funds’) financial, accounting, regulatory and investment matters and has contributed to the Boards’ deliberations. |
| |
Joel W. Motley, Trustee (since 2006) Age: 60 | | Member of the Vestry of Trinity Wall Street (since April 2012); Director of Southern Africa Legal Services Foundation (since March 2012); Board Member of Pulitzer Center for Crisis Reporting (non-profit journalism) (since December 2010); Managing Director of Public Capital Advisors, LLC (privately-held financial advisor) (since January 2006); Managing Director of Carmona Motley, Inc. (privately-held financial advisor) (since January 2002); Director of Columbia Equity Financial Corp. (privately-held financial advisor) (2002-2007); Managing Director of Carmona Motley Hoffman Inc. (privately-held financial advisor) (January 1998-December 2001); Member of the Finance and Budget Committee of the Council on Foreign Relations, Member of the Investment Committee and Board of Human Rights Watch and Member of the Investment Committee and Board of Historic Hudson Valley. Oversees 50 portfolios in the OppenheimerFunds complex. Mr. Motley has served on the Boards of certain Oppenheimer funds since October 2002, during which time he has become familiar with the Fund’s (and other Oppenheimer funds’) financial, accounting, regulatory and investment matters and has contributed to the Boards’ deliberations. |
| |
Joanne Pace, Advisory Board Member (since 2012) Age: 54 | | Board Director of Horizon Blue Cross Blue Shield of New Jersey (since November 2012); Advisory Board Director of The Alberleen Group LLC (since March, 2012); Advisory Board Director of The Agile Trading Group LLC (since March, 2012); Advisory Council Member of 100 Women in Hedge Funds (non-profit) (since December, 2012); Advisory Council Member of Morgan Stanley Children’s Hospital (non-profit) (since May, 2012); Board Director of The Komera Project (non-profit) (since April, 2012); New York Advisory Board Director of Peace First (non-profit) (since March, 2010); Senior Advisor of SECOR Asset Management, LP (2010-2011); Managing Director and Chief Operating Officer of Morgan Stanley Investment Management (2006-2010); Partner and Chief Operating Officer of FrontPoint Partners, LLC (hedge fund) (2005-2006); held the following positions at Credit Suisse: Managing Director (2003-2005); Global Head of Human Resources and member of Executive Board and Operating Committee (2004-2005), Global Head of Operations and Product Control (2003-2004); held the following positions at Morgan Stanley: Managing Director (1997-2003), Controller and Principal Accounting Officer (1999-2003); Chief Financial Officer (temporary assignment) for the Oversight Committee, Long Term Capital Management (1998-1999). Lead Independent Director and Chair of the Audit and Nominating Committee of The Global Chartist Fund, LLC of Oppenheimer Asset Management (2011-2012); Board Director of Managed Funds Association (2008-2010); Board Director of |
| | |
| 60 | | OPPENHEIMER ROCHESTER MINNESOTA MUNICIPAL FUND |
| | |
Joanne Pace,
Continued | | Morgan Stanley Foundation (2007-2010) and Investment Committee Chair (2008-2010). Ms. Pace has served on the Boards of certain Oppenheimer funds since 2012, during which time she has become familiar with the Funds (and other Oppenheimer funds’) financial, accounting, regulatory and investment matters and has contributed to the Boards’ deliberations. Oversees 50 portfolios in the OppenheimerFunds complex as an Advisory Board Member/Trustee/Director. Ms. Pace has served on the Boards of certain Oppenheimer funds since November 2012, during which time she has become familiar with the Funds (and other Oppenheimer funds’) financial, accounting, regulatory and investment matters and has contributed to the Board’s deliberations. |
| |
Mary Ann Tynan, Trustee (since 2008) Age: 67 | | Director and Secretary of the Appalachian Mountain Club (non-profit outdoor organization) (since January 2012); Director of Opera House Arts (non-profit arts organization) (since October 2011); Independent Director of the ICI Board of Governors (non-profit) (since October 2011); Vice Chair of Board of Trustees of Brigham and Women’s/Faulkner Hospitals (non-profit hospital) (since 2000); Chair of Board of Directors of Faulkner Hospital (non-profit hospital) (since 1990); Member of Audit and Compliance Committee of Partners Health Care System (non-profit) (since 2004); Board of Trustees of Middlesex School (educational institution) (since 1994); Chair of Board of Directors of Idealswork, Inc. (financial services provider) (since 2003); Partner, Senior Vice President and Director of Regulatory Affairs of Wellington Management Company, LLP (global investment manager) (1976-2002); Vice President and Corporate Secretary, John Hancock Advisers, Inc. (mutual fund investment adviser) (1970-1976). Oversees 50 portfolios in the OppenheimerFunds complex. Ms. Tynan has served on the Boards of certain Oppenheimer funds since October 2008, during which time she has become familiar with the Fund’s (and other Oppenheimer funds’) financial, accounting, regulatory and investment matters and has contributed to the Boards’ deliberations. |
| |
Joseph M. Wikler, Trustee (since 2006) Age: 72 | | Director of C-TASC (bio-statistics services) (2007-2012); formerly, Director of the following medical device companies: Medintec (1992-2011) and Cathco (1996-2011); Member of the Investment Committee of the Associated Jewish Charities of Baltimore (since 1994); Director of Lakes Environmental Association (environmental protection organization) (1996-2008); Director of Fortis/Hartford mutual funds (1994-December 2001). Oversees 50 portfolios in the OppenheimerFunds complex. Mr. Wikler has served on the Boards of certain Oppenheimer funds since August 2005, during which time he has become familiar with the Fund’s (and other Oppenheimer funds’) financial, accounting, regulatory and investment matters and has contributed to the Boards’ deliberations. |
| |
Peter I. Wold, Trustee (since 2006) Age: 65 | | Director of Arch Coal, Inc. (since 2010); President of Wold Oil Properties, Inc. (oil and gas exploration and production company) (since 1994); Vice President of American Talc Company, Inc. (talc mining and milling) (since 1999); Managing Member of Hole-in-the-Wall Ranch (cattle ranching) (since 1979); Director and Chairman of Wyoming Enhanced Oil Recovery Institute Commission (enhanced oil recovery study) (2004-2012); Director and Chairman of the Denver Branch of the Federal Reserve Bank of Kansas City (1993-1999); and Director of PacifiCorp. (electric utility) (1995-1999). Oversees 50 portfolios in the OppenheimerFunds complex. Mr. Wold has served on the Boards of certain Oppenheimer funds since August 2005, during which time he has become familiar with the Fund’s (and other Oppenheimer funds’) financial, accounting, regulatory and investment matters and has contributed to the Boards’ deliberations. |
| | | | |
| OPPENHEIMER ROCHESTER MINNESOTA MUNICIPAL FUND | | | 61 | |
TRUSTEES AND OFFICERS Unaudited / Continued
| | |
| INTERESTED TRUSTEE AND OFFICER | | Mr. Glavin is an “Interested Trustee “ because he is affiliated with the Manager and the Sub-Adviser by virtue of his positions as an officer and director of the Manager and a director of the Sub-Adviser, and as a shareholder of the Sub-Adviser’s parent company. Both as a Trustee and as an officer, he serves for an indefinite term, or until his resignation, retirement, death or removal. Mr. Glavin’s address is Two World Financial Center, 225 Liberty Street, 11th Floor, New York, New York 10281-1008. |
| |
William F. Glavin, Jr., President and Principal Executive Officer and Trustee (since 2009) Age: 54 | | Director, Chief Executive Officer and President of the Manager (since January 2013); Chairman of the Sub-Adviser (December 2009-December 2012); Chief Executive Officer (January 2009-December 2012) and Director of the Sub-Adviser (since January 2009); President of the Sub-Adviser (May 2009-December 2012); Management Director (since June 2009), President (since December 2009) and Chief Executive Officer (since January 2011) of Oppenheimer Acquisition Corp. (“OAC”) (the Sub-Adviser’s parent holding company); Director of Oppenheimer Real Asset Management, Inc. (since March 2010); Executive Vice President (March 2006-February 2009) and Chief Operating Officer (July 2007-February 2009) of Massachusetts Mutual Life Insurance Company (OAC’s parent company); Director (May 2004-March 2006) and Chief Operating Officer and Chief Compliance Officer (May 2004-January 2005), President (January 2005-March 2006) and Chief Executive Officer (June 2005-March 2006) of Babson Capital Management LLC; Director (March 2005-March 2006), President (May 2003-March 2006) and Chief Compliance Officer (July 2005-March 2006) of Babson Capital Securities, Inc. (a broker-dealer); President (May 2003-March 2006) of Babson Investment Company, Inc.; Director (May 2004-August 2006) of Babson Capital Europe Limited; Director (May 2004-October 2006) of Babson Capital Guernsey Limited; Director (May 2004-March 2006) of Babson Capital Management LLC; Non-Executive Director (March 2005-March 2007) of Baring Asset Management Limited; Director (February 2005-June 2006) Baring Pension Trustees Limited; Director and Treasurer (December 2003-November 2006) of Charter Oak Capital Management, Inc.; Director (May 2006-September 2006) of C.M. Benefit Insurance Company; Director (May 2008-June 2009) and Executive Vice President (June 2007-July 2009) of C.M. Life Insurance Company; President (March 2006-May 2007) of MassMutual Assignment Company; Director (January 2005-December 2006), Deputy Chairman (March 2005-December 2006) and President (February 2005-March 2005) of MassMutual Holdings (Bermuda) Limited; Director (May 2008-June 2009) and Executive Vice President (June 2007-July 2009) of MML Bay State Life Insurance Company; Chief Executive Officer and President (April 2007-January 2009) of MML Distributors, LLC; and Chairman (March 2006-December 2008) and Chief Executive Officer (May 2007-December 2008) of MML Investors Services, Inc. An officer of 86 portfolios in the OppenheimerFunds complex. |
| OTHER OFFICERS OF THE FUND | | The addresses of the Officers in the chart below are as follows: for Mr. Gabinet and Ms. Nasta, Two World Financial Center, 225 Liberty Street, New York, New York 10281-1008, for Messrs. Vandehey and Wixted, 6803 S. Tucson Way, Centennial, Colorado 80112-3924, for Messrs. Loughran, Cottier, Willis, DeMitry, Camarella, Pulire and Stein, 350 Linden Oaks, Rochester, New York 14625. Each Officer serves for an indefinite term or until his or her resignation, retirement, death or removal. |
| |
Daniel G. Loughran, Vice President (since 2006) Age: 49 | | Senior Vice President of the Sub-Adviser (since July 2007); Vice President of the Sub-Adviser (April 2001-June 2007) and a Portfolio Manager with the Sub-Adviser (December 1999-November 2001). Team Leader, a Senior Portfolio Manager, an officer and a trader for the Fund and other Oppenheimer funds. |
| | |
| 62 | | OPPENHEIMER ROCHESTER MINNESOTA MUNICIPAL FUND |
| | |
Scott S. Cottier, Vice President (since 2006) Age: 41 | | Vice President of the Sub-Adviser (since September 2002). Portfolio Manager and trader at Victory Capital Management (1999-2002). Senior Portfolio Manager, an officer and a trader for the Fund and other Oppenheimer funds. |
| |
Troy E. Willis, Vice President (since 2006) Age: 40 | | Vice President of the Sub-Adviser (since July 2009); Assistant Vice President of the Sub-Adviser (July 2005-June 2009). Portfolio Manager of the Sub-Adviser (2003- 2005). Corporate Attorney for Southern Resource Group (June 1999-December 2003). Senior Portfolio Manager, an officer and a trader for the Fund and other Oppenheimer funds. |
| |
Mark R. DeMitry, Vice President (since 2009) Age: 37 | | Vice President of the Sub-Adviser (since July 2009); Associate Portfolio Manager of the Fund (September 2006- June 2009). Research Analyst of the Sub-Adviser (June 2003-September 2006) and a Credit Analyst of the Sub-Adviser (July 2001-May 2003). Senior Portfolio Manager, an officer and a trader for the Fund and other Oppenheimer funds. |
| |
Michael L. Camarella, Vice President (since 2009) Age: 36 | | Vice President of the Sub-Adviser (since January 2011); Assistant Vice President of the Sub-Adviser (July 2009-December 2010); Associate Portfolio Manager of the Sub-Adviser (January 2008-December 2010). Research Analyst of the Sub-Adviser (April 2006-December 2007) and a Credit Analyst of the Sub-Adviser (June 2003-March 2006). Senior Portfolio Manager, an officer and a trader for the Fund and other Oppenheimer funds. |
| |
Charles S. Pulire, Vice President (since 2011) Age: 35 | | Vice President of the Sub-Adviser (since February 2013), Assistant Vice President of the Sub-Adviser (December 2010-January 2013); Research Analyst of the Manager (February 2008-November 2010); Credit Analyst of the Sub-Adviser (May 2006-January 2008). Senior Portfolio Manager, an officer and a trader for the Fund and other Oppenheimer funds. |
| |
Richard A. Stein, Vice President (since 2007) Age: 55 | | Director of the Rochester Credit Analysis team (since March 2004); Senior Vice President of the Sub-Adviser (since June 2011) and a Vice President of the Sub-Adviser (November 1997-May 2011); headed Rochester’s Credit Analysis team (since May 1993). |
| |
Arthur S. Gabinet, Secretary and Chief Legal Officer (since 2011) Age: 55 | | Executive Vice President, Secretary and General Counsel of the Manager (since January 2013); General Counsel OFI SteelPath, Inc. (since January 2013); Executive Vice President (May 2010-December 2012) and General Counsel (since January 2011) of the Sub-Adviser; General Counsel of the Distributor (since January 2011); General Counsel of Centennial Asset Management Corporation (January 2011-December 2012); Executive Vice President (January 2011-December 2012) and General Counsel of HarbourView Asset Management Corporation (since January 2011); Assistant Secretary (since January 2011) and Director (since January 2011) of OppenheimerFunds International Ltd. and OppenheimerFunds plc; Director of Oppenheimer Real Asset Management, Inc. (January 2011-December 2012) and General Counsel (since January 2011); Executive Vice President (January 2011-December 2011) and General Counsel of Shareholder Financial Services, Inc. and Shareholder Services, Inc. (since January 2011); Executive Vice President (January 2011-December 2012) and General Counsel of OFI Private Investments Inc. (since January 2011); Vice President of OppenheimerFunds Legacy Program (January 2011-December 2011); Executive Vice President (January 2011-December 2012) and General Counsel of OFI Institutional Asset Management, Inc. (since January 2011); General Counsel, Asset Management of the Sub-Adviser (May 2010-December 2010); Principal, The Vanguard Group (November 2005-April 2010); District Administrator, U.S. Securities and Exchange Commission (January 2003-October 2005). An officer of 86 portfolios in the OppenheimerFunds complex. |
| | | | |
| OPPENHEIMER ROCHESTER MINNESOTA MUNICIPAL FUND | | | 63 | |
TRUSTEES AND OFFICERS Unaudited / Continued
| | |
Christina M. Nasta, Vice President and Chief Business Officer (since 2009) Age: 39 | | Senior Vice President of OppenheimerFunds Distributor, Inc. (since January 2013); Senior Vice President of the Sub-Adviser (July 2010-December 2012); Vice President of the Sub-Adviser (January 2003-July 2010); Vice President of OppenheimerFunds Distributor, Inc. (January 2003-July 2010). An officer of 86 portfolios in the OppenheimerFunds complex. |
| |
Mark S. Vandehey, Vice President and Chief Compliance Officer (since 2006) Age: 62 | | Senior Vice President and Chief Compliance Officer of the Manager (since January 2013); Chief Compliance Officer of OFI SteelPath, Inc. (since January 2013); Senior Vice President of the Sub-Adviser (March 2004-December 2012); Chief Compliance Officer of the Sub-Adviser, OppenheimerFunds Distributor, Inc., OFI Trust Company, OFI Institutional Asset Management, Inc., Oppenheimer Real Asset Management, Inc., OFI Private Investments, Inc., Harborview Asset Management Corporation, Trinity Investment Management Corporation, and Shareholder Services, Inc. (since March 2004); Vice President of OppenheimerFunds Distributor, Inc., Centennial Asset Management Corporation and Shareholder Services, Inc. (June 1983-December 2012). An officer of 86 portfolios in the OppenheimerFunds complex. |
| |
Brian W. Wixted, Treasurer and Principal Financial & Accounting Officer (since 2006) Age: 53 | | Senior Vice President of the Manager (since January 2013); Treasurer of the Sub-Adviser, HarbourView Asset Management Corporation, Shareholder Financial Services, Inc., Shareholder Services, Inc., and Oppenheimer Real Asset Management, Inc. (March 1999-June 2008), OFI Private Investments, Inc. (March 2000-June 2008), OppenheimerFunds International Ltd. and OppenheimerFunds plc (since May 2000), OFI Institutional Asset Management, Inc. (November 2000-June 2008), and OppenheimerFunds Legacy Program (charitable trust program established by the Sub-Adviser) (June 2003-December 2011); Treasurer and Chief Financial Officer of OFI Trust Company (since May 2000); Assistant Treasurer of Oppenheimer Acquisition Corporation (March 1999-June 2008). An officer of 86 portfolios in the OppenheimerFunds complex. |
The Fund’s Statement of Additional Information contains additional information about the Fund’s Trustees and Officers and is available without charge upon request, by calling 1.800.CALL OPP (225.5677).
| | |
| 64 | | OPPENHEIMER ROCHESTER MINNESOTA MUNICIPAL FUND |
OPPENHEIMER ROCHESTER MINNESOTA MUNICIPAL FUND
| | |
| Manager | | OFI Global Asset Management, Inc. |
| Sub-Adviser | | OppenheimerFunds, Inc. |
| Distributor | | OppenheimerFunds Distributor, Inc. |
| Transfer and Shareholder Servicing Agent | | OFI Global Asset Management, Inc. |
| Sub-Transfer Agent | | Shareholder Services, Inc. DBA OppenheimerFunds Services |
| Independent Registered Public Accounting Firm | | KPMGLLP |
| Legal Counsel | | Kramer Levin Naftalis & Frankel LLP |
© 2013 OppenheimerFunds, Inc. All rights reserved.
| | | | |
| OPPENHEIMER ROCHESTER MINNESOTA MUNICIPAL FUND | | | 65 | |
PRIVACY POLICY NOTICE
As an Oppenheimer fund shareholder, you are entitled to know how we protect your personal information and how we limit its disclosure.
Information Sources
We obtain nonpublic personal information about our shareholders from the following sources:
| l | | Applications or other forms |
| l | | When you create a user ID and password for online account access |
| l | | When you enroll in eDocs Direct, our electronic document delivery service |
| l | | Your transactions with us, our affiliates or others |
| l | | A software program on our website, often referred to as a “cookie,” which indicates which parts of our site you’ve visited |
| l | | When you set up challenge questions to reset your password online |
If you visit oppenheimerfunds.com and do not log on to the secure account information areas, we do not obtain any personal information about you. When you do log on to a secure area, we do obtain your user ID and password to identify you. We also use this information to provide you with products and services you have requested, to inform you about products and services that you may be interested in and assist you in other ways.
We do not collect personal information through our website unless you willingly provide it to us, either directly by email or in those areas of the website that request information. In order to update your personal information (including your mailing address, email address and phone number) you must first log on and visit your user profile.
If you have set your browser to warn you before accepting cookies, you will receive the warning message with each cookie. You can refuse cookies by turning them off in your browser. However, doing so may limit your access to certain sections of our website.
We use cookies to help us improve and manage our website. For example, cookies help us recognize new versus repeat visitors to the site, track the pages visited, and enable some special features on the website. This data helps us provide a better service for our website visitors.
Protection of Information
We do not disclose any non-public personal information (such as names on a customer list) about current or former customers to anyone, except as permitted by law.
Disclosure of Information
We send your financial advisor (as designated by you) copies of confirmations, account statements and other documents reporting activity in your fund accounts. We may also use details about you and your investments to help us, our financial service affiliates, or firms that jointly market their financial products and services with ours, to better serve your investment needs or suggest financial services or educational material that may be of interest to you. If this requires us to provide you with an opportunity to “opt in” or “opt out” of such information sharing with a firm not affiliated with us, you will receive notification on how to do so, before any such sharing takes place.
Right of Refusal
We will not disclose your personal information to unaffiliated third parties (except as permitted by law), unless we first offer you a reasonable opportunity to refuse or “opt out” of such disclosure.
Internet Security and Encryption
In general, the email services provided by our website are encrypted and provide a secure and private means of communication with us. To protect your own privacy, confidential and/or personal information should only be communicated via email when you are advised that you are using a secure website.
| | |
| 66 | | OPPENHEIMER ROCHESTER MINNESOTA MUNICIPAL FUND |
PRIVACY POLICY NOTICE
As a security measure, we do not include personal or account information in non-secure emails, and we advise you not to send such information to us in non-secure emails. Instead, you may take advantage of the secure features of our website to encrypt your email correspondence. To do this, you will need to use a browser that supports Secure Sockets Layer (SSL) protocol.
We do not guarantee or warrant that any part of our website, including files available for download, are free of viruses or other harmful code. It is your responsibility to take appropriate precautions, such as use of an anti-virus software package, to protect your computer hardware and software.
| l | | All transactions, including redemptions, exchanges and purchases, are secured by SSL and 128-bit encryption. SSL is used to establish a secure connection between your PC and OppenheimerFunds’ server. It transmits information in an encrypted and scrambled format. |
| l | | Encryption is achieved through an electronic scrambling technology that uses a “key” to code and then decode the data. Encryption acts like the cable converter box you may have on your television set. It scrambles data with a secret code so that no one can make sense of it while it is being transmitted. When the data reaches its destination, the same software unscrambles the data. |
| l | | You can exit the secure area by either closing your browser, or for added security, you can use the Log Out button before you close your browser. |
Other Security Measures
We maintain physical, electronic and procedural safeguards to protect your personal account information. Our employees and agents have access to that information only so that they may offer you products or provide services, for example, when responding to your account questions.
How You Can Help
You can also do your part to keep your account information private and to prevent unauthorized transactions. If you obtain a user ID and password for your account, do not allow it to be used by anyone else. Also, take special precautions when accessing your account on a computer used by others.
Who We Are
This joint notice describes the privacy policies of the Oppenheimer funds, OppenheimerFunds, Inc., and each of its financial institution subsidiaries, the trustee of OppenheimerFunds Individual Retirement Accounts (IRAs) and the custodian of the OppenheimerFunds 403(b)(7) tax sheltered custodial accounts. It applies to all Oppenheimer fund accounts you presently have, or may open in the future, using your Social Security number—whether or not you remain a shareholder of our funds. This notice was last updated November 2012. In the event it is updated or changed, we will post an updated notice on our website at oppenheimerfunds.com. If you have any questions about these privacy policies, write to us at P.O. Box 5270, Denver, CO 80217-5270, email us by clicking on the Contact Us section of our website at oppenheimerfunds.com or call us at 1.800.CALL OPP (225.5677).
| | | | |
| OPPENHEIMER ROCHESTER MINNESOTA MUNICIPAL FUND | | | 67 | |
Visit us at oppenheimerfunds.com for 24-hr access to account information and transactions or call us at 1.800.CALL OPP (1.800.225.5677) for 24-hr automated information and automated transactions. Representatives also available Mon-Fri 8am-8pm ET.
OppenheimerFunds are distributed by OppenheimerFunds Distributor, Inc.
RA0585.001.0313 May 20, 2013
Item 2. Code of Ethics.
The registrant has adopted a code of ethics that applies to the registrant’s principal executive officer, principal financial officer, principal accounting officer or controller or persons performing similar functions.
Item 3. Audit Committee Financial Expert.
The Board of Trustees of the registrant has determined that David Downes, the Board’s Audit Committee Chairman, is an audit committee financial expert and that Mr. Downes is “independent” for purposes of this Item 3.
Item 4. Principal Accountant Fees and Services.
The principal accountant for the audit of the registrant’s annual financial statements billed $31,800 in fiscal 2013 and $31,200 in fiscal 2012.
The principal accountant for the audit of the registrant’s annual financial statements billed $2,500 in fiscal 2013 and $2,619 in fiscal 2012.
The principal accountant for the audit of the registrant’s annual financial statements billed $430,500 in fiscal 2013 and $439,009 in fiscal 2012 to the registrant’s investment adviser or any entity controlling, controlled by, or under common control with the adviser that provides ongoing services to the registrant.
Such services include: Internal control reviews, compliance procedures, GIPS attestation procedures, internal audit training, surprise exams, system conversion testing, and Project Flow
The principal accountant for the audit of the registrant’s annual financial statements billed no such fees in fiscal 2013 and $1,000 in fiscal 2012.
The principal accountant for the audit of the registrant’s annual financial statements billed $434,876 in fiscal 2013 and $190,051 in fiscal 2012 to the registrant’s investment adviser or any entity controlling, controlled by, or under common control with the adviser that provides ongoing services to the registrant.
Such services include: tax compliance, tax planning and tax advice. Tax compliance generally involves preparation of original and amended tax returns, claims for a refund and tax payment-planning services. Tax planning and tax advice includes assistance with tax audits and appeals, tax advice related to mergers and acquisitions and requests for rulings or technical advice from taxing authorities.
The principal accountant for the audit of the registrant’s annual financial statements billed no such fees in fiscal 2013 and no such fees in fiscal 2012.
The principal accountant for the audit of the registrant’s annual financial statements billed no such fees in fiscal 2013 and no such fees in fiscal 2012 to the registrant’s investment adviser or any entity controlling, controlled by, or under common control with the adviser that provides ongoing services to the registrant.
Such fees would include the cost to the principal accountant of attending audit committee meetings and consultations regarding the registrant’s retirement plan with respect to its Trustees.
| (e) | (1) During its regularly scheduled periodic meetings, the registrant’s audit committee will pre-approve all audit, audit-related, tax and other services to be provided by the principal accountants of the registrant. |
The audit committee has delegated pre-approval authority to its Chairman for any subsequent new engagements that arise between regularly scheduled meeting dates provided that any fees such pre-approved are presented to the audit committee at its next regularly scheduled meeting.
Under applicable laws, pre-approval of non-audit services may be waived provided that: 1) the aggregate amount of all such services provided constitutes no more than five percent of the total amount of fees paid by the registrant to its principal accountant during the fiscal year in which services are provided 2) such services were not recognized by the registrant at the time of engagement as non-audit services and 3) such services are promptly brought to the attention of the audit committee of the registrant and approved prior to the completion of the audit.
(2) 0%
| (f) | Not applicable as less than 50%. |
| (g) | The principal accountant for the audit of the registrant’s annual financial statements billed $867,876 in fiscal 2013 and $632,679 in fiscal 2012 to the registrant and the registrant’s investment adviser or any entity controlling, controlled by, or under common control with the adviser that provides ongoing services to the registrant related to non-audit fees. Those billings did not include any prohibited non-audit services as defined by the Securities Exchange Act of 1934. |
| (h) | The registrant’s audit committee of the board of Trustees has considered whether the provision of non-audit services that were rendered to the registrant’s investment adviser, and any entity controlling, controlled by, or under common control with the investment adviser that provides ongoing services to the registrant that were not pre-approved pursuant to paragraph (c)(7)(ii) of Rule 2-01 of Regulation S-X is compatible with maintaining the principal accountant’s independence. No such services were rendered. |
Item 5. Audit Committee of Listed Registrants
Not applicable.
Item 6. Schedule of Investments.
a) Not applicable. The complete schedule of investments is included in Item 1 of this Form N-CSR.
b) Not applicable.
Item 7. Disclosure of Proxy Voting Policies and Procedures for Closed-End Management Investment Companies.
Not applicable.
Item 8. Portfolio Managers of Closed-End Management Investment Companies.
Not applicable.
Item 9. Purchases of Equity Securities by Closed-End Management Investment Company and Affiliated Purchasers.
Not applicable.
Item 10. Submission of Matters to a Vote of Security Holders.
The Fund’s Governance Committee Provisions with Respect to Nominations of Directors/Trustees to the Respective Boards
None
Item 11. Controls and Procedures.
Based on their evaluation of the registrant’s disclosure controls and procedures (as defined in rule 30a-3(c) under the Investment Company Act of 1940 (17 CFR 270.30a-3(c)) as of 3/28/2013, the registrant’s principal executive officer and principal financial officer found the registrant’s disclosure controls and procedures to provide reasonable assurances that information required to be disclosed by the registrant in the reports that it files under the Securities Exchange Act of 1934 (a) is accumulated and communicated to registrant’s management, including its principal executive officer and principal financial officer, to allow timely decisions regarding required disclosure, and (b) is recorded, processed, summarized and reported, within the time periods specified in the rules and forms adopted by the U.S. Securities and Exchange Commission.
There have been no changes in the registrant’s internal controls over financial reporting that occurred during the registrant’s second fiscal quarter of the period covered by this report that have materially affected, or are reasonably likely to materially affect, the registrant’s internal control over financial reporting.
Item 12. Exhibits.
| (a) | (1) Exhibit attached hereto. |
(2) Exhibits attached hereto.
(3) Not applicable.
| (b) | Exhibit attached hereto. |
SIGNATURES
Pursuant to the requirements of the Securities Exchange Act of 1934 and the Investment Company Act of 1940, the registrant has duly caused this report to be signed on its behalf by the undersigned, thereunto duly authorized.
Oppenheimer Rochester Minnesota Municipal Fund
| | |
By: | | /s/ William F. Glavin, Jr. |
| | William F. Glavin, Jr. |
| | Principal Executive Officer |
| |
Date: | | 5/8/2013 |
Pursuant to the requirements of the Securities Exchange Act of 1934 and the Investment Company Act of 1940, this report has been signed below by the following persons on behalf of the registrant and in the capacities and on the dates indicated.
| | |
By: | | /s/ William F. Glavin, Jr. |
| | William F. Glavin, Jr. |
| | Principal Executive Officer |
| |
Date: | | 5/8/2013 |
| | |
By: | | /s/ Brian W. Wixted |
| | Brian W. Wixted |
| | Principal Financial Officer |
| |
Date: | | 5/8/2013 |