UNITED STATES
SECURITIES AND EXCHANGE COMMISSION
WASHINGTON, D.C. 20549
| FORM N-CSR |
CERTIFIED SHAREHOLDER REPORT OF REGISTERED MANAGEMENT
INVESTMENT COMPANIES
Investment Company Act file number 811-21885
ENCOMPASS FUNDS
(Exact name of registrant as specified in charter)
1700 California Street, Suite 335, San Francisco, CA 94109
(Address of principal executive offices) (Zip code)
Malcolm H. Gissen
Encompass Funds
1700 California Street, Suite 335
San Francisco, CA 94109
(Name and address of agent for service)
Registrant's telephone number, including area code: (415) 749-6565
Date of fiscal year end: May 31
Date of reporting period: May 31, 2009
Form N-CSR is to be used by management investment companies to file reports with the Commission not later than 10 days after the transmission to stockholders of any report that is required to be transmitted to stockholders under Rule 30e-1 under the Investment Company Act of 1940 (17 CFR 270.30e -1). The Commission may use the information provided on Form N-CSR in its regulatory, disclosure review, inspection and policymaking roles.
A registrant is required to disclose the information specified by Form N-CSR, and the Commission will make this information public. A registrant is not required to respond to the collection of information contained in Form N-CSR unless the Form displays a currently valid Office of Management and Budget ("OMB") control number. Please direct comments concerning the accuracy of the information collection burden estimate and any suggestions for reducing the burden to Secretary, Securities and Exchange Commission, 450 Fifth Street, NW, Washington, DC 20549-0609. The OMB has reviewed this collection of information under the clearance requirements of 44 U.S.C. § 3507.
Item 1. Reports to Stockholders.

TICKER SYMBOL: ENCPX
ANNUAL REPORT
May 31, 2009
ENCOMPASS FUND ANNUAL LETTER
~July 2009~
Dear Fellow Encompass Fund Shareholders:
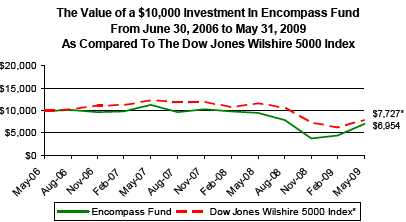
We are pleased to provide this Annual Report for Encompass Fund's third fiscal year, from June 1, 2008 to May 31, 2009. During this period the Fund had a total return of -26.81%, while the benchmark we use for the Fund, the Dow Jones Wilshire 5000 Index, had a total return of -32.63% . An income dividend of $0.0643 per share was paid on December 29, 2008. If you have dividend reinvestment, as most of the shareholders do, the dividend was reinvested at $3.85 per share.
2008 was a very challenging year for every type of equity and especially for the resource sectors the Fund has favored. The Fund had a total return of -61.59% for calendar year 2008, and the benchmark Index was -37.23% . For the first six months of calendar year 2009, the Fund produced a total return of 73.1%, versus a total return of 4.45% for the Dow Jones Wilshire 5000 Index. The Net Asset Value at June 30, 2009 was $6.82.
We have previously explained that in 2008 hedge funds and other investors simply dumped many of the resource (and other) stocks they held. Because many of the resource companies held by the Fund are smaller capitalization companies and are relatively thinly traded, this dumping had a profound impact on stock prices, often driving prices down 50-90% in a one- or two-month period. The Fund Managers are in regular contact with portfolio companies and many of the companies held by the Fund continued to expand their resources, even while their stock prices were declining in 2008. We continued to evaluate each of the companies in the portfolio, and sold the companies we considered weaker.
Your managers regularly evaluate every position in the Fund. When prices of companies considered by us to be excellent companies fell to levels far below our estimation of the intrinsic values of the companies (and in some cases, the cash the company held), we added to positions. Our shareholders have been well-rewarded in the first half of calendar year 2009, and a number of these companies have doubled and tripled in value.
Looking Ahead
Nobody knows the direction of equities markets. In early March many "experts" were predicting the continued sharp decline in the market with a target price of a 5,000 Dow. Some even said the market would not recover for 10 years. Instead, the market soared by more than 35% in less than three months and the Dow approached 10,000, before falling back. Few people expected this rally, which we consider a response to an oversold market. The market is currently retracing some of the gains of the past few months.
We see signs that markets are improving: corporations are raising large amounts of money through debt and equity offerings; the spreads between government bonds and good quality corporate bonds continue to narrow; a few initial public offerings (IPO's) are coming to market; and corporate earnings look better than anticipated at the beginning of the year. On the other hand, we do not think we are yet out of the worst recession since World War II.
2009 Annual Report 1
Unemployment is likely to go higher (over 10%), many large and small banks still may not survive, billions of dollars of bad mortgages continue to be held by banks and other lenders, and consumers are saving in the U.S. rather than spending, which is not good for corporate revenues. While we expect the economy to improve gradually toward the end of this year and throughout 2010, we are very cautious.
The Fund continues to emphasize resource companies and health care companies in its portfolio. We like precious metals and industrial metals under almost every possible scenario. We believe that with the U.S. government spending record sums, the possibility of inflationary times ahead will increasingly be on investors' minds. That should move investors towards holding gold, silver and other metals. If the economy improves, the demand for metals is likely to increase significantly. Industrial metals like copper, iron ore, zinc, lead and tin should be in greater demand. In addition, as consumers do better financially, more of them generally buy gold and silver jewelry.
Among the successes the Fund has had in 2009 are investments in uranium. We expect uranium mining and construction of nuclear power plants in the U.S. to attract much greater media attention in the years ahead as nuclear energy expands worldwide. The U.S. has significant amounts of uranium, mostly in Western states like Texas, Wyoming, New Mexico, and Colorado. There have been remarkable advancements in the technology in the operations of nuclear power plants in the last 20 years, especially as related to safety issues. Further, the construction of nuclear power plants costs between $10 billion and $20 billion, and employs thousands of workers. If we want to provide good jobs for our citizens, building and operating nuclear power plants would be a good way to do this. Regardless of the number of new plants built, or the timing involved, the 440 plants currently in worldwide operation use about 180 million pounds of uranium per year, while only about 100 million pounds is new ly mined. The difference in the past has been met by inventories and uranium reprocessed from nuclear weapons. These sources are coming to an end, and we believe that the supply and demand imbalances will lead to increased production. We are investing in companies that we believe will benefit from this situation.
We thank you for your support and confidence. Please tell your friends and colleagues about the Fund.
2009 Annual Report 2
Encompass Fund
PERFORMANCE INFORMATION
May 31, 2009 NAV $6.76
TOTAL RATE OF RETURN (%) FOR PERIODS ENDED MAY 31, 2009.
| Since | ||||
| 1 Year(A) | Inception(A) | |||
| Encompass Fund | -26.81% | -11.69% | ||
| Dow Jones Wilshire 5000 Index(B) | -32.63% | -8.45% |
(A)Since Inception and 1 Year returns include change in share prices and in each case includes reinvestment of any dividends and capital gain distributions. The inception date of the Encompass Fund was June 30, 2006.
(B)The Dow Jones Wilshire 5000 Index measures the performance of all U.S. headquartered equity securities with readily available price data. Over 5,000 capitalization weighted security returns are used to adjust the index. The composition of the Dow Jones Wilshire 5000 Index is different from the Fund.
PAST PERFORMANCE DOES NOT GUARANTEE FUTURE RESULTS. INVESTMENT RETURN AND PRINCIPAL VALUE WILL FLUCTUATE SO THAT SHARES, WHEN REDEEMED, MAY BE WORTH MORE OR LESS THAN THEIR ORIGINAL COST. RETURNS DO NOT REFLECT THE DEDUCTION OF TAXES THAT A SHAREHOLDER WOULD PAY ON FUND DISTRIBUTIONS OR THE REDEMPTION OF FUND SHARES. CURRENT PERFORMANCE MAY BE LOWER OR HIGHER THAN THE PERFORMANCE DATA QUOTED. TO OBTAIN PERFORMANCE DATA CURRENT TO THE MOST RECENT MONTH END, PLEASE CALL 1-800-595-3166.
2009 Annual Report 3
Encompass Fund
Encompass Fund
By Sectors Based on Percent of Net Assets
(UNAUDITED)

*Net Cash represents cash equivalents and other assets less liabilities
__________________________________________________________________________________________
Availability of Quarterly Schedule of Investments
The Fund files its complete schedule of portfolio holdings with the Securities and Exchange Commission ("SEC") for the first and third quarters of each fiscal year on Form N-Q. The Fund’s Forms N-Q are available on the SEC's Web site at http://www.sec.gov. The Fund’s Forms N-Q also may be reviewed and copied at the SEC's Public Reference Room in Washington, DC. Information on the operation of the Public Reference Room may be obtained by calling 1-800-SEC-0330.
Proxy Voting Guidelines
Brick Asset Management, Inc., the Fund’s Adviser, is responsible for exercising the voting rights associated with the securities held by the Fund. A description of the policies and procedures used by the Adviser in fulfilling this responsibility is available without charge on the Fund’s website at www.encompassfunds.com or is also available without charge, upon request, by calling our toll free number (1-888-463-3957). It is also included in the Fund’s Statement of Additional Information, which is available on the Securities and Exchange Commission’s website at http://www.sec.gov.
Information regarding how the Fund voted proxies, Form N-PX, relating to portfolio securities during the most recent 12-month period ended June 30 is available without charge, upon request, by calling our toll free number (1-888-463-3957). This information is also available on the Securities and Exchange Commission’s website at http://www.sec.gov.
2009 Annual Report 4
Expense Example
(Unaudited)
Shareholders of this Fund incur ongoing costs consisting of management fees and service fees. The following example is intended to help you understand your ongoing costs of investing in the Fund and to compare these costs with similar costs of investing in other mutual funds. The example is based on an investment of $1,000 invested in the Fund on December 1, 2008 and held through May 31, 2009.
The first line of the table below provides information about actual account values and actual expenses. In order to estimate the expenses a shareholder paid during the period covered by this report, shareholders can divide their account value by $1,000 (for example, an $8,600 account value divided by $1,000 = 8.6) and then multiply the result by the number in the first line under the heading entitled "Expenses Paid During the Period." The second line of the table below provides information about hypothetical account values and hypothetical expenses based on the Fund's actual expense ratio and an assumed rate of return of 5% per year before expenses, which is not the Fund’s actual return. The hypothetical account values and expenses may not be used to estimate the actual ending account balance or expenses paid by a shareholder for the period. Shareholders may use this information to compare the ongoing costs of investing in this Fund and oth er funds. To do so, compare this 5% hypothetical example with the 5% hypothetical examples that appear in other funds' shareholder reports.
| Expenses Paid | ||||||
| Beginning | Ending | During the Period* | ||||
| Account Value | Account Value | December 1, 2008 | ||||
| December 1, 2008 | May 31, 2009 | to May 31, 2009 | ||||
| Actual | $1,000.00 | $1,847.55 | $10.29 | |||
| Hypothetical | $1,000.00 | $1,017.70 | $7.29 | |||
| (5% annual return | ||||||
| before expenses) | ||||||
* Expenses are equal to the Fund’s annualized expense ratio of 1.45%, multiplied
by the average account value over the period, multiplied by 182/365 (to reflect the
half year period).
2009 Annual Report 5
| Encompass Fund | ||||||
| Schedule of Investments | ||||||
| May 31, 2009 | ||||||
| Shares/Principal Amount | Market Value | % of Net Assets | ||||
| COMMON STOCKS | ||||||
| Agricultural Chemicals | ||||||
| 300 | Potash Corp. of Saskatchewan, Inc. + (Canada) | $ 34,752 | 1.00% | |||
| Bituminous Coal & Lignite Mining | ||||||
| 2,000 | Peabody Energy Corp. + | 67,960 | ||||
| 3,000 | Southgobi Energy Resources * (Canada) | 29,187 | ||||
| 97,147 | 2.81% | |||||
| Copper Mining & Processing | ||||||
| 1,500 | Freeport-McMoRan Copper & Gold Inc. + | 81,645 | ||||
| 110,000 | Global Hunter Corp. * (Canada) | 3,960 | ||||
| 85,605 | 2.48% | |||||
| Crude Petroleum & Natural Gas | ||||||
| 250,000 | Continental Energy Corp. * (Canada) | 25,000 | 0.72% | |||
| Drug Delivery Systems | ||||||
| 40,000 | Delcath Systems Inc. * | 137,600 | 3.98% | |||
| Generic Drugs | ||||||
| 4,500 | 3SBio Inc. * ** (China) | 38,565 | ||||
| 2,050 | Teva Pharmaceutical Industries Ltd. ** (Israel) | 95,038 | ||||
| 133,603 | 3.86% | |||||
| Home Building | ||||||
| 2,500 | DR Horton Inc. + | 23,025 | 0.67% | |||
| Industrial Metals & Minerals | ||||||
| 62,500 | Avalon Rare Metals Inc. * (Canada) | 66,125 | ||||
| 200,000 | Aztec Metals Corp. * (Canada) | 8,000 | ||||
| 375,000 | Goldbrook Ventures * (Canada) | 20,625 | ||||
| 94,750 | 2.74% | |||||
| Oil & Gas Income Trusts | ||||||
| 2,400 | Crescent Point Energy Trust (Canada) | 69,782 | ||||
| 6,700 | Daylight Resources Trust (Canada) | 51,155 | ||||
| 120,937 | 3.50% | |||||
| Precious Metals Mining & Processing | ||||||
| 35,000 | Avion Resources Corp. * (Canada) | 10,850 | ||||
| 300,000 | Avion Resources Corp. * (Restricted) (Canada) | 83,700 | ||||
| 17,000 | Caza Gold Corp. * (Canada) | 340 | ||||
| 40,000 | Claude Resources Inc. * (Canada) | 32,800 | ||||
| 30,000 | Exeter Resource Corp. * (Canada) | 102,300 | ||||
| 20,000 | Fronteer Development Group Inc. * (Canada) | 75,800 | ||||
| 10,000 | NovaGold Resources Inc. * (Canada) | 51,300 | ||||
| 8,000 | Seabridge Gold Inc. * + (Canada) | 232,960 | ||||
| 590,050 | 17.06% | |||||
| Services - Computer Processing & Data Preparation | ||||||
| 17,300 | Zix Corp. * | 28,718 | 0.83% | |||
| Silver Mining and Processing | ||||||
| 20,000 | Endeavour Silver Corp. * (Canada) | 44,400 | ||||
| 75,000 | Paramount Gold and Silver Corp. * (Canada) | 80,250 | ||||
| 7,000 | Silver Wheaton Corp. * (Canada) | 73,640 | ||||
| 198,290 | 5.73% | |||||
| Solar Cell Manufacturing | ||||||
| 8,000 | JA Solar Holdings Co., Ltd. * + (China) | 33,840 | 0.98% | |||
| Uranium Mining & Exploration | ||||||
| 65,000 | Magnum Uranium Corp. * (Canada) | 15,080 | ||||
| 135,000 | Uranium Energy Corp. * | 317,250 | ||||
| 4,000 | Uranium Participation Corp. * (Canada) | 28,656 | ||||
| 360,986 | 10.44% | |||||
| Utilities & Power Producers | ||||||
| 5,000 | Calpine Corporation * + | 67,750 | ||||
| 4,000 | NorthWestern Corp. | 85,720 | ||||
| 153,470 | 4.44% | |||||
*Non-Income producing securities during the period.
**ADR - American Depository Receipt.
+ Portion or all of the security is pledged as collateral for call and put options written.
See Note 2 for information on Restricted Securities.
The accompanying notes are an integral part of these financial statements.
2009 Annual Report 6
| Encompass Fund | ||||||
| Schedule of Investments | ||||||
| May 31, 2009 | ||||||
| Shares/Principal Amount | Market Value | % of Net Assets | ||||
| COMMON STOCKS | ||||||
| Wholesale - Petroleum Distribution | ||||||
| 2,525 | Aegean Marine Petroleum Network Inc. + (Greece) | 40,274 | 1.16% | |||
| Total for Common Stock (Cost - $2,061,058) | 2,158,047 | 62.40% | ||||
| REAL ESTATE INVESTMENT TRUSTS | ||||||
| 20,000 | Ashford Hospitality Trust Inc. | 81,000 | ||||
| 6,200 | Prime Group Realty - Pfd. B | 10,788 | ||||
| Total for Real Estate Investment Trusts (Cost - $262,130) | 91,788 | 2.65% | ||||
| WARRANTS | ||||||
| 17,500 | Avion Resources Corp. * (expires 5-8-2010) (a) | - | ||||
| 150,000 | Avion Resources Corp. (Restricted) * (expires 7-12-2010) (b) | 29,550 | ||||
| 100,000 | Aztec Metals Corp. * (expires 2-6-2010) (c) | - | ||||
| 55,000 | Global Hunter Corp. * (expires 8-23-2009) (d) | - | ||||
| 375 | Uranium Energy Corp. * (expires 4-11-2010) (e) | - | ||||
| 375 | Uranium Energy Corp. * (expires 5-11-2010) (f) | - | ||||
| 375 | Uranium Energy Corp. * (expires 6-11-2010) (g) | - | ||||
| 5,000 | Uranium Energy Corp. * (expires 7-8-2010) (h) | - | ||||
| Total for Warrants (Cost - $0) | 29,550 | 0.85% | ||||
| Cash Equivalents | ||||||
| 250,000 | Huntington Bank Conservative Deposit Account 1.44% *** | 250,000 | ||||
| 980,412 | Huntington Bank Money Market Fund IV 0.01% *** | 980,412 | ||||
| Total for Cash Equivalents (Cost - $1,230,412) | 1,230,412 | 35.58% | ||||
| Total Investments | 3,509,797 | 101.48% | ||||
| (Cost - $3,553,600) | ||||||
| Liabilities in Excess of Other Assets | (51,320) | -1.48% | ||||
| Net Assets | $ 3,458,477 | 100.00% | ||||
*Non-Income producing securities during the period.
+ Portion or all of the security is pledged as collateral for call and put options written.
*** Variable rate security; the rate shown was the rate at May 31, 2009.
(a) Avion Resources Corp. warrants expire May 8, 2010, with an exercise price of $0.65 Canadian.
(b) Avion Resources Corp. (Restricted) warrants expire July 12, 2010, with an exercise price of $0.10 Canadian.
(c) Aztec Metals Corp. warrants expire February 6, 2010 with an exercise price of $.075 Canadian.
(d) Global Hunter Corp. warrants expire August 23, 2009, with an exercise price of $0.60 Canadian.
(e) Uranium Energy Corp. warrants expire April 11, 2010, with an exercise price of $4.25.
(f) Uranium Energy Corp. warrants expire May 11, 2010, with an exercise price of $4.25.
(g) Uranium Energy Corp. warrants expire June 11, 2010, with an exercise price of $4.25.
(h) Uranium Energy Corp. warrants expire July 8, 2010, with an exercise price of $3.10.
See Note 2 for information on Restricted Securities.
The accompanying notes are an integral part of these financial statements.
2009 Annual Report 7
| Encompass Fund | ||||
| Schedule of Written Options | ||||
| May 31, 2009 | ||||
| Underlying Security | Shares Subject | Market Value | ||
| Expiration Date/Exercise Price | to Put | |||
| Aegean Marine Petroleum Network Inc. (Greece) | 1,500 | 525 | ||
| June 2009 Puts @ 15.00 | ||||
| Calpine Corporation | 2,500 | 125 | ||
| June 2009 Puts @ 7.50 | ||||
| DR Horton Inc. | 1,500 | 1,785 | ||
| June 2009 Puts @ 10.00 | ||||
| Peabody Energy Corp. | 500 | 275 | ||
| June 2009 Puts @ 30.00 | ||||
| Total (Premiums Received $9,640) | $ 2,710 | |||
| Underlying Security | Shares Subject | Market Value | ||
| Expiration Date/Exercise Price | to Call | |||
| Freeport-McMoRan Copper & Gold Inc. | ||||
| August 2009 Calls @ 50.00 | 1,500 | $ 13,320 | ||
| JA Solar Holdings Co., Ltd. (China) | ||||
| June 2009 Calls @ 2.50 | 8,000 | 16,000 | ||
| Peabody Energy Corp. | ||||
| June 2009 Calls @ 32.00 | 2,000 | 5,800 | ||
| Potash Corp. of Saskatchewan, Inc. (Canada) | ||||
| June 2009 Calls @ 110.00 | 300 | 2,670 | ||
| Seabridge Gold Inc. (Canada) | ||||
| June 2009 Calls @ 22.50 | 3,000 | 18,300 | ||
| Seabridge Gold Inc. (Canada) | ||||
| August 2009 Calls @ 25.00 | 3,000 | 17,400 | ||
| Total (Premiums Received $32,927) | $ 73,490 | |||
The accompanying notes are an integral part of these financial statements.
2009 Annual Report 8
| Encompass Fund | ||
| Statement of Assets and Liabilities | ||
| May 31, 2009 | ||
| Assets: | ||
| Investment Securities at Market Value | $ 3,509,797 | |
| (Identified Cost - $3,553,600) | ||
| Cash | 5,000 | |
| Receivables: | ||
| Receivables for Fund Shares Sold | 22,000 | |
| Dividends and Interest | 783 | |
| Total Assets | 3,537,580 | |
| Liabilities | ||
| Service Fees Payable | 901 | |
| Management Fees Payable | 2,002 | |
| Covered Call Options Written (Premiums Received $32,927) | 73,490 | |
| Covered Put Options Written (Premiums Received $9,640) | 2,710 | |
| Total Liabilities | 79,103 | |
| Net Assets | $ 3,458,477 | |
| Net Assets Consist of: | ||
| Paid In Capital | $ 4,478,984 | |
| Accumulated Undistributed Net Investment Income | 1,903 | |
| Realized Loss on Investments - Net | (944,974) | |
| Unrealized Depreciation in Value | ||
| of Investments Based on Identified Cost - Net | (77,436) | |
| Net Assets, for 511,677 Shares Outstanding | $ 3,458,477 | |
| (Unlimited number of shares authorized without par value) | ||
| Net Asset Value and Redemption Price | ||
| Per Share ($3,458,477/511,677 shares) | $ 6.76 | |
| Statement of Operations | ||
| For the fiscal year ended May 31, 2009 | ||
| Investment Income: | ||
| Dividends (a) | $ 39,429 | |
| Interest | 1,234 | |
| Total Investment Income | 40,663 | |
| Expenses: | ||
| Service Fees (Note 3) | 8,632 | |
| Management Fees (Note 3) | 19,183 | |
| Total Expenses | 27,815 | |
| Net Investment Income | 12,848 | |
| Realized and Unrealized Gain (Loss) on Investments: | ||
| Realized Loss on Investments | (925,016) | |
| Realized Loss on Option Transactions | (4,311) | |
| Capital Gain Distributions from Portfolio Companies | 5,245 | |
| Net Increase In Unrealized Appreciation on Investments | 158,146 | |
| Net Realized and Unrealized Gain (Loss) on Investments | (765,936) | |
| Net Decrease in Net Assets Resulting from Operations | $ (753,088) | |
(a) Net of foreign taxes withheld $1,973.
The accompanying notes are an integral part of these financial statements.
2009 Annual Report 9
| Encompass Fund | ||||
| Statements of Changes in Net Assets | ||||
| 6/1/2008 | 6/1/2007 | |||
| to | to | |||
| 5/31/2009 | 5/31/2008 | |||
| Increase (Decrease) in Net Assets from Operations: | ||||
| Net Investment Income | $ 12,848 | $ 29,121 | ||
| Net Realized Loss on Investments | (925,016) | (26,418) | ||
| Realized Gain (Loss) on Option Transactions | (4,311) | 6,154 | ||
| Capital Gain Distributions from Portfolio Companies | 5,245 | 1,555 | ||
| Unrealized Appreciation (Depreciation) on Investments | 158,146 | (461,093) | ||
| Net Decrease in Net Assets Resulting from Operations | (753,088) | (450,681) | ||
| Distributions to Shareholders from: | ||||
| Net Investment Income | (21,275) | (23,773) | ||
| Return of Capital | - | (3,755) | ||
| Total Distributions Paid to Shareholders | (21,275) | (27,528) | ||
| Capital Share Transactions: | ||||
| Proceeds From Sale of Shares | 1,238,631 | 1,620,147 | ||
| Shares Issued on Reinvestment of Dividends | 21,275 | 27,528 | ||
| Cost of Shares Redeemed | (78,038) | (40,860) | ||
| Net Increase from Shareholder Activity | 1,181,868 | 1,606,815 | ||
| Total Increase | 407,505 | 1,128,606 | ||
| Net Assets at Beginning of Period | 3,050,972 | 1,922,366 | ||
| Net Assets at End of Period (Including undistributed net investment | $ 3,458,477 | $ 3,050,972 | ||
| income of $1,903 and $10,330, respectively.) | ||||
| Share Transactions: | ||||
| Issued | 197,687 | 155,332 | ||
| Reinvested | 5,526 | 2,629 | ||
| Redeemed | (16,541) | (4,255) | ||
| Net increase in shares | 186,672 | 153,706 | ||
| Shares outstanding beginning of period | 325,005 | 171,299 | ||
| Shares outstanding end of period | 511,677 | 325,005 | ||
| Financial Highlights | ||||||||
| Selected data for a share of capital stock outstanding | 6/1/2008 | 6/1/2007 | 6/30/2006* | |||||
| throughout the period: | to | to | to | |||||
| 5/31/2009 | 5/31/2008 | 5/31/2007 | ||||||
| Net Asset Value - | ||||||||
| Beginning of Period | $ 9.39 | $ 11.22 | $ 10.00 | |||||
| Net Investment Income *** | 0.04 | 0.10 | 0.10 | |||||
| Net Gains or Losses on Securities | ||||||||
| (realized and unrealized) | (2.61) | (1.84) | 1.15 | |||||
| Total from Investment Operations | (2.57) | (1.74) | 1.25 | |||||
| Less Distributions from: | ||||||||
| Net Investment Income | (0.06) | (0.07) | (0.03) | |||||
| Return of Capital | 0.00 | (0.02) | - | |||||
| Total Distributions | (0.06) | (0.09) | (0.03) | |||||
| Net Asset Value - | ||||||||
| End of Period | $ 6.76 | $ 9.39 | $ 11.22 | |||||
| Total Return **** | (26.81)% | (15.61)% | 12.59% | |||||
| Ratios/Supplemental Data | ||||||||
| Net Assets - End of Period (Thousands) | 3,458 | 3,051 | 1,922 | |||||
| Ratio of Expenses to Average Net Assets | 1.45% | 1.45% | 1.45% | ** | ||||
| Ratio of Net Income to Average Net Assets | 0.67% | 1.01% | 1.15% | ** | ||||
| Portfolio Turnover Rate | 37.56% | 32.52% | 11.26% |
* Commencement of investment operations.
** Annualized.
*** Calculated using the average shares method.
**** Total return in the above table represents the rate that the investor would
have earned or lost on an investment in the Fund assuming reinvestment of
distributions to shareholders, and for periods of less than one year are not annualized
The accompanying notes are an integral part of these financial statements.
2009 Annual Report 10
NOTES TO FINANCIAL STATEMENTS
ENCOMPASS FUND
MAY 31, 2009
1.) ORGANIZATION
Encompass Fund (the "Fund") is a non-diversified series of the Encompass Funds (the "Trust"), and is registered under the Investment Company Act of 1940 as an open-end management investment company. The Trust was organized as an Ohio business trust on March 26, 2006, and may offer shares of beneficial interest in a number of separate series, each series representing a distinct fund with its own investment objectives and policies. At present, the Fund is the only series authorized by the Trust. The Fund commenced operations on June 30, 2006. The Fund’s investment adviser is Brick Asset Management, Inc. (the “Adviser”). The Fund's investment objective is long-term capital appreciation.
2.) SIGNIFICANT ACCOUNTING POLICIES
SECURITY VALUATION: Equity securities generally are valued by using market quotations, but may be valued on the basis of prices furnished by a pricing service when the Adviser believes such prices accurately reflect the fair market value of such securities. Securities that are traded on any stock exchange or on the NASDAQ over-the-counter market are generally valued by the pricing service at the last quoted sale price. Lacking a last sale price, an equity security is generally valued by the pricing service at its last bid price. When market quotations are not readily available, when the Adviser determines that the market quotation or the price provided by the pricing service does not accurately reflect the current market value, or when restricted or illiquid securities are being valued, such securities are valued as determined in good faith by the Adviser, in conformity with guidelines adopted by and subject to review of the Board of Trustees of the Trust.
Fixed income securities generally are valued by using market quotations, but may be valued on the basis of prices furnished by a pricing service when the Adviser believes such prices accurately reflect the fair market value of such securities. A pricing service utilizes electronic data processing techniques based on yield spreads relating to securities with similar characteristics to determine prices for normal institutional-size trading units of debt securities without regard to sale or bid prices. If the Adviser decides that a price provided by the pricing service does not accurately reflect the fair market value of the securities, when prices are not readily available from a pricing service or when restricted or illiquid securities are being valued, securities are valued at fair value as determined in good faith by the Adviser, in conformity with guidelines adopted by and subject to review of the Board of Trustees. Short term investments in fixed income securities with ma turities of less than 60 days when acquired, or which subsequently are within 60 days of maturity, are valued by using the amortized cost method of valuation, which the Board of Trustees has determined will represent fair value.
In accordance with the Trust’s good faith pricing guidelines, the Adviser is required to consider all appropriate factors relevant to the value of securities for which it has determined other pricing sources are not available or reliable as described above. No single standard for determining fair value controls, since fair value depends upon the circumstances of each individual case. As a general principle, the current fair value of securities being valued by the Adviser would appear to be the amount which the owner might reasonably expect to receive for them upon their current sale. Methods which are in accord with this principle may, for example, be based on (i) a multiple of earnings; (ii) a discount from market of a similar freely traded security (including a derivative security or a basket of securities traded on other markets, exchanges or among dealers); or (iii) yield to maturity with respect to debt issues, or a combination of these and other methods.
FAS 157: The Fund adopted Financial Accounting Standards Board Statement of Financial Accounting Standards No. 157, Fair Value Measurements ("FAS 157"), effective May 1, 2008. In accordance with FAS 157, fair value is defined as the price that the Fund would receive to sell an asset or pay to transfer a liability in an orderly transaction between market participants at the measurement date. FAS 157 also establishes a framework for measuring fair value, and a three-level hierarchy for fair value measurements based upon the transparency of inputs to the valuation of an asset or liability. The three-tier hierarchy of inputs is summarized below.
Level 1 - quoted prices in active markets for identical investments
Level 2 - other significant observable inputs (including quoted prices for similar investments, interest rates, prepayment speeds, credit risk, etc.)
Level 3 - significant unobservable inputs (including the Fund's own assumptions in determining the fair value of investments) The inputs or methodology used for valuing securities are not necessarily an indication of the risk associated with investing in those securities.
The following table summarizes the valuation of the Fund's investments by the above fair value hierarchy levels as of May 31, 2009:
2009 Annual Report 11
Notes to the Financial Statements - continued
| Investments | ||
| Valuation Inputs of Assets | in Securities | |
| Level 1- Quoted Prices | $ 3,388,207 | |
| Level 2- Significant Other Observable Inputs | 113,250 | |
| Level 3- Significant Unobservable Inputs | 8,340 | |
| Total | $ 3,509,797 |
| Investments in | ||
| Valuation Inputs of Liabilities | Written Options | |
| Level 1- Quoted Prices | $76,200 | |
| Level 2- Significant Other Observable Inputs | 0 | |
| Level 3- Significant Unobservable Inputs | 0 | |
| Total | $76,200 |
Following is a reconciliation of investments in which significant unobservable inputs (Level 3) were used in determining fair value:
| Investments | ||
| in Securities | ||
| Balance as of 5/31/08 | $ 0 | |
| Accrued discounts/premiums | 0 | |
| Realized gain (loss) | 0 | |
| Change in unrealized appreciation/depreciation | 0 | |
| Net purchases (sales) | 8,340 | |
| Net transfers in and/or out of Level 3 | 0 | |
| Balance as of 5/31/09 | $ 8,340 | |
| Net changes in unrealized appreciation/depreciation | ||
| from investments still held as of 5/31/09 | $ 0 |
FOREIGN CURRENCY: Investment securities and other assets and liabilities denominated in foreign currencies are translated into U.S. dollar amounts at the date of valuation. Purchases and sales of investment securities and income and expense items denominated in foreign currencies are translated into U.S. dollar amounts on the respective dates of such transactions.
The Fund does not isolate that portion of the results of operations resulting from changes in foreign exchange rates on investments from the fluctuations arising from changes in market prices of securities held. Such fluctuations are included with the net realized and unrealized gain or loss from investments.
Net realized foreign exchange gains or losses arise from sales of foreign currencies, currency gains or losses realized between the trade and settlement dates on securities transactions, and the difference between the amounts of dividends, interest, and foreign withholding taxes recorded on the Fund's books and the U.S. dollar equivalent of the amounts actually received or paid. Net unrealized foreign exchange gains and losses arise from changes in the fair values of assets and liabilities, other than investments in securities at fiscal period end, resulting from changes in exchange rates.
SHORT SALES: The Fund may sell a security it does not own in anticipation of a decline in the fair value of that security. When the Fund sells a security short, it must borrow the security sold short and deliver it to the broker-dealer through which it made the short sale. A gain, limited to the price at which the Fund sold the security short, or a loss, unlimited in size, will be recognized upon the termination of a short sale.
OPTION WRITING: When the Fund writes an option, an amount equal to the premium received by the Fund is recorded as a liability and is subsequently adjusted to the current fair value of the option written. Premiums received from writing options that expire unexercised are treated by the Fund on the expiration date as realized gains from investments. The difference between the premium and the amount paid on effecting a closing purchase transaction, including brokerage commissions, is also treated as a realized gain, or, if the premium is less than the amount paid for the closing transaction, as a realized loss. If a call option is exercised, the premium is added to the proceeds from the sale of the underlying security or currency in determining whether the Fund has realized a gain or loss. If a put option is exercised, the premium reduces the cost basis of the securities purchased by the Fund. The Fund as a writer of an option bears the market risk of an unfavorable change in the price of the security underlying the written option.
RESTRICTED SECURITIES: The Fund held the following Restricted Securities at May 31, 2009, the sale of which are restricted. The investments have been valued by the Adviser pursuant to the Fund’s Good Faith Pricing Guidelines at the following unit prices, after considering various pertinent factors, including the discount to the trading price of the common stock at which the Units were purchased; the restrictions on the sale of the Units; and the market price of the stock relative to the exercise price of the warrant. It is possible that the estimated value may differ significantly from the amount that might ultimately be realized and the difference could be material.
2009 Annual Report 12
Notes to the Financial Statements - continued
| Restricted Security | Units | Fair Value per Unit | Fair Value | |||
| Avion Resources Corp. | 300,000 | 0.279 | $ 83,700 | |||
| Avion Resources Corp. - Warrant | 150,000 | 0.197 | 29,550 | |||
| $ 113,250 |
The restricted securities represented 3.5% of the Fund’s total market value of its investments at May 31, 2009.
SECURITY LOANS: The Fund may make long and short term loans of its portfolio securities to parties such as broker-dealers, banks or institutional investors. The Fund would receive compensation in the form of fees, or it would retain a portion of interest on the investment of any cash received as collateral. The Fund continues to receive interest or dividends on the securities loaned. The loans are secured by collateral at least equal, at all times, to the fair value of the securities loaned plus accrued interest. Gain or loss in the fair value of the securities loaned that may occur during the term of the loan will be for the account of the Fund. The Fund has the right under the lending agreement to recover the securities from the borrower on demand.
SECURITY TRANSACTION TIMING: Security transactions are recorded on a trade date basis. Dividend income is recognized on the ex-dividend date. Interest income is recognized on an accrual basis. Discounts and premiums on securities purchased are amortized over the life of the respective securities. Withholding taxes on foreign dividends have been provided for in accordance with the Fund’s understanding of the applicable country’s tax rules and rates.
FEDERAL INCOME TAXES: The Fund’s policy is to comply with the requirements of Subchapter M of the Internal Revenue Code that are applicable to regulated investment companies and to distribute all of its taxable income to its shareholders. Therefore, no federal income tax provision is required. It is the Fund's policy to distribute annually, prior to the end of the calendar year, dividends sufficient to satisfy excise tax requirements of the Internal Revenue Service. This Internal Revenue Service requirement may cause an excess of distributions over the book year-end accumulated income. In addition, it is the Fund's policy to distribute annually, after the end of the fiscal year, any remaining net investment income and net realized capital gains.
DISTRIBUTIONS TO SHAREHOLDERS: Distributions to shareholders, which are determined in accordance with income tax regulations, are recorded on the ex-dividend date.
USE OF ESTIMATES: The preparation of financial statements in conformity with accounting principles generally accepted in the United States of America requires management to make estimates and assumptions that affect the reported amounts of assets and liabilities and disclosure of contingent assets and liabilities at the date of the financial statements and the reported amounts of increases and decreases in net assets from operations during the reporting period. Actual results could differ from those estimates.
3.) MANAGEMENT AND SERVICES AGREEMENTS
Under the terms of the Management Agreement between the Trust and the Adviser (the "Management Agreement"), the Adviser manages the investment portfolio of the Fund, subject to policies adopted by the Trust's Board of Trustees, and, at its own expense and without reimbursement from the Trust, furnishes office space and all necessary office facilities, equipment and executive personnel necessary for managing the Fund. For its services the Adviser receives an investment management fee equal to 1.00% of the average daily net assets of the Fund.
Under the terms of the Services Agreement between the Trust and the Adviser (the "Services Agreement"), the Adviser renders administrative and supervisory services to the Fund, provides the services of a chief compliance officer and assumes and pays all ordinary expenses of the Fund, except that the Fund pays all management fees, brokerage fees and commissions, taxes, borrowing costs (such as (a) interest and (b) dividend expenses on securities sold short), extraordinary or non-recurring expenses, Rule 12b-1 expenses (of which none were authorized as of May 31, 2009) and indirect expenses (such as fees and expenses of other funds in which the Fund may invest). For its services the Adviser receives a services fee equal to 0.45% of the average daily net assets of the Fund.
For the fiscal year ended May 31, 2009, the Adviser earned management fees totaling $19,183, of which $2,002 was still due to the Adviser at May 31, 2009. For the same period the Adviser earned services fees of $8,632, of which $901 was still due to the Adviser at May 31, 2009. Trustees who are not interested persons of the Fund were paid a total of $4,200 in Trustees’ fees by the Fund's Adviser for the fiscal year ended May 31, 2009.
4.) INVESTMENT TRANSACTIONS
For the fiscal year ended May 31, 2009, purchases and sales of investment securities other than U.S. Government obligations and short-term investments aggregated $891,332 and $696,592 respectively. Purchases and sales of U.S. Government obligations aggregated $0 and $0, respectively.
2009 Annual Report 13
Notes to the Financial Statements - continued
5.) PUT & CALL OPTIONS
Transactions in written put and call options during the year ended May 31, 2009 were as follows:
| Number of | Premiums | |||
| Contracts | Received | |||
| Options outstanding at May 31, 2008 | 0 | $0 | ||
| Options written | 492 | $99,506 | ||
| Options exercised | (140) | ($34,990) | ||
| Options expired | (9) | ($4,109) | ||
| Options terminated in closing purchase transactions | (105) | ($17,840) | ||
| Options outstanding at May 31, 2009 | 238 | $42,567 |
6.) TAX MATTERS
There was a dividend distribution paid on December 30, 2008 of $0.0643 per share. The tax char acter of distributions was as follows:
Distributions paid from:
| Year ended | Year ended | |||
| May 31, 2009 | May 31, 2008 | |||
| Ordinary Income: | $ 21,275 | $ 23,773 | ||
| Short-term Capital Gain: | 0 | 0 | ||
| Long-term Capital Gain: | 0 | 0 | ||
| Return of Capital: | 0 | 3,755 | ||
| $ 21,275 | $ 27,528 |
As of May 31, 2009, the tax basis components of distributable earnings, unrealized appreciation (depreciation) and cost of investment securities were as follows:
| Undistributed ordinary income | $ 1,903 | |
| Capital loss carryforwards expire as follows: 2015+ | $ 2,184 | |
| 2016 | 18,708 | |
| 2017 | 630,423 | |
| $ 651,315 | ||
| Post-October capital loss deferrals from 11/1/08 through 5/31/2009* | ($ 293,659) | |
| Gross unrealized appreciation on investment securities | $ 622,572 | |
| Gross unrealized depreciation on investment securities | (700,008) | |
| Net unrealized depreciation on investment securities | $ 77,436 | |
| Cost of investment securities including short term investments | $ 3,553,600 | |
*These deferrals are considered incurred in the subsequent year.
+ The capital loss carryforwards will be used to offset any capital gains realized by the Fund in future years through the expiration date. The Fund will not make distributions from capital gains while a capital loss carryforward remains.
7.) CAPITAL SHARES
The Trust is authorized to issue an unlimited number of shares. Paid in capital at May 31, 2009 was $4,478,984 representing 511,677 shares outstanding.
8.) CONTROL OWNERSHIP
The beneficial ownership, either directly or indirectly, of more than 25% of the voting securities of a fund creates a presumption of control of the fund under Section 2(a)(9) of the Investment Company Act of 1940. As of May 31, 2009, Charles Schwab & Co. Inc. held for the benefit of others, in aggregate, approximately 77.16% of the Fund and therefore may be deemed to control the Fund.
9.) RECENT ACCOUNTING PRONOUNCEMENTS
In March 2008, the Financial Accounting Standards Board ("FASB") issued the Statement of Financial Accounting Standards No. 161, "Disclosures about Derivative Instruments and Hedging Activities" ("SFAS 161"). SFAS 161 is effective for fiscal years and interim periods beginning after November 15, 2008. SFAS 161 requires enhanced disclosures about the Fund's derivative and hedging activities, including how such activities are accounted for and their effect on the Fund's financial position, performance and cash flows. Management is currently evaluating the impact the adoption of SFAS 161 will have on the Fund's financial statements and related disclosures. In April 2009, FASB issued FASB Staff Position No. 157-4, "Determining Fair Value When the Volume and Level of Activity for the Asset and Liability Have Significantly Decreased and
2009 Annual Report 14
Notes to the Financial Statements - continued
Identifying Transactions That Are Not Orderly" ("FSP 157-4"). FSP 157-4 is effective for fiscal years and interim periods ending after June 15, 2009. FSP 157-4 provides additional guidance for estimating fair value in accordance with FASB Statement of Financial Standards No. 157, "Fair Value Measurements" ("FAS 157"), when the volume and level of activity for the asset or liability have significantly decreased as well as guidance on identifying circumstances that indicate a transaction is not orderly. Management is currently evaluating the impact the adoption of FSP 157-4 will have on the Fund's financial statements and related disclosures.
In May 2009, FASB issued the Statement of Financial Accounting Standards No. 165, "Subsequent Events" ("SFAS 165"). SFAS 165 is effective for fiscal years and interim periods ending after June 15, 2009. SFAS 165 requires the disclosure of the date through which an entity has evaluated subsequent events and the basis for that date - that is, whether that date represents the date the financial statements were issued or were available to be issued. Management is currently evaluating the impact the adoption of SFAS 165 will have on the Fund's financial statements and related disclosures.
2009 Annual Report 15
| ADDITIONAL INFORMATION |
APPROVAL OF INVESTMENT ADVISORY AGREEMENT
On May 29, 2009 the Board of Trustees considered the renewal of the Management Agreement. In reviewing the Management Agreement, the Board of Trustees received materials from the Adviser addressing the following factors: (i) the investment performance of the Fund and the Adviser; (ii) the nature, extent and quality of the services provided by the Adviser to the Fund; (iii) the cost of the services to be provided and the profits to be realized by the Adviser and its affiliates from the relationship with the Fund; (iv) the extent to which economies of scale will be realized as the Fund grows; and (v) whether the fee levels reflect these economies of scale to the benefit of shareholders.
As to the performance of the Fund, the materials provided to the Trustees included information regarding the Fund's performance compared to a group of funds of similar size, style and objective that were categorized by Morningstar as World Stock funds (the "Peer Group"). The Trustees also received performance information for the Dow Jones Wilshire 5000 Index. The performance data was presented for various periods through March 31, 2009. The Trustees noted that the Fund outperformed the Peer Group for both the 12 month period and year-to-date period ended March 31, 2009. The Fund was down 40.29% for the 12 month period ended March 31, 2009 compared to a return of -41.76% for the Peer Group. The Fund was up 28.93% compared to -8.23% for the Peer Group for the year-to-date period ended March 31, 2009. During calendar 2008 the Fund underperformed the Dow Jones Wilshire 5000 Index, having generated a -61.59% total return compared to -37.23% for the Index. The Trustees also noted that the Fund slightly underperformed the Dow Jones Wilshire 5000 Index for the 12 month period ended March 31, 2009, having generated a -40.29% total return compared to -37.96% for the Index.
As to the nature, extent and quality of the services provided by the Adviser, the Trustees analyzed the Adviser's experience and capabilities. The Adviser reviewed and discussed with the Board it's Form ADV and Code of Ethics certifications. Mr. Gissen summarized the information provided to the Board and discussed the Adviser's investment management experience. Furthermore, the Adviser discussed it’s financial condition and discussed the firm's ability to meet its obligations under the Management Agreement. The Board concluded that the nature and extent of the services provided by the Adviser were consistent with their expectations, including the quality of services provided by the portfolio managers. The Trustees also concluded that the Adviser has the resources to provide quality advisory services to the Fund.
As to the costs of the services to be provided, the Board reviewed the fees under the Management Agreement compared to the Peer Group. The Fund's expense ratio of 1.45% was lower than its Peer Group's average expense ratio of 1.71% . The Trustees then reviewed the management fee ratio of the Fund compared its Peer Group and noted that the management fee ratio of 1.00% was above the category average of 0.81%, but within the range of the Peer Group. The Trustees also noted that the Fund has no front-end load, deferred-load, or 12b-1 expense. The category averages for front-end loads, deferred-loads and 12b-1 expenses were 1.17%, 1.54% and 0.43% respectively. The Adviser indicated that it would consider adding breakpoints in the future as the Fund grows. The Trustees recognized the expense ratio was below the average for the Peer Group and that the management fee was above the Peer Group; however, they also recognized that the Adviser was not making a profit from its services t o the Fund, and that the Adviser is committed to reducing fees as economies of scale are realized. The Trustees concluded that the advisory fee was reasonable.
Next, the independent Trustees met in executive session to discuss the continuation of the Management Agreement. Upon reconvening the meeting, the Trustees reported that after further consideration, they were satisfied with the performance of the Fund. They concluded that the nature and extent of services provided by the Adviser was consistent with the Board's expectations. The Trustees also concluded that the Adviser has sufficient resources and had provided quality advisory services to the Fund. The Board agreed that that the fees in the Management Agreement were reasonable and that the Adviser is not making a profit from its relationship with the Fund. The Trustees noted that the Adviser has indicated that it will consider adding breakpoints in the future as the Fund grows. It was the consensus of the Trustees, including the Independent Trustees, that the renewal of the Management Agreement would be in the best interests of the Fund.
2009 Annual Report 16
REPORT OF INDEPENDENT REGISTERED PUBLIC ACCOUNTING FIRM
| To the Shareholders and Board of Trustees of Encompass Fund, a Series of the Encompass Funds |
We have audited the accompanying statement of assets and liabilities of the Encompass Fund, a Series of the Encompass Funds (the "Fund"), including the schedule of investments, as of May 31, 2009 and the related statement of operations for the year then ended, the statements of changes in net assets and financial highlights for the two years in the period then ended and the financial highlights for the period June 30, 2006 (commencement of investment operations) through May 31, 2007. These financial statements and financial highlights are the responsibility of the Fund's management. Our responsibility is to express an opinion on these financial statements based on our audits.
We conducted our audits in accordance with the standards of the Public Company Accounting Oversight Board (United States). Those standards require that we plan and perform the audit to obtain reasonable assurance about whether the financial statements and financial highlights are free of material misstatement. An audit includes examining, on a test basis, evidence supporting the amounts and disclosures in the financial statements. Our procedures included confirmation of securities and cash owned as of May 31, 2009, by correspondence with the custodian and brokers. An audit also includes assessing the accounting principles used and significant estimates made by management, as well as evaluating the overall financial statement presentation. We believe that our audits provide a reasonable basis for our opinion.
In our opinion, the financial statements and financial highlights referred to above present fairly, in all material respects, the financial position of the Encompass Fund, a Series of the Encompass Funds as of May 31, 2009, the results of its operations and changes in its net assets and the financial highlights for the periods indicated therein in conformity with accounting principles generally accepted in the United States of America.
![]()
Abington, Pennsylvania
July 27, 2009
2009 Annual Report 17
| TRUSTEES AND OFFICERS |
The Board of Trustees supervises the business activities of the Trust. The names of the Trustees and executive officers of the Trust are shown below. Each Trustee serves until the Trustee sooner dies, resigns, retires or is removed. Officers hold office for one year and until their respective successors are chosen and qualified. The Statement of Additional Information includes additional information about the Fund’s Trustees and Officers and is available, without charge upon request, by calling 1-888-463-3957 The Trustees and Executive Officers of the Trust and their principal business activities during the past five years are:
Interested Trustees and Officers
| Other | ||||||||||
| Name, | Position | Length of | Principal | Number of | Directorships | |||||
| Address(1), | with the | Time Served | Occupation(s) | Portfolios | Held By | |||||
| and Age | Trust | During | Overseen By | Trustee or | ||||||
| Past 5 Years | Trustee | Officer | ||||||||
| Malcolm H. Gissen(2), 65 | President, | Since 2006 | President, Malcolm H. Gissen & | 1 | None | |||||
| Treasurer | Associates, Inc. (1985-Present). | |||||||||
| and Trustee | President, Brick Asset | |||||||||
| Management, Inc. (2006-Present). | ||||||||||
| Marshall G. Berol, 72 | Secretary | Since 2006 | Principal, BL/SH Financial (1990- | N/A | N/A | |||||
| and Chief | present), Chief Investment | |||||||||
| Compliance | Officer, Malcom H. Gissen & | |||||||||
| Officer | Associates, Inc. (2000-Present), | |||||||||
| Secretary, Brick Asset | ||||||||||
| Management, Inc. (2006-Present). | ||||||||||
Independent Trustees
| Principal | Number of | Other | ||||||||
| Name, | Position | Length of | Occupation(s) | Portfolios | Directorships | |||||
| Address(1), | with the | Time Served | During | Overseen By | Held By | |||||
| and Age | Trust | Past 5 Years | Trustee | Trustee or | ||||||
| Officer | ||||||||||
| Sol Coffino, 65 | Independent | Since 2006 | Senior Vice President, Taxes & | 1 | None | |||||
| Trustee | Acquisition Services, Fremont | |||||||||
| Group (1997-Present). | ||||||||||
| John F. Runkel, 54 | Independent | Since 2006 | General Counsel, Intuitive | 1 | None | |||||
| Trustee | Surgical, Inc (2006-2007), General | |||||||||
| Counsel, VISX, Inc. (2001-2005). | ||||||||||
| William P. Twomey, 66 | Independent | Since 2006 | Retired (2006-Present). Chief | 1 | None | |||||
| Trustee | Financial Officer, Morrison & | |||||||||
| Foerster, LLP (1994-2006). | ||||||||||
(1)The address of each trustee and officer is c/o Encompass Funds 1700 California Street, Suite 335 San Francisco, CA 94109.
(2)Malcolm H. Gissen is considered an "interested person" as defined in Section 2(a)(19) of the Investment Company Act of 1940 by virtue of his affiliation with the Adviser.
2009 Annual Report 18
| Board of Trustees Sol Coffino Malcolm H. Gissen John F. Runkel William P. Twomey Investment Adviser Brick Asset Management, Inc. Counsel Thompson Hine LLP Custodian Huntington National Bank Dividend Paying Agent, Shareholders' Servicing Agent, Transfer Agent Mutual Shareholder Services, LLC Fund Administrator Premier Fund Solutions, Inc. Independent Registered Public Accounting Firm Sanville & Company |
This report is provided for the general information of the shareholders of the Encompass
Fund. This report is not intended for distribution to prospective investors in the Fund,
unless preceded or accompanied by an effective prospectus.
Item 2. Code of Ethics.
The registrant has adopted a code of ethics that applies to the registrant’s principal executive officer and the principal financial officer. The registrant has not made any amendments to its code of ethics during the covered period. The registrant has not granted any waivers from any provisions of the code of ethics during the covered period. A copy of the registrant’s Code of Ethics is filed herewith.
Item 3. Audit Committee Financial Expert.
The registrant’s Board of Trustees has determined that it does not have an audit committee financial expert serving on its audit committee. The registrant believes that the experience provided by each member of the audit committee together offers the registrant adequate oversight for the registrant’s level of financial complexity.
Item 4. Principal Accountant Fees and Services.
(a-d) The following table details the aggregate fees billed for each of the last two fiscal years for audit fees, audit-related fees, tax fees and other fees by the principal accountant to the registrant. The principal accountant has provided no services to the adviser or any entity controlled by, or under common control with the adviser that provides ongoing services to the registrant.
| FYE 5/31/09 | FYE 5/31/08 | |||
| Audit Fees | $11,00 | $9,500 | ||
| Audit-Related Fees | $0 | $0 | ||
| Tax Fees | $2,000 | $1,200 | ||
| All Other Fees | $0 | $0 |
Nature of Tax Fees: preparation of Excise Tax Statement and 1120 RIC.
(e) (1) The audit committee approves all audit and non-audit related services and, therefore, has not adopted pre-approval policies and procedures described in paragraph (c)(7) of Rule 2-01 of Regulation S-X.
(e) (2) None of the services described in paragraph (b) through (d) of this Item were approved by the audit committee pursuant to paragraph (c)(7)(i)(C) of Rule 2-01 of Regulation S-X.
(f) All of the principal accountant’s hours spent on auditing the registrant’s financial statements were attributed to work performed by full-time permanent employees of the principal accountant.
(g) The following table indicates the aggregate non-audit fees billed by the registrant’s principal accountant for services to the registrant , the registrant’s investment adviser (not sub-adviser), and any entity controlling, controlled by, or under common control with the adviser that provides ongoing services to the registrant, for the last two years.
| Non-Audit Fees | FYE 5/31/09 | FYE 5/31/08 | ||
| Registrant | $2,000 | $1,200 |
| Registrant’s Investment Adviser | $0 | $0 |
(h) The principal accountant provided no services to the investment adviser or any entity controlling, controlled by, or under common control with the adviser that provides ongoing services to the registrant.
Item 5. Audit Committee of Listed Companies. Not applicable.
Item 6. Schedule of Investments. Schedule filed with Item 1.
Item 7. Disclosure of Proxy Voting Policies and Procedures for Closed-End Management Investment Companies. Not applicable.
Item 8. Portfolio Managers of Closed-End Management Investment Companies. Not applicable.
Item 9. Purchases of Equity Securities by Closed-End Management Investment Companies and Affiliated Purchasers. Not applicable.
Item 10. Submission of Matters to a Vote of Security Holders.
The registrant has not adopted procedures by which shareholders may recommend nominees to the registrant’s board of trustees.
Item 11. Controls and Procedures.
(a) The registrant’s president and chief financial officer concluded that the disclosure controls and procedures (as defined in Rule 30a-3(c) under the Investment Company Act of 1940 (the “Act”)) were effective as of a date within 90 days of the filing date of this report, based on the evaluation of these controls and procedures required by Rule 30a-3(b) under the Act.
(b) There were no changes in the registrant’s internal control over financial reporting (as defined in Rule 30a-3(d) under the Act) that occurred during the registrant’s second fiscal quarter of the period covered by this report that have materially affected, or are reasonably likely to materially affect, the registrant’s internal control over financial reporting.
Item 12. Exhibits.
(a)(1) Code of Ethics. Filed herewith.
(a)(2) Certifications pursuant to Section 302 of the Sarbanes-Oxley Act of 2002. Filed herewith
(b) Certification pursuant to Section 906 Certification of the Sarbanes-Oxley Act of 2002. Filed herewith.
| SIGNATURES |
Pursuant to the requirements of the Securities Exchange Act of 1934 and the Investment Company Act of 1940, the registrant has duly caused this report to be signed on its behalf by the undersigned, thereunto duly authorized.
ENCOMPASS FUNDS
| By: /s/ Malcolm H. Gissen Malcolm H. Gissen President |
| Date: 9/29/09 |
Pursuant to the requirements of the Securities Exchange Act of 1934 and the Investment Company Act of 1940, this report has been signed below by the following persons on behalf of the registrant and in the capacities and on the dates indicated.
| By: /s/ Malcolm H. Gissen Malcolm H. Gissen President |
| Date: 9/29/09 |
| By: /s/ Malcolm H. Gissen Malcolm H. Gissen Chief Financial Officer |
| Date: 9/29/09 |