UNITED STATES
SECURITIES AND EXCHANGE COMMISSION
WASHINGTON, D.C. 20549
FORM N-CSR
CERTIFIED SHAREHOLDER REPORT OF REGISTERED MANAGEMENT
INVESTMENT COMPANIES
Investment Company Act file number 811-21885
ENCOMPASS FUNDS
(Exact name of registrant as specified in charter)
| 1700 California Street, Suite 335, San Francisco, CA | 94109 |
| (Address of principal executive offices) | (Zip code) |
Malcolm H. Gissen
Encompass Funds
1700 California Street, Suite 335
San Francisco, CA 94109
(Name and address of agent for service)
Registrant's telephone number, including area code: (415) 749-6565
Date of fiscal year end: May 31
Date of reporting period: May 31, 2013
Form N-CSR is to be used by management investment companies to file reports with the Commission not later than 10 days after the transmission to stockholders of any report that is required to be transmitted to stockholders under Rule 30e-1 under the Investment Company Act of 1940 (17 CFR 270.30e -1). The Commission may use the information provided on Form N-CSR in its regulatory, disclosure review, inspection and policymaking roles.
A registrant is required to disclose the information specified by Form N-CSR, and the Commission will make this information public. A registrant is not required to respond to the collection of information contained in Form N-CSR unless the Form displays a currently valid Office of Management and Budget ("OMB") control number. Please direct comments concerning the accuracy of the information collection burden estimate and any suggestions for reducing the burden to Secretary, Securities and Exchange Commission, 450 Fifth Street, NW, Washington, DC 20549-0609. The OMB has reviewed this collection of information under the clearance requirements of 44 U.S.C. § 3507.
Item 1. Reports to Stockholders.

TICKER SYMBOL: ENCPX
ANNUAL REPORT
May 31, 2013
ENCOMPASS FUND ANNUAL LETTER
~July 2013~
Dear Fellow Shareholder:
The Encompass Fund is on a fiscal year ending May 31st, and this Annual Report is for the year ended May 31, 2013.
Unfortunately it was not a good year either for the markets we have primarily invested in, nor for the Fund.
As investors in the Fund you are aware that the Fund is not constrained to invest in any particular sector or industry, nor of a particular market capitalization size company. The Fund Managers look for attractive sectors or industries (a "top-down" approach) or attractive individual companies (a "bottom-up" approach) in which to invest.
When the Fund was established seven years ago, (June 30, 2006), we believed that the various resource industries offered attractive investment opportunities. Gold and silver were in demand and rising in price, and world-wide growth, especially in the emerging nations like China and India, necessitated increasing use of industrial commodities (copper, oil, natural gas, coal, uranium, lead, zinc, and other metals and minerals). We invested in the stocks of the companies involved with the exploration and production of many of these commodities, including a number of smaller ("junior") mining companies. We have continued an emphasis on the resource companies as we believe their investments remain attractive. We also have invested the Fund in other sectors such as healthcare, real estate and technology.
The emphasis on resource companies stood the Fund in extremely good stead in 2009 and 2010, when the Encompass Fund ranked among the top few funds in Morningstar’s World Stock Fund Category. Unfortunately, that has not been the case since then. The underlying fundamentals for most commodities remains good, but the markets have become obsessed with market and stock movements on a very short-term basis, moving up or down based on the latest report or rumor. Also, because interest rates have remained at a historical extremely low level, there has been a flow of funds to higher yielding stocks (generally the large-cap, dividend paying companies that primarily make up the S&P 500 Index or the Dow Jones Industrial Index).
2013 Annual Report 1
As one example, gold's underlying fundamentals are that demand continues from central governments and individuals, and increased supply is difficult. The deposits being discovered and brought into production today are in more remote locations and subject to increased permitting hurdles, environmental regulations, local people's concerns and demands, and local and federal governments' increased desire for more revenues (taxes, royalties, larger ownership interests). Similar challenges have prevailed with most of the commodities. For the year ended May 31, 2013 the price gold declined 17.3%; a senior gold miner's index (Market Vectors Gold Miners ETF) declined 36.4%; a junior gold miners index (Market Vectors Junior Gold Miners ETF) declined 39.3%; the price of silver declined 27.0% and a silver miners index (Global X Silver Miners ETF) declined 36.7%; the price of copper declined 12.1% and a copper miner's index (Global X Copper Miners ETF) declined 21.3% .
We continue to believe that the positive underlying fundamentals for a number of commodities remain intact. There continues to be growth around the world, benefitting the industrial commodities. However, the financing of projects continues to be very difficult for any company, particularly the smaller ones, and so we have reduced our holdings in the smaller exploration companies, and increased the positions in cash-flowing, producing companies. We have also increased exposure to large-cap companies and to non-resource sectors.
In the Semi-Annual letter, we mentioned two particular companies that were continuing to experience difficulties - Continental Energy and GeoPetro Resources. We are pleased to report that both have made important progress since then. Continental Energy in June 2013 completed the acquisition of a majority interest in a privately held Norwegian holding company, whose subsidiaries operate established off-shore oil and gas service operations such as engineering, construction and maintenance of drilling rigs. These have historically been in the North Sea, and the companies are expanding into the Middle East and Southeast Asia. This provides Continental an interest in an operating, cash-flowing company, and should be very beneficial. GeoPetro announced a merger with a Southern California based energy company, which is also positive.
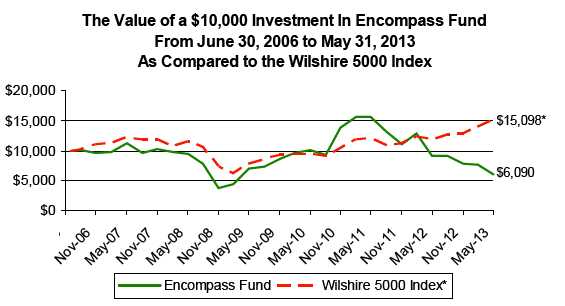
For the year ended May 31, 2013 the Fund declined 33.41% while the Fund's benchmark, The Wilshire 5000 Index, gained 27.51% .
2013 Annual Report 2
We know that this has been a very trying time for the Fund and its investors, as it has been for us. We truly appreciate your support and confidence.
We also want to extend a thank you to the Fund's Trustees and administrative service providers for their support and guidance. They are listed on the back cover of this report.
Yours Very Truly,

Malcolm H. Gissen Marshall G. Berol
2013 Annual Report 3
Encompass Fund (Unaudited)
| PERFORMANCE INFORMATION | ||||||||
| May 31, 2013 NAV $5.92 | ||||||||
| TOTAL RATE OF RETURN (%) FOR PERIODS ENDED MAY 31, 2013. | ||||||||
| Since | ||||||||
| 1 Year(A) | 3 Year(A) | 5 Year(A) | Inception(A) | |||||
| Encompass Fund | -33.41% | -15.26% | -8.51% | -6.92% | ||||
| Wilshire 5000 Index(B) | 27.51% | 16.72% | 5.65% | 6.14% | ||||
(A)1 Year, 3 Year, 5 Year and Since Inception returns include change in share prices and in each case includes reinvestment of any dividends and capital gain distributions. 1 Year, 3 Year, 5 Year and Since Inception returns are annualized for periods greater than one year. The inception date of the Encompass Fund was June 30, 2006.
(B)Wilshire 5000 Index measures the performance of all U.S. headquartered equity securities with readily available price data. Over 5,000 capitalization weighted security returns are used to adjust the index. The composition of the Wilshire 5000 Index is different from the Fund.
PAST PERFORMANCE DOES NOT GUARANTEE FUTURE RESULTS. INVESTMENT RETURN AND PRINCIPAL VALUE WILL FLUCTUATE SO THAT SHARES, WHEN REDEEMED, MAY BE WORTH MORE OR LESS THAN THEIR ORIGINAL COST. RETURNS DO NOT REFLECT THE DEDUCTION OF TAXES THAT A SHAREHOLDER WOULD PAY ON FUND DISTRIBUTIONS OR THE REDEMPTION OF FUND SHARES. CURRENT PERFORMANCE MAY BE LOWER OR HIGHER THAN THE PERFORMANCE DATA QUOTED. TO OBTAIN PERFORMANCE DATA CURRENT TO THE MOST RECENT MONTH END, PLEASE CALL 1-888-463-3957.
2013 Annual Report 4
Encompass Fund
Encompass Fund
By Sectors Based on Percentage of Net Assets
(UNAUDITED)
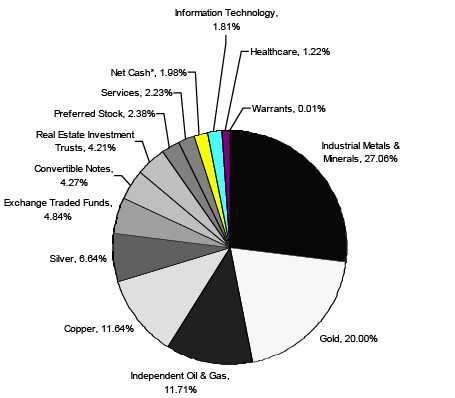
*Net Cash represents cash equivalents and other assets less liabilities.
Availability of Quarterly Schedule of Investments
(Unaudited)
The Fund files its complete schedule of portfolio holdings with the Securities and Exchange Commission ("SEC") for the first and third quarters of each fiscal year on Form N-Q. The Fund’s Forms N-Q are available on the SEC's Web site at http://www.sec.gov. The Fund’s Forms N-Q also may be reviewed and copied at the SEC's Public Reference Room in Washington, DC. Information on the operation of the Public Reference Room may be obtained by calling 1-800-SEC-0330.
Proxy Voting Guidelines
(Unaudited)
Brick Asset Management, Inc., the Fund’s Adviser, is responsible for exercising the voting rights associated with the securities held by the Fund. A description of the policies and procedures used by the Adviser in fulfilling this responsibility is available without charge on the Fund’s website at www.encompassfunds.com or is also available without charge, upon request, by calling our toll free number (1-888-463-3957). It is also included in the Fund’s Statement of Additional Information, which is available on the Securities and Exchange Commission’s website at http://www.sec.gov.
Information regarding how the Fund voted proxies, Form N-PX, relating to portfolio securities during the most recent 12-month period ended June 30 is available without charge, upon request, by calling our toll free number (1-888-463-3957). This information is also available on the Securities and Exchange Commission’s website at http://www.sec.gov.
2013 Annual Report 5
Expense Example
(Unaudited)
Shareholders of this Fund incur ongoing costs consisting of management fees and service fees. Although the Fund charges no sales loads or transaction fees, you will be assessed fees for outgoing wire transfers, returned checks and stop payment orders at prevailing rates charged by Mutual Shareholder Services, LLC, the Fund’s transfer agent. IRA accounts will be charged an $8.00 annual maintenance fee. If shares are redeemed within 90 days of purchase from the Fund, the shares are subject to a 2% redemption fee. The following example is intended to help you understand your ongoing costs of investing in the Fund and to compare these costs with similar costs of investing in other mutual funds. The example is based on an investment of $1,000 invested in the Fund on December 1, 2012 and held through May 31, 2013.
The first line of the table below provides information about actual account values and actual expenses. In order to estimate the expenses a shareholder paid during the period covered by this report, shareholders can divide their account value by $1,000 (for example, an $8,600 account value divided by $1,000 = 8.6) and then multiply the result by the number in the first line under the heading entitled "Expenses Paid During the Period."
The second line of the table below provides information about hypothetical account values and hypothetical expenses based on the Fund's actual expense ratio and an assumed rate of return of 5% per year before expenses, which is not the Fund’s actual return. The hypothetical account values and expenses may not be used to estimate the actual ending account balance or expenses paid by a shareholder for the period. Shareholders may use this information to compare the ongoing costs of investing in this Fund and other funds. To do so, compare this 5% hypothetical example with the 5% hypothetical examples that appear in other funds' shareholder reports.
Please note that the expenses shown in the table are meant to highlight your ongoing costs only and do not reflect any transactional costs, such as the annual maintenance fee charged to IRA accounts, redemption fees, or exchange fees. Therefore, the second line of the table is useful in comparing ongoing costs only, and will not help you determine the relative total costs of owning different funds. In addition, if these transactional costs were included, your costs would have been higher.
| Expenses Paid | ||||||
| Beginning | Ending | During the Period* | ||||
| Account Value | Account Value | December 1, 2012 | ||||
| December 1, 2012 | May 31, 2013 | to May 31, 2013 | ||||
| Actual | $1,000.00 | $776.90 | $6.42 | |||
| Hypothetical | $1,000.00 | $1,017.70 | $7.29 | |||
| (5% annual return | ||||||
| before expenses) | ||||||
| * Expenses are equal to the Fund’s annualized expense ratio of 1.45%, multiplied by the average account value over the period, multiplied by 182/365 (to reflect the half year period). |
2013 Annual Report 6
| Encompass Fund | |||||
| Schedule of Investments | |||||
| May 31, 2013 | |||||
| Shares/Principal Amount | Fair Value | % of Net Assets | |||
| COMMON STOCKS | |||||
| Coal Mining & Processing | |||||
| 35,700 | Forbes & Manhattan Coal Corp. * (Canada) | $ | 19,336 | 0.37 | % |
| Communications Equipment | |||||
| 1,500 | QUALCOMM Incorporated | 95,220 | 1.81 | % | |
| Copper Mining & Processing | |||||
| 500,000 | Boxxer Gold Corp. * (Canada) | 21,762 | |||
| 800,000 | Excelsior Mining Corp. * (Canada) | 123,803 | |||
| 800,000 | International PBX Ventures Ltd. * (Canada) | 19,344 | |||
| 1,077,500 | Redhawk Resources, Inc. * (Canada) | 448,133 | |||
| 613,042 | 11.64 | % | |||
| Drug Delivery Systems | |||||
| 150,000 | Delcath Systems, Inc. * | 64,350 | 1.22 | % | |
| Gold Exploration & Mining | |||||
| 191,000 | Aguila American Gold Ltd. * (Canada) | 4,619 | |||
| 90,000 | Atacama Pacific Gold Corp. * (Canada) | 152,336 | |||
| 446,100 | Brazil Resources Inc. * (Canada) | 396,955 | |||
| 49,500 | Brazil Resources Inc. * (Restricted) (Canada) | 39,642 | |||
| 337,000 | Caza Gold Corp. * (Canada) | 21,188 | |||
| 6,903 | Comstock Mining, Inc. * | 14,220 | |||
| 250,000 | Corex Gold Corp. * (Canada) | 14,508 | |||
| 183,412 | Endeavour Mining Corp. * (Canada) | 163,207 | |||
| 150,000 | Gold Standard Ventures Corp. * (Canada) | 125,835 | |||
| 375,000 | Telson Resources Inc. * (Canada) | 16,322 | |||
| 5,860 | Yamana Gold Inc. (Canada) | 67,624 | |||
| 1,016,456 | 19.29 | % | |||
| Gold & Silver Ores | |||||
| 7,000 | Primero Mining Corp. * (Canada) | 37,520 | 0.71 | % | |
| Home Builders | |||||
| 4,500 | D.R. Horton, Inc. | 109,620 | 2.08 | % | |
| Industrial Metals & Minerals | |||||
| 258,500 | American Vanadium Corp. * (Canada) | 192,519 | |||
| 137,500 | Avalon Rare Metals Inc. * (Canada) | 122,375 | |||
| 790,000 | Aztec Metals Corp. * ** (Restricted) (Canada) | 31,600 | |||
| 550,000 | Dacha Strategic Metals Inc. * (Canada) | 79,795 | |||
| 253,000 | Standard Graphite Corporation * (Canada) | 14,682 | |||
| 239,958 | United States Antimony Corp. * | 343,140 | |||
| 784,111 | 14.88 | % | |||
| Lumber & Wood Products (No Furniture) | |||||
| 6,000 | International Forest Products Ltd. * (Canada) | 55,247 | 1.05 | % | |
| Oil & Gas Exploration & Production | |||||
| 543,000 | Border Petroleum Corp. * (Canada) | 7,878 | |||
| 1,400,000 | Continental Energy Corp. * (Canada) | 70,000 | |||
| 6,250 | DeeThree Exploration Ltd. * (Canada) | 42,739 | |||
| 2,377,946 | GeoPetro Resources Company * | 164,078 | |||
| 40,000 | GreenHunter Resources, Inc. * | 45,200 | |||
| 89,000 | Magnum Hunter Resources Corp. * | 305,270 | |||
| 55,000 | NiMin Energy Corp. * (Canada) | 3,724 | |||
| 300,000 | Petrodorado Energy Ltd. * (Canada) | 23,213 | |||
| 662,102 | 12.57 | % | |||
| Real Estate Development | |||||
| 972,500 | 360 VOX Corporation * (Canada) | 117,577 | 2.23 | % | |
| Silver Mining and Processing | |||||
| 75,000 | Paramount Gold and Silver Corp. * | 112,500 | |||
| 10,000 | Silver Wheaton Corp. (Canada) | 237,200 | |||
| 349,700 | 6.64 | % | |||
| * Non-Income producing securities during the period. ** The value of Aztec Metals Corp. is determined based on the security’s last offering price and management’s understanding of the company’s current financial situation. Level 3 security. See Note 3. |
| The accompanying notes are an integral part of these financial statements. |
2013 Annual Report 7
| Encompass Fund | ||||||
| Schedule of Investments | ||||||
| May 31, 2013 | ||||||
| Shares/Principal Amount | Fair Value | % of Net Assets | ||||
| COMMON STOCKS | ||||||
| Uranium Mining & Exploration | ||||||
| 100,000 | European Uranium Resources Ltd. * (Canada) | $ | 25,631 | |||
| 164,000 | Strateco Resources Inc. * (Canada) | 11,104 | ||||
| 150,000 | Uranium Energy Corp. * | 321,000 | ||||
| 50,000 | UR-Energy Inc. * | 54,000 | ||||
| 411,735 | 7.82 | % | ||||
| Total for Common Stocks (Cost - $7,806,986) | 4,336,016 | 82.31 | % | |||
| CONVERTIBLE NOTES | ||||||
| 250,000 | Continental Energy Corp., 18%, 9/16/2013 (Restricted) (Canada) **** | 225,000 | ||||
| Total for Convertible Notes Securities (Cost - $250,000) | 225,000 | 4.27 | % | |||
| EXCHANGE TRADED FUNDS | ||||||
| 1,400 | ProShares Ultra Dow30SM | 133,238 | ||||
| 1,250 | ProShares Ultra Nasdaq Biotechnology * | 121,950 | ||||
| Total for Exchange Traded Funds (Cost - $232,558) | 255,188 | 4.84 | % | |||
| PREFERRED STOCK | ||||||
| 100 | Comstock Mining Inc., 7.5% Series B Convertible Preferred | 124,848 | ||||
| Total for Preferred Stock (Cost - $100,000) | 124,848 | 2.38 | % | |||
| REAL ESTATE INVESTMENT TRUSTS | ||||||
| 16,800 | Ashford Hospitality Trust Inc. | 221,928 | ||||
| Total for Real Estate Investment Trusts (Cost - $108,385) | 221,928 | 4.21 | % | |||
| WARRANTS | ||||||
| 41,750 | American Vanadium Corp. * (expires 3-12-2014) (a) | $ | - | |||
| 245,000 | Aztec Metals Corp. * (Restricted) (expires 1-28-2014) (b) | - | ||||
| 142,500 | Canadian Overseas Petroleum Ltd. * (expires 12-1-2013) (c) | - | ||||
| 1,562,500 | Continental Energy Corp. * (Restricted) (expires 3-21-2015) (d) | - | ||||
| 15,000 | Delcath Systems, Inc. * (expires 5-31-2015) (e) | - | ||||
| 25,000 | Estrella Intl. Energy Svs. Ltd. * (expires 3-3-2015) (f) | - | ||||
| 262,500 | GeoPetro Resources Company * *** (expires 9-30-2013) (g) | - | ||||
| 116,700 | GeoPetro Resources Company * *** (expires 12-31-2013) (h) | - | ||||
| 62,500 | GeoPetro Resources Company * *** (expires 12-23-2013) (i) | - | ||||
| 575,000 | GeoPetro Resources Company * *** (expires 3-2-2014) (j) | - | ||||
| 227,273 | GeoPetro Resources Company * *** (expires 4-28-2014) (k) | - | ||||
| 200,000 | International PBX Ventures Ltd. * (expires 2-8-2014) (l) | - | ||||
| 7,772 | Magnum Hunter Resources Corp. * (expires 10-14-2013) (m) | 777 | ||||
| 800,000 | Nortec Minerals Corp. * (expires 7-7-2013) (n) | - | ||||
| *Non-Income producing securities during the period. *** Security exempt from registration pursuant to Rule 144A under the Securities Act of 1933. This security represents 0% of the portfolio at May 31, 2013 and is considered liquid and may be resold in transactions exempt from registration, normally to qualified institutional buyers. **** The value of the Continental Energy Corp. Convertible Note is on an "as if converted" basis, based on the stock's market price from time to time (with a 10% restricted stock discount). That valuation method was put into effect on November 9, 2012, and con- tinues. Level 3 security. See Note 3. (a) American Vanadium Corp. warrants expire March 12, 2014, with an exercise price of $1.00 Canadian. (b) Aztec Metals Corp. warrants expire January 28, 2014, with an exercise price of $0.075 Canadian. (c) Canadian Overseas Petroleum Limited warrants expire December 1, 2013, with an exercise price of $0.65 Canadian. (d) Continental Energy Corp. warrants expire March 21, 2015 with an exercise price of $0.08. (e) Delcath Systems, Inc. warrants expire May 31, 2015, with an exercise price of $1.20. (f) Estrella Intl. Energy Svs. Ltd. warrants expire March 3, 2015, with an exercise price of $1.50 Canadian. (g) GeoPetro Resources Company warrants expire September 30, 2013, with an exercise price of $0.75. (h) GeoPetro Resources Company warrants expire December 31, 2013, with an exercise price of $0.75. (i) GeoPetro Resources Company warrants expire December 23, 2013, with an exercise price of $0.50. (j) GeoPetro Resources Company warrants expire March 2, 2014, with an exercise price of $0.75. (k) GeoPetro Resources Company warrants expire April 28, 2014, with an exercise price of $1.00. (l) International PBX Ventures Ltd. warrants expire February 8, 2014, with an exercise price of $0.25 Canadian. (m) Magnum Hunter Resources Corp. warrants expire October 14, 2013, with an exercise price of $10.50. (n) Nortec Minerals Corp. warrants expire July 7, 2013, with an exercise price of $0.20 Canadian. |
| The accompanying notes are an integral part of these financial statements. |
2013 Annual Report 8
| Encompass Fund | ||||||
| Schedule of Investments | ||||||
| May 31, 2013 | ||||||
| Shares/Principal Amount | Fair Value | % of Net Assets | ||||
| WARRANTS | ||||||
| 187,500 | Telson Resources Inc. * (expires 8-9-2013) (o) | $ | - | |||
| 75,000 | United States Antimony Corp. * (expires 1-20-2014) (p) | - | ||||
| 7,500 | United States Antimony Corp. * (Restricted) (expires 6-29-2014) (q) | - | ||||
| Total for Warrants (Cost - $0) | 777 | 0.01 | % | |||
| MONEY MARKET FUNDS | ||||||
| 106,667 | Fidelity Institutional Money Market Portfolio 0.26% ***** | 106,667 | ||||
| Total for Money Market Funds (Cost - $106,667) | 106,667 | 2.02 | % | |||
| Total Investments | 5,270,424 | 100.04 | % | |||
| (Cost - $8,604,596) | ||||||
| Liabilities in Excess of Other Assets | (1,909 | ) | -0.04 | % | ||
| Net Assets | $ | 5,268,515 | 100.00 | % | ||
| * Non-Income producing securities during the period. ***** Variable rate security; the coupon rate shown represents the rate at May 31, 2013. (o) Telson Resources Inc. warrants expire August 9, 2013, with an exercise price of $1.40 Canadian. (p) United States Antimony Corp. warrants expire January 20, 2014, with an exercise price of $2.50. (q) United States Antimony Corp. warrants expire June 29, 2014, with an exercise price of $2.50. |
| The accompanying notes are an integral part of these financial statements. |
2013 Annual Report 9
| Encompass Fund | |||
| Statement of Assets and Liabilities | |||
| May 31, 2013 | |||
| Assets: | |||
| Investment Securities at Fair Value | $ | 5,270,424 | |
| (Cost - $8,604,596) | |||
| Cash | 1,000 | ||
| Receivables: | |||
| Securities Sold | 12,712 | ||
| Dividends and Interest | 2 | ||
| Total Assets | 5,284,138 | ||
| Liabilities: | |||
| Management Fees Payable | 2,860 | ||
| Service Fees Payable | 1,945 | ||
| Payable for Shareholder Redemptions | 10,818 | ||
| Total Liabilities | 15,623 | ||
| Net Assets | $ | 5,268,515 | |
| Net Assets Consist of: | |||
| Paid In Capital | $ | 11,580,869 | |
| Accumulated Net Investment Loss | (38,435 | ) | |
| Accumulated Realized Loss on Investments - Net | (2,939,747 | ) | |
| Unrealized Depreciation in Value of Investments | |||
| Based on Identified Cost - Net | (3,334,172 | ) | |
| Net Assets, for 889,409 Shares Outstanding | $ | 5,268,515 | |
| (Unlimited number of shares authorized without par value) | |||
| Net Asset Value Per Share ($5,268,515/889,409 shares) | $ | 5.92 | |
| Redemption Price ($5.92 x 0.98) (Note 2) | $ | 5.80 | |
| Statement of Operations | |||
| For the fiscal year ended May 31, 2013 | |||
| Investment Income: | |||
| Dividends (a) | $ | 10,923 | |
| Interest | 16,452 | ||
| Total Investment Income | 27,375 | ||
| Expenses: | |||
| Management Fees (Note 4) | 84,601 | ||
| Service Fees (Note 4) | 38,070 | ||
| Total Expenses | 122,671 | ||
| Net Investment Loss | (95,296 | ) | |
| Realized and Unrealized Loss on Investments: | |||
| Realized Loss on Investments | (2,453,196 | ) | |
| Change in Unrealized Depreciation on Investments | (455,079 | ) | |
| Net Realized and Unrealized Loss on Investments | (2,908,275 | ) | |
| Net Decrease in Net Assets Resulting from Operations | $ | (3,003,571 | ) |
| (a) Net of foreign taxes withheld $726. The accompanying notes are an integral part of these financial statements. |
2013 Annual Report 10
| Encompass Fund | |||||||
| Statements of Changes in Net Assets | |||||||
| 6/1/2012 | 6/1/2011 | ||||||
| to | to | ||||||
| 5/31/2013 | 5/31/2012 | ||||||
| Increase/(Decrease) in Net Assets from Operations: | |||||||
| Net Investment Income/(Loss) | $ | (95,296 | ) | $ | (136,598 | ) | |
| Net Realized Gain/(Loss) on Investments | (2,453,196 | ) | (227,441 | ) | |||
| Realized Gain/(Loss) on Option Transactions | - | 11,400 | |||||
| Unrealized Appreciation/(Depreciation) on Investments | (455,079 | ) | (9,515,505 | ) | |||
| Unrealized Appreciation/(Depreciation) on Options | - | (5,400 | ) | ||||
| Net Increase/(Decrease) in Net Assets Resulting from Operations | (3,003,571 | ) | (9,873,544 | ) | |||
| Distributions to Shareholders from: | |||||||
| Net Investment Income | - | - | |||||
| Total Distributions Paid to Shareholders | - | - | |||||
| Capital Share Transactions: | |||||||
| Proceeds From Sale of Shares | 246,990 | 4,170,192 | |||||
| Proceeds From Redemption Fees (Note 2) | 2,862 | 25,684 | |||||
| Shares Issued on Reinvestment of Dividends | - | - | |||||
| Cost of Shares Redeemed | (3,220,171 | ) | (10,545,287 | ) | |||
| Net Increase/(Decrease) from Shareholder Activity | (2,970,319 | ) | (6,349,411 | ) | |||
| Total Increase/(Decrease) | (5,973,890 | ) | (16,222,955 | ) | |||
| Net Assets at Beginning of Period | 11,242,405 | 27,465,360 | |||||
| Net Assets at End of Period (Including undistributed net investment | $ | 5,268,515 | $ | 11,242,405 | |||
| income/(loss) of ($38,435) and $0, respectively.) | |||||||
| Share Transactions: | |||||||
| Issued | 30,964 | 326,009 | |||||
| Reinvested | - | - | |||||
| Redeemed | (406,035 | ) | (873,673 | ) | |||
| Net Increase/(Decrease) in Shares | (375,071 | ) | (547,664 | ) | |||
| Shares Outstanding Beginning of Period | 1,264,480 | 1,812,144 | |||||
| Shares Outstanding End of Period | 889,409 | 1,264,480 | |||||
| Financial Highlights | |||||||||||||||
| Selected data for a share of capital stock outstanding | 6/1/2012 | 6/1/2011 | 6/1/2010 | 6/1/2009 | 6/1/2008 | ||||||||||
| throughout the period: | to | to | to | to | to | ||||||||||
| 5/31/2013 | 5/31/2012 | 5/31/2011 | 5/31/2010 | 5/31/2009 | |||||||||||
| Net Asset Value - | |||||||||||||||
| Beginning of Period | $ | 8.89 | $ | 15.16 | $ | 9.73 | $ | 6.76 | $ | 9.39 | |||||
| Net Investment Income (Loss) (a) | (0.09 | ) | (0.09 | ) | (0.13 | ) | (0.06 | ) | 0.04 | ||||||
| Net Gains or Losses on Securities | |||||||||||||||
| (realized and unrealized) | (2.88 | ) | (6.20 | ) | 5.53 | 3.03 | (2.61 | ) | |||||||
| Total from Investment Operations | (2.97 | ) | (6.29 | ) | 5.40 | 2.97 | (2.57 | ) | |||||||
| Less Distributions from: | |||||||||||||||
| Net Investment Income | 0.00 | 0.00 | 0.00 | 0.00 | (0.06 | ) | |||||||||
| Return of Capital | 0.00 | 0.00 | 0.00 | 0.00 | 0.00 | ||||||||||
| Total Distributions | 0.00 | 0.00 | 0.00 | 0.00 | (0.06 | ) | |||||||||
| Proceeds from Redemption Fee (Note 2) | 0.00 | * | 0.02 | 0.03 | 0.00 | * | 0.00 | ||||||||
| Net Asset Value - | |||||||||||||||
| End of Period | $ | 5.92 | $ | 8.89 | $ | 15.16 | $ | 9.73 | $ | 6.76 | |||||
| Total Return (b) | (33.41 | )% | (41.36 | )% | 55.81 | % | 43.93 | % | (26.81 | )% | |||||
| Ratios/Supplemental Data | |||||||||||||||
| Net Assets - End of Period (Thousands) | $ | 5,269 | $ | 11,242 | $ | 27,465 | $ | 8,495 | $ | 3,458 | |||||
| Ratio of Expenses to Average Net Assets | 1.45 | % | 1.45 | % | 1.45 | % | 1.45 | % | 1.45 | % | |||||
| Ratio of Net Income (Loss) to Average Net Assets | (1.13 | )% | (0.78 | )% | (0.96 | )% | (0.67 | )% | 0.67 | % | |||||
| Portfolio Turnover Rate | 24.37 | % | 27.82 | % | 25.57 | % | 21.50 | % | 37.56 | % |
| * Amount calculated is less than $0.005. (a) Calculated using the average shares method. (b) Total return in the above table represents the rate that the investor would have earned or lost on an investment in the Fund assuming reinvestment of distributions to shareholders. |
| The accompanying notes are an integral part of these financial statements. |
2013 Annual Report 11
NOTES TO FINANCIAL STATEMENTS
ENCOMPASS FUND
MAY 31, 2013
1.) ORGANIZATION
Encompass Fund (the "Fund") is a non-diversified series of the Encompass Funds (the "Trust"), and is registered under the Investment Company Act of 1940 as an open-end management investment company. The Trust was organized as an Ohio business trust on March 26, 2006, and may offer shares of beneficial interest in a number of separate series, each series representing a distinct fund with its own investment objectives and policies. At present, the Fund is the only series authorized by the Trust. The Fund commenced operations on June 30, 2006. The Fund’s investment adviser is Brick Asset Management, Inc. (the “Adviser”). The Fund's investment objective is long-term capital appreciation.
2.) SIGNIFICANT ACCOUNTING POLICIES
SECURITY VALUATION: All investments in securities are recorded at their estimated fair value, as described in note 3.
SHARE VALUATION: The net asset value (the “NAV”) is generally calculated as of the close of trading on the New York Stock Exchange (normally 4:00 p.m. Eastern time) every day the Exchange is open. The NAV is calculated by taking the total value of the Fund’s assets, subtracting its liabilities, and then dividing by the total number of shares outstanding, rounded to the nearest cent. The offering price and redemption price per share is equal to the net asset value per share, except that shares of each fund are subject to a redemption fee of 2% if redeemed within 90 days of purchase. To discourage large and frequent short-term trades by investors, and to compensate the Fund for costs that may be incurred by such trades, the Fund imposed the redemption fee. During the fiscal year ended May 31, 2013 proceeds from redemption fees were $2,862.
FOREIGN CURRENCY: Investment securities and other assets and liabilities denominated in foreign currencies are translated into U.S. dollar amounts at the date of valuation. Purchases and sales of investment securities and income and expense items denominated in foreign currencies are translated into U.S. dollar amounts on the respective dates of such transactions.
The Fund does not isolate that portion of the results of operations resulting from changes in foreign exchange rates on investments from the fluctuations arising from changes in market prices of securities held. Such fluctuations are included with the net realized and unrealized gain or loss from investments.
Net realized foreign exchange gains or losses arise from sales of foreign currencies, currency gains or losses realized between the trade and settlement dates on securities transactions, and the difference between the amounts of dividends, interest, and foreign withholding taxes recorded on the Fund's books and the U.S. dollar equivalent of the amounts actually received or paid. Net unrealized foreign exchange gains and losses arise from changes in the fair values of assets and liabilities, other than investments in securities at fiscal period end, resulting from changes in exchange rates.
SHORT SALES: The Fund may sell a security it does not own in anticipation of a decline in the fair value of that security. When the Fund sells a security short, it must borrow the security sold short and deliver it to the broker-dealer through which it made the short sale. A gain, limited to the price at which the Fund sold the security short, or a loss, unlimited in size, will be recognized upon the termination of a short sale.
OPTION WRITING: When the Fund writes an option, an amount equal to the premium received by the Fund is recorded as a liability and is subsequently adjusted to the current fair value of the option written. Premiums received from writing options that expire unexercised are treated by the Fund on the expiration date as realized gains from investments. The difference between the premium and the amount paid on effecting a closing purchase transaction, including brokerage commissions, is also treated as a realized gain, or, if the premium is less than the amount paid for the closing transaction, as a realized loss. If a call option is exercised, the premium is added to the proceeds from the sale of the underlying security or currency in determining whether the Fund has realized a gain or loss. If a put option is exercised, the premium reduces the cost basis of the securities purchased by the Fund. The Fund as a writer of an option bears the market risk of an unfavorable change in the price of the security underlying the written option. See Note 6 for additional disclosure on options transactions.
RESTRICTED SECURITIES: The Fund held the following Restricted Securities at May 31, 2013, the sale of which are restricted. The investments have been valued by the Adviser pursuant to the Fund’s Good Faith Pricing Guidelines at the following prices, after considering various pertinent factors, including the discount to the trading price of the common stock at which the Units were purchased; the restrictions on the sale of the Units; and the market price of the stock relative to the exercise price of the warrant. It is possible that the estimated value may differ significantly from the amount that might ultimately be realized and the difference could be material.
2013 Annual Report 12
| Notes to Financial Statements - continued | |||||||
| Acquisition | Fair Value | ||||||
| Restricted Security | Date | Cost | Units | per Unit | Fair Value | ||
| Aztec Metals Corp. | 3/11/2010 | $ 39,085 | 790,000 | 0.040 | 31,600 | ||
| Aztec Metals Corp. - Warrants | 1/8/2010 | 0 | 245,000 | 0.000 | 0 | ||
| Brazil Resources Inc. | 9/21/2010 | 16,775 | 49,500 | 0.801 | 39,642 | ||
| Continental Energy Corp. * | 9/19/2011 | 250,000 | 250,000 | 0.900 | 225,000 | ||
| Continental Energy Corp. - Warrants | 9/28/2011 | 0 | 1,562,500 | 0.000 | 0 | ||
| GeoPetro Resources Company - Warrants | 9/20/2010 | 0 | 262,500 | 0.000 | 0 | ||
| GeoPetro Resources Company - Warrants | 12/31/2010 | 0 | 116,700 | 0.000 | 0 | ||
| GeoPetro Resources Company - Warrants | 3/2/2011 | 0 | 62,500 | 0.000 | 0 | ||
| GeoPetro Resources Company - Warrants | 3/2/2011 | 0 | 575,000 | 0.000 | 0 | ||
| GeoPetro Resources Company - Warrants | 5/12/2011 | 0 | 227,273 | 0.000 | 0 | ||
| United States Antimony Corp. - Warrants | 7/16/2012 | 0 | 7,500 | 0.000 | 0 | ||
| $296,242 | |||||||
| * Convertible Note 18% 9/16/2013. | |||||||
The restricted securities, including those securities exempt from registration pursuant to Rule 144A under the Securities Act of 1933, represented 5.62% of the Fund’s net assets at May 31, 2013. The Fund has no right to require registration of unregistered securities. Securities exempt from registration pursuant to Rule 144A under the Securities Act of 1933 have been identified on the Schedule of Investments.
SECURITY LOANS: The Fund may make long and short term loans of its portfolio securities to parties such as broker-dealers, banks or institutional investors. The Fund would receive compensation in the form of fees, or it would retain a portion of interest on the investment of any cash received as collateral. The Fund continues to receive interest or dividends on the securities loaned. The loans are secured by collateral at least equal, at all times, to the fair value of the securities loaned plus accrued interest. Gain or loss in the fair value of the securities loaned that may occur during the term of the loan will be for the account of the Fund. The Fund has the right under the lending agreement to recover the securities from the borrower on demand.
SECURITY TRANSACTION TIMING: Security transactions are recorded on a trade date basis. Dividend income is recognized on the ex-dividend date. Interest income is recognized on an accrual basis. Discounts and premiums on securities purchased are amortized over the life of the respective securities. Withholding taxes on foreign dividends have been provided for in accordance with the Fund’s understanding of the applicable country’s tax rules and rates.
FEDERAL INCOME TAXES: The Fund’s policy is to comply with the requirements of Subchapter M of the Internal Revenue Code that are applicable to regulated investment companies and to distribute all of its taxable income to its shareholders. Therefore, no federal income tax provision is required. It is the Fund's policy to distribute annually, prior to the end of the calendar year, dividends sufficient to satisfy excise tax requirements of the Internal Revenue Service. This Internal Revenue Service requirement may cause an excess of distributions over the book year-end accumulated income. In addition, it is the Fund's policy to distribute annually, after the end of the fiscal year, any remaining net investment income and net realized capital gains.
The Fund recognizes the tax benefits of certain tax positions only where the position is “more likely than not” to be sustained assuming examination by tax authorities. Management has analyzed the Fund’s tax positions, and has concluded that no liability for unrecognized tax benefits should be recorded related to uncertain tax positions taken on returns filed for open tax years (2010-2012), or expected to be taken on the Fund’s 2013 tax return. The Fund identifies its major tax jurisdictions as U.S. Federal and State tax authorities; however the Fund is not aware of any tax positions for which it is reasonably possible that the total amounts of unrecognized tax benefits will change materially in the next twelve months.
DISTRIBUTIONS TO SHAREHOLDERS: Distributions to shareholders, which are determined in accordance with income tax regulations, are recorded on the ex-dividend date.
USE OF ESTIMATES: The preparation of financial statements in conformity with accounting principles generally accepted in the United States of America requires management to make estimates and assumptions that affect the reported amounts of assets and liabilities and disclosure of contingent assets and liabilities at the date of the financial statements and the reported amounts of increases and decreases in net assets from operations during the reporting period. Actual results could differ from those estimates.
RECLASSIFICATIONS: As of May 31, 2013, the Fund recorded a permanent book/tax difference of $56,861 from net investment loss to paid in capital. This reclassification has no impact on the net asset value of the Fund and is designed generally to present undistributed income and realized gains/(losses) on a tax basis, which is considered to be more informative to shareholders.
SUBSEQUENT EVENTS: Management has evaluated the impact of all subsequent events on the Fund through the date the issuance of these financial statements and has noted no such events requiring disclosure.
2013 Annual Report 13
Notes to Financial Statements - continued
3.) SECURITIES VALUATIONS
The Fund utilizes various methods to measure the fair value of most of its investments on a recurring basis. As required by the fair value topic of the FASB Accounting Standards Codification, fair value is defined as the price that the Fund would receive to sell an asset or pay to transfer a liability in an orderly transaction between market participants at the measurement date. The topic also establishes a framework for measuring fair value, and a three-level hierarchy for fair value measurements based upon the transparency of inputs to the valuation of an asset or liability. The three-tier hierarchy of inputs is summarized below:
Level 1 - Unadjusted quoted prices in active markets for identical assets or liabilities that the Fund has the ability to access.
Level 2 - Observable inputs other than quoted prices included in level 1 that are observable for the asset or liability, either directly or indirectly. These inputs may include quoted prices for the identical instrument on an inactive market, prices for similar instruments, interest rates, prepayment speeds, credit risk, yield curves, default rates and similar data.
Level 3 - Unobservable inputs for the asset or liability, to the extent relevant observable inputs are not available, representing the Fund’s own assumptions about the assumptions a market participant would use in valuating the asset or liability, and would be based on the best information available.
The following tables summarizes the inputs used to value the Fund’s assets measured at fair value as of May 31, 2013:
| Valuation Inputs of Assets | Level 1 | Level 2 | Level 3 | Total | ||||
| Common Stocks | $4,264,774 | $ 39,642 | $ 31,600 | $4,336,016 | ||||
| Convertible Notes | 0 | 0 | 225,000 | 225,000 | ||||
| Exchange Traded Funds | 255,188 | 0 | 0 | 255,188 | ||||
| Preferred Stock | 0 | 124,848 | 0 | 124,848 | ||||
| Real Estate Investment Trusts | 221,928 | 0 | 0 | 221,928 | ||||
| Warrants | 0 | 777 | 0 | 777 | ||||
| Money Market Funds | 106,667 | 0 | 0 | 106,667 | ||||
| Total | $4,848,557 | $165,267 | $256,600 | $5,270,424 |
Refer to the Fund’s Schedule of Investments for a listing of securities by industry. It is the Fund’s policy to consider transfers into or out of the levels as of the end of the reporting period.
The Fund’s assets assigned to level 3 input category are valued at fair value as determined in good faith under procedures established by and under the general supervision of the Board. To determine fair value, management will utilize the valuation technique that they deem the most appropriate in the circumstances. Securities valued at level 3 have been valued based upon a market approach in which management assesses quantitative factors, such as the last trade price and financial condition of the underlying issuer, as well as qualitative factors, such as reputation of the underlying issuer. Management reviews the subsequent trading activity to determine if the valuation techniques used were reasonable. For additional information regarding the techniques used to value the Fund’s level 3 investments, Aztec Metals Corp. and Continental Energy Corp. Convertible Note, please see the Fund’s Schedule of Investments.
The following is a reconciliation of assets for which level 3 inputs were used in determining value:
| Common Stock | ||
| Beginning balance at May 31, 2012 | $ | 31,600 |
| Total realized gain/(loss) | 0 | |
| Change in unrealized appreciation/(depreciation) | 0 | |
| Cost of Purchases | 0 | |
| Cost of Sales | 0 | |
| Net transfers in/(out) of level 3 from level 2 | 225,000 | |
| Ending balance at May 31, 2013 | $ | 256,600 |
The total change in unrealized appreciation (depreciation) included in the statement of operations attributable to level 3 investments still held at May 31, 2013 includes ($28,250).
The following table shows transfers between level 1 and level 2 of the fair value hierarchy:
| Transfers In | Transfers Out | ||||
| Level 1 | Level 2 | Level 1 | Level 2 | ||
| $22,886 | - | - | $22,886 | ||
Financial assets were transferred from level 2 to level 1 when the underlying positions were no longer restricted securities.
2013 Annual Report 14
Notes to Financial Statements - continued
FAIR VALUE MEASUREMENTS
A description of the valuation techniques applied to the Fund’s major categories of assets and liabilities measured at fair value on a recurring basis follows.
Equity securities (common stock including preferred stock, real estate investment trusts, warrants and exchange traded funds). Equity securities that are traded on any exchange or on the NAS-DAQ over-the-counter market are valued at the last quoted sale price. Lacking a last sale price, a security is valued at its last bid price except when, in the Adviser's opinion, the last bid price does not accurately reflect the current value of the security. All other securities for which over-the-counter market quotations are not readily available are valued at their last bid price. Generally, if the security is traded in an active market and is valued at the last sale price, the security is categorized as a level 1 security. When the security position is not considered to be part of an active market or when the security is valued at the bid price, the position is generally categorized as a level 2. When market quotations are not readily available, when the Adviser determines the last bid price does not accurately reflect the current value or when restricted securities are being valued, such securities are valued as determined in good faith by the Adviser, in conformity with guidelines adopted by and subject to review of the Board of Trustees and are generally categorized in level 2 or level 3 of the fair value hierarchy.
Money market securities. Money market securities are valued at a net asset value of $1.00 and are classified in level 1 of the fair value hierarchy.
Options. Option positions that are traded on any exchange or on the NASDAQ over-the-counter market are valued at the last quoted sale price. To the extent these option positions are actively traded and valuation adjustments are not applied, they are classified in level 1 of the fair value hierarchy. Lacking a last sale price, an option position, is valued at its last bid price except when, in the Adviser’s opinion, the last bid price does not accurately reflect the current value of the option position. When a bid price is used for valuation or when the security is not actively traded, those securities are valued at their last bid price and are generally categorized in level 2 of the fair value hierarchy.
Fixed income securities (including convertible notes). Fixed income securities generally are valued by using market quotations, but may be valued on the basis of prices furnished by a pricing service when the Adviser believes such prices accurately reflect the fair market value of such securities. A pricing service utilizes electronic data processing techniques based on yield spreads relating to securities with similar characteristics to determine prices for normal institutional-size trading units of debt securities without regard to sale or bid prices. If the Adviser decides that a price provided by the pricing service does not accurately reflect the fair market value of the securities, when prices are not readily available from a pricing service or when restricted or illiquid securities are being valued, securities are valued at fair value as determined in good faith by the Adviser, in conformity with guidelines adopted by and subject to review of the Board of Trustees and are generally categorized in level 2 or level 3 of the fair value hierarchy. Short term investments in fixed income securities with maturities of less than 60 days when acquired, or which subsequently are within 60 days of maturity, are valued by using the amortized cost method of valuation, which the Board of Trustees has determined will represent fair value.
In accordance with the Trust's good faith pricing guidelines, the Adviser is required to consider all appropriate factors relevant to the value of securities for which it has determined other pricing sources are not available or reliable as described above. There is no single standard for determining fair value, since fair value depends upon the circumstances of each individual case. As a general principle, the current fair value of an issue of securities being valued by the Adviser would appear to be the amount which the owner might reasonably expect to receive for them upon their current sale. Methods which are in accordance with this principle may, for example, be based on (i) a multiple of earnings; (ii) a discount from market of a similar freely traded security (including a derivative security or a basket of securities traded on other markets, exchanges or among dealers); or (iii) yield to maturity with respect to debt issues, or a combination of these and other methods.
4.) MANAGEMENT AND SERVICES AGREEMENTS
Under the terms of the Management Agreement between the Trust and the Adviser (the "Management Agreement"), the Adviser manages the investment portfolio of the Fund, subject to policies adopted by the Trust's Board of Trustees, and, at its own expense and without reimbursement from the Trust, furnishes office space and all necessary office facilities, equipment and executive personnel necessary for managing the Fund. For its services the Adviser receives an investment management fee equal to 1.00% of the average daily net assets of the Fund.
Under the terms of the Services Agreement between the Trust and the Adviser (the "Services Agreement"), the Adviser renders administrative and supervisory services to the Fund, provides the services of a chief compliance officer and assumes and pays all ordinary expenses of the Fund, except that the Fund pays all management fees, brokerage fees and commissions, taxes, borrowing costs (such as (a) interest and (b) dividend expenses on securities sold short), extraordinary or non-recurring expenses, Rule 12b-1 expenses (of which none were authorized as of May 31, 2013) and indirect expenses (such as fees and expenses of other funds in which the
2013 Annual Report 15
Notes to Financial Statements - continued
Fund may invest). For its services the Adviser receives a services fee equal to 0.45% of the average daily net assets of the Fund.
For the fiscal year ended May 31, 2013, the Adviser earned management fees totaling $84,601, of which $2,860 was still due to the Adviser at May 31, 2013. For the same period the Adviser earned services fees of $38,070, of which $1,945 was still due to the Adviser at May 31, 2013.
Trustees who are not interested persons of the Fund were paid a total of $6,000 in Trustees’ fees by the Fund's Adviser for the fiscal year ended May 31, 2013.
5.) INVESTMENT TRANSACTIONS
For the fiscal year ended May 31, 2013, purchases and sales of investment securities other than U.S. Government obligations and short-term investments aggregated $1,907,866 and $4,868,350 respectively. Purchases and sales of U.S. Government obligations aggregated $0 and $0, respectively.
6.) PUT & CALL OPTIONS
The Fund did not invest in any derivative instruments during the fiscal year ended May 31, 2013.
7.) TAX MATTERS
There were no distributions paid during the fiscal years ended May 31, 2013 and 2012.
As of May 31, 2013, the tax basis components of distributable earnings, unrealized appreciation (depreciation) and cost of investment securities were as follows:
| Deferred late year ordinary losses * | $ | 38,435 | |
| Capital loss carryforwards expire as follows: No expiration - short-term+ | $ | 326,266 | |
| No expiration - long-term | 789,214 | ||
| 2017 | 34,939 | ||
| 2018 | 202,382 | ||
| $ | 1,352,801 | ||
| Gross unrealized appreciation on investment securities | $ | 1,130,598 | |
| Gross unrealized depreciation on investment securities | (4,464,770 | ) | |
| Net unrealized depreciation on investment securities | ($ | 3,334,172 | ) |
| Cost of investment securities including short term investments | $ | 8,604,596 | |
| Post October losses deferred * | $ | 1,586,948 | |
+ The capital loss carryforwards will be used to offset any capital gains realized by the Fund in future years through the expiration date, if any. The Fund will not make distributions from capital gains while a capital loss carryforward remains. Under the Regulated Investment Company Modernization Act of 2010, funds are permitted to carry forward capital losses incurred in taxable years beginning after December 22, 2010 for an unlimited period. However, any losses incurred during those future taxable years will be required to be utilized prior to the losses incurred in pre-enactment taxable years. As a result of this pre-enactment capital loss carry forwards may be more likely to expire unused. Additionally, post-enactment capital losses that are carried forward retain their character as either short-term or long-term capital losses rather than being considered all short-term as under previous law.
* These deferrals are considered incurred in the subsequent year.
As of May 31, 2013, there are no differences between book basis and tax basis cost of investments.
8.) CAPITAL SHARES
The Trust is authorized to issue an unlimited number of shares. Paid in capital at May 31, 2013 was $11,580,869 representing 889,409 shares outstanding.
9.) CONTROL OWNERSHIP
The beneficial ownership, either directly or indirectly, of more than 25% of the voting securities of a fund creates a presumption of control of the fund under Section 2(a)(9) of the Investment Company Act of 1940. As of May 31, 2013, Charles Schwab & Co. Inc., located at 101 Montgomery Street, San Francisco, CA, 94101, held for the benefit of others, in aggregate, approximately 61.00% of the Fund and therefore may be deemed to control the Fund.
10.) NEW ACCOUNTING PRONOUNCEMENT
In December 2011, the Financial Accounting Standards Board (FASB) issued Accounting Standards Update ("ASU") No. 2011-11 (the "Pronouncement") related to disclosures about offsetting assets and liabilities. The amendments in this ASU require an entity to disclose informa-
2013 Annual Report 16
Notes to Financial Statements - continued
tion about offsetting and related arrangements to enable users of its financial statements to understand the effect of those arrangements on its financial position. The ASU is effective for annual reporting periods beginning on or after January 1, 2013, and interim periods within those annual periods. The Pronouncement requires retrospective application for all comparative periods presented. Management is currently evaluating the impact that this Pronouncement may have on the Fund's financial statements.
2013 Annual Report 17
REPORT OF INDEPENDENT REGISTERED PUBLIC ACCOUNTING FIRM
REPORT OF INDEPENDENT REGISTERED PUBLIC ACCOUNTING FIRM
To the Shareholders and Board of Trustees
of Encompass Fund,
a Series of the Encompass Funds
We have audited the accompanying statement of assets and liabilities of the Encompass Fund, a Series of the Encompass Funds (the "Fund"), including the schedule of investments, as of May 31, 2013 and the related statement of operations for the year then ended, the statements of changes in net assets for each of the two years in the period then ended, and the financial highlights for each of the five years in the period then ended. These financial statements and financial highlights are the responsibility of the Fund's management. Our responsibility is to express an opinion on these financial statements based on our audits.
We conducted our audits in accordance with the standards of the Public Company Accounting Oversight Board (United States). Those standards require that we plan and perform the audit to obtain reasonable assurance about whether the financial statements and financial highlights are free of material misstatement. The Fund was not required to have, nor were we engaged to perform, an audit of its internal control over financial reporting. Our audits included consideration of internal control over financial reporting as a basis for designing audit procedures that are appropriate in the circumstances, but not for the purpose of expressing an opinion on the effectiveness of the Fund's internal control over financial reporting. Accordingly, we express no such opinion. An audit includes examining, on a test basis, evidence supporting the amounts and disclosures in the financial statements, assessing the accounting principles used and significant estimates made by management, as well as evaluating the overall financial statement presentation. Our procedures included confirmation of securities and cash owned as of May 31, 2013, by correspondence with the custodian and brokers. We believe that our audits provide a reasonable basis for our opinion.
In our opinion, the financial statements and financial highlights referred to above present fairly, in all material respects, the financial position of the Encompass Fund, a Series of the Encompass Funds, as of May 31, 2013, the results of its operations for the year then ended, the changes in net assets for each of the two years in the period then ended, and the financial highlights for each of the five years in the period then ended, in conformity with accounting principles generally accepted in the United States of America.

Abington, Pennsylvania
July 19, 2013
2013 Annual Report 18
ADDITIONAL INFORMATION
APPROVAL OF INVESTMENT ADVISORY AGREEMENT
On May 13, 2013 the Board of Trustees (the “Trustees” or the “Board”) considered the renewal of the Management Agreement. In reviewing the Management Agreement, the Board received materials from the Adviser addressing the following factors: (i) the investment performance of the Fund and the Adviser; (ii) the nature, extent and quality of the services provided by the Adviser to the Fund; (iii) the cost of the services to be provided and the profits to be realized by the Adviser and its affiliates from the relationship with the Fund; (iv) the extent to which economies of scale will be realized as the Fund grows; and (v) whether the fee levels reflect these economies of scale to the benefit of shareholders.
Performance. As to the performance of the Fund, the materials provided to the Trustees included information regarding the Fund's performance compared to a group of funds of similar size, style and objective that were categorized by Morningstar as World Stock funds (the "Peer Group"). The Trustees also received performance information for the Dow Jones Wilshire 5000 Index (the "Index"). The performance data was presented for various periods through March 31, 2013. It was noted that the Fund significantly underperformed the Peer Group and the Index for the 12-month period ended March 31, 2013, by returning -42.66% compared to a return of 7.26% of the Peer Group and 14.15% for the Index. Additionally, the Trustees noted that the Fund underperformed the Peer Group and the Index for the 3-year and 5-year periods ended March 31, 2013and the Fund underperformed the Index since the inception of the Fund. During the period of inception to March 31, 2013, the Fund had returned -4.77% and the Index had returned 5.66% . The Trustees noted that the most significant variances in performance returns was the 12-month returns and that the performance variances between the Fund, the Peer Group, and the Index were less pronounced over a longer term. As the Trustees reviewed the performance, the Adviser reminded the Trustees that for the calendar year ended 2009 the Fund had greatly outperformed the market by returning over 137%. The Adviser noted that while the calendar year 2009 returns had been very exceptional and would be difficult to achieve again, the Adviser believes that its experience demonstrates its ability to reverse the Fund's negative performance in the future. The Adviser also reminded the Trustees that their investment strategy is a long-term approach and that negative returns or a shorter term may be expected. As the discussion continued, the Adviser sited reasons for the Fund's poor performance and there was an extensive discussion regarding the current steps taken by the Adviser to regain better comparative performance. Overall, the Trustees noted that the comparative performance information indicated that the Fund had poor performance through the periods ended March 31, 2013, but that they believe the Adviser's experience and knowledge demonstrate it may be able to turn around the relative performance of the Fund in the future and the Adviser is actively managing the portfolio to improve performance.
Nature, Extent and Quality of Services. As to the nature, extent and quality of the services provided by the Adviser, the Trustees analyzed the Adviser's experience and capabilities. The Adviser reviewed and discussed with the Board the Adviser's Form ADV, Code of Ethics certifications confirmed to the Trustees that there has been no change in personnel since the last annual renewal. The Adviser summarized the information provided to the Board and discussed the Adviser's investment management experience. The Adviser then reviewed its balance sheet and income statement as of and for the 12-month period ended March 31, 2013. It was noted that although the Adviser was only marginally profitable for the 12-month period ended March 31, 2013, the Adviser and its members have the resources to provide quality advisory services to the Fund. The Board, including the Independent Trustees, concluded that the nature and extent of the services provided by the Adviser were consistent with their expectations, including the quality of services provided by the portfolio managers. The Trustees also concluded that the Adviser has the resources to provide quality advisory services to the Fund.
Fees, Expenses and Profitability. The Board and the Adviser continued to review the 15(c) Questionnaire completed by the Adviser and provided to the Board prior to the Meeting. Included in the Questionnaire, the Board reviewed the Adviser's profitability analysis, advisory fee and comparative expense ratio information. The Adviser discussed in further detail its financial condition and discussed the firm's ability to meet its obligations under the Management Agreement, referring the Trustees to the Adviser's balance sheet included in the Board Materials. As to the costs of the services to be provided, the Board reviewed the fees under the Management Agreement compared to a peer group of other funds in the Morningstar World Stock Fund category. The Board noted that the Fund's audited expense ratio of 1.45% was lower than its Peer Group's average audited expense ratio of 1.53%. The Trustees then reviewed the management
2013 Annual Report 19
Additional Information - continued
fee ratio of the Fund compared to its Peer Group and noted that the management fee ratio of 1.00% was above the category average of 0.80%, but within the range of advisory fees paid by funds in the Peer Group. The Trustees also noted that the Fund has no front-end load, deferred-load, or 12b-1 expense. The category averages for front-end loads, deferred-loads and 12b-1 expenses were 0.44%, 0.74% and 0.42%, respectively. The Adviser noted that under a separate Services Agreement, it is receiving additional fees from the Fund, but is paying substantially all operating expenses of the Fund and that the Adviser's relationship with the Fund has resulted in only a very slight profit to the Adviser. The Adviser also stated that in addition to advisory services, the Adviser also provides the Fund with officers, including the CCO for both the Trust and the Adviser, and office space. It was noted that for the 12-month period ended March 31, 2013 the Adviser was marginally profitable without consideration to any indirect expenses. As the Trustees continued to discuss the fees, expenses, and profitability, the Trustees noted that although the Adviser was marginally profitable with respect to the Fund for the year ended March 31, 2013, the Fund's asset level had declined and until assets increase again, it would be unlikely for the Adviser to be profitable in the near future. The Adviser represented that the members of the Adviser were committed to the Fund and would be able to cover Fund expenses if the revenues achieved from the Fund do not cover fund expenses and the Adviser is responsible for any such expenses under a fee waiver. The Trustees, including the Independent Trustees, concluded that the Fund's current advisory fee of 1.00% is reasonable. The Board further considered whether the amount of profit realized by the Adviser is a fair entrepreneurial profit for the management of the Fund. The Trustees, including the Independent Trustees, concluded that the Adviser's level of profitability from its relationship with the Fund is not excessive.
Economies of Scale. The Board, including the Independent Trustees, discussed with the Adviser whether it believes there are economies of scale with respect to the management of the Fund that are available and whether the potential exists for realization of any further economies of scale. The Adviser indicated that it would consider adding breakpoints in the future as the Fund grows; however, through March 31, 2013, the amount of time spent managing the Fund and other duties are still substantial enough to keep fees at the present rate. The Adviser reminded the Trustees that direct expenses of the Fund resulted in only a slight profit margin to the Adviser. The Adviser did further indicate that it is committed to reducing fees charged to the Fund as economies of scale are realized. After discussion, it was the consensus of the Trustees that, based upon the current asset level of the Fund, economies of scale or implementation of breakpoints in the advisory fee was not a relevant consideration at this time.
Next, the Independent Trustees met in executive session to discuss the continuation of the Management Agreement. The officers of the Trust were excused during this discussion.
Conclusion. Upon reconvening the meeting, the Trustees reported that after further consideration, while the recent Fund performance was poor, they believed that the Adviser has the experience and knowledge to achieve better relative performance in the future. They concluded that the nature and extent of services provided by the Adviser was consistent with the Board's expectations. The Trustees also concluded that the Adviser has sufficient resources to provide, and had provided, quality advisory services to the Fund. The Board agreed that that the fees paid pursuant to the Management Agreement were reasonable and that the while the Adviser was marginally profitable before indirect expenses for the 12-month period ended March 31, 2013, the fees earned by the Adviser were reasonable when considering the amount of time spent managing the Fund and Services provided to the Fund. The Trustees noted that the Adviser indicated that it will consider adding breakpoints in the future as the Fund grows. It was the consensus of the Trustees, including the Independent Trustees, that the advisory fee structure is reasonable and that renewal of the Management Agreement is in the best interests of the Trust and the Fund's shareholders.
2013 Annual Report 20
This page was intentionally left blank.
2013 Annual Report 21
TRUSTEES AND OFFICERS
The Board of Trustees supervises the business activities of the Trust. The names of the Trustees and executive officers of the Trust are shown below. Each Trustee serves until the Trustee sooner dies, resigns, retires or is removed. Officers hold office for one year and until their respective successors are chosen and qualified. The Statement of Additional Information includes additional information about the Fund’s Trustees and Officers and is available, without charge upon request, by calling 1-888-463-3957. The Trustees and Executive Officers of the Trust and their principal business activities during the past five years are:
Interested Trustees and Officers
| Other | |||||
| Name, | Position | Length of | Principal | Number of | Directorships |
| Address(1), | with the | Time Served | Occupation(s) | Portfolios | Held By |
| and Age | Trust | During | Overseen By | Trustee or | |
| Past 5 Years | Trustee | Officer | |||
| Malcolm H. Gissen(2), 69 | President, | Since 2006 | President, Malcolm H. Gissen & | 1 | None |
| Treasurer | Associates, Inc. (1985-Present). | ||||
| and Trustee | President, Brick Asset | ||||
| Management, Inc. (2006-Present). | |||||
| Marshall G. Berol, 76 | Secretary | Since 2006 | Principal, BL/SH Financial (1990- | N/A | None |
| present), Chief Investment | |||||
| Officer, Malcolm H. Gissen & | |||||
| Associates, Inc. (2000-Present), | |||||
| Secretary, Brick Asset | |||||
| Management, Inc. (2006-Present). | |||||
| Julian G. Winters, 44 | Chief | Since 2011 | Managing Member Watermark | N/A | N/A |
| Compliance | Solutions LLC (investment com- | ||||
| Officer | pliance and consulting) since | ||||
| 3/07; previously, Vice President | |||||
| of Compliance Administration, | |||||
| The Nottingham Company | |||||
| (investment company administra- | |||||
| tor and fund accountant), 3/98 - | |||||
| 3/07. | |||||
Independent Trustees
| Principal | Number of | Other | |||
| Name, | Position | Length of | Occupation(s) | Portfolios | Directorships |
| Address(1)(3), | with the | Time Served | During | Overseen By | Held By |
| and Age | Trust | Past 5 Years | Trustee | Trustee or | |
| Officer | |||||
| John F. Runkel, 58 | Independent | Since 2006 | General Counsel, Affymetrix, Inc. | 1 | None |
| Trustee | (2008-June 2013). General | ||||
| Counsel, Intuitive Surgical, Inc. | |||||
| (2006-2008). | |||||
| William P. Twomey, 70 | Independent | Since 2006 | Retired (2006-Present). Chief | 1 | None |
| Trustee | Financial Officer, Morrison & | ||||
| Foerster, LLP (1994-2006). | |||||
| John F. Hamilton, 68 | Independent | Since 2012 | Director, Vermillion, Inc. (2008 - | 1 | None |
| Trustee | 2013). Director and Audit | ||||
| Committee Chair, Anesiva, Inc. | |||||
| (2009 - 2009). Consulting Chief | |||||
| Financial Officer, Xoma (US) LLC | |||||
| (2008 - 2009). | |||||
(1) The address of each trustee and officer is c/o Encompass Funds 1700 California Street, Suite 335 San Francisco, CA 94109.
(2) Malcolm H. Gissen is considered an "interested person" as defined in Section 2(a)(19) of the Investment Company Act of 1940 by virtue of his affiliation with the Adviser.
(3) Sol Coffino resigned from the Board of Trustees on July 31, 2012.
2013 Annual Report 22
Board of Trustees
|
| This report is provided for the general information of the shareholders of the Encompass Fund. This report is not intended for distribution to prospective investors in the Fund, unless preceded or accompanied by an effective prospectus. |
Item 2. Code of Ethics.
The registrant has adopted a code of ethics that applies to the registrant’s principal executive officer and the principal financial officer. The registrant has not made any amendments to its code of ethics during the covered period. The registrant has not granted any waivers from any provisions of the code of ethics during the covered period. A copy of the registrant’s Code of Ethics is filed herewith.
Item 3. Audit Committee Financial Expert.
The registrant’s Board of Trustees has determined that it does not have an audit committee financial expert serving on its audit committee. The registrant believes that the experience provided by each member of the audit committee together offers the registrant adequate oversight for the registrant’s level of financial complexity.
Item 4. Principal Accountant Fees and Services.
(a-d) The following table details the aggregate fees billed for each of the last two fiscal years for audit fees, audit-related fees, tax fees and other fees by the principal accountant to the registrant. The principal accountant has provided no services to the adviser or any entity controlled by, or under common control with the adviser that provides ongoing services to the registrant.
| FYE 5/31/13 | FYE 5/31/12 | |||
| Audit Fees | $13,000 | $12,500 | ||
| Audit-Related Fees | $0 | $0 | ||
| Tax Fees | $2,300 | $2,350 | ||
| All Other Fees | $0 | $0 |
Nature of Tax Fees: preparation of Excise Tax Statement and 1120 RIC.
(e) (1) The audit committee approves all audit and non-audit related services and, therefore, has not adopted pre-approval policies and procedures described in paragraph (c)(7) of Rule 2-01 of Regulation S-X.
(e) (2) None of the services described in paragraph (b) through (d) of this Item were approved by the audit committee pursuant to paragraph (c)(7)(i)(C) of Rule 2-01 of Regulation S-X.
(f) All of the principal accountant’s hours spent on auditing the registrant’s financial statements were attributed to work performed by full-time permanent employees of the principal accountant.
(g) The following table indicates the aggregate non-audit fees billed by the registrant’s principal accountant for services to the registrant , the registrant’s investment adviser (not sub-adviser), and any entity controlling, controlled by, or under common control with the adviser that provides ongoing services to the registrant, for the last two years.
| Non-Audit Fees | FYE 5/31/13 | FYE 5/31/12 | ||
| Registrant | $2,300 | $2,350 | ||
| Registrant’s Investment Adviser | $0 | $0 |
(h) The principal accountant provided no services to the investment adviser or any entity controlling, controlled by, or under common control with the adviser that provides ongoing services to the registrant.
Item 5. Audit Committee of Listed Companies. Not applicable.
Item 6. Schedule of Investments. Schedule filed with Item 1.
Item 7. Disclosure of Proxy Voting Policies and Procedures for Closed-End Management Investment Companies. Not applicable.
Item 8. Portfolio Managers of Closed-End Management Investment Companies. Not applicable.
Item 9. Purchases of Equity Securities by Closed-End Management Investment Companies and Affiliated Purchasers. Not applicable.
Item 10. Submission of Matters to a Vote of Security Holders.
The registrant has not adopted procedures by which shareholders may recommend nominees to the registrant’s board of trustees.
Item 11. Controls and Procedures.
(a) The registrant’s president and chief financial officer concluded that the disclosure controls and procedures (as defined in Rule 30a-3(c) under the Investment Company Act of 1940 (the “Act”)) were effective as of a date within 90 days of the filing date of this report, based on the evaluation of these controls and procedures required by Rule 30a-3(b) under the Act.
(b) There were no changes in the registrant’s internal control over financial reporting (as defined in Rule 30a-3(d) under the Act) that occurred during the registrant’s second fiscal quarter of the period covered by this report that have materially affected, or are reasonably likely to materially affect, the registrant’s internal control over financial reporting.
Item 12. Exhibits.
(a)(1) Code of Ethics. Filed herewith.
(a)(2) Certifications pursuant to Section 302 of the Sarbanes-Oxley Act of 2002. Filed herewith.
(b) Certification pursuant to Section 906 Certification of the Sarbanes-Oxley Act of 2002. Filed herewith.
SIGNATURES
Pursuant to the requirements of the Securities Exchange Act of 1934 and the Investment Company Act of 1940, the registrant has duly caused this report to be signed on its behalf by the undersigned, thereunto duly authorized.
ENCOMPASS FUNDS
By: /s/Malcolm H. Gissen |
Date: July 26, 2013
Pursuant to the requirements of the Securities Exchange Act of 1934 and the Investment Company Act of 1940, this report has been signed below by the following persons on behalf of the registrant and in the capacities and on the dates indicated.
| By: /s/Malcolm H. Gissen Malcolm H. Gissen President |
| Date: July 26, 2013 |
By: /s/Malcolm H. Gissen |
| Date: July 26, 2013 |