Table of Contents
As filed with the Securities and Exchange Commission on April 24, 2007
RegistrationNo. 333-
SECURITIES AND EXCHANGE COMMISSION
Washington, D.C. 20549
Form S-1
REGISTRATION STATEMENT
UNDER
THE SECURITIES ACT OF 1933
Concho Resources Inc.
(Exact name of registrant as specified in charter)
| Delaware (State or other jurisdiction of incorporation or organization) | 1311 (Primary Standard Industrial Classification Code Number) 550 West Texas Avenue, Suite 1300 Midland, Texas 79701 (432) 683-7443 | 76-0818600 (I.R.S. Employer Identification Number) |
(Address, including zip code, and telephone number, including area code,
of registrant’s principal executive offices)
David W. Copeland
Vice President and General Counsel
550 West Texas Avenue, Suite 1300
Midland, Texas 79701
(432) 683-7443
(Name, address, including zip code, and telephone number, including area code,
of agent for service)
With a copy to: | ||||
| T. Mark Kelly Douglas E. McWilliams Vinson & Elkins L.L.P. 1001 Fannin, Suite 2500 Houston, Texas77002-6760 (713) 758-2222 | William S. Anderson Bracewell & Giuliani LLP 711 Louisiana Street, Suite 2300 Houston, Texas 77002-2770 (713) 221-1122 | Gerald S. Tanenbaum Cahill Gordon & Reindel LLP 80 Pine Street New York, New York 10005 (212) 701-3224 | ||
Approximate date of commencement of proposed sale to the public: As soon as practicable on or after the effective date of this Registration Statement.
If any of the securities being registered on this Form are to be offered on a delayed or continuous basis pursuant to Rule 415 under the Securities Act of 1933, check the following box. o
If this Form is filed to register additional securities for an offering pursuant to Rule 462(b) under the Securities Act, check the following box and list the Securities Act registration statement number of the earlier effective registration statement for the same offering. o
If this Form is a post-effective amendment filed pursuant to Rule 462(c) under the Securities Act, check the following box and list the Securities Act registration statement number of the earlier effective registration statement for the same offering. o
If this Form is a post-effective amendment filed pursuant to Rule 462(d) under the Securities Act, check the following box and list the Securities Act registration statement number of the earlier effective registration statement for the same offering. o
CALCULATION OF REGISTRATION FEE
| Title of Each Class of | Proposed Maximum | Amount of | ||||
| Securities to be Registered | Aggregate Offering Price | Registration Fee | ||||
| Common stock, par value $.001 | $535,000,000(1)(2) | $16,425 | ||||
| (1) | Includes common stock issuable upon exercise of the underwriters’ option to purchase additional shares of common stock. | |
| (2) | Estimated solely for the purpose of calculating the registration fee pursuant to Rule 457(o). |
The registrant hereby amends this registration statement on such date or dates as may be necessary to delay its effective date until the registrant shall file a further amendment which specifically states that this registration statement shall thereafter become effective in accordance with Section 8(a) of the Securities Act of 1933 or until the registration statement shall become effective on such date as the Securities and Exchange Commission, acting pursuant to said Section 8(a), may determine.
Table of Contents
| The information in this preliminary prospectus is not complete and may be changed. We may not sell these securities until the registration statement filed with the Securities and Exchange Commission is effective. This preliminary prospectus is not an offer to sell these securities, and we are not soliciting an offer to buy these securities in any jurisdiction where the offer or sale is not permitted. |
Subject to completion, dated April 24, 2007
Preliminary prospectus
shares

Concho Resources Inc.
Common Stock
Concho Resources Inc. is selling shares of common stock, and the selling stockholders identified in this prospectus are selling an additional shares. We will not receive any of the proceeds from the sale of the shares by the selling stockholders. This is the initial public offering of our common stock. The estimated initial public offering price is between $ and $ per share.
Prior to this offering, there has been no public market for our common stock. We intend to apply to have our common stock listed on the New York Stock Exchange under the symbol “CXO.”
| Per share | Total | |||
| Initial public offering price | $ | $ | ||
| Underwriting discount | $ | $ | ||
| Proceeds to Concho Resources Inc., before expenses | $ | $ | ||
| Proceeds to selling stockholders, before expenses | $ | $ | ||
Certain selling stockholders have granted the underwriters an option for a period of 30 days to purchase up to an aggregate of additional shares of our common stock on the same terms and conditions set forth above to cover over-allotments, if any.
Investing in our common stock involves a high degree of risk. See “Risk factors” beginning on page 15.
Neither the Securities and Exchange Commission nor any state securities commission has approved or disapproved of these securities or passed upon the adequacy or accuracy of this prospectus. Any representation to the contrary is a criminal offense.
The underwriters expect to deliver the shares of common stock to investors on , 2007.
| JPMorgan | Banc of America Securities LLC |
Joint book-running managers
Lehman Brothers
Joint lead manager
| BNP PARIBAS |
| Merrill Lynch & Co. |
| UBS Investment Bank |
| Wachovia Securities |
, 2007
Table of Contents
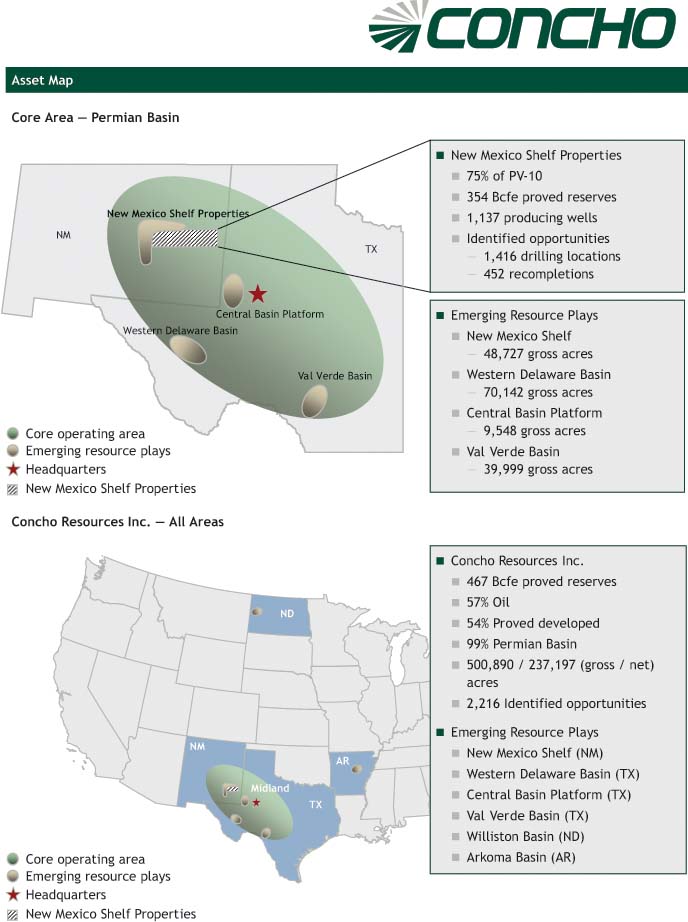
Table of contents
You should rely only on the information contained in this prospectus and the registration statement of which this prospectus is a part. We have not authorized anyone to provide you with information different from that contained in this prospectus. We and the selling stockholders are offering to sell, and seeking offers to buy, shares of our common stock only in jurisdictions where offers and sales are permitted. The information contained in this prospectus is accurate only as of the date of this prospectus, regardless of the time of delivery of this prospectus or of any sale of our common stock.
No action is being taken in any jurisdiction outside the United States to permit a public offering of our common stock or possession or distribution of this prospectus in that jurisdiction. Persons who come into possession of this prospectus in jurisdictions outside the United States are required to inform themselves about and to observe any restrictions as to this offering and the distribution of this prospectus applicable to those jurisdictions.
Concho and Concho Resources are registered trademarks of ours. Other products, services and company names mentioned in this prospectus are the service marks/trademarks of their respective owners.
i
Table of Contents
Cautionary statement regarding forward-looking statements
This prospectus contains forward-looking statements that are subject to a number of risks and uncertainties, many of which are beyond our control. All statements, other than statements of historical fact included in this prospectus, regarding our strategy, future operations, financial position, estimated revenues and losses, projected costs, prospects, plans and objectives of management are forward-looking statements. When used in this prospectus, the words “could,” “believe,” “anticipate,” “intend,” “estimate,” “expect,” “may,” “continue,” “predict,” “potential,” “project” and similar expressions are intended to identify forward-looking statements, although not all forward-looking statements contain such identifying words.
Forward-looking statements may include statements about our:
| • | business strategy; |
| • | estimated quantities of oil and natural gas reserves; |
| • | technology; |
| • | financial strategy; |
| • | oil and natural gas realized prices; |
| • | timing and amount of future production of oil and natural gas; |
| • | the amount, nature and timing of capital expenditures; |
| • | drilling of wells; |
| • | competition and government regulations; |
| • | marketing of oil and natural gas; |
| • | exploitation or property acquisitions; |
| • | costs of exploiting and developing our properties and conducting other operations; |
| • | general economic and business conditions; |
| • | cash flow and anticipated liquidity; |
| • | uncertainty regarding our future operating results; and |
| • | plans, objectives, expectations and intentions contained in this prospectus that are not historical. |
You should not place undue reliance on these forward-looking statements. All forward-looking statements speak only as of the date of this prospectus. We do not undertake any obligation to release publicly any revisions to the forward-looking statements to reflect events or circumstances after the date of this prospectus or to reflect the occurrence of unanticipated events, unless the securities laws require us to do so.
Although we believe that our plans, objectives, expectations and intentions reflected in or suggested by the forward-looking statements we make in this prospectus are reasonable, we can give no assurance that they will be achieved. We disclose important factors that could cause our actual results to differ materially from our expectations under “Risk factors” and “Management’s discussion and analysis of financial condition and results of operations” and elsewhere in this prospectus. These cautionary statements qualify all forward-looking statements attributable to us or persons acting on our behalf.
ii
Table of Contents
Industry and market data
The market data and certain other statistical information used throughout this prospectus are based on independent industry publications, government publications, reports by market research firms or other published independent sources. Some data are also based on our good faith estimates. Although we believe these third-party sources are reliable, we have not independently verified the information and cannot guarantee its accuracy and completeness.
iii
Table of Contents
Prospectus summary
This summary highlights information contained elsewhere in this prospectus. Because this section is only a summary, it does not contain all of the information that may be important to you or that you should consider before making an investment decision. For a more complete understanding of this offering, we encourage you to read this entire prospectus, including the information contained under the heading “Risk factors.” You should read the following summary together with the more detailed information, pro forma financial information and consolidated financial information and the notes thereto included elsewhere in this prospectus. In this prospectus, unless the context otherwise requires, the terms “we,” “us,” “our” and “Concho Resources“ refer to Concho Resources Inc. and its subsidiaries.
In this prospectus, “pro forma” means after giving pro forma effect to the combination transaction that occurred on February 27, 2006. Please read “Business and properties—Combination transaction” for more information about the combination transaction.
We have provided definitions for the oil and natural gas terms used in this prospectus in the “Glossary of terms” beginning onpage A-1 of this prospectus. Unless otherwise indicated, the information contained in this prospectus assumes that the underwriters do not exercise their option to purchase additional shares from certain selling stockholders.
Our business
We are an independent oil and natural gas company engaged in the acquisition, development, exploitation and exploration of oil and natural gas properties. Our conventional operations are primarily focused in the Permian Basin of Southeast New Mexico and West Texas. These conventional operations are complemented by our activities in unconventional emerging resource plays. We intend to grow our reserves and production through development drilling, exploitation and exploration activities on our multi-year project inventory and through acquisitions that meet our strategic and financial objectives.
Our operations are primarily concentrated in the Permian Basin, the largest onshore oil and gas basin in the United States. As of December 31, 2006, 99% of our total estimated net proved reserves were located in the Permian Basin and consisted of approximately 57% crude oil and 43% natural gas. This basin is characterized by an extensive production history, mature infrastructure, long reserve life, multiple producing horizons, enhanced recovery potential and a large number of operators. The primary producing formation in the Permian Basin under our core properties in Southeast New Mexico is the Paddock interval of the Yeso formation, which is located at depths ranging from 3,800 feet to 5,800 feet. We have also discovered reserves and are producing oil and natural gas from the Blinebry interval of the Yeso formation, the top of which is located approximately 400 feet below the base of the Paddock interval. In addition, we have assembled a multi-year inventory of development drilling and exploitation projects, including further projects to evaluate the aerial extent of the Blinebry interval, that we believe will allow us to grow proved reserves and production. We have also acquired significant acreage positions in the Permian Basin of Southeast New Mexico, the Central Basin Platform, the Delaware Basin and the Val Verde Basin of West Texas, the Williston Basin in North Dakota and the Arkoma Basin in Arkansas, covering unconventional emerging resource plays, where we intend to apply horizontal drilling, advanced fracture stimulation and enhanced recovery technologies.
1
Table of Contents
We were formed in February 2006 as a result of the combination of Concho Equity Holdings Corp. and a portion of the oil and natural gas properties and related assets owned by Chase Oil Corporation and certain of its affiliates. Concho Equity Holdings Corp. was formed in April 2004 and represents the third of three Permian Basin-focused companies that have been formed since 1997 by our current management team (the prior two companies were sold to large domestic independent oil and natural gas companies).
Following the formation of our company, we drilled 140 gross (86.4 net) wells in 2006, 89% of which were completed as producers, 7% of which were dry holes and 4% of which are awaiting completion. In addition, following the formation of our company, we recompleted 103 gross (77.1 net) wells in 2006, 98% of which were productive. As a result, we have increased our total estimated net proved reserves by approximately 51 Bcfe from 416 Bcfe as of December 31, 2005, on a pro forma basis, to 467 Bcfe as of December 31, 2006, while producing approximately 26 Bcfe of oil and natural gas on a pro forma basis during the year ended December 31, 2006. In addition, following the formation of our company, we increased our average net daily production from 62 MMcfe during March 2006 to 79 MMcfe during December 2006.
The following table provides a summary of selected operating information of our conventional properties in the Permian Basin, which is our core operating area, and in our unconventional emerging resource plays.PV-10 includes the present value of our estimated future abandonment and site restoration costs for proved properties net of the present value of estimated salvage proceeds from each of these properties. We set forth our definition ofPV-10 (a non-GAAP financial measure) and a reconciliation ofPV-10 to the standardized measure of discounted future net cash flows under “—Non-GAAP financial measures and reconciliations.”
| Year ended | ||||||||||||||||||||||||
| As of | December 31, | |||||||||||||||||||||||
| December 31, 2006 | 2006 | |||||||||||||||||||||||
| Pro forma | Pro forma | |||||||||||||||||||||||
| Total | reserve/ | average | ||||||||||||||||||||||
| proved | production | Identified | Identified | Total | Total | daily | ||||||||||||||||||
| reserves | PV-10 | index(1) | drilling | recompletion | gross | net | production | |||||||||||||||||
| Areas | (Bcfe) | ($ in millions) | (years) | locations(2) | projects(2) | acreage | acreage | (MMcfe/d) | ||||||||||||||||
| Permian Basin | ||||||||||||||||||||||||
| Southeast New Mexico | 387.5 | $ | 782.6 | 18.7 | 1,505 | 489 | 182,475 | 87,160 | 56.8 | |||||||||||||||
| West Texas | 70.2 | 154.5 | 15.5 | 148 | 49 | 95,390 | 35,101 | 12.4 | ||||||||||||||||
Emerging Plays and Other(3) | 9.1 | 16.9 | 19.2 | 23 | 2 | 223,025 | 114,936 | 1.3 | ||||||||||||||||
| Total | 466.8 | $ | 954.0 | 18.1 | 1,676 | 540 | 500,890 | 237,197 | 70.5 | |||||||||||||||
| (1) | The Pro forma reserve/production index is the number of years proved reserves would last assuming current production continued at the same rate. This index is calculated by dividing pro forma production during the year ended December 31, 2006, into the proved reserve quantity as of December 31, 2006. | |
| (2) | The identified drilling locations and identified recompletion projects listed in the table above included 817 drilling locations and recompletion projects for which proved reserves had been included in our reserve reports as of December 31, 2006. | |
| (3) | Information with respect to “Other” includes conventional oil and gas operations on properties that are not located in the Permian Basin. As of December 31, 2006, 3.1 Bcfe of the proved reserves and $5.4 million of thePV-10 as well as one of the identified drilling locations and two identified recompletion projects were related to oil and natural gas properties categorized as “Other” and not as “Emerging Plays.” In addition, as of December 31, 2006, 4,948 gross (797 net) acres reflected above were categorized as “Other,” and 1.2 MMcfe/d of the pro forma average daily production during the year ended December 31, 2006 reflected above were categorized as “Other.” |
2
Table of Contents
In our unconventional emerging resource plays, we target areas where we can acquire large undeveloped acreage positions and apply horizontal drilling, advanced fracture stimulation and enhanced recovery technologies to achieve economic, repeatable production results. As of December 31, 2006, we held interests in 218,077 gross (114,139 net) acres in six unconventional emerging resource plays. Our current positions include acreage in:
| • | the Northwest Shelf area in Southeast New Mexico, where we have tested one re-entry well and drilled six exploratory wells targeting the Wolfcamp Carbonate; |
| • | the Central Basin Platform of West Texas, where we plan to target the Woodford Shale; |
| • | the Delaware Basin of West Texas, where we have drilled four exploratory wells targeting the Bone Spring, Atoka, Barnett and Woodford Shales; |
| • | the Val Verde Basin of West Texas, where we plan to drill our first test well in 2007, which will target the Ellenburger Dolomite and the Canyon Sands; |
| • | the North Dakota portion of the Williston Basin, where we have drilled two exploratory wells targeting the Bakken Shale; and |
| • | the eastern Arkoma Basin in Arkansas, where we plan to drill our first test well prior to March 31, 2008, which will target the Fayetteville Shale. |
Our exploration and development budget for our oil and gas properties for the year ending December 31, 2007 is approximately $137 million. We plan to spend approximately 93% of our capital budget on exploration and development activities associated with our conventional properties in the Permian Basin, 3% for leasehold acquisitions and 4% for exploration activities in our emerging resource plays. If we achieve successful results from exploratory drilling in our unconventional emerging resource plays, we may allocate a greater portion of our planned 2007 capital expenditure budget to those plays.
Our business strategy
Our goal is to enhance stockholder value through profitably increasing reserves, production and cash flow by executing our strategy as described below:
| • | Exploit our multi-year project inventory. We believe our multi-year drilling and exploitation inventory will allow us to grow our proved reserves and production for the next several years. As of December 31, 2006, we had identified 2,216 drilling locations and recompletion projects on our existing properties, including step-out drilling, infill drilling (including well deepening opportunities), workovers and recompletions. |
| • | Enhance production from our existing properties through development of additional producing horizons and enhanced recovery methods.We believe there are additional productive horizons underlying certain of our existing producing horizons in Southeast New Mexico that have not been fully developed. During 2006, we accelerated an evaluation, which had begun in late 2005, of the Blinebry interval, which lies below the primary producing interval under our core properties in Southeast New Mexico. During 2006, we drilled 52 wells in the Blinebry interval, all of which have since been completed as producers. At December 31, 2006, the wells in the Blinebry interval which had been drilled and completed and were producing only from the Blinebry interval were producing an average of 80 Bbl and 176 Mcf per well per day. We currently intend to drill an additional 69 wells in 2007 to further evaluate the aerial extent |
3
Table of Contents
| of the Blinebry interval. In addition, we are evaluating the feasibility of enhanced recovery operations on a significant portion of our Southeast New Mexico properties. |
| • | Pursue the acquisition, exploration and development of unconventional emerging oil and natural gas resource plays. We have assembled an exploration team to target unconventional emerging resource plays where we can acquire large undeveloped acreage positions and apply horizontal drilling, advanced fracture stimulation and enhanced recovery technologies to achieve economic, repeatable production results. As of December 31, 2006, we had accumulated 218,077 gross (114,139 net) acres in six unconventional emerging resource plays, and our technical team is focused on exploring, developing and exploiting these resource plays as well as evaluating and acquiring acreage in similar plays in North America. |
| • | Make opportunistic acquisitions that meet our strategic and financial objectives. We seek to acquire oil and gas properties that we believe complement our existing properties in our core areas of operation. We have an experienced team of management, engineering and geoscience professionals to identify and evaluate acquisition opportunities. We also seek to acquire oil and gas properties that provide opportunities for the addition of reserves and production through a combination of exploitation, development, high-potential exploration and control of operations and that will allow us to apply our operating expertise or that otherwise have geologic characteristics that are similar to our existing properties. |
Our strengths
We have a number of strengths that we believe will help us successfully execute our strategy:
| • | Experienced and incentivized management team. Our executive officers average over 20 years of experience in the oil and gas industry, having led both public and private oil and natural gas exploration and production companies. These companies have had substantially all of their operations in our core area of the Permian Basin and were headquartered in Midland, Texas, which is located in the heart of the Permian Basin. Additionally, members of our technical staff, including six petroleum engineers, seven geoscientists and seven landmen, have, on average, more than 23 years experience in the industry. After giving effect to this offering, our executive officers will beneficially own an aggregate of % of our outstanding common stock, which will align their objectives with those of our stockholders. |
| • | History of growth and capital efficiency. During the year ended December 31, 2006, we increased our total estimated net proved reserves by approximately 51 Bcfe from 416 Bcfe as of December 31, 2005, on a pro forma basis, to 467 Bcfe as of December 31, 2006, and produced approximately 26 Bcfe of oil and natural gas on a pro forma basis. In addition, following the formation of our company, we increased our average net daily production from 62 MMcfe during March 2006 to 79 MMcfe during December 2006. The increase in reserves and production during the year ended December 31, 2006 was primarily attributable to our successful drilling program in the Permian Basin. Despite increasing costs of oilfield services and equipment in our areas of operation, we added 101 Bcfe of proved reserves through new discoveries and extensions, excluding revisions of previous estimates, at a total cost of $191.5 million. |
| • | Large inventory of drilling and recompletion opportunities. Following the formation of our company, we drilled 140 gross (86.4 net) wells in 2006, of which 125 gross (81.4 net) wells were completed as producers, 10 gross (3.2 net) wells were dry holes and 5 gross (1.8 net) wells are awaiting completion. In addition, following the formation of our company, we |
4
Table of Contents
| recompleted 103 gross (77.1 net) wells in 2006, 98% of which were productive. As of December 31, 2006, we had identified 1,676 undrilled well locations on our acreage, with proved undeveloped reserves attributed to 595 of such locations, and 540 recompletion opportunities, with proved reserves attributed to 222 of such opportunities. We plan to drill 134 wells and recomplete 90 wells during 2007. |
| • | Geographically concentrated operations. Our current operations are focused in the Permian Basin of Southeast New Mexico and West Texas, where 99% of our proved reserves are located. Our geographic concentration allows us to establish economies of scale with respect to drilling, production, operating and administrative costs, in addition to further leveraging our base of technical expertise in this region. |
| • | Significant operational control. As of December 31, 2006, we operated 916 gross (824 net) wells on properties which comprised 89% of ourPV-10. Additionally, as of December 31, 2006, approximately 72% of our identified drilling locations and recompletion projects were associated with properties we operate. Our high proportion of operated properties enables us to exercise a significant level of control over the amount and timing of expenses, capital allocation and other aspects of exploration and development. |
Combination transaction
We were formed as a Delaware corporation on February 22, 2006, in connection with a combination transaction whereby certain of the stockholders of Concho Equity Holdings Corp. exchanged their equity interests in that company for approximately 52 million shares of our common stock and options to purchase shares of our common stock, and each of Chase Oil Corporation, Caza Energy LLC and their affiliated oil and gas working interest owners (which we refer to herein as the “Chase Group”) contributed their interests in certain oil and gas properties to our company in exchange for approximately 70 million shares of our common stock and total cash payments of approximately $409 million. Upon the initial closing of the combination transaction on February 27, 2006, the executive officers of Concho Equity Holdings Corp. became the executive officers of our company. For more information about the combination transaction, please see “Business and properties — Combination transaction.” Prior to the completion of this offering, the field operations of the oil and gas properties we acquired from the Chase Group were conducted on our behalf and at our direction by employees of Mack Energy Corporation, an affiliate of Chase Oil. Upon the completion of this offering, our employees, along with third party contractors, if necessary, will assume those operations. For more information about our transactions with certain affiliates of Chase Oil, please see “Certain relationships and related party transactions.”
Concho Equity Holdings Corp. was formed in April 2004 by our existing senior management team and private equity investors, and it commenced oil and gas operations in December 2004 upon its acquisition of certain oil and natural gas properties located in Southeast New Mexico and West Texas from Lowe Partners, L.P. for approximately $117 million, which properties we refer to herein as the “Lowe Properties.”
Risk factors
Investing in our common stock involves risks that include the speculative nature of oil and natural gas exploration, competition, volatile oil and natural gas prices and other material factors. You should read carefully the section entitled “Risk factors” for an explanation of these
5
Table of Contents
risks before investing in our common stock. In particular, the following considerations may offset our business strengths or have a negative effect on our business strategy as well as on activities on our properties, which could cause a decrease in the price of our common stock and result in a loss of all or a portion of your investment:
| • | A substantial or extended decline in oil and natural gas prices may adversely affect our business, financial condition or results of operations and our ability to meet our capital expenditure obligations and financial commitments. |
| • | Our development and exploitation projects require substantial capital expenditures. We may be unable to obtain needed capital or financing on satisfactory terms or at all, which could lead to a decline in our oil and natural gas reserves. |
| • | Reserve estimates depend on many assumptions that may turn out to be inaccurate. Any material inaccuracies in these reserve estimates or underlying assumptions will materially affect the quantity and present value of our reserves. |
| • | Drilling for and producing oil and natural gas are high risk activities with many uncertainties that could adversely affect our business, financial condition or results of operations. |
| • | We may incur substantial losses and be subject to substantial liability claims as a result of our oil and natural gas operations. We may not be insured for, or our insurance may be inadequate to protect us against, these risks. |
| • | Unless we replace our oil and natural gas reserves, our reserves and production will decline, which would adversely affect our cash flows and results of operations. |
| • | The unavailability or high cost of drilling and workover rigs, equipment, supplies, materials, electricity, personnel and oilfield services could adversely affect our ability to execute our exploration and development plans within our budget or on a timely basis. |
| • | Substantially all of our producing properties are located in Southeast New Mexico and West Texas, making us vulnerable to risks associated with operating in one major geographic area. Furthermore, approximately 53% of our proved reserves as of December 31, 2006, are from the Yeso formation, which includes both the Paddock and Blinebry intervals, within this geographic area, thus making us vulnerable to risks associated with this concentration of assets. |
| • | The results of enhanced recovery methods are uncertain. |
For a discussion of other considerations that could negatively affect us, including risks related to this offering and our common stock, see “Risk factors” and “Cautionary statement regarding forward-looking statements.”
Corporate information
Concho Resources Inc. is a Delaware corporation. Our principal executive offices are located at 550 West Texas Avenue, Suite 1300, Midland, Texas 79701, and our telephone number at that address is(432) 683-7443.
6
Table of Contents
The offering
| Common stock offered by us: | shares | |
| Common stock offered by the selling stockholders: | shares | |
| Total common stock offered hereby: | shares | |
| Common stock to be outstanding immediately following the offering: | shares | |
| Use of proceeds: | We intend to use the net proceeds from the sale of our shares to repay a portion of our existing indebtedness. See “Use of proceeds.” We will not receive any of the proceeds from the sale of the shares by the selling stockholders. See “Principal and selling stockholders.” | |
| Dividend policy: | We do not anticipate paying any cash dividends on our common stock. | |
| New York Stock Exchange symbol: | CXO | |
| Risk factors: | See “Risk factors” and the other information included in this prospectus for a discussion of the factors you should consider carefully before deciding to invest in shares of our common stock. |
The number of shares of our common stock outstanding after this offering is based on shares of common stock outstanding as of , 2007, and excludes:
| • | shares of our common stock reserved for issuance upon exercise of stock options granted under our stock option plans, at a weighted average exercise price of $ per share; and |
| • | shares of our common stock reserved for issuance pursuant to future awards under our 2006 Stock Incentive Plan. |
Other information about this prospectus
Unless specifically stated otherwise, the information in this prospectus:
| • | reflects a reverse stock split of our shares of common stock effected immediately prior to the completion of this offering; |
| • | assumes no exercise of the underwriters’ over-allotment option; and |
| • | assumes an initial public offering price of $ , which is the mid-point of the range set forth on the front cover page of this prospectus. |
7
Table of Contents
Summary historical and pro forma consolidated financial data
This section presents our summary historical and pro forma consolidated financial data. The summary historical consolidated financial data presented below is not intended to replace our historical consolidated financial statements.
The following table shows summary historical financial data related to Concho Resources (as the accounting successor to Concho Equity Holdings Corp.), combined financial data of the properties we acquired from the Chase Group (which we refer to as the “Chase Group Properties”) and unaudited pro forma financial data of Concho Resources as of and for the year ended December 31, 2006. We have accounted for the combination transaction that occurred on February 27, 2006, as an acquisition by Concho Equity Holdings Corp. of the Chase Group Properties and a simultaneous reorganization of Concho Resources such that Concho Equity Holdings Corp. is now our wholly owned subsidiary.
Our historical results of operations for the periods presented below may not be comparable either from period to period or going forward, for the following reasons:
| • | Prior to December 7, 2004, Concho Equity Holdings Corp. did not own any material assets and did not conduct substantial operations other than organizational activities. |
| • | On December 7, 2004, Concho Equity Holdings Corp. acquired the Lowe Properties for approximately $117 million and commenced oil and gas operations. |
| • | On February 27, 2006, the initial closing of the combination transaction occurred. Pursuant to the combination transaction, Concho Resources acquired the Chase Group Properties for approximately 70 million shares of common stock and approximately $409 million in cash. |
| • | On March 27, 2007, Concho Resources entered into a $200.0 million second lien term loan facility from which it received proceeds of $199.0 million that it used to repay the $39.8 million outstanding under its prior term loan facility and to reduce the outstanding balance under its revolving credit facility by $154.0 million, with the remaining $5.2 million used to pay loan fees, accrued interest and for general corporate purposes. |
The summary historical financial data for the Chase Group Properties for the years ended December 31, 2004 and 2005 are derived from the audited financial statements of the Chase Group Properties. The summary historical financial data for Concho Resources for the period from inception (April 21, 2004) through December 31, 2004, and for the years ended December 31, 2005 and 2006, are derived from the audited financial statements of Concho Resources.
The summary pro forma financial data for the year ended December 31, 2006 set forth in the following table are derived from the unaudited pro forma financial statements of Concho Resources included in this prospectus. The pro forma statement of operations data has been prepared as if the closing of the combination transaction had taken place as of January 1, 2006.
Our balance sheet data as of December 31, 2006, as adjusted, gives effect to the following transactions:
| • | the issuance by us of shares of common stock in this offering; | |
| • | our borrowing of $200.0 million under our second lien term loan facility; and |
8
Table of Contents
| • | the repayment of a portion of our outstanding indebtedness using net proceeds from this offering as described in “Use of proceeds.” |
You should read the following data along with “Selected historical and pro forma consolidated financial information,” “Management’s discussion and analysis of financial condition and results of operations” and the consolidated financial statements and related notes, each of which is included in this prospectus. You should also read the pro forma information together with the unaudited pro forma combined financial statements and related notes included in this prospectus.
The following table includes the non-GAAP financial measure EBITDAX. For a definition of this measure and a reconciliation to its most directly comparable financial measure calculated and presented in accordance with generally accepted accounting principles, which we refer to as “GAAP,” please read “—Non-GAAP financial measures and reconciliations.”
| Chase Group | ||||||||||||||||||||||
| Properties | Concho Resources Inc. | |||||||||||||||||||||
| Inception (April 21, | Pro forma | |||||||||||||||||||||
| Years ended | 2004) through | Years ended | year ended | |||||||||||||||||||
| December 31, | December 31, | December 31, | December 31, | |||||||||||||||||||
| (In thousands, except per share amounts) | 2004 | 2005 | 2004 | 2005 | 2006 | 2006 | ||||||||||||||||
| (unaudited) | ||||||||||||||||||||||
Statement of operations data: | ||||||||||||||||||||||
Operating revenues: | ||||||||||||||||||||||
| Oil sales | $ | 66,529 | $ | 73,132 | $ | 1,851 | $ | 31,621 | $ | 131,773 | $ | 145,713 | ||||||||||
| Natural gas sales | 41,247 | 46,546 | 1,771 | 23,315 | 66,517 | 74,033 | ||||||||||||||||
| Total operating revenues | 107,776 | 119,678 | 3,622 | 54,936 | 198,290 | 219,746 | ||||||||||||||||
Operating costs and expenses: | ||||||||||||||||||||||
| Oil and gas production | 11,762 | 12,979 | 512 | 10,923 | 22,060 | 24,456 | ||||||||||||||||
| Oil and gas production taxes | 9,202 | 10,298 | 234 | 3,712 | 15,762 | 17,602 | ||||||||||||||||
| Exploration and abandonments | 179 | — | 1,850 | 2,666 | 5,612 | 5,612 | ||||||||||||||||
| Depreciation, depletion and accretion | 20,459 | 19,092 | 963 | 11,574 | 61,009 | 66,520 | ||||||||||||||||
| Impairments of proved oil and gas properties | 3,233 | 194 | — | 2,295 | 9,891 | 9,892 | ||||||||||||||||
| General and administrative | 1,387 | 1,702 | 3,086 | 8,055 | 12,577 | 12,861 | ||||||||||||||||
| Stock-based compensation | — | — | 1,128 | 3,252 | 9,144 | 9,144 | ||||||||||||||||
| Ineffective portion of cash flow hedges | — | — | — | 1,148 | (1,193 | ) | (1,193 | ) | ||||||||||||||
| (Gain) loss on derivatives not designated as hedges | 7,936 | 1,062 | (684 | ) | 5,001 | — | — | |||||||||||||||
| Total operating costs and expenses | 54,158 | 45,327 | 7,089 | 48,626 | 134,862 | 144,894 | ||||||||||||||||
Income (loss) from operations | 53,618 | 74,351 | (3,467 | ) | 6,310 | 63,428 | 74,852 | |||||||||||||||
Other income (expense): | ||||||||||||||||||||||
| Interest expense | — | — | (272 | ) | (3,096 | ) | (30,567 | ) | (35,790 | ) | ||||||||||||
| Other, net | — | — | 168 | 779 | 1,186 | 1,186 | ||||||||||||||||
| Total other expense | — | — | (104 | ) | (2,317 | ) | (29,381 | ) | (34,604 | ) | ||||||||||||
Income (loss) before income taxes | 53,618 | 74,351 | (3,571 | ) | 3,993 | 34,047 | 40,248 | |||||||||||||||
| Income tax (expense) benefit | — | — | 915 | (2,039 | ) | (14,379 | ) | (16,797 | ) | |||||||||||||
Net income (loss) | $ | 53,618 | $ | 74,351 | $ | (2,656 | ) | $ | 1,954 | $ | 19,668 | $ | 23,451 | |||||||||
| Preferred stock dividends | (804 | ) | (4,766 | ) | (1,244 | ) | — | |||||||||||||||
| Effect of induced conversion of preferred stock | — | — | 11,601 | — | ||||||||||||||||||
Net income (loss) applicable to common shareholders | $ | (3,460 | ) | $ | (2,812 | ) | $ | 30,025 | $ | 23,451 | ||||||||||||
EBITDAX(1) (unaudited) | $ | 85,425 | $ | 94,699 | $ | (42 | ) | $ | 33,025 | $ | 149,077 | $ | 166,013 | |||||||||
Basic earnings (loss) per share: | ||||||||||||||||||||||
| Net income (loss) per share | $ | (1.74 | ) | $ | (0.35 | ) | $ | 0.32 | $ | 0.22 | ||||||||||||
| Shares used in basic earnings (loss) per share | 1,987 | 8,117 | 94,575 | 108,335 | ||||||||||||||||||
Diluted earnings (loss) per share: | ||||||||||||||||||||||
| Net income (loss) per share | $ | (1.74 | ) | $ | (0.35 | ) | $ | 0.30 | $ | 0.20 | ||||||||||||
| Shares used in diluted earnings (loss) per share | 1,987 | 8,117 | 101,458 | 115,412 | ||||||||||||||||||
9
Table of Contents
| Chase Group | Concho Resources Inc. | |||||||||||||||||||
| Properties | Inception (April 21, | |||||||||||||||||||
| Years ended | 2004) through | Years ended | ||||||||||||||||||
| December 31, | December 31, | December 31, | ||||||||||||||||||
| (In thousands) | 2004 | 2005 | 2004 | 2005 | 2006 | |||||||||||||||
Other financial data: | ||||||||||||||||||||
| Net cash provided by (used in) operations | $ | 84,202 | $ | 93,162 | $ | (2,193 | ) | $ | 25,070 | $ | 112,181 | |||||||||
| Net cash provided by (used in) investing | (30,045 | ) | (35,611 | ) | (122,473 | ) | (61,902 | ) | (596,852 | ) | ||||||||||
| Net cash provided by (used in) financing | (54,157 | ) | (57,551 | ) | 125,322 | 45,358 | 476,611 | |||||||||||||
| Capital expenditures | 25,451 | 32,352 | 116,880 | 72,758 | 1,226,180 | |||||||||||||||
| Concho Resources Inc. | ||||||||||||||||||
| Chase Group | As adjusted | |||||||||||||||||
| Properties | as of | |||||||||||||||||
| As of December 31, | As of December 31, | December 31, | ||||||||||||||||
| (In thousands) | 2004 | 2005 | 2004 | 2005 | 2006 | 2006(2) | ||||||||||||
(unaudited) | ||||||||||||||||||
Balance sheet data: | ||||||||||||||||||
| Cash and cash equivalents | $ | — | $ | — | $ | 656 | $ | 9,182 | $ | 1,122 | $ | |||||||
| Property and equipment, net | 135,568 | 149,042 | 115,455 | 170,583 | 1,320,655 | 1,320,655 | ||||||||||||
| Total assets | 145,100 | 161,792 | 130,717 | 232,385 | 1,390,072 | |||||||||||||
| Long-term debt, including current | ||||||||||||||||||
| maturities | — | — | 53,000 | 72,000 | 495,500 | |||||||||||||
| Stockholders’ equity/net investment | 134,014 | 150,814 | 71,710 | 109,670 | 575,156 | |||||||||||||
| (1) | EBITDAX is defined as income before accounting changes, plus (1) interest, the amortization of related debt issuance costs and other financial costs, net of capitalized interest, (2) federal and state income taxes, (3) depreciation, depletion, amortization and accretion, (4) hedge ineffectiveness, (5) property impairments, (6) exploration expense and dry hole costs, (7) (gain) loss on derivatives not designated as hedges, and (8) stock-based compensation expense. See “—Non-GAAP financial measures and reconciliations.” | |
| (2) | A $1.00 increase (decrease) in the assumed initial public offering price per share would decrease (increase) long-term debt, including current maturities by $ and would increase (decrease) stockholders’ equity by $ , assuming the number of shares offered by us set forth on the cover page of this prospectus remains the same and after deducting underwriting discounts and estimated offering expenses payable by us. |
10
Table of Contents
Summary reserve and pro forma production
and operating data (unaudited)
and operating data (unaudited)
The following estimates of net proved oil and natural gas reserves as of December 31, 2006 and pro forma net proved oil and natural gas reserves as of December 31, 2005, are based on reports prepared by Netherland, Sewell & Associates, Inc. and Cawley, Gillespie & Associates, Inc., independent petroleum engineers. In preparing their reports, Netherland, Sewell & Associates, Inc. and Cawley, Gillespie & Associates, Inc. evaluated properties representing 100% of ourPV-10 as of the end of the applicable periods. Summaries of the Netherland, Sewell & Associates, Inc. and Cawley, Gillespie & Associates, Inc. reports on our proved reserves as of December 31, 2006, are attached to this prospectus as Annex A and Annex B, respectively. All calculations of estimated net proved reserves have been made in accordance with the rules and regulations of the SEC. Please read “Risk factors,” “Management’s discussion and analysis of financial condition and results of operations,” “Business and properties—Our oil and natural gas reserves,” “Business and properties—Our production, prices and expenses,” and the Netherland, Sewell & Associates, Inc. and Cawley, Gillespie & Associates, Inc. summary reports included in this prospectus in evaluating the material presented below. The pro forma reserve data was prepared as if the combination transaction had taken place on December 31, 2005 for proved reserves data. The pro forma production data was prepared as if the combination transaction had taken place on January 1, 2006 for production, price and cost data.
| Pro forma as of | As of | |||||
| December 31, 2005 | December 31, 2006 | |||||
Proved reserves: | ||||||
| Oil (MBbl) | 37,492 | 44,322 | ||||
| Natural gas (MMcf) | 190,938 | 200,818 | ||||
| Natural gas equivalent (MMcfe) | 415,890 | 466,750 | ||||
| Proved developed reserves percentage | 55.0% | 54.2% | ||||
PV-10 (in millions)(1) | $ | 1,324.5 | $ | 954.0 | ||
Estimated reserve life (in years)(2) | 18.9 | 18.1 | ||||
| (1) | PV-10 is a non-GAAP financial measure and generally differs from standardized measure, the most directly comparable GAAP financial measure, because it does not include the effects of income taxes on future net revenues. See “—Non-GAAP financial measures and reconciliations.” Prices used in the computation of future net cash flows were adjusted for location and quality by field, and were $61.04 per Bbl and $10.08 per MMBtu for purposes of estimating pro forma net proved reserves as of December 31, 2005 and were $57.75 per Bbl and $5.64 per MMBtu for purposes of estimating net proved reserves as of December 31, 2006. |
| (2) | Calculated by dividing proved reserves by pro forma production volumes for the years indicated. |
11
Table of Contents
| Pro forma | |||
| year ended | |||
| December 31, 2006 | |||
Net production volumes: | |||
| Oil (MBbl) | 2,539.6 | ||
| Natural gas (MMcf) | 10,497.6 | ||
| Natural gas equivalent (MMcfe) | 25,735.0 | ||
Average prices: | |||
| Oil, without hedges ($/Bbl) | $ | 57.38 | |
| Oil, with hedges ($/Bbl) | $ | 54.62 | |
| Natural gas, without hedges ($/Mcf) | $ | 7.05 | |
| Natural gas, with hedges ($/Mcf) | $ | 7.17 | |
| Natural gas equivalent, without hedges ($/Mcfe) | $ | 8.54 | |
| Natural gas equivalent, with hedges ($/Mcfe) | $ | 8.31 | |
Operating costs and expenses: | |||
| Oil and gas production ($/Mcfe) | $ | 0.92 | |
| Oil and gas production taxes ($/Mcfe) | $ | 0.68 | |
| General and administrative ($/Mcfe) | $ | 0.49 | |
| Depreciation and depletion expense ($/Mcfe) | $ | 2.57 | |
12
Table of Contents
Non-GAAP financial measures and reconciliations
(unaudited)
PV-10
ThePV-10 is derived from the standardized measure of discounted future net cash flows which is the most directly comparable GAAP financial measure.PV-10 is a computation of the standardized measure of discounted future net cash flows on a pre-tax basis.PV-10 is equal to the standardized measure of discounted future net cash flows at the applicable date, before deducting future income taxes, discounted at 10%. We believe that the presentation of thePV-10 is relevant and useful to investors because it presents the discounted future net cash flows attributable to our estimated net proved reserves prior to taking into account future corporate income taxes, and it is a useful measure for evaluating the relative monetary significance of our oil and natural gas properties. Further, investors may utilize the measure as a basis for comparison of the relative size and value of our reserves to other companies. We use this measure when assessing the potential return on investment related to our oil and natural gas properties.PV-10, however, is not a substitute for the standardized measure of discounted future net cash flows. OurPV-10 measure and the standardized measure of discounted future net cash flows do not purport to present the fair value of our oil and natural gas reserves.
The following table provides a reconciliation of the standardized measure of discounted future net cash flows toPV-10 as of December 31, 2005 and 2006.
| (Dollars in millions) | Pro forma 2005 | 2006 | ||||||
| PV-10 | $ | 1,324.5 | $ | 954.0 | ||||
| Present value of future income tax discounted at 10% | (379.7 | ) | (243.7 | ) | ||||
| Standardized measure of discounted future cash flows | $ | 944.8 | $ | 710.3 | ||||
EBITDAX
We define EBITDAX as income before accounting changes, plus (1) interest, the amortization of related debt issuance costs and other financing costs, net of capitalized interest, (2) federal and state income taxes, (3) depreciation, depletion, amortization and accretion, (4) hedge ineffectiveness, (5) property impairments, (6) exploration expense and dry hole costs, (7) (gain) loss on derivatives not designated as hedges, and (8) stock-based compensation expense.
Our EBITDAX measure provides additional information which may be used to better understand our operations. EBITDAX is commonly accepted as providing useful information regarding a company’s ability to service and incur debt. EBITDAX is used as a supplemental financial measurement in the evaluation of our business and should not be considered as an alternative to net income, as an indicator of our operating performance, as an alternative to cash flows from operating activities or as a measure of liquidity. We consider exploration expense and dry hole costs in EBITDAX so that our calculation of EBITDAX will be comparable to EBITDA of companies that employ the full-cost method of accounting for their oil and gas properties. However, EBITDAX as used by us may not be comparable to similarly titled measures reported by other companies. EBITDAX on a pro forma basis for the year ended December 31, 2006, gives effect to the combination transaction as if it had closed on January 1, 2006.
13
Table of Contents
The following table provides a reconciliation of net income (loss) to EBITDAX.
| Chase Group Properties | Concho Resources Inc. | ||||||||||||||||||||||
| Inception | Pro forma | ||||||||||||||||||||||
| (April 21, 2004) | year ended | ||||||||||||||||||||||
| Years ended December 31, | through December 31, | Years ended December 31, | December 31, | ||||||||||||||||||||
| (In thousands) | 2004 | 2005 | 2004 | 2005 | 2006 | 2006 | |||||||||||||||||
| Net income (loss) | $ | 53,618 | $ | 74,351 | $ | (2,656 | ) | $ | 1,954 | $ | 19,668 | $ | 23,451 | ||||||||||
| Interest expense | — | — | 272 | 3,096 | 30,567 | 35,790 | |||||||||||||||||
| Income tax expense (benefit) | — | — | (915 | ) | 2,039 | 14,379 | 16,797 | ||||||||||||||||
| Depreciation, depletion and accretion | 20,459 | 19,092 | 963 | 11,574 | 61,009 | 66,520 | |||||||||||||||||
| Ineffective portion of cash flow hedges | — | — | — | 1,148 | (1,193 | ) | (1,193 | ) | |||||||||||||||
| Impairments of proved oil and gas properties | 3,233 | 194 | — | 2,295 | 9,891 | 9,892 | |||||||||||||||||
| Exploration and abandonments | 179 | — | 1,850 | 2,666 | 5,612 | 5,612 | |||||||||||||||||
| (Gain) loss on derivatives not designated as hedges | 7,936 | 1,062 | (684 | ) | 5,001 | — | — | ||||||||||||||||
| Stock-based compensation | — | — | 1,128 | 3,252 | 9,144 | 9,144 | |||||||||||||||||
| EBITDAX | $ | 85,425 | $ | 94,699 | $ | (42 | ) | $ | 33,025 | $ | 149,077 | $ | 166,013 | ||||||||||
14
Table of Contents
Risk factors
You should carefully consider the risk factors set forth below as well as the other information contained in this prospectus before investing in our common stock. Any of the following risks could materially and adversely affect our business, financial condition or results of operations. In such a case, you may lose all or part of your investment. The risks described below are not the only risks facing us. Additional risks and uncertainties not currently known to us or those we currently view to be immaterial may also materially adversely affect our business, financial condition or results of operations.
Risks relating to our business
Oil and natural gas prices are volatile. A decline in oil and natural gas prices could adversely affect our financial position, financial results, cash flows, access to capital and ability to grow.
Our future financial condition, revenues, results of operations, rate of growth and the carrying value of our oil and natural gas properties depend primarily upon the prices we receive for our oil and natural gas production and the prices prevailing from time to time for oil and natural gas. Oil and natural gas prices historically have been volatile and are likely to continue to be volatile in the future, especially given current geopolitical conditions. This price volatility also affects the amount of our cash flow we have available for capital expenditures and our ability to borrow money or raise additional capital. The prices for oil and natural gas are subject to a variety of factors that are beyond our control. These factors include:
| • | the level of consumer demand for oil and natural gas; |
| • | the domestic and foreign supply of oil and natural gas; |
| • | commodity processing, gathering and transportation availability, and the availability of refining capacity; |
| • | the price and level of imports of foreign oil and natural gas; |
| • | the ability of the members of the Organization of Petroleum Exporting Countries to agree to and maintain oil price and production controls; |
| • | domestic and foreign governmental regulations and taxes; |
| • | the price and availability of alternative fuel sources; |
| • | weather conditions; |
| • | political conditions or hostilities in oil and natural gas producing regions, including the Middle East and South America; |
| • | technological advances affecting energy consumption; and |
| • | worldwide economic conditions. |
These factors and the volatility of the energy markets generally make it extremely difficult to predict future oil and natural gas price movements with any certainty. Declines in oil and natural gas prices would not only reduce our revenue, but could reduce the amount of oil and natural gas that we can produce economically and, as a result, could have a material adverse effect on our financial condition, results of operations and reserves. If the oil and natural gas
15
Table of Contents
industry experiences significant price declines, we may, among other things, be unable to maintain or increase our borrowing capacity, repay current or future indebtedness or obtain additional capital on attractive terms, all of which can affect the value of our common stock.
Furthermore, recent oil prices have been high compared to historical prices and have been particularly volatile. For example, the NYMEX crude oil price per Bbl was $32.52, $43.45, $61.04 and $61.15 as of December 31, 2003, 2004, 2005 and 2006, respectively, and during 2006 the NYMEX crude oil spot price ranged from a high of $77.03 to a low of $55.81. In addition, natural gas prices have been subject to significant fluctuations during the past several years. For example, the NYMEX natural gas price per Mcf was $5.96, $6.18, $10.08 and $5.64 as of December 31, 2003, 2004, 2005 and 2006, respectively, and during 2006 the NYMEX natural gas spot price ranged from a high of $9.87 to a low of $3.63.
Drilling for and producing oil and natural gas are high-risk activities with many uncertainties that could adversely affect our business, financial condition or results of operations.
Our future financial condition and results of operations will depend on the success of our exploitation, exploration, development and production activities. Our oil and natural gas exploration and production activities are subject to numerous risks beyond our control, including the risk that drilling will not result in commercially viable oil or natural gas production. Our decisions to purchase, explore, develop or otherwise exploit prospects or properties will depend in part on the evaluation of data obtained through geophysical and geological analyses, production data and engineering studies, the results of which are often inconclusive or subject to varying interpretations. For a discussion of the uncertainty involved in these processes, see “—Reserve estimates depend on many assumptions that may turn out to be inaccurate. Any material inaccuracies in these reserve estimates or underlying assumptions will materially affect the quantities and present value of our reserves.” Our cost of drilling, completing, equipping and operating wells is often uncertain before drilling commences. Overruns in budgeted expenditures are common risks that can make a particular project uneconomical. Further, many factors may curtail, delay or cancel drilling, including the following:
| • | delays imposed by or resulting from compliance with regulatory and contractual requirements; |
| • | pressure or irregularities in geological formations; |
| • | shortages of or delays in obtaining equipment and qualified personnel; |
| • | equipment failures or accidents; |
| • | adverse weather conditions; |
| • | reductions in oil and natural gas prices; |
| • | surface access restrictions; |
| • | title problems; and |
| • | limitations in the market for oil and natural gas. |
16
Table of Contents
Reserve estimates depend on many assumptions that may turn out to be inaccurate. Any material inaccuracies in these reserve estimates or underlying assumptions will materially affect the quantities and present value of our reserves.
The process of estimating oil and natural gas reserves is complex. It requires interpretations of available technical data and many estimates, including estimates based upon assumptions relating to economic factors. Any significant inaccuracies in these interpretations or estimates could materially affect the estimated quantities and present value of reserves shown in this prospectus. See “Business and properties—Our oil and natural gas reserves” for information about our oil and natural gas reserves.
In order to prepare our estimates, we must project production rates and timing of development expenditures. We must also analyze available geological, geophysical, production and engineering data. The extent, quality and reliability of this data can vary. The process also requires economic assumptions about matters such as oil and natural gas prices, drilling and operating expenses, the amount and timing of capital expenditures, taxes and the availability of funds.
Actual future production, oil and natural gas prices, revenues, taxes, development expenditures, operating expenses and quantities of recoverable oil and natural gas reserves most likely will vary from our estimates. Any significant variance could materially affect the estimated quantities and present value of reserves shown in this prospectus. For example, in connection with the preparation of our total estimated net proved reserves as of December 31, 2006, we revised our estimated natural gas reserves downward by 16,595 MMcf from our previous estimates. This reduction in natural gas reserves was primarily because of the decrease in natural gas prices during 2006. In addition, we may adjust estimates of proved reserves to reflect production history, results of exploration and development, prevailing oil and natural gas prices and other factors, many of which are beyond our control.
You should not assume that the present value of future net revenues from our proved reserves referred to in this prospectus is the current market value of our estimated oil and natural gas reserves. In accordance with SEC requirements, we generally base the estimated discounted future net cash flows from our proved reserves on prices and costs on the date of the estimate. Actual future prices and costs may differ materially from those used in the present value estimate. If oil prices decline by $1.00 per Bbl, then ourPV-10 as of December 31, 2006, would decrease from $954.0 million to $934.9 million. If natural gas prices decline by $0.10 per Mcf, then ourPV-10 as of December 31, 2006, would decrease from $954.0 million to $945.3 million. Any adjustments to the estimates of proved reserves or decreases in the price of oil or natural gas may decrease the value of our common stock.
Almost all of our producing properties are located in the Permian Basin region of Southeast New Mexico and West Texas, making us vulnerable to risks associated with operating in one major geographic area. In addition, a substantial portion of our proved reserves as of December 31, 2006, are from a single producing horizon within this area.
Our producing properties are geographically concentrated in the Permian Basin region of Southeast New Mexico and West Texas. At December 31, 2006, approximately 99% of ourPV-10 was attributable to properties located in the Permian Basin. As a result of this concentration, we may be disproportionately exposed to the impact of regional supply and demand factors, delays or interruptions of production from these wells caused by significant governmental regulation, processing or transportation capacity constraints, market limitations, curtailment of production
17
Table of Contents
or interruption of the processing or transportation of oil and natural gas produced from the wells in these areas.
In addition to the geographic concentration of our producing properties described above, approximately 53% of our proved reserves as of December 31, 2006, were attributable to the Yeso formation, which includes both the Paddock and Blinebry intervals, underlying our oil and gas properties located in Southeast New Mexico. This concentration of assets within one producing horizon exposes us to risks such as changes in field-wide rules and regulations that could cause us to permanently or temporarily shut-in all of our wells within the field. Furthermore, we are in the process of drilling and completing wells in the Blinebry interval (the lower member of the Yeso formation), which lies beneath the Paddock interval on certain of our properties located in Southeast New Mexico. These activities could result in delays in the production of our proved reserves from the Paddock interval in the event that commingling of both formations is imprudent or otherwise not feasible.
Part of our strategy involves exploratory drilling, including drilling in new or emerging plays. As a result, our drilling results in these areas are uncertain, and the value of our undeveloped acreage will decline if drilling results are unsuccessful.
The results of our exploratory drilling in new or emerging areas are more uncertain than drilling results in areas that are developed and have established production. Since new or emerging plays and new formations have limited or no production history, we are unable to use past drilling results in those areas to help predict our future drilling results. As a result, our cost of drilling, completing and operating wells in these areas may be higher than initially expected, and the value of our undeveloped acreage will decline if drilling results are unsuccessful.
Our commodity price risk management program may cause us to forego additional future profits or result in our making cash payments to our counterparties.
To reduce our exposure to changes in the prices of oil and natural gas, we have entered into and may in the future enter into additional commodity price risk management arrangements for a portion of our oil and natural gas production. The agreements that we have entered into generally have the effect of providing us with a fixed price for a portion of our expected future oil and natural gas production over a fixed period of time. Commodity price risk management arrangements expose us to the risk of financial loss and may limit our ability to benefit from increases in oil and natural gas prices in some circumstances, including the following:
| • | the counterparty to a commodity price risk management contract may default on its contractual obligations to us; |
| • | there may be a change in the expected differential between the underlying price in a commodity price risk management agreement and actual prices received; or |
| • | market prices may exceed the prices which we are contracted to receive, resulting in our need to make significant cash payments to our contract counterparty. |
Our commodity price risk management activities could have the effect of reducing our revenues and the value of our common stock. As of December 31, 2006, the net unrealized gain on our commodity price risk management contracts was $0.7 million. An average increase in the commodity price of $1 per barrel of crude oil and $0.10 per Mcf for natural gas would have resulted in a decrease in the net unrealized gain on our commodity price risk management
18
Table of Contents
contracts as reflected on our balance sheet as of December 31, 2006 of approximately $2.3 million. We may continue to incur significant unrealized gains or losses in the future from our commodity price risk management activities to the extent market prices continue to increase and our derivatives contracts remain in place. See “Management’s discussion and analysis of financial condition and results of operations—Liquidity and capital resources—Hedging.”
Our working capital could be adversely affected if we enter into derivative instruments that require cash collateral.
The use of derivatives may, in some cases, require the posting of cash collateral with counterparties. Although we currently do not, and do not anticipate that we will in the future, enter into derivative contracts that require an initial deposit of cash collateral, our working capital could be impacted if we enter into derivative instruments that require cash collateral and commodity prices change in a manner adverse to us. Future collateral requirements are uncertain and will depend on arrangements with our counterparties and highly volatile oil and natural gas prices.
Our business requires substantial capital expenditures. We may be unable to obtain needed capital or financing on satisfactory terms or at all, which could lead to a decline in our oil and natural gas reserves.
The oil and natural gas industry is capital intensive. We make and expect to continue to make substantial capital expenditures in our business for the development, exploitation, production and acquisition of oil and natural gas reserves. For example, during the first three months of 2007, we were required to curtail our drilling program due to a number of factors, including a shortage of capital to fund our capital expenditures. We intend to finance our future capital expenditures primarily through cash flow from operations and through borrowings under our revolving credit facility; however, our financing needs may require us to alter or increase our capitalization substantially through the issuance of debt or equity securities. The issuance of additional equity securities could have a dilutive effect on the value of your common stock. Additional borrowings under our revolving credit facility or the issuance of additional debt will require that a greater portion of our cash flow from operations be used for the payment of interest and principal on our debt, thereby reducing our ability to use cash flow to fund working capital, capital expenditures and acquisitions. Additionally, we cannot be certain that additional financing will be available on acceptable terms or at all. In the event additional capital resources are unavailable, we may curtail drilling, development and other activities or be forced to sell some of our assets on an untimely or unfavorable basis.
Our cash flow from operations and access to capital are subject to a number of variables, including:
| • | our proved reserves; |
| • | the level of oil and natural gas we are able to produce from existing wells; |
| • | the prices at which our oil and natural gas are sold; and |
| • | our ability to acquire, locate and produce new reserves. |
If our revenues or the borrowing base under our revolving credit facility decrease as a result of lower oil or natural gas prices, operating difficulties, declines in reserves, lending requirements
19
Table of Contents
or regulations, or for any other reason, we may have limited ability to obtain the capital necessary to sustain our operations at current levels. We expect that we will require additional capital to fund our operations, and we may not be able to obtain debt or equity financing to satisfy our capital requirements. If cash generated from operations or cash available under our revolving credit facility is not sufficient to meet our capital requirements, the failure to obtain additional financing could result in a curtailment of our operations relating to development of our prospects, which in turn could lead to a decline in our oil and natural gas reserves, and could adversely affect our business, financial condition and results of operations.
Our identified inventory of drilling locations and recompletion opportunities are scheduled out over several years, making them susceptible to uncertainties that could materially alter the occurrence or timing of their drilling.
Our management has specifically identified and scheduled the drilling and recompletion of our drilling and recompletion opportunities as an estimation of our future multi-year development activities on our existing acreage. As of December 31, 2006, we had identified 1,676 drilling locations with proved undeveloped reserves attributable to 595 of such locations, and 540 recompletion opportunities with proved reserves attributed to 222 of such opportunities. These identified opportunities represent a significant part of our growth strategy. Our ability to drill and develop these opportunities depends on a number of uncertainties, including the availability of capital, equipment, services and personnel, seasonal conditions, regulatory and third party approvals, oil and natural gas prices, costs and drilling and recompletion results. Because of these uncertainties, we do not know if the numerous potential opportunities we have identified will ever be drilled or recompleted or if we will be able to produce oil or natural gas from these or any other potential opportunities. As such, our actual development activities may materially differ from those presently identified, which could adversely affect our business.
Approximately 46% of our total estimated net proved reserves as of December 31, 2006, were undeveloped, and those reserves may not ultimately be developed.
As of December 31, 2006, approximately 46% of our total estimated net proved reserves were undeveloped. Recovery of undeveloped reserves requires significant capital expenditures and successful drilling. The reserve data assumes that we can and will make these expenditures and conduct these operations successfully. While we are reasonably certain of our ability to make these expenditures and to conduct these operations under existing economic conditions, these assumptions may not prove correct. If we choose not to spend the capital to develop these reserves, or if we are not able to successfully develop these reserves, we will be required to write-off these reserves. Any such write-offs of our reserves could reduce our ability to borrow money and could reduce the value of our common stock.
We cannot control the development of the properties we own but do not operate, which may adversely affect our production, revenues and results of operations.
As of December 31, 2006, approximately 11% of ourPV-10 was attributable to properties for which we were not designated as the operator. As a result, the success and timing of our drilling and development activities on such nonoperated properties depend upon a number of factors outside of our control, including:
| • | the nature and timing of drilling and operational activities; |
20
Table of Contents
| • | the timing and amount of capital expenditures; |
| • | the operators’ expertise and financial resources; |
| • | the approval of other participants in such properties; and |
| • | the selection of suitable technology. |
If drilling and development activities are not conducted on these properties or are not conducted on a timely basis, we may be unable to increase our production or offset normal production declines, which may adversely affect our production, revenues and results of operations.
Unless we replace our oil and natural gas reserves, our reserves and production will decline, which would adversely affect our cash flows and results of operations.
Unless we conduct successful development, exploitation and exploration activities or acquire properties containing proved reserves, our proved reserves will decline as those reserves are produced. Producing oil and natural gas reservoirs generally are characterized by declining production rates that vary depending upon reservoir characteristics and other factors. Our future oil and natural gas reserves and production, and therefore our cash flow and results of operations, are highly dependent on our success in efficiently developing and exploiting our current reserves and economically finding or acquiring additional recoverable reserves. We may not be able to develop, exploit, find or acquire sufficient additional reserves to replace our current and future production.
We may be unable to make attractive acquisitions or integrate acquired companies, and any inability to do so may disrupt our business.
One aspect of our business strategy calls for acquisitions of businesses that complement or expand our current business. We cannot assure you that we will be able to identify attractive acquisition opportunities. Even if we do identify attractive candidates, we cannot assure you that we will be able to complete the acquisition of them or do so on commercially acceptable terms. If we acquire another business, we could have difficulty integrating its operations, systems, management and other personnel and technology with our own. These difficulties could disrupt our ongoing business, distract our management and employees, increase our expenses and adversely affect our results of operations. Even if these difficulties could be overcome, we cannot assure you that the anticipated benefits of any acquisition would be realized. In addition, we may incur additional debt or issue additional equity to pay for any future acquisitions.
Acquisitions may prove to be worth less than we paid because of uncertainties in evaluating recoverable reserves and potential liabilities.
We obtained nearly all of our current reserve base through acquisitions of producing properties and undeveloped acreage. We expect acquisitions will continue to contribute to our future growth. Successful acquisitions require an assessment of a number of factors, including estimates of recoverable reserves, exploration potential, future oil and gas prices, operating costs and potential environmental and other liabilities. Such assessments are inexact and their accuracy is inherently uncertain. In connection with our assessments, we perform a review of the acquired properties, which we believe is generally consistent with industry practices. However, such a
21
Table of Contents
review will not reveal all existing or potential problems. In addition, our review may not permit us to become sufficiently familiar with the properties to fully assess their deficiencies and capabilities. We do not inspect every well. Even when we inspect a well, we do not always discover structural, subsurface and environmental problems that may exist or arise.
We are generally not entitled to contractual indemnification for preclosing liabilities, including environmental liabilities. Normally, we acquire interests in properties on an “as is” basis with limited remedies for breaches of representations and warranties.
Competition in the oil and natural gas industry is intense, making it more difficult for us to acquire properties, market oil and natural gas and secure trained personnel.
We operate in a highly competitive environment for acquiring properties, marketing oil and natural gas and securing trained personnel. Many of our competitors possess and employ financial, technical and personnel resources substantially greater than ours, which can be particularly important in the areas in which we operate. Those companies may be able to pay more for productive oil and natural gas properties and exploratory prospects and to evaluate, bid for and purchase a greater number of properties and prospects than our financial or personnel resources permit. In addition, those companies may be able to offer better compensation packages to attract and retain qualified personnel than we are able to offer. The cost to attract and retain qualified personnel has increased over the past few years due to competition and may increase substantially in the future. Our ability to acquire additional prospects and to find and develop reserves in the future will depend on our ability to evaluate and select suitable properties and to consummate transactions in a highly competitive environment. Also, there is substantial competition for capital available for investment in the oil and natural gas industry. We may not be able to compete successfully in the future in acquiring prospective reserves, developing reserves, marketing hydrocarbons, attracting and retaining quality personnel and raising additional capital. Our failure to acquire properties, market oil and natural gas and secure trained personnel and increased compensation for trained personnel could have a material adverse effect on our business.
Shortages of oil field equipment, services and qualified personnel could reduce our cash flow and adversely affect our results of operations.
The demand for qualified and experienced field personnel to drill wells and conduct field operations, geologists, geophysicists, engineers and other professionals in the oil and natural gas industry can fluctuate significantly, often in correlation with oil and natural gas prices, causing periodic shortages. Historically, there have been shortages of drilling rigs and other oilfield equipment as demand for rigs and equipment has increased along with the number of wells being drilled. These factors also cause significant increases in costs for equipment, services and personnel. Higher oil and natural gas prices generally stimulate demand and result in increased prices for drilling rigs, crews and associated supplies, equipment and services. It is beyond our control and ability to predict whether these conditions will exist in the future and, if so, what their timing and duration will be. These types of shortages or price increases could significantly decrease our profit margin, cash flow and operating results, or restrict our ability to drill the wells and conduct the operations which we currently have planned and budgeted or which we may plan in the future.
Because of the termination of our Transition Services Agreement with Mack Energy upon the completion of this offering, we must hire or relocate personnel to assume the daily operations
22
Table of Contents
of certain of our properties in the Permian Basin region of Southeast New Mexico. If we are not able to hire or relocate sufficient personnel to operate these properties, we may be forced to curtail operations in this area, which would result in a decrease in our rate of production and would have an adverse effect on our cash flow and results of operations.
Our exploration and development drilling may not result in commercially productive reserves.
Drilling activities are subject to many risks, including the risk that commercially productive reservoirs will not be encountered. New wells that we drill may not be productive, or we may not recover all or any portion of our investment in such wells. The seismic data and other technologies we use do not allow us to know conclusively prior to drilling a well that oil or natural gas is present or may be produced economically. Drilling for oil and natural gas often involves unprofitable efforts, not only from dry holes but also from wells that are productive but do not produce sufficient net reserves to return a profit at then realized prices after deducting drilling, operating and other costs. The cost of drilling, completing and operating a well is often uncertain, and cost factors can adversely affect the economics of a project. Further, our drilling operations may be curtailed, delayed or canceled as a result of numerous factors, including:
| • | unexpected drilling conditions; |
| • | title problems; |
| • | pressure or lost circulation in formations; |
| • | equipment failures or accidents; |
| • | adverse weather conditions; |
| • | compliance with environmental and other governmental or contractual requirements; and |
| • | increases in the cost of, or shortages or delays in the availability of, electricity, supplies, materials, drilling or workover rigs, equipment and services. |
We may incur substantial losses and be subject to substantial liability claims as a result of our oil and natural gas operations. In addition, we may not be insured for, or our insurance may be inadequate to protect us against, these risks.
We are not insured against all risks. Losses and liabilities arising from uninsured and underinsured events could materially and adversely affect our business, financial condition or results of operations. Our oil and natural gas exploration and production activities are subject to all of the operating risks associated with drilling for and producing oil and natural gas, including the possibility of:
| • | environmental hazards, such as uncontrollable flows of oil, natural gas, brine, well fluids, toxic gas or other pollution into the environment, including groundwater contamination; |
| • | abnormally pressured or structured formations; |
| • | mechanical difficulties, such as stuck oilfield drilling and service tools and casing collapse; |
| • | fires, explosions and ruptures of pipelines; |
| • | personal injuries and death; and |
23
Table of Contents
| • | natural disasters. |
Any of these risks could adversely affect our ability to conduct operations or result in substantial losses to our company as a result of:
| • | injury or loss of life; |
| • | damage to and destruction of property, natural resources and equipment; |
| • | pollution and other environmental damage; |
| • | regulatory investigations and penalties; |
| • | suspension of our operations; and |
| • | repair and remediation costs. |
We may elect not to obtain insurance if we believe that the cost of available insurance is excessive relative to the risks presented. In addition, pollution and environmental risks generally are not fully insurable. The occurrence of an event that is not covered or not fully covered by insurance could have a material adverse effect on our business, financial condition or results of operations.
Market conditions or operational impediments may hinder our access to oil and natural gas markets or delay our production.
Market conditions or the unavailability of satisfactory oil and natural gas processing or transportation arrangements may hinder our access to oil and natural gas markets or delay our production. The availability of a ready market for our oil and natural gas production depends on a number of factors, including the demand for and supply of oil and natural gas and the proximity of reserves to pipelines and terminal facilities. Our ability to market our production depends in substantial part on the availability and capacity of gathering systems, pipelines and processing facilities owned and operated by third parties. Our failure to obtain such services on acceptable terms could have a material adverse effect on our business, financial condition and results of operations. We may be required to shut in wells due to lack of a market or inadequacy or unavailability of crude oil or natural gas pipeline or gathering system capacity. If that were to occur, then we would be unable to realize revenue from those wells until suitable arrangements were made to market our production.
We are subject to complex federal, state, local and other laws and regulations that could adversely affect the cost, timing, manner or feasibility of conducting our operations.
Our oil and natural gas exploration, development and production, and saltwater disposal operations are subject to complex and stringent laws and regulations. In order to conduct our operations in compliance with these laws and regulations, we must obtain and maintain numerous permits, approvals and certificates from various federal, state, local and governmental authorities. We may incur substantial costs and experience delays in order to maintain compliance with these existing laws and regulations. In addition, our costs of compliance may increase or our operations may be otherwise adversely affected if existing laws and regulations are revised or reinterpreted, or if new laws and regulations become applicable to our operations. For instance, the New Mexico Oil Conservation Division is considering amending or replacing an existing rule regulating the permitting, construction, operation and closure of oilfield pits at
24
Table of Contents
well sites in New Mexico. If the agency adopts a new or revised pit rule that imposes stricter requirements on the construction and use of oilfield pits, then it is possible that the cost to operate our wells in New Mexico could increase. These and other future costs could have a material adverse effect on our business, financial condition or results of operations.
Our business is subject to federal, state and local laws and regulations as interpreted and enforced by governmental authorities possessing jurisdiction over various aspects of the exploration for, and the production of, oil and natural gas. Failure to comply with such laws and regulations, as interpreted and enforced, could have a material adverse effect on our business, financial condition or results of operations. Please read “Business and properties—Applicable laws and regulations” for a description of the laws and regulations that affect us.
Our operations expose us to significant costs and liabilities with respect to environmental and operational safety matters.
We may incur significant delays, costs and liabilities as a result of environmental, health and safety requirements applicable to our oil and natural gas exploration, development and production, and saltwater disposal activities. These delays, costs and liabilities could arise under a wide range of federal, state and local laws and regulations relating to protection of the environment, health and safety, including regulations and enforcement policies that have tended to become increasingly strict over time. Failure to comply with these laws and regulations may result in the assessment of administrative, civil and criminal penalties, imposition of cleanup and site restoration costs and liens, and, to a lesser extent, issuance of injunctions to limit or cease operations. In addition, claims for damages to persons or property, including natural resources, may result from the environmental, health and safety impacts of our operations.
Strict as well as joint and several liability may be imposed under certain environmental laws, which could cause us to become liable for the conduct of others or for consequences of our own actions that were in compliance with all applicable laws at the time those actions were taken. New laws, regulations or enforcement policies could be more stringent and impose unforeseen liabilities or significantly increase compliance costs. If we were not able to recover the resulting costs through insurance or increased revenues, our business, financial condition or results of operations could be adversely affected. Please read “Business and properties—Applicable laws and regulations—Environmental, health and safety matters” for more information.
The loss of our chief executive officer or our chief operating officer or other key personnel could adversely affect our business.
We depend, and will continue to depend in the foreseeable future, on the services of Timothy A. Leach, our chairman of the board and chief executive officer, Steven L. Beal, our president and chief operating officer, and other officers and key employees with extensive experience and expertise in evaluating and analyzing producing oil and natural gas properties and drilling prospects, maximizing production from oil and natural gas properties, marketing oil and gas production, and developing and executing acquisition, financing and hedging strategies. These persons include the executive officers listed in “Management—Executive officers and directors.” Our ability to hire and retain our officers is important to our continued success and growth. The unexpected loss of the services of one or more of these individuals could have a detrimental effect on our business.
25
Table of Contents
The results of enhanced recovery methods are uncertain.
We inject water into formations on some of our properties to increase the production of oil and natural gas. We may in the future expand these efforts to more of our properties or employ other enhanced recovery methods in our operations. The additional production and reserves attributable to the use of enhanced recovery methods are inherently difficult to predict. If our enhanced recovery programs do not allow for the extraction of oil and natural gas in a manner or to the extent that we anticipate, our future results of operations and financial condition could be materially and adversely affected.
Failure by us to achieve and maintain effective internal control over financial reporting in accordance with the rules of the SEC could harm our business and operating resultsand/or result in a loss of investor confidence in our financial reports, which could have a material adverse effect on our business and stock price.
We are in the process of evaluating our internal controls systems to allow management to report on, and our independent auditors to audit, our internal controls over financial reporting. We will be performing the system and process evaluation and testing (and any necessary remediation) required to comply with the management certification and auditor attestation requirements of Section 404 of the Sarbanes-Oxley Act of 2002. We will be required to comply with Section 404 for the year ending December 31, 2008. However, we cannot be certain as to the timing of completion of our evaluation, testing and remediation actions or the impact of the same on our operations. Furthermore, upon completion of this process, we may identify control deficiencies of varying degrees of severity under applicable SEC and Public Company Accounting Oversight Board rules and regulations that remain unremediated. As a public company, we will be required to report, among other things, control deficiencies that constitute a “material weakness” or changes in internal controls that, or that are reasonably likely to, materially affect internal controls over financial reporting. A “material weakness” is a significant deficiency or combination of significant deficiencies that results in more than a remote likelihood that a material misstatement of the annual or interim consolidated financial statements will not be prevented or detected. If we fail to implement the requirements of Section 404 in a timely manner, we might be subject to sanctions or investigation by regulatory authorities such as the SEC. In addition, failure to comply with Section 404 or the report by us of a material weakness may cause investors to lose confidence in our consolidated financial statements, and our stock price may be adversely affected as a result. If we fail to remedy any material weakness, our consolidated financial statements may be inaccurate, we may face restricted access to the capital markets and our stock price may be adversely affected.
Our indebtedness could restrict our operations and make us more vulnerable to adverse economic conditions.
We now have, and after this offering will continue to have, a significant amount of indebtedness, and the terms of our revolving credit facility require us to pay higher interest rate margins as we utilize a larger percentage of our available borrowing base. As of December 31, 2006, our total debt was $495.5 million, and on an as adjusted basis (as if we had closed this offering and used the net proceeds as described in “Use of proceeds” on that date), our total debt would have been $ million. At December 31, 2006, our revolving credit facility bore interest at a rate of 7.85% per annum. In addition, on March 27, 2007, we entered into a second lien term loan facility that currently bears interest at 9.10% per annum and that was fully funded in the amount of $200.0 million. The $199.0 million in proceeds under this second lien term loan were
26
Table of Contents
used to repay the $39.8 million outstanding under our prior term loan facility, to reduce the outstanding balance under our revolving credit facility by $154.0 million and to pay $5.2 million in loan fees, accrued interest and for general corporate purposes. Assuming our total debt outstanding as of December 31, 2006 was held constant throughout the year ended December 31, 2006, if interest rates increased or decreased by 1% per annum, interest expense for the year ended December 31, 2006 would have increased or decreased by approximately $5.0 million. As of December 31, 2006, we had a total borrowing capacity of $475.0 million under our revolving credit facility, of which $19.3 million was available. In connection with our entry into our second lien term loan facility on March 27, 2007, the total borrowing capacity under our revolving credit facility was reduced to $375.0 million. The amount of the borrowing capacity that was available under our revolving credit facility as of December 31, 2006, would have been increased by $54.0 million as a result of the reduction of our total borrowing capacity under our revolving credit facility in connection with our entry into the second lien term loan facility and the application of the proceeds from our second lien term loan facility to repay a portion of our indebtedness under our revolving credit facility had such repayment occurred on December 31, 2006.
Our current and future indebtedness could have important consequences to you. For example, it could:
| • | impair our ability to make investments and obtain additional financing for working capital, capital expenditures, acquisitions or other general corporate purposes; |
| • | limit our ability to use operating cash flow in other areas of our business because we must dedicate a substantial portion of these funds to make principal and interest payments on our indebtedness; |
| • | limit our ability to borrow funds that may be necessary to operate or expand our business; |
| • | put us at a competitive disadvantage to competitors that have less debt; |
| • | increase our vulnerability to interest rate increases; and |
| • | hinder our ability to adjust to rapidly changing economic and industry conditions. |
Our ability to meet our debt service and other obligations may depend in significant part on the extent to which we can successfully implement our business strategy. We may not be able to implement or realize the benefits of our business strategy.
Our existing bank credit facilities impose restrictions on us that may affect our ability to successfully operate our business.
Our bank credit facilities limit our ability to take various actions, such as:
| • | incurring additional indebtedness; |
| • | paying dividends; |
| • | creating certain additional liens on our assets; |
| • | entering into sale and leaseback transactions; |
| • | making investments; |
27
Table of Contents
| • | entering into transactions with affiliates; |
| • | making material changes to the type of business we conduct or our business structure; |
| • | making guarantees; |
| • | disposing of assets in excess of certain permitted amounts; |
| • | merging or consolidating with other entities; and |
| • | selling all or substantially all of our assets. |
In addition, our bank credit facilities require us to maintain certain financial ratios and to satisfy certain financial conditions, which may require us to reduce our debt or take some other action in order to comply with each of them.
These restrictions could also limit our ability to obtain future financings, make needed capital expenditures, withstand a downturn in our business or the economy in general, or otherwise conduct necessary corporate activities. We also may be prevented from taking advantage of business opportunities that arise because of the limitations imposed on us by the restrictive covenants under each of our bank credit facilities.
Severe weather could have a material adverse impact on our business.
Our business could be materially and adversely affected by severe weather. Repercussions of severe weather conditions may include:
| • | curtailment of services; |
| • | weather-related damage to drilling rigs, resulting in suspension of operations; |
| • | weather-related damage to our facilities; |
| • | inability to deliver materials to jobsites in accordance with contract schedules; and |
| • | loss of productivity. |
A terrorist attack or armed conflict could harm our business.
Terrorist activities, anti-terrorist efforts and other armed conflict involving the United States may adversely affect the United States and global economies and could prevent us from meeting our financial and other obligations. If any of these events occur or escalate, the resulting political instability and societal disruption could reduce overall demand for oil and natural gas, potentially putting downward pressure on demand for our services and causing a reduction in our revenue. Oil and natural gas related facilities could be direct targets of terrorist attacks, and our operations could be adversely impacted if significant infrastructure or facilities we use for the production, transportation or marketing of our oil and natural gas production are destroyed or damaged. Costs for insurance and other security may increase as a result of these threats, and some insurance coverage may become more difficult to obtain, if available at all.
28
Table of Contents
Risks relating to the offering and our common stock
Certain stockholders’ shares are restricted from immediate resale but may be sold into the market in the near future. This could cause the market price of our common stock to drop significantly.
After this offering, we will have outstanding shares of common stock. Of these shares, the shares we and the selling stockholders are selling in this offering, or shares if the underwriters exercise their over-allotment option in full, will be freely tradeable without restriction under the Securities Act except for any shares purchased by one of our “affiliates” as defined in Rule 144 under the Securities Act. A total of shares, or shares if the underwriters exercise their over-allotment option in full, will be “restricted securities” (within the meaning of Rule 144 under the Securities Act) or subject tolock-up arrangements. In connection with this offering, we, our officers and directors and certain of our existing stockholders (including the selling stockholders) have entered intolock-up agreements under which we and they have agreed not to offer or sell any shares of common stock or securities convertible into or exchangeable or exercisable for shares of common stock for an initial period of 180 days from the date of this prospectus without the prior written consent of J.P. Morgan Securities Inc. and Banc of America Securities LLC, on behalf of the underwriters. J.P. Morgan Securities Inc. and Banc of America Securities LLC may, at any time and without notice, waive any of the terms of theselock-up agreements. See “Underwriting” for a description of theselock-up agreements. An aggregate of of these shares will become available for resale in the public market as shown in the chart below.
| Number of | ||
| shares | Date of eligibility for resale into public market | |
| No less than 180 days after the date of this prospectus (in accordance withlock-up agreements with the underwriters). | ||
| Between 181 and 365 days after the date of this prospectus due to the requirements of the federal securities laws. | ||
As soon as practicable after this offering, we intend to file one or more registration statements with the SEC onForm S-8 providing for the registration of shares of our common stock issued or reserved for issuance under our stock option plans. Subject to the exercise of unexercised options or the expiration or waiver of vesting conditions for restricted stock and the expiration oflock-ups we and certain of our stockholders have entered into, shares registered under these registration statements onForm S-8 will be available for resale immediately in the public market without restriction.
Our management and directors and their affiliates will beneficially own, control or have substantial influence over a significant amount of our common stock, giving them a significant influence over our corporate transactions and other matters. Their interests may conflict with yours, and the concentration of ownership of our common stock by such stockholders will limit the influence of public stockholders.
Upon the closing of this offering, our management, directors and their respective affiliates, will beneficially own, control or have substantial influence over approximately % of our outstanding common stock. If these stockholders voted together as a group, they would have the ability to exert significant influence over our board of directors and its policies. These stockholders would, acting together, be able to significantly influence the outcome of
29
Table of Contents
stockholder votes, including votes concerning the election of directors, the adoption or amendment of provisions in our certificate of incorporation or bylaws and possible mergers, corporate control contests and other significant corporate transactions. This concentration of ownership may have the effect of delaying, deferring or preventing a change in control, a merger, consolidation, takeover or other business combination. This concentration of ownership could also discourage a potential acquiror from making a tender offer or otherwise attempting to obtain control of us, which could in turn have an adverse effect on the market price of our common stock.
Purchasers of common stock will experience immediate and substantial dilution.
Based on an assumed initial public offering price of $ per share, purchasers of our common stock in this offering will experience an immediate and substantial dilution of $ per share in the net tangible book value per share of common stock from the initial public offering price, and our pro forma net tangible book value as of December 31, 2006, after giving effect to this offering, would be $ per share. You will incur further dilution if outstanding options to purchase common stock are exercised. In addition, our certificate of incorporation allows us to issue significant numbers of additional shares. Please read “Dilution” for a description of the calculation of net tangible book value.
Our certificate of incorporation, bylaws and Delaware law contain provisions that could discourage acquisition bids or merger proposals, which may adversely affect the market price of our common stock.
Our certificate of incorporation authorizes our board of directors to issue preferred stock without stockholder approval. If our board of directors elects to issue preferred stock, it could be more difficult for a third party to acquire us. In addition, some provisions of our certificate of incorporation, bylaws and Delaware law could make it more difficult for a third party to acquire control of us, even if the change of control would be beneficial to our stockholders, including:
| • | limitations on the removal of directors; |
| • | the prohibition of stockholder action by written consent; and |
| • | limitations on the ability of our stockholders to call special meetings and establish advance notice provisions for stockholder proposals and nominations for elections to the board of directors to be acted upon at meetings of stockholders. |
Please read “Description of capital stock—Anti-takeover provisions of our certificate of incorporation and bylaws” for more information about these provisions.
Because we have no plans to pay dividends on our common stock, investors must look solely to stock appreciation for a return on their investment in us.
We do not anticipate paying any cash dividends on our common stock in the foreseeable future. We currently intend to retain all future earnings to fund the development and growth of our business. Any payment of future dividends will be at the discretion of our board of directors and will depend on, among other things, our earnings, financial condition, capital requirements, level of indebtedness, statutory and contractual restrictions applying to the payment of dividends and other considerations that our board of directors deems relevant. The terms of our
30
Table of Contents
existing bank credit facilities restrict the payment of dividends without the prior written consent of the lenders. Investors must rely on sales of their common stock after price appreciation, which may never occur, as the only way to realize a return on their investment. Investors seeking cash dividends should not purchase our common stock.
There has been no active trading market for our common stock, and an active trading market may not develop.
Prior to this offering, there has been no public market for our common stock. We intend to apply to list our common stock for trading on the New York Stock Exchange. We do not know if an active trading market will develop for our common stock or how the common stock will trade in the future, which may make it more difficult for you to sell your shares. Negotiations among the underwriters, the selling stockholders and us will determine the initial public offering price, which may not be indicative of the price at which our common stock will trade following the closing of this offering. You may not be able to resell your shares at or above the initial public offering price.
If our stock price fluctuates after the initial offering, you could lose a significant part of your investment.
In recent years, the stock market has experienced extreme price and volume fluctuations. In addition, the trading prices of the stock of newly public companies often have been unrelated or out of proportion to the operating performance of these companies. This volatility has had a significant effect on the market price of securities issued by many companies for reasons unrelated to the operating performance of these companies. The market price of our common stock could similarly be subject to wide fluctuations in response to a number of factors, most of which we cannot control, including:
| • | changes in securities analysts’ recommendations and their estimates of our financial performance; |
| • | the public’s reaction to our press releases, announcements and our filings with the SEC and those of our competitors; |
| • | fluctuations in broader stock market prices and volumes, particularly among securities of oil and natural gas exploration and production companies; |
| • | changes in market valuations of similar companies; |
| • | investor perception of our industry or our prospects; |
| • | changes in interest rates generally; |
| • | additions or departures of key personnel; |
| • | commencement of or involvement in litigation; |
| • | changes in environmental and other governmental regulations; |
| • | announcements by us or our competitors of strategic alliances, significant contracts, new technologies, acquisitions, commercial relationships, joint ventures or capital commitments; |
31
Table of Contents
| • | variations in our quarterly results of operations or cash flows or those of other oil and natural gas exploration and production companies; |
| • | revenue and operating results failing to meet the expectations of securities analysts or investors in a particular quarter; |
| • | changes in the pricing policies of our suppliers and vendors; |
| • | future issuances and sales of our common stock; |
| • | demand for and trading volume of our common stock; |
| • | domestic and worldwide supplies and prices of and demand for oil and natural gas; and |
| • | changes in general conditions in the U.S. economy, financial markets or the oil and natural gas industry or the industries of our customers. |
The realization of any of these risks and other factors beyond our control could cause the market price of our common stock to decline significantly. In particular, the market price for our common stock may be influenced by variations in oil and natural gas prices This may cause our stock price to fluctuate with these underlying commodity prices, which are highly volatile.
If equity research analysts do not publish research or reports about our business or if they issue unfavorable commentary or downgrade our common stock, the price of our common stock could decline.
The trading market for our common stock may rely in part on the research and reports that equity research analysts publish about us and our business. We do not control the opinions of these analysts. The price of our stock could decline if one or more equity analysts downgrade our stock or if those analysts issue other unfavorable commentary or cease publishing reports about us or our business.
The availability of shares for sale in the future could reduce the market price of our common stock.
In the future, we may issue securities to raise cash for acquisitions. We may also acquire interests in other companies by using a combination of cash and our common stock or just our common stock. We may also issue securities convertible into our common stock. Any of these events may dilute your ownership interest in our company and have an adverse impact on the price of our common stock.
In addition, sales of a substantial amount of our common stock in the public market, or the perception that these sales may occur, could reduce the market price of our common stock. This could also impair our ability to raise additional capital through the sale of our securities.
The requirements of being a public company, including compliance with the reporting requirements of the Securities Exchange Act of 1934 and the requirements of the Sarbanes-Oxley Act, may strain our resources and increase our costs. We may be unable to comply with these requirements in a timely or cost-effective manner.
As a public company with listed equity securities, we will need to comply with new laws, regulations and requirements, certain corporate governance provisions of the Sarbanes-Oxley
32
Table of Contents
Act of 2002, related regulations of the SEC and the requirements of the NYSE with which we are not required to comply as a private company. Complying with these statutes, regulations and requirements will occupy a significant amount of the time of our board of directors and management and will increase our costs and expenses. We will need to:
| • | institute a more comprehensive compliance function; |
| • | design, establish, evaluate and maintain a system of internal controls over financial reporting in compliance with the requirements of Section 404 of the Sarbanes-Oxley Act of 2002 and the related rules and regulations of the SEC and the Public Company Accounting Oversight Board; |
| • | comply with rules promulgated by the NYSE; |
| • | prepare and distribute periodic public reports in compliance with our obligations under the federal securities laws; |
| • | establish new internal policies, such as those relating to disclosure controls and procedures and insider trading; |
| • | involve and retain to a greater degree outside counsel and accountants in the above activities; |
| • | establish an investor relations function; and |
| • | attract and retain qualified personnel for compliance. |
In addition, we also expect that being a public company subject to these rules and regulations will require us to modify our director and officer liability insurance, and we may be required to accept reduced coverage or to incur substantially higher costs to obtain coverage. These factors could also make it more difficult for us to attract and retain qualified members of our board of directors, particularly to serve on our audit committee, as well as qualified executive officers.
33
Table of Contents
Use of proceeds
We estimate that our net proceeds from this offering will be approximately $ million, assuming an initial public offering price of $ per share and after deducting underwriting discounts and commissions and estimated offering expenses. A $1.00 increase (decrease) in the assumed initial public offering price per share would increase (decrease) the net proceeds to us from this offering by $ million, assuming the number of shares offered by us, as set forth on the cover page of this prospectus, remains the same and after deducting underwriting discounts and estimated offering expenses payable by us. We intend to use all of the net proceeds we receive from this offering to repay a portion of our outstanding indebtedness under our second lien term loan facility, our revolving credit facility or a combination of the foregoing. Under the terms of our second lien term loan facility, we are obligated to use not less than 50% of our net proceeds to repay our outstanding indebtedness under our second lien term loan facility. Our second lien term loan facility currently bears interest at 9.10% per annum and matures on March 27, 2012. Our revolving credit facility bore interest at 7.85% per annum as of December 31, 2006, and matures on February 24, 2010. We will not receive any of the net proceeds from the sale of shares of common stock by the selling stockholders. See “Principal and selling stockholders.”
Certain affiliates of the underwriters to this offering are lenders under our second lien term loan facility and our revolving credit facility and will receive a portion of the net proceeds we receive from this offering based on the amount of the loans they have extended under these bank credit facilities. Banc of America Securities LLC is the lead arranger and book manager under our second lien term loan facility. In addition, each of BNP Paribas Securities Corp. and Merrill Lynch, Pierce, Fenner & Smith Incorporated has an affiliate that is a lenderand/or agent under our second lien term loan facility. In addition, under our revolving credit facility, JPMorgan Chase Bank, N.A. is the administrative agent, Bank of America, N.A. is the syndication agent and each of Wachovia Bank, National Association and BNP Paribas is a documentation agent. Each of these is a lender under our revolving credit facility and is an affiliate of one of the underwriters of this offering. Please read “Underwriting.”
Dividend policy
Following this offering of our common stock, we do not currently anticipate paying any cash dividends on our common stock. We currently intend to retain future earnings, if any, to finance the expansion of our business. Our future dividend policy is within the discretion of our board of directors and will depend upon various factors, including our results of operations, financial condition, capital requirements and investment opportunities. We are also currently prohibited from paying dividends by our bank credit facilities.
34
Table of Contents
Capitalization
The following table shows our cash and cash equivalents and our total capitalization as of December 31, 2006 on an actual basis and on an as adjusted basis to reflect the following events:
| • | the repayment by our executive officers of certain loans made by our company to our executive officers prior to the filing of the registration statement of which this prospectus is a part; and |
| • | the closing of this offering and the application of the net proceeds from this offering as described under “Use of proceeds.” |
We derived this table from, and it should be read in conjunction with and is qualified in its entirety by reference to, the historical consolidated financial statements and the accompanying notes included elsewhere in this prospectus. You should read this information in conjunction with these consolidated financial statements and “Management’s discussion and analysis of financial condition and results of operations.”
| As of December 31, 2006 | |||||||
| (in thousands) | Actual | As adjusted(1) | |||||
| Cash and cash equivalents | $ | 1,122 | $ | ||||
| Long-term debt, including current maturities | $ | 495,500 | $ | ||||
Stockholders’ equity: | |||||||
| Series A preferred stock, $.01 par value; 30,000,000 shares authorized, zero shares issued and outstanding, actual and as adjusted | — | — | |||||
| Preferred stock, $.001 par value; 10,000,000 shares authorized, zero shares issued and outstanding, actual and as adjusted | — | — | |||||
Common stock, $.001 par value; 300,000,000 shares authorized, 118,185,563 shares issued and outstanding, actual and shares issued and outstanding as adjusted(2) | 118 | ||||||
| Additional paid-in capital | 575,330 | ||||||
| Notes receivable from officers and employees | (12,858 | ) | |||||
| Retained earnings | 12,152 | ||||||
| Accumulated other comprehensive income, net of taxes | 414 | ||||||
| Total stockholders’ equity | 575,156 | ||||||
| Total capitalization | $ | 1,070,656 | $ | ||||
| (1) | A $1.00 increase (decrease) in the assumed initial public offering price per share would decrease (increase) long-term debt, including current maturities, by $ million and increase (decrease) each of additional paid-in capital, total stockholders’ equity and total capitalization by $ million, assuming the number of shares offered by us, as set forth on the cover page of this prospectus, remains the same. | |
| (2) | The number of shares of common stock issued and outstanding on an actual and an as adjusted basis includes shares of common stock outstanding and awards of restricted stock, but does not include shares of common stock subject to outstanding options. |
35
Table of Contents
Dilution
Purchasers of common stock in this offering will experience immediate and substantial dilution in the net tangible book value per share of the common stock for accounting purposes. Net tangible book value per share represents the amount of our total tangible assets less our total liabilities, divided by the number of shares of common stock that will be outstanding. At December 31, 2006, we had a net tangible book value of $570.7 million, or $4.83 per share. After giving effect to the sale by us of shares of common stock in this offering at an assumed initial public offering price of $ per share and after the deduction of underwriting discounts and estimated offering expenses, the as adjusted net tangible book value at December 31, 2006, would have been $ million, or $ per share. This represents an immediate increase in such net tangible book value of $ per share to existing stockholders and an immediate and substantial dilution of $ per share to new investors purchasing common stock in this offering. The following table illustrates this per share dilution:
| Assumed initial public offering price per share | $ | |||||
| Net tangible book value per share as of December 31, 2006 | $ | |||||
| Increase per share attributable to the offering | $ | |||||
| As adjusted net tangible book value per share after the offering | $ | |||||
| Dilution in as adjusted net tangible book value per share to new investors | $ | |||||
A $1.00 increase (decrease) in the assumed initial public offering price per share would increase (decrease) our as adjusted net tangible book value by $ million, would increase (decrease) our net tangible book value per share by $ per share and would increase (decrease) the dilution in as adjusted net tangible book value to new investors in this offering by $ per share, assuming the number of shares offered by us, as set forth on the cover page of this prospectus, remains the same.
The following table summarizes, on an as adjusted basis set forth above as of December 31, 2006, the total number of shares of common stock owned by existing stockholders and to be owned by new investors, the total consideration paid and the average price per share paid by our existing stockholders and to be paid by new investors in this offering at $ , the mid-point of the range of the initial public offering prices set forth on the cover of this prospectus, calculated before deduction of estimated underwriting discounts.
| Shares acquired(1) | Total consideration(2) | Average price | |||||||||||||
| Number | Percent | Amount | Percent | paid per share | |||||||||||
| Existing stockholders | % | $ | % | $ | |||||||||||
| New investors | |||||||||||||||
| Total | 100.0% | $ | 100.0% | ||||||||||||
| (1) | The number of shares disclosed for the existing stockholders includes shares being sold by the selling stockholders in this offering. The number of shares disclosed for the new investors does not include the shares being purchased by the new investors from the selling stockholders in this offering. | |
| (2) | A $1.00 increase (decrease) in the assumed initial public offering price per share would increase (decrease) total consideration paid by new investors by $ million, or increase (decrease) the percent of total consideration paid by new investors to %, assuming the number of shares offered by us, as set forth on the cover of this prospectus, remains the same. |
36
Table of Contents
Selected historical and pro forma
consolidated financial information
consolidated financial information
This section presents our selected historical and pro forma consolidated financial data. The selected historical consolidated financial data presented below is not intended to replace our historical consolidated financial statements. You should read the following data along with “Management’s discussion and analysis of financial condition and results of operations” and the consolidated financial statements and related notes, each of which is included in this prospectus. You should also read the pro forma information together with the unaudited pro forma combined financial statements and related notes included in this prospectus.
Selected historical and pro forma financial information for Concho Resources Inc.
The following table shows selected historical financial data related to Concho Resources Inc. (as the accounting successor to Concho Equity Holdings Corp.), combined financial data of the Chase Group Properties and unaudited pro forma financial data of Concho Resources as of and for the year ended December 31, 2006. We have accounted for the combination transaction that occurred on February 27, 2006, as an acquisition by Concho Equity Holdings Corp. of the Chase Group Properties and a simultaneous reorganization of Concho Resources such that Concho Equity Holdings Corp. is now our wholly owned subsidiary.
Our historical results of operations for the periods presented below may not be comparable either from period to period or going forward, for the following reasons:
| • | Prior to December 7, 2004, Concho Equity Holdings Corp. did not own any material assets and did not conduct substantial operations other than organizational activities. |
| • | On December 7, 2004, Concho Equity Holdings Corp. acquired the Lowe Properties for approximately $117 million and commenced oil and gas operations. |
| • | On February 27, 2006, the initial closing of the combination transaction occurred. Pursuant to the combination transaction, Concho Resources acquired the Chase Group Properties for approximately 70 million shares of common stock and approximately $409 million in cash. |
| • | On March 27, 2007, Concho Resources entered into a $200.0 million second lien term loan facility from which it received proceeds of $199.0 million that it used to repay the $39.8 million outstanding under its prior term loan facility and to reduce the outstanding balance under its revolving credit facility by $154.0 million, with the remaining $5.2 million used to pay loan fees, accrued interest and for general corporate purposes. |
The historical financial data for the Chase Group Properties for the years ended December 31, 2003, 2004 and 2005 are derived from the audited financial statements of the Chase Group Properties. The historical financial data for the Chase Group Properties for the year ended December 31, 2002 is derived from the unaudited financial statements of the Chase Group Properties. The historical financial data for Concho Resources for the period from inception (April 21, 2004) through December 31, 2004, and for the years ended December 31, 2005 and 2006, are derived from the audited financial statements of Concho Resources.
The pro forma financial data for the year ended December 31, 2006 set forth in the following table are derived from the unaudited pro forma financial statements of Concho Resources
37
Table of Contents
included in this prospectus. The pro forma statement of operations has been prepared as if the closing of the combination transaction had taken place as of January 1, 2006.
Our balance sheet data as of December 31, 2006, as adjusted, gives effect to the following transactions:
| • | the issuance by us of shares of common stock in this offering; |
| • | the repayment by our executive officers of certain loans made by our company to our executive officers prior to the filing of the registration statement of which this prospectus is a part; |
| • | our borrowing of $200.0 million under our second lien term loan facility; and |
| • | the repayment of a portion of our outstanding indebtedness using proceeds from this offering as described in “Use of proceeds.” |
The following table includes the non-GAAP financial measure EBITDAX. For a definition of this measure and a reconciliation to its most directly comparable financial measure calculated and presented in accordance with generally accepted accounting principles, which we refer to as GAAP, please read “Prospectus summary—Non-GAAP financial measures and reconciliations.”
| Chase Group Properties | Concho Resources Inc. | ||||||||||||||||||||||||||||||
| Inception | |||||||||||||||||||||||||||||||
| (April 21, | Pro forma | ||||||||||||||||||||||||||||||
| Years ended | 2004) through | Years ended | year ended | ||||||||||||||||||||||||||||
| (in thousands, except | December 31, | December 31, | December 31, | December 31, | |||||||||||||||||||||||||||
| per share amounts) | 2002 | 2003 | 2004 | 2005 | 2004 | 2005 | 2006 | 2006 | |||||||||||||||||||||||
| (unaudited) | (unaudited) | ||||||||||||||||||||||||||||||
Statement of operations data: | |||||||||||||||||||||||||||||||
Operating revenues: | |||||||||||||||||||||||||||||||
| Oil sales | $ | 59,881 | $ | 62,016 | $ | 66,529 | $ | 73,132 | $ | 1,851 | $ | 31,621 | $ | 131,773 | $ | 145,713 | |||||||||||||||
| Natural gas sales | 23,870 | 41,486 | 41,247 | 46,546 | 1,771 | 23,315 | 66,517 | 74,033 | |||||||||||||||||||||||
| Total operating revenues | 83,751 | 103,502 | 107,776 | 119,678 | 3,622 | 54,936 | 198,290 | 219,746 | |||||||||||||||||||||||
Operating costs and expenses: | |||||||||||||||||||||||||||||||
| Oil and gas production | 10,386 | 9,868 | 11,762 | 12,979 | 512 | 10,923 | 22,060 | 24,456 | |||||||||||||||||||||||
| Oil and gas production taxes | 6,928 | 8,815 | 9,202 | 10,298 | 234 | 3,712 | 15,762 | 17,602 | |||||||||||||||||||||||
| Exploration and abandonments | 900 | 2,116 | 179 | — | 1,850 | 2,666 | 5,612 | 5,612 | |||||||||||||||||||||||
| Depreciation, depletion and accretion | 16,239 | 19,643 | 20,459 | 19,092 | 963 | 11,574 | 61,009 | 66,520 | |||||||||||||||||||||||
| Impairments of proved oil and gas properties | 1,587 | 2,065 | 3,233 | 194 | — | 2,295 | 9,891 | 9,892 | |||||||||||||||||||||||
| General and administrative | 1,128 | 1,246 | 1,387 | 1,702 | 3,086 | 8,055 | 12,577 | 12,861 | |||||||||||||||||||||||
| Stock-based compensation | — | — | — | — | 1,128 | 3,252 | 9,144 | 9,144 | |||||||||||||||||||||||
| Ineffective portion of cash flow hedges | — | — | — | — | — | 1,148 | (1,193 | ) | (1,193 | ) | |||||||||||||||||||||
| (Gain) loss on derivatives not designated as hedges | 3,379 | 576 | 7,936 | 1,062 | (684 | ) | 5,001 | — | — | ||||||||||||||||||||||
| Total operating costs and expenses | 40,547 | 44,329 | 54,158 | 45,327 | 7,089 | 48,626 | 134,862 | 144,894 | |||||||||||||||||||||||
Income (loss) from operations | 43,204 | 59,173 | 53,618 | 74,351 | (3,467 | ) | 6,310 | 63,428 | 74,852 | ||||||||||||||||||||||
Other income (expense): | |||||||||||||||||||||||||||||||
| Interest expense | — | — | — | — | (272 | ) | (3,096 | ) | (30,567 | ) | (35,790 | ) | |||||||||||||||||||
| Other, net | — | — | — | — | 168 | 779 | 1,186 | 1,186 | |||||||||||||||||||||||
| Total other expense | — | — | — | — | (104 | ) | (2,317 | ) | (29,381 | ) | (34,604 | ) | |||||||||||||||||||
Income (loss) before income taxes | 43,204 | 59,173 | 53,618 | 74,351 | (3,571 | ) | 3,993 | 34,047 | 40,248 | ||||||||||||||||||||||
| Income tax (expense) benefit | — | — | — | — | 915 | (2,039 | ) | (14,379 | ) | (16,797 | ) | ||||||||||||||||||||
Net income (loss) | $ | 43,204 | $ | 59,173 | $ | 53,618 | $ | 74,351 | $ | (2,656 | ) | $ | 1,954 | $ | 19,668 | $ | 23,451 | ||||||||||||||
38
Table of Contents
| Chase Group Properties | Concho Resources Inc. | |||||||||||||||||||||||||||||
| Inception | ||||||||||||||||||||||||||||||
| (April 21, | Pro forma | |||||||||||||||||||||||||||||
| Years ended | 2004) through | Years ended | year ended | |||||||||||||||||||||||||||
| (in thousands, except | December 31, | December 31, | December 31, | December 31, | ||||||||||||||||||||||||||
| per share amounts) | 2002 | 2003 | 2004 | 2005 | 2004 | 2005 | 2006 | 2006 | ||||||||||||||||||||||
| (unaudited) | (unaudited) | |||||||||||||||||||||||||||||
| Preferred stock dividends | (804 | ) | (4,766 | ) | (1,244 | ) | — | |||||||||||||||||||||||
| Effect of induced conversion of preferred stock | — | — | 11,601 | — | ||||||||||||||||||||||||||
Net income (loss) applicable to common shareholders | $ | (3,460 | ) | $ | (2,812 | ) | $ | 30,025 | $ | 23,451 | ||||||||||||||||||||
EBITDAX(1) (unaudited) | $ | 85,425 | $ | 94,699 | $ | (42 | ) | $ | 33,025 | $ | 149,077 | $ | 166,013 | |||||||||||||||||
Basic earnings (loss) per share: | ||||||||||||||||||||||||||||||
| Net income (loss) per share | $ | (1.74 | ) | $ | (0.35 | ) | $ | 0.32 | $ | 0.22 | ||||||||||||||||||||
| Shares used in basic earnings (loss) per share | 1,987 | 8,117 | 94,575 | 108,335 | ||||||||||||||||||||||||||
Diluted earnings (loss) per share: | ||||||||||||||||||||||||||||||
| Net income (loss) per share | $ | (1.74 | ) | $ | (0.35 | ) | $ | 0.30 | $ | 0.20 | ||||||||||||||||||||
| Shares used in diluted earnings (loss) per share | 1,987 | 8,117 | 101,458 | 115,412 | ||||||||||||||||||||||||||
| Chase Group Properties | Concho Resources Inc. | |||||||||||||||||||||||
| Inception | ||||||||||||||||||||||||
| (April 21, | ||||||||||||||||||||||||
| Years ended | 2004) through | Years ended | ||||||||||||||||||||||
| December 31, | December 31, | December 31, | ||||||||||||||||||||||
| (in thousands) | 2003 | 2004 | 2005 | 2004 | 2005 | 2006 | ||||||||||||||||||
Other financial data: | ||||||||||||||||||||||||
| Net cash provided by (used in) operations | $ | 84,264 | $ | 84,202 | $ | 93,162 | $ | (2,193 | ) | $ | 25,070 | $ | 112,181 | |||||||||||
| Net cash provided by (used in) investing | (31,823 | ) | (30,045 | ) | (35,611 | ) | (122,473 | ) | (61,902 | ) | (596,852 | ) | ||||||||||||
| Net cash provided by (used in) financing | (52,441 | ) | (54,157 | ) | (57,551 | ) | 125,322 | 45,358 | 476,611 | |||||||||||||||
| Capital expenditures | 29,449 | 25,451 | 32,352 | 116,880 | 72,758 | 1,226,180 | ||||||||||||||||||
| Chase Group Properties | Concho Resources Inc. | |||||||||||||||||||||||
| As adjusted | ||||||||||||||||||||||||
| as of | ||||||||||||||||||||||||
| As of December 31, | As of December 31, | December 31, | ||||||||||||||||||||||
| (in thousands) | 2002 | 2003 | 2004 | 2005 | 2004 | 2005 | 2006 | 2006(2) | ||||||||||||||||
| (unaudited) | (unaudited) | |||||||||||||||||||||||
Balance sheet data: | ||||||||||||||||||||||||
| Cash and cash equivalents | — | — | $ | — | $ | — | $ | 656 | $ | 9,182 | $ | 1,122 | $ | |||||||||||
| Property and equipment, net | 126,956 | 133,547 | 135,568 | 149,042 | 115,455 | 170,583 | 1,320,655 | 1,320,655 | ||||||||||||||||
| Total assets | 135,973 | 141,860 | 145,100 | 161,792 | 130,717 | 232,385 | 1,390,072 | |||||||||||||||||
| Long-term debt, including current maturities | — | — | — | — | 53,000 | 72,000 | 495,500 | |||||||||||||||||
| Stockholders’ equity/net investment | 127,821 | 134,554 | 134,014 | 150,814 | 71,710 | 109,670 | 575,156 | |||||||||||||||||
| (1) | EBITDAX is defined as income before accounting changes, plus (1) interest, the amortization of related debt issuance costs and other financial costs, net of capitalized interest, (2) federal and state income taxes, (3) depreciation, depletion, amortization and accretion, (4) hedge ineffectiveness, (5) property impairments and (6) exploration expense and dry hole costs, (7) (gain) loss on derivatives not designated as hedges, and (8) stock-based compensation expense. See “Prospectus summary—Non-GAAP financial measures and reconciliations.” | |
| (2) | A $1.00 increase (decrease) in the assumed initial public offering price per share would decrease (increase) long-term debt, including current maturities by $ and would increase (decrease) stockholders’ equity by $ , assuming the number of shares offered by us set forth on the cover page of this prospectus remains the same and after deducting underwriting discounts and estimated offering expenses payable by us. |
39
Table of Contents
Selected historical financial and operating information for Lowe Properties
The selected financial data for the Lowe Properties for the years ended December 31, 2002 and 2003 and for the period from January 1, 2004 through November 30, 2004 were derived from the audited and unaudited statements of revenue and direct operating expenses of the Lowe Properties included in this prospectus and information provided by the seller.
| Period from | |||||||||
| January 1, 2004 | |||||||||
| Years ended | through | ||||||||
| December 31, | November 30, | ||||||||
| Statement of revenues and direct operating expenses data: (in thousands) | 2002 | 2003 | 2004 | ||||||
(unaudited) | |||||||||
| Revenues | $ | 25,753 | $ | 32,371 | $ | 34,663 | |||
| Direct operating expenses: | |||||||||
| Lease operating expense | 7,519 | 6,652 | 6,983 | ||||||
| Production tax expense | 1,597 | 2,023 | 2,159 | ||||||
| Other expenses | — | 435 | 461 | ||||||
| Total direct operating expenses | $ | 9,116 | $ | 9,110 | $ | 9,603 | |||
| Revenues in excess of direct operating expenses | $ | 16,637 | $ | 23,261 | $ | 25,060 | |||
40
Table of Contents
Management’s discussion and analysis of
financial condition and results of operations
financial condition and results of operations
The following discussion is intended to assist you in understanding our business and results of operations together with our present financial condition. This section should be read in conjunction with our historical consolidated financial statements and notes, as well as the selected historical consolidated financial data included elsewhere in this prospectus.
Statements in our discussion may be forward-looking statements. These forward-looking statements involve risks and uncertainties. We caution that a number of factors could cause future production, revenue and expenses to differ materially from our expectations.
Overview
We are an independent oil and natural gas company engaged in the acquisition, development, exploitation and exploration of producing oil and natural gas properties. Our conventional operations are primarily focused in the Permian Basin of Southeast New Mexico and West Texas. We have also acquired significant acreage positions in the Permian Basin of Southeast New Mexico, the Central Basin Platform, the Delaware Basin and the Val Verde Basin of West Texas, the Williston Basin in North Dakota and the Arkoma Basin in Arkansas, covering unconventional emerging resource plays, where we intend to apply horizontal drilling, advanced fracture stimulation and enhanced recovery technologies. Crude oil comprised 57% of our 467 Bcfe of estimated net proved reserves as of December 31, 2006, and 59% of our 23.3 Bcfe of production for the year ended December 31, 2006. We seek to operate the wells in which we own an interest, and we operated wells that accounted for 89% of ourPV-10 and 48% of our 1,921 gross wells as of December 31, 2006. By controlling operations, we are able to more effectively manage the cost and timing of exploration and development of our properties, including the drilling and stimulation methods used.
On February 24, 2006, we entered into a combination agreement in which we agreed to purchase certain oil and gas properties owned by Chase Oil Corporation, Caza Energy LLC and certain other individual working interest owners (which we refer to collectively as the “Chase Group”) and combine them with substantially all of the outstanding equity interests of Concho Equity Holdings Corp. to form our company. The initial closing of the transactions contemplated by the combination agreement occurred on February 27, 2006. As a result of the initial closing of the combination transaction, the members of the Chase Group that sold their working interests to us at the initial closing of the combination transaction received 69,366,627 shares of our common stock and approximately $400 million in cash, and the former shareholders of Concho Equity Holdings Corp. that were a party to the combination agreement received 47,535,346 shares of our common stock. In addition, certain options held by our employees to purchase preferred and common stock of Concho Equity Holdings Corp. were converted into options to purchase 4,698,331 shares of our common stock. The oil and gas properties contributed to us by the Chase Group (which we refer to as the “Chase Group Properties”) represent approximately 76% of ourPV-10 as of December 31, 2006. The executive officers of Concho Equity Holdings Corp. became the executive officers of our company in connection with the initial closing of the combination transaction. We have accounted for the combination transaction as a reorganization of our company, such that Concho Equity Holdings Corp. is now our wholly owned subsidiary, and a simultaneous acquisition by our company of the assets contributed by the Chase Group.
41
Table of Contents
We agreed in the combination agreement to offer to acquire additional interests in the Chase Group Properties from persons associated with the Chase Group. In May 2006, we acquired certain of such interests from ten of such persons in exchange for an aggregate consideration of 222,645 shares of our common stock and $8.9 million in cash. In April 2007, we offered to acquire the remainder of such interests from an additional nine persons in exchange for, at the respective seller’s option, shares of our common stock or cash, or any combination thereof, aggregating a total purchase offer of $906,000. Terms concerning the exchange of such interests for shares of our common stock were the same as the terms in the combination agreement.
In addition, because certain employee stockholders of Concho Equity Holdings Corp. were not confirmed to have been accredited investors at the time of the combination transaction, their 254,621 units, consisting of one preferred and one common share of Concho Equity Holdings Corp., could not be immediately exchanged for our common shares. On April 16, 2007, these remaining shares of Concho Equity Holdings Corp. were exchanged for 636,555 shares of our common stock. As a result, Concho Equity Holdings Corp. is now our wholly owned subsidiary. The common and preferred shares of Concho Equity Holdings Corp. which were outstanding between February 27, 2006 and April 16, 2007 have been treated as exchangeable for and equivalent to shares of our common stock in our consolidated financial statements.
Factors that significantly affect our results
Our revenue, cash flow from operations and future growth depend substantially on factors beyond our control, such as economic, political and regulatory developments and competition from other sources of energy. Oil and natural gas prices have historically been volatile and may fluctuate widely in the future. Sustained periods of low prices for oil or natural gas could materially and adversely affect our financial position, our results of operations, the quantities of oil and gas that we can economically produce and our ability to access capital.
We generally hedge a portion of our expected future oil and natural gas production to reduce our exposure to fluctuations in commodity price. See “—Liquidity and capital resources—Hedging” for a discussion of our hedging and hedge positions.
Like all businesses engaged in the exploration and production of oil and natural gas, we face the challenge of natural production declines. As initial reservoir pressures are depleted, oil and natural gas production from a given well decreases. Thus, an oil and natural gas exploration and production company depletes part of its asset base with each unit of oil or natural gas it produces. We attempt to overcome this natural decline by drilling to find additional reserves and acquiring more reserves than we produce and by implementing secondary recovery techniques. Our future growth will depend on our ability to enhance production levels from our existing reserves and to continue to add reserves in excess of production. We will maintain our focus on costs necessary to produce our reserves as well as the costs necessary to add reserves through drilling and acquisitions. Our ability to make capital expenditures to increase production from our existing reserves and to add reserves through drilling is dependent on our capital resources and can be limited by many factors, including our ability to access capital in a cost-effective manner and to timely obtain drilling permits and regulatory approvals.
Items impacting comparability of our financial results
Our historical results of operations for the periods presented may not be comparable, either from period to period or going forward, for the reasons described below.
42
Table of Contents
Combination transaction
We were formed in February 2006 as a result of the combination transaction between Concho Equity Holdings Corp. and the Chase Group.
Concho Equity Holdings Corp. is our predecessor for accounting purposes. As a result, our historical financial statements prior to February 27, 2006, are the financial statements of Concho Equity Holdings Corp. Concho Equity Holdings Corp. was formed on April 21, 2004, and did not own any material assets and did not conduct substantial operations other than organizational activities until it acquired the Lowe Properties on December 7, 2004. For a discussion of the results of operations of Concho Resources (as the accounting successor to Concho Equity Holdings Corp.), please read “—Results of operations of Concho Resources.” The financial statements of Concho Resources (as the accounting successor to Concho Equity Holdings Corp.), together with the notes thereto, are also included in this prospectus.
As of December 31, 2006, approximately 76% of ourPV-10 was attributable to the properties contributed to us by the Chase Group in the combination transaction. For a discussion of the results of operations of the Chase Group Properties, please read “—Results of operations of the Chase Group Properties.” The combined financial statements of the Chase Group Properties, together with the notes thereto, are also included in this prospectus.
Additional indebtedness and other expenses
During 2006 and 2007, we incurred additional indebtedness and other expenses as a result of our rapid growth, particularly as a result of the combination transaction. Our historical financial information prior to 2006 does not give effect to various items that will affect our results of operations and liquidity following the closing of this offering, including the following items:
| • | we closed the combination transaction on February 27, 2006 and properties were contributed to us by the Chase Group that represent approximately 76% of ourPV-10 as of December 31, 2006; |
| • | we incurred approximately $405 million of new indebtedness upon the initial closing of the combination transaction; |
| • | we entered into a $200.0 million second lien term loan facility on March 27, 2007, from which we received proceeds of $199.0 million to repay the $39.8 million outstanding under our prior term loan facility, to reduce the outstanding balance under our revolving credit facility by $154.0 million and the remaining $5.2 million to pay loan fees, accrued interest and for general corporate purposes; and |
| • | we have incurred additional general and administrative costs as a result of the expansion of our technical and administrative staffs and as a result of increased amounts of professional fees. |
Curtailment of drilling
We determined in January 2007 to reduce our drilling activities for the first three months of 2007. This determination was due to a decline in oil and natural gas prices in January 2007 compared to such prices in the fourth quarter of 2006, the costs of goods and services necessary to complete our drilling activities and the resulting effect of these circumstances on our expected cash flow for the three months ended March 31, 2007. In addition, we determined to
43
Table of Contents
reduce our drilling activities and curtail capital expenditures until we were able to complete our second lien term loan facility in March 2007. Also due to the reduced drilling activities described above, we recorded an expense in the first quarter of 2007 of approximately $2.1 million for contract drilling fees related to stacked rigs subject to daywork drilling contracts with two drilling contractors. Approximately $1.8 million of this amount was paid to Silver Oak Drilling, LLC, which is an affiliate of the Chase Group. We resumed our planned drilling activities in April 2007, and we believe we will spend our planned 2007 exploration and development budget of approximately $137 million during 2007.
Public company expenses
In addition, we believe that our expected future financial results will be impacted as a result of our becoming a public corporation. We anticipate initially incurring additional annual general and administrative expenses of approximately $ million relating to operating as a separate publicly held corporation, including compensation and benefit expenses of our executive management personnel, costs associated with annual and quarterly reports to stockholders, costs associated with our compliance with the Sarbanes-Oxley Act of 2002, independent auditor fees, investor relations activities, registrar and transfer agent fees, incremental director and officer liability insurance costs, and director compensation.
44
Table of Contents
Results of operations of Concho Resources Inc.
The following table presents selected financial and operating information of Concho Resources Inc. (as successor to Concho Equity Holdings Corp.) for the period of inception (April 21, 2004) through December 31, 2004, and for the years ended December 31, 2005 and 2006:
| Inception (April 21, | ||||||||||||
| 2004) through | Years ended December 31, | |||||||||||
| (in thousands, except price data) | December 31, 2004 | 2005 | 2006 | |||||||||
| Oil sales | $ | 1,851 | $ | 31,621 | $ | 131,773 | ||||||
| Natural gas sales | 1,771 | 23,315 | 66,517 | |||||||||
| Total operating revenues | 3,622 | 54,936 | 198,290 | |||||||||
| Operating costs and expenses | 7,089 | 48,626 | 134,862 | |||||||||
| Interest, net and other revenue | 104 | 2,317 | 29,381 | |||||||||
| Income (loss) before income taxes | (3,571 | ) | 3,993 | 34,047 | ||||||||
| Income tax (expense) benefit | 915 | (2,039 | ) | (14,379 | ) | |||||||
Net income (loss) | $ | (2,656 | ) | $ | 1,954 | $ | 19,668 | |||||
Production volumes (unaudited): | ||||||||||||
| Oil (MBbl) | 44.7 | 599.0 | 2,294.8 | |||||||||
| Natural gas (MMcf) | 290.7 | 3,403.8 | 9,506.8 | |||||||||
| Natural gas equivalent (MMcfe) | 559.1 | 6,997.7 | 23,275.4 | |||||||||
Average prices (unaudited): | ||||||||||||
| Oil, without hedges ($/Bbl) | $ | 41.37 | $ | 54.71 | $ | 60.47 | ||||||
| Oil, with hedges ($/Bbl) | 41.37 | 52.79 | 57.42 | |||||||||
| Natural gas, without hedges ($/Mcf) | 6.09 | 6.99 | 6.87 | |||||||||
| Natural gas, with hedges ($/Mcf) | 6.09 | 6.85 | 7.00 | |||||||||
| Natural gas equivalent, without hedges ($/Mcfe) | 6.48 | 8.08 | 8.77 | |||||||||
| Natural gas equivalent, with hedges ($/Mcfe) | 6.48 | 7.85 | 8.52 | |||||||||
Year ended December 31, 2005, compared to year ended December 31, 2006
Oil and gas revenues. Revenue from oil and gas operations increased by $143.4 million (261%) from $54.9 million for the year ended December 31, 2005 to $198.3 million for the year ended December 31, 2006. This increase was primarily because of increased production as a result of the acquisition of the Chase Group Properties and secondarily due to successful drilling efforts during 2005 and 2006. Total production increased 16,277 MMcfe (233%) from 6,998 MMcfe for the year ended December 31, 2005 to 23,275 MMcfe for the year ended December 31, 2006. The increases in revenue and production attributable to the Chase Group Properties between 2005 and 2006 were $136.2 million and 11,747 MMcfe, respectively. In addition, average realized oil prices (after giving effect to hedging activities) increased 9% from $52.79 per Bbl in 2005 to $57.42 per Bbl in 2006, average realized natural gas prices (after giving effect to hedging activities) increased 2% from $6.85 per Mcf in 2005 to $7.00 per Mcf in 2006 and average
45
Table of Contents
realized natural gas equivalent prices (after giving effect to hedging activities) increased 9% from $7.85 per Mcfe in 2005 to $8.52 per Mcfe in 2006.
Hedging activities. The oil and gas prices that we report are based on the market price received for the commodities adjusted to give effect to the results of our cash flow hedging activities. We utilize commodity derivative instruments (swaps and zero cost collar option contracts) in order to (1) reduce the effect of the volatility of price changes on the commodities we produce and sell, (2) support our annual capital budgeting and expenditure plans and (3) lock-in commodity prices to protect economics related to certain capital projects. During 2005, our commodity price hedges decreased oil revenues by $1.2 million ($1.92 per Bbl) and decreased gas revenues by $0.5 million ($0.14 per Mcf). During 2006, our commodity price hedges decreased oil revenues by $7.0 million ($3.05 per Bbl) and increased gas revenues by $1.2 million ($0.13 per Mcf).
Production expenses Production expenses (including production taxes) increased $23.2 million (159%) from $14.6 million ($2.09 per Mcfe) to $37.8 million ($1.62 per Mcfe) for the years ended December 31, 2005 and 2006, respectively. The increase in operating costs are due to two sources: (1) production costs associated with the Chase Group Properties acquired in February 2006 of approximately $20.2 million and (2) costs associated with new wells that were successfully completed in 2005 and 2006 as a result of our drilling activities. Lease operating expenses and workover costs comprised approximately 75% and 58% of production expenses for 2005 and 2006, respectively. These costs per unit of production decreased 39% from $1.56 per Mcfe in 2005 to $0.95 per Mcfe in 2006. This is because the Chase Group Properties are, on average, less expensive to operate than the properties we operated prior to the combination transaction. Lease operating expenses include ad valorem taxes that are affected by commodity price changes. Ad valorem taxes were approximately 9% and 5% of lease operating expenses for 2005 and 2006, respectively.
The secondary component of operating costs is production taxes and is directly related to commodity price changes. These costs comprised approximately 25% and 42% of total operating costs for 2005 and 2006, respectively. Production taxes per unit of production increased 28% from $0.53 per Mcfe in 2005 to $0.68 per Mcfe in 2006. This increase was primarily due to an increase in commodity prices.
Exploration and abandonments / geological and geophysical costs. Exploration and abandonments / geological and geophysical costs increased by $2.9 million from $2.7 million during 2005 to $5.6 million during 2006. The exploration and abandonments / geological and geophysical costs during 2005 consisted of $1.4 million of exploratory dry hole costs and $1.3 million of geological and geophysical costs. The exploratory dry hole costs during 2005 were attributable to one exploratory dry hole in each of Eddy and Lea Counties, New Mexico that we operated and to one exploratory dry hole in Zapata County, Texas operated by another company. The geological and geophysical costs for 2005 primarily consisted of general and administrative costs for our geology department as well as seismic data, geophysical data and core analysis. The exploration and abandonments / geological and geophysical costs during 2006 consisted of $3.4 million of exploratory dry hole costs and $2.2 million of geological and geophysical costs. The exploratory dry hole costs during 2006 were attributable to one exploratory dry hole in Gaines County, Texas that we operated and one exploratory dry hole in Val Verde County, Texas operated by another company. The geological and geophysical costs for 2006 primarily consisted of general and administrative costs for our geology department as well as seismic data, geophysical data and core analysis.
46
Table of Contents
Depreciation and depletion expense. Total depreciation and depletion expense increased $49.2 million (428%) from $11.5 million ($1.64 per Mcfe) to $60.7 million ($2.61 per Mcfe) for the years ended December 31, 2005 and 2006, respectively. The increase in total expense and expense per Mcfe was primarily due to the acquisition of the Chase Group Properties and related acquisition costs associated with the combination transaction. Approximately $30.7 million of the increase in depreciation and depletion expense for 2006 was attributable to the acquisition of the Chase Group Properties.
Impairment of oil and gas properties. In accordance with Financial Accounting Standards Board (“FASB”) Statement of Financial Accounting Standards (“SFAS”) No. 144 “Accounting for the Impairment or Disposal of Long-Lived Assets,” we review our long-lived assets to be held and used, including proved oil and gas properties accounted for under the successful efforts method of accounting. As a result of this review of the recoverability of the carrying value of our assets during 2005, we recognized a non-cash charge against earnings of $2.3 million related to our proved oil and gas properties. For the year ended December 31, 2006, we recognized a non-cash charge against earnings of $9.9 million related to our proved oil and gas properties. Of this amount, $0.1 million was related to the Chase Group Properties.
General and administrative expenses. General and administrative expenses increased $10.4 million (92%) from $11.3 million ($1.62 per Mcfe) to $21.7 million ($0.93 per Mcfe) for the years ended December 31, 2005 and 2006 respectively. Excluding non-cash stock-based compensation of $3.3 million in 2005 and $9.1 million in 2006, general and administrative expenses increased $4.5 million (56%) from $8.1 million ($1.15 per Mcfe) to $12.6 million ($0.54 per Mcfe) for the years ended December 31, 2005 and 2006, respectively. The increase in general and administrative expense during 2006 was primarily because of the hiring of additional staff and an increase in professional fees related to the combination transaction and other activities of our company. We earn revenue as operator of certain oil and gas properties in which we own interests. As such, we earned revenue of $0.6 million and $0.8 million during the years ended December 31, 2005 and 2006, respectively. This revenue is reflected as a reduction of general and administrative expenses in the consolidated statements of operations.
Interest expense. Interest expense increased $27.5 million from $3.1 million to $30.6 million for the years ended December 31, 2005 and 2006, respectively. The weighted average interest rate for the years ended December 31, 2005 and 2006 was 5.5% and 7.5%, respectively. The weighted average debt outstanding during 2005 and 2006 was approximately $59 million and $407 million, respectively. The increase in interest expense was due to the increase in overall debt outstanding and the increase in interest rates. The increase in weighted average debt outstanding during 2006 was primarily due to our borrowing under our revolving credit facility on February 27, 2006 to fund the cash payment due as part of the combination transaction, to repay the Concho Equity Holdings Corp. credit facility, and to pay bank and legal fees. The increase in weighted average debt outstanding was also due to our borrowing $40 million under our prior second lien term loan facility on July 6, 2006 to reduce the amount outstanding under our revolving credit facility by $32.1 million, with the remaining $7.9 million used for general corporate purposes.
Other, net. Interest and other revenue increased by $407,000 from $779,000 to $1,186,000 during the years ended December 31, 2005 and 2006, respectively. Interest earned increased by $450,000 from $367,000 during the year ended December 31, 2005 to $817,000 during the year ended December 31, 2006, due to interest on officer and employee notes. Other revenue
47
Table of Contents
decreased by $43,000 from $412,000 to $369,000 during the years ended December 31, 2005 and 2006, respectively.
Income tax provisions (benefits). We recorded income tax expense of $2.0 million and $14.4 million for the years ended December 31, 2005 and 2006, respectively. The income tax expense was due to the income reported during the years ended December 31, 2005 and 2006.
We had a net deferred federal and state tax asset at December 31, 2005 in the amount of $4.9 million. This accumulated balance is based on deferred hedge losses and differences in basis of oil and gas properties for tax purposes as compared to book purposes and offset by the effect of a net operating loss. Intangible drilling costs are allowed as deductions by the Internal Revenue Service and are capitalized under the generally accepted accounting principles in the United States of America. At December 31, 2006, we had a net deferred tax liability of $241.7 million. This change is primarily due to differences in basis and depletion of oil and gas properties for tax purposes as compared to book purposes related to the acquisition of the Chase Group Properties in February 2006, a reduction of deferred hedge losses and the elimination of the net operating loss.
Inception (April 21, 2004) through December 31, 2004, compared to year ended December 31, 2005
Oil and gas revenues. Revenues from oil and gas operations increased by $51.3 million from $3.6 million for the period April 21, 2004 to December 31, 2004 to $54.9 million for the year ended December 31, 2005. This increase was primarily because we did not conduct any substantial operations other than organizational activities from our formation on April 21, 2004 until the acquisition of the Lowe Properties on December 7, 2004. In addition, revenue during the year ended December 31, 2005 increased due to the successful completion of new wells as a result of our drilling activities during 2005. Finally, average oil prices after giving effect to hedging activities increased 28% between 2004 and 2005 from $41.37 per Bbl to $52.79 per Bbl, respectively, and average natural gas prices after giving effect to hedging activities increased 12% between 2004 and 2005 from $6.09 per Mcf to $6.85 per Mcf, respectively. Average natural gas equivalent prices increased 21% from $6.48 per Mcfe in 2004 to $7.85 per Mcfe in 2005.
Hedging activities. The oil and gas prices that we report are based on the market price received for the commodities adjusted by the results of our cash flow hedging activities. We utilize commodity derivative instruments (swaps and zero cost collar option contracts) in order to (1) reduce the effect of the volatility of price changes on the commodities we produce and sell, (2) support our annual capital budgeting and expenditure plans and (3) lock-in prices to protect economics related to certain capital projects. During 2005, our commodity price hedges decreased oil revenues by $1.2 million ($1.92 per Bbl) and decreased gas revenues by $0.5 million ($0.14 per Mcf). During 2004, there were no settlements of oil or gas hedges as the first hedged period began in January 2005.
Production expenses. Production costs (including production taxes) increased by $13.9 million from $0.7 million ($1.33 per Mcfe) during the period from April 21, 2004 to December 31, 2004 to $14.6 million ($2.09 per Mcfe) during the year ended December 31, 2005. Lease operating expenses and workover costs, the components of production costs over which we have management control, increased by $10.4 million from $0.5 million ($0.91 per Mcfe) during the period from April 21, 2004 to December 31, 2004 to $10.9 million ($1.56 per Mcfe) during the year ended December 31, 2005. The increase in production costs, including lease operating expenses
48
Table of Contents
and workover costs, between the period from April 21, 2004 to December 31, 2004 and the year ended December 31, 2005 was primarily because of our less extensive oil and gas operations during the period from April 21, 2004 to December 31, 2004, prior to our acquisition of the Lowe Properties on December 7, 2004. Lease operating expenses include ad valorem taxes that are affected by commodity price changes. Ad valorem taxes were approximately 10% and 9% of lease operating expenses for 2004 and 2005 respectively.
The secondary component of production costs is production taxes and is directly related to commodity price changes. Our production taxes increased from $0.2 million ($0.42 per Mcfe) during the period from April 21, 2004 to December 31, 2004 to $3.7 million ($0.53 per Mcfe) during the year ended December 31, 2005, primarily due to higher commodity prices and increased production during the year ended December 31, 2005.
Exploration and abandonments / geological and geophysical costs. Exploration and abandonments / geological and geophysical costs increased by $0.8 million from $1.9 million during the period from April 21, 2004 to December 31, 2004 to $2.7 million during the year ended December 31, 2005. The exploration and abandonments / geological and geophysical costs during the period from April 21, 2004 to December 31, 2004 consisted of $1.3 million of exploratory dry hole costs and $0.6 million of geological and geophysical costs. The geological and geophysical costs for the period from April 21, 2004 to December 31, 2004 included a non-cash charge of $0.4 million related to an abandoned prospect in the Gulf Coast region. The exploration and abandonments / geological and geophysical costs during the year ended December 31, 2005 consisted of $1.4 million of exploratory dry hole costs and $1.3 million of geological and geophysical costs. The exploratory dry hole costs during the year ended December 31, 2005 were attributable to two wells drilled in the Permian Basin region that we operated and one well in the Gulf Coast region that we did not operate.
Depreciation and depletion expense. Our total depreciation and depletion expense increased by $10.5 million from $1.0 million ($1.71 per Mcfe) during the period from April 21, 2004 to December 31, 2004 to $11.5 million ($1.64 per Mcfe) during year ended December 31, 2005. The increase in the total depreciation and depletion expense was primarily because of the impact of the acquisition of the Lowe Properties on the full year ended December 31, 2005. Our depreciation and depletion expense per Mcfe decreased from during the period from April 21, 2004 to December 31, 2004 to the year ended December 31, 2005 because of additional reserves added to the depletable properties base during 2005 resulting from the Company’s successful drilling operations.
Impairment of oil and gas properties. In accordance with SFAS No. 144, we reviewed our long-lived assets to be held and used, including proved oil and gas properties accounted for under the successful efforts method of accounting. As a result of this review of the recoverability of the carrying value of our assets during 2005, we recognized a non-cash charge against earnings of $2.3 million related to our proved oil and gas properties. At December 31, 2004, we did not recognize a charge against earnings related to our proved oil and gas properties.
General and administrative expenses. General and administrative expenses increased by $7.1 million from $4.2 million ($7.54 per Mcfe) during the period from April 21, 2004 to December 31, 2004 to $11.3 million ($1.62 per Mcfe) during the year ended December 31, 2005, respectively. Excluding non-cash stock-based compensation of $1.1 million in 2004 and $3.3 million in 2005, our general and administrative expenses increased by $4.9 million from $3.1 million ($5.52 per Mcfe) during the period from April 21, 2004 to December 31, 2004 to $8.1 million ($1.15 per Mcfe) during the year ended December 31, 2005. The increase in general and administrative
49
Table of Contents
expense during the year ended December 31, 2005 was primarily because of increased business activity in 2005 as well as the hiring of additional staff in 2005. From time to time, we also earn revenue in our capacity as operator of certain oil and gas properties in which we own interests. As such, we earned revenue of $38,000 and $591,000 during the period from April 21, 2004 to December 31, 2004 and during the year ended December 31, 2005, respectively. This revenue is reflected as a reduction of general and administrative expenses in the consolidated statements of operations.
Interest expense. Interest expense increased by $2.8 million from $0.3 million during the period from April 21, 2004 to December 31, 2004 to $3.1 million during the year ended December 31, 2005. The increase in interest expense during the year ended December 31, 2005 was primarily due to increased borrowings under our former revolving credit facility that we incurred to fund a portion of the cash consideration for the Lowe Properties. Prior to October 14, 2004, the date on which we were required to make a cash escrow deposit for the acquisition of the Lowe Properties, we had not borrowed any funds under the former revolving credit facility.
Other, net. Interest and other revenue increased by $611,000 from $168,000 during the period from April 21, 2004 to December 31, 2004 to $779,000 during the year ended December 31, 2005. Interest earned increased by $256,000 from $111,000 during the period from April 21, 2004 to December 31, 2004 to $367,000 during the year ended December 31, 2005 due to interest on officer and employee notes. Other revenue increased by $355,000 from $57,000 during the period from April 21, 2004 to December 31, 2004 to $412,000 during the year ended December 31, 2005.
Income tax provisions (benefits). We recorded an income tax benefit of $0.9 million during the period from April 21, 2004 to December 31, 2004 and an income tax expense of $2.0 million during the year ended December 31, 2005. The income tax benefit during the period from April 21, 2004 to December 31, 2004 was due to the loss we reported during that period while the income tax expense during the year ended December 31, 2005 was due to the income we reported during that period.
We recognized a net deferred federal and state tax asset during the period from April 21, 2004 to December 31, 2004 in the amount of $0.9 million at December 31, 2004. This accumulated balance is based on differences in basis and depletion of oil and gas properties for tax purposes as compared to book purposes offset by the effects of a net operating loss and the tax effects of deferred hedge gains. The deferred tax asset increased by $4.0 million from December 31, 2004 to December 31, 2005, primarily due to the tax effect of deferred hedge losses offset by an increase in intangible drilling costs which are allowed by the Internal Revenue Service as deductions and are capitalized under generally accepted accounting principles in the United States of America.
Liquidity and capital resources
Our primary sources of liquidity have been cash flows generated from operating activities and financing provided by our bank credit facilities. We believe that funds from operating cash flows and our bank credit facilities should be sufficient to meet both our short-term working capital requirements and our 2007 exploration and development budget.
50
Table of Contents
Cash flow from operating activities
Our net cash provided by operating activities was $25.1 million and $112.2 million for the years ended December 31, 2005 and 2006, respectively. The increase in operating cash flows in 2006 was principally due to increases in our oil and gas production as a result of our exploration and development program and cash flow from production attributable to the Chase Group Properties that we acquired in the combination transaction in February 2006.
Cash flow used in investing activities
During the years ended December 31, 2005 and 2006, we invested $55.6 million and $595.6 million, respectively, in our capital program, inclusive of dry hole costs. Cash flows used in investing activities increased during the year ended December 31, 2006, primarily due to the $409 million cash portion of the consideration we paid to the Chase Group in the combination transaction and drilling activities in 2006.
Cash flow from financing activities
Net cash provided by financing activities was $45.4 million and $476.6 million for the years ended December 31, 2005 and 2006, respectively. In 2005, cash provided by financing activities was primarily attributable to net proceeds from the issuance of debt and equity in our company, partially offset by payment of dividends on preferred stock. The increase during 2006 was primarily due to borrowings under our revolving credit agreement to fund the approximate $409 million cash portion of the consideration paid to the Chase Group and associated persons pursuant to the combination transaction and proceeds from private issuances of equity in our company.
Bank credit facilities
We have two separate bank credit facilities. The first bank credit facility is our Credit Agreement, dated as of February 24, 2006, with JPMorgan Securities Inc. as the administrative agent for a group of lenders that provides a revolving line of credit having a total commitment of $475 million, which we refer to as the “revolving credit facility.” The total amount that we can borrow and have outstanding at any one time is limited to the lesser of the total commitment of $475 million or the borrowing base established by the lenders. As of December 31, 2006, the borrowing base under our revolving credit facility was $475 million, but was reduced to $375 million on March 27, 2007 in connection with the completion of our second lien term loan facility described below. As of December 31, 2006, the principal amount outstanding under our revolving credit facility was $455.7 million. The second bank credit facility is our Second Lien Credit Agreement, dated as of March 27, 2007, with Bank of America, N.A., as the administrative agent for the other lenders thereunder, that provides a five year term loan in the amount of $200.0 million, which we refer to as the “second lien term loan facility.” Upon execution of the second lien term loan facility, we funded the full amount under that facility and received proceeds of $199.0 million to repay the $39.8 million outstanding under our prior term loan facility, to reduce the outstanding balance under our revolving credit facility by $154.0 million and the remaining $5.2 million to pay loan fees, accrued interest and for general corporate purposes. We expect to use not less than one-half of the net proceeds we receive from this offering to repay a portion of our outstanding indebtedness under the second lien term loan facility and to use any remaining net proceeds to repay a portion of our
51
Table of Contents
outstanding indebtedness under our second lien term loan facility or our revolving credit facility or a combination thereof as described in “Use of proceeds.”
Revolving credit facility. The revolving credit facility allows us to borrow, repay and reborrow amounts available under the revolving credit facility. The amount of the borrowing base is based primarily upon the estimated value of our oil and natural gas reserves. The borrowing base under our revolving credit facility is re-determined at least semi-annually. The revolving credit facility matures on February 24, 2010, and borrowings under our revolving credit facility bear interest, payable quarterly, at our option, at (1) a rate (as defined and further described in our revolving credit facility) per annum equal to a Eurodollar Rate (which is substantially the same as the London Interbank Offered Rate) for one, two, three or six months as offered by the lead bank under our revolving credit facility, plus an applicable margin ranging from 100 to 225 basis points, or (2) such bank’s Prime Rate, plus an applicable margin ranging from 0 to 125 basis points, dependent in each case upon the percentage of our available borrowing base then utilized. Our revolving credit facility bore interest at 7.85% per annum as of December 31, 2006. We pay quarterly commitment fees under our revolving credit facility on the unused portion of the available borrowing base ranging from 25 to 50 basis points, dependent upon the percentage of our available borrowing base then utilized.
Borrowings under our revolving credit facility are secured by a first lien on substantially all of our assets and properties. Our revolving credit facility also contains restrictive covenants that may limit our ability to, among other things, pay cash dividends, incur additional indebtedness, sell assets, make loans to others, make investments, enter into mergers, incur liens and engage in certain other transactions without the prior consent of the lenders. The revolving credit facility also requires us to maintain certain ratios as defined and further described in our revolving credit facility, including a current ratio of not less than 1.0 to 1.0 and a maximum leverage ratio (generally defined as the ratio of total funded debt to EBITDAX) of no greater than 4.0 to 1.0. In addition, at the inception of the revolving credit facility, we had a one-time requirement to enter into hedging agreements with respect to not less than 75% of our forecasted production through December 31, 2008, that was attributable to our proved developed producing reserves estimated as of December 31, 2005. As of December 31, 2006, we were in compliance with all such covenants.
Second lien term loan facility. The second lien term loan facility provides a $200 million term loan, which bears interest, at our option, at (1) a rate per annum equal to the London Interbank Offered Rate, plus an applicable margin of 375 basis points or (2) the prime rate, plus an applicable margin of 225 basis points. Upon the completion of this offering, the interest rate under any of the second lien term loan facility that remains outstanding after the application of the net proceeds from this offering as described in “Use of proceeds” increases, at our option, to (1) a rate per annum equal to the London Interbank Offered Rate, plus an applicable margin of 425 basis points or (2) the prime rate, plus an applicable margin of 275 basis points. We have the option to select different interest periods, subject to availability, and interest is payable at the end of the interest period we select, though such interest payments must be made at least on a quarterly basis. We are required to repay $500,000 of the second lien term loan facility on the last day of each calendar quarter, commencing June 30, 2007, until the remaining balance of the loan matures on March 27, 2012. Our second lien term loan facility currently bears interest at 9.10% per annum. We have the right to prepay the outstanding balance under the second lien term loan facility at any time, provided, however, that we will incur a 2% prepayment penalty on any principal amount prepaid from March 27, 2008 until March 26, 2009
52
Table of Contents
and a 1% prepayment penalty on any principal amount prepaid from March 27, 2009 until March 26, 2010.
Borrowings under the second lien term loan facility are secured by a second lien on the same assets as are securing our revolving credit facility, which liens are subordinated to liens securing our revolving credit agreement. The second lien term loan facility also contains various restrictive financial covenants and compliance requirements that are similar to those contained in the revolving credit agreement, including the maintenance of certain financial ratios.
Future capital expenditures and commitments
We evaluate opportunities to purchase or sell oil and natural gas properties in the marketplace and could participate as a buyer or seller of properties at various times. We seek to acquire oil and gas properties that provide opportunities for the addition of reserves and production through a combination of exploitation, development, high-potential exploration and control of operations and that will allow us to apply our operating expertise or that otherwise have geologic characteristics that are similar to our existing properties.
Expenditures for exploration and development of oil and natural gas properties are the primary use of our capital resources. We anticipate investing approximately $137 million for exploration and development expenditures in 2007 as follows (in millions):
| Amount | |||
| Drilling and recompletion opportunities in our core operating area | $ | 113.3 | |
| Projects in our emerging plays | 4.8 | ||
| Projects operated by third parties | 14.2 | ||
| Acquisition of leasehold acreage and other property interests | 4.7 | ||
| $ | 137.0 | ||
Although we cannot provide any assurance, assuming successful implementation of our strategy, including the future development of our proved reserves and realization of our cash flows as anticipated, we believe that our remaining cash balance and cash flows from operations will be sufficient to satisfy our 2007 exploration and development budget. The actual amount and timing of our expenditures may differ materially from our estimates as a result of, among other things, actual drilling results, the timing of expenditures by third parties on projects that we do not operate, the availability of drilling rigs and other services and equipment, and regulatory, technological and competitive developments.
Hedging
We account for derivative instruments in accordance with SFAS No. 133 “Accounting for Derivative Instruments and Hedging Activities,” as amended. The specific accounting treatment for changes in the market value of the derivative instruments used in hedging activities is determined based on the designation of the derivative instruments as a cash flow or fair value hedge and effectiveness of the derivative instruments. We generally attempt to qualify such derivative instruments as cash flow hedges for accounting purposes.
We have utilized fixed-price contracts and zero-cost collars to reduce exposure to unfavorable changes in oil and natural gas prices that are subject to significant and often volatile
53
Table of Contents
fluctuation. Under the fixed price physical delivery contracts, we receive the fixed price stated in the contract. Under the zero-cost collars, if the market price of crude oil or natural gas, as applicable, is less than the ceiling strike price and greater than the floor strike price, we receive the market price. If the market price of crude oil or natural gas, as applicable, exceeds the ceiling strike price or falls below the floor strike price, we receive the applicable collar strike price.
The tables below provide the volumes and related data associated with our oil and natural gas hedging as of December 31, 2006:
Oil and Natural Gas Price Collars
| MMBtus | ||||||||||||||||||||||
| of | El Paso Natural Gas— | Fair | ||||||||||||||||||||
| Barrels | NYMEX oil prices | natural | Permian Basin natural gas prices | market | ||||||||||||||||||
| Period of time | of oil | Floor | Cap | gas | Floor | Cap | value | |||||||||||||||
| (in thousands) | ||||||||||||||||||||||
| January 1, 2007 thru December 31, 2007 | 237,250 | $ | 37.95 | $ | 41.75 | — | $ | — | $ | — | $ | (5,375 | ) | |||||||||
| January 1, 2007 thru December 31, 2007 | — | $ | — | $ | — | 1,277,500 | $ | 5.00 | $ | 6.02 | $ | (849 | ) | |||||||||
| January 1, 2007 thru December 31, 2007 | — | $ | — | $ | — | 4,562,500 | $ | 6.25 | $ | 10.80 | $ | 3,148 | ||||||||||
| January 1, 2008 thru December 31, 2008 | — | $ | — | $ | — | 4,941,000 | $ | 6.50 | $ | 9.35 | $ | 891 | ||||||||||
| Total net fair market value asset (liability) | $ | (2,185 | ) | |||||||||||||||||||
Oil Price Swaps
| Period of time | Barrels of oil | NYMEX oil swap price | Fair market value | ||||||
| (in thousands) | |||||||||
| January 1, 2007 thru December 31, 2007 | 839,500 | $ | 67.85 | $ | 2,865 | ||||
| January 1, 2008 thru December 31, 2008 | 951,600 | $ | 67.50 | $ | 45 | ||||
| Total fair market value asset | $ | 2,910 | |||||||
54
Table of Contents
Obligations and commitments
We have the following contractual obligations and commitments as of December 31, 2006:
| Payments due by period | |||||||||||||||
| Less than | 1 - 3 | 3 - 5 | More than | ||||||||||||
| (In thousands) | Total | 1 year | years | years | 5 years | ||||||||||
Long-term debt(1) | $ | 495,500 | $ | 400 | $ | 800 | $ | 494,300 | $ | — | |||||
Operating lease obligation(2) | 3,125 | 438 | 888 | 926 | 873 | ||||||||||
Daywork drilling contracts(3) | 14,445 | 14,445 | — | — | — | ||||||||||
Chase Group asset purchase obligation(4) | 906 | 906 | — | — | — | ||||||||||
Oil and gas lease extension payment(5) | 2,093 | 2,093 | — | — | — | ||||||||||
| Employment agreements with executive officers | 4,103 | 1,700 | 2,403 | — | — | ||||||||||
Asset retirement obligations(6) | 8,700 | 1,958 | 194 | 169 | 6,379 | ||||||||||
| Total contractual cash obligations | $ | 528,872 | $ | 21,940 | $ | 4,285 | $ | 495,395 | $ | 7,252 | |||||
| (1) | Our long-term debt increased by $5.2 million on March 27, 2007, excluding accrued interest, as a result of funding our second lien term loan facility. | |
| (2) | Operating lease obligation is for office space. | |
| (3) | Consists of daywork drilling contracts related to five drilling rigs contracted for a portion of 2007. See Note K to our consolidated financial statements. | |
| (4) | Represents the value of certain oil and gas interests contracted to be acquired from Chase Group members. We are obligated to offer to deliver aggregate consideration of $906,000, in cash or common stock or any combination of the foregoing to these individuals. See Note K to our consolidated financial statements. | |
| (5) | Represents an obligation for an additional payment to be made in 2007 in connection with our prior leasing of 13,952 net acres in Culberson County, Texas. | |
| (6) | Amounts represent expected oil and gas property abandonments related to proved reserves by period, net of any future accretion. |
Off-balance sheet arrangements
Currently we do not have any off-balance sheet arrangements.
Critical accounting policies and practices
Our historical consolidated financial statements and notes to our historical consolidated financial statements contain information that is pertinent to our management’s discussion and analysis of financial condition and results of operations. Preparation of financial statements in conformity with accounting principles generally accepted in the United States requires that our management make estimates, judgments and assumptions that affect the reported amounts of assets, liabilities, revenues and expenses, and the disclosure of contingent assets and liabilities. However, the accounting principles used by us generally do not change our reported cash flows or liquidity. Interpretation of the existing rules must be done and judgments made on how the specifics of a given rule apply to us.
55
Table of Contents
In management’s opinion, the more significant reporting areas impacted by management’s judgments and estimates are revenue recognition, the choice of accounting method for oil and natural gas activities, oil and natural gas reserve estimation, asset retirement obligations and impairment of assets. Management’s judgments and estimates in these areas are based on information available from both internal and external sources, including engineers, geologists and historical experience in similar matters. Actual results could differ from the estimates, as additional information becomes known.
Successful efforts method of accounting
We utilize the successful efforts method of accounting for our oil and natural gas exploration and development activities under this method. Exploration expenses, including geological and geophysical costs, lease rentals and exploratory dry holes, are charged against income as incurred. Costs of successful wells and related production equipment, undeveloped leases and developmental dry holes are also capitalized. This accounting method may yield significantly different results than the full cost method of accounting. Exploratory drilling costs are initially capitalized, but are charged to expense if and when the well is determined not to have found proved reserves. Generally, a gain or loss is recognized when producing properties are sold.
The application of the successful efforts method of accounting requires management’s judgment to determine the proper designation of wells as either developmental or exploratory, which will ultimately determine the proper accounting treatment of costs of dry holes. Once a well is drilled, the determination that proved reserves have been discovered may take considerable time, and requires both judgment and application of industry experience. The evaluation of oil and gas leasehold acquisition costs included in unproved properties requires management’s judgment to estimate the fair value of such properties. Drilling activities in an area by other companies may also effectively condemn our leasehold positions.
Non-producing properties consist of undeveloped leasehold costs and costs associated with the purchase of certain proved undeveloped reserves. Individually significant non-producing properties are periodically assessed for impairment of value.
Depreciation of capitalized drilling and development costs of oil and natural gas properties is computed using theunit-of-production method on an individual property or unit basis based on total estimated proved developed oil and natural gas reserves. Depletion of producing leaseholds is based on theunit-of-production method using our total estimated net proved reserves. In arriving at rates under theunit-of-production method, the quantities of recoverable oil and natural gas are established based on estimates made by our geologists and engineers and independent engineers. Service properties, equipment and other assets are depreciated using the straight-line method over estimated useful lives of 1 to 50 years. Upon sale or retirement of depreciable or depletable property, the cost and related accumulated depletion are eliminated from the accounts and the resulting gain or loss is recognized.
Oil and natural gas reserves and standardized measure of future cash flows
Our independent engineers and technical staff prepare the estimates of our oil and natural gas reserves and associated future net cash flows. Current accounting guidance allows only proved oil and natural gas reserves to be included in our financial statement disclosures. The SEC has defined proved reserves as the estimated quantities of crude oil and natural gas which geological and engineering data demonstrate with reasonable certainty to be recoverable in future
56
Table of Contents
years from known reservoirs under existing economic and operating conditions. Even though our independent engineers and technical staff are knowledgeable and follow authoritative guidelines for estimating reserves, they must make a number of subjective assumptions based on professional judgments in developing the reserve estimates. Reserve estimates are updated at least annually and consider recent production levels and other technical information about each field. Periodic revisions to the estimated reserves and future cash flows may be necessary as a result of a number of factors, including reservoir performance, new drilling, oil and natural gas prices, cost changes, technological advances, new geological or geophysical data, or other economic factors. We cannot predict the amounts or timing of future reserve revisions. If such revisions are significant, they could significantly alter future DD&A and result in impairment of assets that may be material.
Asset retirement obligations
In June 2001, the FASB issued SFAS No. 143, “Accounting for Asset Retirement Obligations,” which applies to legal obligations associated with the retirement of long-lived assets that result from the acquisition, construction, development and the normal operation of a long-lived asset. The primary impact of this standard on us relates to oil and natural gas wells on which we have a legal obligation to plug and abandon. SFAS No. 143 requires us to record the fair value of a liability for an asset retirement obligation in the period in which it is incurred and a corresponding increase in the carrying amount of the related long-lived asset. The determination of the fair value of the liability requires us to make numerous judgments and estimates, including judgments and estimates related to future costs to plug and abandon wells, future inflation rates and estimated lives of the related assets.
Impairment of assets
All of our long-lived assets are monitored for potential impairment when circumstances indicate that the carrying value of an asset may be greater than its future net cash flows, including cash flows from risk adjusted proved reserves. The evaluations involve a significant amount of judgment since the results are based on estimated future events, such as future sales prices for oil and natural gas, future costs to produce these products, estimates of future oil and natural gas reserves to be recovered and the timing thereof, the economic and regulatory climates and other factors. The need to test a field for impairment may result from significant declines in sales prices or downward revisions to estimated quantities of oil and natural gas reserves. Any assets held for sale are reviewed for impairment when we approve the plan to sell. Estimates of anticipated sales prices are highly judgmental and subject to material revision in future periods. Because of the uncertainty inherent in these factors, we cannot predict when or if future impairment charges will be recorded.
Recent accounting pronouncements
In December 2004, the FASB issued SFAS No. 123 (Revised 2004), “Share-Based Payment”. SFAS No. 123R addresses the accounting for transactions in which an enterprise exchanges its valuable equity instruments for employee services. It also addresses transactions in which an enterprise incurs liabilities that are based on the fair value of the enterprise’s equity instruments or that may be settled by the issuance of those equity instruments in exchange for employee services. The cost of employee services received in exchange for equity instruments, including employee stock options, would be measured based on the grant-date fair value of those
57
Table of Contents
instruments. That cost would be recognized as compensation expense over the requisite service period (often the vesting period). Generally, no compensation cost would be recognized for equity instruments that do not vest. We adopted SFAS No. 123R in 2005 and applied the modified retrospective application method to all prior periods. We previously utilized the method of accounting for stock based compensation prescribed by APB 25 and included disclosures in the footnotes to the consolidated financial statements which illustrated the results we would have recorded had we utilized the fair value method prescribed by SFAS No. 123 “Accounting for Stock-Based Compensation” in our primary financial statements.
The FASB issued FSPNo. 19-1, which amends SFAS No. 19 to provide that in those situations where exploration drilling has been completed and oil and gas reserves have been found, but such reserves cannot be classified as proved when drilling is complete, the drilling costs may be capitalized if the well has found a sufficient quantity of reserves to justify its completion as a producing well and the enterprise is making sufficient progress assessing the reserves and the economic and operating viability of the project. If either of the criteria is not met, the well is assumed to be impaired and the costs charged to expense. Any well that has not found reserves is charged to expense. We adopted FSPNo. 19-1 January 1, 2006 and there was no significant impact on our consolidated financial position or results of operations.
In July 2006, the FASB issues FIN No. 48 “Accounting for Uncertainty in Income Taxes—an Interpretation of FASB Statement 109”. FIN No. 48 clarifies that an entity’s tax benefits recognized in tax returns must be more likely than not of being sustained prior to recording the related tax benefit in the financial statements. As required by FIN No. 48, we will adopt this new accounting standard effective January 1, 2007. Management is currently reviewing the impact of FIN No. 48 on our consolidated financial statements.
In September 2006, the FASB issued SFAS No. 157, “Fair Value Measurement”. This statement defines fair value, establishes a framework for measuring fair value and expands disclosures about fair value measurements. This statement is effective for financial statements issued for fiscal years beginning after November 15, 2007. We will adopt SFAS No. 157 effective January 1, 2008. We are currently evaluating the impact of SFAS No. 157.
In September 2006, the SEC issued Staff Accounting Bulletin (SAB) 108, “Financial Statements—Considering the Effects of Prior Year Misstatements when Quantifying Misstatements in Current Year Financial Statements.” SAB 108 requires quantification of the impact of all prior year misstatements from both an income statement and a balance sheet perspective to determine if the misstatements are material. SAB 108 is effective for financial statements issued for fiscal years ending after November 15, 2006. We adopted SAB 108 effective at the inception of Concho Equity Holdings Corp.
Inflation
Historically, general inflationary trends have not had a material effect on our operating results. However, we have experienced inflationary pressure on technical staff compensation and the cost of oilfield services and equipment due to the increase in drilling activity and competitive pressures resulting from higher oil and natural gas prices in recent years.
58
Table of Contents
Quantitative and qualitative disclosures about market risk
We are exposed to a variety of market risks including credit risk, commodity price risk and interest rate risk. We address these risks through a program of risk management including the use of derivative instruments.
Credit risk. We monitor our risk of loss due to non-performance by counterparties of their contractual obligations. Our principal exposure to credit risk is through the sale of our oil and natural gas production, which we market to energy marketing companies and refineries, as described under “Business and properties-Marketing arrangements.” We monitor our exposure to these counterparties primarily by reviewing credit ratings, financial statements and payment history. We extend credit terms based on our evaluation of each counterparty’s creditworthiness. Although we have not generally required our counterparties to provide collateral to support their obligation to us, we may, if circumstances dictate, require collateral in the future. In this manner, we reduce credit risk.
Commodity price risk. We are exposed to market risk as the prices of crude oil and natural gas are subject to fluctuations resulting from changes in supply and demand. To partially reduce price risk caused by these market fluctuations, we have hedged approximately 75% of our forecasted oil and natural production through December 31, 2008, attributable to our proved developed producing reserves as of December 31, 2005, through the utilization of derivatives, including zero-cost collars and fixed price contracts. See “—Liquidity and capital resources—Hedging.”
Interest rate risk. Our exposure to changes in interest rates relates primarily to long-term debt obligations. We manage our interest rate exposure by limiting our variable-rate debt to a certain percentage of total capitalization and by monitoring the effects of market changes in interest rates. We may utilize interest rate derivatives to alter interest rate exposure in an attempt to reduce interest rate expense related to existing debt issues. Interest rate derivatives are used solely to modify interest rate exposure and not to modify the overall leverage of the debt portfolio. We are exposed to changes in interest rates as a result of our bank credit facilities, and the terms of our revolving credit agreement require us to pay higher interest rate margins as we utilize a larger percentage of our available borrowing base. We had total indebtedness of $455.7 million outstanding under our revolving credit agreement at December 31, 2006. The impact of a 1% increase in interest rates on this amount of debt would result in increased interest expense of approximately $4.6 million and a corresponding decrease in net income before income tax. On March 27, 2007, we entered into a $200.0 million second lien term loan facility, from which we received $199.0 million in proceeds, with $39.8 million of such amount used to retire our prior second lien term loan facility, $154.0 million of such amount used to reduce the amount outstanding under our revolving credit agreement and the remaining $5.2 million of such amount used to pay loan fees, accrued interest and for general corporate purposes.
59
Table of Contents
Results of operations of the Chase Group Properties
The following table presents selected financial and operating information of the Chase Group Properties for the years ended December 31, 2004 and 2005:
| Years ended December 31, | ||||||
| (in thousands, except price data) | 2004 | 2005 | ||||
| Oil sales | $ | 66,529 | $ | 73,132 | ||
| Natural gas sales | 41,247 | 46,546 | ||||
| Total operating revenues | 107,776 | 119,678 | ||||
| Oil and gas production | 11,762 | 12,979 | ||||
| Oil and gas production taxes | 9,202 | 10,298 | ||||
| Depreciation, depletion and amortization | 20,196 | 18,646 | ||||
| Impairments of proved properties | 3,233 | 194 | ||||
| Exploration and abandonments | 179 | — | ||||
| Accretion of discount on asset retirement obligations | 263 | 446 | ||||
| General and administrative | 1,387 | 1,702 | ||||
| Loss on derivatives not designated as hedges | 7,936 | 1,062 | ||||
| Total operating costs and expenses | 54,158 | 45,327 | ||||
| Revenues in excess of expenses | $ | 53,618 | $ | 74,351 | ||
Production volumes (unaudited): | ||||||
| Oil (MBbl) | 1,751 | 1,429 | ||||
| Natural gas (MMcf) | 7,636 | 6,636 | ||||
| Natural gas equivalents (Mcfe) | 18,142 | 15,210 | ||||
Average prices (unaudited): | ||||||
| Oil ($/Bbl) | $ | 37.99 | $ | 51.17 | ||
| Natural gas ($/Mcf) | 5.40 | 7.01 | ||||
| Natural gas equivalents ($/Mcfe) | 5.94 | 7.87 | ||||
Year ended December 31, 2004, compared to year ended December 31, 2005
Oil and gas revenues. Revenue from oil and gas operations increased by $11.9 million (11%) from $107.8 million for the year ended December 31, 2004 to $119.7 million for the year ended December 31, 2005. This increase was primarily because of increased commodity prices which more than offset the declines in production. Total production decreased 2,932 MMcfe (16%) from 18,142 MMcfe for the year ended December 31, 2004 to 15,210 MMcfe for the year ended December 31, 2005. Production decreased because capital funds expended for property acquisition and development was not sufficient to overcome the natural decline of the existing wells. Average realized oil prices increased 35% from $37.99 per Bbl in 2004 to $51.17 per Bbl in 2005, average realized natural gas prices increased 30% from $5.40 per Mcf in 2004 to $7.01 per Mcf
60
Table of Contents
in 2005 and total realized production equivalent prices increased 32% from $5.94 per Mcfe in 2004 to $7.87 per Mcfe in 2005.
Oil and gas production costs. Total operating costs increased $2.3 million (11%) from $21.0 million ($1.16 per Mcfe) to $23.3 million ($1.53 per Mcfe) for the years ended December 31, 2004 and 2005, respectively. The increase in operating costs was due to general increases in oil and gas service and equipment rates. Lease operating expenses and workover costs comprised approximately 56% of total operating costs during both 2004 and 2005. These costs per unit of production increased 31% from $0.65 per Mcfe in 2004 to $0.85 per Mcfe in 2005. Per unit costs increased because of increases in oil and gas service and equipment rates along with lower production volumes. Included in operating costs are costs of salaries and benefits of pumpers and field level supervisors of the Chase Group and the Chase Group’s share of general liability insurance that do not necessarily decrease when production volumes decrease.
Oil and gas production taxes. Production taxes comprised approximately 44% of total operating costs for 2004 and 2005. Production taxes per unit of production increased 33% from $0.51 per Mcfe in 2004 to $0.68 per Mcfe in 2005. This increase was directly related to an increase in commodity prices. In general, production taxes rates are based on the value of production rather than production volumes.
Depletion, depreciation and amortization expense. Total depletion, depreciation and amortization expense decreased $1.6 million (8%) from $20.2 million ($1.11 per Mcfe) to $18.6 million ($1.23 per Mcfe) for the years ended December 31, 2004 and 2005, respectively. The decrease in total expense was primarily due to lower production volumes.
Impairment of oil and gas properties. In accordance with SFAS 144, the long-lived assets of the Chase Group Properties to be held and used, including proved oil and gas properties accounted for under the successful efforts method of accounting are reviewed. As a result of this review of the recoverability of the carrying value of its assets during 2004, the Chase Group Properties recognized non-cash charges against earnings of $3.3 million related to its proved oil and gas properties. During 2005, the Chase Group Properties recognized non-cash charges against earnings of $0.2 million related to its proved oil and gas properties.
General and administrative expenses. General and administrative expenses increased $0.3 million (21%) from $1.4 million ($0.08 per Mcfe) to $1.7 million ($0.11 per Mcfe) for the years ended December 31, 2004 and 2005, respectively. The increase in general and administrative expense during 2005 was primarily because of increases in compensation expenses.
Loss on derivatives not designated as hedges. Gains and losses on derivative transactions are a result of fluctuations in oil and natural gas prices and, consequently, the change in fair values of derivatives as included in our earnings for each accounting period. Losses in 2004 exceeded those in 2005 because the derivative transactions were entered into in the second quarter of 2004, resulting in 2004 mark-to-market adjustments being larger due to larger remaining contractual volumes than in 2005. Also, no derivative transactions were outstanding for the period of June 2005 through December 2005.
61
Table of Contents
Business and properties
We are an independent oil and natural gas company engaged in the acquisition, development, exploitation and exploration of oil and natural gas properties. Our conventional operations are primarily focused in the Permian Basin of Southeast New Mexico and West Texas. These conventional operations are complemented by our activities in unconventional emerging resource plays. We intend to grow our reserves and production through development drilling, exploitation and exploration activities on our multi-year project inventory and through acquisitions that meet our strategic and financial objectives.
Our operations are primarily concentrated in the Permian Basin, the largest onshore oil and gas basin in the United States. As of December 31, 2006, 99% of our total estimated net proved reserves were located in the Permian Basin and consisted of approximately 57% crude oil and 43% natural gas. This basin is characterized by an extensive production history, mature infrastructure, long reserve life, multiple producing horizons, enhanced recovery potential and a large number of operators. The primary producing formation in the Permian Basin under our core properties in Southeast New Mexico is the Paddock interval of the Yeso formation, which is located at depths ranging from 3,800 feet to 5,800 feet. We have also discovered reserves and are producing oil and natural gas from the Blinebry interval of the Yeso formation, the top of which is located approximately 400 feet below the base of the Paddock interval. In addition, we have assembled a multi-year inventory of development drilling and exploitation projects, including further projects to evaluate the aerial extent of the Blinebry interval, that we believe will allow us to grow proved reserves and production. We have also acquired significant acreage positions in the Permian Basin of Southeast New Mexico, the Central Basin Platform, the Delaware Basin and the Val Verde Basin of West Texas, the Williston Basin in North Dakota and the Arkoma Basin in Arkansas covering unconventional emerging resource plays, where we intend to apply horizontal drilling, advanced fracture stimulation and enhanced recovery technologies.
We were formed in February 2006 as a result of the combination of Concho Equity Holdings Corp. and a portion of the oil and natural gas properties and related assets owned by Chase Oil Corporation and certain of its affiliates. Concho Equity Holdings Corp. was formed in April 2004 and represents the third of three Permian Basin-focused companies that have been formed since 1997 by our current management team (the prior two companies were sold to large domestic independent oil and gas companies).
Following the formation of our company, we drilled 140 gross (86.4 net) wells in 2006, 89% of which were completed as producers, 7% of which were dry holes and 4% of which are awaiting completion. In addition, following the formation of our company, we recompleted 103 gross (77.1 net) wells in 2006, 98% of which were productive. As a result, we have increased our total estimated net proved reserves by approximately 51 Bcfe from 416 Bcfe as of December 31, 2005, on a pro forma basis, to 467 Bcfe as of December 31, 2006, while producing approximately 26 Bcfe of oil and natural gas on a pro forma basis during the year ended December 31, 2006. In addition, following the formation of our company, we increased our average net daily production from 62 MMcfe during March 2006 to 79 MMcfe during December 2006.
The following table provides a summary of selected operating information of our conventional properties in the Permian Basin, which is our core operating area, and in our unconventional emerging resource plays. PV-10 includes the present value of our estimated future abandonment and site restoration costs for proved properties net of the present value of estimated salvage
62
Table of Contents
proceeds from each of these properties. We set forth our definition ofPV-10 (a non-GAAP financial measure) and a reconciliation ofPV-10 to the standardized measure of discounted future net cash flows under “Prospectus summary—Non-GAAP financial measures and reconciliations.”
| Year ended | ||||||||||||||||||||||||
| As of | December 31, | |||||||||||||||||||||||
| December 31, 2006 | 2006 | |||||||||||||||||||||||
| Pro forma | Pro forma | |||||||||||||||||||||||
| Total | reserve/ | average | ||||||||||||||||||||||
| proved | production | Identified | Identified | Total | Total | daily | ||||||||||||||||||
| reserves | PV-10 | index(1) | drilling | recompletion | gross | net | production | |||||||||||||||||
| Areas | (Bcfe) | ($ in millions) | (years) | locations(2) | projects(2) | acreage | acreage | (MMcfe/d) | ||||||||||||||||
| Permian Basin | ||||||||||||||||||||||||
| Southeast New Mexico | 387.5 | $ | 782.6 | 18.7 | 1,505 | 489 | 182,475 | 87,160 | 56.8 | |||||||||||||||
| West Texas | 70.2 | 154.5 | 15.5 | 148 | 49 | 95,390 | 35,101 | 12.4 | ||||||||||||||||
Emerging Plays and Other(3) | 9.1 | 16.9 | 19.2 | 23 | 2 | 223,025 | 114,936 | 1.3 | ||||||||||||||||
| Total | 466.8 | $ | 954.0 | 18.1 | 1,676 | 540 | 500,890 | 237,197 | 70.5 | |||||||||||||||
| (1) | The Pro forma reserve/production index is the number of years proved reserves would last assuming current production continued at the same rate. This index is calculated by dividing pro forma production during the year ended December 31, 2006, into the proved reserve quantity as of December 31, 2006. | |
| (2) | The identified drilling locations and identified recompletion projects listed in the table above included 817 drilling locations and recompletion projects for which proved reserves had been included in our reserve reports as of December 31, 2006. | |
| (3) | Information with respect to “Other” includes conventional oil and gas operations on properties that are not located in the Permian Basin. As of December 31, 2006, 3.1 Bcfe of the proved reserves and $5.4 million of thePV-10 as well as one of the identified drilling locations and two identified recompletion projects were related to oil and natural gas properties categorized as “Other” and not as “Emerging Plays.” In addition, as of December 31, 2006, 4,948 gross (797 net) acres reflected above were categorized as “Other,” and 1.2 MMcfe/d of the pro forma average daily production during the year ended December 31, 2006 reflected above were categorized as “Other.” |
In our unconventional emerging resource plays, we target areas where we can acquire large undeveloped acreage positions and apply horizontal drilling, advanced fracture stimulation and enhanced recovery technologies to achieve economic, repeatable production results. As of December 31, 2006, we held interests in 218,077 gross (114,139 net) acres in six unconventional emerging resource plays. Our current positions include acreage in:
| • | the Northwest Shelf area in Southeast New Mexico, where we have tested one re-entry well and drilled six exploratory wells targeting the Wolfcamp Carbonate; |
| • | the Central Basin Platform of West Texas, where we plan to target the Woodford Shale; |
| • | the Delaware Basin of West Texas, where we have drilled four exploratory wells targeting the Bone Spring, Atoka, Barnett and Woodford Shales; |
| • | the Val Verde Basin of West Texas, where we plan to drill our first test well in 2007, which will target the Ellenburger Dolomite and the Canyon Sands; |
| • | the North Dakota portion of the Williston Basin, where we have drilled two exploratory wells targeting the Bakken Shale; and |
| • | the eastern Arkoma Basin in Arkansas, where we plan to drill our first test well prior to March 31, 2008, which will target the Fayetteville Shale. |
63
Table of Contents
Our exploration and development budget for our oil and gas properties for the year ending December 31, 2007 is approximately $137 million. We plan to spend approximately 93% of our capital budget on exploration and development activities associated with our conventional properties in the Permian Basin, 3% for leasehold acquisitions and 4% for exploration activities in our emerging resource plays. If we achieve successful results from exploratory drilling in our unconventional emerging resource plays, we may allocate a greater portion of our planned 2007 capital expenditure budget to those plays.
Our business strategy
Our goal is to enhance stockholder value through profitably increasing reserves, production and cash flow by executing our strategy as described below:
| • | Exploit our multi-year project inventory. We believe our multi-year drilling and exploitation inventory will allow us to grow our proved reserves and production for the next several years. As of December 31, 2006, we had identified 2,216 drilling locations and recompletion projects on our existing properties, including step-out drilling, infill drilling (including well deepening opportunities), workovers and recompletions. |
| • | Enhance production from our existing properties through development of additional producing horizons and enhanced recovery methods. We believe there are additional productive horizons underlying certain of our existing producing horizons in Southeast New Mexico that have not been fully developed. During 2006, we accelerated an evaluation, which had begun in late 2005, of the Blinebry interval, which lies below the primary producing interval under our core properties in Southeast New Mexico. During 2006, we drilled 52 wells in the Blinebry interval, all of which have since been completed as producers. At December 31, 2006, the wells in the Blinebry interval which had been drilled and completed and were producing only from the Blinebry interval were producing an average of 80 Bbl and 176 Mcf per well per day. We currently intend to drill an additional 69 wells in 2007 to further evaluate the aerial extent of the Blinebry interval. In addition, we are evaluating the feasibility of enhanced recovery operations on a significant portion of our Southeast New Mexico properties. |
| • | Pursue the acquisition, exploration and development of unconventional emerging oil and natural gas resource plays. We have assembled an exploration team to target unconventional emerging resource plays where we can acquire large undeveloped acreage positions and apply horizontal drilling, advanced fracture stimulation and enhanced recovery technologies to achieve economic, repeatable production results. As of December 31, 2006, we had accumulated 218,077 gross (114,139 net) acres in six unconventional emerging resource plays, and our technical team is focused on exploring, developing and exploiting these resource plays as well as evaluating and acquiring acreage in similar plays in North America. |
| • | Make opportunistic acquisitions that meet our strategic and financial objectives. We seek to acquire oil and gas properties that we believe complement our existing properties in our core areas of operation. We have an experienced team of management, engineering and geoscience professionals to identify and evaluate acquisition opportunities. We also seek to acquire oil and gas properties that provide opportunities for the addition of reserves, production and value through a combination of exploitation, development, high-potential exploration and control of operations and that will allow us to apply our operating expertise or that otherwise have geologic characteristics that are similar to our existing properties. |
64
Table of Contents
Our strengths
We have a number of strengths that we believe will help us successfully execute our strategy:
| • | Experienced and incentivized management team. Our executive officers average over 20 years of experience in the oil and gas industry, having led both public and private oil and natural gas exploration and production companies. These companies have had substantially all of their operations in our core area of the Permian Basin and were headquartered in Midland, Texas, which is located in the heart of the Permian Basin. Additionally, members of our technical staff, including six petroleum engineers, seven geoscientists and seven landmen, have, on average, more than 23 years experience in the industry. After giving effect to this offering, our executive officers will beneficially own an aggregate of % of our outstanding common stock, which will align their objectives with those of our stockholders. |
| • | History of growth and capital efficiency. During the year ended December 31, 2006, we increased our total estimated net proved reserves by approximately 51 Bcfe from 416 Bcfe as of December 31, 2005, on a pro forma basis, to 467 Bcfe as of December 31, 2006, and produced approximately 26 Bcfe of oil and natural gas on a pro forma basis. In addition, following the formation of our company, we increased our average net daily production from 62 MMcfe during March 2006 to 79 MMcfe during December 2006. The increase in reserves and production during the year ended December 31, 2006 was primarily attributable to our successful drilling program in the Permian Basin. Despite increasing costs of oilfield services and equipment in our areas of operation, we added 101 Bcfe of proved reserves through new discoveries and extensions, excluding revisions of previous estimates at a total cost of $191.5 million. |
| • | Large inventory of drilling and recompletion opportunities. Following the formation of our company, we drilled 140 gross (86.4 net) wells in 2006, of which 125 gross (81.4 net) wells were completed as producers, 10 gross (3.2 net) wells were dry holes and 5 gross (1.8 net) wells are awaiting completion. In addition, following the formation of our company, we recompleted 103 gross (77.1 net) wells in 2006, 98% of which were productive. As of December 31, 2006, we had identified 1,676 undrilled well locations on our acreage, with proved undeveloped reserves attributed to 595 of such locations, and 540 recompletion opportunities, with proved reserves attributed to 222 of such opportunities. We plan to drill 134 wells and recomplete 90 wells during 2007. |
| • | Geographically concentrated operations. Our current operations are focused in the Permian Basin of Southeast New Mexico and West Texas, where 99% of our proved reserves are located. Our geographic concentration allows us to establish economies of scale with respect to drilling, production, operating and administrative costs, in addition to further leveraging our base of technical expertise in this region. |
| • | Significant operational control. As of December 31, 2006, we operated 916 gross (824 net) wells on properties which comprised 89% of ourPV-10. Additionally, as of December 31, 2006, approximately 72% of our identified drilling locations and recompletion projects were associated with properties we operate. Our high proportion of operated properties enables us to exercise a significant level of control over the amount and timing of expenses, capital allocation and other aspects of exploration and development. |
65
Table of Contents
Combination transaction
On February 24, 2006, we entered into a combination agreement in which we agreed to purchase certain oil and gas properties owned by Chase Oil Corporation, Caza Energy LLC and certain other individual working interest owners (which we refer to collectively as the “Chase Group”) and combine them with substantially all of the outstanding equity interests of Concho Equity Holdings Corp. to form our company. The initial closing of the transactions contemplated by the combination agreement occurred on February 27, 2006. As a result of the initial closing of the combination transaction agreement, the members of the Chase Group that sold their working interests to us at the initial closing of the combination transaction received 69,366,627 shares of our common stock and approximately $400 million in cash, and the former shareholders of Concho Equity Holdings Corp. that were a party to the combination agreement received 47,535,346 shares of our common stock. In addition, certain options held by our employees to purchase preferred and common stock of Concho Equity Holdings Corp. were converted into options to purchase 4,698,331 shares of our common stock. The oil and gas properties contributed to us by the Chase Group (which we refer to as the “Chase Group Properties”) represent approximately 76% of ourPV-10 as of December 31, 2006. The executive officers of Concho Equity Holdings Corp. became the executive officers of our company in connection with the initial closing of the combination transaction. We have accounted for the combination transaction as a reorganization of our company, such that Concho Equity Holdings Corp. is now our wholly owned subsidiary, and a simultaneous acquisition by our company of the assets contributed by the Chase Group.
We agreed in the combination agreement to offer to acquire additional interests in the Chase Group Properties from persons associated with the Chase Group. In May 2006, we acquired certain of such interests from ten of such persons in exchange for an aggregate consideration of 222,645 shares of our common stock and $8.9 million in cash. In April 2007, we offered to acquire the remainder of such interests from an additional nine persons in exchange for, at the respective seller’s option, shares of our common stock or cash, or any combination thereof, aggregating a total purchase offer of $906,000. Terms concerning the exchange of such interests for shares of our common stock were the same as the terms in the combination agreement.
In addition, because certain employee stockholders of Concho Equity Holdings Corp. were not confirmed to have been accredited investors at the time of the combination transaction, their 254,621 units, consisting of one preferred and one common share of Concho Equity Holdings Corp., could not be immediately exchanged for our common shares. On April 16, 2007, these remaining shares of Concho Equity Holdings Corp. were exchanged for 636,555 shares of our common stock. As a result, Concho Equity Holdings Corp. is now our wholly owned subsidiary.
Prior to the completion of this offering, the field operations of the oil and gas properties we acquired from the Chase Group were conducted on our behalf and at our direction by employees of Mack Energy Corporation, an affiliate of Chase Oil. Upon the completion of this offering, our employees, along with third party contractors, if necessary, will assume those operations. For more information about our transactions with certain affiliates of Chase Oil, please see “Certain relationships and related party transactions.”
Concho Equity Holdings Corp. was formed in April 2004 by our existing senior management team and private equity investors, and it commenced oil and gas operations in December 2004 upon its acquisition of the Lowe Properties for approximately $117 million. As of January 1, 2006, Concho Equity Holdings Corp. had 107.5 Bcfe in proved oil and natural gas reserves that were primarily located in the Permian Basin of Southeast New Mexico and West Texas. As of that same
66
Table of Contents
date, Concho Equity Holdings Corp. also held exploration leasehold acreage in emerging resource plays in the Wolfcamp Carbonate in Southeast New Mexico, the Delaware Basin Shale plays in West Texas, the Bakken Shale in North Dakota and the Fayetteville Shale in Arkansas. As a result of the combination transaction, we acquired all of the oil and gas properties and related operations of Concho Equity Holdings Corp., and now employ its personnel.
Chase Oil is a private company formed by Mack C. Chase in 1992 to engage in oil and natural gas exploitation, acquisition, exploration and production activities primarily in the Permian Basin region of Southeast New Mexico. The oil and gas interests contributed by the Chase Group in the combination transaction represented a portion of the total assets held by the Chase Group. As of January 1, 2006, the net interests in the properties contributed by the Chase Group in the combination transaction consisted of 305.5 Bcfe in net proved oil and natural gas reserves located in the Permian Basin region of Southeast New Mexico.
After the closing of the combination transaction, the former holders of Concho Equity Holdings Corp. owned approximately 41% of our outstanding common stock, the Chase Group owned the remaining 59%, and the executive officers of Concho Equity Holdings Corp. became the executive officers of our company. The oil and gas property interests contributed by the Chase Group represented approximately 76% of our pro formaPV-10 as of December 31, 2006. These oil and gas properties are primarily located in Lea and Eddy Counties in New Mexico.
Productive wells
The following table presents our total gross and net productive wells by region and by oil or gas completion as of December 31, 2006:
| Natural | ||||||||||||||||||
| Oil wells | gas wells | Total wells | ||||||||||||||||
| Gross | Net | Gross | Net | Gross | Net | |||||||||||||
| Permian Basin: | ||||||||||||||||||
| Southeast New Mexico | 1,218 | 729.0 | 178 | 51.6 | 1,396 | 780.6 | ||||||||||||
| West Texas | 415 | 131.2 | 65 | 10.9 | 480 | 142.1 | ||||||||||||
| Emerging Plays and Other | 5 | 1.1 | 40 | 5.6 | 45 | 6.7 | ||||||||||||
| Total | 1,638 | 861.3 | 283 | 68.1 | 1,921 | 929.4 | ||||||||||||
67
Table of Contents
Developed and undeveloped acreage
The following table presents the total gross and net developed and undeveloped acreage by region as of December 31, 2006:
| Developed acres | Undeveloped acres | Total acres | ||||||||||||||||
| Gross | Net | Gross | Net | Gross | Net | |||||||||||||
| Permian Basin: | ||||||||||||||||||
| Southeast New Mexico | 116,196 | 60,308 | 66,279 | 26,852 | 182,475 | 87,160 | ||||||||||||
| West Texas | 77,305 | 25,557 | 18,085 | 9,544 | 95,390 | 35,101 | ||||||||||||
Emerging Plays and Other(1) | 10,629 | 1,441 | 212,396 | 113,495 | 223,025 | 114,936 | ||||||||||||
| Total | 204,130 | 87,306 | 296,760 | 149,891 | 500,890 | 237,197 | ||||||||||||
| (1) | The following table sets forth gross and net acreage as of December 31, 2006 for each of our six emerging resource plays and our plays categorized as “Other” included in “Emerging Plays and Other.” |
| Total acres | ||||||
| Gross | Net | |||||
| Southeast New Mexico | 41,217 | 10,778 | ||||
| Central Basin Platform | 9,548 | 9,548 | ||||
| Western Delaware Basin | 70,142 | 22,942 | ||||
| Val Verde Basin | 39,999 | 39,609 | ||||
| Williston Basin of North Dakota | 40,149 | 16,810 | ||||
| Arkoma Basin of Arkansas | 17,022 | 14,452 | ||||
| Total Emerging Plays | 218,077 | 114,139 | ||||
| Other | 4,948 | 797 | ||||
| Total Emerging Plays and Other | 223,025 | 114,936 | ||||
The following table sets forth the amount of our gross and net undeveloped acreage as of December 31, 2006 that will expire over the next three years by region unless production is established within the spacing units covering the acreage prior to the expiration dates:
| 2007 | 2008 | 2009 | ||||||||||||||||
| Gross | Net | Gross | Net | Gross | Net | |||||||||||||
| Permian Basin: | ||||||||||||||||||
| Southeast New Mexico | 5,805 | 2,876 | 23,696 | 7,490 | 8,601 | 3,423 | ||||||||||||
| West Texas | 3,991 | 2,072 | 14,155 | 3,200 | 2,726 | 1,975 | ||||||||||||
Emerging Plays and Other(1) | 2,621 | 2,671 | 11,358 | 2,766 | 72,260 | 43,316 | ||||||||||||
| Total | 12,417 | 7,619 | 49,209 | 13,456 | 83,587 | 48,714 | ||||||||||||
| (1) | We have the option to extend the expiration terms by two additional years (beginning October 2007 through May 2008) on approximately 6,400 gross (4,800 net) acres by paying $405,000 in 2007 and $200,000 in 2008. |
Drilling activities
The following table sets forth information with respect to wells drilled during the periods indicated and does not include wells drilled on the oil and gas properties we acquired from the
68
Table of Contents
Chase Group prior to the combination transaction on February 27, 2006. The information should not be considered indicative of future performance, nor should a correlation be assumed between the number of productive wells drilled, quantities of reserves found or economic value. Development wells are wells drilled within the proved area of an oil or gas reservoir to the depth of a stratigraphic horizon known to be productive. Exploratory wells are wells drilled to find and produce oil or gas in an unproved area, to find a new reservoir in a field previously found to be productive of oil or gas in another reservoir, or to extend a known reservoir. Productive wells are those that produce commercial quantities of hydrocarbons, exclusive of their capacity to produce at a reasonable rate of return.
| Inception (April 21, | ||||||||||||||||||
| 2004) through | Years ended December 31, | |||||||||||||||||
| December 31, 2004 | 2005 | 2006 | ||||||||||||||||
| Gross | Net | Gross | Net | Gross | Net | |||||||||||||
| Development wells | ||||||||||||||||||
| Productive | 2.0 | 1.0 | 61.0 | 23.5 | 93.0 | 57.8 | ||||||||||||
| Dry | 2.0 | 1.0 | 3.0 | 1.7 | 7.0 | 2.4 | ||||||||||||
| Exploratory wells | ||||||||||||||||||
| Productive | 3.0 | 1.5 | 8.0 | 2.2 | 37.0 | 25.4 | ||||||||||||
| Dry | 1.0 | 0.7 | 3.0 | 1.4 | 3.0 | 0.8 | ||||||||||||
| Total wells | ||||||||||||||||||
| Productive | 5.0 | 2.5 | 69.0 | 25.7 | 130.0 | 83.2 | ||||||||||||
| Dry | 3.0 | 1.7 | 6.0 | 3.1 | 10.0 | 3.2 | ||||||||||||
| Total | 8.0 | 4.2 | 75.0 | 28.8 | 140.0 | 86.4 | ||||||||||||
As of December 31, 2006, we had 4.0 gross (2.1 net) development wells and 4.0 gross (3.0 net) exploratory wells that were in the process of drilling.
As of December 31, 2006, we operated six rigs on our properties. While we have plans to add additional rigs during 2007, there can be no assurance that additional rigs will be available to us at an attractive cost or at times consistent with our 2007 drilling schedule. See “Risk Factors—Shortages of oil field equipment, services and qualified personnel could reduce our cash flow and adversely affect our results of operations.”
We determined in January 2007 to reduce our drilling activities for the first three months of 2007. This determination was due to a decline in oil and natural gas prices in January 2007 compared to such prices in the fourth quarter of 2006, the costs of goods and services necessary to complete our drilling activities and the resulting effect of these circumstances on our expected cash flow for the three months ended March 31, 2007. This reduction in drilling activities will likely result in a reduction in oil and gas production, revenues and cash provided by operating activities for the year ended December 31, 2007. We resumed our planned drilling activities beginning in April 2007, and we believe we will spend our planned 2007 exploration and development budget of approximately $137 million during 2007.
69
Table of Contents
Our oil and natural gas reserves
The following table sets forth our estimated net proved oil and natural gas reserves,PV-10 and standardized measure of discounted future net cash flows as of December 31, 2006. PV-10 includes the present value of our estimated future abandonment and site restoration costs for proved properties net of the present value of estimated salvage proceeds from each of these properties. Our reserve estimates are based on independent engineering evaluations prepared by Netherland, Sewell & Associates, Inc. and Cawley Gillespie & Associates, Inc. as of December 31, 2006, ($57.75 per Bbl and $5.635 per MMBtu, adjusted for location and quality by field, were used in the computation of future net cash flows).
| Oil (MBbl) | Gas (MMcf) | Total (MMcfe) | PV-10 ($MM) | |||||||||
| Proved developed producing | 21,032 | 101,544 | 227,736 | $ | 619.0 | |||||||
| Proved developed non-producing | 2,411 | 10,879 | 25,345 | 52.1 | ||||||||
| Proved undeveloped | 20,879 | 88,395 | 213,669 | 282.9 | ||||||||
| Total proved | 44,322 | 200,818 | 466,750 | $ | 954.0 | |||||||
Standardized measure of discounted future net cash flows(1) | $710.3 | |||||||||||
| (1) | Standardized measure of discounted future net cash flows is computed by applying year-end prices, costs and a discount factor of 10 percent to net proved reserves, taking into account the effect of future income taxes. |
The following table sets forth our estimated net proved reserves andPV-10 as of December 31, 2006, by region:
| Total | Percent of | ||||||||||||||
| Oil (MBbl) | Gas (MMcf) | (MMcfe) | total | PV-10 ($MM) | |||||||||||
| Permian Basin: | |||||||||||||||
| Southeast New Mexico | 35,084 | 177,005 | 387,509 | 83% | $ | 782.6 | |||||||||
| West Texas | 8,887 | 16,843 | 70,165 | 15% | 154.5 | ||||||||||
| Emerging Plays and Other | 351 | 6,970 | 9,076 | 2% | 16.9 | ||||||||||
| Total | 44,322 | 200,818 | 466,750 | 100% | $ | 954.0 | |||||||||
70
Table of Contents
Our production, prices and expenses
The following table sets forth summary information concerning our production results, average sales prices and production costs for the period from inception (April 21, 2004) through December 31, 2004, and the years ended December 31, 2005 and 2006. The actual historical data in this table excludes for periods prior to February 27, 2006, production from the oil and gas properties we acquired from the Chase Group in connection with the combination transaction. The pro forma data for the year ended December 31, 2006 gives effect to the oil and gas properties we acquired from the Chase Group as if we had acquired such properties on January 1, 2006.
| Inception | Pro forma | |||||||||||
| (April 21, 2004) | for the | |||||||||||
| through | year ended | |||||||||||
| December 31, | Years ended December 31, | December 31, | ||||||||||
| 2004 | 2005 | 2006 | 2006 | |||||||||
Net production volumes: | ||||||||||||
| Oil (MBbl) | 44.7 | 599.0 | 2,294.8 | 2,539.6 | ||||||||
| Natural gas (MMcf) | 290.7 | 3,403.8 | 9,506.8 | 10,497.6 | ||||||||
| Natural gas equivalent (MMcfe) | 559.1 | 6,997.7 | 23,275.4 | 25,735.0 | ||||||||
Average prices: | ||||||||||||
| Oil, without hedges ($/Bbl) | $ | 41.37 | $ | 54.71 | $ | 60.47 | $ | 57.38 | ||||
| Oil, with hedges ($/Bbl) | $ | 41.37 | $ | 52.79 | $ | 57.42 | $ | 54.62 | ||||
| Natural gas, without hedges ($/Mcf) | $ | 6.09 | $ | 6.99 | $ | 6.87 | $ | 7.05 | ||||
| Natural gas, with hedges ($/Mcf) | $ | 6.09 | $ | 6.85 | $ | 7.00 | $ | 7.17 | ||||
| Natural gas equivalent, without hedges ($/Mcfe) | $ | 6.48 | $ | 8.08 | $ | 8.77 | $ | 8.54 | ||||
| Natural gas equivalent, with hedges ($/Mcfe) | $ | 6.48 | $ | 7.85 | $ | 8.52 | $ | 8.31 | ||||
Operating costs and expenses: | ||||||||||||
| Oil and gas production ($/Mcfe) | $ | 0.92 | $ | 1.56 | $ | 0.95 | $ | 0.92 | ||||
| Oil and gas production taxes ($/Mcfe) | $ | 0.42 | $ | 0.53 | $ | 0.68 | $ | 0.68 | ||||
| General and administrative ($/Mcfe) | $ | 5.52 | $ | 1.15 | $ | 0.54 | $ | 0.49 | ||||
| Depreciation and depletion expense ($/Mcfe) | $ | 1.71 | $ | 1.64 | $ | 2.61 | $ | 2.57 | ||||
The following table sets forth information regarding our average daily pro forma production during the year ended December 31, 2006, by geographic region:
| Pro forma average | |||||||||
| daily production— | |||||||||
| for the years ended | |||||||||
| December 31, 2006 | |||||||||
| Bbl | Mcf | Mcfe | |||||||
| Permian Basin | |||||||||
| Southeast New Mexico | 5,465 | 23,950 | 56,740 | ||||||
| West Texas | 1,451 | 3,722 | 12,428 | ||||||
| Emerging Plays and Other | 40 | 1,088 | 1,328 | ||||||
| Total | 6,956 | 28,760 | 70,496 | ||||||
71
Table of Contents
Summary of core operating areas and emerging plays
Permian Basin
The Permian Basin is one of the most prolific oil and gas regions in the United States, with its first commercial discovery in 1923 and cumulative production of 32.5 billion barrels of oil and 105 trillion cubic feet of gas as of December 31, 2006. Current average daily production in the Permian Basin is approximately 10 billion cubic feet equivalent gas per day from approximately 118,000 active producing wells. It underlies an area of Southeast New Mexico and West Texas approximately 250 miles wide and 300 miles long. Commercial accumulations of hydrocarbons occur in multiple stratigraphic horizons, at depths ranging from approximately 1,000 feet to over 25,000 feet. This area is characterized by long life shallow decline reserves.
The Permian Basin is our core operating area, and, as of December 31, 2006, our estimated net proved reserves of 464 Bcfe in this basin accounted for 99% of our total estimated net proved reserves and 99% of ourPV-10. As of December 31, 2006, we owned an interest in 1,880 wells in the Permian Basin, of which we operated 916. Based on our total proved reserves as of December 31, 2006, and our pro forma 2006 production, our reserve to production ratio was 18.3 years. As of December 31, 2006, we identified 1,675 drilling locations, with proved undeveloped reserves attributed to 595 of such locations, and 538 recompletion opportunities, with proved reserves attributed to 221 of such opportunities. During the year ended December 31, 2006, our pro forma average net daily production in the Permian Basin was 69.3 MMcfe per day.
Southeast New Mexico Permian
Our Permian Basin operations in Southeast New Mexico represent our most significant concentration of assets and, as of December 31, 2006, our estimated proved reserves of 387.5 Bcfe in this basin accounted for 83% of our total net proved reserves and 82% of our provedPV-10. As of December 31, 2006, the wells that we operated accounted for 92% of our provedPV-10 in this core area. As of December 31, 2006, we had 1,400 gross producing wells in Southeast New Mexico. During the year ended December 31, 2006, our average pro forma net daily production from this area was approximately 56.8 MMcfe per day, representing 81% of our total pro forma production for that time period. We target two distinct producing areas, which we refer to as the Shelf Properties and the Basinal Properties. The Shelf Properties generally produce from the Yeso (Paddock and Blinebry intervals), San Andres and Grayburg formations, with producing depths generally ranging from 900 feet to 7,500 feet. The Basinal Properties generally produce from the Morrow formation, with producing depths generally ranging from 7,500 feet to 15,000 feet.
Shelf Properties
Our Shelf Properties represented 75% of our totalPV-10 as of December 31, 2006. We acquired most of these properties from the Chase Group upon closing of the combination transaction. As of December 31, 2006, we had 353.5 Bcfe of proved reserves and 1,137 gross producing wells in this area. As of December 31, 2006, on our Shelf Properties, we identified 1,416 drilling locations, with proved undeveloped reserves attributed to 395 of such locations, and 452 recompletion opportunities, with proved reserves attributed to 155 of such opportunities. Average pro forma net daily production from this area for the year ended December 31, 2006, was approximately 49.4 MMcfe per day, and production from this area represents 70% of our
72
Table of Contents
total average daily net pro forma production for the same period. Our properties are primarily located in Eddy and Lea counties, along the Abo-Yeso shelf edge on the northern rim of the Delaware Basin. This east to west trending fairway produces from a succession of stacked pays. The majority of the production in this region is from the Grayburg, San Andres and Yeso (Paddock and Blinebry intervals) formations. During 2006, we accelerated an evaluation, which had begun in late 2005, of the Blinebry interval of the Yeso formation, the top of which is located approximately 400 feet below the base of the Paddock interval of the Yeso formation. In 2006, we drilled 52 wells in the Blinebry interval, all of which have since been completed as producers. At December 31, 2006, the wells in the Blinebry interval which had been drilled and completed and were producing only from the Blinebry interval were producing an average of 80 Bbl and 176 Mcf per well per day. In 2007, we intend to drill 83 wells on our Shelf Properties, 69 of which will further evaluate the aerial extent of the Blinebry interval. The Empire/Empire East and Loco Hills fields collectively comprised 61% of our Southeast New MexicoPV-10 as of December 31, 2006.
Empire/Empire East. Producing intervals within this field include the Yates, Seven Rivers, Yeso (Paddock and Blinebry intervals) and Abo formations. As of December 31, 2006, we had 133 Bcfe of proved reserves and 343 wells producing in the area. In addition, as of December 31, 2006, we identified 444 drilling locations, with proved undeveloped reserves attributed to 127 of such locations, and 160 recompletion opportunities, with proved reserves attributed to 62 of such opportunities. As of December 31, 2006, proved reserves attributable to the Empire/Empire East field had aPV-10 of $297 million, which represented approximately 38% of the totalPV-10 attributable to our entire Southeast New Mexico properties. Average pro forma net daily production from this field for the year ended December 31, 2006 was approximately 10.0 MMcfe.
Loco Hills. We are currently producing from the Seven Rivers, Queen, Grayburg, San Andres and Yeso (Paddock and Blinebry intervals) formations. We currently have 148 wells producing in this field. In addition, as of December 31, 2006, we identified 236 drilling locations, with proved undeveloped reserves attributed to 65 of such locations, and 144 recompletion opportunities, with proved reserves attributed to 46 of such opportunities. As of December 31, 2006, reserves attributable to the Loco Hills field had aPV-10 of $176 million, which represented approximately 23% of the totalPV-10 attributable to our Southeast New Mexico properties. Average pro forma net daily production from this field for the year ended December 31, 2006 was approximately 7.6 MMcfe.
Basinal Properties
Our Basinal Properties in Southeast New Mexico represent approximately 7% of our totalPV-10 as of December 31, 2006. As of December 31, 2006, we had 34 Bcfe of proved reserves and 259 gross wells producing in this area. As of December 31, 2006, on our Basinal Properties, we identified 89 drilling locations, with proved undeveloped reserves attributed to 60 of such locations, and 37 recompletion opportunities, with proved reserves attributed to 32 of such opportunities. Average pro forma net daily production from this area for the year ended December 31, 2006, was approximately 7.4 MMcfe per day, and production from this area represents 11% of our total average daily net pro forma production for the same period. The majority of the production in this region is from the Morrow formation, with significant additional contributions from the shallower Atoka and Strawn formations. In 2007, we intend to drill or participate in five wells to the Morrow formation and drilled 10 such wells in 2006, with seven wells producing, two wells awaiting completion and one dry hole.
73
Table of Contents
Texas Permian
This core area accounted for approximately 15% of our total proved reserves and approximately 16% of our totalPV-10 as of December 31, 2006. As of December 31, 2006, we had 70 Bcfe of proved reserves and 480 gross wells producing in this area. In addition, as of December 31, 2006, we identified 148 drilling locations, with proved undeveloped reserves attributed to 127 of such locations, and 49 recompletion opportunities, with proved reserves attributed to 34 of such opportunities. In 2007, we intend to drill 20 wells in this area. As of December 31, 2006, approximately 52% of the totalPV-10 attributable to our Texas Permian core area was concentrated in the area’s three most significant fields. Two of the top three fields (Fullerton and Deep Rock) are located on the Central Basin Platform, while the third (Coyanosa) is located just off the western edge of the platform.
Fullerton. Our interests in this field consist of 28 wells producing from the Clearfork formation. In addition, as of December 31, 2006, we identified 30 drilling locations, with proved reserves attributed to 24 of such locations. ThePV-10 of our proved reserves in this field as of December 31, 2006, was $39 million. This field represents approximately 25% of the totalPV-10 attributable to our Texas Permian core area and contained 16.8 Bcfe of proved reserves as of December 31, 2006. Average net daily production for the year ended December 31, 2006 was approximately 2.6 MMcfe.
Deep Rock. Our interests in this field consist of 31 wells producing from multiple intervals, including the Ellenberger, Devonian, Pennsylvanian, Wolfcamp and Glorieta formations, at depths ranging from 3,500 feet to 10,000 feet. In addition, as of December 31, 2006, we identified 14 drilling locations, with proved undeveloped reserves attributable to 11 of such locations, and one recompletion opportunity. ThePV-10 of our proved reserves in this field as of December 31, 2006, was $29 million. This field represents approximately 19% of the totalPV-10 attributable to our Texas Permian core area and contains 13.9 Bcfe of proved reserves as of December 31, 2006. Average net daily production for the year ended December 31, 2006 was approximately 1.6 MMcfe.
Coyanosa. Our interests in this field consist of 51 wells producing from multiple intervals, including the Ellenberger, Wolfcamp or Delaware formations, at depths ranging from 3,500 feet to 18,000 feet. In addition, as of December 31, 2006, we identified two drilling locations, with proved reserves attributed to one of such locations, and 25 recompletion opportunities, with proved reserves attributed to 19 of such opportunities. ThePV-10 of our proved reserves in this field as of December 31, 2006, was $12 million. This field represents approximately 8% of the totalPV-10 attributable to our Texas Permian core area and contains 4.9 Bcfe of proved reserves as of December 31, 2006. Average net daily production for the year ended December 31, 2006 was approximately 1.8 MMcfe.
Emerging Resource Play Areas
As of December 31, 2006, we were involved in six significant unconventional emerging resource plays, with a total acreage position of 218,077 gross (114,139 net) acres. These plays are currently in various stages of maturity. As of December 31, 2006, we had an aggregate of 6.0 Bcfe of proved reserves attributed to these plays.
Southeast New Mexico
A horizontal Wolfcamp play is being actively exploited along the northwestern rim of the Delaware Basin, in Eddy and Chaves Counties, New Mexico, with several operators flowing gas
74
Table of Contents
to sales. This Wolfcamp horizon is found at depths ranging from 4,100 feet to 6,000 feet. We have tested one re-entry, and have participated with Mack Energy Corporation in the drilling of five horizontal exploration wells. As of December 31, 2006, we owned 41,217 gross (10,778 net) acres, of which we acquired 24,579 gross (6,138 net) acres in the play from Caza Energy, LLC, a Chase Oil affiliate, subsequent to the combination transaction.
In addition, during the fourth quarter of 2006, we drilled one horizontal test well in the oil window of the Wolfcamp horizon and completed such well as a producer in mid-February 2007. Through March 31, 2007, this well averaged approximately 1.7 MMcfe per day, and as of December 31, 2006, we had identified 7,510 gross (6,632 net) acres associated with this play.
As of December 31, 2006, we had 5.9 Bcfe of proved reserves booked to the horizontal Wolfcamp play in Eddy and Chaves Counties, New Mexico.
Central Basin Platform
In November 2006, we acquired 9,548 gross (9,548 net) acres in the Woodford Shale play in Andrews County, Texas. This unconventional shale is prospective at depths from 8,000 to 10,000 feet. We currently plan to drill our first test well in 2007.
Western Delaware Basin
This play is located in West Texas in a lightly explored portion of the Delaware Basin. As of December 31, 2006, we owned 70,142 gross (22,942 net) acres in Culberson and Reeves Counties, Texas. Both conventional and unconventional targets are prospective in this area. We have drilled and are in different stages of completing four exploratory wells. The primary unconventional targets are the Bone Spring, Atoka, Barnett and Woodford Shales, which are found at depths ranging from 5,000 feet to 12,000 feet.
Val Verde Basin
As of December 31, 2006, we owned 39,999 gross (39,609 net) acres in this play located in Edwards and Kinney Counties, Texas, where the primary unconventional targets are the fractured Ellenburger Dolomite and the Canyon Sands at depths of less than 8,000 feet. We currently plan to conduct a3-D seismic survey of this play in the second quarter of 2007 and to drill our first test well in the fourth quarter of 2007.
North Dakota
This horizontal Bakken Shale play is being developed in the North Dakota portion of the Williston Basin. This Mississippian age horizon consists of a siltstone encased within a highly organic oil-rich shale package and is found at depths ranging from 9,000 feet to 11,000 feet. We have completed two wells as producers. As of December 31, 2006, we owned 40,149 gross (16,810 net) acres in this play in Mountrail and McKenzie Counties, North Dakota. As of December 31, 2006, we had 0.1 Bcfe of proved reserves booked to this play.
Arkansas
As of December 31, 2006, we owned 17,022 gross (14,452 net) acres in the Fayetteville Shale play in Faulkner and White Counties, Arkansas. The Fayetteville Shale play in the eastern Arkoma
75
Table of Contents
Basin of Arkansas is the geological time equivalent to the Barnett Shale, a proved target in the Ft. Worth Basin. The Fayetteville Shale has producers in both vertical and horizontal wells, and on our acreage position the Fayetteville Shale is found at depths ranging from 7,000 feet to 8,500 feet.
Marketing arrangements
General. We market our crude oil and natural gas in accordance with standard energy practices utilizing certain of our employees and external consultants, in each case in consultation with our chief financial officer and our production engineers. The marketing effort is coordinated with the operations group as it relates to the planning and preparation of future drilling programs so that available markets can be assessed and secured. This planning also involves the coordination of procuring the physical facilities necessary to connect new producing wells as efficiently as possible upon their completion. When possible, we negotiate with our purchasers on multiple well drilling programs in an attempt to improve our economics on such wells due to the commitment of potentially increased production volumes. Our current drilling plans consist substantially of multiple well programs.
Crude Oil. We do not refine or process the crude oil we produce. The majority of our crude oil is transported by truck to various pipeline stations throughout Southeast New Mexico and West Texas. The oil is then delivered either to hub facilities located in Midland, Texas or Cushing, Oklahoma or to third party refineries located in Southeast New Mexico and the panhandle of Texas, with the majority of our crude oil going to a refinery in Southeast New Mexico. The remaining oil that we produce is connected directly to pipelines via gathering facilities in the respective field locations. This oil is also transported to the hub facilities and refineries mentioned above. We sell the majority of the oil we produce under short-term contracts using market sensitive pricing. Approximately 36% of our oil and natural gas revenues for the year ended December 31, 2006, are attributable to a verbal agreement with a purchaser, an arrangement pursuant to which production attributable to the subject properties, which we acquired in the combination transaction, have been marketed for several years. The majority of our contracts are based on a Platt’s formula which is calculated based on an intermediate posting deemed 40 degrees (typically as published by major crude oil purchasers at the Cushing, Oklahoma delivery point) for each calendar month plus the average of the Platt’s P-Plus WTI price as published monthly in the Platt’s Oilgram Price Report. This price is then adjusted for differentials based upon delivery location and oil quality. We also sell a portion of our oil at prices posted by the principal purchaser of oil where our producing properties are located.
Natural Gas. When assessing the market for our natural gas we must first determine the type of gas connection needed based upon the type of gas expected to be produced. We also consider any gas gathering and delivery infrastructure in the areas of our production and evaluate market options to obtain the best price reasonably available under the circumstances. We sell the majority of our gas under individually negotiated gas purchase contracts using market sensitive pricing. The majority of our gas contracts are term agreements that extend at least three years from the date of the subject contract.
The majority of the gas we sell is casinghead gas which is sold at the wellhead under a percentage of proceeds processing contract. The purchaser gathers our casinghead gas in the field where produced and transports it via pipeline to a gas processing plant where the liquid products are extracted. The remaining gas product is residue gas, or dry gas. Under our
76
Table of Contents
percentage of proceeds contract, we receive the value for the extracted liquids and the residue gas. Each of the liquid products has its own individual market and is therefore priced separately.
The remaining portion of our gas is dry gas which is gathered at the wellhead and delivered into the purchaser’s residue or mainline transportation system. In many cases, the gas gathering and transportation is performed by a third party gathering company which transports the production from the production location to the purchaser’s mainline. The majority of our dry gas and residue gas sales contracts are term agreements that extend at least three years from the date of the subject contract.
Our principal customers
We sell our oil and natural gas production principally to marketers and other purchasers that have access to nearby pipeline facilities. In areas where there is no practical access to pipelines, oil is transported to storage facilities by trucks owned or otherwise arranged by the marketers or purchasers. Our marketing of oil and natural gas can be affected by factors beyond our control, the effects of which cannot be accurately predicted. For a description of some of these factors, see “Risk factors—Market conditions or operational impediments may hinder our access to oil and natural gas markets or delay our production.”
On a pro forma basis, for the year ended December 31, 2006, oil and natural gas sales to Navajo Refining Company, L.P. and DCP Midstream, LP, formerly Duke Energy Field Services, accounted for approximately 53% and 18%, respectively, of our total oil and gas sales. While the loss of either of these purchasers may result in a temporary interruption in sales of, or a lower price for, our production, we believe that the loss of either of these purchasers would not have a material adverse effect on our operations, as there are a number of alternative purchasers in our producing regions.
Competition
The oil and natural gas industry is highly competitive. We encounter strong competition from other independent producers and major oil companies in acquiring properties, contracting for drilling equipment and securing trained personnel. Many of these competitors have financial and technical resources and staffs substantially larger than ours. As a result, our competitors may be able to pay more for desirable leases, or to evaluate, bid for and purchase a greater number of properties or prospects than our financial or personnel resources will permit.
We are also affected by competition for drilling rigs and the availability of related equipment. The oil and natural gas industry is currently experiencing shortages of drilling and workover rigs, equipment, pipe, materials and personnel, which has delayed developmental drilling and exploitation activities and caused significant price increases. The shortage of personnel has also made it difficult to attract and retain personnel with experience in the oil and gas industry and has caused us to increase our general and administrative budget. We are unable to predict when, or if, such shortages may be alleviated.
Competition is also strong for attractive oil and natural gas producing properties, undeveloped leases and drilling rights, and we cannot assure you that we will be able to compete satisfactorily. Although we regularly evaluate acquisition opportunities and submit bids as part of our growth strategy, we do not have any current agreements, understandings or arrangements with respect to any material acquisition.
77
Table of Contents
Applicable laws and regulations
Regulation of the oil and natural gas industry
Regulation of transportation of oil. Sales of crude oil, condensate and natural gas liquids are not currently regulated and are made at negotiated prices. Nevertheless, Congress could reenact price controls in the future.
Our sales of crude oil are affected by the availability, terms and cost of transportation. The transportation of oil in common carrier pipelines is also subject to rate regulation. The Federal Energy Regulatory Commission, or the “FERC,” regulates interstate oil pipeline transportation rates under the Interstate Commerce Act. In general, interstate oil pipeline rates must be cost-based, although settlement rates agreed to by all shippers are permitted and market-based rates may be permitted in certain circumstances. Effective January 1, 1995, the FERC implemented regulations establishing an indexing system (based on inflation) for transportation rates for oil that allowed for an increase or decrease in the cost of transporting oil to the purchaser. A review of these regulations by the FERC in 2000 was successfully challenged on appeal by an association of oil pipelines. On remand, the FERC in February 2003 increased the index slightly, effective July 2001. Intrastate oil pipeline transportation rates are subject to regulation by state regulatory commissions. The basis for intrastate oil pipeline regulation, and the degree of regulatory oversight and scrutiny given to intrastate oil pipeline rates, varies from state to state. Insofar as effective interstate and intrastate rates are equally applicable to all comparable shippers, we believe that the regulation of oil transportation rates will not affect our operations in any way that is of material difference from those of our competitors.
Further, interstate and intrastate common carrier oil pipelines must provide service on a non-discriminatory basis. Under this open access standard, common carriers must offer service to all similarly situated shippers requesting service on the same terms and under the same rates. When oil pipelines operate at full capacity, access is governed by prorationing provisions set forth in the pipelines’ published tariffs. Accordingly, we believe that access to oil pipeline transportation services generally will be available to us to the same extent as to our competitors.
Regulation of transportation and sale of natural gas. Historically, the transportation and sale for resale of natural gas in interstate commerce have been regulated pursuant to the Natural Gas Act of 1938, the Natural Gas Policy Act of 1978 and regulations issued under those Acts by the FERC. In the past, the federal government has regulated the prices at which natural gas could be sold. While sales by producers of natural gas can currently be made at uncontrolled market prices, Congress could reenact price controls in the future. Deregulation of wellhead natural gas sales began with the enactment of the Natural Gas Policy Act. In 1989, Congress enacted the Natural Gas Wellhead Decontrol Act which removed all Natural Gas Act and Natural Gas Policy Act price and non-price controls affecting wellhead sales of natural gas effective January 1, 1993.
The FERC regulates interstate natural gas transportation rates and service conditions, which affects the marketing of natural gas that we produce, as well as the revenues we receive for sales of our natural gas. Since 1985, the FERC has endeavored to make natural gas transportation more accessible to natural gas buyers and sellers on an open and non-discriminatory basis. The FERC has stated that open access policies are necessary to improve the competitive structure of the interstate natural gas pipeline industry and to create a regulatory framework that will put natural gas sellers into more direct contractual relations with natural gas buyers by, among other things, unbundling the sale of natural gas from the sale of transportation and storage
78
Table of Contents
services. Beginning in 1992, the FERC issued Order No. 636 and a series of related orders to implement its open access policies. As a result of the Order No. 636 program, the marketing and pricing of natural gas have been significantly altered. The interstate pipelines’ traditional role as wholesalers of natural gas has been eliminated and replaced by a structure under which pipelines provide transportation and storage service on an open access basis to others who buy and sell natural gas. Although the FERC’s orders do not directly regulate natural gas producers, they are intended to foster increased competition within all phases of the natural gas industry.
In 2000, the FERC issued Order No. 637 and subsequent orders, which imposed a number of additional reforms designed to enhance competition in natural gas markets. Among other things, Order No. 637 effected changes in FERC regulations relating to scheduling procedures, capacity segmentation, penalties, rights of first refusal and information reporting. Most pipelines’ tariff filings to implement the requirements of Order No. 637 have been accepted by the FERC and placed into effect.
We cannot accurately predict whether the FERC’s actions will achieve the goal of increasing competition in markets in which our natural gas is sold. Additional proposals and proceedings that might affect the natural gas industry are pending before the FERC and the courts. The natural gas industry historically has been very heavily regulated. Therefore, we cannot provide any assurance that the less stringent regulatory approach recently established by the FERC will continue. However, we do not believe that any action taken will affect us in a way that materially differs from the way it affects other natural gas producers.
Gathering service, which occurs upstream of jurisdictional transmission services, is regulated by the states onshore and in state waters. Although its policy is still in flux, the FERC has reclassified certain jurisdictional transmission facilities as non-jurisdictional gathering facilities, which has the tendency to increase our costs of getting gas to point of sale locations.
Intrastate natural gas transportation is also subject to regulation by state regulatory agencies. The basis for intrastate regulation of natural gas transportation and the degree of regulatory oversight and scrutiny given to intrastate natural gas pipeline rates and services varies from state to state. Insofar as such regulation within a particular state will generally affect all intrastate natural gas shippers within the state on a comparable basis, we believe that the regulation of similarly situated intrastate natural gas transportation in any states in which we operate and ship natural gas on an intrastate basis will not affect our operations in any way that is of material difference from those of our competitors. Like the regulation of interstate transportation rates, the regulation of intrastate transportation rates affects the marketing of natural gas that we produce, as well as the revenues we receive for sales of our natural gas.
Regulation of Production. The production of oil and natural gas is subject to regulation under a wide range of local, state and federal statutes, rules, orders and regulations. Federal, state and local statutes and regulations require permits for drilling operations, drilling bonds and reports concerning operations. All of the states in which we own and operate properties have regulations governing conservation matters, including provisions for the unitization or pooling of oil and natural gas properties, the establishment of maximum allowable rates of production from oil and natural gas wells, the regulation of well spacing, and the plugging and abandonment of wells. The effect of these regulations is to limit the amount of oil and natural gas that we can produce from our wells and to limit the number of wells or the locations at which we can drill, although we can apply for exceptions to such regulations or to have reductions in well spacing. Moreover, each state generally imposes a production or severance tax with respect to the production and sale of oil, natural gas and natural gas liquids within its jurisdiction. The
79
Table of Contents
failure to comply with these rules and regulations can result in substantial penalties. Our competitors in the oil and natural gas industry are subject to the same regulatory requirements and restrictions that affect our operations.
Environmental, health and safety matters
General. Our operations are subject to stringent and complex federal, state and local laws and regulations governing environmental protection as well as the discharge of materials into the environment. These laws and regulations may, among other things:
| • | require the acquisition of various permits before drilling commences; | |
| • | restrict the types, quantities and concentration of various substances that can be released into the environment in connection with oil and natural gas drilling and production, and saltwater disposal activities; | |
| • | limit or prohibit drilling activities on certain lands lying within wilderness, wetlands and other protected areas; and | |
| • | require remedial measures to mitigate pollution from former and ongoing operations, such as requirements to close pits and plug abandoned wells. |
These laws, rules and regulations may also restrict the rate of oil and natural gas production below the rate that would otherwise be possible. The regulatory burden on the oil and gas industry increases the cost of doing business in the industry and consequently affects profitability. Additionally, Congress and federal and state agencies frequently revise environmental laws and regulations, and any changes that result in more stringent and costly waste handling, disposal and cleanup requirements for the oil and gas industry could have a significant impact on our operating costs.
The following is a summary of some of the existing laws, rules and regulations to which our business operations are subject.
Waste Handling. The Resource Conservation and Recovery Act, or “RCRA”, and comparable state statutes, regulate the generation, transportation, treatment, storage, disposal and cleanup of hazardous and non-hazardous wastes. Under the auspices of the federal Environmental Protection Agency, or “EPA”, the individual states administer some or all of the provisions of RCRA, sometimes in conjunction with their own, more stringent requirements. Drilling fluids, produced waters, and most of the other wastes associated with the exploration, development, and production of crude oil or natural gas are currently regulated under RCRA’s non-hazardous waste provisions. However, it is possible that certain oil and natural gas exploration and production wastes now classified as non-hazardous could be classified as hazardous wastes in the future. Any such change could result in an increase in our costs to manage and dispose of wastes, which could have a material adverse effect on our results of operations and financial position.
Comprehensive Environmental Response, Compensation and Liability Act. The Comprehensive Environmental Response, Compensation and Liability Act, or “CERCLA”, also known as the Superfund law, imposes joint and several liability, without regard to fault or legality of conduct, on classes of persons who are considered to be responsible for the release of a hazardous substance into the environment. These persons include the owner or operator of the site where the release occurred, and anyone who disposed or arranged for the disposal of a hazardous
80
Table of Contents
substance released at the site. Under CERCLA, such persons may be subject to joint and several liability for the costs of cleaning up the hazardous substances that have been released into the environment, for damages to natural resources and for the costs of certain health studies. In addition, it is not uncommon for neighboring landowners and other third-parties to file claims for personal injury and property damage allegedly caused by the hazardous substances released into the environment.
We currently own, lease, or operate numerous properties that have been used for oil and natural gas exploitation and production for many years. Although we believe that we have utilized operating and waste disposal practices that were standard in the industry at the time, hazardous substances, wastes, or hydrocarbons may have been released on or under the properties owned or leased by us, or on or under other locations, including off-site locations, where such substances have been taken for disposal. In addition, some of our properties have been operated by third parties or by previous owners or operators whose treatment and disposal of hazardous substances, wastes, or hydrocarbons was not under our control. These properties and the substances disposed or released on them may be subject to CERCLA, RCRA, and analogous state laws. Under such laws, we could be required to remove previously disposed substances and wastes, remediate contaminated property, or perform remedial plugging or pit closure operations to prevent future contamination.
Water Discharges. The Federal Water Pollution Control Act, or the “Clean Water Act”, and analogous state laws, impose restrictions and strict controls with respect to the discharge of pollutants, including spills and leaks of oil and other substances, into waters of the United States. The discharge of pollutants into regulated waters is prohibited, except in accordance with the terms of a permit issued by the EPA or an analogous state agency. Federal and state regulatory agencies can impose administrative, civil and criminal penalties for non-compliance with discharge permits or other requirements of the Clean Water Act and analogous state laws and regulations.
Air Emissions. The Federal Clean Air Act, and comparable state laws, regulate emissions of various air pollutants through air emissions permitting programs and the imposition of other requirements. In addition, the EPA has developed, and continues to develop, stringent regulations governing emissions of toxic air pollutants at specified sources. Federal and state regulatory agencies can impose administrative, civil and criminal penalties for non-compliance with air permits or other requirements of the federal Clean Air Act and associated state laws and regulations.
Recent scientific studies have suggested that emissions of certain gases, commonly referred to as “greenhouse gases” and including carbon dioxide and methane, may be contributing to warming of the Earth’s atmosphere. In response to such studies, the U.S. Congress is actively considering legislation to reduce emissions of greenhouse gases. In addition, several states have declined to wait on Congress to develop and implement climate control legislation and have already taken legal measures to reduce emissions of greenhouse gases. For instance, at least nine states in the Northeast (Connecticut, Delaware, Maine, Maryland, Massachusetts, New Hampshire, New Jersey, New York and Vermont) and five states in the West (Arizona, California, New Mexico, Oregon and Washington) have passed laws, adopted regulations or undertaken regulatory initiatives to reduce the emission of greenhouse gases, primarily through the planned development of greenhouse gas emission inventories and/or regional greenhouse gas cap and trade programs. Also, as a result of the U.S. Supreme Court’s decision on April 2, 2007 inMassachusetts, et al. v. EPA, the EPA may be required to regulate greenhouse gas emissions from
81
Table of Contents
mobile sources (e.g., cars and trucks) even if Congress does not adopt new legislation specifically addressing emissions of greenhouse gases. Other nations have already agreed to regulate emissions of greenhouse gases pursuant to the United Nations Framework Convention on Climate Change, also known as the “Kyoto Protocol,” an international treaty pursuant to which participating countries (not including the United States) have agreed to reduce their emissions of greenhouse gases to below 1990 levels by 2012. Passage of climate control legislation or other regulatory initiatives by Congress or various states of the U.S., or the adoption of regulations by the EPA and analogous state agencies that restrict emissions of greenhouse gases in areas in which we conduct business could have an adverse affect on our operations and demand for our products.
National Environmental Policy Act. Oil and natural gas exploration and production activities on federal lands are subject to the National Environmental Policy Act, or “NEPA”. NEPA requires federal agencies, including the Department of Interior, to evaluate major agency actions having the potential to significantly impact the environment. In the course of such evaluations, an agency will prepare an environmental assessment that assesses the potential direct, indirect and cumulative impacts of a proposed project and, if necessary, will prepare a more detailed environmental impact statement that may be made available for public review and comment. All of our current exploration and production activities, as well as proposed exploration and development plans, on federal lands require governmental permits that are subject to the requirements of NEPA. This process has the potential to delay the development of oil and natural gas projects.
OSHA and Other Laws and Regulation. We are subject to the requirements of the federal Occupational Safety and Health Act, or “OSHA”, and comparable state statutes. The OSHA hazard communication standard, the EPA communityright-to-know regulations under the Title III of CERCLA and similar state statutes require that we organizeand/or disclose information about hazardous materials used or produced in our operations. We believe that we are in substantial compliance with these applicable requirements and with other OSHA and comparable requirements.
We believe that we are in substantial compliance with all existing environmental laws and regulations applicable to our current operations and that our continued compliance with existing requirements will not have a material adverse impact on our financial condition and results of operations. For instance, we did not incur any material capital expenditures for remediation or pollution control activities for the year ended December 31, 2006. Additionally, as of the date of this prospectus, we are not aware of any environmental issues or claims that will require material capital expenditures during 2007. However, we cannot assure you that the passage of more stringent laws or regulations in the future will not have an negative impact on our financial position or results of operation. For instance, the New Mexico Oil Conservation Division is considering amending or replacing an existing rule regulating the permitting, construction, operation and closure of oilfield pits at well sites in New Mexico. If the agency adopts a new or revised pit rule that imposes stricter requirements on the construction and use of oilfield pits, then it is possible that the cost to operate our wells in New Mexico could increase.
Grayburg-Jackson West Cooperative Unit Regulatory Matter
From 1984 through 1997, the owners of the Grayburg-Jackson West Cooperative Unit (which is referred to herein as the “GJ Unit”), a group of formations and intervals unitized by state
82
Table of Contents
regulatory authorities, compromised of approximately 2,400 acres in Eddy County, New Mexico and which comprises a portion of the Chase Group Properties, drilled or deepened approximately 70 wells that produced from zones below a depth approved as the unitized formation. The owners of the working interests in the GJ Unit possessed the ownership rights entitling them to produce hydrocarbons from the subject producing intervals below the unitized formation, but had not obtained the necessary regulatory approval (1) as to certain wells, to drill or deepen below the base of the unitized formation or (2) to produce hydrocarbons from intervals below the base of the unitized formation and to commingle such production with production from the unitized formation. In connection with the failure to obtain the required regulatory approval to produce on a commingled basis from these deeper intervals, the operators filed incorrect perforation and completion reports with state regulatory authorities, and filed monthly production reports that did not disclose that hydrocarbons had been produced from intervals below the unitized formation and that hydrocarbons produced from these deeper intervals were improperly commingled with production from the unitized formation (although the reports apparently reflected the actual volumes produced by the wells). As a result, a unit royalty interest owner in the unitized formation was overpaid and the State of New Mexico, which was the owner of the royalty interest in the subject producing intervals below the unitized formation, was underpaid for several years.
On November 15, 2005, Mack Energy Corporation filed an application with the New Mexico Oil Conservation Division (which is referred to herein as the “NMOCD”) to expand the vertical limit of the unitized formation to include the deeper intervals that had been accessed, produced and commingled without obtaining regulatory approval. A hearing on the application was originally scheduled for December 15, 2005, but was continued at the request of Mack Energy. On February 27, 2006, the combination transaction occurred and, as a result, we acquired the GJ Unit.
On April 13, 2006, the NMOCD held a hearing on Mack Energy’s application to expand the vertical limit of the unitized formation. Representatives of Mack Energy, acting under our Contract Operator Agreement with Mack Energy, participated in the hearing and presented testimony during that hearing that intervals below the unitized formation had not been tested or developed. Based on the application submitted by Mack Energy and the evidence and testimony presented at the hearing, on June 13, 2006, the NMOCD approved the application and entered its order expanding the vertical limit of the unitized formation to include certain deeper intervals, including one of those that had previously been produced and commingled without regulatory approval.
Over the course of developing our drilling program for the Chase Group Properties in July and August 2006, we discovered the existence of these violations and this testimony. Following further investigation by our employees and discussions with a representative of Chase Oil and Mack Energy and our counsel, we reported these developments to our board of directors. Because this matter related to ongoing regulatory violations by entities that were under the control of certain members of our board of directors, our board of directors determined on September 6, 2006, to form a special committee of the board of directors that consisted of independent and disinterested non-management directors for the purpose of investigating the matters identified by our management relating to the GJ Unit. The special committee engaged separate legal counsel to assist it with its investigation of this matter. Also, in September 2006, representatives of Mack Energy and our company met with relevant regulatory authorities from the State of New Mexico, and voluntarily self-reported the matters related to the GJ Unit, and we filed amended reports to correct prior reporting inaccuracies.
83
Table of Contents
As a result of these actions, we, along with Mack Energy, entered into a settlement agreement with the New Mexico State Land Office on November 2, 2006 related to the underpayment of royalties arising from these circumstances. Under the terms of the settlement agreement, Mack Energy paid $615,444 to the State of New Mexico for underpayment of royalties and interest thereon. We were not required to make any payments under the settlement agreement. Further, on January 22, 2007, the State of New Mexico advised us that there was no basis for a compliance and enforcement proceeding against our company and no evidence of a knowing and willful violation of applicable law by our company. On January 19, 2007, Mack Energy entered into an Agreed Compliance Order and agreed to pay a penalty of $250,000 for its violations of applicable rules, regulations and statutes. Finally, the NMOCD approved our correction of the prior records related to the GJ Unit and, in February 2007, approved our application to expand the vertical limit of the unitized formation below the depth of the intervals that had previously been improperly produced and commingled with production from the unitized formation and to bring all of the wells in the GJ Unit into compliance with all applicable rules, regulations and statutes.
The special committee of the board of directors examined relevant documents provided by our company and our regulatory counsel in New Mexico, conducted interviews of members of management and heard a presentation from a representative of Chase Oil and Mack Energy. The special committee also monitored the activities of our company and our legal counsel during the discussions and proceedings with relevant New Mexico regulatory authorities. Based on its review of this matter, the special committee recommended the adoption of certain policies and procedures governing the operation of all legal proceedings involving our company as well as a review of the due diligence processes associated with future acquisitions of properties. The special committee also recommended certain actions to address corporate governance matters at our company. Finally, the special committee reviewed the conduct of our officers and directors to determine whether any such conduct would indicate that an officer or director was unsuitable to continue in their position, and the special committee did not determine that any officer or director was unsuitable to continue in their position with our company.
Legal proceedings
We are not a party to any material pending legal proceedings, other than ordinary course proceedings incidental to our business. While the ultimate outcome and impact of any proceeding cannot be predicted with certainty, our management does not believe that the resolution of any of these matters will have a material adverse effect on our financial condition or result of operations.
Title to our properties
As is customary in the oil and gas industry, we initially conduct only a cursory review of the title to our properties on which we do not have proved reserves. Prior to the commencement of drilling operations on those properties, we conduct a thorough title examination and perform curative work with respect to significant defects. To the extent title opinions or other investigations reflect defects affecting those properties, we are typically responsible for curing any such defects at our expense. We generally will not commence drilling operations on a property until we have cured any material title defects on such property. We have reviewed the title to substantially all of our producing properties and believe that we have satisfactory title to our
84
Table of Contents
producing properties in accordance with standards generally accepted in the oil and gas industry. Prior to completing an acquisition of producing oil and natural gas leases, we perform title reviews on the most significant leases and, depending on the materiality of properties, we may obtain a title opinion or review previously obtained title opinions. Our oil and natural gas properties are subject to customary royalty and other interests, liens to secure borrowings under our bank credit facilities, liens for current taxes and other burdens which we believe do not materially interfere with the use or affect our carrying value of the properties.
Our employees
As of December 31, 2006, we employed 80 employees, including 19 employed in drilling and production, 15 in financial and accounting, 16 in land, 14 in exploration, 6 in reservoir engineering and 10 in administration. Of these, 73 worked in our Midland, Texas headquarters and 7 were in our field operations. Our future success will depend partially on our ability to attract, retain and motivate qualified personnel. We are not a party to any collective bargaining agreements and have not experienced any strikes or work stoppages. We consider our relations with our employees to be satisfactory. From time to time we utilize the services of independent contractors to perform various field and other services.
85
Table of Contents
Management
Executive officers and directors
The following table sets forth names, ages and titles of our executive officers and directors as of April 23, 2007:
| Name | Age | Title | |||
| Timothy A. Leach | 47 | Chairman of the Board, Chief Executive Officer and Director | |||
| Steven L. Beal | 48 | President, Chief Operating Officer and Director | |||
| David W. Copeland | 50 | Vice President, General Counsel and Secretary | |||
| Curt F. Kamradt | 44 | Vice President, Chief Financial Officer and Treasurer | |||
| David M. Thomas III | 52 | Vice President—Exploration and Land | |||
| E. Joseph Wright | 47 | Vice President—Engineering and Operations | |||
| Tucker S. Bridwell | 55 | Director | |||
| W. Howard Keenan, Jr. | 56 | Director | |||
| A. Wellford Tabor | 38 | Director | |||
Timothy A. Leachhas been the Chairman of the Board of Directors and Chief Executive Officer of our company since its formation in February 2006. Mr. Leach has been the Chairman of the Board and Chief Executive Officer of Concho Equity Holdings Corp. since its inception in April 2004. Mr. Leach was Chairman of the Board and Chief Executive Officer of Concho Oil & Gas Corp. from its inception in January 2001 until its sale in January 2004. From January 2004 to April 2004, Mr. Leach was involved in private investments. Mr. Leach was Chairman of the Board of Directors and Chief Executive Officer of Concho Resources Inc. (which was a different company than our company) from its inception in August 1997 until its sale in June 2001. From September 1989 until May 1997, Mr. Leach was employed by Parker & Parsley Petroleum Company (now Pioneer Natural Resources Company) in a variety of capacities, including serving as Executive Vice President and as a member of Parker & Parsley’s Executive Committee. He is a graduate of Texas A&M University with a Bachelor of Science degree in Petroleum Engineering.
Steven L. Bealhas been a Director and the President and Chief Operating Officer of our company since its formation in February 2006. Mr. Beal has been a director and the President and Chief Operating Officer of Concho Equity Holdings Corp. since its inception in April 2004. Mr. Beal was a director and the Executive Vice President and Chief Financial Officer of Concho Oil & Gas Corp. from its inception in January 2001 until he became its President and Chief Operating Officer in August 2002, a position he held until its sale in January 2004. From January 2004 to April 2004, Mr. Beal was involved in private investments. Mr. Beal was a director and the Vice President and Chief Financial Officer of Concho Resources Inc. (which was a different company than our company) from its inception in August 1997 until its sale in June 2001. From October 1988 until May 1997, Mr. Beal was employed by Parker & Parsley Petroleum Company (now Pioneer Natural Resources Company) in a variety of capacities, including serving as its Senior Vice President and Chief Financial Officer and as a member of Parker & Parsley’s Executive Committee. From 1981 until February 1988, Mr. Beal was employed by the accounting firm of Price Waterhouse. He is a graduate of the University of Texas with a Bachelor of Business Administration degree in Accounting and is a certified public accountant.
86
Table of Contents
David W. Copelandhas been Vice President—General Counsel and corporate Secretary of our company since its formation in February 2006. Mr. Copeland has been the Vice President—General Counsel and corporate Secretary of Concho Equity Holdings Corp. since its inception in April 2004. Mr. Copeland was a director and the Executive Vice President—General Counsel and corporate Secretary of Concho Oil & Gas Corp. from its inception in January 2001 until its sale in January 2004. From January 2004 to April 2004, Mr. Copeland was involved in private investments. Mr. Copeland was a director and the Vice President—General Counsel and Corporate Secretary of Concho Resources Inc. (which was a different company than our company) from its inception in August 1997 until its sale in June 2001. From 1991 until June 1997, Mr. Copeland was employed in the Legal Department of Parker & Parsley Petroleum Company (now Pioneer Natural Resources Company), and served as Vice President, Associate General Counsel from 1994 until June 1997. Prior to joining Parker & Parsley, Mr. Copeland was a partner with the Midland, Texas law firm of Stubbeman, McRae, Sealy, Laughlin & Browder, where his practice was concentrated in corporate, banking and other commercial matters. He is a graduate of Midwestern State University with a Bachelor of Business Administration and a graduate of Texas Tech University School of Law with a Doctor of Jurisprudence.
Curt F. Kamradthas been the Vice President—Chief Financial Officer and Treasurer of our company since its formation in February 2006. Mr. Kamradt has been the Vice President—Chief Financial Officer and Treasurer of Concho Equity Holdings Corp. since its inception in April 2004. Mr. Kamradt was Vice President—Chief Accounting Officer and Treasurer of Concho Oil & Gas Corp. from its inception in January 2001 until he became its Vice President and Chief Financial Officer in August 2002, a position he held until its sale in January 2004. From January 2004 to April 2004, Mr. Kamradt was involved in private investments. Mr. Kamradt was the Treasurer of Concho Resources Inc. (which was a different company than our company) from February 1999 until its sale in June 2001. From December 1989 until October 1999, Mr. Kamradt was employed by Parker & Parsley Petroleum Company (now Pioneer Natural Resources Company) in a variety of capacities, including serving as its Treasurer. From 1985 until December 1989, Mr. Kamradt was employed by the accounting firms of Price Waterhouse and Grant Thornton. He is a graduate of Eastern New Mexico University with a Bachelor of Business Administration degree in Accounting and is a certified public accountant.
David M. Thomas IIIhas been the Vice President—Exploration and Land of our company since its formation in February 2006. Mr. Thomas has been the Vice President—Exploration & Land of Concho Equity Holdings Corp. since April 2005. From July 2004 until April 2005, Mr. Thomas was involved in private investments. From August 2000 to July 2004, Mr. Thomas served as Exploration Manager/Southern Region for Tom Brown, Inc. In 2000, prior to joining Tom Brown, Inc., he served as a geologist for Pure Resources Inc. From 1998 to 2000, he served as Senior Staff Geologist for Mobil E&P U.S. Inc. and Senior Geologist for Conoco, Inc. in Midland, Texas. Mr. Thomas is certified as a Professional Geoscientist and is a Certified Professional Landman. He is a graduate of the University of New Mexico with a Bachelor of Business Administration degree, and a graduate of the University of Oklahoma with a Master of Science degree in Geology.
E. Joseph Wrighthas been the Vice President—Engineering and Operations of our company since February 2006. Mr. Wright has been the Vice President—Operations & Engineering of Concho Equity Holdings Corp. since its inception in April 2004. Mr. Wright was Vice President—Operations/Engineering of Concho Oil & Gas Corp. from its inception in January 2001 until its sale in January 2004. From January 2004 to April 2004, Mr. Wright was involved private investments. Mr. Wright served in various engineering and operations positions for Concho
87
Table of Contents
Resources Inc. (which was a different company than our company), including serving as Vice President—Operations, from February 1998 until its sale in June 2001. From 1982 until February 1998, Mr. Wright was employed by Mewbourne Oil Company in several operations, reservoir and evaluation engineering and capital markets positions. He is a graduate of Texas A&M University with a Bachelor of Science degree in Petroleum Engineering.
Tucker S. Bridwellhas been a Director of our company since February 2006. Mr. Bridwell was a director of Concho Equity Holdings Corp. from its inception in April 2004 until February 2006, and served as Chairman of its Compensation Committee. Mr. Bridwell has been the President of each of the Mansefeldt Investment Corporation and the Dian Graves Owen Foundation since September 1997 and manages investments for both entities; both of which are stockholders of our company. He has been in the energy business in various capacities for over twenty-five years. Mr. Bridwell served as Chairman of the Board of Directors of First Permian, LLC from 2000 until its sale to Energen Corporation in April 2002. Mr. Bridwell is also a director of Petrohawk Energy Corporation and serves on its Audit Committee. He is a graduate of Southern Methodist University with a Bachelor of Business Administration degree and a Master of Business Administration degree, and is a certified public accountant.
W. Howard Keenan, Jr. has been a Director of our company since February 2006. Mr. Keenan previously was a director of Concho Equity Holdings Corp., Concho Oil & Gas Corp. and Concho Resources Inc. (which was a different company than our company). Mr. Keenan has over thirty years of experience in the financial and energy businesses. Since 1997, he has been a Member of Yorktown Partners LLC, a private equity investment manager focused on the energy industry. Two limited partnerships managed by Yorktown Partners LLC are stockholders of our company. Mr. Keenan currently serves on the Board of Directors of GeoMet, Inc. From 1975 to 1997, he was in the Corporate Finance Department of Dillon, Read & Co. Inc. and active in the private equity and energy areas, including the founding of the first Yorktown Partners fund in 1991. He is serving or has served as a director of multiple Yorktown Partners portfolio companies. Mr. Keenan holds a Bachelors degree from Harvard College and a Master of Business Administration from Harvard University.
A. Wellford Taborhas been a Director of our company since February 2006. Mr. Tabor was a director of Concho Equity Holdings Corp. from its inception in April 2004 until February 2006. Mr. Tabor also served as a director of Concho Oil & Gas Corp. from March 2003 until its sale to a large domestic independent oil and gas company in January 2004. Mr. Tabor is a Partner with Wachovia Capital Partners, which is a stockholder of our company. Prior to joining Wachovia Capital Partners in 2000, Mr. Tabor was a director at The Beacon Group from 1995 to 2000. From 1991 to 1993, he worked in the Investment Banking Division at Morgan Stanley & Co. Mr. Tabor currently serves on the Board of Directors of James River Specialty, a publicly traded insurance company, and several other privately held energy and financial services companies in which Wachovia Capital Partners is an investor. Mr. Tabor earned his undergraduate degree from The University of Virginia and his Master of Business Administration from The Graduate School of Business at Stanford University.
Board of directors
We currently have five directors. Our restated certificate of incorporation and bylaws will provide for a classified board of directors consisting of three classes of directors, each serving staggered three-year terms. As a result, stockholders will elect a portion of our board of directors each year. Class I directors’ terms will expire at the annual meeting of stockholders to
88
Table of Contents
be held in 2008, Class II directors’ terms will expire at the annual meeting of stockholders to be held in 2009 and Class III directors’ terms will expire at the annual meeting of stockholders to be held in 2010. The Class I directors are Messrs. and , the Class II directors are Messrs. and and the Class III directors are Messrs. , and . At each annual meeting of stockholders held after the initial classification, the successors to directors whose terms will then expire will be elected to serve from the time of election until the third annual meeting following election. The division of our board of directors into three classes with staggered terms may delay or prevent a change of our management or a change in control. See “Description of capital stock—Anti-takeover provisions of our certificate of incorporation and bylaws.”
In addition, our restated bylaws will provide that the authorized number of directors, which shall constitute the whole board of directors, may be changed by a resolution duly adopted by the board of directors. Any additional directorships resulting from an increase in the number of directors will be distributed among the three classes so that, as nearly as possible, each class will consist of one-third of the total number of directors. Vacancies and newly created directorships may be filled by the affirmative vote of a majority of our directors then in office, even if less than a quorum.
Each of our current directors was nominated in accordance with provisions of a stockholders’ agreement and a voting agreement entered into at the time of the combination transaction. These stockholders’ agreement and voting agreement provisions will automatically terminate upon the closing of this offering.
Board committees
Our board of directors currently has an audit committee and a compensation committee. Following the closing of this offering, we intend to actively recruit additional directors to serve on our board of directors. We expect that these additional directors will qualify as “independent” for purposes of serving on our board of directors. In addition, our board of directors intends to form a nominating and corporate governance committee upon the completion of this offering.
Audit committee. Our audit committee currently consists of Messrs. Tabor, and . Mr. Tabor is “independent’’ under the standards of the New York Stock Exchange and SEC regulations. As permitted by the standards of the New York Stock Exchange and the rules of the SEC, we intend to appoint an independent director to replace on the audit committee within 90 days of the completion of this offering and a second independent director to replace on the audit committee within one year of the completion of this offering. Our audit committee operates pursuant to a formal written charter. This committee oversees, reviews, acts on and reports to our board of directors on various auditing and accounting matters, including: the selection of our independent accountants, the scope of our annual audits, fees to be paid to the independent accountants, the performance of our independent accountants and our accounting practices. In addition, the audit committee oversees our compliance programs relating to legal and regulatory requirements.
Compensation committee. Our compensation committee currently consists of Messrs. Bridwell and Keenan, with Mr. Bridwell serving as chairman of the compensation committee. Messrs. Bridwell, and Keenan are “independent” under the standards of the New York Stock Exchange and SEC regulations. As required by the standards of the New York Stock Exchange, the
89
Table of Contents
compensation committee consists solely of independent directors. Our compensation committee operates pursuant to a formal written charter. This committee establishes salaries, incentives and other forms of compensation for officers and other employees. Our compensation committee also administers our incentive compensation and benefit plans.
Compensation committee interlocks and insider participation
The compensation committee consists of Messrs. Bridwell and Keenan, both of whom are non-employee directors, with Mr. Bridwell serving as chairman of the compensation committee. Neither of these individuals have ever been an officer or employee of our company. In addition, none of our executive officers serves as a member of a board of directors or compensation committee of any entity that has one or more executive officers who serve on our board or on our compensation committee.
Executive officer compensation
Compensation discussion and analysis
This compensation discussion and analysis explains our compensation philosophy, policies and practices with respect to our chief executive officer, chief financial officer and the other four most highly-compensated executive officers, which are collectively referred to as our named executive officers.
General. Our compensation committee is responsible for establishing and administering policies governing the compensation of our named executive officers. The compensation committee is composed entirely of independent directors. See “—Board committees—Compensation committee.”
Our executive compensation program is designed to accomplish the following objectives:
| • | attract individuals with the skills necessary for us to execute our business plan; |
| • | motivate and reward executive officers whose knowledge, skills and performance are critical to our success; |
| • | align the interests of our named executive officers and stockholders with the performance of our company on both a short-term and long-term basis; and |
| • | retain those individuals who continue to perform at or above the levels that we expect. |
To accomplish these objectives, we provide what we believe is a competitive total compensation package to our executive management team through a combination of base salary, annual cash bonuses, long-term equity incentive compensation and broad-based benefits programs.
Our compensation committee determines the appropriate level for each compensation component based on competitive benchmarking, our recruiting and retention goals, our view of internal parity and consistency and overall company performance. When our compensation committee established our named executive officers’ compensation levels for 2006, it reviewed compensation data in an executive compensation survey of energy companies prepared by Mercer Human Resource Consulting, Inc. We believe that the group of companies participating in the survey is an appropriate peer group because it consists of similar organizations against whom we compete for executive talent. Our compensation committee has not engaged a
90
Table of Contents
compensation consultant in the past, but we engaged Longnecker & Associates in March 2007 to assist with the evaluation of our executive compensation program going forward. Our compensation committee has not adopted any formal or informal policies or guidelines for allocating compensation between long-term and currently paid out compensation, between cash and non-cash compensation or among different forms of non-cash compensation.
In connection with becoming a public company, our compensation committee’s intent is to perform at least annually a strategic review of our named executive officers’ overall compensation package to determine whether it provides adequate incentives and motivation and whether it adequately compensates our named executive officers relative to comparable officers in other companies with which we compete for executives. After our initial public offering, we anticipate working with Longnecker & Associates to conduct a review of our named executive officers’ overall compensation package for the remainder of 2007 and for 2008. The compensation committee meets outside the presence of all of our named executive officers to consider appropriate compensation for our chief executive officer and our president. For all other named executive officers, our compensation committee meets outside the presence of all named executive officers except our chief executive officer and president. Our chief executive officer and president together annually review other named executive officers’ performance with our compensation committee and make recommendations with respect to the appropriate base salary, targets for and payments under our annual cash bonus plan and the grants of long-term equity incentive awards for those named executive officers. Based in part on these recommendations from our chief executive officer and president and other considerations discussed below, the compensation committee establishes and approves the annual compensation package of our named executive officers other than our chief executive officer and president.
Base compensation. On an annual basis, the compensation committee reviews salary ranges and individual salaries for our named executive officers. We seek to pay base salaries at the market median pay level of individuals in comparable positions. We believe that paying base salaries near the market median is necessary to achieve our compensation objectives of attracting and retaining executives with the appropriate abilities and experience required to lead us. The compensation committee established base salary for each named executive officer based on consideration of market median pay levels and internal factors, such as the individual’s responsibilities, skills and experience, and the pay of others on the executive team.
In connection with the combination transaction, each of our named executive officers entered into a separate employment agreement, under which Messrs. Leach and Beal are guaranteed a minimum base annual salary of $350,000 and Messrs. Copeland, Kamradt, Wright and Thomas are guaranteed a minimum base annual salary of $250,000. Our compensation committee believes that these base salary levels achieve its executive compensation objectives and satisfy the goal of providing base salaries at the market median.
From January 1, 2006 until the completion of the combination transaction on February 27, 2006, our named executive officers received compensation as officers of Concho Equity Holdings Corp., our predecessor for accounting purposes. Base salary levels for our named executive officers during that period remained the same as in 2005 and consisted of $50,000 for each of Messrs. Leach and Beal and $33,333 for each of Messrs. Copeland, Kamradt, Wright and Thomas.
Cash bonuses. We utilize cash bonuses to reward achievement of performance targets with a time horizon of one year or less. Our compensation committee plans to determine performance targets for our named executive officers on an annual basis. We believe that the payment of cash bonuses upon the achievement of performance targets is necessary to achieve our
91
Table of Contents
compensation objectives of motivating and rewarding our named executive officers, as well as aligning the interests of our named executive officers and stockholders with the performance of our company on a short-term basis.
For 2006, the only performance target established by our compensation committee was the filing of the registration statement for our initial public offering. As this performance target was not achieved in 2006, none of our named executive officers received a cash bonus. In connection with the filing of the registration statement for our initial public offering, Messrs. Leach and Beal each received a $313,000 cash bonus; Messrs. Copeland, Kamradt and Wright each received a $172,000 cash bonus; and Mr. Thomas received a $199,000 cash bonus. For 2007, and in addition to the bonus payable upon the filing of the registration statement for our initial public offering, our named executive officers are eligible to earn a bonus ranging from 0% to 100% of their base salary based on the performance measure of net asset value per share growth, in addition to other performance measures that the committee may decide to evaluate in its sole discretion. When evaluating net asset value per share growth, our compensation committee has wide discretion to determine the appropriate percentage of base salary for each named executive officer. Our compensation committee chose net asset value per share growth because it believes it to be the best indicator of the Company’s financial success and stockholder value creation.
Stock options. We utilize stock option grants to motivate and reward our named executive officers, as well as to align the interests of our named executive officers and stockholders with the performance of our company on a long-term basis. In addition, we utilize multi-year vesting periods when granting stock options to facilitate the compensation objective of retaining our named executive officers.
Because our named executive officers are awarded stock options with an exercise price equal to the fair market value of our common stock on the date of grant, the determination of which is discussed below, these options will have value to our named executive officers only if the market price of our common stock increases after the date of grant. Typically, our stock options vest at a rate of one-quarter of the shares subject to the option on each of the first four anniversaries of the grant date. The stock options that we have granted under our 2006 Stock Incentive Plan typically may be exercised by the recipient at any time once vested and will expire ten years from the date of the grant, but may expire earlier upon termination of employment. While the 2006 Stock Incentive Plan allows for other forms of equity compensation, the compensation committee and management currently believe that stock options are the appropriate vehicle to provide long-term incentive compensation to our named executive officers. Other types of long-term equity incentive compensation may be considered in the future as our business strategy evolves.
Following the completion of our initial public offering, all options will be granted with an exercise price equal to the fair market value of our common stock on the date of the grant. Such fair market value will be defined as the closing market price of a share of our common stock on the date of the grant. We do not have any program, plan or practice of setting the exercise price on a date or price other than the fair market value of our common stock on the grant date. We do not have any program, plan or obligation that requires us to grant equity compensation on specified dates to our named executive officers.
Like other pay components, long-term equity incentive award grants are determined based on an analysis of competitive market data of companies we deem our peers, relying on data in the Mercer executive compensation survey. Annual grants are targeted at the median level of
92
Table of Contents
market pay practices for each executive officer’s position, but may be adjusted based on individual performance. In addition, our compensation committee generally considers an executive officer’s stock holdings or previous stock option grants when determining the number of stock options to be granted.
During 2006, we granted options to purchase 125,000 shares of our common stock to each of Messrs. Leach and Beal, and 150,000 shares to each of Messrs. Copeland, Kamradt and Wright, and 200,000 shares to Mr. Thomas. Each of the grants had an exercise price of $6.00 per share. These grants were made by our board of directors after the completion of the combination transaction in February 2006, and the board determined that, in light of the individuals’ performance, it was appropriate to provide additional incentive for each of these persons. To date, all of our options have been granted under our 2006 Stock Incentive Plan, which is described below under “—2006 Stock Incentive Plan.”
Stock ownership guidelines have not been implemented by our compensation committee for our named executive officers. We will continue to periodically review best practices and re-evaluate our position with respect to stock ownership guidelines.
Severance and change of control payments. All of our named executive officers are entitled to receive severance payments equal to a specified number of months of base salary, as well as accelerated vesting of all existing stock options in the event that their employment is terminated by our company other than for “cause” (and not by reason of death or disability) or if they terminate their employment following a “change in duties.’’ Upon a termination within two years of a change of control, each of our named executive officers is entitled to a lump sum severance payment equal to two years of base salary and accelerated vesting of all existing stock option awards.
We believe these severance and change of control arrangements mitigate some of the risk that exists for executives working in a smaller company. These arrangements are intended to attract and retain qualified executives that could have job alternatives that may appear to them to be less risky absent these arrangements. Because of recent significant acquisition activity in the oil and gas industry, there is a possibility that we could be acquired in the future. Accordingly, we believe that the larger severance packages resulting from terminations related to change of control transactions would provide an incentive for these executives to continue to help successfully execute such a transaction from its early stages until closing.
For a description and quantification of these severance and change of control benefits, please see “—Employment, severance and change of control arrangements.”
Other benefits. Our named executive officers are eligible to participate in all of our employee benefit plans, such as medical, dental, vision, group life, disability, and accidental death and dismemberment insurance and our 401(k) plan, in each case on the same basis as other employees, subject to applicable law. We also provide vacation and other paid holidays to all employees, including our named executive officers, which are comparable to those provided at peer companies.
During 2006, we owned and operated an airplane to facilitate the travel of senior executives in as safe a manner as possible and with the best use of their time. Messrs. Leach and Beal are entitled to utilize our aircraft for business travel and reasonable personal travel in North America. Certain other named executive officers use the corporate aircraft for business travel and, until May 13, 2006, used such aircraft for personal travel. The immediate family members
93
Table of Contents
of Messrs. Leach and Beal are also permitted to utilize our aircraft for their reasonable personal use in North America. Messrs. Leach and Beal are not obligated to reimburse us for the use of such aircraft except when their immediate family members use such aircraft without one of Messrs. Leach or Beal accompanying them on the flight, in which case they shall be obligated to reimburse us for the variable costs of such use. The amount of personal and family travel using our aircraft is subject to annual review and adjustment by the compensation committee.
The value of personal aircraft usage described above is based on our direct operating cost. This methodology calculates our incremental cost based on the average weighted cost of fuel, on-board catering, aircraft maintenance, landing fees, trip-related hangar and parking costs, and smaller variable costs. Since the corporate aircraft is used primarily for business travel, the methodology excludes fixed costs which do not change based on usage, such as pilots’ and other employees’ salaries, purchase costs of the aircraft and non-trip-related hangar expenses. On occasions when an executive’s spouse or other family member accompanies the executive on a flight, no additional direct operating cost is incurred under the foregoing methodology.
Tax and accounting policies. We account for equity compensation paid to our employees under SFAS 123R, which requires us to estimate and record an expense over the service period of the award. Our cash compensation is recorded as an expense at the time the obligation is accrued. We receive a tax deduction for the compensation expense. We structure cash bonus compensation so that it is taxable to our executives at the time it becomes available to them. We currently intend that all cash compensation paid will be tax deductible for us. However, with respect to equity compensation awards, while any gain recognized by employees from nonqualified options granted at fair market value should be deductible, to the extent that an option constitutes an incentive stock option, gain recognized by the optionee will not be deductible if there is no disqualifying disposition by the optionee. In addition, if we grant restricted stock or restricted stock unit awards that are not subject to performance vesting, they may not be fully deductible by us at the time the award is otherwise taxable to employees.
94
Table of Contents
Executive compensation tables
The following table presents compensation information for our fiscal year ended December 31, 2006 paid to or accrued for our chief executive officer, chief financial officer and each of our four other most highly compensated executive officers whose aggregate salary and bonus was more than $100,000. We refer to these executive officers as our named executive officers elsewhere in this prospectus.
Summary Compensation Table
| All other | |||||||||||||||
| Name and principal position | Salary(1) | Bonus | Option awards(2) | compensation(3) | Total | ||||||||||
| Timothy A. Leach | $ | 333,333 | $ | — | $ | 603,840 | $ | 34,124 | $ | 971,297 | |||||
Chairman and Chief Executive Officer | |||||||||||||||
| Steven L. Beal | 333,333 | — | 603,840 | 18,395 | 955,568 | ||||||||||
President and Chief Operating Officer | |||||||||||||||
| David W. Copeland | 233,333 | — | 375,905 | 17,951 | 627,189 | ||||||||||
Vice President—General Counsel and Secretary | |||||||||||||||
| Curt F. Kamradt | 233,333 | — | 375,905 | 13,883 | 623,121 | ||||||||||
Vice President, Chief Financial Officer and Treasurer | |||||||||||||||
| E. Joseph Wright | 233,333 | — | 375,905 | 14,055 | 623,293 | ||||||||||
Vice President—Engineering and Operations | |||||||||||||||
| David M. Thomas III | 233,333 | — | 324,649 | 15,753 | 573,735 | ||||||||||
Vice President—Exploration and Land | |||||||||||||||
| (1) | From January 1, 2006 until the completion of the combination transaction on February 27, 2006, our named executive officers received compensation as officers of Concho Equity Holdings Corp., our predecessor for accounting purposes. For their service as named executive officers of our company from February 28, 2006 through December 31, 2006, Messrs. Leach and Beal each earned $283,333 and Messrs. Copeland, Kamradt, Wright and Thomas each earned $200,000. | |
| (2) | The amounts in this column represent the dollar amount recognized for financial statement reporting purposes with respect to the fiscal year computed in accordance with SFAS No. 123R. Please see Note H of the notes to our consolidated financial statements for a discussion of all assumptions made in determining the grant date fair values. The stock option grants are comprised of grants on February 23, 2006 and June 12, 2006. Grants made on February 23, 2006 were made under the stock option plan dated August 13, 2004, as amended and restated as of February 27, 2006. Grants made on June 12, 2006 were made under the 2006 Stock Incentive Plan dated June 1, 2006. Options granted February 23, 2006 vest at the end of three years commencing on the first anniversary of the date of grant. Options granted on June 12, 2006 vest as to1/4 of the shares underlying the option on each of the first four anniversaries of the grant date. Option awards reported for Mr. Leach are comprised of $461,520 for options granted February 23, 2006 and $143,320 for options granted June 12, 2006. Options awards reported for Mr. Beal are comprised of $461,520 for options granted February 23, 2006 and $143,320 for options granted June 12, 2006. Options awards reported for Mr. Kamradt are comprised of $205,121 for options granted February 23, 2006 and $170,784 for options granted June 12, 2006. Options awards reported for Mr. Copeland are comprised of $205,121 for options granted February 23, 2006 and $170,784 for options granted June 12, 2006. Option awards reported for Mr. Thomas are comprised of $96,938 for options granted February 23, 2006 and $227,711 for options granted June 12, 2006. Options awards reported for Mr. Wright are comprised of $205,121 for options granted February 23, 2006 and $170,784 for options granted June 12, 2006. | |
| (3) | All other compensation reported for Mr. Leach represents a $14,987 matching contribution by our company to our 401(k) Plan, of which $12,615 was for the period from February 28, 2006 through December 31, 2006; $55 for life insurance |
95
Table of Contents
| premiums, of which $46 was for the period from February 28, 2006 through December 31, 2006; and $19,082 for personal use of our company’s airplane, of which $16,646 was for the period from February 28, 2006 through December 31, 2006. All other compensation reported for Mr. Beal represents a $14,998 matching contribution by our company to our 401(k) Plan, of which $12,616 was for the period from February 28, 2006 through December 31, 2006; $55 for life insurance premiums, of which $46 was for the period from February 28, 2006 through December 31, 2006; and $3,342 for personal use of our company’s airplane, all of which was for the period from February 28, 2006 through December 31, 2006. All other compensation reported for Mr. Kamradt represents a $13,828 matching contribution by our company to our 401(k) Plan, of which $11,828 was for the period from February 28, 2006 through December 31, 2006 and $55 for life insurance premiums, of which $46 was for the period from February 28, 2006 through December 31, 2006. All other compensation reported for Mr. Copeland represents a $14,000 matching contribution by our company to our 401(k) Plan, of which $12,000 was for the period from February 28, 2006 through December 31, 2006; $55 for life insurance premiums, of which $46 was for the period from February 28, 2006 through December 31, 2006; and $3,896 for personal use of our company’s airplane, of which $2,320 was for the period from February 28, 2006 through December 31, 2006. All other compensation reported for Mr. Thomas represents a $14,000 matching contribution by our company to our 401(k) Plan, of which $12,000 was for the period from February 28, 2006 through December 31, 2006; $55 for life insurance premiums, of which $46 was for the period from February 28, 2006 through December 31, 2006; and $1,698 for personal use of our company’s airplane, all of which was for the period from February 28, 2006 through December 31, 2006. All other compensation reported for Mr. Wright represents a $14,000 matching contribution by our company to our 401(k) Plan, of which $12,000 was for the period from February 28, 2006 through December 31, 2006 and $55 for life insurance premiums, of which $46 was for the period from February 28, 2006 through December 31, 2006. |
Grants of plan-based awards in last fiscal year
The following table provides information with regard to each stock option granted to each named executive officer during 2006.
| Estimated | |||||||||||||||||
| fair market | |||||||||||||||||
| value of | |||||||||||||||||
| Number of | Exercise | common | Grant date | ||||||||||||||
| securities | price of | stock on | fair value | ||||||||||||||
| underlying | option | date of | of option | ||||||||||||||
| Name | Grant date | options | awards | grant(3) | awards | ||||||||||||
| Timothy A. Leach | February 23, 2006 | 261,855 | (1) | $ | 4.00 | (1) | $ | 5.76 | $ | 568,896 | |||||||
| June 12, 2006 | 125,000 | (2) | 6.00 | (2) | 7.70 | 493,750 | |||||||||||
| Steven L. Beal | February 23, 2006 | 261,855 | (1) | 4.00 | (1) | 5.76 | 568,896 | ||||||||||
| June 12, 2006 | 125,000 | (2) | 6.00 | (2) | 7.70 | 493,750 | |||||||||||
| David W. Copeland | February 23, 2006 | 116,380 | (1) | 4.00 | (1) | 5.76 | 252,842 | ||||||||||
| June 12, 2006 | 150,000 | (2) | 6.00 | (2) | 7.70 | 592,500 | |||||||||||
| Curt F. Kamradt | February 23, 2006 | 116,380 | (1) | 4.00 | (1) | 5.76 | 252,842 | ||||||||||
| June 12, 2006 | 150,000 | (2) | 6.00 | (2) | 7.70 | 592,500 | |||||||||||
| E. Joseph Wright | February 23, 2006 | 116,380 | (1) | 4.00 | (1) | 5.76 | 252,842 | ||||||||||
| June 12, 2006 | 150,000 | (2) | 6.00 | (2) | 7.70 | 592,500 | |||||||||||
| David M. Thomas III | February 23, 2006 | 55,000 | (1) | 4.00 | (1) | 5.76 | 119,491 | ||||||||||
| June 12, 2006 | 200,000 | (2) | 6.00 | (2) | 7.70 | 790,000 | |||||||||||
| (1) | On February 23, 2006, each of our named executive officers received a stock option grant as an executive officer of Concho Equity Holdings Corp., our predecessor for accounting purposes. Upon completion of the combination transaction, each outstanding option to purchase shares of Concho Equity Holdings Corp. was converted into an option to purchase 2.5 shares of our common stock at an exercise price of $4.00 per share. The number of securities underlying the option award is shown as converted to our common stock. For each of these options, 78% of the total award became vested and exercisable on February 27, 2006 and the remaining 22% will become exercisable on February 27, 2009. | |
| (2) | Each of these options become exercisable as to 1/4 of the shares underlying the option on each of the first four anniversaries of the grant date. These options also contain provisions that provide for accelerated vesting upon the occurrence of certain events following a change of control of our company, as discussed below in “—Employment, severance and change of control arrangements.” | |
| (3) | The estimated fair market value of common stock on date of grant represents the per share dollar amount recognized for financial statement reporting purposes with respect to the fiscal year computed in accordance with SFAS No. 123R. |
96
Table of Contents
Outstanding option awards at December 31, 2006
The following table presents the outstanding option awards held as of December 31, 2006 by each named executive officer.
| Number of securities | Exercise | ||||||||||||||||
| underlying unexercised | price of | Option | |||||||||||||||
| options(1) | option | expiration | |||||||||||||||
| Name | Grant date | Exercisable | Unexercisable | awards | date | ||||||||||||
| Timothy A. Leach | August 13, 2004 | 139,260 | (2) | 39,278 | (2) | $4.00 | (2) | August 13, 2014 | |||||||||
| December 6, 2004 | 216,316 | (2) | 61,012 | (2) | 4.00 | (2) | December 6, 2014 | ||||||||||
| July 15, 2005 | 92,839 | (2) | 26,185 | (2) | 4.00 | (2) | June 15, 2015 | ||||||||||
| December 30, 2005 | 139,260 | (2) | 39,278 | (2) | 4.00 | (2) | December 30, 2015 | ||||||||||
| February 23, 2006 | 204,247 | (2) | 57,608 | (2) | 4.00 | (2) | February 23, 2016 | ||||||||||
| June 12, 2006 | — | 125,000 | 6.00 | June 12, 2016 | |||||||||||||
| Steven L. Beal | August 13, 2004 | 139,260 | (2) | 39,278 | (2) | $4.00 | (2) | August 13, 2014 | |||||||||
| December 6, 2004 | 216,316 | (2) | 61,012 | (2) | 4.00 | (2) | December 6, 2014 | ||||||||||
| July 15, 2005 | 92,839 | (2) | 26,185 | (2) | 4.00 | (2) | July 15, 2015 | ||||||||||
| December 30, 2005 | 139,260 | (2) | 39,278 | (2) | 4.00 | (2) | December 30, 2015 | ||||||||||
| February 23, 2006 | 204,247 | (2) | 57,608 | (2) | 4.00 | (2) | February 23, 2016 | ||||||||||
| June 12, 2006 | — | 125,000 | 6.00 | June 12, 2016 | |||||||||||||
| David W. Copeland | August 13, 2004 | 61,893 | (2) | 17,457 | (2) | 4.00 | (2) | August 13, 2014 | |||||||||
| December 6, 2004 | 96,141 | (2) | 27,117 | (2) | 4.00 | (2) | December 6, 2014 | ||||||||||
| July 15, 2005 | 41,261 | (2) | 11,638 | (2) | 4.00 | (2) | July 15, 2015 | ||||||||||
| December 30, 2005 | 61,893 | (2) | 17,457 | (2) | 4.00 | (2) | December 30, 2015 | ||||||||||
| February 23, 2006 | 90,776 | (2) | 25,604 | (2) | 4.00 | (2) | February 23, 2016 | ||||||||||
| June 12, 2006 | — | 150,000 | 6.00 | June 12, 2016 | |||||||||||||
| Curt F. Kamradt | August 13, 2004 | 61,893 | (2) | 17,457 | (2) | 4.00 | (2) | August 13, 2014 | |||||||||
| December 6, 2004 | 96,141 | (2) | 27,117 | (2) | 4.00 | (2) | December 6, 2014 | ||||||||||
| July 15, 2005 | 41,261 | (2) | 11,638 | (2) | 4.00 | (2) | July 15, 2015 | ||||||||||
| December 30, 2005 | 61,893 | (2) | 17,457 | (2) | 4.00 | (2) | December 30, 2015 | ||||||||||
| February 23, 2006 | 90,776 | (2) | 25,604 | (2) | 4.00 | (2) | February 23, 2016 | ||||||||||
| June 12, 2006 | — | 150,000 | 6.00 | June 12, 2016 | |||||||||||||
| E. Joseph Wright | August 13, 2004 | 61,893 | (2) | 17,457 | (2) | 4.00 | (2) | August 13, 2014 | |||||||||
| December 6, 2004 | 96,141 | (2) | 27,117 | (2) | 4.00 | (2) | December 6, 2014 | ||||||||||
| July 15, 2005 | 41,261 | (2) | 11,638 | (2) | 4.00 | (2) | July 15, 2015 | ||||||||||
| December 30, 2005 | 61,893 | (2) | 17,457 | (2) | 4.00 | (2) | December 30, 2015 | ||||||||||
| February 23, 2006 | 90,776 | (2) | 25,604 | (2) | 4.00 | (2) | February 23, 2016 | ||||||||||
| June 12, 2006 | — | 150,000 | 6.00 | June 12, 2016 | |||||||||||||
| David M. Thomas III | April 15, 2005 | 74,685 | (2) | 21,065 | (2) | 4.00 | (2) | April 15, 2015 | |||||||||
| July 15, 2005 | 19,500 | (2) | 5,500 | (2) | 4.00 | (2) | July 15, 2015 | ||||||||||
| December 30, 2005 | 29,250 | (2) | 8,250 | (2) | 4.00 | (2) | December 30, 2015 | ||||||||||
| February 23, 2006 | 42,900 | (2) | 12,100 | (2) | 4.00 | (2) | February 23, 2016 | ||||||||||
| June 12, 2006 | — | 200,000 | 6.00 | June 12, 2016 | |||||||||||||
| (1) | These options contain provisions that provide for accelerated vesting upon the occurrence of certain events following a change of control of our company, as discussed below in “—Employment, severance and change of control arrangements.” | |
| (2) | Prior to the completion of the combination transaction on February 27, 2006, Concho Equity Holdings Corp, our predecessor for accounting purposes, made awards of stock options to our named executive officers. Upon completion of the combination transaction, each outstanding option to purchase shares of Concho Equity Holdings Corp. was converted into an option to purchase 2.5 shares of our common stock at an exercise price of $4.00 per share. The number of securities underlying the option award is shown as converted to our common stock. |
97
Table of Contents
Option exercises in last fiscal year
No shares were acquired pursuant to the exercise of options by any named executive officer during 2006.
Employment, severance and change of control arrangements
We entered into employment agreements with all of our named executive officers, each with an effective date as of June 1, 2006. These employment agreements are substantially similar and have an initial term that expires three years from the effective date, but will automatically be extended for successive one-year terms after the initial term unless either party gives written notice within 90 days prior to the end of the term. Under these agreements, Mr. Leach and Mr. Beal’s minimum annual base salaries are $350,000 and Messrs. Copeland, Kamradt, Wright and Thomas’s minimum annual base salaries are $250,000. All of our named executive officers are eligible to receive cash bonuses as and when approved by our board of directors or compensation committee. Mr. Leach and Mr. Beal are entitled to utilize our aircraft for business use, and they and their families are entitled to use our aircraft for reasonable personal use and are not required to reimburse us for any cost related to such use unless a family member travels without either Mr. Leach or Mr. Beal.
If one of our named executive officer’s employment is terminated by us without “cause” (and not by reason of his death or disability), or if he terminates his employment following a “change in duties,” then we will provide him with certain severance benefits. If such a termination of employment occurs prior to a change of control or more than two years after a change of control, then his base salary will continue to be paid for 12 months and we will reimburse him for up to 12 months for the amount by which the cost of his continued coverage under our group health plans exceeds the employee contribution amount that we charge our active senior executives for similar coverage. If such a termination of employment occurs during the two-year period beginning on the date upon which a change of control occurs (a “change of control period”), then he will be entitled to a lump sum severance amount equal to two times his annual base salary, all of his stock options and restricted stock awards will vest in full, and we will reimburse him for up to 18 months for the amount by which the cost of his continued coverage under our group health plans exceeds the employee contribution amount that we charge our active senior executives for similar coverage. If the total amount of payments to be provided by our company in connection with a change in control would cause any of the named executive officers to incur “golden parachute” excise tax liability, then the payments will be reduced to the extent necessary to leave him in a better after-tax position than if no such reduction had occurred. The agreement does not provide for any tax “gross-up” payments. We will have “cause” to terminate a named executive officer’s employment if he (1) has engaged in gross negligence, gross incompetence or willful misconduct in the performance of his duties, (2) has materially breached any material provision of his employment agreement, corporate policy or code of conduct established by our company, (3) has willfully engaged in conduct that is materially injurious to our company, (4) has committed an act of fraud, embezzlement or willful breach of a fiduciary duty to our company, (5) has been convicted of a crime involving fraud, dishonesty or moral turpitude or any felony, or (6) has refused, without proper reason, to perform his duties. Prior to a change of control or after the expiration of a change of control period, a named executive officer will incur a “change in duties” if there is a reduction in the rank of his title as an officer of our company, a reduction in his base salary, or a material diminution in his employee benefits and perquisites from those substantially similar to those provided to similarly situated executives. During a change of
98
Table of Contents
control period, a named executive officer will incur a “change in duties” if there is (a) a material reduction in the nature or scope of his authorities or duties, (b) a reduction in his base salary, (c) a diminution in his eligibility to participate in bonus, stock option, incentive award and other compensation plans, (d) a material diminution in his employee benefits and perquisites, or (e) a change in the location of his principal place of employment by more than 10 miles. In addition, each of the employment agreements contains provisions that prohibit, with certain limitations, the named executive officer from competing with us; soliciting any of our customers, vendors, or acquisition candidates; or soliciting or hiring any of our employees or inducing any of them to terminate their employment with us. These restrictions will generally continue for a period of 12 months following termination of employment, except under certain circumstances we must agree to continue to pay the named executive officer’s base salary in order for the non-competition restrictions to continue to apply.
In addition to the acceleration of vesting provisions described above, all options to purchase common stock issued to our named executive officers may be subject to accelerated vesting upon a change of control as described below in the section entitled “—Potential payments upon change of control under employment agreements.”
Potential payments upon change of control under employment agreements
The following table summarizes the potential payments to each named executive officer assuming that one of the events described in the table below occurs. The table assumes that the event occurred on December 31, 2006. We have assumed a price per share of our common stock of $ .
| Termination of employment by our company without | ||||||||
| “cause” (and not by reason of death or disability) or | ||||||||
| resignation following a “change in duties” | ||||||||
| Prior to, or more than two | Within two years after a | |||||||
| Name | years after a change of control | change of control | ||||||
| Timothy A. Leach | (1 | ) | (2 | ) | ||||
| Steven L. Beal | (1 | ) | (2 | ) | ||||
| David W. Copeland | (3 | ) | (4 | ) | ||||
| Curt F. Kamradt | (3 | ) | (4 | ) | ||||
| E. Joseph Wright | (3 | ) | (4 | ) | ||||
| David M. Thomas III | (3 | ) | (4 | ) | ||||
| (1) | Includes payment of $350,000 for the continuation of salary and $18,173 for continuation of health benefits for a period of 12 months following such termination. | |
| (2) | Includes payment of $700,000 in a lump sum payment for salary, $27,259 for continuation of health benefits for a period of 18 months following such termination and $ for accelerated vesting of equity awards, based on the fair value of unvested stock options as of December 31, 2006 in accordance with the provisions of Statement of Financial Accounting Standards (“SFAS”) No. 123R, “Share-based Payment.” | |
| (3) | Includes payment of $250,000 for the continuation of salary and $18,173 for continuation of health benefits for a period of 12 months following such termination. | |
| (4) | Includes payment of $500,000 in a lump sum payment for salary, $27,259 for continuation of health benefits for a period of 18 months following such termination and $ for accelerated vesting of equity awards, based on the fair value of unvested stock options as of December 31, 2006 in accordance with the provisions of Statement of Financial Accounting Standards (“SFAS”) No. 123R, “Share-based Payment.” |
99
Table of Contents
Director compensation
Directors who are not employees of our company, which we refer to as “Outside Directors,” receive compensation for serving on our board of directors. Our objectives for director compensation are to remain competitive with the compensation paid to directors of comparable companies while adhering to corporate governance best practices with respect to such compensation, and to reinforce our practice of encouraging stock ownership. Our Outside Director compensation includes:
| • | an annual retainer of $35,000; |
| • | a meeting attendance fee of $1,000 for each board meeting attended; |
| • | a committee meeting attendance fee of $500 for each board committee meeting attended; and |
| • | on an annual basis, commencing with the second year of service, an award of 5,000 shares of restricted stock under our company’s equity compensation plan. |
On June 1, 2006, the board of directors approved a one-time award to the Outside Directors of 10,000 shares of restricted stock under our 2006 Stock Incentive Plan, which shares fully vested on January 2, 2007. All directors are reimbursed for all reasonableout-of-pocket expenses incurred in attending meetings of the board of directors and committees thereof.
Director compensation
| Name(1) | Fees | Stock Awards | Total | ||||||
| Tucker S. Bridwell | $ | 17,166 | $ | 77,000 | $ | 94,166 | |||
W. Howard Keenan, Jr.(2) | 15,666 | 77,000 | 92,666 | ||||||
A. Wellford Tabor(3) | 17,166 | 77,000 | 94,166 | ||||||
G. Carl Everett(4) | 17,666 | 77,000 | 94,666 | ||||||
Larry V. Kalas(4) | 16,666 | 77,000 | 93,666 | ||||||
John A. Knorr(4) | 13,666 | 77,000 | 90,666 | ||||||
Bradley D. Bartek(4) | 14,666 | 77,000 | 91,666 | ||||||
Robert C. Chase(4) | 13,666 | 77,000 | 90,666 | ||||||
| (1) | Our employee directors have been omitted from this table because they receive no compensation for serving on our board of directors. | |
| (2) | Mr. Keenan remits all fees received as director compensation to Yorktown Energy Partners V, L.P. and Yorktown Energy Partners VI, L.P. and holds all securities received as director compensation for the benefit of those entities. Mr. Keenan disclaims beneficial ownership of all such securities as well as those held by those entities, except to the extent of his pecuniary interest therein. | |
| (3) | Mr. Tabor remits all fees received as director compensation to Wachovia Capital Partners (“WCP”) and holds all securities received as director compensation for the benefit of WCP. Mr. Tabor disclaims beneficial ownership of all such securities as well as those held by WCP and its affiliates, except to the extent of his pecuniary interest therein. | |
| (4) | Messrs. Everett, Kalas, Knorr, Bartek and Chase each resigned as a director on April 23, 2007. |
2006 Stock Incentive Plan
The following contains a summary of the material terms of our 2006 Stock Incentive Plan, which was adopted by our board of directors and approved by our stockholders. The description of
100
Table of Contents
the Stock Incentive Plan does not describe all aspects of the plan. For more information, we refer you to the full text of the Stock Incentive Plan, which has been filed as an exhibit to the registration statement of which this prospectus is a part.
The 2006 Stock Incentive Plan permits the grant of non-qualified stock options, incentive stock options, stock appreciation rights issued in tandem with stock options or phantom stock awards, restricted stock, phantom stock, performance awards and other stock-based awards to our employees, directors and consultants and to employees and consultants of our affiliates, provided that incentive stock options may be granted solely to employees. A maximum of 11,700,000 shares of common stock may be delivered pursuant to awards under the 2006 Stock Incentive Plan. The number of shares deliverable pursuant to awards under the 2006 Stock Incentive Plan is subject to adjustment as a result of mergers, consolidations, reorganizations, stock splits, stock dividends and other similar changes in our common stock. Shares of common stock used to pay exercise prices and to satisfy tax withholding obligations with respect to awards as well as shares covered by awards that expire, terminate or lapse will again be available for awards under the 2006 Stock Incentive Plan.
Administration. The 2006 Stock Incentive Plan is administered by the compensation committee of the board of directors. Our compensation committee has the sole discretion to determine the employees, directors and consultants to whom awards may be granted under the 2006 Stock Incentive Plan and the manner in which such awards will vest. The compensation committee is authorized to construe the 2006 Stock Incentive Plan, to prescribe rules and regulations relating to the 2006 Stock Incentive Plan, and to make any other determinations that it deems necessary or advisable for administering the 2006 Stock Incentive Plan. Our compensation committee may correct any defect, supply any omission or reconcile any inconsistency in the 2006 Stock Incentive Plan in the manner and to the extent the compensation committee deems expedient to carry the 2006 Stock Incentive Plan into effect.
Stock Options. Our compensation committee will determine the exercise price for each stock option award. Options must have an exercise price at least equal to the fair market value of the common stock on the date the option is granted. An option holder may exercise an option by written notice and payment of the exercise price:
| • | in cash; |
| • | if the option agreement so provides, by a “cashless exercise,” in accordance with procedures approved by the compensation committee; or |
| • | if the option agreement so provides, by delivery of a number of shares of common stock (plus cash if necessary) having a fair market value equal to the option price. |
Stock Appreciation Rights. A stock appreciation right permits the holder to receive an amount (in cash, common stock, or a combination thereof) equal to the number of stock appreciation rights exercised by the holder, multiplied by the excess of the fair market value of common stock on the exercise date over the stock appreciation rights’ exercise price. Stock appreciation rights may be granted in connection with the grant of an option or a phantom stock award. The exercise price of stock appreciation rights granted under the 2006 Stock Incentive Plan will be determined by the compensation committee; provided, however, that such exercise price cannot be less than the fair market value of a share of common stock on a date the stock appreciation right is granted (subject to adjustments). A stock appreciation right may be
101
Table of Contents
exercised in whole or in such installments and at such times as determined by the compensation committee.
Restricted Stock Awards. Pursuant to a restricted stock award, shares of common stock may be granted at any time the award is made with or without any cash payment to us, as determined by the compensation committee; provided, however, that such shares will be subject to certain restrictions on the disposition thereof and certain obligations to forfeit such shares to us as may be determined in the discretion of the compensation committee. The compensation committee may provide that the restrictions on disposition may lapse based upon (a) the attainment of specific performance measures established by the compensation committee; (b) the participant’s continued service with us; (c) the occurrence of any other event or condition specified by the compensation committee in its sole discretion; or (d) a combination of any of the foregoing factors. A participant may not sell, transfer, pledge, exchange, hypothecate, or otherwise dispose of such shares until the expiration of the restriction period.
Transferability. Unless otherwise determined by our compensation committee, awards granted under the 2006 Stock Incentive Plan are not transferable other than by will or by the laws of descent and distribution or, in some cases, pursuant to the terms of a qualified domestic relations order. Incentive stock options may be exercisable during the participant’s lifetime only by such participant or his legal representative or guardian.
Change of Control. In the event of a “Corporate Change” (as defined in the 2006 Stock Incentive Plan), the compensation committee may provide for:
| • | the substitution of similar options with respect to the stock of the successor company; |
| • | the acceleration of the vesting of all or any portion of certain awards; or |
| • | the mandatory surrender to us by selected participants of some or all of the outstanding awards held by such participants, at which time we will cancel such awards and cause to be paid to each affected participant a certain amount of cash per share, as specified in the 2006 Stock Incentive Plan. |
Amendment and Termination. Our board of directors in its discretion may terminate the 2006 Stock Incentive Plan at any time with respect to any shares of common stock for which awards have not been granted. Our board of directors may alter or amend the 2006 Stock Incentive Plan from time to time, except that no change may be made that would impair the rights of a participant with respect to an outstanding award without the consent of the participant. In addition, our board of directors may not, without approval of our stockholders:
| • | amend the 2006 Stock Incentive Plan to increase the maximum aggregate number of shares that may be issued under the 2006 Stock Incentive Plan; or |
| • | increase the maximum number of shares that may be issued under the 2006 Stock Incentive Plan through incentive stock options or change the class of individuals eligible to receive awards under the 2006 Stock Incentive Plan. |
Indemnification of directors and executive officers and limitation of liability
We have also entered into indemnification agreements with each of our executive officers and directors. These indemnification agreements are intended to permit indemnification to the fullest extent now or hereafter permitted by the General Corporation Law of the State of
102
Table of Contents
Delaware. It is possible that the applicable law could change the degree to which indemnification is expressly permitted.
The indemnification agreements cover expenses (including attorneys’ fees), judgments, fines and amounts paid in settlement incurred as a result of the fact that such person, in his or her capacity as a director or officer, is made, threatened or reasonably expected to be made a party to any suit or proceeding. The indemnification agreements generally cover claims relating to the fact that the indemnified party is or was an officer, director, employee or agent of us or any of our subsidiaries, or is or was serving at our request in such a position for another entity. The indemnification agreements also obligate us to promptly advance all expenses incurred in connection with any claim. The indemnitee is, in turn, obligated to reimburse us for all amounts so advanced if it is later determined that the indemnitee is not entitled to indemnification. The indemnification provided under the indemnification agreements is not exclusive of any other indemnity rights; however, double payment to the indemnitee is prohibited.
103
Table of Contents
Principal and selling stockholders
The following table sets forth certain information regarding the beneficial ownership of our common stock prior to and as of the closing of this offering by:
| • | each person who will beneficially own more than 5% of our common stock then outstanding; |
| • | each of our named executive officers; |
| • | each of our directors; |
| • | all of our directors and executive officers as a group; and |
| • | each selling stockholder. |
All information with respect to beneficial ownership has been furnished by the respective directors, officers or stockholders, as the case may be. The number of shares in the column “Number of shares offered” represents all of the shares that each selling stockholder may offer under this prospectus assuming no exercise of the underwriters’ over-allotment option. Except as noted below in the footnotes, Chase Oil Corporation, Caza Energy LLC, Richard L. Chase, Robert C. Chase and Gerene Dianne Chase Ferguson will each sell a pro rata number of the total shares that may be sold pursuant to the underwriters’ over-allotment option. To our knowledge, upon the completion of this offering, each of the persons named below will have sole voting and investment power as to the shares shown, except as disclosed in this prospectus or to the extent this power may be shared with a spouse. None of the selling stockholders are broker dealers or affiliates of broker dealers. Beneficial ownership as shown in the table below has been determined in accordance with the applicable rules and regulations promulgated under the Securities Exchange Act of 1934.
104
Table of Contents
| Shares beneficially | |||||||||||||||
| Shares beneficially | owned | ||||||||||||||
| owned | Number of | after this | |||||||||||||
| prior to the offering | shares | offering(1)(2) | |||||||||||||
| Name of beneficial owner | Number | % of class | offered | Number | % of class | ||||||||||
Chase Oil Corporation(3) | 56,009,965 | ||||||||||||||
Caza Energy LLC(4)(6)(8) | 4,999,851 | ||||||||||||||
Richard L. Chase(5) | 2,504,914 | ||||||||||||||
Robert C. Chase(6) | 9,012,741 | ||||||||||||||
Gerene Dianne Chase Ferguson(7) | 1,849,007 | ||||||||||||||
Mack C. Chase(8) | 4,999,851 | ||||||||||||||
Yorktown Energy Partners V, L.P.(9) | 6,330,000 | ||||||||||||||
Yorktown Energy Partners VI, L.P.(9) | 14,995,000 | ||||||||||||||
Yale University(10) | 6,397,500 | ||||||||||||||
Timothy A. Leach(11) | 2,870,944 | ||||||||||||||
Steven L. Beal(11) | 2,870,945 | ||||||||||||||
David W. Copeland(11) | 1,299,589 | ||||||||||||||
Curt F. Kamradt(11) | 1,299,589 | ||||||||||||||
David M. Thomas III(11) | 642,835 | ||||||||||||||
E. Joseph Wright(11) | 1,299,589 | ||||||||||||||
Tucker S. Bridwell(12) | 1,449,438 | ||||||||||||||
W. Howard Keenan, Jr.(13) | 21,335,000 | ||||||||||||||
A. Wellford Tabor(14) | 10,000 | ||||||||||||||
All directors and executive officers as a group(9 persons)(11) | 33,077,929 | ||||||||||||||
| * | Less than 1%. |
| (1) | Assumes no exercise of the underwriters’ over-allotment option to purchase an aggregate of shares, granted by . If such over-allotment option is exercised in full, will beneficially own shares ( %) after the offering. | |
| (2) | Based upon an aggregate of shares to be outstanding following the completion of this offering. | |
| (3) | The address of Chase Oil Corporation is P.O. Box 1767, Artesia, NM 88211-1767. | |
| (4) | The address of Caza Energy LLC is P.O. Box 1767, Artesia, NM 88211-1767. | |
| (5) | The address of Richard Chase is P.O. Box 359, Artesia, NM 88211-0359. | |
| (6) | Robert Chase directly owns 4,012,890 shares of common stock. Robert Chase is the beneficial owner of the shares owned by Caza Energy LLC, of which Robert Chase is a Manager and therefore shares voting and investment power with respect to the shares owned by Caza Energy LLC. Robert Chase disclaims beneficial ownership in the shares held by Caza Energy LLC except to the extent of his pecuniary interest in Caza Energy LLC. The address of Robert Chase is P.O. Box 297, Artesia, NM 88211-0297. | |
| (7) | The address of Ms. Ferguson is P.O. Box 693, Artesia, NM 88211-0693. | |
| (8) | Mack Chase is the beneficial owner of the shares owned by Caza Energy LLC, of which Mack Chase is a Manager and therefore shares voting and investment power with respect to the shares owned by Caza Energy LLC. Mack Chase disclaims beneficial ownership in the shares held by Caza Energy LLC except to the extent of his pecuniary interest in Caza Energy LLC. The address of Mack Chase is P.O. Box 693, Artesia, NM 88211-0693. | |
| (9) | The address of Yorktown Energy Partners V, L.P. and Yorktown Energy Partners VI, L.P. is 410 Park Avenue, 19th Floor, New York, NY 10022. | |
| (10) | The address of Yale University is 230 Prospect, New Haven, CT 06511-2107. |
105
Table of Contents
| (11) | The number of shares beneficially owned includes the following shares that are subject to options that are currently exercisable or will become exercisable within 60 days of the date of this prospectus: |
| Shares subject | |||
| Name of beneficial owner | to options | ||
| Timothy A. Leach | 823,172 | ||
| Steven L. Beal | 823,172 | ||
| David W. Copeland | 389,464 | ||
| Curt F. Kamradt | 389,464 | ||
| David M. Thomas III | 216,335 | ||
| E. Joseph Wright | 389,464 | ||
| (12) | Includes 853,000 shares of common stock owned by the Mansfeldt Concho Partners and 586,438 shares owned by the Dian Graves Foundation. | |
| (13) | Includes 21,325,000 shares of common stock owned by Yorktown Energy Partners V, L.P. and Yorktown Energy Partners VI, L.P. W. Howard Keenan, Jr. is a member and a manager of the general partner of Yorktown Energy Partners V, L.P. and Yorktown Energy Partners VI, L.P. and holds all securities received as director compensation for the benefit of those entities. Mr. Keenan disclaims beneficial ownership of all such securities as well as those held by Yorktown Energy Partners V, L.P. and Yorktown Energy Partners VI, L.P., except to the extent of his pecuniary interest therein. | |
| (14) | Mr. Tabor is a member of Wachovia Capital Partners (“WCP”) and holds all securities received as director compensation for the benefit of WCP. Mr. Tabor disclaims beneficial ownership of all such securities as well as those held by WCP and its affiliates, except to the extent of his pecuniary interest therein. |
106
Table of Contents
Certain relationships and related party transactions
Since our inception, we have entered into the following transactions and contractual arrangements with our officers, directors and principal stockholders. Although we have not historically had formal policies and procedures regarding the review and approval of related party transactions, all transactions outside of the ordinary course of business between us and any of our officers, directors and principal stockholders were approved by our board of directors. Prior to the completion of this offering, our board of directors intends to adopt a written policy that will require our audit committee to review on an annual basis all transactions with related parties, or in which a related party has a direct or indirect interest, and to determine whether to ratify or approve the transaction after consideration of the related party’s interest in the transaction and other material facts.
Transactions with Chase Oil and its affiliates
Transition Services Agreement
We have entered into a Transition Services Agreement with Mack Energy Corporation, an affiliate of Chase Oil, whereby it provides services to the properties in Southeast New Mexico that we acquired from Chase Oil and its affiliates in the combination transaction. The Transition Services Agreement replaced our prior Contract Operator Agreement with Mack Energy that we entered into in connection with the initial closing of the combination transaction. We agreed with Mack Energy to terminate the Contract Operator Agreement in connection with the execution of the Transition Services Agreement on April 23, 2007. Under the Transition Services Agreement, Mack Energy provides field level services, including pumping, well service oversight and supervision and certain equipment for workover and recompletion services, at costs prevailing in the area of the subject properties, but not to exceed charges for comparable services by and among Mack Energy and its affiliates. Mack Energy performed substantially similar services on our behalf under the Contract Operator Agreement prior to its termination. During the year ended December 31, 2006, we paid Mack Energy approximately $10.3 million for services rendered under the Contract Operator Agreement. The Transition Services Agreement terminates upon completion of this offering and our employees along with third party contractors, if necessary, will then assume the operation of the subject properties.
Silver Oak Drilling contracts
Silver Oak Drilling, LLC, an affiliate of Chase Oil, owns and operates drilling rigs, four of which we are currently using for a substantial portion of our operations in Southeast New Mexico. During the year ended December 31, 2006, we spent approximately $13.1 million with Silver Oak Drilling for drilling services in Southeast New Mexico. We determined in January 2007 to reduce our drilling activities for the first three months of 2007. As a result, we paid $1.8 million to Silver Oak Drilling for contract drilling fees related to stacked rigs subject to daywork drilling contracts. We resumed our planned drilling activities in April 2007, and we expect to spend approximately $21 million for the year ended December 31, 2007 on exploration and development drilling in Southeast New Mexico that will be conducted by Silver Oak Drilling under drilling contracts that will terminate on August 1, 2007.
Saltwater disposal
Among the assets we acquired in the combination transaction is an undivided interest in a saltwater gathering and disposal system built by affiliates of Chase Oil to gather and dispose of
107
Table of Contents
water produced from wells located on the Chase Group Properties and other wells. Although we are the operator of the salt water gathering and disposal system, this system is being operated on our behalf by Mack Energy Corporation under the Transition Services Agreement described above. The system is owned jointly by Chase Oil, Mack Energy, Caza Energy LLC and us in undivided ownership percentages, which are to be annually redetermined as of January 1 of each year on the basis of each party’s percentage contribution of the total volume of produced water disposed of into the system during the prior calendar year. As of January 1, 2007, we owned 90% of the system and Chase Oil, Mack Energy and Caza Energy collectively owned 10% of the system. Each owner has the right to dispose of produced water into the system. Operating, repair and maintenance costs are allocated among the owners monthly on the basis of their respective system ownership interests at the time the charge is incurred. The owners have agreed and acknowledged that the system is to be owned and operated without any intent to profit, and that any third-party income attributable to the system will be allocated proportionately to the owners as a reduction of operating costs. Costs of any future expansion of the system are to be shared as agreed upon at the time. In the event that the owners cannot agree on any such allocation, the owner proposing an expansion shall have the right to construct such expansion at its cost and for its exclusive use. This agreement shall continue so long as any well located on the subject properties is utilizing the system.
Software license agreement
In order to obtain enhanced computer processing capabilities and functionality for our various business processes, as of March 1, 2006, we entered into a Software License Agreement with Enertia Software Systems, which is an affiliate of Chase Oil. We are using the software in the following software functional areas: accounting and financial reporting, well production and field data gathering, land and contracts, and payroll processing. The Software License Agreement provides for up to twenty concurrent users with the ability for us to upgrade in five concurrent user increments for a one-time license fee of $50,000 for each concurrent user increment. The license granted in the Software License Agreement can be terminated by either party by providing notice to the other party at least six months prior to the date on which the termination will be effective, which termination may not be earlier than March 1, 2007. We have paid aggregate fees to the licensor to date in the amount of $450,000, which consists of a software license fee of $300,000 and a project fee of $150,000. The project fee was to pay for the cost of conversion of the data from our previous software system to the new system. In addition to these initial fees, we became obligated to pay an annual maintenance fee to the licensor in the amount of $48,000, beginning on September 1, 2006. During the year ended December 31, 2006, we also paid to Enertia approximately $120,000 for consulting and programming services. We believe that the terms of this Software License Agreement are at least as favorable as they would have been had we contracted with an unrelated third party.
Acquisition of leasehold acreage from Caza Energy LLC
For the year ended December 31, 2006, we paid Caza Energy LLC, an affiliate of Chase Oil, approximately $2.1 million for leasehold interests in 24,579 gross (6,138 net) acres located in Eddy and Chaves Counties, New Mexico. We intend to combine a portion of these purchased leasehold interests together with other of our leasehold interests in the area to explore the horizontal Wolfcamp play, which is located along the northwestern rim of the Delaware Basin in Eddy and Chaves Counties, New Mexico. We believe that the terms of this acquisition are at least as favorable as they would have been had we acquired the interests from an unrelated third party.
108
Table of Contents
Other transactions
We also conduct business with certain companies that are affiliated with Chase Oil and Mack Energy from time to time. Robert Chase, who was a director of our company from February 27, 2006 until April 23, 2007, is an officer of these companies. Most of these companies provide us with oilfield services or supplies that we use in the ordinary course of our operations. Our business with these companies is not subject to any contracts or other commitments other than arrangements entered into at the time the services are rendered or the supplies are purchased. We are not required to purchase products or services from these companies and we are able to purchase these products and services from other vendors who are not affiliated with Chase Oil. We believe that the terms of our arrangements with these companies are at least as favorable as they would have been had we contracted with an unrelated third party. During the year ended December 31, 2006, we incurred the following expenditures with the following companies that are affiliated with Chase Oil and Mack Energy:
| Activity | Activity | ||||||||
| with vendor | with vendor | ||||||||
| prior to the | subsequent to the | Total | |||||||
| the combination | the combination | amount of | |||||||
Name of Vendor | transaction | transaction | expenditures | ||||||
| (in thousands) | |||||||||
| Alliance Drillings Fluids, LLC | $ | — | $ | 778 | $ | 778 | |||
| Arrowhead Pipe & Supply Co. | — | 13,565 | 13,565 | ||||||
| Catalyst Oilfield Services LLC | — | 930 | 930 | ||||||
| Deer Horn Aviation Ltd. Co. | 67 | 240 | 307 | ||||||
| Production Specialty Services, Inc. | 57 | 959 | 1,016 | ||||||
| Silver Oak Drilling, LLC | — | 13,097 | 13,097 | ||||||
| Total of oilfield service and supply vendors | $ | 124 | $ | 29,569 | $ | 29,693 | |||
Overriding royalty interests
Prior to the formation of Concho Equity Holdings Corp., Messrs. Leach, Beal, Copeland, Kamradt and Wright acquired working interests in 120 undeveloped acres located in Lea County, New Mexico. In connection with the formation of Concho Equity Holdings Corp., these working interests were sold to that company in November 2004 for $120,000 in the aggregate, and Messrs. Leach, Beal, Copeland, Kamradt and Wright each retained a 0.25% overriding royalty interest in any production attributable to this acreage. We have not drilled any wells that are subject to the overriding royalty interest and, therefore, no payments have been made in connection with these royalty interests.
In April 2005, we acquired certain working interests in 46,861 gross (26,908 net) acres located in Culberson County, Texas from an entity partially owned by Mr. Thomas. In connection with this acquisition, such entity retained a 2% overriding royalty interest in the acquired properties, which overriding royalty interest is now owned equally by Mr. Thomas and another employee of our company. Mr. Thomas became an executive officer of our company immediately following the acquisition.
Certain members of the Chase Group own overriding royalty interests in some of the properties we operate that were acquired in the combination transaction. For the year ended December 31, 2006, the aggregate amount of royalty payments made was $816,000.
109
Table of Contents
Executive officer promissory notes
In connection with the capitalization of Concho Equity Holdings Corp. at various dates through February 23, 2006, that company received limited recourse promissory notes from each of our executive officers as partial payment for equity securities issued to such executive officers. Interest accrued and compounded annually on the unpaid principal amount of the promissory notes at the rate of 6.0% per annum. Interest was not required to be paid on these promissory notes until the earlier of prepayment of the promissory notes or maturity of the promissory notes. No principal or interest was paid by our executive officers on these promissory notes until April 23, 2007, when our executive officers repaid in full the aggregate principal amount and accrued interest on the promissory notes. The following table sets forth for each of our executive officers the aggregate amount of the outstanding principal and accrued interest as of December 31, 2006 and as of April 23, 2007.
| As of December 31, 2006 | As of April 23, 2007 | ||||||||||||
| Aggregate | Aggregate | ||||||||||||
| principal | Accrued | principal | Accrued | ||||||||||
Name of executive officer | amount | interest | amount | interest | |||||||||
| Timothy A. Leach | $ | 2,392,665 | $ | 224,953 | $ | 2,392,665 | $ | 268,091 | |||||
| Steven L. Beal | 2,392,665 | 224,953 | 2,392,665 | 268,091 | |||||||||
| David W. Copeland | 1,063,415 | 99,980 | 1,063,415 | 119,153 | |||||||||
| Curt F. Kamradt | 1,063,415 | 99,978 | 1,063,415 | 119,151 | |||||||||
| David M. Thomas III | 1,450,100 | 117,600 | 1,450,100 | 143,745 | |||||||||
| E. Joseph Wright | 1,063,415 | 99,980 | 1,063,415 | 119,153 | |||||||||
Escrow agreement
In connection with the combination transaction, 861,501 shares of our common stock were deposited by certain of our stockholders with an escrow agent subject to an Escrow Agreement dated February 27, 2006. The escrow agent has been instructed to deliver the escrowed shares to us for reissuance to Messrs. Leach, Beal, Copeland, Kamradt and Wright if, prior to August 26, 2007, Concho Resources is sold in a business combination such that our common stock is valued at a price equal to or greater than $14.00 per share. If this condition occurs, we will be required to record approximately $4.8 million of compensation expense when the condition is met. If this condition does not occur, the escrow agent will distribute the escrowed shares to the registered owners thereof that originally deposited the shares.
Wachovia Capital Partners
Mr. Tabor, one of our directors, is a member of Wachovia Capital Partners, the merchant banking arm of Wachovia Corporation. An affiliate of Wachovia Capital Partners and Wachovia Corporation is one of our stockholders but is not a selling stockholder in this offering. Wachovia Capital Markets LLC, an affiliate of Wachovia Corporation, is an underwriter in this offering. Please read “Underwriting.” Wachovia Bank, National Association, an affiliate of Wachovia Corporation, is a lender under our revolving credit facility. A portion of the proceeds from this offering may be used to repay amounts outstanding under our revolving credit facility. Please read “Use of proceeds” and “Underwriting.”
110
Table of Contents
Registration rights agreement
Demand registration rights
In connection with the combination transaction, we entered into a registration rights agreement with our stockholders, including the members of the Chase Group and the former stockholders of Concho Equity Holdings Corp. According to the registration rights agreement, at the earlier of the closing of an underwritten public offering of our common stock or nine months from the closing of the combination transaction, holders of either 20% of the aggregate shares held by the Chase Group or 20% of the aggregate shares held by the former stockholders of Concho Equity Holdings Corp. may request in writing that we register their shares by filing a registration statement under the Securities Act, so long as the anticipated aggregate offering price, net of underwriting discounts and commissions, exceeds $50 million.
Piggy-back registration rights
If we propose to file a registration statement under the Securities Act relating to an offering of our common stock (other than on a Form S-4 or a Form S-8), upon the written request of holders of registrable securities, we will use our commercially reasonable efforts to include in such registration, and any related underwriting, all of the registrable securities requested to be included, subject to customary cutback provisions. There is no limit to the number of these “piggy-back” registrations in which these holders may request their shares to be included.
Registration procedures and expenses
We generally will bear the registration expenses incurred in connection with any registration, including all registration, filing and qualification fees, printing and accounting fees, but excluding underwriting discounts and commissions. We have agreed to indemnify these stockholders against certain liabilities, including liabilities under the Securities Act, in connection with any registration effected under the registration rights agreement. We are not obligated to effect any registration more than one time in any six month period and these registration rights terminate 10 years after the date of closing of this offering.
111
Table of Contents
Description of capital stock
Prior to the closing of this offering, Concho Resources Inc. will amend and restate its certificate of incorporation and by-laws to provide for a for reverse stock split in the form of a stock dividend and add certain other provisions as described below. The information in this section describes our amended and restated certificate of incorporation and by-laws that will be in effect following the closing of this offering and assumes that the reverse stock split has taken place.
The following summary of the capital stock and amended and restated certificate of incorporation and by-laws of Concho Resources Inc. does not purport to be complete and is qualified in its entirety by reference to the provisions of applicable law and to our amended and restated certificate of incorporation and by-laws, forms of which are filed as exhibits to the registration statement of which this prospectus is a part.
The authorized capital stock of Concho Resources Inc. consists of 300,000,000 shares of common stock, $.001 par value per share, and 10,000,000 shares of preferred stock, $.001 par value per share.
Common stock
We currently have 117,657,465 shares of voting common stock outstanding, including 424,390 shares of restricted stock. The shares of restricted stock have voting rights, rights to receive dividends and are subject to certain forfeiture restrictions. After this offering, we will have shares of common stock outstanding. As of April 23, 2007, there were 117 holders of our common stock.
Holders of our common stock will be entitled to one vote for each share held on all matters submitted to a vote of stockholders and do not have cumulative voting rights. Accordingly, holders of a majority of the shares of our common stock entitled to vote in any election of directors may elect all of the directors standing for election.
Holders of our common stock are entitled to receive proportionately any dividends if and when such dividends are declared by our board of directors, subject to any preferential dividend rights of preferred stock that may be outstanding at the time such dividends are declared. Upon the liquidation, dissolution or winding up of our company, the holders of our common stock are entitled to receive ratably our net assets available after the payment of all debts and other liabilities and subject to the prior rights of any outstanding preferred stock. Holders of our common stock have no preemptive, subscription, redemption or conversion rights. The rights, preferences and privileges of holders of our common stock are subject to, and may be adversely affected by, the rights of the holders of shares of any series of preferred stock that we may designate and issue in the future.
There are no redemption or sinking fund provisions applicable to our common stock. All outstanding shares of our common stock are fully paid and non-assessable.
We intend to list the shares of common stock sold in this offering on the NYSE under the symbol “CXO.”
Preferred stock
Under the terms of our amended and restated certificate of incorporation, our board of directors will be authorized to designate and issue shares of preferred stock in one or more
112
Table of Contents
series without further vote or action by our shareholders. Our board of directors has the discretion to determine the rights, preferences, privileges and restrictions, including voting rights, dividend rights, conversion rights, redemption privileges and liquidation preferences, of each series of preferred stock. It is not possible to state the actual effect of the issuance of any shares of preferred stock upon the rights of holders of the common stock until the board of directors determines the specific rights of the holders of the preferred stock. However, these effects might include:
| • | restricting dividends on the common stock; | |
| • | diluting the voting power of the common stock; | |
| • | impairing the liquidation rights of the common stock; and | |
| • | delaying or preventing a change in control of our company. |
We currently have no shares of preferred stock outstanding and we have no present plans to issue any shares of preferred stock.
Anti-takeover provisions of our certificate of incorporation and bylaws
Our certificate of incorporation and bylaws contain several provisions that could delay or make more difficult the acquisition of us through a hostile tender offer, open market purchases, proxy contest, merger or other takeover attempt that a stockholder might consider in his or her best interest, including those attempts that might result in a premium over the market price of our common stock.
Written consent of stockholders
Our certificate of incorporation and bylaws provide that any action required or permitted to be taken by our stockholders must be taken at a duly called meeting of stockholders and not by written consent.
Special meetings of stockholders
Subject to the rights of the holders of any series of preferred stock, our bylaws provide that special meetings of the stockholders may only be called by the chairman of the board of directors or by the resolution of our board of directors approved by a majority of the total number of authorized directors. No business other than that stated in our notice may be transacted at any special meeting.
Advance notice procedure for director nominations and stockholder proposals
Our bylaws provide that adequate notice must be given to nominate candidates for election as directors or to make proposals for consideration at annual meetings of our stockholders. For nominations or other business to be properly brought before an annual meeting by a stockholder, the stockholder must have delivered a written notice to the Secretary of our company at our principal executive offices not earlier than the close of business on the 120th calendar day prior to the first anniversary of the date of the preceding year’s annual meeting nor later than the close of business on the 90th calendar day prior to the first anniversary of the date of the preceding year’s annual meeting; provided, however, that in the event that the date of the annual meeting is more than 30 calendar days before or more than 70 calendar days after such anniversary date, notice by the stockholder to be timely must be so delivered not earlier than
113
Table of Contents
the close of business on the 120th calendar day prior to such annual meeting nor later than the close of business on the later of the 90th calendar day prior to such annual meeting or the 10th calendar day following the calendar day on which public announcement, if any, of the date of such meeting is first made by us.
Nominations of persons for election to our board of directors may be made at a special meeting of stockholders at which directors are to be elected pursuant to our notice of meeting (i) by or at the direction of our board of directors, or (ii) by any stockholder of our company who is a stockholder of record at the time of the giving of notice of the meeting, who is entitled to vote at the meeting and who complies with the notice procedures set forth in our bylaws. In the event we call a special meeting of stockholders for the purpose of electing one or more directors to our board of directors, any stockholder may nominate a person or persons (as the case may be) for election to such position(s) if the stockholder provides written notice to the Secretary of our company at our principal executive offices not earlier than the close of business on the 120th calendar day prior to such special meeting, nor later than the close of business on the later of the 90th calendar day prior to such special meeting or the 10th calendar day following the day on which public announcement, if any, is first made of the date of the special meeting and of the nominees proposed by our board of directors to be elected at such meeting.
These procedures may operate to limit the ability of stockholders to bring business before a stockholders meeting, including the nomination of directors and the consideration of any transaction that could result in a change in control and that may result in a premium to our stockholders.
Classified board
Our certificate of incorporation divides our directors into three classes serving staggered three-year terms. As a result, stockholders will elect approximately one-third of the board of directors each year. This provision, when coupled with the provision of our restated certificate of incorporation authorizing only the board of directors to fill vacant or newly created directorships or increase the size of the board of directors and the provision providing that directors may only be removed for cause, may deter a stockholder from gaining control of our board of directors by removing incumbent directors or increasing the number of directorships and simultaneously filling the vacancies or newly created directorships with its own nominees.
Authorized capital stock
Our certificate of incorporation contains provisions that the authorized but unissued shares of common stock and preferred stock are available for future issuance without shareholder approval, subject to various limitations imposed by the New York Stock Exchange. These additional shares may be utilized for a variety of corporate purposes, including future public offerings to raise additional capital, corporate acquisitions and employee benefit plans. The existence of authorized but unissued shares of common stock and preferred stock could make it more difficult or discourage an attempt to obtain control of our company by means of a proxy contest, tender offer, merger or otherwise.
Amendment of the Bylaws
Under Delaware law, the power to adopt, amend or repeal bylaws is conferred upon the stockholders. A corporation may, however, in its certificate of incorporation also confer upon
114
Table of Contents
the board of directors the power to adopt, amend or repeal its bylaws. Our charter and bylaws grant our board the power to adopt, amend and repeal our bylaws on the affirmative vote of a majority of the directors then in office. Our stockholders may adopt, amend or repeal our bylaws but only at any regular or special meeting of stockholders by the holders of not less than 662/3% of the voting power of all outstanding voting stock.
Renouncement of business opportunities
Certain of our stockholders, including all of the members of our board of directors other than Messrs. Leach and Beal, who received shares of common stock in the combination transaction may from time to time have investments in other exploration and production companies that may compete with us. Our certificate of incorporation and our Business Opportunities Agreement provide that so long as any of the parties to the Business Opportunities Agreement, which we refer to as the “Designated Parties,” is serving as a member of our board of directors, we renounce any interest or expectancy in any business opportunity, transaction or other matter in and that involves any aspect of the oil and gas exploration, exploitation, development and production business, other than:
| • | any business opportunity that is brought to the attention of a Designated Party solely in such person’s capacity as a director or officer of our company and with respect to which, at the time of such presentment, no other Designated Party has independently received notice or otherwise identified such opportunity; or |
| • | any business opportunity that is identified by a Designated Party solely through the disclosure of information by or on behalf of us. |
Thus, for example, a Designated Party may pursue opportunities in the oil and gas exploration and production industry for their own account. Our certificate of incorporation provides that the Designated Parties have no obligation to offer such opportunities to us. We are not prohibited from pursuing any business opportunity with respect to which we have renounced any interest.
Limitation of liability of directors
Our certificate of incorporation provides that no director shall be personally liable to us or our stockholders for monetary damages for breach of fiduciary duty as a director, except for liability as follows:
| • | for any breach of the director’s duty of loyalty to us or our stockholders; |
| • | for acts or omissions not in good faith or which involve intentional misconduct or a knowing violation of laws; |
| • | for unlawful payment of a dividend or unlawful stock purchase or stock redemption; and |
| • | for any transaction from which the director derived an improper personal benefit. |
The effect of these provisions is to eliminate our rights and our stockholders’ rights, through stockholders’ derivative suits on our behalf, to recover monetary damages against a director for a breach of fiduciary duty as a director, including breaches resulting from grossly negligent behavior, except in the situations described above.
115
Table of Contents
Delaware takeover statute
We are subject to Section 203 of the Delaware General Corporation Law, which prohibits a Delaware corporation from engaging in any business combination with any interested stockholder for a period of three years after the date that such stockholder became an interested stockholder, with the following exceptions:
| • | before such date, the board of directors of the corporation approved either the business combination or the transaction that resulted in the stockholder becoming an interested holder; |
| • | upon completion of the transaction that resulted in the stockholder becoming an interested stockholder, the interested stockholder owned at least 85% of the voting stock of the corporation outstanding at the time the transaction began, excluding for purposes of determining the voting stock outstanding (but not the outstanding voting stock owned by the interested stockholder) those shares owned (1) by persons who are directors and also officers and (2) employee stock plans in which employee participants do not have the right to determine confidentially whether shares held subject to the plan will be tendered in a tender or exchange offer; or |
| • | on or after such date, the business combination is approved by the board of directors and authorized at an annual or special meeting of the stockholders, and not by written consent, by the affirmative vote of at least 662/3% of the outstanding voting stock that is not owned by the interested stockholder. |
In general, Section 203 defines business combination to include the following:
| • | any merger or consolidation involving the corporation and the interested stockholder; |
| • | any sale, transfer, pledge or other disposition (in one transaction or a series of transactions) of 10% or more of the assets of the corporation involving the interested stockholder; |
| • | subject to certain exceptions, any transaction that results in the issuance or transfer by the corporation of any stock of the corporation to the interested stockholder; |
| • | any transaction involving the corporation that has the effect of increasing the proportionate share of the stock or any class or series of the corporation beneficially owned by the interested stockholder; or |
| • | the receipt by the interested stockholder of the benefit of any loss, advances, guarantees, pledges or other financial benefits by or through the corporation. |
In general, Section 203 defines an “interested stockholder” as an entity or person who, together with the person’s affiliates and associates, beneficially owns, or within three years prior to the time of determination of interested stockholder status did own, 15% or more of the outstanding voting stock of the corporation.
116
Table of Contents
Registration rights
In connection with the closing of the combination transaction, we entered into a registration rights agreement with our principal stockholders covering all of the shares of common stock owned by our principal stockholders after the closing of this offering. For a description of the registration rights agreement, see “Certain relationships and related party transactions—Registration rights agreement.”
Transfer agent and registrar
The transfer agent and registrar for our common stock is .
117
Table of Contents
Shares eligible for future sale
General
Prior to this offering, there has been no public market for our common stock. Sales of substantial amounts of common stock in the open market, including shares issuable upon exercise of outstanding options, or the perception that those sales could occur, could adversely affect prevailing market prices and could impair our ability to raise capital in the future through the sale of our equity securities.
Upon closing of this offering, we will have outstanding shares of our common stock (which includes shares of unvested restricted stock) and outstanding options to purchase shares of our common stock. All of the shares sold in this offering, or the shares if the underwriters exercise their option to purchase additional shares in full, will be freely tradable without restriction under the Securities Act, except for any shares purchased by one of our “affiliates,” as that term is defined under Rule 144 under the Securities Act. All of the shares outstanding other than the shares sold in this offering (a total of shares, or shares if the underwriters exercise their option to purchase additional shares in full) will be “restricted securities” within the meaning of Rule 144 under the Securities Act and may not be sold other than through registration under the Securities Act or pursuant to an exemption from registration, subject to the restrictions on transfer contained in thelock-up agreements described below and in “Underwriting.”
Persons who may be deemed affiliates generally include individuals or entities that control, are controlled by or are under common control with us and may include our officers, directors and significant stockholders.
Lock-up agreements
In connection with this offering, we, our executive officers, our directors and certain stockholders (including the selling stockholders), have agreed that, during the period beginning from the date of this prospectus and continuing to and including the date 180 days after the date of this prospectus, neither we nor any of them will, directly or indirectly, offer, sell, offer to sell, contract to sell or otherwise dispose of any shares of our common stock without the prior written consent of J.P. Morgan Securities Inc. and Banc of America Securities LLC, with limited exceptions as described under “Underwriting.” Thislock-up will not apply to approximately shares that are currently held by our employees or issuable upon the exercise of options outstanding under our long-term incentive plan and up to an additional shares covered by grants that we are permitted to award under our existing long-term incentive plan during the180-daylock-up period. See “Underwriting” for a description of theselock-up arrangements. Upon the expiration of theselock-up agreements, shares, or shares if the underwriters exercise their option to purchase additional shares in full, will be eligible for sale in the public market under Rule 144 of the Securities Act, subject to volume limitations and other restrictions contained in Rule 144.
Rule 144
In general, under Rule 144 as currently in effect, beginning 90 days after the date of this prospectus, a person, or persons whose shares are aggregated, who has beneficially owned
118
Table of Contents
restricted shares for at least one year, including the holding period of any prior owner (other than an affiliate of ours) would be entitled to sell within any three-month period a number of shares that does not exceed the greater of:
| • | 1% of the number of shares of common stock then outstanding; or |
| • | the average weekly reported trading volume of the common stock on the New York Stock Exchange during the four calendar weeks preceding the filing of a Form 144 with respect to the sale. |
Sales under Rule 144 also are subject to manner of sale provisions and notice requirements and to the availability of current public information about us.
Rule 144(k)
Under Rule 144(k), a person who is not deemed to have been an affiliate of ours at any time during the three months preceding a sale and who has beneficially owned the shares proposed to be sold for at least two years, including the holding period of any prior owner (other than an affiliate of ours) is entitled to sell those shares without complying with the manner of sale, public information, volume limitation or notice provisions of Rule 144.
Registration rights
In connection with the closing of the combination transaction, we entered into a registration rights agreement with certain of our stockholders covering shares of common stock owned by such stockholders. For a description of the registration rights agreement, see “Certain relationships and related party transactions—Registration rights agreement.”
119
Table of Contents
Material U.S. federal tax consequences fornon-U.S. holders of our common stock
The following is a general discussion of the material U.S. federal income and estate tax consequences tonon-U.S. Holders with respect to the acquisition, ownership and disposition of our common stock. A“Non-U.S. Holder” for purposes of this discussion is any beneficial owner of our common stock who acquires such stock for cash pursuant to the terms of this prospectus and who is not:
| • | an individual citizen or resident of the United States, including an alien individual who is a lawful permanent resident of the United States or meets the “substantial presence” test under section 7701(b)(3) of the Internal Revenue Code of 1986, as amended (the “Code”); |
| • | a corporation (or an entity treated as a corporation for U.S. federal income tax purposes) created or organized in the United States or under the laws of the United States, any state thereof, or the District of Columbia; |
| • | a partnership (or an entity treated as a partnership for U.S. federal income tax purposes); |
| • | an estate, the income of which is subject to U.S. federal income tax regardless of its source; or |
| • | a trust, if a U.S. court can exercise primary supervision over the administration of the trust and one or more U.S. persons can control all substantial decisions of the trust, or certain other trusts that have a valid election to be treated as a U.S. person pursuant to the applicable Treasury Regulations. |
This discussion is based on current provisions of the Code, final, temporary and proposed Treasury Regulations, judicial opinions, published positions of the Internal Revenue Service (the “IRS”) and all other applicable administrative and judicial authorities, all of which are subject to change, possibly with retroactive effect. This discussion does not address all aspects of U.S. federal income and estate taxation or any aspects of state, local, ornon-U.S. taxation, nor does it consider any specific facts or circumstances that may apply to particularNon-U.S. Holders that may be subject to special treatment under the U.S. federal income tax laws including, but not limited to, insurance companies, persons holding our common stock as part of a hedging or conversion transaction or a straddle or other risk-reduction transaction, tax-exempt organizations, pass-through entities, banks or financial institutions, brokers, dealers in securities, and U.S. expatriates. If a partnership or other entity treated as a partnership for U.S. federal income tax purposes is a beneficial owner of our common stock, the tax treatment of a partner in the partnership will generally depend upon the status of the partner and the activities of the partnership. This discussion assumes that theNon-U.S. Holder will hold our common stock as a capital asset, which generally is property held for investment.
Prospective investors are urged to consult their tax advisors regarding the U.S. federal, state and local, andnon-U.S. income and other tax considerations of acquiring, holding and disposing of shares of common stock.
120
Table of Contents
Dividends
We do not anticipate paying any dividends on our common stock. Nonetheless, if any such dividends were paid, we would be required to withhold tax from the amount of any dividend paid to aNon-U.S. Holder to the extent paid out of our current or accumulated earnings and profits, as determined under U.S. federal income tax principles equal to 30% of the gross amount of the dividend, or a lower rate prescribed by an applicable income tax treaty, unless the dividend is effectively connected with a trade or business carried on by theNon-U.S. Holder within the United States. In addition, because we expect to be a “United States real property holding corporation” as defined below, we may be required to withhold tax from the amount of any dividend paid to a Non-U.S. Holder even to the extent the amount thereof exceeds our current and accumulated earnings and profits. Under applicable Treasury regulations, aNon-U.S. Holder will be required to satisfy certain certification requirements, generally on IRSForm W-8BEN, or any successor form, directly or through an intermediary, in order to claim a reduced rate of withholding under an applicable income tax treaty. If tax is withheld in an amount in excess of the amount applicable under an income tax treaty, a refund of the excess amount may generally be obtained by filing an appropriate claim for refund with the IRS.
Dividends that are effectively connected with a U.S. trade or business (and, where an income tax treaty applies, are attributable to a U.S. permanent establishment of theNon-U.S. Holder) generally will not be subject to U.S. withholding tax if theNon-U.S. Holder files the properly completed required forms, such as IRSForm W-8ECI, or any successor form, with the payor of the dividend, but instead generally will be subject to U.S. federal income tax on a net income basis in the same manner as if theNon-U.S. Holder were a resident of the United States unless an income tax treaty provides otherwise. A corporateNon-U.S. Holder that receives effectively connected dividends may be subject to an additional branch profits tax at a rate of 30%, or a lower rate prescribed by an applicable income tax treaty, on its “effectively connected earnings and profits,” subject to adjustments.
Gain on sale or other disposition of common stock
In general, aNon-U.S. Holder will not be subject to U.S. federal income tax on any gain realized upon the sale or other taxable disposition of the Non-U.S Holder’s shares of common stock unless:
| • | the gain is effectively connected with a trade or business carried on by theNon-U.S. Holder within the United States (and, where an income tax treaty applies, is attributable to a U.S. permanent establishment of theNon-U.S. Holder); |
| • | theNon-U.S. Holder is an individual who is present in the United States for 183 days or more in the taxable year of disposition and certain other conditions are met; or |
| • | we are or have been a “United States real property holding corporation” for U.S. federal income tax purposes during specified periods. |
Except as set forth in the next paragraph, aNon-U.S. Holder who recognizes gain from the disposition of our common stock meeting the description set forth in the first or third bullet point above will be generally subject to tax on a net basis under regular graduated U.S. federal income tax rates and, if aNon-U.S. Holder described in the first bullet point is a corporation, it may also be subject to the branch profits tax discussed above. ANon-U.S. Holder described in
121
Table of Contents
the second bullet point above will be subject to a 30% tax on the gain derived from the sale, which may be offset by U.S. source capital losses.
Because of the oil and natural gas properties and other real property assets we own, we expect that we are and will remain a United States real property holding corporation. The determination of whether we are a United States real property holding corporation at any given point in time, however, is fact specific and depends on the composition of our assets at that time. Generally, a corporation is a United States real property holding corporation if the fair market value of its “United States real property interests,” as defined in the Internal Revenue Code and applicable regulations, equals or exceeds 50% of the aggregate fair market value of its worldwide real property interests and its other assets used or held for use in a trade or business. Even if we are or have been a United States real property holding corporation, provided our common stock is regularly traded on an established securities market (such as the New York Stock Exchange), aNon-U.S. Holder will not be subject to U.S. federal income tax on the disposition of our common stock unless such holder (actually or constructively) holds or held (at anytime during the shorter of the five year period preceding the date of disposition or the holder’s entire holding period) more than five percent of our common stock. If our common stock is not so regularly traded, allNon-U.S. Holders would be subject to U.S. federal income tax on disposition of our common stock in the event we are or have been during relevant times a United States real property holding corporation.
You are encouraged to consult your own tax advisor regarding our possible status as a United States real property holding corporation and its possible consequences in your particular circumstances.
Information reporting and backup withholding
Generally, we must report annually to the IRS the amount of dividends paid, the name and address of the recipient, and the amount, if any, of tax withheld. A similar report is sent to the recipient. These information reporting requirements apply even if withholding was not required because the dividends were effectively connected dividends or withholding was reduced by an applicable income tax treaty. Under income tax treaties or other agreements, the IRS may make its reports available to tax authorities in the recipient’s country of residence. In addition, dividends we pay generally will be subject to backup withholding, currently at a rate of 28% of the gross proceeds, unless the recipient certifies as to itsnon-U.S. status, which certification generally may be made on IRSForm W-8BEN, or otherwise establishes an exemption.
Proceeds from the disposition of common stock effected by or through a U.S. office of a broker will be subject to information reporting and backup withholding unless the person making the disposition certifies as to itsnon-U.S. status or otherwise establishes an exemption. Generally, U.S. information reporting and backup withholding will not apply to a payment of disposition proceeds if the transaction is effected outside the United States by or through anon-U.S. office. However, exceptions apply in the event the broker has certain connections to the United States.
Backup withholding is not an additional tax. Rather, the amount of tax withheld is applied as a credit to the U.S. federal income tax liability of persons subject to backup withholding. If backup withholding results in an overpayment of U.S. federal income taxes, a refund may be obtained, provided the required documents are timely filed with the IRS.
122
Table of Contents
Estate tax
Our common stock owned or treated as owned by an individual who is not a citizen or resident of the United States (as specifically defined for U.S. federal estate tax purposes) at the time of death will be includible in the individual’s gross estate for U.S. federal estate tax purposes, unless an applicable estate tax treaty provides otherwise.
The preceding discussion of material U.S. federal income tax considerations for non-U.S. holders of our common stock is for general information only and it is not tax advice. Each prospective investor should consult its own tax advisor regarding the particular U.S. federal, state, local and non-U.S. tax consequences of acquisition, ownership and disposition of our common stock, including the consequences of any proposed change in applicable laws.
123
Table of Contents
Underwriting
J.P. Morgan Securities Inc. and Banc of America Securities LLC are acting as joint book-runners and joint lead managers, Lehman Brothers Inc. is acting as joint lead manager and BNP Paribas Securities Corp., Merrill Lynch, Pierce, Fenner & Smith Incorporated, UBS Securities LLC and Wachovia Capital Markets, LLC are acting as co-managers for this offering.
We, the selling stockholders and the underwriters named below have entered into an underwriting agreement covering the common stock to be sold in this offering. Each underwriter has severally agreed to purchase, and we and the selling stockholders have agreed to sell to each underwriter, the number of shares of common stock set forth opposite its name in the following table.
| Name | Number of shares | ||
| J.P. Morgan Securities Inc. | |||
| Banc of America Securities LLC | |||
| Lehman Brothers Inc. | |||
| BNP Paribas Securities Corp. | |||
| Merrill Lynch, Pierce, Fenner & Smith Incorporated | |||
| UBS Securities LLC | |||
| Wachovia Capital Markets, LLC | |||
| Total | |||
The underwriting agreement provides that if the underwriters take any of the shares presented in the table above, then they must take all of the shares. No underwriter is obligated to take any shares allocated to a defaulting underwriter except under limited circumstances. The underwriting agreement provides that the obligations of the underwriters are subject to certain conditions precedent, including the absence of any material adverse change in our business and the receipt of certain certificates, opinions and letters from us, our counsel and our independent auditors.
The underwriters are offering the shares of common stock, subject to the prior sale of shares, and when, as and if such shares are delivered to and accepted by them. The underwriters will initially offer to sell shares to the public at the initial public offering price shown on the front cover page of this prospectus. The underwriters may sell shares to securities dealers at a discount of up to $ per share from the initial public offering price. Any such securities dealers may resell shares to certain other brokers or dealers at a discount of up to $ per share from the initial public offering price. After the initial public offering, the underwriters may vary the public offering price and other selling terms.
If the underwriters sell more shares than the total number shown in the table above, the underwriters have the option to buy up to an additional shares of common stock from Chase Oil Corporation, Caza Energy LLC, Richard L. Chase, Robert C. Chase and Gerene Dianne Chase Ferguson to cover such sales. They may exercise this option during the30-day period from the date of this prospectus. If any shares are purchased under this option, the underwriters will purchase shares in approximately the same proportion as shown in the table above. If any
124
Table of Contents
additional shares of common stock are purchased, the underwriters will offer the additional shares on the same terms as those on which the shares are being offered.
The following table shows the per share and total underwriting discounts that we and the selling stockholders will pay to the underwriters. These amounts are shown assuming both no exercise and full exercise of the underwriters’ option to purchase additional shares.
| Paid for by | Paid for by | |||||||||||||||
| Concho Resources Inc. | selling stockholders | |||||||||||||||
| Without | With full | Without | With full | |||||||||||||
| overallotment | overallotment | overallotment | overallotment | |||||||||||||
| exercise | exercise | exercise | exercise | |||||||||||||
| Per share | $ | $ | $ | $ | ||||||||||||
| Total | $ | $ | $ | $ | ||||||||||||
The underwriters have advised us that they may make short sales of our common stock in connection with this offering, resulting in the sale by the underwriters of a greater number of shares than they are required to purchase pursuant to the underwriting agreement. The short position resulting from those short sales will be deemed a “covered” short position to the extent that it does not exceed the shares subject to the underwriters’ overallotment option and will be deemed a ”naked” short position to the extent that it exceeds that number. A naked short position is more likely to be created if the underwriters are concerned that there may be downward pressure on the trading price of the common stock in the open market that could adversely affect investors who purchase shares in this offering. The underwriters may reduce or close out their covered short position either by exercising the overallotment option or by purchasing shares in the open market. In determining which of these alternatives to pursue, the underwriters will consider the price at which shares are available for purchase in the open market as compared to the price at which they may purchase shares through the overallotment option. Any “naked” short position will be closed out by purchasing shares in the open market. Similar to the other stabilizing transactions described below, open market purchases made by the underwriters to cover all or a portion of their short position may have the effect of preventing or retarding a decline in the market price of our common stock following this offering. As a result, our common stock may trade at a price that is higher than the price that otherwise might prevail in the open market.
The underwriters have advised us that, pursuant to Regulation M under the Securities Exchange Act of 1934, they may engage in transactions, including stabilizing bids or the imposition of penalty bids, that may have the effect of stabilizing or maintaining the market price of the shares of common stock at a level above that which might otherwise prevail in the open market. A “stabilizing bid” is a bid for or the purchase of shares of common stock on behalf of the underwriters for the purpose of fixing or maintaining the price of the common stock. A “penalty bid” is an arrangement permitting the underwriters to claim the selling concession otherwise accruing to an underwriter or syndicate member in connection with the offering if the common stock originally sold by that underwriter or syndicate member is purchased by the underwriters in the open market pursuant to a stabilizing bid or to cover all or part of a syndicate short position. The underwriters have advised us that stabilizing bids and open market purchases may be effected on the New York Stock Exchange, in theover-the-counter market or otherwise and, if commenced, may be discontinued at any time.
One or more of the underwriters may facilitate the marketing of this offering online directly or through one of its affiliates. In those cases, prospective investors may view offering terms and a
125
Table of Contents
prospectus online and, depending upon the particular underwriter, place orders online or through their financial advisor.
We and the selling stockholders estimate that our total expenses for this offering, excluding underwriting discounts, will be approximately $ .
We and the selling stockholders have agreed to indemnify the underwriters against certain liabilities, including liabilities under the Securities Act.
We, our executive officers and directors, the selling stockholders and certain significant holders of our outstanding common stock and common stock equivalents have agreed that, during the period beginning from the date of this prospectus and continuing to and including the date 180 days after the date of this prospectus, none of us or them will, directly or indirectly, offer, sell, offer to sell, contract to sell or otherwise dispose of any shares of our common stock without the prior written consent of J.P. Morgan Securities Inc. and Banc of America Securities LLC, except in limited circumstances.
We may issue shares of common stock or securities convertible into or exchangeable or exercisable for shares of common stock for the benefit of our employees, directors and officers under benefit plans described in this prospectus.
The underwriters have informed us that they do not intend sales to discretionary accounts to exceed 5% of the total number of shares of our common stock offered by them and that no sales to discretionary accounts may be made without prior written approval of the customer.
We intend to apply to list our common stock on the New York Stock Exchange under the symbol “CXO.” The underwriters intend to sell shares of our common stock to a minimum of 2,000 beneficial owners in lots of 100 or more so as to meet the distribution requirements of this listing.
There has been no public market for the common stock prior to this offering. We, the selling stockholders and the underwriters will negotiate the initial public offering price. In determining the initial public offering price, we, the selling stockholders and the underwriters expect to consider a number of factors in addition to prevailing market conditions, including:
| • | the information set forth in this prospectus and otherwise available to the underwriters; |
| • | the history of and prospects for our industry; |
| • | an assessment of our management; |
| • | our present operations; |
| • | our historical results of operations; |
| • | the trend of our revenues and earnings; |
| • | our earnings prospects; |
| • | the general condition of the securities markets at the time of this offering; |
| • | the recent market prices of, and demand for, publicly traded common stock of generally comparable companies; and |
| • | other factors deemed relevant by the underwriters, the selling stockholders and us. |
We, the selling stockholders and the underwriters will consider these and other relevant factors in relation to the price of similar securities of generally comparable companies. Neither we, the selling stockholders nor the underwriters can assure investors that an active trading market will
126
Table of Contents
develop for the common stock, or that the common stock will trade in the public market at or above the initial public offering price.
Affiliates of J.P. Morgan Securities Inc., Banc of America Securities LLC and BNP Paribas Securities Corp. may receive in excess of 10% of the net proceeds from this offering depending on which portion of our indebtedness we decide to repay with the proceeds of this offering. See “Use of proceeds.” According to Rule 2720 of the National Association of Securities Dealers, Inc.’s (“NASD”) Conduct Rules, the offering must comply with the requirements of Rule 2720 of the NASD Conduct Rules. That rule requires that the initial public offering price can be no higher than that recommended by a “qualified independent underwriter,” as defined by the NASD. In view of J.P. Morgan Securities Inc.’s, Banc of America Securities LLC’s and BNP Paribas Securities Corp.’s relationship with us, the offering is being conducted in accordance with the rules of the NASD, and UBS Securities LLC will serve in the capacity of “qualified independent underwriter” and will perform due diligence investigations and review and participate in the preparation of the registration statement of which this prospectus forms a part. We have agreed to reimburse UBS Securities LLC for its expenses, if any, incurred as a result of its engagement as qualified independent underwriter.
From time to time in the ordinary course of their respective businesses, certain of the underwriters and their affiliates perform various financial advisory, investment banking and commercial banking services from time to time for us and our affiliates. For example, certain affiliates of the underwriters to this offering are lenders under our revolving credit facility. JPMorgan Chase Bank, N.A., an affiliate of J.P. Morgan Securities Inc., is the administrative agent, collateral agent and a lender under our revolving credit facility. In addition, each of Banc of America Securities LLC, BNP Paribas Securities Corp. and Wachovia Capital Markets, LLC has an affiliate that is a lenderand/or agent under our revolving credit facility. In addition, Banc of America Securities LLC served as the lead arranger and book manager of our second lien term loan facility, and each of BNP Paribas Securities Corp. and Merrill Lynch, Pierce, Fenner & Smith Incorporated has an affiliate that is a lender under our second lien term loan facility. See “Use of proceeds.”
Legal matters
The validity of our shares of common stock offered by this prospectus will be passed upon for us by Vinson & Elkins L.L.P., Houston, Texas. Certain legal matters in connection with this offering will be passed upon for Chase Oil Corporation and Caza Energy LLC by Bracewell & Giuliani LLP, Houston, Texas. Legal matters in connection with this offering will be passed upon for the underwriters by Cahill Gordon & Reindel llp, New York, New York.
Experts
The audited financial statements of Concho Resources Inc., the Chase Group Properties and the Lowe Properties included in this registration statement have been audited by Grant Thornton LLP, independent registered public accountants, as indicated in their reports with respect thereto, and are included herein in reliance upon the authority of said firm as experts in giving said reports.
127
Table of Contents
Independent petroleum engineers
Certain estimates of our net oil and natural gas reserves and related information as of December 31, 2006, included in this prospectus have been derived from engineering reports prepared by Netherland, Sewell & Associates, Inc. and Cawley, Gillespie & Associates, Inc. All such information has been so included on the authority of such firms as experts regarding the matters contained in their reports.
Where you can find more information
We have filed with the SEC a registration statement onForm S-1, including exhibits, under the Securities Act with respect to the common stock to be sold in this offering. This prospectus, which constitutes a part of the registration statement, does not contain all of the information set forth in the registration statement or the exhibits that are part of the registration statement. For further information about us and our common stock, you should refer to the registration statement. Any statements made in this prospectus as to the contents of any contract, agreement or other document are not necessarily complete. With respect to each such contract, agreement or other document filed as an exhibit to the registration statement, you should refer to the exhibit for a more complete description of the matter involved, and each statement in this prospectus shall be deemed qualified in its entirety by this reference.
You may read, without charge, and copy, at prescribed rates, all or any portion of the registration statement or any reports, statements or other information in the files at the public reference facilities of the SEC’s principal office at 100 F Street, N.E., Washington, D.C., 20549. You can request copies of these documents upon payment of a duplicating fee by writing to the SEC. You may call the SEC at1-800-SEC-0330 for further information on the operation of its public reference rooms. Our filings, including the registration statement, will also be available to you on the Internet web site maintained by the SEC athttp://www.sec.gov.
Following the completion of this offering, we will file with or furnish to the SEC periodic reports and other information. These reports and other information may be inspected and copied at the public reference facilities maintained by the SEC or obtained from the SEC’s website as provided above. Following the completion of this offering, our website on the Internet will be located athttp://www.conchoresources.com, and we expect to make our periodic reports and other information filed with or furnished to the SEC available, free of charge, through our website, as soon as reasonably practicable after those reports and other information are electronically filed with or furnished to the SEC. Information on our website or any other website is not incorporated by reference into this prospectus and does not constitute a part of this prospectus. You may also request a copy of these filings at no cost, by writing or telephoning us at the following address: Concho Resources Inc., 550 West Texas Avenue, Suite 1300, Midland, Texas 79701,(432) 683-7443.
We intend to furnish or make available to our stockholders annual reports containing our audited financial statements prepared in accordance with GAAP. We also intend to furnish or make available to our stockholders quarterly reports containing our unaudited interim financial information, including the information required byForm 10-Q, for the first three fiscal quarters of each fiscal year.
128
Table of Contents
Glossary of terms
The terms defined in this section are used throughout this prospectus:
| Bbl | One stock tank barrel, of 42 U.S. gallons liquid volume, used herein in reference to crude oil, condensate or natural gas liquids. | |
| Bcfe | One billion cubic feet of natural gas equivalent using the ratio of one barrel of crude oil, condensate or natural gas liquids to six Mcf of natural gas. | |
| Basin | A large natural depression on the earth’s surface in which sediments accumulate. | |
| Dry hole | A well found to be incapable of producing hydrocarbons in sufficient quantities such that proceeds from the sale of such production would exceed production expenses, taxes and the royalty burden. | |
| Exploitation | A drilling or other project which may target proven or unproven reserves (such as probable or possible reserves), but which generally is reasonably expected to have lower risk. | |
| Field | An area consisting of a single reservoir or multiple reservoirs all grouped on, or related to, the same individual geological structural feature or stratigraphic condition. The field name refers to the surface area, although it may refer to both the surface and the underground productive formations. | |
| Gross wells | Are the number of wells in which a working interest is owned and net wells are the total of our fractional working interests owned in gross wells. | |
| Horizontal drilling | A drilling technique used in certain formations where a well is drilled vertically to a certain depth and then drilled at a high angle to vertical (which can be greater than 90 degrees) in order to stay within a specified interval. | |
| Infill wells | Wells drilled into the same pool as known producing wells so that oil or natural gas does not have to travel as far through the formation. | |
| MBbl | One thousand barrels of crude oil, condensate or natural gas liquids. | |
| Mcf | One thousand cubic feet of natural gas. | |
| Mcfe | One thousand cubic feet of natural gas equivalent. | |
| MMBbl | One million barrels of crude oil, condensate or natural gas liquids. | |
| MMBtu | One million British thermal units. | |
| MMcf | One million cubic feet of natural gas. | |
| MMcfe | One million cubic feet of natural gas equivalent. | |
| NYMEX | The New York Mercantile Exchange. |
129
Table of Contents
| Net acres | The percentage of total acres an owner owns out of a particular number of acres within a specified tract. An owner who has 50% interest in 100 acres owns 50 net acres. | |
| Net revenue interest | A working interest owner’s gross working interest in production, less the related royalty, overriding royalty, production payment, and net profits interests. | |
| PV-10 | When used with respect to oil and natural gas reserves,PV-10 means the estimated future gross revenue to be generated from the production of proved reserves, net of estimated production and future development and abandonment costs, using prices and costs in effect at the determination date, before income taxes, and without giving effect to non-property-related expenses, discounted to a present value using an annual discount rate of 10% in accordance with the guidelines of the SEC. | |
| Primary recovery | The period of production in which oil and natural gas is produced from its reservoir through the wellbore without enhanced recovery technologies, such as water flooding or gas injection. | |
| Proved developed reserves | The estimated quantities of crude oil, natural gas and natural gas liquids which geological and engineering data demonstrate with reasonable certainty to be recoverable in future years through existing wellbores. | |
| Proved reserves | The estimated quantities of crude oil, natural gas and natural gas liquids which geological and engineering data demonstrate with reasonable certainty to be recoverable in future years from known reservoirs under existing economic and operating conditions, i.e., prices and costs as of the date the estimate is made. Prices include consideration of changes in existing prices provided only by contractual arrangements, but not on escalations based upon future conditions. | |
| Proved undeveloped reserves | Reserves that are expected to be recovered from new wells on undrilled acreage or from existing wells where a relatively major expenditure is required for recompletion. | |
| Recompletion | The addition of production from another interval or formation in an existing wellbore. | |
| Reservoir | A formation beneath the surface of the earth from which hydrocarbons may be present. Itsmake-up is sufficiently homogenous to differentiate it from other formations. | |
| Secondary recovery | The recovery of oil and gas through the injection of liquids or gases into the reservoir, supplementing its natural energy. Secondary recovery methods are often applied when production slows due to depletion of the natural pressure. |
130
Table of Contents
| Seismic survey | Also known as a seismograph survey, is a survey of an area by means of an instrument which records the travel time of the vibrations of the earth. By recording the time interval between the source of the shock wave and the reflected or refracted shock waves from various formations, geophysicists are better able to define the underground configurations. | |
| Spacing | The distance between wells producing from the same reservoir. Spacing is expressed in terms of acres, e.g.,40-acre spacing, and is established by regulatory agencies. | |
| Standardized Measure | The present value (discounted at an annual rate of 10%) of estimated future net revenues to be generated from the production of proved reserves net of estimated income taxes associated with such net revenues, as determined in accordance with Statement of Financial Accounting Standards No. 69 (using prices and costs in effect as of the period end date) without giving effect to non-property related expenses such as indirect general and administrative expenses, and debt service or to depreciation, depletion and amortization. Standardized measure does not give effect to derivative transactions. | |
| Step-out drilling | The drilling of a well adjacent to existing production in an effort to expand the aerial extent of a known producing field. | |
| Undeveloped acreage | Acreage owned or leased on which wells can be drilled or completed to a point that would permit the production of commercial quantities of oil and natural gas regardless of whether such acreage contains proved reserves. | |
| Unit | The joining of all or substantially all interests in a reservoir or field, rather than single tracts, to provide for development and operation without regard to separate property interests. Also, the area covered by a unitization agreement. | |
| Wellbore | The hole drilled by the bit that is equipped for oil or gas production on a completed well. Also called well or borehole. | |
| Working interest | The right granted to the lessee of a property to explore for and to produce and own oil, gas, or other minerals. The working interest owners bear the exploration, development, and operating costs on either a cash, penalty, or carried basis. | |
| Workover | Operations on a producing well to restore or increase production. |
131
Table of Contents
Index to financial statements
| Page | ||||
Concho Resources Inc. (Historical): | ||||
| F-2 | ||||
| F-3 | ||||
| F-4 | ||||
| F-5 | ||||
| F-6 | ||||
| F-7 | ||||
Concho Resources Inc. (Pro-forma) (Unaudited): | ||||
| F-52 | ||||
| F-53 | ||||
| F-54 | ||||
Chase Group Properties: | ||||
| F-56 | ||||
| F-57 | ||||
| F-58 | ||||
| F-59 | ||||
| F-60 | ||||
| F-61 | ||||
Lowe Properties: | ||||
| F-73 | ||||
| F-74 | ||||
| F-75 | ||||
F-1
Table of Contents
REPORT OF INDEPENDENT REGISTERED
PUBLIC ACCOUNTING FIRM
PUBLIC ACCOUNTING FIRM
Board of Directors and Stockholders
Concho Resources Inc.
We have audited the accompanying consolidated balance sheets of Concho Resources Inc. (a Delaware corporation) and subsidiaries, formerly Concho Equity Holdings Corp., as of December 31, 2005 and 2006, and the related consolidated statements of operations, stockholders’ equity and cash flows for the period from inception (April 21, 2004) through December 31, 2004, and for the years ended December 31, 2005 and 2006. These financial statements are the responsibility of the Company’s management. Our responsibility is to express an opinion on these financial statements based on our audits.
We conducted our audits in accordance with the standards of the Public Company Accounting Oversight Board (United States). Those standards require that we plan and perform the audit to obtain reasonable assurance about whether the financial statements are free of material misstatement. The Company is not required to have, nor were we engaged to perform an audit of its internal control over financial reporting. Our audit included consideration of internal control over financial reporting as a basis for designing audit procedures that are appropriate in the circumstances, but not for the purposes of expressing an opinion on the effectiveness of the Company’s internal control over financial reporting. Accordingly, we express no such opinion. An audit also includes examining, on a test basis, evidence supporting the amounts and disclosures in the financial statements, assessing the accounting principles used and significant estimates made by management, as well as evaluating the overall financial statement presentation. We believe that our audits provide a reasonable basis for our opinion.
In our opinion, the consolidated financial statements referred to above present fairly, in all material respects, the financial position of Concho Resources Inc. and subsidiaries as of December 31, 2005 and 2006, and the results of their operations and their cash flows for the period from inception (April 21, 2004) through December 31, 2004, and for the years ended December 31, 2005 and 2006, in conformity with accounting principles generally accepted in the United States of America.
GRANT THORNTON LLP
Tulsa, Oklahoma
April 23, 2007
F-2
Table of Contents
Concho Resources Inc. and subsidiaries consolidated balance sheets
| December 31, | December 31, | |||||||
| (in thousands, except share and per share data) | 2005 | 2006 | ||||||
Assets | ||||||||
| Current assets: | ||||||||
| Cash and cash equivalents | $ | 9,182 | $ | 1,122 | ||||
| Accounts receivable: | ||||||||
| Oil and gas | 14,040 | 27,304 | ||||||
| Joint operations and other | 11,890 | 22,638 | ||||||
| Related parties | 18,382 | 1,449 | ||||||
| Derivative instruments | — | 6,013 | ||||||
| Deferred income taxes | 3,006 | 82 | ||||||
| Inventory | 1,018 | 1,309 | ||||||
| Prepaid insurance and other | 1,674 | 3,848 | ||||||
| Total current assets | 59,192 | 63,765 | ||||||
| Property and equipment, at cost: | ||||||||
| Oil and gas properties, successful efforts method: | ||||||||
| Proved properties | 157,787 | 1,159,756 | ||||||
| Unproved properties | 21,901 | 239,462 | ||||||
| Accumulated depletion and depreciation | (14,336 | ) | (84,098 | ) | ||||
| Total oil and gas properties, net | 165,352 | 1,315,120 | ||||||
| Other property and equipment, net | 5,231 | 5,535 | ||||||
| Total property and equipment, net | 170,583 | 1,320,655 | ||||||
| Deferred income taxes | 1,898 | — | ||||||
| Deferred loan costs, net | 411 | 4,417 | ||||||
| Other assets | 301 | 1,235 | ||||||
| Total assets | $ | 232,385 | $ | 1,390,072 | ||||
Liabilities and stockholders’ equity | ||||||||
| Current liabilities: | ||||||||
| Accounts payable: | ||||||||
| Trade | $ | 5,897 | $ | 16,157 | ||||
| Related parties | — | 3,593 | ||||||
| Other current liabilities: | ||||||||
| Revenue payable | 7,529 | 9,901 | ||||||
| Accrued drilling costs | 10,493 | 17,051 | ||||||
| Accrued interest | 684 | 8,004 | ||||||
| Other accrued liabilities | 3,119 | 6,220 | ||||||
| Derivative instruments | 9,307 | 6,224 | ||||||
| Dividends payable | 1,410 | 87 | ||||||
| Chase Group unaccredited investors asset purchase obligation | — | 906 | ||||||
| Contingent consideration | 1,824 | — | ||||||
| Current portion of long-term debt | — | 400 | ||||||
| Current asset retirement obligations | 83 | 1,958 | ||||||
| Total current liabilities | 40,346 | 70,501 | ||||||
| Long-term debt | 72,000 | 495,100 | ||||||
| Noncurrent derivative instruments | 8,865 | — | ||||||
| Deferred income taxes | — | 241,752 | ||||||
| Asset retirement obligations and other long-term liabilities | 1,504 | 7,563 | ||||||
| Commitments and contingencies (Note K) | ||||||||
| Stockholders’ equity: | ||||||||
| Series A preferred stock, $0.01 par value; 30,000,000 shares authorized; 12,959,096 and zero shares issued and outstanding; and 1,819,140 and zero shares partially paid, at December 31, 2005 and December 31, 2006, respectively (aggregate liquidation value $116,632 at December 31, 2005) | 130 | — | ||||||
| Preferred stock, $0.001 par value; 10,000,000 shares authorized; and zero shares issued and outstanding at December 31, 2005 and 2006 | — | — | ||||||
| Common stock, $0.001 par value; 30,000,000 and 300,000,000 shares authorized; 16,283,813 and 118,185,563 shares issued and outstanding; and 2,160,520 and zero shares partially paid, at December 31, 2005 and 2006, respectively | 16 | 118 | ||||||
| Additional paid-in capital | 135,868 | 575,330 | ||||||
| Notes receivable from officers and employees | (9,012 | ) | (12,858 | ) | ||||
| Retained earnings (accumulated deficit) | (6,272 | ) | 12,152 | |||||
| Accumulated other comprehensive income (loss) | (11,060 | ) | 414 | |||||
| Total stockholders’ equity | 109,670 | 575,156 | ||||||
| Total liabilities and stockholders’ equity | $ | 232,385 | $ | 1,390,072 | ||||
The accompanying notes are an integral part of these consolidated financial statements.
F-3
Table of Contents
Concho Resources Inc. and subsidiaries
Consolidated statements of operations
Consolidated statements of operations
| Inception (April 21, | ||||||||||||
| 2004) through | Year ended | |||||||||||
| December 31, | December 31, | |||||||||||
| (in thousands, except per share amounts) | 2004 | 2005 | 2006 | |||||||||
| Operating revenues: | ||||||||||||
| Oil sales | $ | 1,851 | $ | 31,621 | $ | 131,773 | ||||||
| Natural gas sales | 1,771 | 23,315 | 66,517 | |||||||||
| Total operating revenues | 3,622 | 54,936 | 198,290 | |||||||||
Operating costs and expenses: | ||||||||||||
| Oil and gas production | 512 | 10,923 | 22,060 | |||||||||
| Oil and gas production taxes | 234 | 3,712 | 15,762 | |||||||||
| Exploration and abandonments | 1,850 | 2,666 | 5,612 | |||||||||
| Depreciation and depletion | 956 | 11,485 | 60,722 | |||||||||
| Accretion of discount on asset retirement obligations | 7 | 89 | 287 | |||||||||
| Impairments of proved oil and gas properties | — | 2,295 | 9,891 | |||||||||
| General and administrative (Including non-cash stock-based compensation of $1,128, $3,252, and $9,144 for the periods ended December 31, 2004, 2005 and 2006, respectively.) | 4,214 | 11,307 | 21,721 | |||||||||
| Ineffective portion of cash flow hedges | — | 1,148 | (1,193 | ) | ||||||||
| (Gain) loss on derivatives not designated as hedges | (684 | ) | 5,001 | — | ||||||||
| Total operating costs and expenses | 7,089 | 48,626 | 134,862 | |||||||||
Income (loss) from operations | (3,467 | ) | 6,310 | 63,428 | ||||||||
Other income (expense): | ||||||||||||
| Interest expense | (272 | ) | (3,096 | ) | (30,567 | ) | ||||||
| Other, net | 168 | 779 | 1,186 | |||||||||
| Total other expense | (104 | ) | (2,317 | ) | (29,381 | ) | ||||||
Income (loss) before income taxes | (3,571 | ) | 3,993 | 34,047 | ||||||||
| Income tax (expense) benefit | 915 | (2,039 | ) | (14,379 | ) | |||||||
Net income (loss) | (2,656 | ) | 1,954 | 19,668 | ||||||||
| Preferred stock dividends | (804 | ) | (4,766 | ) | (1,244 | ) | ||||||
| Effect of induced conversion of preferred stock | — | — | 11,601 | |||||||||
Net income (loss) applicable to common shareholders | $ | (3,460 | ) | $ | (2,812 | ) | $ | 30,025 | ||||
Basic earnings (loss) per share: | ||||||||||||
| Net income (loss) per share | $ | (1.74 | ) | $ | (0.35 | ) | $ | 0.32 | ||||
| Shares used in basic earnings (loss) per share | 1,987 | 8,117 | 94,575 | |||||||||
Diluted earnings (loss) per share: | ||||||||||||
| Net income (loss) per share | $ | (1.74 | ) | $ | (0.35 | ) | $ | 0.30 | ||||
| Shares used in diluted earnings (loss) per share | 1,987 | 8,117 | 101,458 | |||||||||
The accompanying notes are an integral part of these consolidated financial statements.
F-4
Table of Contents
Concho Resources Inc. and subsidiaries
Consolidated statements of stockholders’ equity
Consolidated statements of stockholders’ equity
| Notes | Retained | Accumulated | ||||||||||||||||||||||||||||||||
| Series A | Additional | Receivable from | Earnings | Other | Total | |||||||||||||||||||||||||||||
| Preferred Stock | Common Stock | Paid-in | Officers and | (Accumulated | Comprehensive | Stockholders’ | ||||||||||||||||||||||||||||
| (in thousands) | Shares | Amount | Shares | Amount | Capital | Employees | Deficit) | (Loss) Income | Equity | |||||||||||||||||||||||||
| BALANCE AT INCEPTION (APRIL 21, 2004) | — | $ | — | — | $ | — | $ | — | $ | — | $ | — | $ | — | $ | — | ||||||||||||||||||
| Comprehensive income (loss) | ||||||||||||||||||||||||||||||||||
| Net loss | — | — | — | — | — | — | (2,656 | ) | — | (2,656 | ) | |||||||||||||||||||||||
| Deferred hedge gains, net of tax of $19 | — | — | — | — | — | — | — | 33 | 33 | |||||||||||||||||||||||||
| Total comprehensive loss | (2,623 | ) | ||||||||||||||||||||||||||||||||
| Issuance of subscribed units | 7,689 | 77 | 7,689 | 8 | 76,802 | (3,840 | ) | — | — | 73,047 | ||||||||||||||||||||||||
| Issuance of common stock | — | — | 2,011 | 2 | 1,004 | — | — | — | 1,006 | |||||||||||||||||||||||||
| Stock-based compensation for stock options | — | — | — | — | 178 | — | — | — | 178 | |||||||||||||||||||||||||
| Stock-based compensation on issuance of units | — | — | — | — | 950 | — | — | — | 950 | |||||||||||||||||||||||||
| Accrued interest—officer & employee notes | — | — | — | — | — | (44 | ) | — | — | (44 | ) | |||||||||||||||||||||||
| 6% Series A Preferred stock dividends | — | — | — | — | — | — | (804 | ) | — | (804 | ) | |||||||||||||||||||||||
| BALANCE AT DECEMBER 31, 2004 | 7,689 | $ | 77 | 9,700 | $ | 10 | $ | 78,934 | $ | (3,884 | ) | $ | (3,460 | ) | $ | 33 | $ | 71,710 | ||||||||||||||||
| Comprehensive income (loss) | ||||||||||||||||||||||||||||||||||
| Net income | — | — | — | — | — | — | 1,954 | — | 1,954 | |||||||||||||||||||||||||
| Deferred hedge losses, net of tax of ($6,550) | — | — | — | — | — | — | — | (12,147 | ) | (12,147 | ) | |||||||||||||||||||||||
| Net settlement losses included in earnings, net of taxes of $568 | — | — | — | — | — | — | — | 1,054 | 1,054 | |||||||||||||||||||||||||
| Total comprehensive loss | (9,139 | ) | ||||||||||||||||||||||||||||||||
| Issuance of subscribed units | 5,270 | 53 | 5,270 | 5 | 53,026 | (4,805 | ) | — | — | 48,279 | ||||||||||||||||||||||||
| Issuance of common stock | — | — | 1,313 | 1 | 656 | — | — | — | 657 | |||||||||||||||||||||||||
| Stock-based compensation for stock options | — | — | — | — | 1,506 | — | — | — | 1,506 | |||||||||||||||||||||||||
| Stock-based compensation on issuance of units | — | — | — | — | 1,746 | — | — | — | 1,746 | |||||||||||||||||||||||||
| Accrued interest—officer & employee notes | — | — | — | — | — | (323 | ) | — | — | (323 | ) | |||||||||||||||||||||||
| 6% Series A Preferred stock dividends | — | — | — | — | — | — | (4,766 | ) | — | (4,766 | ) | |||||||||||||||||||||||
| BALANCE AT DECEMBER 31, 2005 | 12,959 | $ | 130 | 16,283 | $ | 16 | $ | 135,868 | $ | (9,012 | ) | $ | (6,272 | ) | $ | (11,060 | ) | $ | 109,670 | |||||||||||||||
| Comprehensive income (loss) | ||||||||||||||||||||||||||||||||||
| Net income | — | — | — | — | — | — | 19,668 | — | 19,668 | |||||||||||||||||||||||||
| Deferred hedge gains, net of tax of $4,200 | — | — | — | — | — | — | — | 7,736 | 7,736 | |||||||||||||||||||||||||
| Net settlement losses included in earnings, net of taxes of $2,030 | — | — | — | — | — | — | — | 3,738 | 3,738 | |||||||||||||||||||||||||
| Total comprehensive income | 31,142 | |||||||||||||||||||||||||||||||||
| Issuance of subscribed units | 4,518 | 45 | 4,518 | 5 | 45,326 | (3,158 | ) | — | — | 42,218 | ||||||||||||||||||||||||
| Issuance of common stock | — | — | 1,155 | 1 | 577 | — | — | — | 578 | |||||||||||||||||||||||||
| Conversion of preferred stock | (17,477 | ) | (175 | ) | 26,216 | 26 | 149 | — | — | — | — | |||||||||||||||||||||||
| Issuance of common stock for acquisition | — | — | 69,590 | 70 | 384,266 | — | — | — | 384,336 | |||||||||||||||||||||||||
| Restricted stock issued as stock-based compensation | — | — | 427 | — | 1,044 | — | — | — | 1,044 | |||||||||||||||||||||||||
| Cancellation of restricted stock | — | — | (3 | ) | — | — | — | — | — | — | ||||||||||||||||||||||||
| Stock-based compensation for stock options | — | — | — | — | 7,125 | — | — | — | 7,125 | |||||||||||||||||||||||||
| Stock-based compensation on issuance of units | — | — | — | — | 975 | — | — | — | 975 | |||||||||||||||||||||||||
| Accrued interest—officer & employee notes | — | — | — | — | — | (688 | ) | — | — | (688 | ) | |||||||||||||||||||||||
| 6% Series A Preferred stock dividends | — | — | — | — | — | — | (1,244 | ) | — | (1,244 | ) | |||||||||||||||||||||||
| BALANCE AT DECEMBER 31, 2006 | — | $ | — | 118,186 | $ | 118 | $ | 575,330 | $ | (12,858 | ) | $ | 12,152 | $ | 414 | $ | 575,156 | |||||||||||||||||
The accompanying notes are an integral part of these consolidated financial statements.
F-5
Table of Contents
Concho Resources Inc. and subsidiaries
Consolidated statements of cash flows
Consolidated statements of cash flows
| Period from | ||||||||||||
| inception | ||||||||||||
| (April 21, 2004) | ||||||||||||
| through | Year ended | Year ended | ||||||||||
| December 31, | December 31, | December 31, | ||||||||||
| (in thousands) | 2004 | 2005 | 2006 | |||||||||
| CASH FLOWS FROM OPERATING ACTIVITIES: | ||||||||||||
| Net income (loss) | $ | (2,656 | ) | $ | 1,954 | $ | 19,668 | |||||
| Adjustments to reconcile net income (loss) to net cash provided by (used in) operating activities: | ||||||||||||
| Depreciation and depletion | 956 | 11,485 | 60,722 | |||||||||
| Impairments of proved oil and gas properties | — | 2,295 | 9,891 | |||||||||
| Accretion of discount on asset retirement obligations | 7 | 89 | 287 | |||||||||
| Exploration expense, including dry holes | 1,636 | 1,549 | 3,387 | |||||||||
| Non-cash compensation expense | 1,128 | 3,252 | 9,144 | |||||||||
| Gas imbalances | — | (37 | ) | 82 | ||||||||
| Ineffective portion of cash flow hedges | — | 1,148 | (1,193 | ) | ||||||||
| Deferred rent liability | 10 | 11 | 262 | |||||||||
| Deferred income taxes | (915 | ) | 1,974 | 12,618 | ||||||||
| Interest accrued on officer and employee notes | (44 | ) | (323 | ) | (688 | ) | ||||||
| Amortization of deferred loan costs | 9 | 134 | 1,494 | |||||||||
| Loss (gain) on sale of other property and equipment | (18 | ) | 21 | (3 | ) | |||||||
| Loss (gain) on derivatives not designated as hedges | (684 | ) | 5,001 | — | ||||||||
| Changes in operating assets and liabilities, net of acquisitions: | ||||||||||||
| Accounts receivable | (4,732 | ) | (15,621 | ) | (27,683 | ) | ||||||
| Prepaid insurance and other | (126 | ) | (1,548 | ) | (2,465 | ) | ||||||
| Other assets | (12 | ) | — | 12 | ||||||||
| Accounts payable | 2,445 | 3,452 | 13,853 | |||||||||
| Revenue payable | 166 | 6,958 | 2,372 | |||||||||
| Accrued liabilities | 443 | 2,786 | 3,101 | |||||||||
| Accrued interest | 194 | 490 | 7,320 | |||||||||
| Net cash provided by (used in) operating activities | (2,193 | ) | 25,070 | 112,181 | ||||||||
| CASH FLOWS FROM INVESTING ACTIVITIES: | ||||||||||||
| Capital expenditures on oil and gas properties | (6,450 | ) | (52,768 | ) | (182,389 | ) | ||||||
| Acquisition of oil and gas properties and other assets | (114,649 | ) | (2,855 | ) | (413,229 | ) | ||||||
| Additions to other property and equipment | (1,374 | ) | (4,061 | ) | (1,234 | ) | ||||||
| Proceeds from other assets | — | 817 | — | |||||||||
| Payments on derivatives not designated as hedges | — | (3,035 | ) | — | ||||||||
| Net cash used in investing activities | (122,473 | ) | (61,902 | ) | (596,852 | ) | ||||||
| CASH FLOWS FROM FINANCING ACTIVITIES: | ||||||||||||
| Proceeds from issuance of long-term debt | 53,000 | 63,400 | 664,993 | |||||||||
| Payments of long-term debt | — | (44,400 | ) | (241,493 | ) | |||||||
| Proceeds from issuance of subscribed units and common stock | 74,053 | 30,621 | 61,178 | |||||||||
| Payments of preferred stock dividends | — | (4,160 | ) | (2,567 | ) | |||||||
| Proceeds from notes payable—affiliate | 4,100 | — | — | |||||||||
| Payments of notes payable—affiliate | (4,100 | ) | — | — | ||||||||
| Payments for loan origination costs | (450 | ) | (103 | ) | (5,500 | ) | ||||||
| Premiums paid on derivatives not designated as hedges | (1,281 | ) | — | — | ||||||||
| Net cash provided by financing activities | 125,322 | 45,358 | 476,611 | |||||||||
| Net increase (decrease) in cash and cash equivalents | 656 | 8,526 | (8,060 | ) | ||||||||
| BEGINNING CASH AND CASH EQUIVALENTS | — | 656 | 9,182 | |||||||||
| ENDING CASH AND CASH EQUIVALENTS | $ | 656 | $ | 9,182 | $ | 1,122 | ||||||
| SUPPLEMENTAL CASH FLOWS: | ||||||||||||
| Cash paid for interest and fees, net of $0, $370 and $2,129 capitalized | $ | 67 | $ | 2,449 | $ | 23,881 | ||||||
| Cash paid for income taxes | $ | — | $ | 100 | $ | 1,725 | ||||||
| NON-CASH INVESTING ACTIVITIES: | ||||||||||||
| Issuance of common stock in acquisition of oil and gas properties and other assets | $ | — | $ | — | $ | 384,336 | ||||||
| NON-CASH FINANCING ACTIVITIES: | ||||||||||||
| Issuance of notes receivable issued in connection with capital options | $ | 3,840 | $ | 4,805 | $ | 3,158 | ||||||
The accompanying notes are an integral part of these consolidated financial statements.
F-6
Table of Contents
Concho Resources Inc. and subsidiaries
Notes to consolidated financial statements
Notes to consolidated financial statements
Note A. Organization and nature of operations
Concho Resources Inc. (“Resources”) is a Delaware corporation formed on February 22, 2006. Pursuant to the Combination Agreement dated February 24, 2006, among Concho Resources Inc., Concho Equity Holdings Corp. (“CEHC”), Chase Oil Corporation, Caza Energy LLC (“Caza”) and certain other parties thereto (collectively with Chase Oil Corporation and Caza, the “Chase Group”), Resources acquired working interests in oil and gas properties from the Chase Group and issued shares of its common stock to certain stockholders of CEHC in exchange for their capital stock of CEHC. CEHC is a Delaware corporation formed on April 21, 2004 by certain individuals and private equity investors. CEHC commenced substantial oil and gas operations in December 2004 upon its acquisition of certain oil and gas properties located in Southeast New Mexico and West Texas. The combination transaction described above (the “Combination”) was accounted for as an acquisition by CEHC of the Chase Group Properties and a simultaneous reorganization of Resources such that CEHC is now a wholly owned subsidiary of Resources. Upon the closing of the Combination, the executive officers of CEHC became the executive officers of Resources. Resources and its wholly owned subsidiaries are hereafter collectively referred to as the “Company.”
CEHC’s shareholders received 47,535,346 shares of common stock of Resources in exchange for their preferred and common shares of CEHC, excluding eighteen holders owning an aggregate of 254,621 shares of CEHC 6% Series A Preferred Stock and 254,621 shares of CEHC common stock, as discussed in Note G. In addition, the Chase Group transferred their ownership in certain oil and gas properties in Southeast New Mexico to Resources in exchange for cash in the aggregate amount of approximately $409 million and 69,589,272 shares of Resources common stock. As of December 31, 2006, this ownership of the Chase Group represents approximately 59 percent of the total outstanding common stock ownership of the Company.
The Company’s principal business is the acquisition, development, exploitation and exploration of oil and gas properties in the Permian Basin region of Southeast New Mexico and West Texas.
Note B. Summary of significant accounting policies
Principles of consolidation. Prior to the Combination, the consolidated financial statements of Resources represent the accounts of CEHC and its wholly owned subsidiaries. After the Combination, the consolidated financial statements of Resources include the accounts of Resources and its wholly owned subsidiaries, including CEHC. All material intercompany balances and transactions have been eliminated.
Use of estimates in the preparation of financial statements. Preparation of financial statements in conformity with generally accepted accounting principles in the United States of America requires management to make estimates and assumptions that affect the reported amounts of assets and liabilities, the disclosure of contingent assets and liabilities at the date of the financial statements and the reported amounts of revenues and expenses during the reporting periods. Actual results could differ from these estimates. Depletion and depreciation of oil and gas properties are determined using estimates of proved oil and gas reserves. There are numerous uncertainties inherent in the estimation of quantities of proved reserves and in the projection of
F-7
Table of Contents
future rates of production and the timing of development expenditures. Similarly, evaluations for impairment of proved and unproved oil and gas properties are subject to numerous uncertainties including, among others, estimates of future recoverable reserves and commodity price outlooks. Other significant estimates include, but are not limited to, the asset retirement obligations, fair value of derivative financial instruments, purchase price allocations and fair value of stock-based compensation.
Cash equivalents. The Company considers all cash on hand, depository accounts held by banks, money market accounts and investments with an original maturity of three months or less to be cash equivalents. The Company’s cash and cash equivalents are held in a few financial institutions in amounts that exceed the insurance limits of the Federal Deposit Insurance Corporation. However, management believes that the Company’s counter-party risks are minimal based on the reputation and history of the institutions selected.
Accounts receivable. The Company sells oil and gas to various customers and participates with other parties in the drilling, completion and operation of oil and gas wells. Joint interest and oil and gas sales receivables related to these operations are generally unsecured. The Company determines joint interest operations accounts receivable allowances based on management’s assessment of the creditworthiness of the joint interest owners and the Company’s ability to realize the receivables through netting of anticipated future production revenues. Receivables are considered past due if full payment is not received by the contractual due date. Past due accounts are generally written off against the allowance for doubtful accounts only after all collection attempts have been exhausted. The Company had no allowance for doubtful accounts at December 31, 2005 or 2006.
Inventory. Inventory consists primarily of tubular goods that the Company plans to utilize in its ongoing exploration and development activities and is carried at the lower of cost or market value.
Deferred loan costs. Deferred loan costs are stated at cost, net of amortization, which is computed using the effective interest and straight-line methods. The Company had deferred loan costs of $411,000 and $4,417,000, net of accumulated amortization of $142,000 and $1,083,000, as of December 31, 2005 and December 31, 2006, respectively.
On February 24, 2006, in conjunction with the Combination, the Company replaced its prior revolving credit facility with a new revolving credit facility. The remaining net deferred loan costs of $376,000 associated with the retired debt, were written off and included inInterest expense in 2006. In addition, on July 6, 2006, the Company entered into a term loan facility. The new deferred loan costs on these facilities are being amortized over the life of the loans, which mature February 24, 2010 and July 7, 2011, respectively. Future amortization expense for each of the years ended December 31, 2007, 2008, 2009, 2010 and 2011 is approximately $1,350,000, $1,350,000, $1,350,000, $308,000 and $50,000, respectively.
Oil and gas properties. The Company utilizes the successful efforts method of accounting for its oil and gas properties under the provisions of Financial Accounting Standards Board (“FASB”) Statement of Financial Accounting Standards (“SFAS”) No. 19, “Financial Accounting and Reporting by Oil and Gas Producing Companies.” Under this method all costs associated with productive wells and nonproductive development wells are capitalized, while nonproductive exploration costs are expensed. Capitalized acquisition costs relating to proved properties are depleted on a field basis using the unit-of-production method based on proved reserves. The
F-8
Table of Contents
depreciation of capitalized exploratory drilling and development costs is based on the unit-of-production method using proved developed reserves on a field basis.
Proceeds from the sales of individual properties and the capitalized costs of individual properties sold or abandoned are credited and charged, respectively, to accumulated depletion and depreciation. Generally, no gain or loss is recognized until the entire amortization base is sold. However, gain or loss is recognized from the sale of less than an entire amortization base if the disposition is significant enough to materially impact the depletion rate of the remaining properties in the amortization base. Ordinary maintenance and repair costs are generally expensed as incurred.
Costs of significant nonproducing properties, wells in the process of being drilled and development projects are excluded from depletion until such time as the related project is developed and proved reserves are established or impairment is determined. The Company capitalizes interest, if debt is outstanding, on expenditures for significant development projects until such projects are ready for their intended use. At December 31, 2005 and 2006 the Company had excluded $11.8 million and $33.6 million, respectively, of capitalized costs from depletion and had capitalized interest of $370,000 and $2,129,000, during 2005 and 2006, respectively.
In accordance with SFAS No. 144, “Accounting for the Impairment or Disposal of Long-Lived Assets,” the Company reviews its long-lived assets to be held and used, including proved oil and gas properties, whenever events or circumstances indicate that the carrying value of those assets may not be recoverable. An impairment loss is indicated if the sum of the expected future cash flows is less than the carrying amount of the assets. In this circumstance, the Company recognizes an impairment loss for the amount by which the carrying amount of the asset exceeds the estimated fair value of the asset. The Company reviews its oil and gas properties by amortization base (field) or by individual well for those wells not constituting part of an amortization base. For each property determined to be impaired, an impairment loss equal to the difference between the carrying value of the properties and the estimated fair value (discounted future cash flows) of the properties would be recognized at that time. Estimating future cash flows involves the use of judgments, including estimation of the proved and unproved oil and gas reserve quantities, timing of development and production, expected future commodity prices, capital expenditures and production costs. The Company recognized impairment expense of $0, $2.3 million and $9.9 million during the periods ended December 31, 2004, 2005 and 2006, respectively, related to its proved oil and gas properties.
Unproved oil and gas properties are each periodically assessed for impairment by considering future drilling plans, the results of exploration activities, commodity price outlooks, planned future sales or expiration of all or a portion of such projects. During the periods ended December 31, 2004, 2005 and 2006, the Company recognized a non-cash charge against earnings of $376,000, $199,000 and $196,000, respectively, related to abandoned prospects, which is included inExploration and abandonmentsin the accompanying consolidated statements of operations.
Exploratory well costs. Costs of drilling exploratory wells are capitalized, pending management’s determination of whether the wells have found proved reserves. If proved reserves are found, the costs remain capitalized. If proved reserves are not found, the capitalized costs of drilling the well are charged to expense. Management makes this determination as soon as possible after completion of drilling considering the guidance provided in SFAS No. 19 and FASB Staff Position (“FSP”)No. 19-1 “Accounting for Suspended Well Costs.”
F-9
Table of Contents
SFAS No. 19 provided that such costs should not be carried as an asset for more than one year following completion of drilling unless the well has found oil and gas reserves in an area requiring a major capital expenditure before production could begin. In that case, the costs of such exploratory well would continue to be carried as an asset pending determination of whether proved reserves had been found only as long as the well had found a sufficient quantity of reserves to justify its completion as a producing well if the required capital expenditure was made and drilling of the additional exploratory wells was under way or firmly planned for the near future. If both those conditions were not met, the well costs were charged to expense.
The Company adopted the provisions ofFSP No. 19-1 effective January 1, 2006.FSP 19-1 amends SFAS No. 19 to provide that in those situations where exploration drilling has been completed and oil and gas reserves have been found, but such reserves cannot be classified as proved when drilling is complete, the drilling costs may be capitalized if the well has found a sufficient quantity of reserves to justify its completion as a producing well and the enterprise is making sufficient progress assessing the reserves and the economic and operating viability of the project. If either of the criteria is not met, the well is assumed to be impaired and the costs charged to expense. Any well that has not found reserves is charged to expense. Management performs this evaluation on a quarterly basis. The adoption ofFSP No. 19-1 had no impact on the Company’s consolidated financial position or results of operations.
The following table provides an aging as of December 31, 2005 and 2006 of capitalized exploratory well costs based on the date the drilling was completed:
| December 31, | ||||||
| (in thousands) | 2005 | 2006 | ||||
| Wells in progress | $ | 1,190 | $ | 916 | ||
| Capitalized exploratory well costs that have been capitalized for a period of one year or less | 2,765 | 14,042 | ||||
| Capitalized exploratory well costs that have been capitalized for a period greater than one year | — | 4,915 | ||||
| Total exploratory well costs | $ | 3,955 | $ | 19,873 | ||
As of December 31, 2006, the Company had one exploratory well in Texas on which the drilling was completed for more than one year with a total cost of approximately $4.9 million. Management believes this well has found sufficient reserves to justify its completion, and the Company is assessing those reserves and the operating viability of the project. During 2006, the Company drilled another well in this area as part of its exploration efforts with plans to further continue evaluation of this area during 2007. Depending on the results of such activity, the costs capitalized for the completed wells may be charged to expense during 2007.
F-10
Table of Contents
The changes in capitalized exploratory well costs were as follows:
| Inception | |||||||||||
| (April 21, 2004) | |||||||||||
| through | Year ended | Year ended | |||||||||
| December 31, | December 31, | December 31, | |||||||||
| (in thousands) | 2004 | 2005 | 2006 | ||||||||
| Beginning capitalized exploratory well costs | $ | — | $ | 2,149 | $ | 3,955 | |||||
| Additions to exploratory well costs pending the determination of proved reserves | 2,149 | 5,556 | 41,956 | ||||||||
| Reclassifications due to determination of proved reserves | — | (3,749 | ) | (25,762 | ) | ||||||
| Exploratory well costs charged to expense | — | (1 | ) | (276 | ) | ||||||
| Ending capitalized exploratory well costs | $ | 2,149 | $ | 3,955 | $ | 19,873 | |||||
Other property and equipment. Other capital assets include buildings, vehicles, computer equipment and software, telecommunications equipment and furniture and fixtures. These items are recorded at cost and are depreciated using the straight-line method based on expected lives of the individual assets or group of assets ranging from two to 15 years.
Environmental. The Company is subject to extensive Federal, state and local environmental laws and regulations. These laws, which are often changing, regulate the discharge of materials into the environment and may require the Company to remove or mitigate the environmental effects of the disposal or release of petroleum or chemical substances at various sites. Environmental expenditures are expensed. Expenditures that relate to an existing condition caused by past operations and that have no future economic benefits are expensed. Liabilities for expenditures of a noncapital nature are recorded when environmental assessmentand/or remediation is probable and the costs can be reasonably estimated. Such liabilities are generally undiscounted unless the timing of cash payments is fixed and readily determinable. Management believes no liabilities of this nature existed at December 31, 2005 or 2006.
Oil and gas sales and imbalances. The Company’s principal revenue source is the sale of crude oil and natural gas. In general, the amount recorded as revenue from the sale of such products represents the estimated amount due based on the Company’s interest in the properties and the agreements with the respective purchasers. The amount reported as revenue in the accompanying statements of operations is also affected by the results of oil and gas hedging activities, as discussed below. Oil and gas revenues are recorded at the time of delivery of such products to pipelines for the account of the purchaser or at the time of physical transfer of such products to the purchaser. The Company follows the sales method of accounting for oil and gas sales, recognizing revenues based on the Company’s share of actual proceeds from the oil and gas sold to purchasers. Oil and gas imbalances are generated on properties for which two or more owners have the right to take production “in-kind” and, in doing so, take more or less than their respective entitled percentage. Imbalances are tracked by well, but the Company does not record any receivable to or payable from the other owners unless the imbalance has reached a level whereby it exceeds the remaining reserves in the respective well. If reserves are insufficient to offset the imbalance and the Company is in an overtake position, a liability is recorded for the amount of shortfall in reserves valued at a contract price or the market price in effect at the time the imbalance is generated. If the Company is in an undertake position, a receivable is
F-11
Table of Contents
recorded for an amount that is reasonably expected to be received, not to exceed the current market value of such imbalance.
The Company had no gas imbalance liabilities or assets recorded prior to 2005. At December 31, 2005, the Company had a gas imbalance liability, included inAsset Retirement Obligations and Other Long-Term Liabilitiesin the accompanying consolidated balance sheet of approximately $446,000 related to the Company’s overtake position of 70,249 Mcf on certain wells and a gas imbalance receivable, included inOther Assets, net in the accompanying consolidated balance sheet of approximately $289,000 related to the Company’s undertake position of 64,176 Mcf on certain wells. A net overtake of 18,765 Mcf, valued at approximately $194,000, was assumed by the Company with the December 7, 2004 acquisition of interests in certain oil and gas properties and was, therefore, reflected as a 2005 adjustment to the purchase price allocation (see Note D). The remaining net undertake of 12,692 Mcf that arose in 2005, valued at approximately $37,000, was recorded net inOil and gas productionexpense in the accompanying consolidated statement of operations for the year ended December 31, 2005.
At December 31, 2006, the Company had a gas imbalance liability, included inAsset Retirement Obligations and Other Long-Term Liabilitiesin the accompanying consolidated balance sheet of approximately $539,000 related to the Company’s overtake position of 85,348 Mcf on certain wells and a gas imbalance receivable, included inOther Assets, Netin the accompanying consolidated balance sheet of approximately $299,000 related to the Company’s undertake position of 66,438 Mcf on certain wells. The net overtake of 12,837 Mcf that arose in 2006, valued at approximately $83,000, was recorded net as an increase toOil and gas productionexpense in the accompanying consolidated statement of operations for the year ended December 31, 2006.
Derivative instruments and hedging. The Company applies the provisions of SFAS No. 133, “Accounting for Derivative Instruments and Hedging Activities,” as amended. This statement requires the recognition of all derivative instruments as either assets or liabilities measured at fair value. The Company netted the fair value of derivative instruments by counterparty in the accompanying consolidated balance sheets where the right of offset exists as permitted by FASB Interpretation (“FIN”) No. 39, “Offsetting of Amounts Related to Certain Contracts”.
Under the provisions of SFAS No. 133, the Company may designate a derivative instrument as hedging the exposure to changes in the fair value of an asset or a liability or an identified portion thereof that is attributable to a particular risk (a ‘‘fair value hedge’’) or as hedging the exposure to variability in expected future cash flows that are attributable to a particular risk (a ‘‘cash flow hedge’’). Special accounting for qualifying hedges allows the effective portion of a derivative instrument’s gains and losses to offset related results on the hedged item in the statement of operations and requires that a company formally document, designate and assess the effectiveness of the transactions that receive hedge accounting treatment. Both at the inception of a hedge and on an ongoing basis, a hedge must be expected to be highly effective in achieving offsetting changes in fair value or cash flows attributable to the underlying risk being hedged. If the Company determines that a derivative instrument is no longer highly effective as a hedge, it discontinues hedge accounting prospectively and future changes in the fair value of the derivative are recognized in current earnings. The amount already reflected inAccumulated Other Comprehensive (Loss) Incomeremains there until the hedged item affects earnings or it is probable that the hedged item will not occur by the end of the originally specified time period or within two months thereafter. The Company assesses hedge effectiveness at the end of each quarter.
F-12
Table of Contents
In accordance with SFAS No. 133, changes in the fair value of derivative instruments that are fair value hedges are offset against changes in the fair value of the hedged assets, liabilities or firm commitments, through earnings. Effective changes in the fair value of derivative instruments that are cash flow hedges are recognized inAccumulated Other Comprehensive (Loss) Incomeand reclassified into earnings in the period in which the hedged item affects earnings. Ineffective portions of a derivative instrument’s change in fair value are immediately recognized in earnings. Derivative instruments that do not qualify, or cease to qualify, as hedges must be adjusted to fair value and the adjustments are recorded through net income (loss).
All of the Company’s commodity price collars and price swaps outstanding at December 31, 2005 and 2006 were designated as cash flow hedges. The market prices used to value the financial derivative instruments reflect management’s estimates considering various factors including closing exchange andover-the-counter quotations, and the time value of the underlying commitments. There were no gains or losses reclassified into earnings as there were no cash settlements during the period ended December 31, 2004. The Company reclassified losses of approximately $1,622,000 and $5,768,000, resulting in a decrease to oil and gas sales, as a result of periodic contractual cash settlements of its price collars and price swaps for the years ended December 31, 2005 and 2006, respectively, that were previously reported inAccumulated Other Comprehensive (Loss) Income. All of the Company’s derivative instruments are expected to settle within the next two years (see Note I). The Company expects a pre-tax loss of $211,000 to be reclassified into earnings during the year ended December 31, 2007. The amount of hedge ineffectiveness recognized inIneffective portion of cash flow hedgesin the accompanying consolidated statements of operations was a loss of approximately $1,148,000 and gain of approximately $1,193,000 for the years ended December 31, 2005 and 2006, respectively. There was no significant hedge ineffectiveness for the period ended December 31, 2004.
Asset retirement obligations. The Company accounts for the obligation in accordance with SFAS No. 143, “Asset Retirement Obligations.” SFAS No. 143 requires entities to record the fair value of a liability for an asset retirement obligation in the period in which it is incurred and a corresponding increase in the carrying amount of the related long-lived asset. Subsequently, the asset retirement cost included in the carrying amount of the related asset is allocated to expense through depreciation of the asset. Changes in the liability due to passage of time are recognized as an increase in the carrying amount of the liability and as corresponding accretion expense.
In March 2005, the FASB issued FIN No. 47, “Accounting for Conditional Asset Retirement Obligations, an interpretation of FASB Statement No. 143.” FIN 47 clarifies that conditional asset retirement obligations meet the definition of liabilities and should be recognized when incurred if their fair values can be reasonably estimated. The interpretation was adopted by the Company on December 31, 2005 with no impact on the Company’s financial position or results of operations.
General and administrative expense. The Company receives fees for the operation of jointly owned oil and gas properties and records such reimbursements as reductions ofGeneral and administrative expense. Such fees totaled approximately $38,000, $591,000 and $799,000 for the periods ended December 31, 2004, 2005 and 2006, respectively.
Stock-based compensation. In December 2004, the FASB issued SFAS No. 123R, “Share-Based Payment.” SFAS No. 123R addresses the accounting for transactions in which an enterprise exchanges its valuable equity instruments for employee services. It also addresses transactions in which an enterprise incurs liabilities that are based on the fair value of the enterprise’s equity instruments or that may be settled by the issuance of those equity instruments in exchange for
F-13
Table of Contents
employee services. The cost of employee services received in exchange for equity instruments, including employee stock options, would be measured based on the grant-date fair value of those instruments. That cost would be recognized as compensation expense over the requisite service period (often the vesting period). Generally, no compensation cost would be recognized for equity instruments that do not vest. The Company adopted SFAS No. 123R in 2005 and applied the modified retrospective application method to all prior periods. The Company previously utilized the method of accounting for stock based compensation prescribed by Accounting Principles Board Opinion No. 25 “Accounting for Stock Issued to Employees” and included disclosures in the footnotes to the consolidated financial statements which illustrated the results the Company would have recorded had it utilized the fair value method prescribed by SFAS No. 123 “Accounting for Stock-Based Compensation” in its primary financial statements.
Interest and other income. The Company collects rental income on its commercial building from lessees. Rental revenue is recognized on a straight-line basis over the term of the rental agreement.
As discussed more fully in Note G, the Company accrues interest income on notes receivable from officers and employees.
Income taxes. The Company accounts for income taxes in accordance with the provisions of SFAS No. 109, “Accounting for Income Taxes.” Under the asset and liability method of SFAS No. 109, deferred tax assets and liabilities are recognized for the future tax consequences attributable to differences between the financial statement carrying amounts of existing assets and liabilities and their respective tax bases. Deferred tax assets and liabilities are measured using enacted tax rates expected to apply to taxable income in the years in which those temporary differences are expected to be recovered or settled. Under SFAS No. 109, the effect on deferred tax assets and liabilities of a change in tax rate is recognized in income in the period that includes the enactment date. A valuation allowance is established to reduce deferred tax assets if it is more likely than not that the related tax benefits will not be realized.
Reclassifications. Certain prior period amounts have been reclassified to conform to the 2006 presentation. These reclassifications had no impact on net income (loss), total stockholders’ equity or cash flows.
Note C. Disclosures about fair value of financial instruments
Cash and cash equivalents, accounts receivable, other current assets, accounts payable, interest payable and other current liabilities. The carrying amounts approximate fair value due to the short maturity of these instruments.
Notes receivable—officers and employees. The carrying amounts approximate fair value due to the comparability of the interest rate to risk-adjusted rates for similar financial instruments.
Line of credit and term note. The carrying amount of borrowings outstanding under the Company’s revolving credit facility and term note (see Note J) approximate fair value because the instruments bear interest at variable market rates.
Commodity price collars and price swaps. The fair value of commodity price collars and price swaps are estimated by management considering various factors, including closing exchange andover-the-counter quotations and the time value of the underlying commitments. Management’s estimated fair value represents the estimated amounts that the Company would expect to receive or pay to settle the derivative contracts (see Note I).
F-14
Table of Contents
Note D. Acquisitions and business combinations
Acquisition of interests in oil and gas properties and other assets. On December 7, 2004 one of the Company’s wholly owned subsidiaries, COG Oil & Gas LP (“COG LP”), acquired interests in several producing crude oil and natural gas fields and non-producing leasehold acreage in the Permian Basin region of Southeast New Mexico and West Texas from a privately-held company, Lowe Partners, LP (the “Seller”) (the “Lowe Acquisition”). In conjunction with this transaction, a separate wholly owned subsidiary of the Company, COG Realty LLC (“Realty”), acquired 100 percent ownership in two buildings in Midland, Texas from an affiliate of the Seller. This entire acquisition was accounted for using the purchase method of accounting. At the time of purchase, there was no difference in the book and tax basis of the acquired properties.
One property acquired was subject to a preferential right to purchase, giving a third party the right to acquire the Seller’s interest in such property. This preferential right was not fully exercised by its holder until after the closing of the Lowe Acquisition. As a result, COG LP acquired the property interests at closing and subsequently sold the subject interest to the holder of the preferential right on February 2, 2005 for the same amount as COG LP paid for the property interest at closing of the Lowe Acquisition, which was $2.21 million. Similar to the properties acquired by COG LP in the Lowe Acquisition, the sales price received has been adjusted, in accordance with the governing purchase and sale agreement, for property revenue, expense and other items related to periods prior to the effective date of September 1, 2004. This post-closing adjustment, in which COG LP paid the buyer approximately $247,000, was completed and settled on July 25, 2005.
The purchase price paid at closing of the Lowe Acquisition was adjusted, in accordance with the governing purchase and sale agreement, for property revenue, expense and other items related to periods from the effective date of September 1, 2004 to the post-closing date. This post-closing adjustment, in which the Seller paid COG LP approximately $948,000, was completed and settled on May 24, 2005.
The purchase and sale agreement governing the Lowe Acquisition provided for possible additional consideration (“Contingent Consideration”). COG LP paid Contingent Consideration of approximately $1,824,000 for each of the second, third and fourth quarters of 2005, aggregating approximately $5,473,000. These amounts were added to the allocation of the original purchase price of proved oil and gas properties. Similarly, in the settlement of the one property subject to a preferential right to purchase, the buyer owed COG LP approximately $35,000 of Contingent Consideration for each of the second, third and fourth quarters of 2005. These amounts aggregating $105,000 were included in the final allocation of purchase price of proved oil and gas properties at December 31, 2005. All three payments were received prior to December 31, 2005.
Effective July 25, 2005, Realty sold one of the buildings for cash in the amount of $850,000, prior to adjustment for closing costs. This building was deducted from the purchase price allocation.
As disclosed in Note B, in theOil and gas sales and imbalances section, the Company assumed natural gas and oil imbalances related to certain of the wells acquired. As such, the net overtake of 18,765 Mcf, valued at approximately $194,000, was included in the determination of the final allocated purchase price to the proved oil and gas properties.
F-15
Table of Contents
The following table summarizes the final allocated net purchase price of the Lowe Acquisition:
| (in thousands) | ||||
| Proved oil and gas properties | $ | 106,485 | ||
| Unproved oil and gas properties | 7,904 | |||
| Commercial real estate | 1,672 | |||
| Assets held for sale — preferential rights | 2,209 | |||
| Vehicles and other | 42 | |||
| Total assets acquired | 118,312 | |||
| Net gas imbalance liability | (194 | ) | ||
| Asset retirement obligations | (883 | ) | ||
| Total liabilities assumed | (1,077 | ) | ||
| Net purchase price | $ | 117,235 | ||
Business combination. On February 27, 2006, the Company closed a Combination Agreement with the Chase Group whereby ownership in certain oil and gas properties and non-producing leasehold acreage in Southeast New Mexico (the “Chase Group Properties”) were merged with the properties previously owned by CEHC. The results of the Chase Group Properties have been included in the consolidated financial statements since that date.
The Chase Group received cash in the aggregate amount of $409 million and 69,589,272 shares of Resources common stock valued at $384 million for an aggregate purchase price of $796 million including transaction costs. The value of the Resources common stock shares issued was determined based on an agreed upon fair market value of the assets purchased evaluated using reserve engineering estimates. This entire transaction was accounted for using the purchase method of accounting. At the time of the Combination, due to a difference in book and tax basis of the acquired properties, the Company recognized a deferred tax liability of approximately $227.7 million.
The following table summarizes the final allocated net purchase price of the Combination, including capitalized transaction costs:
| (in thousands) | ||||
| Proved oil and gas properties | $ | 830,540 | ||
| Unproved oil and gas properties | 200,000 | |||
| Total assets acquired | 1,030,540 | |||
| Asset retirement obligations | (6,158 | ) | ||
| Chase investors asset purchase obligation | (906 | ) | ||
| Deferred tax liability | (227,735 | ) | ||
| Total liabilities assumed | (234,799 | ) | ||
| Net purchase price | $ | 795,741 | ||
As discussed in Note K, the Company was obligated under the Combination Agreement to offer to purchase additional working interests in the Chase Group Properties from nine individuals
F-16
Table of Contents
within the Chase Group for total consideration of approximately $906,000. In April 2007, the Company satisfied this obligation by paying $255,000 in cash and issuing 108,457 shares of common stock. This aggregate purchase price is reflected inProved properties and the related obligation is reflected inAccrued liabilities in the accompanying consolidated balance sheet as of December 31, 2006.
The following table represents pro forma consolidated statements of operations as though the Combination had been completed as of January 1, 2005:
| Pro forma | ||||||
| Year ended December 31, | ||||||
| (in thousands, except per share data) (unaudited) | 2005 | 2006 | ||||
| Operating revenues | $ | 174,614 | $ | 219,746 | ||
| Net income applicable to common shareholders | $ | 19,006 | $ | 23,451 | ||
| Earnings per common share: | ||||||
| Basic | $ | 0.21 | $ | 0.22 | ||
| Diluted | $ | 0.21 | $ | 0.20 | ||
On February 27, 2006, the Company signed a contract operator agreement with Mack Energy Corporation (“MEC”) whereby the Company engaged MEC as contract operator to provide certain services with respect to the Chase Group Properties. See further discussion of related party transactions in Note O.
Note E. New accounting pronouncements
In July 2006, the FASB issued FIN No. 48 “Accounting for Uncertainty in Income Taxes—an Interpretation of FASB Statement 109”. FIN No. 48 clarifies that an entity’s tax benefits recognized in tax returns must be more likely than not of being sustained prior to recording the related tax benefit in the financial statements. As required by FIN No. 48, the Company will adopt this new accounting standard effective January 1, 2007. Management is currently reviewing the impact of FIN No. 48 on the Company’s consolidated financial statements.
In September 2006, the FASB issued SFAS No. 157, “Fair Value Measurement”. This statement defines fair value, establishes a framework for measuring fair value and expands disclosures about fair value measurements. This statement is effective for financial statements issued for fiscal years beginning after November 15, 2007. The Company will adopt SFAS No. 157 effective January 1, 2008. The Company is currently evaluating the impact of SFAS No. 157.
In September 2006, the Securities and Exchange Commission issued Staff Accounting Bulletin (SAB) 108, Financial Statements — Considering the Effects of Prior Year Misstatements when Quantifying Misstatements in Current year Financial Statements.” SAB 108 requires quantification of the impact of all prior year misstatements from both an income statement and a balance sheet perspective to determine if the misstatements are material. SAB 108 is effective for financial statements issued for fiscal years ending after November 15, 2006. The Company adopted SAB 108 effective at its inception.
F-17
Table of Contents
Note F. Asset retirement obligations
The Company’s asset retirement obligations represent the estimated present value of the estimated cash flows the Company will incur to plug, abandon and remediate its producing properties at the end of their production lives, in accordance with applicable state laws. The Company does not provide for a market risk premium associated with asset retirement obligations because a reliable estimate cannot be determined. The Company has no assets that are legally restricted for purposes of settling asset retirement obligations.
The following table summarizes the Company’s asset retirement obligation transactions recorded in accordance with the provisions of SFAS No. 143 during the years ended December 31, 2005 and 2006:
| (in thousands) | 2005 | 2006 | ||||||
| Asset retirement obligations, beginning of year | $ | 890 | $ | 1,120 | ||||
| Liability incurred upon acquiring and drilling wells | 196 | 7,443 | ||||||
| Accretion expense | 89 | 287 | ||||||
| Liabilities settled upon plugging and abandoning wells | (2 | ) | — | |||||
| Revisions to estimated cash flows | (53 | ) | (150 | ) | ||||
| Asset retirement obligations, end of year | $ | 1,120 | $ | 8,700 | ||||
| Note G. | Stockholders’ equity and stock issued subject to limited recourse notes |
Equity commitments. Pursuant to a stock purchase agreement (the “Stock Purchase Agreement”) entered into on August 13, 2004, the Company obtained private equity commitments totaling $202.5 million, comprised of equity commitments from fourteen private investors (the “Private Investors”) of approximately $188.9 million and equity commitments from the five original officers (the “Officers”) of the Company in the aggregate amount of $13.6 million. The original commitments were subject to call by a vote of the Board of Directors over a four year period beginning August 13, 2004 (the “Take-Down Period”), with the first date on which capital was called being August 13, 2004. Subsequent calls were made on November 11, 2004, June 22, 2005, December 7, 2005 and February 10, 2006. The percentage of total commitments called per capital call date was approximately 15.0 percent, 23.3 percent, 10.0 percent, 15.0 percent and 22.0 percent, respectively. In conjunction with the exchange of CEHC common stock for Resources common stock as of the date of the Combination, the remaining 14.7 percent of these private equity commitments was terminated.
The Private Investors agreed to make their investment for cash in the form of 18.9 million preferred unit (“Preferred Unit”) purchases for $10 each. Each Preferred Unit consisted of one share of 6% Series A Preferred Stock with a stated value of $9 per share, and one share of CEHC common stock with a stated value of $1 per share. The per unit price remained constant throughout the Take-Down Period.
The Officers committed to purchase 1.1 million Preferred Units for a fixed price of $10 per unit, with 15 percent of the purchase price paid in cash and the remaining 85 percent of the purchase price paid by issuing notes payable to the Company with recourse only to any equity security of the Company held by the respective officer (the “Purchase Notes”). In addition, the Officers agreed to purchase 5.3 million shares of CEHC common stock (4.775 shares of CEHC common
F-18
Table of Contents
stock for each Preferred Unit purchased) at a fixed price of $0.50 per share to be paid in cash. The one Preferred Unit and 4.775 shares of CEHC common stock are hereafter collectively referred to as a “Bundled Unit.” The purchase commitments for the Officers’ Bundled Units were to be fulfilled as called by the Board of Directors over the Take-Down Period proportionate to the committed equity purchases made by the Private Investors described above. The Officers’ commitments for Bundled Units totaled $13.6 million, consisting of $11.0 million for Preferred Units and $2.6 million for CEHC common stock. The portion of Preferred Units to be financed with Purchase Notes was $9.4 million.
In addition to this arrangement between the Private Investors and the Officers, certain employees of the Company entered into separate subscription agreements with the Company to purchase Preferred Units. These subscription agreements had similar terms to the Stock Purchase Agreement and were entered into over various dates on dates beginning (for the original employees) on August 13, 2004 and extending to employees who committed to purchase shares and joined the Company through January 1, 2006. For subscription agreements entered into through April 15, 2005, the per unit price was $10. Subsequent to that date, the per unit price was $15. Notable differences between the Officers’ subscription agreements and the employees’ subscription agreements were: (i) the amount of the purchase price required to be paid in cash by most employees was 25 percent of the Preferred Unit price and the amount of the Purchase Note was 75 percent of the Preferred Unit price (rather than the 15 percent and 85 percent, respectively, required of the Officers), and (ii) the employees did not have the right or obligation to purchase CEHC common shares in addition to the Preferred Units. The total commitments made by employees through individual subscription agreements were to purchase 0.5 million Preferred Units for an aggregate value of $5.7 million, of which $4.5 million could be financed with Purchase Notes.
The arrangements described above (the Stock Purchase Agreement and the individual employee subscription agreements) are hereinafter referred to as the “Subscription Agreements.”
Capital calls. On August 13, 2004, the Company completed an initial capital call of 2,833,500 Preferred Units from the Private Investors for $28,335,000 in cash. The second capital call on November 11, 2004, principally funded December 6, 2004, called for 4,401,370 Preferred Units from the Private Investors for $44,014,000 in cash. The Company’s third capital call on June 22, 2005, funded on July 1, July 15 and July 21, 2005, called for 1,889,000 Preferred Units from the Private Investors for $18,890,000 in cash. The Company’s fourth capital call on December 7, 2005, completed on December 30, 2005, called for an aggregate of 2,833,500 Preferred Units from the Private Investors for an aggregate consideration of $28,335,000. Of this amount, $9,953,000 had been received by the Company on December 31, 2005 and the remaining $18 million was included inAccounts receivable—related partiesin the accompanying consolidated balance sheet at December 31, 2005. This receivable was collected in full by January 9, 2006. The Company’s fifth capital call on February 10, 2006, principally funded February 23, 2006, called for 4,155,800 Preferred Units from the Private Investors for $41,558,000 in cash.
Additionally, on August 13, 2004, the Officers and certain employees of the Company purchased 788,000 shares of CEHC common stock and 177,750 Preferred Units for consideration consisting of $668,000 in cash and Purchase Notes in the aggregate principal amount of $1,504,000. For the second capital call, principally funded December 6, 2004, the Officers and certain employees of the Company purchased an additional 1,223,716 shares of CEHC common stock and 276,105 Preferred Units for consideration consisting of $1,037,000 in cash and Purchase Notes in the aggregate principal amount of $2,336,000. For the third capital call, funded on July 1 and
F-19
Table of Contents
July 15, 2005, the Officers and certain employees of the Company purchased 525,200 shares of CEHC common stock and 147,750 Preferred Units for consideration consisting of $500,000 in cash and Purchase Notes in the aggregate principal amount of $1,248,000. For the fourth capital call, completed December 30, 2005, the Officers and employees of the Company purchased 787,801 shares of CEHC common stock and an aggregate of 234,378 Preferred Units for consideration of $798,000 in cash and Purchase Notes in the aggregate principal amount of $2,015,000. Of the cash amount, $464,000 had been received by the Company prior to December 31, 2005 and the remaining $334,000 was included inAccounts receivable—related partiesin the accompanying consolidated balance sheet at December 31, 2005. This receivable was collected in full by February 2, 2006. For the Company’s fifth capital call, principally funded February 23, 2006, the Officers and certain employees purchased 1,155,440 shares of CEHC common stock and 351,670 Subscribed Units for consideration consisting of $1,200,000 in cash and Purchase Notes in the aggregate principal amount of $3,044,000.
Eleven employees of the Company, hired at various dates during the year ended December 31, 2005, purchased when hired, an aggregate of 165,743 Preferred Units for consideration consisting of $412,000 in cash and Purchase Notes in the aggregate principal amount of $1,543,000. Of the cash amount, $364,000 had been received by the Company prior to December 31, 2005 and the remaining $48,000 was included inAccounts receivable—related partiesin the accompanying consolidated balance sheet at December 31, 2005. This receivable was collected in full by February 23, 2006. Two additional employees, hired as of January 1, 2006, purchased when hired an aggregate of 10,128 Preferred Units for consideration consisting of $38,000 in cash and Purchase Notes in the aggregate principal amount of $114,000.
Through February 23, 2006, the Private Investors purchased 16,113,170 Preferred Units for $161.1 million in cash. The Officers had purchased 4,480,157 CEHC common shares and 938,303 Preferred Units for $3.6 million in cash and Purchase Notes totaling $8.0 million. Certain employees purchased 425,221 Preferred Units for $1.0 million in cash and Purchase Notes totaling $3.8 million.
Series A preferred stock. The preferred stock of the Company consists of 30 million authorized shares of 6% Series A Preferred Stock with a stated value of $9.00 per share and par value of $0.01 per share. Such shares bear a 6 percent dividend, payable annually in arrears with accrual of such dividend commencing on the date of issue. The Company may elect to pay the dividend in whole or in part in cash or in additional Units. Upon liquidation, the 6% Series A Preferred Stock would be ranked senior to all other classes of shares.
Preferred stock dividends are generally paid on the anniversary of date of issue. Preferred stock dividends of $4,160,000 and $2,567,000 were paid during the years ended December 31, 2005 and 2006, respectively. As discussed in Note A and below, the majority of the CEHC preferred stock was converted into Resources common stock on the Combination date. Final dividend payments on converted CEHC 6% Series A Preferred Stock were paid in March 2006.
Dividend payments continued to be made to the eighteen employee shareholders that did not convert their shares of CEHC preferred stock to Resources common stock through April 16, 2007. On April 16, 2007, these CEHC preferred shares were exchanged for 381,934 shares of the Company’s common stock.
F-20
Table of Contents
Preferred stock. The Board of Directors is authorized to issue up to 10,000,000 shares of preferred stock with a par value of $0.001 per share (“Preferred Stock”). The Board of Directors will determine for each series of issuance:
| • | the number of shares in any series |
| • | voting powers, if any |
| • | redemption provisions, if any |
| • | dividend rate and other dividend attributes and |
| • | convertible features or attached rights, if any. |
As of December 31, 2006, no shares of Preferred Stock had been issued.
Notes receivable from Officers and certain employees. At December 31, 2005 and 2006, the Company had Purchase Notes receivable from the Officers and certain employees of approximately $9,012,000 and $12,858,000, respectively. These amounts were comprised of aggregate principal amounts of $8,645,000 and $11,803,000, respectively, and accrued interest of $367,000 and $1,055,000, respectively. The maturity date of the Purchase Notes, five years from the date of issuance, range from August 13, 2009 to January 1, 2011, and the stated annual interest rate on all Purchase Notes is 6 percent. Interest is compounded annually; all accrued and unpaid interest on the Purchase Notes is due and payable at maturity. Performance of the Officers’ and all but one of the employees’ obligations under these Purchase Notes is secured by security interests granted by each of the Officers and certain employees of the Company in all equity securities of the Company purchased. Additionally, with respect to one employee, the Company has full recourse against the assets of the employee for collection of amounts due upon the occurrence of a default that is not remedied.
Accounting for issuances to Officers and certain employees. Based on guidance contained in SFAS No. 123R, the agreements to sell stock to the Officers and certain employees subject to Purchase Notes are accounted for as the issuance of options (“Capital Options”) on the dates that the various Subscription Agreements were signed and the purchase commitments were made. Factors that led to the Company’s determination of this accounting treatment included (i) the non-recourse nature of the Purchase Notes, (ii) the ability of the Officers or certain employees to elect not to purchase the CEHC common stock or Preferred Units, and (iii) the absence of substantial penalties for choosing not to participate in capital calls, other than the inability to participate in subsequent capital calls.
In the case of committed equity issuances to the Officers, the Company also considered the close relationship between the Preferred Units and the CEHC common shares. As discussed above, the CEHC common shares were (and all equity securities of the Company held by the Officers now are) additional security for the Purchase Notes, and the Officer could not choose to purchase one security without fulfilling his associated commitment to purchase the other. As a result, the commitment to purchase Preferred Units and CEHC common shares by the Officers is treated as one “bundled” Capital Option (“Bundled Capital Option”). Discussions in these financial statements about Capital Options include Bundled Capital Options unless a separate breakdown between Capital Options and Bundled Capital Options is provided.
The Capital Options issued to certain employees and the Officers were considered to vest based upon performance criteria, which the Company determined to be the action of the CEHC Board of Directors in making a capital call. Compensation expense was recorded based on the grant
F-21
Table of Contents
date fair value of Capital Options vested at each date vesting occurred by approval of a capital call by the CEHC Board of Directors. Consequently, no compensation expense will be recorded for Capital Options which were not vested by a capital call.
Valuation of stock issuances treated as Capital Options. As discussed in Note B, effective January 1, 2005, the Company adopted the provisions of SFAS No. 123R, using the modified retrospective basis to account for its stock-based compensation plans. In calculating the grant date fair value and compensation expense for the issuances treated as grants of Capital Options, the Company estimated the fair value of each grant using the Black-Scholes option-pricing model. The weighted average assumptions utilized in the model were as follows:
| 2004 | 2005 | 2006 | |||||||
| Risk-free interest rates | 3.14% | 3.76% | 4.37% | ||||||
| Expected life | 4.00 years | 3.28 years | 2.61 years | ||||||
| Expected volatility | 43.30% | 34.99% | 34.33% | ||||||
| Expected dividend yield | 0% | 0% | 0% | ||||||
The expected life of each Capital Option was based on an initial expected term of four years beginning on August 13, 2004. This four year term was determined by management based on experience with similarly organized companies and the expectation of either a public offering of the Company’s stock or the sale of the Company or its assets during that time period, leading to an expected exercise of all options. Volatilities are based on historical volatilities of publicly traded securities of similarly sized domestic exploration and production companies.
There are no tax benefits related to either the Bundled Capital Options nor the Capital Options.
F-22
Table of Contents
The following table summarizes the Bundled Capital Options granted to the Officers for the periods ended December 31, 2004, 2005 and 2006:
| Number of | Weighted | |||||||||
| Bundled Capital | average | Grant date | ||||||||
| Options | exercise price | fair value | ||||||||
| Period from inception (April 21, 2004) | ||||||||||
| through December 31, 2004 | ||||||||||
| Outstanding at beginning of period | — | $ | — | |||||||
| Bundled Capital Options granted | 1,100,000 | $ | 9.52 | $ | 2,310,000 | |||||
| Cancelled / forfeited | — | $ | — | |||||||
| Outstanding at end of period | 1,100,000 | $ | 9.52 | |||||||
| Vested outstanding at end of period | 421,299 | $ | 9.52 | |||||||
| Year ended December 31, 2005 | ||||||||||
| Outstanding at beginning of period | 1,100,000 | $ | 9.52 | |||||||
| Bundled Capital Options granted | — | $ | — | $ | — | |||||
| Cancelled / forfeited | — | $ | — | |||||||
| Outstanding at end of period | 1,100,000 | $ | 9.52 | |||||||
| Vested outstanding at end of period | 696,303 | $ | 9.52 | |||||||
| Year ended December 31, 2006 | ||||||||||
| Outstanding at beginning of period | 1,100,000 | $ | 9.52 | |||||||
| Bundled Capital Options granted | — | $ | — | $ | — | |||||
| Cancelled / forfeited | (161,697 | ) | $ | 9.52 | ||||||
| Outstanding at end of period | 938,303 | $ | 9.52 | |||||||
| Vested outstanding at end of period | 938,303 | $ | 9.52 | |||||||
Subsequent to February 27, 2006, each Bundled Capital Option is exercisable for 7.275 shares of Resources common stock.
The following table summarizes information about the Company’s Vested Bundled Capital Options outstanding and exercisable at December 31, 2006:
| Vested Bundled Capital Options Outstanding and Exercisable | |||||||||
| Number | Weighted | ||||||||
| outstanding, vested | average | Weighted | Intrinsic | ||||||
| and exercisable at | remaining | average | value at | ||||||
| December 31, | contractual | exercise | December 31, | ||||||
| 2006 | life | price | 2006 | ||||||
| 938,303 | 3.45 years | $ | 9.52 | $ | 45,655,000 | ||||
The total amount of cash and Purchase Notes delivered for each Bundled Unit during the capital call period of CEHC was $12.39 consisting of $10.00 for each Preferred Unit which included one CEHC common share and one CEHC preferred share, and $0.50 per bundled CEHC common share (4.775 CEHC common shares per bundle totaling $2.39 per Bundled Unit). Each Bundled Unit issued to the Officers also required a cash payment of $3.89per-unit which includes 15 percent of
F-23
Table of Contents
the $10.00 Preferred Unit price or $1.50 plus the $2.39 for the additional common shares included in the Bundled Unit. The weighted average exercise price is derived from the per Bundled Unit amount of the Purchase Notes (85 percent of the $10.00 Preferred Unit price or $8.50) adjusted for interest on such Purchase Notes and dividends on CEHC preferred shares included in the Bundled Unit through the estimated Purchase Note repayment or “exercise” date.
As mentioned above, Bundled Capital Options issued to the Officers vested upon the action of the CEHC Board of Directors in making a capital call. As of the date of the Combination, all remaining capital commitments were terminated; therefore, there will be no future CEHC capital calls. As a result, no compensation expense will be recognized on the unvested 161,697 Bundled Capital Options because they were terminated on February 27, 2006. The grant date fair value associated with the unvested options was $339,000.
The following table summarizes the Capital Options granted to certain employees for the periods ended December 31, 2004, 2005 and 2006:
| Number of | Weighted | |||||||||
| Capital | average | Grant date | ||||||||
| Options | exercise price | fair value | ||||||||
| Period from inception (April 21, 2004) | ||||||||||
| through December 31, 2004 | ||||||||||
| Outstanding at beginning of period | — | $ | — | |||||||
| $10 Capital Options granted | 85,000 | $ | 8.40 | $ | 169,000 | |||||
| Cancelled / forfeited | — | $ | — | |||||||
| Outstanding at end of period | 85,000 | $ | 8.40 | |||||||
| Vested outstanding at end of period | 32,555 | $ | 8.40 | |||||||
| Year ended December 31, 2005 | ||||||||||
| Outstanding at beginning of period | 85,000 | $ | 8.40 | |||||||
| $10 Capital Options granted | 277,500 | $ | 9.05 | $ | 1,528,000 | |||||
| $15 Capital Options granted | 120,000 | $ | 12.28 | $ | 251,000 | |||||
| Cancelled / forfeited | — | $ | — | |||||||
| Outstanding at end of period | 482,500 | $ | 9.74 | |||||||
| Vested outstanding at end of period | 305,422 | $ | 9.74 | |||||||
| Year ended December 31, 2006 | ||||||||||
| Outstanding at beginning of period | 482,500 | $ | 9.74 | |||||||
| $10 Capital Options granted | — | $ | — | $ | — | |||||
| $15 Capital Options granted | 16,000 | $ | 12.13 | $ | 45,000 | |||||
| Cancelled / forfeited | (73,279 | ) | $ | 9.81 | ||||||
| Outstanding at end of period | 425,221 | $ | 9.81 | |||||||
| Vested outstanding at end of period | 425,221 | $ | 9.81 | |||||||
F-24
Table of Contents
Subsequent to February 27, 2006, each Capital Option is exercisable for 2.5 shares of Resources common stock.
The following table summarizes information about the Company’s vested Capital Options outstanding and exercisable at December 31, 2006:
| Vested Options Outstanding and Exercisable | |||||||||||||
| Number | Weighted | ||||||||||||
| outstanding, vested | average | Weighted | Intrinsic | ||||||||||
| and exercisable at | remaining | average | value at | ||||||||||
| December 31, | contractual | exercise | December 31, | ||||||||||
| 2006 | life | price | 2006 | ||||||||||
| $ | 10.00 | 309,213 | 3.61 years | $ | 8.90 | $ | 3,268,000 | ||||||
| $ | 15.00 | 116,008 | 3.83 years | $ | 12.26 | $ | 633,000 | ||||||
| 425,221 | $ | 9.81 | $ | 3,901,000 | |||||||||
Each Preferred Unit issued to employees also required a cash payment of approximately 25 percent of the total unit price, resulting in a weighted average per unit cash payment of $2.06, $2.37 and $2.36 per unit for total Capital Options granted in 2004, 2005 and 2006, respectively. The weighted average exercise price is derived from the per unit amount of the Purchase Note adjusted for interest on such notes and dividends on CEHC preferred shares included in the unit through the estimated repayment or “exercise” date.
As mentioned above, Capital Options issued to certain employees vested upon the action of the CEHC Board of Directors in making a capital call. Upon the closing of the Combination, all remaining capital commitments were terminated; therefore, there will be no future capital calls. As a result, no compensation expense will be recognized on the unvested 73,279 Capital Options because they were terminated on February 27, 2006. The grant date fair value associated with the unvested options was $293,000.
F-25
Table of Contents
The following table summarizes the stock-based compensation for all Capital Options and is included inGeneral and administrative expense in the accompanying consolidated statement of operations for the periods ended December 31, 2004, 2005 and 2006:
| Inception | |||||||||
| (April 21, 2004) | |||||||||
| through | Year ended | Year ended | |||||||
| December 31, | December 31, | December 31, | |||||||
| 2004 | 2005 | 2006 | |||||||
| Stock-based compensation expense from Capital Options: | $ | 950,000 | $ | 1,746,000 | $ | 975,000 | |||
| Bundled Capital Options | |||||||||
| Stock-based compensation expense | $ | 885,000 | $ | 578,000 | $ | 508,000 | |||
| Options vesting during period | 421,299 | 275,004 | 242,000 | ||||||
| Weighted average grant date fair value per option | $ | 2.10 | $ | 2.10 | $ | 2.10 | |||
| Capital Options | |||||||||
| Stock-based compensation expense | $ | 65,000 | $ | 1,168,000 | $ | 467,000 | |||
| Options vesting during period | 32,555 | 272,867 | 119,799 | ||||||
| Weighted average grant date fair value per option | $ | 2.00 | $ | 4.28 | $ | 3.90 | |||
Conversion of CEHC 6% Series A Preferred Stock and CEHC common stock. On February 27, 2006, concurrent with the closing of the Combination described in Notes A and D, the majority of the shares of CEHC preferred stock and shares of CEHC common stock outstanding were converted to shares of Resources common stock, as described below.
A total of 17,222,073 shares of CEHC preferred stock outstanding and held by the Officers and one employee were converted to shares of Resources common stock at the ratio of 1.5 shares of Resources common stock for each share of CEHC preferred stock, resulting in the issuance of 25,833,116 shares of Resources common stock. Dividends accrued through the date of conversion in the amount of $2,491,000 were paid to the holders of the CEHC preferred stock who were subject to the conversion. A total of 21,702,230 shares of CEHC common stock outstanding and held by the Officers and one employee were converted to shares of Resources common stock at the ratio of 1:1.
Eighteen employee shareholders owning an aggregate of 254,621 shares of CEHC preferred stock and 254,621 shares of CEHC common stock did not convert their shares to Resources common stock at the date of the Combination. On April 16, 2007, these remaining shares of CEHC were exchanged for 636,555 shares of the Company’s common stock.
Also in conjunction with the Combination described in Notes A and D and the conversion of CEHC preferred stock into Resources common stock at the ratio of 1.5:1, the CEHC Bundled Capital Options were converted into Resources Bundled Capital Options and CEHC Capital Options were converted into Resources Capital Options. The Resources Bundled Capital Options are each considered to be exercisable for 7.275 shares of Resources common stock and the Resources Capital Options are considered to be exercisable for 2.5 shares of Resources common stock.
F-26
Table of Contents
The following table summarizes the conversion of the Bundled Capital Options and Capital Options in conjunction with the Combination:
Officer group:
| Bundled Capital Option | Bundled Capital Option | |||||||||||||||||
| Preferred Unit(a) | ||||||||||||||||||
| CEHC preferred | ||||||||||||||||||
| Bundled | stock to | Total | Total | |||||||||||||||
| Capital | Common | Common | Resources | common | preferred | |||||||||||||
| Options(b) | stock(c) | stock | common stock | stock | stock | |||||||||||||
| CEHC vested | 938,303 | 4,480,157 | 938,303 | 938,303 | 5,418,460 | 938,303 | ||||||||||||
| Conversion ratios | 1.00 | 1.00 | 1.00 | 1.50 | ||||||||||||||
| Resources vested | 938,303 | 4,480,157 | 938,303 | 1,407,455 | 6,825,915 | — | ||||||||||||
Certain employees group:
| Capital Option | |||||||||||||||
| Preferred Unit(a) | Capital Option | ||||||||||||||
| CEHC preferred | |||||||||||||||
| stock to | Total | Total | |||||||||||||
| Capital | Common | Resources | common | preferred | |||||||||||
| Options(d) | stock | common stock | stock | stock | |||||||||||
| CEHC vested | 425,221 | 425,221 | 425,221 | 425,221 | 425,221 | ||||||||||
| Conversion ratios | 1.00 | 1.00 | 1.50 | ||||||||||||
| Resources vested | 425,221 | 425,221 | 637,832 | 1,063,053 | — | ||||||||||
| (a) | Each Preferred Unit reflects one share of CEHC preferred stock and one share of CEHC common stock. Each share of CEHC preferred stock can be converted into 1.5 shares of Resources common stock. | |
| (b) | Each Bundled Capital Option reflects 4.775 shares of CEHC common stock and one Preferred Unit. Each Bundled Capital Option can be converted into 7.275 shares of Resources common stock. | |
| (c) | The Officers agreed to purchase 4.775 shares of CEHC common stock for each Preferred Unit purchased. | |
| (d) | Each Capital Option reflects one Preferred Unit. Each Capital Option can be converted into 2.5 shares of Resources common stock. |
Common stock held in escrow. On February 27, 2006 the Company entered into an agreement with certain stockholders of the Company in which certain of the Company’s shareholders placed 861,501 shares of Resources common stock in an escrow account (the “Escrow Agreement”). The Escrow Agreement provided that if, on or before February 27, 2007 (the “Initial Period”), the Company consummated one of two specified transactions, the shares held in escrow would be released to the Company for reissuance to Messrs. Leach, Beal, Copeland, Kamradt and Wright. Neither of those specified transactions occurred in the Initial Period. However, the Escrow Agreement specified that if neither of the two specified transactions occurred during the Initial Period, a sale of the Company in a business combination on or before August 26, 2007 where the per share valuation of the Company’s common stock in such sale was equal to or greater than $14.00 per share would result in the release of the shares held in
F-27
Table of Contents
escrow to the Company for reissuance to Messrs. Leach, Beal, Copeland, Kamradt and Wright. These shares have been treated as issued and outstanding in the consolidated financial statements at December 31, 2006. If this condition occurs, the Company will be required to record approximately $4.8 million of compensation expense when the condition is met. If this condition does not occur, the escrow agent will distribute the escrowed shares to the registered owners thereof that originally deposited the shares.
Registration rights agreement. In connection with the Combination, the Company entered into a registration rights agreement with the current stockholders of Resources. According to the registration rights agreement, holders of either 20 percent of the aggregate shares held by the Chase Group or 20 percent of the aggregate shares held by the former stockholders of CEHC may request in writing that the Company register their shares by filing a registration statement under the Securities Act of 1933 (the “Securities Act”), so long as the anticipated aggregate offering price, net of underwriting discounts and commissions, exceeds $50 million.
If the Company proposes to file a registration statement under the Securities Act relating to an offering of Resources common stock, upon the written request of holders of registrable securities, the Company is required to use its commercially reasonable efforts to include in such registration, and any related underwriting, all of the registrable securities requested to be included, subject to customary cutback provisions. There is no limit to the number of these “piggy-back” registrations in which these holders may request their shares to be included.
The Company generally will bear the registration expenses incurred in connection with any registration, including all registration, filing and qualification fees, printing and accounting fees, but excluding underwriting discounts and commissions. The Company has agreed to indemnify these stockholders against certain liabilities, including liabilities under the Securities Act, in connection with any registration effected under the registration rights agreement. The Company is not obligated to affect any registration more than one time in any six month period and these registration rights terminate 10 years after the date of closing of the initial offering.
Note H.Stock incentive plan
On August 13, 2004, the Board of Directors approved a stock option plan (the “Stock Option Plan”) that is administered by the Board’s Compensation Committee and provides for the granting of incentive awards in the form of stock options to employees of the Company. Prior to the Combination, the options granted were to purchase Preferred Units in CEHC. As of February 27, 2006, in conjunction with the conversion of the CEHC preferred stock and CEHC common stock into Resources common stock, the Company adopted and restated the Stock Option Plan to reflect such events (the “Amended and Restated Stock Option Plan”). The option holders and the Company had the same rights in the Amended and Restated Stock Option Plan as they did in the Stock Option Plan. The Amended and Restated Stock Option Plan changed the option exercise prices to reflect the conversion and exchange transactions, and changed the vesting schedule for all outstanding stock options.
Effective June 1, 2006, the Compensation Committee approved the 2006 Stock Incentive Plan (together with applicable option agreements and restricted stock agreements, the “Plan”) that
F-28
Table of Contents
provides for granting stock options and restricted stock awards to employees and individuals associated with the Company. The Plan generally supercedes the Amended and Restated Stock Option Plan. The Plan, administered by the Compensation Committee, may grant stock options, restricted stock awards or any combination thereof not to exceed an aggregate maximum number of 11,700,000 shares of common stock.
Restricted stock awards. On June 1, 2006, the Compensation Committee approved the issuance of restricted stock to eight of the Company’s directors. Under the Plan, the Company issued 80,000 shares of common stock, subject to certain restrictions as set forth in the Plan. These restrictions lapsed with respect to 100 percent of the restricted shares on January 2, 2007.
On June 28, 2006, the Company issued 311,489 shares of common stock to certain non-officer employees, subject to certain restrictions as set forth in the Plan. Provided that the employee has been continuously employed by the Company from the date of grant through the lapse date, the restrictions will lapse with respect to 100 percent of the restricted shares on the earlier of (i) the third annual anniversary of the date of grant, (ii) the date upon which a change of control, as defined in the Plan, occurs, or (iii) the date upon which the employee’s employment with the Company is terminated by reason of death, disability or involuntary termination, as defined in the Plan. During the third and fourth quarters of 2006, as defined in the Plan, the Company issued 32,679 and 2,958 additional shares, respectively, of common stock to new employees, subject to the same restrictions described above.
All restricted shares are treated as issued and outstanding in the accompanying consolidated balance sheets. If an employee terminates employment prior the lapse date, the awarded shares are forfeited and cancelled and are no longer considered issued and outstanding. A summary of the Company’s restricted stock awards during the year ended December 31, 2006 is presented below:
| Number of | Grant date | ||||||
| common shares | fair value | ||||||
| Restricted stock: | |||||||
| Outstanding at January 1, 2006 | — | ||||||
| Shares granted | 427,126 | $ | 3,289,000 | ||||
| Shares canceled / forfeited | (2,736 | ) | |||||
| Lapse of restrictions | — | ||||||
| Outstanding at December 31, 2006 | 424,390 | ||||||
The Company recorded approximately $1,044,000 in compensation expense for the year ended December 31, 2006 for restricted stock issuances. Future stock-based compensation expense related to restricted stock outstanding at December 31, 2006 for the years ended December 31, 2007, 2008, and 2009 is approximately $882,000, $882,000, and $454,000 respectively. The Company does not expect to recognize a reduction of approximately $27,000 in stock-based compensation expense due to estimated forfeitures. The income tax benefit recognized in the accompanying statement of operations for restricted stock was $407,000 for the year ended December 31, 2006.
Stock option awards. The stock options granted from August 13, 2004 through February 23, 2006 under the Stock Option Plan were to purchase Preferred Units. A portion of the options vested based upon passage of time (“Time Vesting”) and a portion of the options vested based
F-29
Table of Contents
upon the Company obtaining certain results related to a liquidation value (“Performance Vesting”). Seventy-eight percent of the aggregate options granted were vested based on Time Vesting, in which they vested one-third each year for a three year period, which would result in approximately 61 percent, 28 percent and 11 percent of their total grant date fair value being expensed in the first, second and third years, respectively, commencing on the first anniversary of the date of grant. The remaining 22 percent of the aggregate options granted were vested based on Performance Vesting. Performance Vesting was considered to be achieved when the Company attained a liquidation valuation which resulted in a 25 percent internal rate of return and a return on investment of two times the total dollars invested by the original shareholders of the Company, upon the occurrence of one of the following events:
(i) the liquidation, dissolution or winding up of the affairs of the Company,
(ii) a sale of all or substantially all of the assets of the Company and a distribution to the shareholders of the proceeds of such sale, or
(iii) any merger, consolidation or other transaction resulting in at least 50 percent of the voting securities of the Company being owned by a single person or a group.
As a result of the Combination, event (iii) listed above occurred, which resulted in a change of control as defined in the Stock Option Plan. As such, the 78 percent of the aggregate options which vested based on Time Vesting were immediately vested as of the date of the Combination. CEHC’s Board of Directors determined that, based upon the value received by the CEHC shareholders in the Combination, the thresholds for internal rate of return and return on investment which determined the portion of vesting based on Performance Vesting, were not met and that 22 percent portion of the options were not vested.
The CEHC Board of Directors later decided that CEHC would vest the 22 percent of aggregate stock options based on Performance Vesting for only the stock option holders who were non-officers. The CEHC Board of Directors also determined CEHC would vest the 22 percent of aggregate stock options based on Performance Vesting for the officers at the end of three years, which will result in approximately 33 percent, 33 percent and 34 percent of their total grant date fair value being expensed in the first, second, and third years, respectively, commencing on the first anniversary of the date of grant.
A summary of CEHC’s stock option activity, under the Stock Option Plan, for the period from April 21, 2004 (CEHC inception date) to December 31, 2004, the year ended December 31, 2005 and the period ended February 27, 2006 (Combination date) is presented below. The amounts
F-30
Table of Contents
shown are immediately prior to the conversion of CEHC stock options to Resources stock options as a result of the Combination:
| Inception | |||||||||||||||||||
| (April 21, 2004) | January 1, 2006 | ||||||||||||||||||
| through | Year ended | through February 27, | |||||||||||||||||
| December 31, 2004 | December 31, 2005 | 2006 | |||||||||||||||||
| Weighted | Weighted | Weighted | |||||||||||||||||
| Number of | average | Number of | average | Number of | average | ||||||||||||||
| units(a) | price | units(a) | price | units(a) | price | ||||||||||||||
| Stock options for Preferred Units: | |||||||||||||||||||
| Outstanding at beginning of period | — | $ | — | 724,257 | $ | 10.00 | 1,365,075 | $ | 10.32 | ||||||||||
| Options granted | 724,257 | $ | 10.00 | 665,247 | $ | 10.66 | 514,267 | $ | 10.68 | ||||||||||
| Options forfeited | — | $ | — | (24,429 | ) | $ | 10.00 | — | $ | — | |||||||||
| Options exercised | — | $ | — | — | $ | — | — | $ | — | ||||||||||
| Outstanding at end of period | 724,257 | $ | 10.00 | 1,365,075 | $ | 10.32 | 1,879,342 | $ | 10.42 | ||||||||||
| Exercisable at end of period | — | $ | — | 182,033 | $ | 10.00 | 1,562,770 | $ | 10.51 | ||||||||||
| (a) | Each option Unit can be exercised for one Preferred Unit which is comprised of one share of CEHC common stock and one share of CEHC preferred stock. |
Under the Plan, effective June 12, 2006, the Company’s Board of Directors approved the issuance of 900,000 stock options to the current officers of the Company, which is comprised of the CEHC Officers and one certain employee. These options have an exercise price of $6, a contractual term of 10 years from the date of grant, and vest using a four year graded vesting schedule which will result in approximately 52 percent, 27 percent, 15 percent and 6 percent of their total grant date fair value being expensed in the first, second, third and fourth years, respectively, commencing on the first anniversary of the date of grant.
Also in conjunction with the Combination described in Notes A and D and the conversion of CEHC preferred stock into Resources common stock at the ratio of 1.5:1, the CEHC unit options were converted into Resources stock options. Each CEHC unit option, (considered to be exchangeable for one share of CEHC preferred stock and one share of CEHC common stock), was converted into 2.5 options to purchase common stock of Resources. Each Resources stock option is considered to be exchangeable for one share of Resources common stock. The
F-31
Table of Contents
following table summarizes the conversion of the CEHC unit options in conjunction with the Combination:
| CEHC | CEHC | Resources | |||||||||||
| Unit Option | Unit | Conversion | Option | Resources | |||||||||
| Exercise Price | Options | Rate | Exercise Price | Options | |||||||||
| $ | 10.00 | 1,721,010 | 2.5:1 | $ | 4.00 | 4,302,312 | |||||||
| $ | 15.00 | 158,332 | 2.5:1 | $ | 6.00 | 396,019 | |||||||
| Total | 1,879,342 | Total | 4,698,331 | ||||||||||
A summary of the Company’s stock option activity under the Plan, for the period from February 27, 2006 through December 31, 2006 is presented below. The amounts shown below are on a post-combination and post-conversion basis:
| February 27, 2006 | |||||||
| through December 31, | |||||||
| 2006 | |||||||
| Weighted | |||||||
| Number of | average | ||||||
| options(a) | price | ||||||
| Stock options: | |||||||
| Outstanding at beginning of period | 4,698,331 | $ | 4.17 | ||||
| Options granted | 900,000 | $ | 6.00 | ||||
| Options forfeited | (2,230 | ) | $ | 5.44 | |||
| Options exercised | — | $ | — | ||||
| Outstanding at end of period | 5,596,101 | $ | 4.46 | ||||
| Exercisable at end of period | 3,904,645 | $ | 4.20 | ||||
| (a) | One option can be exercised for one share of Resources common stock. |
The following table summarizes information about the Company’s vested stock options outstanding and exercisable at December 31, 2006:
| Number | Vested options outstanding and exercisable | ||||||||||||
| outstanding, | Weighted | ||||||||||||
| vested and | average | Weighted | Intrinsic | ||||||||||
| exercisable at | remaining | average | value at | ||||||||||
| Exercise | December 31, | contractual | exercise | December 31, | |||||||||
| prices | 2006 | life | price | 2006 | |||||||||
| $ | 4.00 | 3,510,235 | 8.47 years | $ | 4.00 | $ | 15,099,000 | ||||||
| $ | 6.00 | 394,410 | 8.86 years | $ | 6.00 | $ | 769,000 | ||||||
| 3,904,645 | $ | 4.20 | $ | 15,868,000 | |||||||||
As discussed in Note B, effective January 1, 2005, the Company adopted SFAS No. 123R using the modified retrospective basis to account for its stock-based compensation plans. The following
F-32
Table of Contents
table summarizes information about stock-based compensation for options which is recognized inGeneral and administrative expense in the accompanying consolidated statement of operations for the periods ended December 31, 2004, 2005 and 2006:
| Inception | |||||||||
| (April 21, 2004) | Year ended | Year ended | |||||||
| through December 31, | December 31, | December 31, | |||||||
| 2004 | 2005 | 2006 | |||||||
| Grant date fair value: | |||||||||
Time vesting options(a) | $ | 2,013,000 | $ | 2,891,000 | $ | 1,931,000 | |||
| Performance vesting options: | |||||||||
Officers(b) | 557,000 | 606,000 | 500,000 | ||||||
Certain employee(b) | — | 91,000 | 31,000 | ||||||
Non-officers(c) | 107,000 | 278,000 | 142,000 | ||||||
Current officer stock options(d) | — | — | 3,555,000 | ||||||
| Total | $ | 2,677,000 | $ | 3,866,000 | $ | 6,159,000 | |||
| Stock-based compensation expense from stock options: | |||||||||
Time vesting options(a) | $ | 178,000 | $ | 1,506,000 | $ | 5,085,000 | |||
| Performance vesting options: | |||||||||
Officers(b) | — | — | 511,000 | ||||||
Non-officers(c) | — | — | 505,000 | ||||||
Current officer stock options(d) | — | — | 1,024,000 | ||||||
| Total | $ | 178,000 | $ | 1,506,000 | $ | 7,125,000 | |||
| (a) | Vested immediately as of the date of the Combination, from change of control. | |
| (b) | Vesting revised to a three year cliff vesting schedule by approval of CEHC’s Board of Directors. | |
| (c) | Vested as of the date of the Combination by approval of CEHC’s Board of Directors. | |
| (d) | June 12, 2006 option grant, by approval of the Company’s Board of Directors. |
Future stock-based compensation expense related to incentive stock options outstanding at December 31, 2006 for the years ended December 31, 2007, 2008, 2009 and 2010 is approximately $1,962,000, $1,322,000, $443,000, and $99,000 respectively. The Company does not expect to recognize a reduction of approximately $67,000 in compensation expense due to forfeitures.
Income tax benefit recognized in the income statement for these stock-based compensation arrangements was $63,000, $528,000 and $2,779,000 for 2004, 2005 and 2006, respectively. No amounts have been treated as deductions to the Company’s current taxable income for 2004, 2005 or 2006 since no options have been exercised. In calculating the compensation expense for options, the Company has estimated the fair value of each grant using the Black-Scholes option-
F-33
Table of Contents
pricing model. Assumptions utilized in the model are shown below. Amounts shown are assumptions under the Plan for options exercisable for Resources common stock at a rate of 1:1:
| 2004 | 2005 | 2006 | |||||||
| Risk-free interest rates | 3.29% | 4.12% | 4.81% | ||||||
| Expected term | 3.81 years | 2.89 years | 2.87 years | ||||||
| Expected volatility | 40.24% | 34.87% | 37.12% | ||||||
| Expected dividend yield | — | — | — | ||||||
Note I. Derivative financial instruments
Cash flow hedges. The Company, from time to time, uses derivative financial instruments as cash flow hedges of its commodity price risks. Commodity hedges are used to (a) reduce the effect of the volatility of price changes on the natural gas and crude oil the Company produces and sells and (b) support the Company’s annual capital budgeting and expenditure plans.
During 2004, the Company entered into three natural gas zero cost price collars and three crude oil zero cost price collars to hedge a portion of its estimated natural gas and crude oil production for calendar years 2005, 2006 and 2007. The Company designated these contracts as cash flow hedges. The natural gas and crude oil derivative contracts that hedged the 2005 production expired on December 31, 2005. The Company did not enter into any new derivative contracts in 2005. During 2006, the Company entered into two natural gas zero cost price collars and three crude oil price swaps to hedge a portion of its estimated natural gas and crude oil production for calendar years 2006, 2007 and 2008. The fair market value of the cash flow hedges was a net liability of approximately $18,172,000 and a net asset of approximately $725,000 at December 31, 2005 and 2006, respectively.
The following table sets forth the Company’s outstanding natural gas, crude oil zero cost collars and crude oil swaps:
| Hedged period | |||||||
| As of December 31, 2006: | 2007 | 2008 | |||||
Natural gas price collars: | |||||||
| Volume (MMBtu/day) | 16,000 | 13,500 | |||||
Index price per MMBtu(a) | $5.98–$9.75 | (c) | $6.50–$9.35 | ||||
Crude oil price collars: | |||||||
| Volume (Bbl/day) | 650 | ||||||
NYMEX price per Bbl(b) | $37.95–$41.75 | ||||||
Crude oil price swaps: | |||||||
| Volume (Bbl/day) | 2,300 | 2,600 | |||||
NYMEX price per Bbl(b) | $67.85 | $67.50 | |||||
| (a) | The index prices for the natural gas price collars are based on the Inside FERC-El Paso Natural Gas Permian Basinfirst-of-the-month spot price. | |
| (b) | The index prices for the crude oil price collars and price swaps are based on the NYMEX-West Texas Intermediate monthly average spot price. | |
| (c) | Amounts disclosed represent weighted average prices. |
F-34
Table of Contents
The Company’s reported oil and gas revenue and average oil and gas prices includes the effects of oil quality and Btu content, gathering and transportation costs, gas processing and shrinkage, and the net effect of the commodity hedges. There were no gains or losses reclassified into earnings as there were no cash settlements during the period ended December 31, 2004. The Company reclassified into earnings losses of approximately $1,622,000 and $5,768,000 as a result of periodic contractual cash settlements for the years ended December 31, 2005 and 2006, respectively, related to the commodity financial instruments, that were previously reported inAccumulated Other Comprehensive (Loss) Income. All of the Company’s derivatives are expected to settle within the next two years. The Company expects a pre-tax loss of $211,000 to be reclassified into earnings during the year ended December 31, 2007.
There was no significant hedge ineffectiveness for the period ended December 31, 2004. The amount of hedge ineffectiveness recognized inIneffective portion of cash flow hedges on the Consolidated Statements of Operations was a loss of approximately $1,148,000 and gain of approximately $1,193,000 for the years ended December 31, 2005 and 2006, respectively.
Note J. Long-term debt
On February 24, 2006, in conjunction with the Combination, the Company replaced its prior revolving credit facility and its prior term loan facility with a new revolving credit facility, as described below. A portion of the initial advance from the new revolving credit facility was used to repay all funds borrowed under the prior revolving and term credit facilities. Remaining unamortized fees paid in connection with the issuance of the prior revolving and term credit facilities were fully expensed intoInterest expensein the accompanying consolidated statement of operations for the year ended December 31, 2006 when the prior revolving and term credit facilities were replaced.
1st Lien Credit Facility. As of February 24, 2006, the Company entered into a credit agreement with a syndicate of banks (the “1st Lien Banks”) which provides for a revolving credit facility (the “1st Lien Credit Facility”) with commitments from the 1st Lien Banks aggregating $475 million, subject to a borrowing base. The borrowing base is calculated based on the Company’s oil and gas reserves. The maturity date of the 1st Lien Credit Facility is February 24, 2010. The Company may also request the issuance of letters of credit up to $20 million. The borrowing commitment is reduced by any outstanding letters of credit. The initial advance on the 1st Lien Credit Facility made on February 27, 2006 was $421 million. The proceeds from this initial advance were used as follows:
| Cash payment to the Chase Group in the Combination | $ | 400,000,000 | |
| Repay balance on prior revolving credit facility | 15,900,000 | ||
| Bank fees and legal costs | 5,100,000 | ||
| $ | 421,000,000 | ||
The initial borrowing base is $475 million. The borrowing base components are redetermined semiannually as of January 1 and June 30 of each year. In addition to the regular redetermination dates listed above, the 1st Lien Credit Facility required a special redetermination as of April 30, 2006. This special redetermination was conducted during the quarter ended June 30, 2006 by the 1st Lien Banks and both the borrowing base and the conforming borrowing base were affirmed at their current amounts. In addition to the scheduled redeterminations, the
F-35
Table of Contents
Company and the 1st Lien Banks are each provided the option to request an additional redetermination once between the scheduled redeterminations. The borrowing base remains at $475 million at December 31, 2006.
Advances on the 1st Lien Credit Facility bear interest, at the Company’s option, based on (a) the prime rate of JPMorgan Chase Bank (“JPM Prime Rate”) (8.25 percent at December 31, 2006) or (b) a Eurodollar rate (substantially equal to the London Interbank Offered Rate). The interest rates of Eurodollar rate advances and JPM Prime Rate advances vary, with interest margins ranging from 0-125 basis points and 100- 225 basis points, respectively, per annum depending on the available borrowing base utilized. The Company pays commitment fees on the unused portion of the borrowing base ranging from 25- 50 basis points per annum depending on the available borrowing base utilized. The amount outstanding under this facility at December 31, 2006 was $455.7 million, of which $432 million was at the Eurodollar rate and $23.7 million was at the JPM Prime Rate.
The 1st Lien Credit Facility also includes asame-day advance facility under which the Company may borrow funds on a daily basis from the 1st Lien Banks’ administrative agent. Advances made on thissame-day basis cannot exceed $25 million and the maturity dates cannot exceed fourteen days. The interest rate on this facility is the JPM Prime Rate plus the applicable interest margin. There were no amounts outstanding on this facility at December 31, 2006.
The Company’s obligations under the 1st Lien Credit Facility are secured by substantially all of the Company’s oil and gas properties. In addition, all but one of the Company’s subsidiaries are guarantors, and all subsidiary general partners, limited partners and membership interests owned by the Company and its subsidiaries have been pledged as collateral in the credit agreement. The credit agreement contains various restrictive covenants and compliance requirements which include (a) maintenance of certain financial ratios (i) maintenance of a quarterly ratio of total debt to consolidated earnings before interest expense, income taxes, depletion, depreciation, and amortization, exploration expense and other noncash income and expenses no greater than 3.5 to 1.0 and (ii) maintenance of a ratio of current assets to current liabilities, excluding noncash assets and liabilities related to financial derivatives and asset retirement obligations, to be no less than 1.0 to 1.0, (b) limits on the incurrence of additional indebtedness and certain types of liens and (c) restrictions as to merger and sale or transfer of assets. The Company was in compliance with all covenants of the Credit Facility at December 31, 2006.
On July 6, 2006, the Company entered into the First Amendment to the 1st Lien Credit Facility. The Amendment allowed the Company to obtain additional financing in the form of a $40 million second lien term loan.
2nd Lien Credit Facility. On July 6, 2006, the Company entered into an additional credit agreement arranged by Banc of America Securities LLC for a term loan facility in the amount of $40 million (the “2nd Lien Credit Facility”). The full amount of this facility was funded on the closing date to reduce the amount outstanding under the 1st Lien Credit Facility by $32.1 million, with the remaining $7.9 million used for general corporate purposes.
The 2nd Lien Credit Facility provides a $40 million term loan, which bears interest, at the Company’s option, based on (a) the prime rate of Bank of America, N.A. (“BOA Prime Rate”) (8.25 percent at December 31, 2006) or (b) a Eurodollar rate (substantially equal to the London Interbank Offered Rate). The interest rates of Eurodollar Rate advances and BOA Prime Rate advances vary, with interest margins of 400 basis points and 250 basis points, respectively. The Company may select interest periods on Eurodollar Rate advances of one, two, three, six, nine
F-36
Table of Contents
and twelve months, subject to availability. Interest is payable at the end of the selected interest period, but no less frequently than quarterly.
The Company is required to repay $100,000 of the 2nd Lien Credit Facility on the last day of each calendar quarter beginning September 30, 2006. The maturity date of the 2nd Lien Credit Facility is July 5, 2011. The Company has the right to prepay the outstanding balance under the 2nd Lien Credit Facility at any time, provided, however, that the Company incurs a one percent prepayment penalty on any principal amount prepaid prior to July 5, 2007. The amount outstanding under this facility at December 31, 2006 was $39.8 million. The portion of this facility which is due within the next twelve months, $400,000, is reflected inCurrent portion of long-term debt in the accompanying consolidated balance sheet as of December 31, 2006.
Borrowings under the 2nd Lien Credit Facility are secured by a second lien on the same assets as are securing our 1st Lien Credit Facility, which lien is subordinated to liens securing the 1st Lien Credit Facility. The 2nd Lien Credit Facility contains various restrictive covenants including (a) maintenance of certain financial ratios including (i) maintenance of a quarterly ratio of total debt to consolidated earnings before interest expense, income taxes, depletion, depreciation, and amortization, exploration expense and other noncash income and expenses of less than 4.5 to 1.0, (ii) maintenance of a ratio of current assets to current liabilities, excluding noncash assets and liabilities related to financial derivatives and asset retirement obligations, to be greater than 1.0 to 1.0 and (iii) maintenance of a ratio, as of January 1 and June 30 of each year, of the net present value of the Company’s oil and gas properties to total debt to be greater than 1.5 to 1.0. (b) limits on the incurrence of additional indebtedness and certain types of liens and (c) restrictions as to merger and sale or transfer of assets. The Company was in compliance with all covenants at December 31, 2006.
The Company paid an arrangement fee of $500,000 at the date of closing of the 2nd Lien Credit Facility. This fee will be amortized over the five-year term of the facility beginning in July 2006.
On March 27, 2007, the Company amended the 1st Lien Credit Facility, repaid the 2nd Lien Credit Facility and entered into a new 2nd lien credit facility. See Note Q for further discussion of the refinancing of these debt facilities.
Principal maturities. Principal maturities of long-term debt at December 31, 2006 are as follows:
| (in thousands) | |||
| 2007 | $ | 400 | |
| 2008 | 400 | ||
| 2009 | 400 | ||
| 2010 | 456,100 | ||
| 2011 | 38,200 | ||
| Total | $ | 495,500 | |
F-37
Table of Contents
Note K. Commitments and contingencies
Operating leases. The Company is party to a non-cancelable operating lease for office space for its corporate headquarters in Midland, Texas through October 31, 2013.
Future minimum lease commitments under the amended lease at December 31, 2006 are as follows:
| 2007 | $ | 438,000 | |
| 2008 | 439,000 | ||
| 2009 | 449,000 | ||
| 2010 | 458,000 | ||
| 2011 | 468,000 | ||
| 2012 and thereafter | 873,000 | ||
| Total future minimum lease commitments | $ | 3,125,000 | |
The Company recognizes expense on a straight-line basis in equal amounts over the lease term. Rent expense of $176,000, $316,000 and $685,000 for the periods ended December 31, 2004, 2005 and 2006, respectively, is included in the accompanying consolidated statements of operations.
Daywork drilling contract commitments. The Company signed two daywork drilling contracts with a drilling contractor (“Contractor A”), on November 14, 2005, that provides the Company exclusive use of two rigs for a term ending 365 days from the date the rigs moved to the first wells. The Company may direct the rigs to locations located within the Permian Basin region as needed. The Company is solely responsible and assumes liability for all consequences of operations by both parties while on a daywork basis, with the exception that Contractor A is liable for its employees, subcontractors and invitees. In addition, Contractor A is responsible for pollution or contamination from their equipment. Contractor A will release the Company of any liability for negligence of any party in connection with Contractor A. The operating day rate is $18,000. The operating day rate can be revised to reflect changes in costs incurred by Contractor A for laborand/or fuel. The contract allows an early termination by the Company with at least a thirty day notice and a payment of the lump sum termination amount equal to the current operating day rate less $7,000, multiplied by the days remaining through the end of the contract term. However, if Contractor A secures work for the subject rig with a new customer prior to the end of the contract term, Contractor A will rebate the Company the difference between the current operating day rate pursuant to the contract and the operating day rate received from the new customer. The Company fully utilized both of the rigs in order to complete its 2006 drilling budget. These contracts expired on December 31, 2006.
The Company signed a daywork drilling contract with a drilling contractor (“Contractor B”) on July 20, 2006, that provides the Company exclusive use of one rig for a term that commenced on August 1, 2006 and ends on June 15, 2007. The Company may direct the rig to locations located within the West Texas Permian Basin region as needed. The Company is solely responsible and assumes liability for all consequences of operations by both parties while on a daywork basis, with the exception that Contractor B is liable for its employees, subcontractors and invitees. In addition, Contractor B is responsible for pollution or contamination from their equipment. Contractor B will release the Company of any liability for negligence of any party in connection
F-38
Table of Contents
with Contractor B. The operating day rate is $15,500. The operating day rate can be revised to reflect changes in costs incurred by Contractor B for laborand/or fuel. The contract allows an early termination by the Company with at least a thirty day notice and a payment of the lump sum termination amount equal to the current operating day rate less $6,000, multiplied by the days remaining through the end of the contract term. However, if Contractor B secures work for the subject rig with a new customer prior to the end of the contract term, Contractor B will rebate the Company the difference between the current operating day rate pursuant to the contract and the operating day rate received from the new customer. During February 2007, management decided to stack this rig due to budget modifications. The Company has estimated costs of approximately $915,000 due to Contractor B during the first two quarters of 2007 based on the drilling agreement described above. The Company expects to utilize the rig in the second quarter of 2007 in order to drill one well included in its 2007 drilling budget.
The Company signed daywork drilling contracts with Silver Oak Drilling, LLC (“Silver Oak”), an affiliate of the Chase Group, on August 1, 2006, that provides the Company use of four drilling rigs for a term that commenced on August 1, 2006 and ends on July 31, 2007. The Company may direct the rig to locations located in New Mexico as needed. If the Company moves the rig out of certain New Mexico counties specified in the contract, all effective daywork rates will be increased by an additional $2,000 per day. The Company is solely responsible and assumes liability for all consequences of operations by both parties while on a daywork basis, with the exception that Silver Oak is liable for its employees, subcontractors and invitees. In addition, Silver Oak is responsible for pollution or contamination from their equipment. Silver Oak will release the Company of any liability for negligence of any party connected to Silver Oak. The operating day rate is $14,500 for two of the contracts and $13,500 for the other two contracts. The operating day rate can be revised to reflect changes in costs incurred by more than 5 percent by Silver Oak for labor, insurance premiums, fuel,and/or an increase in the number of Silver Oak’s personnel needed. Under the contract, the Company must pay the full operating day rate for each day during the contract term. Although there is no early termination provision in the contract, Silver Oak has a duty to mitigate damages to the Company by reasonably attempting to secure replacement contracts for the rigs if they are released by the Company or if any contract is terminated by Silver Oak prior to the expiration of the term of the contract. The Company will then be entitled to a 75 percent credit for any revenues received by Silver Oak. Even if the Company releases the rigs, the Company, with 20 days notice, may withdraw its release and reactivate the contract for the remainder of the term to the extent the rig has not been committed to a third party in mitigation of the Company’s damages. During February 2007, management decided to stack these four rigs due to budget modifications. The Company has estimated costs of approximately $1.8 million due to Silver Oak for the first quarter of 2007 based on the drilling agreement described above. As of April 1, 2007, the Company has begun to utilize all four rigs, in order to complete its 2007 drilling budget.
Oil & gas lease extension payment. The Company is party to an agreement which, in part, governs the exploration activities on the Company’s acreage in the Western Delaware Basin shale play in Culberson County, Texas. The agreement contains a three-well drilling requirement. In addition to the drilling well requirement, the agreement requires the Company to pay an additional $2.1 million ($150 per net acre for 13,952 net acres) in order to maintain its leasehold position. This payment will be required within 90 days after the completion of the drilling of the third of the Company’s three-well drilling commitment, should it decide to extend these leases. Failure to complete the three-well commitment by January 1, 2007, or failure to make the additional payment for the acreage, would result in forfeiture of the Company’s leasehold
F-39
Table of Contents
rights, except to the extent of the then-existing proration units, and the Company would be obligated to make a liquidated damages payment of $750,000 for any well not drilled.
As of January 1, 2007, the Company had drilled or was drilling all three of these wells. The last of the three wells drilled reached total depth on January 19, 2007. The Company intends to make the payment of $2.1 million described above, on or before April 19, 2007.
Chase Group accredited and unaccredited investors asset purchase obligation. As discussed in Note D, on February 27, 2006, as required by the Combination Agreement, the Company agreed to purchase working interests in the Chase Group Properties from certain individuals within the Chase Group. On May 18, 2006, the Company purchased interests in the Chase Group Properties from ten individuals within the Chase Group who were accredited investors in exchange for $8.9 million in cash and 222,645 shares of Resources common stock valued at $1.4 million for an aggregate purchase price of $10.3 million. The value of the common shares issued was $6 per share, as required by the Combination Agreement. The aggregate purchase price is reflected inProved propertiesin the accompanying consolidated balance sheet at December 31, 2006. This transaction is included in the aggregate purchase price disclosed in Note D.
The Company was further obligated to offer to purchase additional interests in the Chase Group Properties from nine individuals within the Chase Group. In April 2007, the Company satisfied this obligation by paying $255,000 in cash and issuing 108,457 shares of common stock. The aggregate purchase price is reflected inProved propertiesand the related obligation is reflected inChase Group unaccredited investors asset purchase obligationin the accompanying consolidated balance sheet at December 31, 2006. This transaction is included in the aggregate purchase price disclosed in Note D.
Employment agreements. In connection with the Combination, each of the Company’s executive officers entered into a separate employment agreement with the Company, each with an effective date of June 1, 2006. The agreements are substantially similar and have an initial term that expires three years from the effective date, but will automatically be extended for successive one-year terms after the initial term unless either party gives written notice within 90 days prior to the end of the term.
Under these agreements, Mr. Leach and Mr. Beal’s minimum annual base salaries are $350,000 and Messrs. Copeland, Kamradt, Wright and Thomas’s minimum annual base salaries are $250,000. Mr. Leach and Mr. Beal are entitled to utilize the Company’s aircraft for business use, and they and their families are entitled to use our aircraft for reasonable personal use and are not required to reimburse us for any cost related to such use unless a family member travels without either Mr. Leach or Mr. Beal.
If one of the Company’s named executive officer’s employment is terminated by the Company without cause, as defined in the agreements, or if he terminates his employment following a change in duties, as defined in the agreements, then the Company will provide him with certain severance benefits. If such a termination of employment occurs prior to a change of control or more than two years after a change of control, then his base salary will continue to be paid for 12 months and the Company will reimburse him for up to 12 months for the amount by which the cost of his continued coverage under the Company’s group health plans exceeds the employee contribution amount that the Company charges its active senior executives for similar coverage. If such a termination of employment occurs during the two-year period beginning on
F-40
Table of Contents
the date upon which a change of control, as defined in the agreements, occurs, then he will be entitled to a lump sum severance amount equal to two times his annual base salary, all of his stock options and restricted stock awards will vest in full, and the Company will reimburse him for up to 18 months for the amount by which the cost of his continued coverage under the Company’s group health plans exceeds the employee contribution amount that the Company charges its active senior executives for similar coverage. If the total amount of payments to be provided by the Company in connection with a change in control would cause any of the named executive officers to incur “golden parachute” excise tax liability, the payments will be reduced to the extent necessary to leave him in a better after-tax position than if no such reduction had occurred. The agreement does not provide for any tax “gross-up” payments.
Note L.Regulatory matters
From 1984 through 1997, the owners of the Grayburg-Jackson West Cooperative Unit (“GJ Unit”), a group of formations and intervals unitized by state regulatory authorities, compromised of approximately 2,400 acres in Eddy County, New Mexico and which comprises a portion of the Chase Group Properties, drilled or deepened approximately 70 wells that produced from zones below a depth approved as the unitized formation. The owners of the working interests in the GJ Unit possessed the ownership rights entitling them to produce hydrocarbons from the subject producing intervals below the unitized formation, but had not obtained the necessary regulatory approval (1) as to certain wells, to drill or deepen below the base of the unitized formation or (2) to produce hydrocarbons from intervals below the base of the unitized formation and to commingle such production with production from the unitized formation. In connection with the failure to obtain the required regulatory approval to produce on a commingled basis from these deeper intervals, the operators filed incorrect perforation and completion reports with state regulatory authorities, and filed monthly production reports that did not disclose that hydrocarbons had been produced from intervals below the unitized formation and that hydrocarbons produced from these deeper intervals were improperly commingled with production from the unitized formation (although the reports apparently reflected the actual volumes produced by the wells). As a result, a unit royalty interest owner in the unitized formation was overpaid and the State of New Mexico, which was the owner of the royalty interest in the subject producing intervals below the unitized formation, was underpaid for several years.
On November 15, 2005, Mack Energy Corporation filed an application with the New Mexico Oil Conservation Division (“NMOCD”) to expand the vertical limit of the unitized formation to include the deeper intervals that had been accessed, produced and commingled without obtaining regulatory approval. A hearing on the application was originally scheduled for December 15, 2005, but was continued at the request of Mack Energy. On February 27, 2006, the combination transaction occurred and, as a result, the Company acquired the GJ Unit.
On April 13, 2006, the NMOCD held a hearing on Mack Energy’s application to expand the vertical limit of the unitized formation. Representatives of Mack Energy, acting under the Contract Operator Agreement with Mack Energy, participated in the hearing and presented testimony during that hearing that intervals below the unitized formation had not been tested or developed. Based on the application submitted by Mack Energy and the evidence and testimony presented at the hearing, on June 13, 2006, the NMOCD approved the application and entered its order expanding the vertical limit of the unitized formation to include certain deeper intervals, including one of those that had previously been produced and commingled without regulatory approval.
F-41
Table of Contents
Over the course of developing our drilling program for the Chase Group Properties in July and August 2006, the Company discovered the existence of these violations and this testimony. Following further investigation by the Company’s employees and discussions with a representative of Chase Oil and Mack Energy and the Company’s counsel, the Company reported these developments to the Company’s board of directors. Because this matter related to ongoing regulatory violations by entities that were under the control of certain members of the Company’s board of directors, the Company’s board of directors determined on September 6, 2006, to form a special committee of the board of directors that consisted of independent and disinterested non-management directors for the purpose of investigating the matters identified by the Company’s management relating to the GJ Unit. The special committee engaged separate legal counsel to assist it with its investigation of this matter. Also, in September 2006, representatives of Mack Energy and the Company met with relevant regulatory authorities from the State of New Mexico, and voluntarily self-reported the matters related to the GJ Unit, and the Company filed amended reports to correct prior reporting inaccuracies.
As a result of these actions, the Company, along with Mack Energy, entered into a settlement agreement with the New Mexico State Land Office on November 2, 2006 related to the underpayment of royalties arising from these circumstances. Under the terms of the settlement agreement, Mack Energy paid $615,444 to the State of New Mexico for underpayment of royalties and interest thereon. The Company was not required to make any payments under the settlement agreement. Further, on January 22, 2007, the State of New Mexico advised the Company that there was no basis for a compliance and enforcement proceeding against the Company and no evidence of a knowing and willful violation of applicable law by the Company. On January 19, 2007, Mack Energy entered into an Agreed Compliance Order and agreed to pay a penalty of $250,000 for its violations of applicable rules, regulations and statutes. Finally, the NMOCD approved the Company’s correction of the prior records related to the GJ Unit and, in February 2007, approved the Company’s application to expand the vertical limit of the unitized formation below the depth of the intervals that had previously been improperly produced and commingled with production from the unitized formation and to bring all of the wells in the GJ Unit into compliance with all applicable rules, regulations and statutes.
The special committee of the board of directors examined relevant documents provided by the Company and its regulatory counsel in New Mexico, conducted interviews of members of management and heard a presentation from a representative of Chase Oil and Mack Energy. The special committee also monitored the activities of the Company and the Company’s legal counsel during the discussions and proceedings with relevant New Mexico regulatory authorities. Based on its review of this matter, the special committee recommended the adoption of certain policies and procedures governing the operation of all legal proceedings involving the Company as well as a review of the due diligence processes associated with future acquisitions of properties. The special committee also recommended certain actions to address corporate governance matters at the Company. Finally, the special committee reviewed the conduct of the Company’s officers and directors to determine whether any such conduct would indicate that an officer or director was unsuitable to continue in their position, and the special committee did not determine that any officer or director was unsuitable to continue in their position with the Company.
Note M.Income taxes
The Company accounts for income taxes in accordance with the provisions of SFAS No. 109, “Accounting for Income Taxes.” The Company and its subsidiaries file federal corporate income
F-42
Table of Contents
tax returns on a consolidated basis. The tax returns and the amount of taxable income or loss are subject to examination by United States federal and state taxing authorities. The Company made estimated tax payments of $100,000 for the year ended December 31, 2005 and $1,725,000 for the year ended December 31, 2006. No current or estimated tax payments were made in 2004.
SFAS No. 109 requires that the Company continually assess both positive and negative evidence to determine whether it is more likely than not that deferred tax assets can be realized prior to their expiration. Management monitors Company-specific, oil and gas industry and worldwide economic factors and assesses the likelihood that the Company’s net operating loss carryforwards (“NOLs”) and other deferred tax attributes in the United States, state, and local tax jurisdictions will be utilized prior to their expiration. As of December 31, 2005 and 2006, the Company had no valuation allowances related to its deferred tax assets.
The components of income tax expense (benefit) are as follows:
| (In thousands) | 2004 | 2005 | 2006 | |||||||
| Current income tax expense (benefit) federal and state | $ | — | $ | 65 | $ | 1,761 | ||||
| Deferred income tax expense (benefit) federal and state | (915 | ) | 1,974 | 12,618 | ||||||
| Income tax expense (benefit) | $ | (915 | ) | $ | 2,039 | $ | 14,379 | |||
The reconciliation between the tax expense (benefit) computed by multiplying pretax income (loss) by the U.S. federal statutory rate and the reported amounts of income tax benefit is as follows:
| (In thousands) | 2004 | 2005 | 2006 | |||||||
| Income (loss) at U.S. federal statutory rate | $ | (1,214 | ) | $ | 1,358 | $ | 11,916 | |||
| State income taxes | (34 | ) | 70 | 2,083 | ||||||
| Stock-based compensation | 333 | 611 | 380 | |||||||
| Expense (benefit) for income taxes | $ | (915 | ) | $ | 2,039 | $ | 14,379 | |||
F-43
Table of Contents
The tax effects of temporary differences that give rise to significant portions of the deferred tax assets and deferred tax liabilities were as follows:
| (In thousands) | 2005 | 2006 | ||||||
| Deferred tax asset: | ||||||||
| Federal net operating loss | $ | 3,192 | $ | — | ||||
| Stock-based compensation | 590 | 3,776 | ||||||
| Financial instruments | 6,365 | — | ||||||
| Other | 95 | 301 | ||||||
| Total deferred tax assets | 10,242 | 4,077 | ||||||
| Deferred tax liability: | ||||||||
| Oil and gas properties, principally due to differences in basis resulting from acquisitions and depletion and the deduction of intangible drilling costs for tax purposes | (5,338 | ) | (245,464 | ) | ||||
| Financial instruments | — | (283 | ) | |||||
| Total deferred tax liabilities | (5,338 | ) | (245,747 | ) | ||||
| Net deferred tax asset (liability) | $ | 4,904 | $ | (241,670 | ) | |||
As of December 31, 2006, there were no remaining deferred tax assets for net operating losses as they were fully utilized in 2006.
Texas margins tax. On May 18, 2006, the Governor of Texas signed into law HouseBill 3 (“HB-3”) which modifies the existing franchise tax law. The modified franchise tax will be computed by subtracting either costs of goods sold or compensation expense, as defined in HB-3, from gross revenue to arrive at a gross margin. The resulting gross margin will be taxed at a one percent rate. HB-3 has also expanded the definition of tax paying entities to include limited partnerships. HB-3 becomes effective for activities occurring on or after January 1, 2007. The portion of deferred tax expense attributable to the enactment of the Texas margin tax was $515,000 at December 31, 2006.
Note N.Major customers and derivative counterparties
Sales to major customers. The Company’s share of oil and gas production is sold to various purchasers. The Company is of the opinion that the loss of any one purchaser would not have a material adverse effect on the ability of the Company to sell its oil and gas production.
Navajo Refining Company, L.P. accounted for 36 percent, 38 percent and 52 percent of the oil and gas revenues of the Company during the periods ended December 31, 2004, 2005 and 2006, respectively. DCP Midstream LP, formerly Duke Energy Field Services, accounted for 9 percent, 8 percent and 17 percent of the oil and gas revenues of the Company during the periods ended December 31, 2004, 2005 and 2006, respectively.
At December 31, 2006, the Company had receivables from Navajo Refining Company, L.P. and DCP Midstream LP of $11.0 million and $8.6 million, respectively, which are reflected inAccounts receivable — Oil and gas in the accompanying consolidated balance sheet.
F-44
Table of Contents
Derivative counterparties. The Company uses credit and other financial criteria to evaluate the credit standing of, and to select, counterparties to its derivative instruments. The Company’s credit facility agreements require that the senior unsecured debt ratings of the Company’s derivative counterparties be not less than either A− by Standard & Poor’s Rating Group rating system or A3 by Moody’s Investors Service, Inc. rating system. At December 31, 2006, the counterparties with whom the Company had outstanding derivative contracts met or exceeded the required ratings. Although the Company does not obtain collateral or otherwise secure the fair value of its derivative instruments, management believes the associated credit risk is mitigated by the Company’s credit risk policies and procedures and by the credit rating requirements of the Company’s credit facility agreements. There was no derivative receivable at December 31, 2005. At December 31, 2006, the Company had $6.9 million of derivative receivables representing amounts due from counterparties. Approximately $6 million of short-term derivative receivables and $0.9 million of long-term derivative receivables are reflected inDerivative instrumentsandOther assetsin the accompanying consolidated balance sheet, respectively. At December 31, 2005 and 2006, the Company had $18.2 million and $6.2 million derivative liabilities representing amounts owed to counterparties, respectively. The fair market value of the cash flow hedges were a net liability of approximately $18.2 million and a net asset of approximately $725,000 at December 31, 2005 and 2006, respectively.
Note O.Related parties
Contract operator agreement. On February 27, 2006, the Company signed a contract operator agreement with Mack Energy Corporation (“MEC”), an affiliate of the Chase Group, whereby the Company engaged MEC as contract operator to provide certain services with respect to the Chase Group Properties. The initial term of the contract operator agreement was 5 years commencing on March 1, 2006 and ending on February 28, 2011. The Company and MEC entered into a transition services agreement on April 23, 2007, which terminated the contract operator agreement and under which MEC will provide certain field level operating services on the Chase Group Properties.
The Company paid MEC approximately $10.3 million for the year ended December 31, 2006 for services rendered under the contract operator agreement. Of these amounts approximately $7.1 million were capital costs which are reflected inProved propertiesin the accompanying consolidated balance sheet at December 31, 2006. Approximately $3.2 million and $4,000 were expenses which are reflected inOil and gas production expenseandGeneral and administrative expensefor the year ended December 31, 2006 in the accompanying consolidated statement of operations, respectively.
At December 31, 2006, the Company had outstanding invoices payable to MEC of approximately $1.8 million which are reflected inAccounts payable—related partiesin the accompanying consolidated balance sheet.
Other related party transactions. The Company also has engaged in transactions with certain other affiliates of the Chase Group, including Silver Oak, an oilfield services company, a supply company, a drilling fluids supply company, a pipe and tubing supplier, a fixed base operator of aircraft services, and a software company.
The Company paid these related party vendors approximately $30.3 million for the year ended December 31, 2006 for services rendered. Of these amounts, $28.6 million were capital costs, which are reflected in the accompanying consolidated balance sheet as of December 31, 2006.
F-45
Table of Contents
Approximately $0.4 million were expenses which are reflected inGeneral and administrative expensesfor the year ended December 31, 2006 in the accompanying consolidated statement of operations. Approximately $1.3 million were expenses which are reflected in Oil and gas production expenses for the year ended December 31, 2006 in the accompanying consolidated statement of operations.
At December 31, 2006, the Company had outstanding invoices payable to the other related party vendors mentioned above of approximately $1.8 million which are reflected inAccounts payable—related partiesin the accompanying consolidated balance sheet.
Overriding royalty and royalty interests. Certain members of the Chase Group own overriding royalty interests in certain of the Chase Group Properties. The amount paid attributable to such interests was approximately $0.8 million for the year ended December 31, 2006.
Prospect participation agreement. Subsequent to the closing of the Combination, the Company acquired working interests from Caza in certain lands in New Mexico in which Caza owns an interest.
The Company paid Caza approximately $2.1 million for the year ended December 31, 2006 for these interests. Of these amounts approximately $2.1 million were capital prospect costs which are reflected inUnproved properties in the accompanying consolidated balance sheet at December 31, 2006. Approximately $7,000 were expenses reflected inOil and gas production expensefor the year ended December 31, 2006 in the accompanying consolidated statement of operations.
At December 31, 2006, the Company had no outstanding invoices owed to Caza.
Note P.Defined contribution plan
The Company sponsors a 401(k) defined contribution plan for the benefit of substantially all employees. The Company matches in cash 100 percent of employee contributions, not to exceed 6 percent of the employee’s annual salary. Company contributions to the plan for the periods ended December 31, 2004, 2005 and 2006 were approximately $73,000, $203,000, and $321,000, respectively.
Note Q.Net Income (loss) per share
Basic income (loss) per share is computed by dividing net income (loss) applicable to common shareholders by the weighted average number of common shares treated as outstanding for the period. As discussed in Note G, agreements to sell stock to the Officers and certain employees subject to Purchase Notes are accounted for as options (“Bundled Capital Options” and “Capital Options”, respectively). As a result, Bundled Capital Options and Capital Options are excluded from the weighted average number of common shares treated as outstanding during each period.
The computation of diluted income per share reflects the potential dilution that could occur if securities or other contracts to issue common stock that are dilutive to income were exercised or converted into common stock or resulted in the issuance of common stock that would then share in the earnings of the Company. These amounts include Bundled Capital Options, Capital Options, stock options (as issued under the Stock Option Plan of CEHC adopted in 2004 and the Plan of CRI adopted in 2006, both as described in Note H) and restricted stock. Potentially dilutive effects are calculated using the treasury stock method.
F-46
Table of Contents
The CEHC 6% Series A Preferred Stock were entitled to receive an amount equal to its stated value ($9.00) plus any unpaid dividends upon occurrence of a liquidation event, as defined. In connection with the Combination on February 24, 2006, a liquidation event occurred. Instead of receiving the stated value, the holders of the CEHC 6% Series A Preferred Stock agreed to accept 1.5 shares of Resources common stock in exchange for each share of CEHC 6% Series A Preferred Stock. This was considered to be an induced conversion, as defined in the FASB Emerging Issues Task Force Topic D-42, “The Effect on the Calculation of Earnings per Share for the Redemption or Induced Conversion of Preferred Stock.” The excess of the carrying amount of the CEHC 6% Series A Preferred Stock over the fair value of the Resources common stock issued is required to be added to 2006 net income to arrive at 2006 net income applicable to common shareholders.
The following table is a reconciliation of the basic weighted average common shares outstanding to diluted weighted average common shares outstanding for the periods ended December 31, 2004, 2005, and 2006:
| For the period ended December 31, | |||||||||
| (in thousands) | 2004 | 2005 | 2006 | ||||||
| Weighted average common shares outstanding: | |||||||||
| Basic | 1,987 | 8,117 | 94,575 | ||||||
| Dilutive Bundled Capital Options | — | — | 5,031 | ||||||
| Dilutive Capital Options | — | — | 384 | ||||||
| Dilutive common stock options | — | — | 1,427 | ||||||
| Dilutive restrictive stock | — | — | 41 | ||||||
| Diluted | 1,987 | 8,117 | 101,458 | ||||||
For the years ended December 31, 2004 and 2005, the effects of all securities (including Bundled Capital Options, Capital Options and stock options) that were excluded from the computation of diluted earnings per share because the Company had a net loss applicable to common shareholders and, therefore, the effects would have been antidilutive. Securities excluded are summarized below:
| December 31, | ||||||
| (in thousands) | 2004 | 2005 | ||||
| Series A preferred stock | 7,235 | 11,957 | ||||
Bundled Capital Options(a) | 1,100 | 1,100 | ||||
Capital Options(a) | 85 | 483 | ||||
Common stock options(a) | 724 | 1,365 | ||||
| 9,144 | 14,905 | |||||
| (a) | For unit options, this excludes the preferred stock portion. |
For the year ended December 31, 2006, the effect of 900,000 common stock options were excluded from the computation of diluted earnings per share because the effect would have been antidilutive.
F-47
Table of Contents
Note R.Subsequent events
Refinancing of debt facilities. As of March 27, 2007, the Company amended the 1st Lien Credit Facility, repaid the 2nd Lien Credit Facility and entered into a new 2nd lien credit facility. This refinancing was done to provide additional availability on the Company’s 1st Lien Credit Facility and satisfy the requirement of equalizing the borrowing base and the conforming borrowing base as discussed further in Note J.
The Company entered into the Second Amendment to the 1st Lien Credit Facility on March 27, 2007. The amendment allowed for the incurrence of additional indebtedness in the form of a $200 million second lien term loan. The amendment also redetermined the borrowing base at $375 million, removed the concept of conforming borrowing base and increased the maximum allowable quarterly ratio of total debt to consolidated earnings before interest expense, income taxes, depletion, depreciation, and amortization, exploration expense and other noncash income and expenses from 3.5 to 1.0 to 4.0 to 1.0.
On March 27, 2007, the Company entered into a new 2nd lien credit facility, arranged by Banc of Americas Securities LLC, for a term loan facility in the amount of $200 million (the “New 2nd Lien Credit Facility”). The full amount of the facility was funded on the closing date. The New 2nd Lien Credit Facility was issued at a discount of 0.5 percent; thus, the Company received proceeds of $199.0 million. The proceeds from the borrowing were used to repay the 2nd Lien Credit Facility in full in the amount of $39.8 million without penalty, reduce the amount outstanding under the 1st Lien Credit Facility by $154.0 million, with the remaining $5.2 million used to pay loan fees, accrued interest and for general corporate purposes.
The New 2nd Lien Credit Facility provides a $200 million term loan, which bears interest, at the Company’s option, based on (a) the BOA Prime Rate (8.25 percent at December 31, 2006) or (b) a Eurodollar rate (substantially equal to the London Interbank Offered Rate). The interest rates of Eurodollar rate advances and prime rate advances vary, with interest margins of 375 basis points and 225 basis points, respectively, until the sooner to occur of an initial public offering by the Company or the first anniversary of the closing date of the loan; thereafter, interest margins on Eurodollar rate advances and prime rate advances will be 425 basis points and 275 basis points, respectively. The Company may select interest periods on Eurodollar rate advances of one, two, three, six, nine and twelve months, subject to availability. Interest is payable at the end of the selected interest period, but no less frequently than quarterly.
The Company is required to repay $0.5 million of the term loan facility on the last day of each calendar quarter beginning June 30, 2007. The maturity date of the term loan facility is March 27, 2012. The Company has the right to prepay the outstanding balance under the term loan facility at any time. The Company will not incur a prepayment penalty on any principal amount prepaid during the first twelve months of the loan. A two percent prepayment penalty will be incurred on any principal amount prepaid during the second year following the closing and one percent penalty will be incurred during the third year. After the third year, no prepayment penalty will be incurred.
Borrowings under the New 2nd Lien Credit Facility are secured by a second lien on the same assets as are securing the 1st Lien Credit Facility which lien is subordinated to liens securing the 1st Lien Credit Facility. The New 2nd Lien Credit Facility contains various restrictive covenants including (a) maintenance of certain financial ratios including (i) maintenance of a quarterly ratio of total debt to consolidated earnings before interest expense, income taxes, depletion, depreciation, and amortization, exploration expense and other noncash income and expenses of
F-48
Table of Contents
less than 4.5 to 1.0, (ii) maintenance of a ratio of current assets to current liabilities, excluding noncash assets and liabilities related financial derivatives and asset retirement obligations, to be greater than 1.0 to 1.0 and (iii) maintenance of a ratio, as of January 1 and June 30 of each year, of the net present value of the Company’s oil and gas properties to total debt to be greater than 1.5 to 1.0. (b) limits on the incurrence of additional indebtedness and certain types of liens and (c) restrictions as to merger and sale or transfer of assets.
The Company paid an arrangement fee of $2.5 million at the date of closing. This fee will be amortized toInterest expenseover the five-year term of the facility beginning in April 2007.
The amendment of the 1st Lien Credit Facility on March 27, 2007, resulted in a $100 million, or 21 percent, reduction of the borrowing base. As such, the prorata portion of the remaining debt issuance costs associated with the 1st Lien Credit Facility, totaling approximately $766,000, will be written off and included inInterest expensein the first quarter of 2007. The remaining debt issuance costs of $433,000 associated with the 2nd Lien Credit Facility repaid in full on March 27, 2007, will be written off and included inInterest expensein the first quarter of 2007.
Cash flow hedge. On February 8, 2007, the Company entered into one natural gas price swap to hedge an additional portion of its estimated natural gas production for the period of March through December 2007. The contract is for 2,100 MMBtu per day at a fixed index price of $7.40 per MMBtu. The index price is based on the Inside FERC—El Paso Permian Basin spot price at the first of each month. The Company has designated this derivative instrument as a cash flow hedge.
Note S.Supplementary information
Costs incurred for oil and gas producing activities
| Period from | |||||||||
| April 21, 2004 | |||||||||
| (inception) | |||||||||
| through | Year ended | Year ended | |||||||
| December 31, | December 31, | December 31, | |||||||
| (in thousands) | 2004 | 2005 | 2006 | ||||||
| Property acquisition costs: | |||||||||
| Proved | $ | 99,382 | $ | 7,834 | $ | 824,382 | |||
| Unproved | 10,112 | 14,694 | 217,788 | ||||||
| Exploration | 3,198 | 7,301 | 49,394 | ||||||
| Development | 1,931 | 38,727 | 126,089 | ||||||
| Capitalized asset retirement obligations | 883 | 141 | 7,293 | ||||||
| Total costs incurred for oil and gas properties | $ | 115,506 | $ | 68,697 | $ | 1,224,946 | |||
Reserve quantity information (unaudited)
The estimates of proved oil and gas reserves, which are located primarily in the Permian Basin region of West Texas and Eastern New Mexico were prepared by the Company’s engineers. These reserve estimates were reviewed and confirmed by Netherland, Sewell & Associates, Inc. and Cawley, Gillespie & Associates, Inc. Reserves were estimated in accordance with guidelines
F-49
Table of Contents
established by the Securities and Exchange Commission, which require that reserve estimates be prepared under existing economic and operating conditions with no provision for price and cost escalations except by contractual arrangements except that future production costs exclude overhead charges for Company operated properties. The reserve estimates for 2005 utilize the year-end West Texas Intermediate futures oil price of $61.04 per Bbl and the year-end Henry Hub spot market gas price of $10.08 per Mmbtu. The reserve estimates for 2006 utilize the year-end West Texas Intermediate posted oil price of $57.75 per Bbl and the year-end Henry Hub spot market gas price of $5.635 per Mmbtu. Commodity prices utilized for the reserve estimates were adjusted for location, grade and quality.
Oil and gas reserve quantity estimates are subject to numerous uncertainties inherent in the estimation of quantities of proved reserves and in the projection of future rates of production and the timing of development expenditures. The accuracy of such estimates is a function of the quality of available data and of engineering and geological interpretation and judgment. Results of subsequent drilling, testing and production may cause either upward or downward revision of previous estimates. Further, the volumes considered to be commercially recoverable fluctuate with changes in prices and operating costs. The Company emphasizes that reserve estimates are inherently imprecise and that estimates of new discoveries are more imprecise than those of currently producing oil and gas properties. Accordingly, these estimates are expected to change as additional information becomes available in the future.
| 2004 | 2005 | 2006 | ||||||||||||||||||||||
| Oil and | Natural | Oil and | Natural | Oil and | Natural | |||||||||||||||||||
| condensate | gas | condensate | gas | condensate | gas | |||||||||||||||||||
| (in thousands) | (MBbls) | (MMcf) | (MBbls) | (MMcf) | (MBbls) | (MMcf) | ||||||||||||||||||
| Total proved reserves | ||||||||||||||||||||||||
| Balance, January 1 | — | — | 6,553 | 35,464 | 9,658 | 49,530 | ||||||||||||||||||
Purchase ofminerals-in-place | 6,191 | 32,609 | 191 | 1,095 | 27,163 | 137,963 | ||||||||||||||||||
| New discoveries and extensions | 407 | 3,146 | 3,256 | 15,864 | 10,226 | 39,427 | ||||||||||||||||||
| Revisions of previous estimates | — | — | 257 | 511 | (430 | ) | (16,595 | ) | ||||||||||||||||
| Production from continuing operations | (45 | ) | (291 | ) | (599 | ) | (3,404 | ) | (2,295 | ) | (9,507 | ) | ||||||||||||
| Balance, December 31 | 6,553 | 35,464 | 9,658 | 49,530 | 44,322 | 200,818 | ||||||||||||||||||
| Proved developed reserves: | ||||||||||||||||||||||||
| January 1 | — | — | 4,536 | 24,366 | 6,502 | 34,160 | ||||||||||||||||||
| December 31 | 4,536 | 24,366 | 6,502 | 34,160 | 23,443 | 112,423 | ||||||||||||||||||
Standardized measure of discounted future net cash flows (unaudited)
The standardized measure of discounted future net cash flows is computed by applying year-end prices of oil and gas (with consideration of price changes only to the extent provided by
F-50
Table of Contents
contractual arrangements) to the estimated future production of proved oil and gas reserves less estimated future expenditures (based on year-end costs) to be incurred in developing and producing the proved reserves, discounted using a rate of 10 percent per year to reflect the estimated timing of the future cash flows. Future income taxes are calculated by comparing undiscounted future cash flows to the tax basis of oil and gas properties plus available carryforwards and credits and applying the current tax rates to the difference.
Discounted future cash flow estimates like those shown below are not intended to represent estimates of the fair value of oil and gas properties. Estimates of fair value would also consider probable and possible reserves, anticipated future oil and gas prices, interest rates, changes in development and production costs and risks associated with future production. Because of these and other considerations, any estimate of fair value is necessarily subjective and imprecise.
| (in thousands) | 2004 | 2005 | 2006 | |||||||||
| Oil and gas producing activities: | ||||||||||||
| Future cash inflows | $ | 479,083 | $ | 972,662 | $ | 3,560,326 | ||||||
| Future production, development and abandonment costs | (201,690 | ) | (352,213 | ) | (1,479,797 | ) | ||||||
| Future income tax expense | (59,849 | ) | (186,539 | ) | (530,212 | ) | ||||||
| Future net cash flows | 217,544 | 433,910 | 1,550,317 | |||||||||
| 10% annual discount factor | (83,244 | ) | (210,148 | ) | (839,968 | ) | ||||||
| Standardized measure of discounted future cash flows | $ | 134,300 | $ | 223,762 | $ | 710,349 | ||||||
Changes in standardized measure of discounted future net cash flows (unaudited)
| (in thousands) | 2004 | 2005 | 2006 | |||||||||
Purchases ofminerals-in-place | $ | 140,598 | $ | 7,612 | $ | 795,072 | ||||||
| Extensions and discoveries | 12,074 | 98,826 | 156,266 | |||||||||
| Net changes in prices and production costs | — | 99,041 | (109,264 | ) | ||||||||
| Oil and gas sales, net of production costs | (2,876 | ) | (40,301 | ) | (160,468 | ) | ||||||
| Changes in future development costs | — | (1,649 | ) | (6,085 | ) | |||||||
| Revisions of previous quantity estimates | — | 7,302 | (51,147 | ) | ||||||||
| Accretion of discount | — | 14,933 | 17,317 | |||||||||
| Changes in production rates, timing and other | (471 | ) | (12,596 | ) | (10,119 | ) | ||||||
| Change in present value of future net revenues | 149,325 | 173,168 | 631,572 | |||||||||
| Net change in present value of future income taxes | (15,025 | ) | (83,706 | ) | (144,985 | ) | ||||||
| 134,300 | 89,462 | 486,587 | ||||||||||
| Balance, beginning of year | — | 134,300 | 223,762 | |||||||||
| Balance, end of year | $ | 134,300 | $ | 223,762 | $ | 710,349 | ||||||
F-51
Table of Contents
CONCHO RESOURCES INC. AND SUBSIDIARIES
UNAUDITED PRO FORMA COMBINED
STATEMENT OF OPERATIONS
UNAUDITED PRO FORMA COMBINED
STATEMENT OF OPERATIONS
The unaudited pro forma combined statement of operations has been prepared to assist in the analysis of the historical financial results of Concho Resources Inc. (“Resources” or the “Company”) subsequent to the Combination (meaning the combination of Resources, Concho Equity Holdings Corp. and the Chase Group Properties which was consummated on February 27, 2006) and the Offering. The Chase Group Properties consists of: Chase Oil Corporation (“Chase Oil”); Caza Energy LLC (“Caza Energy”); Robert Chase, Richard Chase, Dianne Crouch (collectively, the “Working Interest Group”); and twenty-one other related parties (collectively, the “Employee Group”). The unaudited pro forma combined statement of operations has been prepared to illustrate pro forma operating results as if the Combination and the Offering had taken place on January 1, 2006.
The unaudited pro forma statement of operations and related notes are presented for illustrative purposes only. If the Combination had occurred in the past, Resources’ operating results might have been different from those presented in the unaudited pro forma information. The unaudited pro forma information should not be relied upon as an indication of operating results that Resources would have achieved if the Combination and the Offering had taken place on the specified date. You should also not rely on the unaudited pro forma information as an indication of the future results that Resources will achieve after the Combination and the Offering. In addition, future results may vary significantly from the results reflected in the accompanying unaudited pro forma combined statement of operations because of normal production declines, changes in product prices, future acquisitions and divestitures and other factors.
The following unaudited pro forma combined statement of operations and related notes should be read in conjunction with the consolidated financial statements and related notes of Resources and the combined statements of revenues and expenses of the Chase Group Properties.
F-52
Table of Contents
Concho Resources Inc. and subsidiaries
Unaudited pro forma combined statement of operations
Year ended December 31, 2006
Unaudited pro forma combined statement of operations
Year ended December 31, 2006
| Chase | |||||||||||||||||||||
| Group | Combination | Offering | |||||||||||||||||||
| Resources | Properties | adjustments | adjustments | Pro forma | |||||||||||||||||
| (in thousands, except per share data and per share amounts) | historical | historical | (Note B) | Pro forma | (Note C) | as adjusted | |||||||||||||||
Operating Revenues: | |||||||||||||||||||||
| Oil sales | $ | 131,773 | $ | 13,940 | $ | 145,713 | $ | — | |||||||||||||
| Natural gas sales | 66,517 | 7,516 | 74,033 | ||||||||||||||||||
| Total operating revenues | 198,290 | 21,456 | 219,746 | ||||||||||||||||||
Operating costs and expenses: | |||||||||||||||||||||
| Oil and gas production | 22,060 | 2,396 | 24,456 | ||||||||||||||||||
| Oil and gas production taxes | 15,762 | 1,840 | 17,602 | ||||||||||||||||||
| Exploration and abandonments | 5,612 | — | 5,612 | ||||||||||||||||||
| Depreciation and depletion | 60,722 | 2,217 | 3,211 | (a) | 66,150 | ||||||||||||||||
| Accretion of discount on asset retirement obligations | 287 | 83 | 370 | ||||||||||||||||||
| Impairments of proved oil and gas properties | 9,891 | 1 | 9,892 | ||||||||||||||||||
| General and administrative (Including non-cash stock-based compensation) | 21,721 | 284 | 22,005 | ||||||||||||||||||
| Ineffective portion of cash flow hedges | (1,193 | ) | — | (1,193 | ) | ||||||||||||||||
| Total operating costs and expenses | 134,862 | 6,821 | 144,894 | ||||||||||||||||||
Income (loss) from operations | 63,428 | 14,635 | 74,852 | ||||||||||||||||||
Other income (expense): | |||||||||||||||||||||
| Interest expense | (30,567 | ) | — | (5,223 | )(b) | (35,790 | ) | ||||||||||||||
| Other, net | 1,186 | — | 1,186 | ||||||||||||||||||
| Total other expense | (29,381 | ) | — | (34,604 | ) | ||||||||||||||||
Income (loss) before income taxes | 34,047 | 14,635 | 40,248 | ||||||||||||||||||
| Income tax (expense) benefit | (14,379 | ) | — | (2,418 | )(c) | (16,797 | ) | ||||||||||||||
Net income (loss) | 19,668 | 14,635 | 23,451 | ||||||||||||||||||
| Preferred stock dividends | (1,244 | ) | — | 1,244 | (d) | — | |||||||||||||||
| Effect of induced conversion of preferred stock | 11,601 | — | (11,601 | )(e) | — | ||||||||||||||||
Net income applicable to common shareholders | $ | 30,025 | $ | 14,635 | $ | 23,451 | |||||||||||||||
Basic earnings (loss) per share: | |||||||||||||||||||||
| Net income (loss) per share | $ | 0.32 | $ | 0.22 | $ | — | |||||||||||||||
| Shares used in basic earnings (loss) per share | 94,575 | 108,335 | — | ||||||||||||||||||
Diluted earnings (loss) per share: | |||||||||||||||||||||
| Net income (loss) per share | $ | 0.30 | $ | 0.20 | $ | — | |||||||||||||||
| Shares used in diluted earnings (loss) per share | 101,458 | 115,412 | — | ||||||||||||||||||
The accompanying notes are an integral part of the above unaudited pro forma combined statement of operations.
F-53
Table of Contents
Concho Resources Inc. and subsidiaries
Notes to unaudited pro forma
combined statement of operations
Notes to unaudited pro forma
combined statement of operations
Note A.Basis of presentation
Following is a description of the individual columns included in the unaudited pro forma combined statement of operations:
Resources—Represents the operating results of Resources as the accounting successor to Concho Equity Holdings Corp (“CEHC”).
Chase Group Properties—Represents operating results of the properties contributed to Concho Resources by the Chase Group, which consists of: Chase Oil Corporation (“Chase Oil”); Caza Energy LLC (“Caza Energy”); Robert Chase, Richard Chase, Dianne Crouch (collectively, the “Working Interest Group”); and twenty-one other related parties (collectively, the “Employee Group”).
The following table summarizes the final allocated net purchase price of the Chase Group Properties acquisition including capitalized transaction costs:
| (in thousands) | ||||
| Proved oil and gas properties | $ | 830,540 | ||
| Unproved oil and gas properties | 200,000 | |||
| Total assets acquired | $ | 1,030,540 | ||
| Asset requirement obligations | (6,158 | ) | ||
| Chase investors asset purchase obligation | (906 | ) | ||
| Deferred tax liability | (227,735 | ) | ||
| Total liabilities assumed | $ | (234,799 | ) | |
| Net Purchase price | $ | 795,741 | ||
Combination Adjustments—Pro forma adjustments to reflect the combination of Resources and the Chase Group properties (the “Combination”) as if it occurred on January 1, 2006. See Note B for a description of the pro forma adjustments related to the Combination.
Offering Adjustments—Represents the offering of common shares with a net proceeds of . See Note C for a description of the pro forma adjustments related to the Offering.
Note B.Pro forma adjustments related to the Combination
| (a) | To adjust depreciation and depletion for the Chase Group Properties for the acquisition cost recorded by Resources. | |
| (b) | To adjust interest expense for borrowings of approximately $411 million under Resources’ bank credit facility to effect the Combination calculated at the Resources borrowing rate of 7.85% at December 31, 2006. |
F-54
Table of Contents
| (c) | To adjust income taxes for the Combination of the Chase Group Properties at the Company’s effective income tax rate of 39%. | |
| (d) | To adjust preferred stock dividends accrued from January 1, 2005 on Series A preferred shares of CEHC which were converted to Resources common shares as of the date of the Combination and to adjust for preferred stock dividends accrued from January 1, 2006 on Series A preferred shares of CEHC for employees who exchanged their common and preferred shares of CEHC for common shares of Resources on April 16, 2007. | |
| (e) | To eliminate the effects of the induced conversion of preferred stock on February 23, 2006. |
Note C.Pro forma adjustments related to the Offering
F-55
Table of Contents
REPORT OF INDEPENDENT REGISTERED
PUBLIC ACCOUNTING FIRM
PUBLIC ACCOUNTING FIRM
Board of Directors and Stockholders
Concho Resources Inc.
We have audited the accompanying combined statements of assets and liabilities of the Chase Group Properties which consists of the assets and liabilities contributed by the Chase Group (as defined in Note A) as provided for in the Combination Agreement dated February 24, 2006 among Concho Resources, Inc., Concho Equity Holdings Corp. (“Concho Holdings”), the stockholders of Concho Holdings, and the Chase Group as of December 31, 2004 and 2005, and the related combined statements of revenues and expenses, net investment, and cash flows for each of the three years in the period ended December 31, 2005 (collectively, the “Special-Purpose Carve-Out Combined Financial Statements”). These Special-Purpose Carve-Out Combined Financial Statements are the responsibility of the Chase Group Properties’ management. Our responsibility is to express an opinion on these Special-Purpose Carve-Out Combined Financial Statements based on our audits.
We conducted our audits in accordance with the standards of the Public Accounting Oversight Board (United States). Those standards require that we plan and perform the audit to obtain reasonable assurance about whether the Special-Purpose Carve-Out Combined Financial Statements are free of material misstatement. The Chase Group Properties are not required to have, nor were we engaged to perform an audit of its internal control over financial reporting. Our audit included consideration of internal control over financial reporting as a basis for designing audit procedures that are appropriate in the circumstances, but not for the purpose of expressing an opinion on the effectiveness of the Chase Group Properties’ internal control over financial reporting. Accordingly, we express no such opinion. An audit also includes examining, on a test basis, evidence supporting the amounts and disclosures in the Special-Purpose Carve-Out Combined Financial Statements, assessing the accounting principles used and significant estimates made by management, as well as evaluating the overall Special-Purpose Carve-Out Combined Financial Statement presentation. We believe that our audits provide a reasonable basis for our opinion.
In our opinion, the Special-Purpose Carve-Out Combined Financial Statements present fairly, in all material respects, the financial position of the Chase Group Properties as of December 31, 2004, and 2005, and the results of their operations and their cash flows for each of the three years in the period ended December 31, 2005, in conformity with accounting principles generally accepted in the United States of America.
As discussed in Note A, the Chase Group Properties are a group of related assets and liabilities in the form of leasehold interests owned by the Chase Group in certain producing and non-producing oil and gas properties and are not a stand-alone entity. The Special-Purpose Carve-Out Combined Financial Statements of the Chase Group Properties reflect the assets, liabilities, revenues, and expenses directly attributable to the Chase Group Properties, as well as allocations deemed reasonable by management, to present the combined financial position, results of operations, changes in net investment, and cash flows of the Chase Group Properties on a stand-alone basis and do not necessarily reflect the combined financial position, results of operations, changes in net investment, and cash flows of the Chase Group Properties in the future or what they would have been had the Chase Group Properties been a separate, stand-alone entity during the periods presented.
| Kansas City, Missouri | GRANT THORNTON LLP |
April 23, 2007
F-56
Table of Contents
The Chase Group Properties
Combined statements of assets and liabilities
| DECEMBER 31, (in thousands) | 2004 | 2005 | ||||||
ASSETS | ||||||||
| CURRENT ASSETS: | ||||||||
| Accounts receivable: | ||||||||
| Oil and gas sales | $ | 9,532 | $ | 3,949 | ||||
| Oil and gas related party | — | 7,224 | ||||||
| Derivative instruments | — | 1,577 | ||||||
| Total current assets | 9,532 | 12,750 | ||||||
| OIL AND GAS PROPERTIES, SUCCESSFUL EFFORTS METHOD: | ||||||||
| Proved properties | 238,544 | 270,453 | ||||||
| Unproved properties | 1,078 | 1,042 | ||||||
| Salt water disposal system | 966 | 1,214 | ||||||
| Accumulated depletion, depreciation and amortization | (105,020 | ) | (123,667 | ) | ||||
| Total oil and gas properties, net | 135,568 | 149,042 | ||||||
| TOTAL ASSETS | $ | 145,100 | $ | 161,792 | ||||
LIABILITIES AND NET INVESTMENT | ||||||||
| CURRENT LIABILITIES: | ||||||||
| Accounts payable: | ||||||||
| Trade | $ | 352 | $ | 2,153 | ||||
| Related party | 45 | 277 | ||||||
| Current portion of asset retirement obligations | 245 | 402 | ||||||
| Derivative instruments | 3,263 | — | ||||||
| Accrued liabilities | 567 | 615 | ||||||
| Total current liabilities | 4,472 | 3,447 | ||||||
| ASSET RETIREMENT OBLIGATIONS, LESS CURRENT PORTION | 6,614 | 7,531 | ||||||
| COMMITMENTS AND CONTINGENCIES (note K) | ||||||||
| NET INVESTMENT | 134,014 | 150,814 | ||||||
| TOTAL LIABILITIES AND NET INVESTMENT | $ | 145,100 | $ | 161,792 | ||||
The accompanying notes are an integral part of these combined financial statements.
F-57
Table of Contents
The Chase Group Properties
Combined statements of revenues and expenses
| Year Ended December 31, (in thousands) | 2003 | 2004 | 2005 | ||||||
| REVENUES: | |||||||||
| Oil sales | $ | 62,016 | $ | 66,529 | $ | 73,132 | |||
| Gas sales | 41,486 | 41,247 | 46,546 | ||||||
| 103,502 | 107,776 | 119,678 | |||||||
| COSTS AND EXPENSES: | |||||||||
| Oil and gas production | 9,868 | 11,762 | 12,979 | ||||||
| Oil and gas production taxes | 8,815 | 9,202 | 10,298 | ||||||
| Depreciation, depletion and amortization | 19,475 | 20,196 | 18,646 | ||||||
| Impairments of proved properties | 2,065 | 3,233 | 194 | ||||||
| Abandonment expense | 2,116 | 179 | — | ||||||
| Accretion of discount on asset retirement obligations | 168 | 263 | 446 | ||||||
| General and administrative | 1,246 | 1,387 | 1,702 | ||||||
| Loss on derivatives not designated as hedges | 576 | 7,936 | 1,062 | ||||||
| 44,329 | 54,158 | 45,327 | |||||||
| Revenues in excess of expenses | $ | 59,173 | $ | 53,618 | $ | 74,351 | |||
The accompanying notes are an integral part of these combined financial statements.
F-58
Table of Contents
The Chase Group Properties
Combined statement of net investment
| Years Ended December 31, 2003, 2004, and 2005 (in thousands) | Total | |||
| BALANCE AT JANUARY 1, 2003 | $ | 127,821 | ||
| Net change in investment | (52,441 | ) | ||
| Revenues in excess of expenses | 59,173 | |||
| BALANCE AT DECEMBER 31, 2003 | 134,553 | |||
| Net change in investment | (54,157 | ) | ||
| Revenues in excess of expenses | 53,618 | |||
| BALANCE AT DECEMBER 31, 2004 | 134,014 | |||
| Net change in investment | (57,551 | ) | ||
| Revenues in excess of expenses | 74,351 | |||
| BALANCE AT DECEMBER 31, 2005 | $ | 150,814 | ||
The accompanying notes are an integral part of this combined financial statement.
F-59
Table of Contents
The Chase Group Properties
Combined statements of cash flows
| Year Ended December 31, (in thousands) | 2003 | 2004 | 2005 | |||||||||
| CASH FLOWS FROM OPERATING ACTIVITIES: | ||||||||||||
| Revenues in excess of expenses | $ | 59,173 | $ | 53,618 | $ | 74,351 | ||||||
| Adjustments to reconcile revenues in excess of expenses to net cash provided by operating activities: | ||||||||||||
| Depreciation, depletion and amortization | 19,475 | 20,196 | 18,646 | |||||||||
| Impairments of proved properties | 2,065 | 3,233 | 194 | |||||||||
| Abandonment expense | 2,116 | 179 | — | |||||||||
| Accretion of discount on asset retirement obligations | 168 | 263 | 446 | |||||||||
| Loss on derivative instruments not designated as hedges | 576 | 7,936 | 1,062 | |||||||||
| Changes in operating assets and liabilities: | ||||||||||||
| Accounts receivable | 704 | (1,219 | ) | (1,641 | ) | |||||||
| Accounts payable | (45 | ) | (12 | ) | 113 | |||||||
| Accrued liabilities | 33 | 36 | 48 | |||||||||
| Cash settlements of asset retirement obligations | (1 | ) | (28 | ) | (57 | ) | ||||||
| Net cash provided by operating activities | 84,264 | 84,202 | 93,162 | |||||||||
| CASH FLOWS FROM INVESTING ACTIVITIES: | ||||||||||||
| Cash settlements on derivative instruments | (2,374 | ) | (4,673 | ) | (5,902 | ) | ||||||
| Additions to oil and gas properties | (29,449 | ) | (25,372 | ) | (29,709 | ) | ||||||
| Net cash used in investing activities | (31,823 | ) | (30,045 | ) | (35,611 | ) | ||||||
| CASH FLOWS FROM FINANCING ACTIVITIES: | ||||||||||||
| Net change in investment | (52,441 | ) | (54,157 | ) | (57,551 | ) | ||||||
| Net cash used in financing activities | (52,441 | ) | (54,157 | ) | (57,551 | ) | ||||||
| Net change in cash | — | — | — | |||||||||
| BEGINNING CASH | — | — | — | |||||||||
| ENDING CASH | $ | — | $ | — | $ | — | ||||||
The accompanying notes are an integral part of these combined financial statements.
F-60
Table of Contents
The Chase Group Properties
Notes to special-purpose carve-out combined financial statements
December 31, 2003, 2004, and 2005
December 31, 2003, 2004, and 2005
Note A.Organization and Basis of Presentation
On February 24, 2006, Concho Resources, Inc. (“Concho”) and certain other parties, entered into a combination agreement with the Chase Group, which consists of: Chase Oil Corporation (“Chase Oil”); Caza Energy LLC (“Caza Energy”); Robert Chase, Richard Chase, Dianne Crouch (collectively, the “Working Interest Group”); and twenty-one other related parties (collectively, the “Employee Group”), for the purpose of acquiring from the Chase Group a group of related assets and liabilities in the form of leasehold interests owned by the Chase Group in certain producing and non-producing oil and gas properties (the “Chase Group Properties”). The closing with Chase Oil, Caza Energy, and the Working Interest Group occurred on February 27, 2006 and, in exchange, Concho provided consideration of $400 million in cash and 69.4 million shares of Concho common stock for the properties contributed at the closing, which included 767 producing wells, related leases, and undeveloped acreage, located in Chaves, Eddy, and Lea counties in New Mexico. In addition, Concho agreed to subsequently acquire from the Employee Group their individual ownership interests in the Chase Group Properties for consideration of $11.2 million, payable in the form of, at the option of the individuals in the Employee Group, shares of Concho common stock , cash, or a combination of both Concho common stock and cash. Through December 31, 2006, $10.3 million of the $11.2 million has closed. The accompanying financial statements include the assets, liabilities, revenues and expenses of the Chase Group Properties as of December 31, 2004 and 2005 and for each of the three years in the period ended December 31, 2005 combined with the subsequent purchase of interests by Concho.
Note B.Summary of Significant Accounting Policies
Use of Estimates in the Preparation of Financial Statements. Preparation of financial statements in conformity with accounting principles generally accepted in the United States of America requires management to make estimates and assumptions that affect the reported amounts of assets and liabilities, the disclosure of contingent assets and liabilities at the date of the financial statements and the reported amounts of revenues and expenses during the reporting periods. Actual results could differ from these estimates. Depletion, depreciation, and amortization of oil and gas properties are determined using estimates of proved oil and gas reserves. There are numerous uncertainties inherent in the estimation of quantities of proved reserves and in the projection of future rates of production and the timing of development expenditures. Similarly, evaluations for impairment of proved and unproved oil and gas properties are subject to numerous uncertainties including, among others, estimates of future recoverable reserves and commodity price outlooks. Other significant estimates include, but are not limited to, the asset retirement obligations, and fair values of derivative financial instruments.
Oil and Gas Properties. The financial statements utilize the successful efforts method of accounting for oil and gas properties as promulgated by Statement of Financial Accounting Standards (“SFAS”) No. 19, “Financial Accounting and Reporting by Oil and Gas Producing Companies.” Under this method all costs associated with productive wells and nonproductive development wells are capitalized, while nonproductive exploration costs are expensed. Capitalized acquisition costs relating to proved properties are depleted using theunit-of-production method based on proved reserves on a field basis. The depreciation of capitalized exploratory drilling and
F-61
Table of Contents
development costs is based on theunit-of-production method using proved developed reserves on a field basis.
Capitalized costs of individual properties abandoned or retired are charged to accumulated depletion, depreciation and amortization. Proceeds from sales of individual properties are credited to property costs. No gain or loss is recognized until the entire amortization base (field) is sold or abandoned. Ordinary maintenance and repair costs are generally expensed as incurred.
Costs of significant nonproducing properties, wells in the process of being drilled and development projects are excluded from depletion until such time as the related project is developed and proved reserves are established or impairment is determined. Interest is capitalized, if debt is outstanding, on expenditures for significant development projects until such projects are ready for their intended use. For the years ended December 31, 2003, 2004 and 2005, no outstanding debt nor capitalized interest was allocated to the Chase Group Properties (see Note H).
In accordance with SFAS No. 144, “Accounting for the Impairment or Disposal of Long-Lived Assets”, management reviews its long-lived assets to be held and used, including proved oil and gas properties accounted for under the successful efforts method of accounting, whenever events or circumstances indicate that the carrying value of those assets may not be recoverable. An impairment loss is indicated if the sum of the expected future cash flows is less than the carrying amount of the assets. In this circumstance, an impairment loss is recognized for the amount by which the carrying amount of the asset exceeds the estimated fair value of the asset. Management reviews its oil and gas properties by amortization base (field). For each property determined to be impaired, an impairment loss equal to the difference between the carrying value of the properties and the fair value (discounted future cash flows) of the properties would be recognized at that time. Estimating future cash flows involves the use of judgments, including estimation of the proved and unproven oil and gas reserve quantities, timing of development and production, expected future commodity prices, capital expenditures, and production costs. A charge against earnings of approximately $2,065,000, $3,233,000 and $194,000 was recognized during the years ended December 31, 2003, 2004 and 2005, respectively, related to impairment of its proved oil and gas properties.
Unproved oil and gas properties are each periodically assessed for impairment by comparing their cost to their estimated value on aproject-by-project basis. The estimated value is affected by the results of exploration activities, commodity price outlooks, planned future sales or expiration of all or a portion of such projects. If the quantity of potential reserves determined by such evaluations is not sufficient to fully recover the cost invested in each project, an impairment loss will be at that time. During the years ended December 31, 2003, and 2004, impairments on unproved oil and gas properties of approximately $2,116,000 and $179,000, respectively, were recorded. There were no impairments during the year ended December 31, 2005.
Concho operates a salt water well disposal system in which salt water from Chase Group wells or from third parties are disposed of into the well. Management has capitalized the costs to acquire and drill these salt water wells and these costs are being depreciated over the average life of the contributed properties from fields that produce the water to be disposed of, which has been calculated at approximately 14 years for proved properties.
F-62
Table of Contents
Exploration Drilling Costs. Costs of drilling exploratory wells are capitalized as part of proved costs pending management’s determination of whether the wells have found proved reserves. Management makes this determination as soon as possible after completion of drilling considering the guidance provided in SFAS No. 19 “Financial Accounting and Reporting by Oil and Gas Producing Companies.” SFAS No. 19 provides that such costs should not be carried as an asset for more than one year following completion of drilling unless the well has found oil and gas reserves in an area requiring a major capital expenditure before production could begin. In that case, the costs of such exploratory wells continue to be carried as an asset pending determination of whether proved reserves have been found only as long as the well has found a sufficient quantity of reserves to justify its completion as a producing well if the required capital expenditure is made and drilling of the additional exploratory wells is under way or firmly planned for the near future. If both those conditions are not met, the well costs are charged to expense. Management performs this evaluation on a quarterly basis. As of December 31, 2004 and 2005, no pending exploratory well costs were recorded.
Income Taxes. Income and expenses from the financial statements are combined with the income and expenses of the beneficial owners of properties from other sources and reported in the beneficial owners’ individual federal and state income tax returns. The Chase Group Properties are not a taxpaying entity for purposes of federal and state income taxes. Accordingly, no income taxes have been recorded in the financial statements.
Environmental. The Chase Group Properties are subject to extensive Federal, state and local environmental laws and regulations. These laws, which are often changing, regulate the discharge of materials into the environment and may require removal or mitigation of the environmental effects of the disposal or release of petroleum or chemical substances at various sites. Environmental expenditures are expensed. Expenditures that relate to an existing condition caused by past operations and that have no future economic benefits are expensed. Liabilities for expenditures of a noncapital nature are recorded when environmental assessmentand/or remediation is probable, and the costs can be reasonably estimated. Such liabilities are generally undiscounted unless the timing of cash payments is fixed and readily determinable. Management believes no significant liabilities of this nature existed at December 31, 2004 and 2005.
Oil and Gas Sales. Oil and gas sales revenues are recognized when delivery has occurred and title to the products has transferred to the purchaser.
Accounts Receivable. The Chase Group Properties sell oil and gas to various customers and participates with other parties in the drilling, completion and operation of oil and gas wells. Joint interest and oil and gas sales receivables related to these operations are generally unsecured. Management determines joint interest operations accounts receivable allowances based on management’s assessment of the credit worthiness of the joint interest owners and the ability to realize the receivables through netting of anticipated future production revenues. Receivables are considered past due if full payment is not received by the contractual due date. Past due accounts are generally written off against the allowance for doubtful accounts only after all collection attempts have been exhausted. No allowance for doubtful accounts was recorded at December 31, 2004 and 2005.
Derivatives and Hedging. The financial statements apply the provisions of SFAS No. 133, “Accounting for Derivative Instruments and Hedging Activities” as amended. This statement requires the recognition of all derivative instruments as either assets or liabilities measured at
F-63
Table of Contents
fair value. The Chase Group Properties’ derivative instruments do not qualify as hedges and are adjusted to fair value with a gain or loss recognized through net income.
Asset Retirement Obligations. The financial statements account for obligations in accordance with SFAS No. 143, “Accounting for Asset Retirement Obligations”. SFAS No. 143 requires entities to record the fair value of a liability for an asset retirement obligation in the period in which it is incurred and a corresponding increase in the carrying amount of the related long-lived asset. Subsequently, the asset retirement cost included in the carrying amount of the related asset is allocated to expense through depreciation of the asset. Changes in the liability due to passage of time are recognized as an increase in the carrying amount of the liability and as corresponding accretion expense.
General and Administrative Expenses. The Chase Group Properties do not have any employees. All general and administrative functions are performed by Mack Energy Corporation, a related-party operator. Accordingly, the accompanying carve out financial statements include an allocation of such costs that directly relate to the Chase Group Properties, including personnel costs of those personnel that work solely for the Chase Group Properties and an allocation of corporate salaries and benefits and other costs that management believes reasonably reflects the portion of the related employees time that benefits the Chase Group Properties. Amounts allocated were approximately $1,246,000, $1,387,000 and $1,702,000 for the years ended December 31, 2003, 2004 and 2005, respectively.
Net Investment in the Chase Group Properties. The net investment in the Chase Group Properties represents a net cumulative balance as the result of transactions between the Chase Group and Mack Energy Corporation, and other related entities and oil and gas properties not included in the Chase Group Properties. There are no terms of settlement or interest charges associated with this balance. The balance also includes the net result of the Chase Group Properties participation in the overall central cash management and treasury program of the Chase Group, Mack Energy Corporation, and other related entities and oil and gas properties not included in the Chase Group Properties.
Note C.Related Party
The Chase Group Properties are billed for services and supplies provided by related entities. In addition, the Chase Group Properties are billed by Mack Energy Corporation, as operator, for services performed by outside parties in which Chase Group Properties benefit from the services or supplies. Total billings for the year ended December 31, 2003, 2004 and 2005 from Mack Energy Corporation to the Chase Group Properties were approximately $41,039,000, $35,365,000 and $46,288,000, respectively. Total billings for the year ended December 31, 2004 and 2005 from Alliance Drilling Fluids, LLC were approximately $109,000 and $365,000, respectively. Total billings for the year ended December 31, 2005 from Catalyst Oilfield Services were approximately $161,000.
The Chase Group Properties has receivables from Mack Energy Corporation of approximately $7,224,000 at December 31, 2005 relating to oil and gas sales receivables. The Chase Group Properties has payables of approximately $45,000 and $277,000 to related parties at December 31, 2004 and 2005, respectively, for services and supplies provided.
F-64
Table of Contents
Note D.Disclosures About Fair Value of Financial Instruments
Accounts Receivable and Accounts Payable. The carrying amounts approximate fair value due to the short maturity of these instruments.
Commodity Price Collar Contracts. The fair value of derivative instruments is estimated by management considering various factors, including closing exchange andover-the-counter quotations, and the time value of the underlying commitments and represents the estimated amounts that the Chase Group Properties would expect to receive or pay to settle the derivative contracts. (See Note G)
Note E.New Accounting Pronouncements
On December 16, 2004, the Financial Accounting Standards Board (“FASB”) issued SFAS No. 153, “Exchanges of Nonmonetary Assets—An Amendment of APB Opinion No. 29”. SFAS No. 153 amends APB Opinion No. 29, “Accounting for Monetary Transactions” that was issued in 1973. The amendments are based on the principle that exchanges of nonmonetary assets should be measured based on the fair value of the assets exchanged. Further, the amendments eliminate the narrow exception for nonmonetary exchanges of similar productive assets and replace it with a broader exception for exchanges of nonmonetary assets that do not have “commercial substance.” Previously, APB No. 29 required that the accounting for an exchange of a productive asset for a similar productive asset or an equivalent interest in the same or similar productive asset should be based on the recorded amount of the asset relinquished. The provisions in SFAS No. 153 are effective for nonmonetary asset exchanges occurring in fiscal periods beginning after June 15, 2005 and must be applied prospectively. The adoption of SFAS No. 153 did not have a significant impact on the financial position or results of operations of the Chase Group Properties.
The FASB issued Staff Position (“FSP”) Nos.141-1 and142-1. As a result of the March 17—18, 2004, Emerging Issues Task Force (“EITF”) meeting, after the EITF reached a consensus on EITF IssueNo. 04-2, “Whether Mineral Rights are Tangible or Intangible Assets,” and concluded that mineral rights, as defined in this issue, are tangible assets. These FSPs addressed the inconsistency between consensus and the characterization of mineral rights as intangible assets in SFAS No. 141, “Business Combinations” and SFAS No. 142, “Goodwill and Other Intangible Assets”. The guidance in these FSPs is applicable to the first reporting period beginning after April 29, 2004, and therefore effective for the Chase Group January 1, 2005. Management adopted these FSPs effective January 1, 2005. The adoption of these FSPs did not have any impact on the financial position or results of operations of the Chase Group Properties.
In March 2005, the FASB published FASB Interpretation (“FIN”) No. 47, “Accounting for Conditional Asset Retirement Obligations,” which requires companies to record a liability for those asset retirement obligations in which the timing or amount of settlement of the obligation are uncertain. These conditional obligations were not addressed by SFAS No. 143. FIN No. 47 will require the Chase Group to accrue a liability when a range of scenarios can be determined. Management adopted FIN No. 47 December 31, 2005. The adoption of FIN No. 47 did not have an impact on the financial position or results of operations of the Chase Group Properties.
The FASB issued FSPNo. 19-1, “Accounting for Suspended Well Costs”, which amends SFAS No. 19 to provide that in those situations where exploration drilling has been completed and oil and gas reserves have been found, but such reserves cannot be classified as proved when drilling is
F-65
Table of Contents
complete, the drilling costs may be capitalized if the well has found a sufficient quantity of reserves to justify its completion as a producing well and the enterprise is making sufficient progress assessing the reserves and the economic and operating viability of the project. If either of the criteria is not met, the well is assumed to be impaired and the costs charged to expense. Any well that has not found reserves is charged to expense. The adoption of this pronouncement is not expected to have a significant impact on the oil and gas properties contained in these special purpose carve-out combined financial statements.
In July 2006, the FASB issued FIN No. 48 “Accounting for Uncertainty in Income Taxes—an Interpretation of FASB Statement 109.” FIN No. 48 clarifies that an entity’s tax benefits recognized in tax returns must be more likely than not of being sustained prior to recording the related tax benefit in the financial statements. The adoption of this pronouncement is not expected to have a significant impact on the oil and gas properties contained in these special purpose carve-out combined financial statements.
Note F.Asset Retirement Obligations
The asset retirement obligations represent the present value of the estimated cash flows that will be incurred to plug, abandon and remediate producing properties at the end of their production lives, in accordance with applicable state laws. The following is a reconciliation of the changes in the asset retirement obligations for December 31, 2003, 2004 and 2005:
| (In thousands) | 2003 | 2004 | 2005 | |||||||||
| Asset retirement obligations, beginning of year | $ | 4,805 | $ | 5,538 | $ | 6,859 | ||||||
| Liability incurred upon acquiring and drilling wells | 663 | 991 | 790 | |||||||||
| Liability settled upon plugging and abandoning wells | (1 | ) | (28 | ) | (57 | ) | ||||||
| Revisions to estimated cash flows | (97 | ) | 95 | (105 | ) | |||||||
| Accretion expense | 168 | 263 | 446 | |||||||||
| Asset retirement obligations, end of year | $ | 5,538 | $ | 6,859 | $ | 7,933 | ||||||
Note G.Derivative Financial Instruments
During 2004 and 2005, the Chase Group Properties had certain derivative instruments that did not qualify as hedges under SFAS No. 133 “Accounting for Derivative Instruments and Hedging Activities”. As such, the net change in their fair value has been recognized in the statements of income.
In April 2004, management purchased an oil collar contract for the period of May 2004 through April 2005 with a floor of $28.00 a barrel and a ceiling of $37.00 a barrel on a daily notional volume of 2,000 barrels.
Additionally, in 2004 management purchased an oil collar contract in May 2004 for the period of June 2004 through May 2005 with a floor of $31.00 and a ceiling of $40.00 on a daily notional volume of 2,000 barrels. In December 2005, management purchased a Gas Swap contract for the period of January 2006 through December 2006 for a fixed price of $10.73 on a daily notional volume of 5,000 MMBtu.
F-66
Table of Contents
The following table sets forth the outstanding natural gas swap agreement and the crude oil zero cost collar option agreements as of December 31, 2004 and 2005.
| Contract Period | ||||||
| As of December 31, 2005 | 2005 | 2006 | ||||
| Daily gas production: | ||||||
| Swap: | ||||||
| Volume (MMBtu/day) | — | 5,000 | ||||
| Index price per MMBtu | — | $ | 10.73 | |||
NYMEX price per MMBtu(a) | — | $ | 8.66 | |||
| Contract Period | ||||||
| As of December 31, 2004 | 2005 | 2006 | ||||
| Daily oil production: | ||||||
| Collar Options: | ||||||
| Volume (Bbl/day) | 2,000 | — | ||||
NYMEX price per Bbl(b) | $ | 50.40 | — | |||
| Floor | $ | 28.00 | — | |||
| Ceiling | $ | 37.00 | — | |||
| Collar Options: | ||||||
| Volume (Bbl/day) | 2,000 | — | ||||
NYMEX price per Bbl(b) | $ | 50.40 | — | |||
| Floor | $ | 31.00 | — | |||
| Ceiling | $ | 40.00 | — | |||
| (a) | Amount disclosed represents U.S. Natural Gas Wellhead price monthly average spot price. | |
| (b) | Amount disclosed represents NYMEX West Texas Intermediate monthly average spot price. |
The Chase Group Properties had derivative instruments not designated as cash flow hedges in 2003, 2004, and 2005 in which the following losses were recorded for each of the following years of the derivative instruments:
| 2003 | $ | 576,000 | |
| 2004 | 7,936,000 | ||
| 2005 | 1,062,000 | ||
The losses were recorded asLoss on derivatives not designated as hedgesin the statements of revenues and expenses in the respective year.
Note H.Debt
For the periods ending December 31, 2003, 2004, and 2005, Chase Oil Corporation and Caza Energy maintained a joint credit facility that had a maximum face amount of $200,000,000 with JP Morgan Chase Bank as Administrative Agent and Bank of Scotland and Frost Bank as participating banks. The facility was secured by substantially all of the assets of Chase Oil
F-67
Table of Contents
Corporation and Caza Energy which consisted of primarily oil and gas properties including the Chase Group Properties. The facilities contained cross default provisions in addition to guaranties to and from various related parties including principal shareholders of Chase Oil Corporation and Caza Energy and other affiliated operating companies, namely Mack C. Chase Trust and Mack Energy Corporation. The availability under the agreement was subject to semi-annual borrowing base redeterminations of the oil and gas properties. The agreement contained terms and conditions similar to other oil and gas facilities provided by the lenders including minimum current ratio and maximum debt to earnings before interest, taxes, depreciation, depletion, amortization and capital expenditures. Advances to and investments in related parties were also restricted by the agreement and adjusted at each redetermination. Interest on borrowings was determined based on the ratio of total amounts outstanding to total amounts available under the facility and the interest rate varied from JP Morgan Chase Bank Prime Rate less 50 to 75 basis points, or at the option of Chase Oil Corporation and Caza Energy, the London Interbank Offered Rate (LIBOR) plus 150 to 225 basis points. The balances due to the lenders at December 31, 2003, 2004 and 2005 were approximately $57,350,000, $77,183,000 and $105,600,000, respectively. Upon the closing of the Combination Agreement, the outstanding balance was retired and the availability was reduced to $10,000,000. The Chase Group Properties provided the primary collateral support for this facility. Due to the maturity and the quality of the Chase Group Properties, they required an insignificant amount of capital expense to maintain predictable production rates. Therefore, borrowings under this line were primarily used for acquisition and development of oil and gas properties outside of the Chase Group Properties and for permitted advances to and investments in related parties. Advances to related parties bore interest at JP Morgan Chase Bank Prime rate less 50 basis points. The balances due from the Chase related parties at December 31, 2003, 2004 and 2005 were approximately $46,042,000, $73,543,000 and $110,075,000, respectively. Since borrowings under the facility were used primarily to fund activities not related to the Chase Group Properties and the borrowings were substantially offset by amounts due from related parties, no debt or interest has been allocated to the Chase Group Properties in the accompanying financial statements.
The parties in the Working Interest Group each maintained separate credit facilities with Frost National Bank under similar terms and conditions as Chase Oil Corporation and Caza Energy. The individuals in the Employee Group have utilized credit facilities with lenders based on their individual financial needs and credit worthiness. The combination agreement required assets transferred to Concho be free and clear of any liens other than permitted liens.
Note I.Major Customers and Derivative Counterparties
Sales to major customers. Navajo Refining Company accounted for approximately 51%, 52% and 52% of the oil and gas revenues of the Chase Group Properties during the years ended December 31, 2003, 2004 and 2005, respectively.
Duke Energy Field Services accounted for approximately 28%, 30% and 31% of the oil and gas revenues of the Chase Group Properties during the years ended December 31, 2003, 2004 and 2005, respectively.
Navajo Refining Company accounted for approximately 50% and 47% of total accounts receivable of the Chase Group Properties during the years ended December 31, 2004 and 2005, respectively.
F-68
Table of Contents
Duke Energy Field Services account for approximately 25% and 27% of total accounts receivable of the Chase Group Properties during the years ended December 31, 2004 and 2005, respectively.
Derivative counterparties. Management uses credit and other financial criteria to evaluate the credit standing of, and to select, counterparties to its derivative instruments. The revolving credit facility agreement requires that the senior unsecured debt ratings of the derivative counterparties is not less than A- by JP Morgan Chase Bank. At December 31, 2004 and 2005, the counterparties met or exceeded the required ratings. Although Management does not obtain collateral or otherwise secure the fair value of its derivative instruments, management believes the associated credit risk is mitigated by credit risk policies and procedures and by the credit rating requirements of the credit facility agreement. At December 31, 2004, the Chase Group Properties had approximately $3.26 million derivative liabilities representing amounts owed to counterparties. At December 31, 2005, the Chase Group Properties had approximately $1.58 million derivative assets owed by counterparties.
Note J.Supplementary Information
Capitalized costs.
| (In thousands) | December 31, 2004 | December 31, 2005 | ||||||
| Oil and gas properties: | ||||||||
| Proved | $ | 238,544 | $ | 270,453 | ||||
| Unproved | 1,078 | 1,042 | ||||||
| Less accumulated depletion, depreciation, and amortization | (105,020 | ) | (123,667 | ) | ||||
| Net capitalized costs for oil and gas properties | $ | 134,602 | $ | 147,828 | ||||
Costs incurred for oil and gas producing activities.
| Year Ended | Year Ended | |||||
| (In thousands) | December 31, 2004 | December 31, 2005 | ||||
| Property acquisition costs: | ||||||
| Proved | $ | 1,277 | $ | 8,283 | ||
| Unproved | 333 | — | ||||
| Development | 22,755 | 23,384 | ||||
| Asset retirement costs | 1,086 | 685 | ||||
| Costs incurred for oil and gas properties | $ | 25,451 | $ | 32,352 | ||
Reserve quantity information (unaudited). The estimates of proved oil and gas reserves, which are located primarily in the Permian Basin region of Eastern New Mexico were prepared by the Chase Group Properties engineers. These reserve estimates were reviewed and confirmed by Cawley, Gillespie and Associates, Inc. Reserves were estimated in accordance with guidelines established by the SEC, which require that reserve estimates be prepared under existing economic and operating conditions with no provision for price and cost escalations except by
F-69
Table of Contents
contractual arrangements. The reserve estimates for 2003, 2004 and 2005 utilize NYMEX oil price of $32.55, $43.46, and $61.04 per bbl, respectively, and a NYMEX gas price of $5.83, $6.19 and $10.08 per Mcf, respectively, as adjusted for location, grade and quality. These prices approximate actual prices being realized at the respective year ends.
Oil and gas reserve quantity estimates are subject to numerous uncertainties inherent in the estimation of quantities of proved reserves and in the projection of future rates of production and the timing of development expenditures. The accuracy of such estimates is a function of the quality of available data and of engineering and geological interpretation and judgment. Results of subsequent drilling, testing and production may cause either upward or downward revision of previous estimates. Further, the volumes considered to be commercially recoverable fluctuate with changes in prices and operating costs. Management emphasizes that reserve estimates are inherently imprecise and that estimates of new discoveries are more imprecise than those of currently producing oil and gas properties. Accordingly, these estimates are expected to change as additional information becomes available in the future.
| 2003 | 2004 | 2005 | ||||||||||||||||||||||
| Oil and | Natural | Oil and | Natural | Oil and | Natural | |||||||||||||||||||
| Condensate | Gas | Condensate | Gas | Condensate | Gas | |||||||||||||||||||
| (MBbls) | (MMcf) | (MBbls) | (MMcf) | (MBbls) | (MMcf) | |||||||||||||||||||
| Total Proved Reserves | ||||||||||||||||||||||||
| Balance, beginning of year | 28,234 | 139,362 | 27,520 | 140,464 | 26,692 | 139,118 | ||||||||||||||||||
Purchase ofminerals-in-place | — | — | — | — | 733 | 1,457 | ||||||||||||||||||
| New discoveries and extensions | 147 | 433 | 85 | 150 | 1,118 | 2,438 | ||||||||||||||||||
| Revisions of previous estimates | 1,264 | 9,327 | 838 | 6,140 | 719 | 5,031 | ||||||||||||||||||
| Production | (2,125 | ) | (8,658 | ) | (1,751 | ) | (7,636 | ) | (1,429 | ) | (6,636 | ) | ||||||||||||
| Balance, end of year | 27,520 | 140,464 | 26,692 | 139,118 | 27,833 | 141,408 | ||||||||||||||||||
| Proved Developed Reserves: | ||||||||||||||||||||||||
| Beginning of year | 14,915 | 77,934 | 14,104 | 79,802 | 13,318 | 78,121 | ||||||||||||||||||
| End of year | 14,104 | 79,802 | 13,318 | 78,121 | 13,365 | 77,331 | ||||||||||||||||||
Standardized measure of discounted future net cash flows (unaudited). The standardized measure of discounted future net cash flows is computed by applying year-end prices of oil and gas (with consideration of price changes only to the extent provided by contractual arrangements) to the estimated future production of proved oil and gas reserves less estimated future expenditures (based on year-end costs) to be incurred in developing and producing the proved reserves, discounted using a rate of 10 percent per year to reflect the estimated timing of the future cash flows.
Discounted future cash flow estimates like those shown below are not intended to represent estimates of the fair value of oil and gas properties. Estimates of fair value would also consider probable and possible reserves, anticipated future oil and gas prices, interest rates, changes in development and production costs and risks associated with future production. Because of these and other considerations, any estimate of fair value is necessarily subjective and imprecise.
F-70
Table of Contents
| December 31, | December 31, | December 31, | ||||||||||
| (In thousands) | 2003 | 2004 | 2005 | |||||||||
| Oil and gas producing activities: | ||||||||||||
| Future cash inflows | $ | 1,586,671 | $ | 1,895,936 | $ | 2,980,762 | ||||||
| Future production costs, abandonment and taxes | (446,938 | ) | (503,389 | ) | (677,934 | ) | ||||||
| Future development costs | (203,403 | ) | (255,054 | ) | (302,331 | ) | ||||||
| Future net cash flows | 936,330 | 1,137,493 | 2,000,497 | |||||||||
| 10% annual discount factor | (478,073 | ) | (591,352 | ) | (998,521 | ) | ||||||
| Standardized measure of discounted future cash flows | $ | 458,257 | $ | 546,141 | $ | 1,001,976 | ||||||
Changes in standardized measure of discounted future net cash flows (unaudited).
| December 31, | December 31, | December 31, | ||||||||||
| (In thousands) | 2003 | 2004 | 2005 | |||||||||
Purchases ofminerals-in-place | $ | — | $ | — | $ | 12,380 | ||||||
| Extensions and discoveries | 2,000 | 1,114 | 17,706 | |||||||||
| Net changes in prices and production costs | 79,426 | 139,744 | 411,692 | |||||||||
| Oil and gas sales, net of production costs | (84,819 | ) | (86,812 | ) | (96,401 | ) | ||||||
| Revisions of previous quantity estimates | 31,036 | 25,440 | 34,010 | |||||||||
| Accretion of discount | 40,195 | 45,826 | 54,614 | |||||||||
| Development costs changes | (22,269 | ) | (31,502 | ) | (18,275 | ) | ||||||
| Changes in production rates, timing and other | 10,735 | (5,926 | ) | 40,109 | ||||||||
| Change in present value of future net revenues | 56,304 | 87,884 | 455,835 | |||||||||
| Balance, beginning of year | 401,953 | 458,257 | 546,141 | |||||||||
| Balance, end of year | $ | 458,257 | $ | 546,141 | $ | 1,001,976 | ||||||
Note K.Settlement Agreement
From 1984 thru May 1997, certain owners of the Chase Group Properties and their predecessors drilled or deepened approximately 70 wells and completed and produced from zones below a depth approved by the New Mexico Oil Conservation Division (“NMOCD”). The companies that owned the applicable Chase Group Properties possessed the ownership rights entitling them to produce hydrocarbons from any zone, but did not have the required regulatory approvals. In December 2005, the NMOCD issued approvals that encompass 63 of the approximately 70 wells and in January 2007, the NMOCD issued approvals that encompass the remaining nine wells. The drilling and completion reports filed with the NMOCD relating to these wells were incorrect and the monthly production reports did not reflect that production was obtained from outside the depth approved by the NMOCD. As a result, a unit royalty owner in the unitized formation was overpaid and the State of New Mexico, which was the owner of the royalty interest outside
F-71
Table of Contents
the unitized formation, was underpaid for several years. In November 2006, Mack Energy Corporation entered into a settlement agreement with the State of New Mexico whereby it paid all unpaid royalties for prior years production plus accrued interest. Chase Oil Corporation, as the lessee of the property, had the fiduciary duty of ensuring the lessors were properly paid, therefore the accompanying financial statements include in oil and gas production expense the additional royalty and interest expense, aggregating, $32,925, $36,549 and $47,951 in 2003, 2004 and 2005, respectively. In January 2007, Mack Energy Corporation paid the NMOCD a penalty of $250,000 for false reporting and the NMOCD released Mack Energy Corporation and its officers, directors and employees from liability for this matter. This penalty was the responsibility of Mack Energy Corporation, as operator, and is not reflected in the accompanying financial statements. Management believes that all required completion records and production records affecting the properties included in the accompanying financial statements have been corrected and submitted to the NMOCD.
F-72
Table of Contents
REPORT OF INDEPENDENT REGISTERED
PUBLIC ACCOUNTING FIRM
PUBLIC ACCOUNTING FIRM
The Shareholders of
Concho Equity Holdings Corp.:
Concho Equity Holdings Corp.:
We have audited the accompanying statements of revenues and direct operating expenses of Lowe Partners, LP’s interests in certain oil and gas properties acquired by Concho Equity Holdings Corp. (“Company”) for the year ended December 31, 2003 and for the period from January 1, 2004 to November 30, 2004. These statements of revenues and direct operating expenses are the responsibility of the Company’s management. Our responsibility is to express an opinion on these statements of revenues and direct operating expenses based on our audits.
We conducted our audits in accordance with the standards of the Public Company Accounting Oversight Board (United States). Those standards require that we plan and perform the audit to obtain reasonable assurance about whether the financial statements are free of material misstatement. The Company is not required to have, nor were we engaged to perform an audit of its internal control over financial reporting. Accordingly, we express no such opinion. Our audit included examining, on a test basis, evidence supporting the amounts and disclosures in the financial statements. An audit also includes assessing the accounting principles used and significant estimates made by management, as well as evaluating the overall financial statement presentation. We believe that our audits provide a reasonable basis for our opinion.
The accompanying statements were prepared for the purpose of complying with the rules and regulations of the Securities and Exchange Commission (for inclusion in the registration statement onForm S-1 of the Company) as described in Note A to the statements and are not intended to be a complete presentation of Lowe Partners, LP’s revenues and expenses.
In our opinion, the statements of revenues and direct operating expenses referred to above present fairly, in all material respects, the revenues and direct operating expenses of Lowe Partners, LP’s interest in the properties acquired by the Company for the year ended December 31, 2003 and for the period from January 1, 2004 to November 30, 2004 in conformity with accounting principles generally accepted in the United States of America.
GRANT THORNTON LLP
Dallas, Texas,
May 17, 2006
F-73
Table of Contents
Lowe Partners, LP
Statements of revenues and direct operating expenses
For the year ended December 31, 2003 and period from January 1, 2004 to November 30, 2004
| 11 months | ||||||
| Year ended | ended | |||||
| December 31, | November 30, | |||||
| (in thousands) | 2003 | 2004 | ||||
Revenues: | ||||||
| Oil and gas sales | $ | 31,392 | $ | 33,753 | ||
| Interest and other | 979 | 910 | ||||
| Total revenues | 32,371 | 34,663 | ||||
Direct operating expenses: | ||||||
| Lease operating expense | 6,652 | 6,983 | ||||
| Production taxes | 2,023 | 2,159 | ||||
| Other expenses | 435 | 461 | ||||
| Total direct operating expenses | 9,110 | 9,603 | ||||
Revenues in excess of direct operating expenses | $ | 23,261 | $ | 25,060 | ||
See accompanying notes to statements of revenues and direct operating expenses.
F-74
Table of Contents
Lowe Partners, LP
Notes to statements of revenues and
direct operating expenses
For the year ended December 31, 2003 and
period from January 1, 2004 to November 30, 2004
direct operating expenses
For the year ended December 31, 2003 and
period from January 1, 2004 to November 30, 2004
Note A Summary of significant events and accounting policies
Basis of presentation
Concho Equity Holdings Corp. (“Concho” or the “Company”) is a Delaware corporation formed on April 21, 2004. The Company’s principal business is the acquisition and exploitation of oil and gas properties in the Permian Basin region of West Texas and Eastern New Mexico. On December 7, 2004 one of the Company’s wholly-owned subsidiaries, COG Oil & Gas LP (“COG LP”), acquired interests in several producing crude oil and natural gas fields in the Permian Basin region of Eastern New Mexico and West Texas from the privately-held company, Lowe Partners, LP (“Seller”). In conjunction with this same transaction, a separate wholly-owned subsidiary of the Company, COG Realty LLC (“Realty”), acquired 100% ownership in two commercial real estate buildings in Midland, Texas from an affiliate of the Seller. The rental income and expenses associated with the buildings are reflected in “Interest and other” and “Other expenses” on the Statements.
The accompanying statements of operating revenues and direct operating expenses were derived from the historical accounting records of the Seller and are presented on the accrual basis of accounting. Such amounts may not be representative of future operations. The statements do not include depreciation, depletion and amortization, general and administrative expenses, income taxes or interest expense as these costs may not be comparable to the expenses expected to be incurred by the Company on a prospective basis.
Historical financial statements reflecting financial position, results of operations and cash flows required by accounting principles generally accepted in the United States of America are not presented as such information is not readily available on an individual property basis and not meaningful to the Lowe Partners, LP properties acquired. Accordingly, the historical statements of revenues and direct operating expenses are presented in lieu of the financial statements required underRule 3-05 of the Securities and Exchange CommissionRegulation S-X.
Use of estimates
The preparation of the accompanying financial statements in conformity with generally accepted accounting principles requires the Company’s management to make estimates and assumptions that affect the reported amounts of revenues and direct operating expenses during the reporting period. The estimates include oil and gas reserve quantities. Management emphasizes that reserve estimates are inherently imprecise and that estimates of more recent reserve discoveries are more imprecise than those for properties with long production histories. Actual results could materially differ from these estimates.
F-75
Table of Contents
Revenue recognition
Title to the produced quantities transfers to the purchaser at the time the purchaser collects or receives the quantities. Prices for such production are defined in the sales contracts.
Risks and uncertainties
Historically, the market for oil and natural gas has experienced significant price fluctuations. Prices are impacted by supply and demand, both domestic and international, seasonal variations caused by changing weather conditions, political conditions, governmental regulations, the availability, proximity and capacity of gathering systems for natural gas, and numerous other factors. Increases or decreases in prices received could have a significant impact on the Company’s future results of operations, reserves estimates and financial position.
Estimating oil and gas reserves is complex and is not exact because of the numerous uncertainties inherent in the process. The process relies on interpretations of available geological, geophysical, petrophysical, engineering and production data. The extent, quality and reliability of both the data and the associated interpretations of that data can vary. The process also requires certain economic assumptions, including, but not limited to, oil and gas prices, drilling and operating expenses, capital expenditures, and taxes. Actual future production, oil and gas prices, revenues, taxes, development expenditures, operating expenses and quantities of recoverable oil and gas most likely will vary from the Company’s estimates. Any significant variance could materially affect the Company’s future results of operations, reserves estimates and financial position.
Note B Supplemental oil and gas reserve information (unaudited)
Reserve quantity information
The estimates of proved oil and gas reserves, which are located primarily in the Permian Basin region of West Texas and Eastern New Mexico were prepared by the Company’s engineers. Reserves were estimated in accordance with guidelines established by the Securities and Exchange Commission and the Financial Accounting Standards Board, which require that reserve estimates be prepared under existing economic and operating conditions with no provision for price and cost escalations except by contractual arrangements. Future production costs exclude overhead charges for Company operated properties. Average wellhead prices in effect at November 30, 2004, inclusive of adjustments for quality and location used in determining future net revenue related to the standardized measure calculation, were $49.13 per barrel of oil and $7.62 per Mcf of gas.
Estimates of proved reserves of the Lowe Partners, LP properties are not available prior to November 30, 2004. For purposes of determining proved reserves at December 31, 2003, the Company estimated reserves using the November 30, 2004 reserves run at an average wellhead price at December 31, 2003 of $32.52 and $6.19 for oil and gas, respectively, adding back current period production and then reducing it by the reserves identified as new extensions and discoveries in 2004. For proved reserves at December 31, 2002, the Company estimated reserves using the November 30, 2004 reserves run at an average wellhead price at December 31, 2002 of $31.17 and $4.75 for oil and gas respectively, adding back current year production and then reducing it by the reserves identified as new extensions and discoveries in 2003.
F-76
Table of Contents
Oil and gas reserve quantity estimates are subject to numerous uncertainties inherent in the estimation of quantities of proved reserves and in the projection of future rates of production and the timing of development expenditures. The accuracy of such estimates is a function of the quality of available data and of engineering and geological interpretation and judgment. Results of subsequent drilling, testing and production may cause either upward or downward revision of previous estimates. Further, the volumes considered to be commercially recoverable fluctuate with changes in prices and operating costs. The Company emphasizes that reserve estimates are inherently imprecise and that estimates of new discoveries are more imprecise than those of currently producing oil and gas properties. Accordingly, these estimates are expected to change as additional information becomes available in the future.
| Year ended | 11 months ended | |||||||||||||||
| December 31, 2003 | November 30, 2004 | |||||||||||||||
| Oil and | Natural | Oil and | Natural | |||||||||||||
| condensate | gas | condensate | gas | |||||||||||||
| (MBbls) | (MMcf) | (MBbls) | (MMcf) | |||||||||||||
| Total Proved Reserves | ||||||||||||||||
| Balance at beginning of period | 6,186 | 34,596 | 5,763 | 33,455 | ||||||||||||
| New discoveries and extensions | 88 | 1,872 | 31 | 91 | ||||||||||||
| Revisions of previous estimates | 55 | 45 | 928 | 1,557 | ||||||||||||
| Production from continuing operations | (566 | ) | (3,058 | ) | (483 | ) | (2,778 | ) | ||||||||
| Balance at end of period | 5,763 | 33,455 | 6,239 | 32,325 | ||||||||||||
| Proved Developed Reserves | ||||||||||||||||
| Balance at end of period | 4,179 | 25,434 | 4,497 | 23,562 | ||||||||||||
Standardized measure of discounted future net cash flows
The standardized measure of discounted future net cash flows is computed by applying year-end prices of oil and gas (with consideration of price changes only to the extent provided by contractual arrangements) to the estimated future production of proved oil and gas reserves less estimated future expenditures (based on year-end costs) to be incurred in developing and producing the proved reserves, discounted using a rate of 10 percent per year to reflect the estimated timing of the future cash flows. Income taxes are excluded because the property interests included in the Lowe Partners, LP acquisition represent only a portion of a business for which income taxes are not estimable.
Discounted future cash flow estimates like those shown below are not intended to represent estimates of the fair value of oil and gas properties. Estimates of fair value would also consider probable and possible reserves, anticipated future oil and gas prices, interest rates, changes in development and production costs and risks associated with future production. Because of these and other considerations, any estimate of fair value is necessarily subjective and imprecise.
F-77
Table of Contents
| 11 months | ||||||||
| Year ended | ended | |||||||
| December 31, | November 30, | |||||||
| 2003 | 2004 | |||||||
| (in thousands) | (in thousands) | |||||||
| Oil and gas producing activities: | ||||||||
| Future cash inflows | $ | 316,376 | $ | 517,956 | ||||
| Future production costs | (128,943 | ) | (177,881 | ) | ||||
| Future development and abandonment costs | (29,729 | ) | (22,115 | ) | ||||
| Future net cash flows | 157,704 | 317,960 | ||||||
| 10% annual discount factor | (78,094 | ) | (149,811 | ) | ||||
| Standardized measure of discounted future cash flows | $ | 79,610 | $ | 168,149 | ||||
Changes in standardized measure of discounted future net cash flows
| 11 months | ||||||||
| Year ended | ended | |||||||
| December 31, | November 30, | |||||||
| 2003 | 2004 | |||||||
| (in thousands) | (in thousands) | |||||||
| Purchases of minerals in place | $ | — | $ | — | ||||
| Extensions and discoveries, less related cost | 5,987 | 994 | ||||||
| Net changes in prices and production costs | (4,241 | ) | 65,771 | |||||
| Oil and gas sales, net of production costs | (22,717 | ) | (24,611 | ) | ||||
| Revisions of previous quantity estimates | 437 | 16,149 | ||||||
| Accretion of discount | 7,362 | 7,961 | ||||||
| Changes in production rates, timing and other | 19,159 | 22,275 | ||||||
| Change in present value of future net revenues | 5,987 | 88,539 | ||||||
| Balance, beginning of year | 73,623 | 79,610 | ||||||
| Balance, end of year | $ | 79,610 | $ | 168,149 | ||||
F-78
Table of Contents
Appendix A
![[NSA Letterhead]](https://capedge.com/proxy/S-1/0000950134-07-008850/h45119h4511950.gif)
January 31, 2007
Mr. E. Joseph Wright
COG Oil & Gas LP
Fasken Center, Tower II
Suite 1300
550 West Texas Avenue
Midland, Texas 79701
Dear Mr. Wright:
In accordance with your request, we have estimated the proved reserves and future revenue, as of December 31, 2006, to the COG Oil & Gas LP (Concho) interest in certain oil and gas properties located in Louisiana, New Mexico, North Dakota, and Texas. This report has been prepared using constant prices and costs, as discussed in subsequent paragraphs of this letter. The estimates of reserves and future revenue in this report conform to the guidelines of the U.S. Securities and Exchange Commission (SEC).
As presented in the accompanying summary projections, Tables I through IV, we estimate the net reserves and future net revenue to the Concho interest in these properties, as of December 31, 2006, to be:
| Net Reserves | Future Net Revenue ($) | |||||||||||||||
| Oil | Gas | Present Worth | ||||||||||||||
| Category | (Barrels) | (MCF) | Total | at 10% | ||||||||||||
| Proved Developed | ||||||||||||||||
| Producing | 7,025,581 | 28,408,884 | 304,584,100 | 169,222,500 | ||||||||||||
| Non-Producing | 577,258 | 5,311,605 | 39,230,900 | 14,646,900 | ||||||||||||
| Proved Undeveloped | 3,610,267 | 11,328,375 | 125,088,200 | 45,328,700 | ||||||||||||
| Total Proved | 11,213,106 | 45,048,864 | 468,903,200 | 229,198,100 | ||||||||||||
The oil reserves shown include crude oil and condensate. Oil volumes are expressed in barrels that are equivalent to 42 United States gallons. Gas volumes are expressed in thousands of cubic feet (MCF) at standard temperature and pressure bases.
The estimates shown in this report are for proved developed producing, proved developed non-producing, and proved undeveloped reserves. In accordance with SEC guidelines, our estimates do not include any probable or possible reserves that may exist for these properties. This report
| 4500 Thanksgiving Tower • 1601 Elm Street • Dallas, Texas75201-4754 • Ph:214-969-5401 • Fax:214-969-5411 | nsai@nsai-petro.com |
| 1221 Lamar Street, Suite 1200 • Houston, Texas77010-3072 • Ph:713-654-4950 • Fax:713-654-4951 | netherlandsewell.com |
A-1
Table of Contents
![[NSA Logo]](https://capedge.com/proxy/S-1/0000950134-07-008850/h45119h4511951.gif)
does not include any value that could be attributed to interests in undeveloped acreage beyond those tracts for which undeveloped reserves have been estimated. Reserve categorization conveys the relative degree of certainty; the estimates of reserves and future revenue included herein have not been adjusted for risk. Definitions of reserve categories are presented immediately following this letter.
Future gross revenue to the Concho interest is prior to deducting state production taxes and ad valorem taxes. Future net revenue is after deductions for these taxes, future capital costs, and operating expenses but before
consideration of federal income taxes. In accordance with SEC guidelines, the future net revenue has been discounted at an annual rate of 10 percent to determine its “present worth.” The present worth is shown to indicate the effect of time on the value of money and should not be construed as being the fair market value of the properties.
For the purposes of this report, we did not perform any field inspection of the properties, nor did we examine the mechanical operation or condition of the wells and their related facilities. We have not investigated possible environmental liability related to the properties; therefore, our estimates do not include any costs due to such possible liability. Also, our estimates do not include any salvage value for the lease and well equipment or the cost of abandoning the properties.
Oil prices used in this report are based on a December 31, 2006, West Texas Intermediate posted price of $57.75 per barrel and are adjusted by lease for quality, transportation fees, and regional price differentials. Gas prices used in this report are based on a December 31, 2006, Henry Hub spot market price of $5.635 per MMBTU and are adjusted by lease for energy content, transportation fees, and regional price differentials. All prices are held constant in accordance with SEC guidelines.
Lease and well operating costs used in this report are based on operating expense records of Concho. For nonoperated properties, these costs include the per-well overhead expenses allowed under joint operating agreements along with estimates of costs to be incurred at and below the district and field levels. As requested, lease and well operating costs for the operated properties include direct lease- and field-level costs and Concho’s estimate of the portion of its headquarters general and administrative overhead expenses necessary to operate the properties. Lease and well operating costs are held constant in accordance with SEC guidelines. Capital costs are included as required for workovers, new development wells, and production equipment.
We have made no investigation of potential gas volume and value imbalances resulting from overdelivery or underdelivery to the Concho interest. Therefore, our estimates of reserves and future revenue do not include adjustments for the settlement of any such imbalances; our projections are based on Concho receiving its net revenue interest share of estimated future gross gas production.
The reserves shown in this report are estimates only and should not be construed as exact quantities. The reserves may or may not be recovered; if they are recovered, the revenues therefrom and the costs related thereto could be more or less than the estimated amounts. Because of governmental policies and uncertainties of supply and demand, the sales rates, prices received for the reserves, and costs incurred in recovering such reserves may vary from
A-2
Table of Contents
assumptions made while preparing this report. Also, estimates of reserves may increase or decrease as a result of future operations.
In evaluating the information at our disposal concerning this report, we have excluded from our consideration all matters as to which the controlling interpretation may be legal or accounting, rather than engineering and geologic. As in all aspects of oil and gas evaluation, there are uncertainties inherent in the interpretation of engineering and geologic data; therefore, our conclusions necessarily represent only informed professional judgment.
The titles to the properties have not been examined by Netherland, Sewell & Associates, Inc., nor has the actual degree or type of interest owned been independently confirmed. The data used in our estimates were obtained from COG Oil & Gas LP, other interest owners, various operators of the properties, public data sources, and the nonconfidential files of Netherland, Sewell & Associates, Inc. and were accepted as accurate. Supporting geologic, field performance, and work data are on file in our office. We are independent petroleum engineers, geologists, geophysicists, and petrophysicists; we do not own an interest in these properties and are not employed on a contingent basis.
Very truly yours,
NETHERLAND, SEWELL & ASSOCIATES, INC.
| By: | /s/ C.H. (Scott) Rees III, P.E. |
C.H. (Scott) Rees III, P.E.
President and Chief Operating Officer
| By: | /s/ G. Lance Binder, P.E. |
G. Lance Binder, P.E.
Executive Vice President
Date Signed: January 31, 2007
GLB:KBD
A-3
Table of Contents
DEFINITIONS OF OIL AND GAS RESERVES
Adapted from Securities and Exchange Commission
Regulation S-XRule 4-10(a)
Adapted from Securities and Exchange Commission
Regulation S-XRule 4-10(a)
The following definitions of proved reserves are set forth in Securities and Exchange Commission (SEC)Regulation S-XSection 210.4-10(a). Also included (in italics) are certain subsequent interpretations set forth in the SEC’s Corporate Finance Accounting Interpretations and Guidance [SEC Interpretations]; SEC Staff Accounting Bulletins: Topic 12 [SEC Topic 12]; and the 1997 reserves definitions approved by the Society of Petroleum Engineers and World Petroleum Council [SPE/WPC Definitions].
Proved Oil and Gas Reserves. Proved oil and gas reserves are the estimated quantities of crude oil, natural gas, and natural gas liquids which geological and engineering data demonstrate with reasonable certainty to be recoverable in future years from known reservoirs under existing economic and operating conditions, i.e., prices and costs as of the date the estimate is made. Prices include consideration of changes in existing prices provided only by contractual arrangements, but not on escalations based upon future conditions.
The determination of reasonable certainty is generated by supporting geological and engineering data. There must be data available which indicate that assumptions such as decline rates, recovery factors, reservoir limits, recovery mechanisms and volumetric estimates, gas-oil ratios or liquid yield are valid. If the area in question is new to exploration and there is little supporting data for decline rates, recovery factors, reservoir drive mechanisms etc., a conservative approach is appropriate until there is enough supporting data to justify the use of more liberal parameters for the estimation of proved reserves. The concept of reasonable certainty implies that, as more technical data becomes available, a positive, or upward, revision is much more likely than a negative, or downward, revision.
Existing economic and operating conditions are the product prices, operating costs, production methods, recovery techniques, transportation and marketing arrangements, ownership and/or entitlement terms and regulatory requirements that are extant on the effective date of the estimate. An anticipated change in conditions must have reasonable certainty of occurrence; the corresponding investment and operating expense to make that change must be included in the economic feasibility at the appropriate time. These conditions include estimated net abandonment costs to be incurred and duration of current licenses and permits.
If oil and gas prices are so low that production is actually shut-in because of uneconomic conditions, the reserves attributed to the shut-in properties can no longer be classified as proved and must be subtracted from the proved reserve data base as a negative revision. Those volumes may be included as positive revisions to a subsequent year’s proved reserves only upon their return to economic status. [SEC Interpretations]
Reservoirs are considered proved if economic producibility is supported by either actual production or conclusive formation test. The area of a reservoir considered proved includes (A) that portion delineated by drilling and defined by gas-oil and/or oil-water contacts, if any; and
A-4
Table of Contents
DEFINITIONS OF OIL AND GAS RESERVES
Adapted from Securities and Exchange Commission
Regulation S-XRule 4-10(a)
Adapted from Securities and Exchange Commission
Regulation S-XRule 4-10(a)
(B) the immediately adjoining portions not yet drilled, but which can be reasonably judged as economically productive on the basis of available geological and engineering data. In the absence of information on fluid contacts, the lowest known structural occurrence of hydrocarbons controls the lower proved limit of the reservoir.
Proved reserves may be attributed to a prospective zone if a conclusive formation test has been performed or if there is production from the zone at economic rates. It is clear to the SEC staff that wireline recovery of small volumes (e.g. 100 cc) or production of a few hundred barrels per day in remote locations is not necessarily conclusive. Analyses of open-hole well logs which imply that an interval is productive are not sufficient for attribution of proved reserves. If there is an indication of economic producibility by either formation test or production, the reserves in the legal and technically justified drainage area around the well projected down to a known fluid contact or the lowest known hydrocarbons, or LKH may be considered to be proved.
In order to attribute proved reserves to legal locations adjacent to such a well (i.e. offsets), there must be conclusive, unambiguous technical data which supports reasonable certainty of production of such volumes and sufficient legal acreage to economically justify the development without going below the shallower of the fluid contact or the LKH. In the absence of a fluid contact, no offsetting reservoir volume below the LKH from a well penetration shall be classified as proved.
Upon obtaining performance history sufficient to reasonably conclude that more reserves will be recovered than those estimated volumetrically down to LKH, positive reserve revisions should be made. [SEC Interpretations]
Economic producibility of estimated proved reserves can be supported to the satisfaction of the Office of Engineering if geological and engineering data demonstrate with reasonable certainty that those reserves can be recovered in future years under existing economic and operating conditions. The relative importance of the many pieces of geological and engineering data which should be evaluated when classifying reserves cannot be identified in advance. In certain instances, proved reserves may be assigned to reservoirs on the basis of a combination of electrical and other type logs and core analyses which indicate the reservoirs are analogous to similar reservoirs in the same field which are producing or have demonstrated the ability to produce on a formation test. [SEC Topic 12]
Reserves which can be produced economically through application of improved recovery techniques (such as fluid injection) are included in the “proved” classification when successful testing by a pilot project, or the operation of an installed program in the reservoir, provides support for the engineering analysis on which the project or program was based.
If an improved recovery technique which has not been verified by routine commercial use in the area is to be applied, the hydrocarbon volumes estimated to be recoverable cannot be
A-5
Table of Contents
DEFINITIONS OF OIL AND GAS RESERVES
Adapted from Securities and Exchange Commission
Regulation S-XRule 4-10(a)
Adapted from Securities and Exchange Commission
Regulation S-XRule 4-10(a)
classified as proved reserves unless the technique has been demonstrated to be technically and economically successful by a pilot project or installed program in that specific rock volume. Such demonstration should validate the feasibility study leading to the project. [SEC Interpretations]
Estimates of proved reserves do not include the following:
| (A) | oil that may become available from known reservoirs but is classified separately as “indicated additional reserves”; |
| (B) | crude oil, natural gas, and natural gas liquids, the recovery of which is subject to reasonable doubt because of uncertainty as to geology, reservoir characteristics, or economic factors; | |
| (C) | crude oil, natural gas, and natural gas liquids, that may occur in undrilled prospects; and |
| (D) | crude oil, natural gas, and natural gas liquids, that may be recovered from oil shales, coal, gilsonite and other such sources. |
Geologic and reservoir characteristic uncertainties such as those relating to permeability, reservoir continuity, sealing nature of faults, structure and other unknown characteristics may prevent reserves from being classified as proved. Economic uncertainties such as the lack of a market (e.g. stranded hydrocarbons), uneconomic prices and marginal reserves that do not show a positive cash flow can also prevent reserves from being classified as proved. Hydrocarbons “manufactured” through extensive treatment of gilsonite, coal and oil shales are mining activities reportable under Industry Guide 7. They cannot be called proved oil and gas reserves. However, coal bed methane gas can be classified as proved reserves if the recovery of such is shown to be economically feasible.
In developing frontier areas, the existence of wells with a formation test or limited production may not be enough to classify those estimated hydrocarbon volumes as proved reserves. Issuers must demonstrate that there is reasonable certainty that a market exists for the hydrocarbons and that an economic method of extracting, treating and transporting them to market exists or is feasible and is likely to exist in the near future. A commitment by the company to develop the necessary production, treatment and transportation infrastructure is essential to the attribution of proved undeveloped reserves. Significant lack of progress on the development of such reserves may be evidence of a lack of such commitment. Affirmation of this commitment may take the form of signed sales contracts for the products; request for proposals to build facilities; signed acceptance of bid proposals; memos of understanding between the appropriate organizations and governments; firm plans and timetables established; approved authorization for expenditures to build facilities; approved loan documents to finance the required infrastructure; initiation of construction of facilities; approved environmental permits etc. Reasonable certainty of procurement of project
A-6
Table of Contents
DEFINITIONS OF OIL AND GAS RESERVES
Adapted from Securities and Exchange Commission
Regulation S-XRule 4-10(a)
Adapted from Securities and Exchange Commission
Regulation S-XRule 4-10(a)
financing by the company is a requirement for the attribution of proved reserves. An inordinately long delay in the schedule of development may introduce doubt sufficient to preclude the attribution of proved reserves.
The history of issuance and continued recognition of permits, concessions and commercially agreements by regulatory bodies and governments should be considered when determining whether hydrocarbon accumulations can be classified as proved reserves. Automatic renewal of such agreements cannot be expected if the regulatory body has the authority to end the agreement unless there is a long and clear track record which supports the conclusion that such approvals and renewal are a matter of course. [SEC Interpretations]
Companies should report reserves of natural gas liquids which are net to their leasehold interests, i.e., that portion recovered in a processing plant and allocated to the leasehold interest. It may be appropriate in the case of natural gas liquids not clearly attributable to leasehold interests ownership to follow instructions to Item 3 of Securities Act Industry Guide 2 and report such reserves separately and describe the nature of the ownership. [SEC Topic 12]
Proved Developed Oil and Gas Reserves. Proved developed oil and gas reserves are reserves that can be expected to be recovered through existing wells with existing equipment and operating methods. Additional oil and gas expected to be obtained through the application of fluid injection or other improved recovery techniques for supplementing the natural forces and mechanisms of primary recovery should be included as “proved developed reserves” only after testing by a pilot project or after the operation of an installed program has confirmed through production response that increased recovery will be achieved.
Currently producing wells and wells awaiting minor sales connection expenditure, recompletion, additional perforations or bore hole stimulation treatment would be examples of properties with proved developed reserves since the majority of the expenditures to develop the reserves has already been spent.
Proved developed reserves from improved recovery techniques can be assigned after either the operation of an installed pilot program shows a positive production response to the technique or the project is fully installed and operational and has shown the production response anticipated by earlier feasibility studies. In the case with a pilot, proved developed reserves can be assigned only to that volume attributable to the pilot’s influence. In the case of the fully installed project, response must be seen from the full project before all the proved developed reserves estimated can be assigned. If a project is not following original forecasts, proved developed reserves can only be assigned to the extent actually supported by the current performance. An important point here is that attribution of incremental proved developed reserves from the application of improved recovery techniques requires the installation of facilities and a production increase. [SEC Interpretations]
A-7
Table of Contents
DEFINITIONS OF OIL AND GAS RESERVES
Adapted from Securities and Exchange Commission
Regulation S-XRule 4-10(a)
Adapted from Securities and Exchange Commission
Regulation S-XRule 4-10(a)
Proved Developed Producing Reserves. Reserves subcategorized as producing are expected to be recovered from completion intervals that are open and producing at the time of the estimate. Improved recovery reserves are considered producing only after the improved recovery project is in operation.
Proved Developed Non-Producing Reserves. Reserves subcategorized as non-producing includeshut-in and behind-pipe reserves.Shut-in reserves are expected to be recovered from (1) completion intervals which are open at the time of the estimate but which have not started producing, (2) wells which were shut-in for market conditions or pipeline connections, or (3) wells not capable of production for mechanical reasons. Behind-pipe reserves are expected to be recovered from zones in existing wells, which will require additional completion work or future recompletion prior to the start of production. [SPE/WPC Definitions]
Proved Undeveloped Reserves. Proved undeveloped oil and gas reserves are reserves that are expected to be recovered from new wells on undrilled acreage, or from existing wells where a relatively major expenditure is required for recompletion. Reserves on undrilled acreage shall be limited to those drilling units offsetting productive units that are reasonably certain of production when drilled. Proved reserves for other undrilled units can be claimed only where it can be demonstrated with certainty that there is continuity of production from the existing productive formation. Under no circumstances should estimates for proved undeveloped reserves be attributable to any acreage for which an application of fluid injection or other improved recovery technique is contemplated, unless such techniques have been proved effective by actual tests in the area and in the same reservoir.
The SEC staff points out that this definition contains no mitigating modifier for the word certainty. Also, continuity of production requires more than the technical indication of favorable structure alone (e.g. seismic data) to meet the test for proved undeveloped reserves. Generally, proved undeveloped reserves can be claimed only for legal and technically justified drainage areas offsetting an existing productive well (but structurally no lower than LKH). If there are at least two wells in the same reservoir which are separated by more than one legal location and which show communication (reservoir continuity), proved undeveloped reserves could be claimed between the two wells, even though the location in question might be more than an offset well location away from any of the wells. In this illustration, seismic data could be used to help support this claim by showing reservoir continuity between the wells, but the required data would be the conclusive evidence of communication from production or pressure tests. The SEC staff emphasizes that proved reserves cannot be claimed more than one offset location away from a productive well if there are no other wells in the reservoir, even though seismic data may exist. The use of high-quality, well calibrated seismic data can improve reservoir description for performing volumetrics (e.g. fluid contacts). However, seismic data is not an indicator of continuity of production and, therefore, can not be the sole indicator of additional proved reserves
A-8
Table of Contents
DEFINITIONS OF OIL AND GAS RESERVES
Adapted from Securities and Exchange Commission
Regulation S-XRule 4-10(a)
Adapted from Securities and Exchange Commission
Regulation S-XRule 4-10(a)
beyond the legal and technically justified drainage areas of wells that were drilled. Continuity of production would have to be demonstrated by something other than seismic data.
In a new reservoir with only a few wells, reservoir simulation or application of generalized hydrocarbon recovery correlations would not be considered a reliable method to show increased proved undeveloped reserves. With only a few wells as data points from which to build a geologic model and little performance history to validate the results with an acceptable history match, the results of a simulation or material balance model would be speculative in nature. The results of such a simulation or material balance model would not be considered to be reasonably certain to occur in the field to the extent that additional proved undeveloped reserves could be recognized. The application of recovery correlations which are not specific to the field under consideration is not reliable enough to be the sole source for proved reserve calculations.
Reserves cannot be classified as proved undeveloped reserves based on improved recovery techniques until such time that they have been proved effective in that reservoir or an analogous reservoir in the same geologic formation in the immediate area. An analogous reservoir is one having at least the same values or better for porosity, permeability, permeability distribution, thickness, continuity and hydrocarbon saturations,
| (g) | Topic 12 of Accounting Series Release No. 257 of the Staff Accounting Bulletins states: In certain instances, proved reserves may be assigned to reservoirs on the basis of a combination of electrical and other type logs and core analyses which indicate the reservoirs are analogous to similar reservoirs in the same field which are producing or have demonstrated the ability to produce on a formation test. |
If the combination of data from open-hole logs and core analyses is overwhelmingly in support of economic producibility and the indicated reservoir properties are analogous to similar reservoirs in the same field that have produced or demonstrated the ability to produce on a conclusive formation test, the reserves may be classified as proved. This would probably be a rare event especially in an exploratory situation. The essence of the SEC definition is that in most cases there must at least be a conclusive formation test in a new reservoir before any reserves can be considered to be proved. [SEC Interpretations]
A-9
Table of Contents
Summary projection of reserves and revenue
As of
12-31-6
As of
12-31-6
| Cog Oil & Gas LP Interest | Summary — All Properties | Louisiana, New Mexico, | North Dakota, and Texas |
Total Proved Reserves
| Gross Revenue | ||||||||||||||||||||||||||||||||||||||||||||||||
| Gross | Net | Gross | Net | Incl Prod+Adval Taxes | Prod+Av | Net Cap | Operating | Net | Cum P.W. | |||||||||||||||||||||||||||||||||||||||
| Period | Oil/cond | Oil/cond | Gas | Gas | Oil | Gas | Total | Taxes | Cost | Expense | Revenue | 10.000% | ||||||||||||||||||||||||||||||||||||
| Ending | MBBL | MBBL | MMCF | MMCF | M$ | M$ | M$ | M$ | M$ | M$ | M$ | M$ | ||||||||||||||||||||||||||||||||||||
12-31- 7 | 3199.669 | 823.536 | 24450.690 | 4005.191 | 46680.9 | 19275.9 | 65956.8 | 6064.6 | 23522.6 | 8878.0 | 27491.6 | 25765.6 | ||||||||||||||||||||||||||||||||||||
12-31- 8 | 3212.573 | 824.063 | 23094.982 | 3952.675 | 46744.2 | 18993.7 | 65737.9 | 6041.2 | 35131.1 | 9215.5 | 15350.1 | 38927.7 | ||||||||||||||||||||||||||||||||||||
12-31- 9 | 3282.296 | 891.661 | 22269.744 | 3839.593 | 50466.4 | 18488.8 | 68955.2 | 6322.4 | 11428.3 | 9576.7 | 41627.8 | 71695.4 | ||||||||||||||||||||||||||||||||||||
| 12-31-10 | 2968.204 | 803.848 | 19825.327 | 3295.627 | 45342.7 | 15823.0 | 61165.7 | 5562.6 | 2018.8 | 9668.6 | 43915.7 | 103203.3 | ||||||||||||||||||||||||||||||||||||
| 12-31-11 | 2676.701 | 695.398 | 16985.892 | 2783.567 | 39210.3 | 13363.4 | 52573.7 | 4774.2 | 622.4 | 9611.8 | 37565.3 | 127704.6 | ||||||||||||||||||||||||||||||||||||
| 12-31-12 | 2483.810 | 626.504 | 14881.742 | 2420.963 | 35372.7 | 11692.7 | 47065.4 | 4276.9 | 1653.2 | 9507.5 | 31627.8 | 146438.8 | ||||||||||||||||||||||||||||||||||||
| 12-31-13 | 2312.396 | 573.578 | 13148.341 | 2116.431 | 32410.9 | 10277.8 | 42688.7 | 3878.9 | 310.3 | 9352.5 | 29147.0 | 162152.1 | ||||||||||||||||||||||||||||||||||||
| 12-31-14 | 2112.708 | 516.919 | 11622.560 | 1858.132 | 29184.4 | 9008.5 | 38192.9 | 3459.5 | 385.3 | 9004.0 | 25344.1 | 174567.8 | ||||||||||||||||||||||||||||||||||||
| 12-31-15 | 1942.136 | 470.228 | 10387.162 | 1661.131 | 26525.7 | 8046.2 | 34571.9 | 3127.2 | 349.7 | 8670.2 | 22424.8 | 184556.7 | ||||||||||||||||||||||||||||||||||||
| 12-31-16 | 1817.021 | 434.486 | 9504.547 | 1544.437 | 24494.4 | 7470.0 | 31964.4 | 2892.1 | 457.4 | 8580.5 | 20034.4 | 192666.4 | ||||||||||||||||||||||||||||||||||||
| 12-31-17 | 1731.750 | 404.446 | 8727.324 | 1430.286 | 22787.0 | 6918.6 | 29705.6 | 2685.2 | 386.8 | 8503.0 | 18130.6 | 199339.8 | ||||||||||||||||||||||||||||||||||||
| 12-31-18 | 1661.803 | 378.513 | 8353.596 | 1414.999 | 21306.6 | 6858.6 | 28165.2 | 2547.4 | 349.9 | 8302.9 | 16965.0 | 205016.1 | ||||||||||||||||||||||||||||||||||||
| 12-31-19 | 1575.032 | 351.499 | 7510.065 | 1247.434 | 19752.6 | 6043.8 | 25796.4 | 2317.8 | 299.7 | 8022.3 | 15156.6 | 209626.1 | ||||||||||||||||||||||||||||||||||||
| 12-31-20 | 1478.254 | 325.439 | 6800.844 | 1124.854 | 18279.7 | 5453.8 | 23733.5 | 2128.1 | 188.3 | 7881.7 | 13535.4 | 213369.8 | ||||||||||||||||||||||||||||||||||||
| 12-31-21 | 1288.768 | 297.743 | 6043.443 | 1019.599 | 16709.3 | 4936.0 | 21645.3 | 1940.8 | 77.7 | 7515.9 | 12110.9 | 216415.5 | ||||||||||||||||||||||||||||||||||||
| SUBTOTAL | 33743.121 | 8417.861 | 203606.259 | 33714.919 | 475267.8 | 162650.8 | 637918.6 | 58018.9 | 77181.5 | 132291.1 | 370427.1 | 216415.5 | ||||||||||||||||||||||||||||||||||||
| REMAING | 8799.659 | 2795.245 | 62534.918 | 11333.945 | 157538.4 | 54598.1 | 212136.5 | 19011.3 | 887.7 | 93761.4 | 98476.1 | 229198.1 | ||||||||||||||||||||||||||||||||||||
| TOTAL OF 65.0 YRS | 42542.780 | 11213.106 | 266141.177 | 45048.864 | 632806.2 | 217248.9 | 850055.1 | 77030.2 | 78069.2 | 226052.5 | 468903.2 | 229198.1 | ||||||||||||||||||||||||||||||||||||
| CUM PROD | 96643.548 | 1244209.325 | ||||||||||||||||||||||||||||||||||||||||||||||
| ULTIMATE | 139186.328 | 1510350.502 | ||||||||||||||||||||||||||||||||||||||||||||||
BASED ON CONSTANT PRICES AND COSTS
PRESENT WORTH PROFILE
| FOR | 8.00 | PCT, | PRESENT WORTH | M$ | 256230.5 | |||||||||||||||
| FOR | 12.00 | PCT, | PRESENT WORTH | M$ | 207055.9 | |||||||||||||||
| FOR | 15.00 | PCT, | PRESENT WORTH | M$ | 180500.2 | |||||||||||||||
| FOR | 20.00 | PCT, | PRESENT WORTH | M$ | 148144.4 | |||||||||||||||
| FOR | 25.00 | PCT, | PRESENT WORTH | M$ | 125216.3 |
Table I
All estimates and exhibits herein are part of this NSAI report and are subject to its parameters and conditions.
A-10
Table of Contents
Summary projection of reserves and revenue
As of
12-31-6
As of
12-31-6
| Cog Oil & Gas LP Interest | Summary — All Properties | Louisiana, New Mexico, | North Dakota, and Texas |
Proved Developed Producing Reserves
| Gross Revenue | ||||||||||||||||||||||||||||||||||||||||||||||||
| Gross | Net | Gross | Net | Incl Prod+Adval Taxes | Prod+Av | Net Cap | Operating | Net | Cum P.W. | |||||||||||||||||||||||||||||||||||||||
| Period | Oil/cond | Oil/cond | Gas | Gas | Oil | Gas | Total | Taxes | Cost | Expense | Revenue | 10.000% | ||||||||||||||||||||||||||||||||||||
| Ending | MBBL | MBBL | MMCF | MMCF | M$ | M$ | M$ | M$ | M$ | M$ | M$ | M$ | ||||||||||||||||||||||||||||||||||||
12-31- 7 | 2762.958 | 670.536 | 21341.080 | 3203.759 | 37977.3 | 15413.2 | 53390.5 | 4893.8 | 0.0 | 8475.2 | 40021.5 | 38278.1 | ||||||||||||||||||||||||||||||||||||
12-31- 8 | 2342.335 | 549.859 | 17133.873 | 2480.192 | 31124.8 | 11968.8 | 43093.6 | 3937.4 | 0.0 | 8354.8 | 30801.4 | 65031.8 | ||||||||||||||||||||||||||||||||||||
12-31- 9 | 2082.950 | 480.240 | 14693.301 | 2104.968 | 27180.6 | 10175.3 | 37355.9 | 3405.7 | 0.0 | 8174.5 | 25775.7 | 85376.8 | ||||||||||||||||||||||||||||||||||||
| 12-31-10 | 1884.684 | 430.692 | 12967.634 | 1858.733 | 24373.9 | 8994.7 | 33368.6 | 3040.8 | 0.0 | 8094.2 | 22233.6 | 101328.4 | ||||||||||||||||||||||||||||||||||||
| 12-31-11 | 1694.589 | 388.017 | 11599.098 | 1664.089 | 21950.1 | 8057.6 | 30007.7 | 2739.2 | 0.0 | 8021.9 | 19246.6 | 113881.3 | ||||||||||||||||||||||||||||||||||||
| 12-31-12 | 1559.214 | 356.997 | 10457.550 | 1502.883 | 20190.2 | 7277.4 | 27467.6 | 2504.7 | 0.0 | 7873.5 | 17089.4 | 124014.7 | ||||||||||||||||||||||||||||||||||||
| 12-31-13 | 1435.576 | 330.782 | 9480.021 | 1354.603 | 18702.0 | 6565.6 | 25267.6 | 2299.4 | 0.0 | 7709.3 | 15258.9 | 132238.6 | ||||||||||||||||||||||||||||||||||||
| 12-31-14 | 1316.163 | 305.889 | 8567.040 | 1222.115 | 17286.6 | 5926.3 | 23212.9 | 2111.2 | 0.0 | 7379.3 | 13722.4 | 138961.5 | ||||||||||||||||||||||||||||||||||||
| 12-31-15 | 1208.778 | 283.731 | 7732.036 | 1101.372 | 16026.8 | 5341.7 | 21368.5 | 1942.2 | 0.0 | 7037.4 | 12388.9 | 144480.1 | ||||||||||||||||||||||||||||||||||||
| 12-31-16 | 1123.511 | 266.177 | 7096.232 | 1012.323 | 15031.4 | 4911.9 | 19943.3 | 1811.1 | 0.0 | 6930.2 | 11202.0 | 149015.4 | ||||||||||||||||||||||||||||||||||||
| 12-31-17 | 1045.095 | 250.172 | 6519.186 | 933.088 | 14124.8 | 4529.4 | 18654.2 | 1692.1 | 0.0 | 6847.4 | 10114.7 | 152738.6 | ||||||||||||||||||||||||||||||||||||
| 12-31-18 | 971.997 | 233.709 | 5969.685 | 853.534 | 13194.5 | 4154.6 | 17349.1 | 1572.0 | 0.0 | 6662.4 | 9114.7 | 155789.0 | ||||||||||||||||||||||||||||||||||||
| 12-31-19 | 900.907 | 217.416 | 5486.989 | 782.153 | 12273.8 | 3813.1 | 16086.9 | 1452.2 | 0.0 | 6424.9 | 8209.8 | 158286.5 | ||||||||||||||||||||||||||||||||||||
| 12-31-20 | 838.336 | 203.943 | 5028.201 | 721.817 | 11514.4 | 3527.2 | 15041.6 | 1356.9 | 0.0 | 6321.2 | 7363.5 | 160323.2 | ||||||||||||||||||||||||||||||||||||
| 12-31-21 | 704.656 | 187.389 | 4484.484 | 665.744 | 10569.5 | 3251.4 | 13820.9 | 1247.1 | 0.0 | 5974.4 | 6599.4 | 161982.4 | ||||||||||||||||||||||||||||||||||||
| SUBTOTAL | 21871.749 | 5155.549 | 148556.410 | 21461.373 | 291520.7 | 103908.2 | 395428.9 | 36005.8 | 0.0 | 110280.6 | 249142.5 | 161982.4 | ||||||||||||||||||||||||||||||||||||
| REMAING | 4860.515 | 1870.032 | 43555.071 | 6947.511 | 105960.0 | 34444.3 | 140404.3 | 12556.5 | 0.0 | 72406.2 | 55441.6 | 169222.5 | ||||||||||||||||||||||||||||||||||||
| TOTAL OF 50.0 YRS | 26732.264 | 7025.581 | 192111.481 | 28408.884 | 397480.7 | 138352.5 | 535833.2 | 48562.3 | 0.0 | 182686.8 | 304584.1 | 169222.5 | ||||||||||||||||||||||||||||||||||||
| CUM PROD | 96643.225 | 1243502.217 | ||||||||||||||||||||||||||||||||||||||||||||||
| ULTIMATE | 123375.489 | 1435613.698 | ||||||||||||||||||||||||||||||||||||||||||||||
BASED ON CONSTANT PRICES AND COSTS
PRESENT WORTH PROFILE
| FOR | 8.00 | PCT, | PRESENT WORTH | M$ | 184710.2 | |||||||||||||||
| FOR | 12.00 | PCT, | PRESENT WORTH | M$ | 156474.9 | |||||||||||||||
| FOR | 15.00 | PCT, | PRESENT WORTH | M$ | 141071.9 | |||||||||||||||
| FOR | 20.00 | PCT, | PRESENT WORTH | M$ | 122050.8 | |||||||||||||||
| FOR | 25.00 | PCT, | PRESENT WORTH | M$ | 108305.0 |
Table II
All estimates and exhibits herein are part of this NSAI report and are subject to its parameters and conditions.
A-11
Table of Contents
Summary projection of reserves and revenue
As of
12-31-6
As of
12-31-6
| Cog Oil & Gas LP Interest | Summary — All Properties | Louisiana, New Mexico, | North Dakota, and Texas |
Proved Developed Non-producing Reserves
| Gross Revenue | ||||||||||||||||||||||||||||||||||||||||||||||||
| Gross | Net | Gross | Net | Incl Prod+Adval Taxes | Prod+Av | Net Cap | Operating | Net | Cum P.W. | |||||||||||||||||||||||||||||||||||||||
| Period | Oil/cond | Oil/cond | Gas | Gas | Oil | Gas | Total | Taxes | Cost | Expense | Revenue | 10.000% | ||||||||||||||||||||||||||||||||||||
| Ending | MBBL | MBBL | MMCF | MMCF | M$ | M$ | M$ | M$ | M$ | M$ | M$ | M$ | ||||||||||||||||||||||||||||||||||||
12-31- 7 | 99.185 | 37.564 | 1854.805 | 455.414 | 2108.0 | 2160.6 | 4268.6 | 401.2 | 3406.3 | 129.9 | 331.2 | 185.7 | ||||||||||||||||||||||||||||||||||||
12-31- 8 | 106.263 | 35.476 | 1752.726 | 424.279 | 2008.3 | 2032.4 | 4040.7 | 379.8 | 842.2 | 174.2 | 2644.5 | 2484.3 | ||||||||||||||||||||||||||||||||||||
12-31- 9 | 98.650 | 34.416 | 1349.869 | 335.515 | 1961.4 | 1621.6 | 3583.0 | 342.5 | 34.8 | 212.5 | 2993.2 | 4849.4 | ||||||||||||||||||||||||||||||||||||
| 12-31-10 | 73.116 | 25.770 | 961.269 | 243.176 | 1462.1 | 1173.8 | 2635.9 | 249.0 | 0.0 | 212.4 | 2174.5 | 6411.5 | ||||||||||||||||||||||||||||||||||||
| 12-31-11 | 62.574 | 21.942 | 746.019 | 194.949 | 1243.8 | 939.3 | 2183.1 | 205.4 | 90.0 | 216.3 | 1671.4 | 7501.0 | ||||||||||||||||||||||||||||||||||||
| 12-31-12 | 72.013 | 24.883 | 646.164 | 170.997 | 1424.6 | 829.9 | 2254.5 | 207.6 | 39.5 | 231.4 | 1776.0 | 8550.6 | ||||||||||||||||||||||||||||||||||||
| 12-31-13 | 68.130 | 24.256 | 535.695 | 145.893 | 1393.5 | 714.2 | 2107.7 | 191.3 | 0.0 | 230.5 | 1685.9 | 9459.8 | ||||||||||||||||||||||||||||||||||||
| 12-31-14 | 58.326 | 21.491 | 462.845 | 128.693 | 1232.2 | 626.9 | 1859.1 | 168.2 | 75.0 | 224.7 | 1391.2 | 10139.9 | ||||||||||||||||||||||||||||||||||||
| 12-31-15 | 49.890 | 18.785 | 411.633 | 116.478 | 1074.9 | 564.0 | 1638.9 | 148.6 | 50.0 | 226.4 | 1213.9 | 10681.3 | ||||||||||||||||||||||||||||||||||||
| 12-31-16 | 47.714 | 17.624 | 482.087 | 141.279 | 1007.7 | 672.3 | 1680.0 | 155.1 | 143.3 | 238.7 | 1142.9 | 11142.7 | ||||||||||||||||||||||||||||||||||||
| 12-31-17 | 46.586 | 16.808 | 507.471 | 148.457 | 960.8 | 707.7 | 1668.5 | 156.2 | 72.7 | 245.4 | 1194.2 | 11582.6 | ||||||||||||||||||||||||||||||||||||
| 12-31-18 | 51.964 | 18.973 | 829.471 | 246.915 | 1075.4 | 1192.9 | 2268.3 | 216.8 | 50.2 | 250.9 | 1750.4 | 12167.8 | ||||||||||||||||||||||||||||||||||||
| 12-31-19 | 59.107 | 21.976 | 605.882 | 181.651 | 1228.8 | 875.1 | 2103.9 | 193.9 | 0.0 | 252.9 | 1657.1 | 12672.3 | ||||||||||||||||||||||||||||||||||||
| 12-31-20 | 50.202 | 18.880 | 483.510 | 146.235 | 1054.4 | 702.5 | 1756.9 | 161.0 | 0.0 | 243.7 | 1352.2 | 13046.9 | ||||||||||||||||||||||||||||||||||||
| 12-31-21 | 45.772 | 16.794 | 416.188 | 125.140 | 938.7 | 598.6 | 1537.3 | 140.8 | 25.0 | 241.4 | 1130.1 | 13330.8 | ||||||||||||||||||||||||||||||||||||
| SUBTOTAL | 989.492 | 355.638 | 12045.634 | 3205.071 | 20174.6 | 15411.8 | 35586.4 | 3317.4 | 4829.0 | 3331.3 | 24108.7 | 13330.8 | ||||||||||||||||||||||||||||||||||||
| REMAING | 453.475 | 221.620 | 9427.261 | 2106.534 | 12537.5 | 9955.8 | 22493.3 | 2084.7 | 887.7 | 4398.7 | 15122.2 | 14646.9 | ||||||||||||||||||||||||||||||||||||
| TOTAL OF 65.0 YRS | 1442.967 | 577.258 | 21472.895 | 5311.605 | 32712.1 | 25367.6 | 58079.7 | 5402.1 | 5716.7 | 7730.0 | 39230.9 | 14646.9 | ||||||||||||||||||||||||||||||||||||
| CUM PROD | 0.323 | 707.108 | ||||||||||||||||||||||||||||||||||||||||||||||
| ULTIMATE | 1443.290 | 22180.003 | ||||||||||||||||||||||||||||||||||||||||||||||
BASED ON CONSTANT PRICES AND COSTS
PRESENT WORTH PROFILE
| FOR | 8.00 | PCT, | PRESENT WORTH | M$ | 16750.1 | |||||||||||||||
| FOR | 12.00 | PCT, | PRESENT WORTH | M$ | 12998.0 | |||||||||||||||
| FOR | 15.00 | PCT, | PRESENT WORTH | M$ | 11095.3 | |||||||||||||||
| FOR | 20.00 | PCT, | PRESENT WORTH | M$ | 8866.2 | |||||||||||||||
| FOR | 25.00 | PCT, | PRESENT WORTH | M$ | 7331.3 |
Table III
All estimates and exhibits herein are part of this NSAI report and are subject to its parameters and conditions.
A-12
Table of Contents
Summary projection of reserves and revenue
As of
12-31-6
As of
12-31-6
Cog Oil & Gas LP InterestSummary — All Properties
Louisiana, New Mexico,
North Dakota, and Texas
Louisiana, New Mexico,
North Dakota, and Texas
Proved Undeveloped Reserves
| Gross Revenue | ||||||||||||||||||||||||||||||||||||||||||||||||
| Gross | Net | Gross | Net | Incl Prod+Adval Taxes | Prod+Av | Net Cap | Operating | Net | CUM P.W. | |||||||||||||||||||||||||||||||||||||||
| Period | Oil/cond | Oil/cond | Gas | Gas | Oil | Gas | Total | Taxes | Cost | Expense | Revenue | 10.000% | ||||||||||||||||||||||||||||||||||||
| Ending | MBBL | MBBL | MMCF | MMCF | M$ | M$ | M$ | M$ | M$ | M$ | M$ | M$ | ||||||||||||||||||||||||||||||||||||
12-31- 7 | 337.526 | 115.436 | 1254.805 | 346.018 | 6595.6 | 1702.1 | 8297.7 | 769.6 | 20116.3 | 272.9 | −12861.1 | −12698.2 | ||||||||||||||||||||||||||||||||||||
12-31- 8 | 763.975 | 238.728 | 4208.383 | 1048.204 | 13611.1 | 4992.5 | 18603.6 | 1724.0 | 34288.9 | 686.5 | −18095.8 | −28588.4 | ||||||||||||||||||||||||||||||||||||
12-31- 9 | 1100.696 | 377.005 | 6226.574 | 1399.110 | 21324.4 | 6691.9 | 28016.3 | 2574.2 | 11393.5 | 1189.7 | 12858.9 | −18530.8 | ||||||||||||||||||||||||||||||||||||
| 12-31-10 | 1010.404 | 347.386 | 5896.424 | 1193.718 | 19506.7 | 5654.5 | 25161.2 | 2272.8 | 2018.8 | 1362.0 | 19507.6 | −4536.6 | ||||||||||||||||||||||||||||||||||||
| 12-31-11 | 919.538 | 285.439 | 4640.775 | 924.529 | 16016.4 | 4366.5 | 20382.9 | 1829.6 | 532.4 | 1373.6 | 16647.3 | 6322.3 | ||||||||||||||||||||||||||||||||||||
| 12-31-12 | 852.583 | 244.624 | 3778.028 | 747.083 | 13757.9 | 3585.4 | 17343.3 | 1564.6 | 1613.7 | 1402.6 | 12762.4 | 13873.5 | ||||||||||||||||||||||||||||||||||||
| 12-31-13 | 808.690 | 218.540 | 3132.625 | 615.935 | 12315.4 | 2998.0 | 15313.4 | 1388.2 | 310.3 | 1412.7 | 12202.2 | 20453.7 | ||||||||||||||||||||||||||||||||||||
| 12-31-14 | 738.219 | 189.539 | 2592.675 | 507.324 | 10665.6 | 2455.3 | 13120.9 | 1180.1 | 310.3 | 1400.0 | 10230.5 | 25466.4 | ||||||||||||||||||||||||||||||||||||
| 12-31-15 | 683.468 | 167.712 | 2243.493 | 443.281 | 9424.0 | 2140.5 | 11564.5 | 1036.4 | 299.7 | 1406.4 | 8822.0 | 29395.3 | ||||||||||||||||||||||||||||||||||||
| 12-31-16 | 645.796 | 150.685 | 1926.228 | 390.835 | 8455.3 | 1885.8 | 10341.1 | 925.9 | 314.1 | 1411.6 | 7689.5 | 32508.3 | ||||||||||||||||||||||||||||||||||||
| 12-31-17 | 640.069 | 137.466 | 1700.667 | 348.741 | 7701.4 | 1681.5 | 9382.9 | 836.9 | 314.1 | 1410.2 | 6821.7 | 35018.6 | ||||||||||||||||||||||||||||||||||||
| 12-31-18 | 637.842 | 125.831 | 1554.440 | 314.550 | 7036.7 | 1511.1 | 8547.8 | 758.6 | 299.7 | 1389.6 | 6099.9 | 37059.3 | ||||||||||||||||||||||||||||||||||||
| 12-31-19 | 615.018 | 112.107 | 1417.194 | 283.630 | 6250.0 | 1355.6 | 7605.6 | 671.7 | 299.7 | 1344.5 | 5289.7 | 38667.3 | ||||||||||||||||||||||||||||||||||||
| 12-31-20 | 589.716 | 102.616 | 1289.133 | 256.802 | 5710.9 | 1224.1 | 6935.0 | 610.2 | 188.3 | 1316.8 | 4819.7 | 39999.7 | ||||||||||||||||||||||||||||||||||||
| 12-31-21 | 538.340 | 93.560 | 1142.771 | 228.715 | 5201.1 | 1086.0 | 6287.1 | 552.9 | 52.7 | 1300.1 | 4381.4 | 41102.3 | ||||||||||||||||||||||||||||||||||||
| SUBTOTAL | 10881.880 | 2906.674 | 43004.215 | 9048.475 | 163572.5 | 43330.8 | 206903.3 | 18695.7 | 72352.5 | 18679.2 | 97175.9 | 41102.3 | ||||||||||||||||||||||||||||||||||||
| REMAING | 3485.669 | 703.593 | 9552.586 | 2279.900 | 39040.9 | 10198.0 | 49238.9 | 4370.1 | 0.0 | 16956.5 | 27912.3 | 45328.7 | ||||||||||||||||||||||||||||||||||||
| TOTAL OF 53.7 YRS | 14367.549 | 3610.267 | 52556.801 | 11328.375 | 202613.4 | 53528.8 | 256142.2 | 23065.8 | 72352.5 | 35635.7 | 125088.2 | 45328.7 | ||||||||||||||||||||||||||||||||||||
| CUM PROD | 0.000 | 0.000 | ||||||||||||||||||||||||||||||||||||||||||||||
| ULTIMATE | 14367.549 | 52556.801 | ||||||||||||||||||||||||||||||||||||||||||||||
BASED ON C0NSTANT PRICES AND COSTS
PRESENT WORTH PROFILE
| FOR | 8.00 | PCT, | PRESENT WORTH | M$ | 54770.2 | |||||||||||||||
| FOR | 12.00 | PCT, | PRESENT WORTH | M$ | 37583.0 | |||||||||||||||
| FOR | 15.00 | PCT, | PRESENT WORTH | M$ | 28333.0 | |||||||||||||||
| FOR | 20.00 | PCT, | PRESENT WORTH | M$ | 17227.4 | |||||||||||||||
| FOR | 25.00 | PCT, | PRESENT WORTH | M$ | 9580.0 |
Table IV
All estimates and exhibits herein are part of this NSAI report and are subject to its parameters and conditions.
A-13
Table of Contents
Annex B
January 25, 2007
Mr. E. Joseph Wright
Vice President
Operations & Engineering
COG Operating, LLC
550 West Texas Avenue, Suite 1300
Midland, Texas 79701
Vice President
Operations & Engineering
COG Operating, LLC
550 West Texas Avenue, Suite 1300
Midland, Texas 79701
| Re: | Evaluation Summary — SEC Pricing COG Operating, LLC Interests Eddy and Lea Counties, New Mexico Proved Reserves As of December 31, 2006 |
Dear Mr. Wright:
As requested, we are submitting our estimates of proved reserves and our forecasts of the resulting economics attributable to the above captioned interests.
Composite reserve estimates and economic forecasts are presented in the attached tables and are summarized below:
| Proved | Proved | |||||||||||||||||||
| Developed | Developed | Proved | ||||||||||||||||||
| Proved | Producing | Non-Producing | Undeveloped | |||||||||||||||||
| Net Reserves | ||||||||||||||||||||
| Oil/Condensate | - Mbbl | 33,109 | 14,006 | 1,834 | 17,269 | |||||||||||||||
| Gas | - MMcf | 155,770 | 73,135 | 5,568 | 77,067 | |||||||||||||||
| Revenue | ||||||||||||||||||||
| Oil/Condensate | - M$ | 1,844,603 | 782,051 | 102,820 | 959,732 | |||||||||||||||
| Gas | - M$ | 865,667 | 414,331 | 30,355 | 420,981 | |||||||||||||||
| Severance and Ad Valorem Taxes | - M$ | 274,752 | 121,818 | 13,322 | 139,612 | |||||||||||||||
| Operating Expenses | - M$ | 417,513 | 261,077 | 13,530 | 142,906 | |||||||||||||||
| Investments | - M$ | 431,690 | 0.0 | 19,407 | 412,283 | |||||||||||||||
| Operating Income (BFIT) | - M$ | 1,586,316 | 813,487 | 86,916 | 685,913 | |||||||||||||||
| Discounted @ 10% | - M$ | 720,299 | 445,258 | 37,406 | 237,634 | |||||||||||||||
In accordance with the Securities and Exchange Commission guidelines, the operating income (BFIT) has been discounted at an annual rate of 10% to determine its “present worth”. The discounted value, “present worth”, shown above should not be construed to represent an estimate of the fair market value by Cawley, Gillespie & Associates, Inc.
The detailed forecasts of reserves and economics are presented in the attached tables. The report is divided into sections by reserves category. The Tables I-Proved, I-PDP, I-PDNP and I-PUD are composite summaries of the reserves and associated economics by reserve category. These summary tables are followed by corresponding Table II’s which present the ultimate recovery, gross and net reserves, ownership, revenue, expenses, investments, net income and discounted
B-1
Table of Contents
Mr. E. Joseph Wright
COG Operating, LLC
January 25, 2007
Page 2
COG Operating, LLC
January 25, 2007
Page 2
cash flows for the individual properties in each Table I. These tables are sorted by reservoir, field and property name. Page 1 of the Appendix explains the type of data in these tables.
The year-end Henry Hub spot market gas price of $5.635 per MMBtu and the year-end Plains WTI posted oil price of $57.75 per barrel were used. In accordance with the Securities and Exchange Commission guidelines, the oil and gas prices were held constant. Prices were adjusted for gravity, heating value, quality, transportation and marketing.
Operating costs were based on operating expense records of Concho Resources. For non-operated properties, these costs include the overhead expenses allowed under existing joint operating agreements. For operated properties, these costs include Concho’s portion of its headquarters general and administrative expenses necessary to operate the properties. Drilling and completion costs were based on estimates provided by Concho Resources and reviewed by Cawley, Gillespie & Associates. As per the Securities and Exchange Commission guidelines, neither expenses nor investments were escalated. The cost of plugging and the salvage value of equipment have not been considered.
The proved reserve classifications conform to criteria of the Securities and Exchange Commission. The reserves and economics are predicated on the regulatory agency classifications, rules, policies, laws, taxes and royalties in effect on the effective date except as noted herein. The possible effects of changes in legislation or other Federal or State restrictive actions have not been considered. All reserve estimates represent our best judgment based on data available at the time of preparation and assumptions as to future economic and regulatory conditions. It should be realized that the reserves actually recovered, the revenue derived therefrom and the actual cost incurred could be more or less than the estimated amounts.
The reserve estimates were based on interpretations of factual data furnished by Concho Resources. Ownership interests were supplied by Concho Resources and were accepted as furnished. To some extent, information from public records has been used to check and/or supplement these data. The basic engineering and geological data were utilized subject to third party reservations and qualifications. Nothing has come to our attention, however, that would cause us to believe that we are not justified in relying on such data. Anon-site inspection of these properties has not been made nor have the wells been tested by Cawley, Gillespie & Associates, Inc.
This report was prepared for the exclusive use of Concho Resources. Third parties should not rely on it without the written consent of the above and Cawley, Gillespie & Associates, Inc. Our work-papers and related data are available for inspection and review by authorized parties.
Respectfully submitted,
/s/ CAWLEY, GILLESPIE & ASSOCIATES, INC.
CAWLEY, GILLESPIE & ASSOCIATES, INC.
B-2
Table of Contents
shares
Common stock
Joint book-running managers
| JPMorgan | Banc of America Securities LLC |
Joint lead manager
Lehman Brothers
Co-managers
| BNP PARIBAS |
| Merrill Lynch & Co. |
| UBS Investment Bank |
| Wachovia Securities |
, 2007
Until , 2007 (25 days after the date of this prospectus), all dealers that effect transactions in our common stock, whether or not participating in this offering, may be required to deliver a prospectus. This requirement is in addition to a dealer’s obligation to deliver a prospectus when acting as an underwriter and with respect to unsold allotments or subscriptions.
Table of Contents
Part II
Information not required in prospectus
Information not required in prospectus
| Item 13. | Other expenses of issuance and distribution |
The following table sets forth the costs and expenses to be paid by us in connection with the sale of the shares of common stock being registered hereby. All amounts are estimates except for the SEC registration fee, the NASD filing fee and the NYSE listing fee.
| Securities and Exchange Commission registration fee | $ | 16,425 | |
| NASD filing fee | 8,000 | ||
| NYSE listing fee | 250,000 | ||
| Accounting fees and expenses | |||
| Legal fees and expenses | |||
| Printing and engraving expenses | |||
| Transfer agent and registrar fees and expenses | |||
| Other expenses | |||
| Total | $ | ||
| Item 14. | Indemnification of directors and officers |
Section 145 of the Delaware General Corporation Law (“DGCL”) provides that a corporation may indemnify any person who was or is a party or is threatened to be made a party to any threatened, pending or completed action, suit or proceeding whether civil, criminal, administrative or investigative (other than an action by or in the right of the corporation) by reason of the fact that he is or was a director, officer, employee or agent of the corporation, or is or was serving at the request of the corporation as a director, officer, employee or agent of another corporation, partnership, joint venture, trust or other enterprise, against expenses (including attorneys’ fees), judgments, fines and amounts paid in settlement actually and reasonably incurred by him in connection with such action, suit or proceeding if he acted in good faith and in a manner he reasonably believed to be in or not opposed to the best interests of the corporation, and, with respect to any criminal action or proceeding, had no reasonable cause to believe his conduct was unlawful. Section 145 further provides that a corporation similarly may indemnify any such person serving in any such capacity who was or is a party or is threatened to be made a party to any threatened, pending or completed action or suit by or in the right of the corporation to procure a judgment in its favor by reason of the fact that he is or was a director, officer, employee or agent of the corporation or is or was serving at the request of the corporation as a director, officer, employee or agent of another corporation, partnership, joint venture, trust or other enterprise, against expenses (including attorneys’ fees) actually and reasonably incurred in connection with the defense or settlement of such action or suit if he acted in good faith and in a manner he reasonably believed to be in or not opposed to the best interests of the corporation and except that no indemnification shall be made in respect of any claim, issue or matter as to which such person shall have been adjudged to be liable to the corporation unless and only to the extent that the Delaware Court of Chancery or such other court in which such action or suit was brought shall determine upon application that, despite the adjudication of liability but in view of all of the circumstances of the case, such person is
II-1
Table of Contents
fairly and reasonably entitled to indemnity for such expenses which the Delaware Court of Chancery or such other court shall deem proper. Our certificate of incorporation and bylaws provide that indemnification shall be to the fullest extent permitted by the DGCL for all our current or former directors or officers. As permitted by the DGCL, our certificate of incorporation provides that we will indemnify our directors against liability to us or our stockholders for monetary damages for breach of fiduciary duty as a director, except (1) for any breach of the director’s duty of loyalty to us or our stockholders, (2) for acts or omissions not in good faith or which involve intentional misconduct or knowing violation of law, (3) under Section 174 of the DGCL or (4) for any transaction from which a director derived an improper personal benefit.
We have also entered into indemnification agreements with all of our directors and employment agreements with all of our executive officers (including each of our named executive officers). These indemnification agreements and employment agreements are intended to permit indemnification to the fullest extent now or hereafter permitted by the DGCL. It is possible that the applicable law could change the degree to which indemnification is expressly permitted.
The indemnification agreements and the employment agreements cover expenses (including attorneys’ fees), judgments, fines and amounts paid in settlement incurred as a result of the fact that such person, in his or her capacity as a director or officer, is made or threatened to be made a party to any suit or proceeding. The indemnification agreements and the employment agreements generally cover claims relating to the fact that the indemnified party is or was an officer, director, employee or agent of us or any of our affiliates, or is or was serving at our request in such a position for another entity. The indemnification agreements and the employment agreements also obligate us to promptly advance all reasonable expenses incurred in connection with any claim. The indemnitee is, in turn, obligated to reimburse us for all amounts so advanced if it is later determined that the indemnitee is not entitled to indemnification. The indemnification provided under the indemnification agreements and the employment agreements is not exclusive of any other indemnity rights; however, double payment to the indemnitee is prohibited.
We are not obligated to indemnify the indemnitee with respect to claims brought by the indemnitee against:
| • | us, except for: |
| • | claims regarding the indemnitee’s rights under the indemnification agreement; | |
| • | claims to enforce a right to indemnification under any statute or law; and | |
| • | counter-claims against us in a proceeding brought by us against the indemnitee; or |
| • | any other person, except for claims approved by our board of directors. |
We have obtained director and officer liability insurance for the benefit of each of the above indemnitees. These policies include coverage for losses for wrongful acts and omissions and to ensure our performance under the indemnification agreements. Each of the indemnitees are named as an insured under such policies and provided with the same rights and benefits as are accorded to the most favorably insured of our directors and officers.
II-2
Table of Contents
| Item 15. | Recent sales of unregistered securities |
Since the formation of our company on February 22, 2006, we have issued unregistered securities to a limited number of persons, as described below. None of these transactions involved any underwriters or public offerings, and we believe that each of these transactions was exempt from registration requirements pursuant to Section 4(2) of the Securities Act of 1933, Regulation D promulgated thereunder or Rule 701 of the Securities Act. The recipients of these securities represented their intention to acquire the securities for investment only and not with a view to or for sale in connection with any distribution thereof, and appropriate legends were affixed to the share certificates and instruments issued in these transactions. No remuneration or commission was paid or given directly or indirectly.
On February 24, 2006, we issued one share to our President and Chief Operating Officer, in connection with the formation of our company. This share of common stock was offered and sold pursuant to the exemption from registration afforded by Section 4(2) of the Securities Act of 1933.
On February 27, 2006, we issued 116,901,973 shares of our common stock in connection with the combination transaction. All of the shares of our common stock issued in connection with the combination transaction were offered and sold pursuant to the exemption from registration afforded by Section 4(2) of the Securities Act of 1933 and Regulation D promulgated thereunder. Pursuant to the combination transaction, certain stockholders of Concho Equity Holdings Corp. exchanged their equity interests in that company for shares of our common stock. In addition, each of Chase Oil Corporation, Caza Energy LLC and certain owners of oil and gas working interest affiliated with Chase Oil Corporation contributed their interests in certain oil and gas properties to our company in exchange for cash and our common stock. All participants in the combination transaction represented to us that they were accredited investors.
On May 18, 2006, we issued an additional 222,645 shares of our common stock in connection with the combination transaction. Pursuant to the combination transaction, certain owners of working interests affiliated with Chase Oil Corporation in certain oil and gas properties contributed their interests in certain oil and gas properties to our company in exchange for cashand/or shares of our common stock. Pursuant to the terms of the combination transaction, we were obligated to offer to purchase the working interests of such persons as soon as possible after the combination transaction. All of the persons offered and sold these shares of common stock represented to us that they were accredited investors.
On June 1, 2006, we issued 80,000 shares of our common stock to members of our board of directors under a written compensatory benefit plan. These shares of common stock were offered and sold pursuant to the exemption from registration afforded by Rule 701 under the Securities Act of 1933.
On June 28, 2006 through November 15, 2006, we issued, in the aggregate, 356,126 shares of our common stock that are subject to certain forfeiture restrictions to certain of our employees under a written compensatory benefit plan. These shares of common stock were offered and sold pursuant to the exemption from registration afforded by Rule 701 under the Securities Act of 1933.
On April 16, 2007, we merged our subsidiary, Concho Acquisition, Inc., with and into its subsidiary, Concho Equity Holdings Corp., to cause the conversion of the remaining shares of common stock and preferred stock of Concho Equity Holdings Corp. not held by Concho
II-3
Table of Contents
Acquisition into shares of our common stock. The conversion pursuant to the merger was on the same terms as the exchange of the shares of common stock and preferred stock of Concho Equity Holdings Corp. for shares of common stock of Concho Resources in the combination transaction. As a result of the merger, we issued 636,555 shares of our common stock to certain of our employees who were stockholders of Concho Equity Holdings Corp. prior to the merger.
On April 19, 2007, we issued, in the aggregate, 108,457 shares of our common stock to five persons in connection with our acquisition of their working interests in certain oil and gas properties. The working interests represented interests in certain of the oil and gas properties we acquired from Chase Oil Corporation and Caza Energy LLC in connection with the combination transaction.
II-4
Table of Contents
| Item 16. | Exhibits and financial statement schedules |
(a) The following exhibits are filed herewith:
| Number | Exhibit | |||
| 1 | .1** | Form of Underwriting Agreement | ||
| 2 | .1*† | Combination Agreement dated February 24, 2006, among Concho Resources Inc., Concho Equity Holdings Corp., Chase Oil Corporation, Caza Energy LLC and the other signatories thereto | ||
| 3 | .1** | Form of Second Amended and Restated Certificate of Incorporation of Concho Resources Inc. | ||
| 3 | .2** | Form of Amended and Restated Bylaws of Concho Resources Inc. | ||
| 4 | .1** | Specimen Common Stock Certificate | ||
| 5 | .1** | Opinion of Vinson & Elkins L.L.P. | ||
| 10 | .1** | Credit Agreement dated February 24, 2006, among Concho Resources Inc., JPMorgan Chase Bank, N.A., as administrative agent, Bank of America, N.A., as syndication agent, Wachovia Bank, National Association, and BNP Paribas, as documentation agents, and the other lenders party thereto | ||
| 10 | .2** | Second Lien Credit Agreement dated March 27, 2007, among Concho Resources Inc., Bank of America, N.A., as administrative agent, and Banc of America LLC, as sole lead arranger and sole booking manager | ||
| 10 | .3* | Transition Services Agreement dated April 23, 2007, between COG Operating LLC and Mack Energy Corporation | ||
| 10 | .4* | Form of Drilling Agreement with Silver Oak Drilling, LLC | ||
| 10 | .5* | Salt Water Disposal System Ownership and Operating Agreement dated February 24, 2006, among COG Operating LLC, Chase Oil Corporation, Caza Energy LLC and Mack Energy Corporation | ||
| 10 | .6* | Software License Agreement dated March 2, 2006, between Enertia Software Systems and Concho Resources Inc. | ||
| 10 | .7* | Leasehold Acquisition Agreement dated April 1, 2005, by and between Trey Resources, Inc. and COG Oil and Gas LP | ||
| 10 | .8* | Transfer of Operating Rights (Sublease) in a Lease for Oil and Gas for Valhalla properties | ||
| 10 | .9* | Assignment of Oil and Gas Leases from Caza Energy LLC | ||
| 10 | .10* | Escrow Agreement dated February 27, 2006, among Concho Resources Inc., Timothy A. Leach, Steven L. Beal, David W. Copeland, Curt F. Kamradt and E. Joseph Wright and other signatories thereto | ||
| 10 | .11* | Business Opportunities Agreement dated February 27, 2006, among Concho Resources Inc. and the other signatories thereto | ||
| 10 | .12* | Registration Rights Agreement dated February 27, 2006, among Concho Resources Inc. and the other signatories thereto | ||
| 10 | .13* | Concho Resources Inc. 2006 Stock Incentive Plan | ||
| 10 | .14** | Form of Incentive Stock Option Agreement | ||
| 10 | .15* | Form of Nonstatutory Stock Option Agreement | ||
| 10 | .16* | Form of Restricted Stock Agreement (for employees) | ||
II-5
Table of Contents
| Number | Exhibit | |||
| 10 | .17* | Form of Restricted Stock Agreement (for non-employee directors) | ||
| 10 | .18* | Employment Agreement dated July 14, 2006, between Concho Resources Inc. and Timothy A. Leach | ||
| 10 | .19* | Employment Agreement dated July 14, 2006, between Concho Resources Inc. and Steven L. Beal | ||
| 10 | .20* | Employment Agreement dated July 14, 2006, between Concho Resources Inc. and David W. Copeland | ||
| 10 | .21* | Employment Agreement dated July 14, 2006, between Concho Resources Inc. and Curt F. Kamradt | ||
| 10 | .22* | Employment Agreement dated July 14, 2006, between Concho Resources Inc. and David M. Thomas III | ||
| 10 | .23* | Employment Agreement dated July 14, 2006, between Concho Resources Inc. and E. Joseph Wright | ||
| 10 | .24* | Form of Indemnification Agreement between Concho Resources Inc. and each of the officers and directors thereof | ||
| 21 | .1** | Subsidiaries of Concho Resources Inc. | ||
| 23 | .1* | Consent of Grant Thornton LLP | ||
| 23 | .2* | Consent of Netherland, Sewell & Associates, Inc. | ||
| 23 | .3* | Consent of Cawley, Gillespie & Associates, Inc. | ||
| 23 | .4** | Consent of Vinson & Elkins L.L.P. | ||
| 24 | .1* | Power of Attorney | ||
| * | Filed herewith. |
| ** | To be filed by amendment. | |
| † | The Combination Agreement filed as Exhibit 2.1 omits the schedules and exhibits to the Combination Agreement. Concho Resources agrees to furnish supplementally a copy of any omitted schedule or exhibit to the Securities and Exchange Commission upon request. |
| Item 17. | Undertakings |
The undersigned registrant hereby undertakes:
(a) Insofar as indemnification for liabilities arising under the Securities Act of 1933 may be permitted to directors, officers and controlling persons of the registrant pursuant to the provisions described in Item 14, or otherwise, the registrant has been advised that in the opinion of the SEC such indemnification is against public policy as expressed in the Securities Act of 1933 and is, therefore, unenforceable. In the event that a claim for indemnification against such liabilities (other than the payment by the registrant of expenses incurred or paid by a director, officer or controlling person of the registrant in the successful defense of any action, suit or proceeding) is asserted by such director, officer or controlling person in connection with the securities being registered, the registrant will, unless in the opinion of its counsel the matter has been settled by controlling precedent, submit to a court of appropriate jurisdiction the question whether such indemnification by it is against public policy as expressed in the Securities Act of 1933 and will be governed by the final adjudication of such issue.
(b) To provide to the underwriters at the closing specified in the underwriting agreement, certificates in such denominations and registered in such names as required by the underwriters to permit prompt delivery to each purchaser.
II-6
Table of Contents
(c) For purpose of determining any liability under the Securities Act of 1933, the information omitted from the form of prospectus filed as part of this registration statement in reliance upon Rule 430A and contained in the form of prospectus filed by the registrant pursuant to Rule 424(b)(1) or (4) or 497(h) under the Securities Act of 1933 shall be deemed to be part of this registration statement as of the time it was declared effective.
(d) For the purpose of determining any liability under the Securities Act of 1933, each post-effective amendment that contains a form of prospectus shall be deemed to be a new registration statement relating to the securities offered therein, and the offering of such securities at that time shall be deemed to be the initial bona fide offering thereof.
II-7
Table of Contents
Signatures
Pursuant to the requirements of the Securities Act of 1933, the Registrant has duly caused this Registration Statement onForm S-1 to be signed on its behalf by the undersigned, thereunto duly authorized, in Midland, Texas, on this 23rd day of April, 2007.
CONCHO RESOURCES INC.
| By: | /s/ Timothy A. Leach |
Name: Timothy A. Leach
| Title: | Chairman and Chief Executive Officer |
Pursuant to the requirements of the Securities Act of 1933, this Registration Statement onForm S-1 has been signed by the following persons in the capacities and on the dates indicated.
| Signature | Title | Date | ||||
/s/ Timothy A. Leach Timothy A. Leach | Chairman, Chief Executive Officer and Director (principal executive officer) | April 23, 2007 | ||||
/s/ Steven L. Beal Steven L. Beal | President, Chief Operating Officer and Director | April 23, 2007 | ||||
/s/ Curt F. Kamradt Curt F. Kamradt | Vice President, Chief Financial Officer and Treasurer (principal financial and accounting officer) | April 23, 2007 | ||||
* Tucker S. Bridwell | Director | April 23, 2007 | ||||
* W. Howard Keenan, Jr. | Director | April 23, 2007 | ||||
* A. Wellford Tabor | Director | April 23, 2007 | ||||
| * By: | /s/ Timothy A. Leach Attorney in Fact | |||||
II-8
Table of Contents
Exhibit index
| Number | Exhibit | |||
| 1 | .1** | Form of Underwriting Agreement | ||
| 2 | .1*† | Combination Agreement dated February 24, 2006, among Concho Resources Inc., Concho Equity Holdings Corp., Chase Oil Corporation, Caza Energy LLC and the other signatories thereto | ||
| 3 | .1** | Form of Second Amended and Restated Certificate of Incorporation of Concho Resources Inc. | ||
| 3 | .2** | Form of Amended and Restated Bylaws of Concho Resources Inc. | ||
| 4 | .1** | Specimen Common Stock Certificate | ||
| 5 | .1** | Opinion of Vinson & Elkins L.L.P. | ||
| 10 | .1** | Credit Agreement dated February 24, 2006, among Concho Resources Inc., JPMorgan Chase Bank, N.A., as administrative agent, Bank of America, N.A., as syndication agent, Wachovia Bank, National Association, and BNP Paribas, as documentation agents, and the other lenders party thereto | ||
| 10 | .2** | Second Lien Credit Agreement dated March 27, 2007, among Concho Resources Inc., Bank of America, N.A., as administrative agent, and Banc of America LLC, as sole lead arranger and sole booking manager | ||
| 10 | .3* | Transition Services Agreement dated April 23, 2007, between COG Operating LLC and Mack Energy Corporation | ||
| 10 | .4* | Form of Drilling Agreement with Silver Oak Drilling, LLC | ||
| 10 | .5* | Salt Water Disposal System Ownership and Operating Agreement dated February 24, 2006, among COG Operating LLC, Chase Oil Corporation, Caza Energy LLC and Mack Energy Corporation | ||
| 10 | .6* | Software License Agreement dated March 2, 2006, between Enertia Software Systems and Concho Resources Inc. | ||
| 10 | .7* | Leasehold Acquisition Agreement dated April 1, 2005, by and between Trey Resources, Inc. and COG Oil and Gas LP | ||
| 10 | .8* | Transfer of Operating Rights (Sublease) in a Lease for Oil and Gas for Valhalla properties | ||
| 10 | .9* | Assignment of Oil and Gas Leases from Caza Energy LLC | ||
| 10 | .10* | Escrow Agreement dated February 27, 2006, among Concho Resources Inc., Timothy A. Leach, Steven L. Beal, David W. Copeland, Curt F. Kamradt and E. Joseph Wright and other signatories thereto | ||
| 10 | .11* | Business Opportunities Agreement dated February 27, 2006, among Concho Resources Inc. and the other signatories thereto | ||
| 10 | .12* | Registration Rights Agreement dated February 27, 2006, among Concho Resources Inc. and the other signatories thereto | ||
| 10 | .13* | Concho Resources Inc. 2006 Stock Incentive Plan | ||
| 10 | .14** | Form of Incentive Stock Option Agreement | ||
| 10 | .15* | Form of Nonstatutory Stock Option Agreement | ||
| 10 | .16* | Form of Restricted Stock Agreement (for employees) | ||
| 10 | .17* | Form of Restricted Stock Agreement (for non-employee directors) | ||
Table of Contents
| Number | Exhibit | |||
| 10 | .18* | Employment Agreement dated July 14, 2006, between Concho Resources Inc. and Timothy A. Leach | ||
| 10 | .19* | Employment Agreement dated July 14, 2006, between Concho Resources Inc. and Steven L. Beal | ||
| 10 | .20* | Employment Agreement dated July 14, 2006, between Concho Resources Inc. and David W. Copeland | ||
| 10 | .21* | Employment Agreement dated July 14, 2006, between Concho Resources Inc. and Curt F. Kamradt | ||
| 10 | .22* | Employment Agreement dated July 14, 2006, between Concho Resources Inc. and David M. Thomas III | ||
| 10 | .23* | Employment Agreement dated July 14, 2006, between Concho Resources Inc. and E. Joseph Wright | ||
| 10 | .24* | Form of Indemnification Agreement between Concho Resources Inc. and each of the officers and directors thereof | ||
| 21 | .1** | Subsidiaries of Concho Resources Inc. | ||
| 23 | .1* | Consent of Grant Thornton LLP | ||
| 23 | .2* | Consent of Netherland, Sewell & Associates, Inc. | ||
| 23 | .3* | Consent of Cawley, Gillespie & Associates, Inc. | ||
| 23 | .4** | Consent of Vinson & Elkins L.L.P. | ||
| 24 | .1* | Power of Attorney | ||
| * | Filed herewith. | |
| ** | To be filed by amendment. | |
| † | The Combination Agreement filed as Exhibit 2.1 omits the schedules and exhibits to the Combination Agreement. Concho Resources agrees to furnish supplementally a copy of any omitted schedule or exhibit to the Securities and Exchange Commission upon request. |