Table of Contents
| Delaware (State or other jurisdiction of incorporation or organization) | 1311 (Primary Standard Industrial Classification Code Number) 550 West Texas Avenue, Suite 1300 Midland, Texas 79701 (432) 683-7443 | 76-0818600 (I.R.S. Employer Identification Number) |
With a copy to: | ||||
| T. Mark Kelly Douglas E. McWilliams Vinson & Elkins L.L.P. 1001 Fannin, Suite 2500 Houston, Texas77002-6760 (713) 758-2222 | William S. Anderson Bracewell & Giuliani LLP 711 Louisiana Street, Suite 2300 Houston, Texas 77002-2770 (713) 221-1122 | Gerald S. Tanenbaum Cahill Gordon & Reindel LLP 80 Pine Street New York, New York 10005 (212) 701-3224 | ||
| Proposed Maximum | Proposed Maximum | Amount of | ||||||||||
| Title of Each Class of | Amount | Offering | Aggregate | Registration | ||||||||
| Securities to be Registered | to be Registered(1) | Price per Share(2) | Offering Price(2) | Fee(2) | ||||||||
| Common Stock, par value $.001 | 10,000,000 | $20.48 | $204,800,000 | $6,288 | ||||||||
| (1) | Includes common stock issuable upon exercise of the underwriters’ option to purchase additional shares of common stock. | |
| (2) | Calculated in accordance with Rule 457(c) based on the average of the high and low prices of our common stock as reported by the New York Stock Exchange on November 21, 2007. |
Table of Contents
| The information in this preliminary prospectus is not complete and may be changed. These securities may not be sold until the registration statement filed with the Securities and Exchange Commission is effective. This preliminary prospectus is not an offer to sell these securities and it is not soliciting an offer to buy these securities in any jurisdiction where the offer or sale is not permitted. |

| Per share | Total | |||||||
| Price to the public | $ | $ | ||||||
| Underwriting discount | $ | $ | ||||||
| Net proceeds to selling stockholders, before expenses | $ | $ | ||||||
| JPMorgan | Banc of America Securities LLC |
Table of Contents
| ii | ||||||||
| 1 | ||||||||
| 16 | ||||||||
| 32 | ||||||||
| 33 | ||||||||
| 33 | ||||||||
| 33 | ||||||||
| 34 | ||||||||
| 38 | ||||||||
| 68 | ||||||||
| 93 | ||||||||
| 114 | ||||||||
| 116 | ||||||||
| 121 | ||||||||
| 127 | ||||||||
| 131 | ||||||||
| 134 | ||||||||
| 134 | ||||||||
| 134 | ||||||||
| 134 | ||||||||
| 136 | ||||||||
| F-1 | ||||||||
| A-1 | ||||||||
| B-1 | ||||||||
| Form of Underwriting Agreement | ||||||||
| Opinion of Vinson & Elkins L.L.P. | ||||||||
| Consent of Grant Thornton LLP - Tulsa | ||||||||
| Consent of Grant Thornton LLP - Kansas City | ||||||||
| Consent of Grant Thornton LLP - Dallas | ||||||||
| Consent of Netherland, Sewell & Associates, Inc. | ||||||||
| Consent of Cawley, Gillespie & Associates, Inc. | ||||||||
| Power of Attorney | ||||||||
i
Table of Contents
ii
Table of Contents
1
Table of Contents
| Nine months | ||||||||||||||||||||||||
| As of | ended | |||||||||||||||||||||||
| December 31, 2006 | September 30, | |||||||||||||||||||||||
| Pro forma | As of | 2007 | ||||||||||||||||||||||
| Total | reserve/ | September 30, 2007 | Average | |||||||||||||||||||||
| proved | production | Identified | Identified | Total | Total | net daily | ||||||||||||||||||
| reserves | PV-10 | index(1) | drilling | recompletion | gross | net | production | |||||||||||||||||
| Areas | (Bcfe) | ($ in millions) | (years) | locations(2) | projects(2) | acreage | acreage | (MMcfe/d) | ||||||||||||||||
| Permian Basin | ||||||||||||||||||||||||
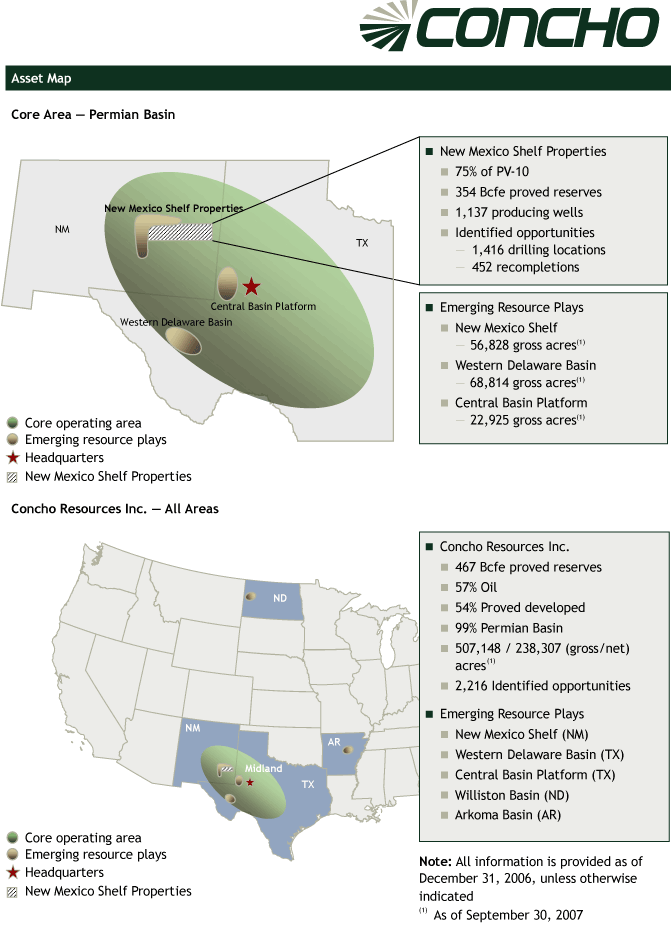
| Southeast New Mexico | 387.5 | $ | 782.6 | 18.7 | 1,505 | 489 | 170,035 | 75,606 | 63.5 | |||||||||||||||
| West Texas | 70.2 | 154.5 | 15.5 | 148 | 49 | 91,547 | 34,358 | 13.1 | ||||||||||||||||
Emerging Plays and Other(3) | 9.1 | 16.9 | 19.2 | 23 | 2 | 245,566 | 128,343 | 3.1 | ||||||||||||||||
| Total | 466.8 | $ | 954.0 | 18.1 | 1,676 | 540 | 507,148 | 238,307 | 79.7 | |||||||||||||||
| (1) | The pro forma reserve/production index is the number of years proved reserves would last assuming current production continued at the same rate. This index is calculated by dividing pro forma production during the year ended December 31, 2006, into the proved reserve quantity as of December 31, 2006. Pro forma production during the year ended December 31, 2006 was 25,735.0 MMcfe, consisting of 20,734.0 MMcfe in the Southeast New Mexico part of the Permian Basin, 4,526.5 MMcfe in the West Texas part of the Permian Basin and 474.5 MMcfe in Emerging Plays and Other. Pro forma production information assumes the combination transaction had taken place on January 1, 2006. | |
| (2) | The identified drilling locations and identified recompletion projects listed in the table above included 817 drilling locations and recompletion projects for which proved reserves had been included in our reserve reports as of December 31, 2006. |
2
Table of Contents
| (3) | Information with respect to “Other” includes conventional oil and gas operations on properties that are not located in the Permian Basin. As of December 31, 2006, 3.1 Bcfe of the proved reserves and $5.4 million of thePV-10, as well as one of the identified drilling locations and two identified recompletion projects, were related to oil and natural gas properties categorized as “Other” and not as “Emerging Plays.” In addition, as of September 30, 2007, 39,668 gross (28,573 net) acres reflected above were categorized as “Other,” and 1.1 MMcfe per day of the average daily production during the nine months ended September 30, 2007 reflected above were categorized as “Other.” |
| • | the Northwest Shelf area in Southeast New Mexico, where we have tested one re-entry well and drilled thirteen wells targeting the Wolfcamp Carbonate; |
| • | the Central Basin Platform of West Texas, where we plan to target the Woodford Shale; |
| • | the Delaware Basin of West Texas, where we have drilled four exploratory wells targeting the Bone Spring, Atoka, Barnett and Woodford Shales; |
| • | the North Dakota portion of the Williston Basin, where we have participated in the drilling of four exploratory wells targeting the Bakken Shale; and |
| • | the eastern Arkoma Basin in Arkansas, where we plan to drill our first test well in 2008, which will target the Fayetteville Shale. |
| • | Exploit our multi-year project inventory. We believe our multi-year drilling and exploitation inventory of 2,216 drilling locations and recompletion projects on our existing properties as of December 31, 2006 will allow us to grow our proved reserves and production for the next several years. |
| • | Enhance production from our existing properties through development of additional producing horizons and enhanced recovery methods.We have begun to evaluate additional productive horizons underlying certain of our existing producing horizons in Southeast New Mexico. During 2006, we drilled 52 wells in the Blinebry interval, all of which have since been |
3
Table of Contents
| completed as producers. During the nine months ended September 30, 2007, we drilled 58 Blinebry wells, of which 46 were completed as producers, 11 were awaiting completion as of September 30, 2007 and 1 was a dry hole. In addition, in September 2007, we began injecting water on our pilot waterflood covering approximately 160 acres in the Paddock interval of the Yeso formation. |
| • | Pursue the acquisition, exploration and development of unconventional emerging oil and natural gas resource plays. We have assembled an exploration team to target unconventional emerging resource plays. Members of our technical staff, consisting of seven petroleum engineers, seven geoscientists and ten landmen, have, on average, more than 23 years experience in the industry. |
| • | Make opportunistic acquisitions that meet our strategic and financial objectives. We seek to acquire oil and gas properties that we believe complement our existing properties in our core areas of operation, as well as other properties that provide opportunities for the addition of reserves and production through a combination of exploitation, development, high-potential exploration and control of operations. |
| • | Experienced and incentivized management team. Our executive officers average over 19 years of experience in the oil and gas industry, having led both public and private oil and natural gas exploration and production companies, all of which have had substantially all of their operations in our core area of the Permian Basin. |
| • | History of growth and capital efficiency. Despite increasing costs of oilfield services and equipment in our areas of operation, we added 101 Bcfe of proved reserves in 2006 through new discoveries and extensions, excluding revisions of previous estimates, at a total cost of $193.3 million. |
| • | Large inventory of drilling and recompletion opportunities. As of December 31, 2006, we had identified multiple undrilled well locations and recompletion opportunities, with proved reserves attributed to a portion of such locations and opportunities. During the nine months ended September 30, 2007, we drilled 75 wells, of which 59 were completed as producers, 14 were awaiting completion as of September 30, 2007 and 2 were dry holes. In addition, during the nine months ended September 30, 2007, we recompleted 78 wells, of which 75 were producing and 3 were dry holes. |
| • | Geographically concentrated operations. The geographic concentration of our current operations in the Permian Basin allows us to establish economies of scale with respect to drilling, production, operating and administrative costs, in addition to further leveraging our base of technical expertise in this region. |
| • | Significant operational control. Our high proportion of operated properties enables us to exercise a significant level of control over the amount and timing of expenses, capital allocation and other aspects of exploration and development. |
4
Table of Contents
| • | A substantial or extended decline in oil and natural gas prices may adversely affect our business, financial condition or results of operations and our ability to meet our capital expenditure obligations and financial commitments. |
| • | Our development and exploitation projects require substantial capital expenditures. We may be unable to obtain needed capital or financing on satisfactory terms or at all, which could lead to a decline in our oil and natural gas reserves. |
| • | Reserve estimates depend on many assumptions that may turn out to be inaccurate. Any material inaccuracies in these reserve estimates or underlying assumptions could materially reduce the estimated quantity and present value of our reserves. |
| • | Drilling for and producing oil and natural gas are high risk activities with many uncertainties that could cause our expenses to increase or our cash flows and production volumes to decrease. |
5
Table of Contents
| • | We may incur substantial losses and be subject to substantial liability claims as a result of our oil and natural gas operations. We may not be insured for, or our insurance may be inadequate to protect us against, these risks. |
| • | Unless we replace our oil and natural gas reserves, our reserves and production will decline, which would adversely affect our cash flows, our ability to raise capital and the value of our common stock. |
| • | The unavailability or high cost of drilling and workover rigs, equipment, supplies, materials, electricity, personnel and oilfield services could adversely affect our ability to execute our exploration and development plans within our budget or on a timely basis. |
| • | Substantially all of our producing properties are located in Southeast New Mexico and West Texas, making us vulnerable to risks associated with operating in one major geographic area. Furthermore, approximately 53% of our proved reserves as of December 31, 2006, are from the Yeso formation, which includes both the Paddock and Blinebry intervals, within this geographic area, thus making us vulnerable to risks associated with this concentration of assets. |
| • | Uncertainties associated with enhanced recovery methods may result in us not realizing an acceptable return on the investments we make to use such methods. |
6
Table of Contents
| Common stock offered by the selling stockholders: | shares | |
| Common stock outstanding as of November 20, 2007(1): | 75,833,972 shares | |
| Use of proceeds: | We will not receive any of the proceeds from the sale of the shares by the selling stockholders. | |
| Dividend policy: | We do not anticipate paying any cash dividends on our common stock. | |
| New York Stock Exchange symbol: | CXO | |
| Risk factors: | See “Risk factors” and the other information included in this prospectus for a discussion of the factors you should consider carefully before deciding to invest in shares of our common stock. |
| • | 3,011,722 shares of our common stock reserved for issuance upon exercise of stock options that were granted under our stock option plan at a weighted average exercise price of $9.71 per share; and | |
| • | 2,405,067 shares of our common stock reserved for issuance pursuant to future awards under our 2006 Stock Incentive Plan. |
7
Table of Contents
| • | Prior to December 7, 2004, Concho Equity Holdings Corp. did not own any material assets and did not conduct substantial operations other than organizational activities. |
| • | On December 7, 2004, Concho Equity Holdings Corp. acquired the Lowe Properties for approximately $117 million and commenced oil and gas operations. |
| • | On February 27, 2006, the initial closing of the combination transaction occurred. Pursuant to the combination transaction, Concho Resources acquired the Chase Group Properties for approximately 35 million shares of common stock and approximately $409 million in cash. |
| • | On March 27, 2007, Concho Resources entered into a $200.0 million second lien term loan facility from which it received proceeds of $199.0 million that it used to repay the $39.8 million outstanding under its prior term loan facility and to reduce the outstanding balance under its revolving credit facility by $154.0 million, with the remaining $5.2 million used to pay loan fees, accrued interest and for general corporate purposes. |
| • | In August 2007, Concho Resources completed its initial public offering of common stock from which it received proceeds of $173.0 million that it used to retire outstanding borrowings under its second lien term loan facility totaling $86.5 million and to retire outstanding borrowings under its revolving credit facility totaling $86.5 million. |
8
Table of Contents
9
Table of Contents
| Chase Group | Concho Resources Inc. | |||||||||||||||||||||||||||||||||
| Properties | Inception | |||||||||||||||||||||||||||||||||
| (April 21, | Pro forma | |||||||||||||||||||||||||||||||||
| 2004) | Nine months | Nine months | ||||||||||||||||||||||||||||||||
| Years ended | through | Years ended | Year ended | ended | ended | |||||||||||||||||||||||||||||
| December 31, | December 31, | December 31, | December 31, | September 30, | September 30, | |||||||||||||||||||||||||||||
| (In thousands, except per share amounts) | 2004 | 2005 | 2004 | 2005 | 2006 | 2006 | 2007 | 2006 | 2007 | |||||||||||||||||||||||||
| (unaudited) | (unaudited) | (unaudited) | (unaudited) | |||||||||||||||||||||||||||||||
Statement of operations data: | ||||||||||||||||||||||||||||||||||
Operating revenues: | ||||||||||||||||||||||||||||||||||
| Oil sales | $ | 66,529 | $ | 73,132 | $ | 1,851 | $ | 31,621 | $ | 131,773 | $ | 145,713 | $ | 128,152 | $ | 90,737 | $ | 128,152 | ||||||||||||||||
| Natural gas sales | 41,247 | 46,546 | 1,771 | 23,315 | 66,517 | 74,033 | 67,395 | 44,908 | 67,395 | |||||||||||||||||||||||||
| Total operating revenues | 107,776 | 119,678 | 3,622 | 54,936 | 198,290 | 219,746 | 195,547 | 135,645 | 195,547 | |||||||||||||||||||||||||
Operating costs and expenses: | ||||||||||||||||||||||||||||||||||
| Oil and gas production | 11,762 | 12,979 | 512 | 10,923 | 22,060 | 24,456 | 22,309 | 14,511 | 22,309 | |||||||||||||||||||||||||
| Oil and gas production taxes | 9,202 | 10,298 | 234 | 3,712 | 15,762 | 17,602 | 15,616 | 10,831 | 15,616 | |||||||||||||||||||||||||
| Exploration and abandonments | 179 | — | 1,850 | 2,666 | 5,612 | 5,612 | 18,110 | 4,717 | 18,110 | |||||||||||||||||||||||||
| Depreciation, depletion and accretion | 20,459 | 19,092 | 963 | 11,574 | 61,009 | 66,520 | 55,370 | 42,366 | 55,370 | |||||||||||||||||||||||||
| Impairments of proved oil and gas properties | 3,233 | 194 | — | 2,295 | 9,891 | 9,892 | 4,577 | 5,762 | 4,577 | |||||||||||||||||||||||||
| Contract drilling fees—stacked rigs | — | — | — | — | — | — | 4,269 | — | 4,269 | |||||||||||||||||||||||||
| General and administrative | 1,387 | 1,702 | 3,086 | 8,055 | 12,577 | 12,861 | 13,911 | 8,003 | 13,911 | |||||||||||||||||||||||||
| Stock-based compensation | — | — | 1,128 | 3,252 | 9,144 | 9,144 | 2,656 | 8,041 | 2,656 | |||||||||||||||||||||||||
| Ineffective portion of cash flow hedges | — | — | — | 1,148 | (1,193 | ) | (1,193 | ) | 1,134 | (64 | ) | 1,134 | ||||||||||||||||||||||
| (Gain) loss on derivatives not designated as hedges | 7,936 | 1,062 | (684 | ) | 5,001 | — | — | (3,088 | ) | — | (3,088 | ) | ||||||||||||||||||||||
| Total operating costs and expenses | 54,158 | 45,327 | 7,089 | 48,626 | 134,862 | 144,894 | 134,864 | 94,167 | 134,864 | |||||||||||||||||||||||||
Income (loss) from operations | 53,618 | 74,351 | (3,467 | ) | 6,310 | 63,428 | 74,852 | 60,683 | 41,478 | 60,683 | ||||||||||||||||||||||||
Other income (expense): | ||||||||||||||||||||||||||||||||||
| Interest expense | — | — | (272 | ) | (3,096 | ) | (30,567 | ) | (21,677 | ) | (20,819 | ) | (20,998 | ) | (29,803 | ) | ||||||||||||||||||
| Other, net | — | — | 168 | 779 | 1,186 | 636 | 787 | 907 | 957 | |||||||||||||||||||||||||
| Total other expense | — | — | (104 | ) | (2,317 | ) | (29,381 | ) | (21,041 | ) | (20,032 | ) | (20,091 | ) | (28,846 | ) | ||||||||||||||||||
Income (loss) before income taxes | 53,618 | 74,351 | (3,571 | ) | 3,993 | 34,047 | 53,811 | 40,651 | 21,387 | 31,837 | ||||||||||||||||||||||||
| Income tax (expense) benefit | — | — | 915 | (2,039 | ) | (14,379 | ) | (22,086 | ) | (17,031 | ) | (8,664 | ) | (13,335 | ) | |||||||||||||||||||
Net income (loss) | $ | 53,618 | $ | 74,351 | (2,656 | ) | 1,954 | 19,668 | 31,725 | 23,620 | 12,723 | 18,502 | ||||||||||||||||||||||
| Preferred stock dividends | (804 | ) | (4,766 | ) | (1,244 | ) | — | — | (1,210 | ) | (45 | ) | ||||||||||||||||||||||
| Effect of induced conversion of preferred stock | — | — | 11,601 | — | — | 11,601 | — | |||||||||||||||||||||||||||
Net income (loss) applicable to common shareholders | $ | (3,460 | ) | $ | (2,812 | ) | $ | 30,025 | $ | 31,725 | $ | 23,620 | $ | 23,114 | $ | 18,457 | ||||||||||||||||||
EBITDA(1) (unaudited) | $ | 74,077 | $ | 93,443 | $ | (2,336 | ) | $ | 18,663 | $ | 125,623 | $ | 142,008 | $ | 116,840 | $ | 84,751 | $ | 117,010 | |||||||||||||||
Basic earnings (loss) per share: | ||||||||||||||||||||||||||||||||||
| Net income (loss) per share | $ | (3.48 | ) | $ | (0.70 | ) | $ | 0.63 | $ | 0.45 | $ | 0.31 | $ | 0.52 | $ | 0.30 | ||||||||||||||||||
| Shares used in basic earnings (loss) per share | 994 | 4,059 | 47,287 | 70,634 | 77,114 | 44,710 | 60,648 | |||||||||||||||||||||||||||
Diluted earnings (loss) per share: | ||||||||||||||||||||||||||||||||||
| Net income (loss) per share | $ | (3.48 | ) | $ | (0.70 | ) | $ | 0.59 | $ | 0.43 | $ | 0.30 | $ | 0.48 | $ | 0.29 | ||||||||||||||||||
| Shares used in diluted earnings (loss) per share | 994 | 4,059 | 50,729 | 74,172 | 79,324 | 47,937 | 62,858 | |||||||||||||||||||||||||||
10
Table of Contents
| Chase Group | ||||||||||||||||||||||||||||
| Properties | Concho Resources Inc. | |||||||||||||||||||||||||||
| Inception (April 21, | ||||||||||||||||||||||||||||
| Years ended | 2004) through | Years ended | Nine months ended | |||||||||||||||||||||||||
| December 31, | December 31, | December 31, | September 30, | |||||||||||||||||||||||||
| (In thousands) | 2004 | 2005 | 2004 | 2005 | 2006 | 2006 | 2007 | |||||||||||||||||||||
(unaudited) | (unaudited) | |||||||||||||||||||||||||||
Other financial data: | ||||||||||||||||||||||||||||
| Net cash provided by (used in) operations | $ | 84,202 | $ | 93,162 | $ | (2,193 | ) | $ | 25,070 | $ | 112,181 | $ | 58,941 | $ | 102,932 | |||||||||||||
| Net cash provided by (used in) investing | (30,045 | ) | (35,611 | ) | (122,473 | ) | (61,902 | ) | (596,852 | ) | (537,930 | ) | (115,028 | ) | ||||||||||||||
| Net cash provided by (used in) financing | (54,157 | ) | (57,551 | ) | 125,322 | 45,358 | 476,611 | 469,807 | 30,842 | |||||||||||||||||||
| Capital expenditures | 25,451 | 32,352 | 116,880 | 72,758 | 1,226,180 | 1,162,328 | 125,055 | |||||||||||||||||||||
| Chase Group | ||||||||||||||||||
| Properties | Concho Resources Inc. | |||||||||||||||||
| As of | ||||||||||||||||||
| As of December 31, | As of December 31, | September 30, | ||||||||||||||||
| (In thousands) | 2004 | 2005 | 2004 | 2005 | 2006 | 2007 | ||||||||||||
(unaudited) | ||||||||||||||||||
Balance sheet data: | ||||||||||||||||||
| Cash and cash equivalents | $ | — | $ | — | $ | 656 | $ | 9,182 | $ | 1,122 | $ | 19,868 | ||||||
| Property and equipment, net | 135,568 | 149,042 | 115,455 | 170,583 | 1,320,655 | 1,368,026 | ||||||||||||
| Total assets | 145,100 | 161,792 | 130,717 | 232,385 | 1,390,072 | 1,443,507 | ||||||||||||
| Long-term debt, including current maturities | — | — | 53,000 | 72,000 | 495,500 | 345,880 | ||||||||||||
| Stockholders’ equity/net investment | 134,014 | 150,814 | 71,710 | 109,670 | 575,156 | 773,384 | ||||||||||||
| (1) | EBITDA is defined as net income, plus (1) interest, the amortization of related debt issuance costs and other financial costs, net of capitalized interest, (2) federal and state income taxes and (3) depreciation, depletion and accretion. See “—Non-GAAP financial measures and reconciliations.” |
11
Table of Contents
and operating data (unaudited)
| Pro forma as of | As of | |||||
| December 31, 2005 | December 31, 2006 | |||||
Proved reserves: | ||||||
| Oil (MBbl) | 37,492 | 44,322 | ||||
| Natural gas (MMcf) | 190,938 | 200,818 | ||||
| Natural gas equivalent (MMcfe) | 415,890 | 466,750 | ||||
| Proved developed reserves percentage | 55.0% | 54.2% | ||||
PV-10 (in millions)(1) | $ | 1,324.5 | $ | 954.0 | ||
Estimated reserve life (in years)(2) | 18.7 | 18.1 | ||||
| (1) | PV-10 is a non-GAAP financial measure and generally differs from standardized measure, the most directly comparable GAAP financial measure, because it does not include the effects of income taxes on future net revenues. See “—Non-GAAP financial measures and reconciliations.” Prices used in the computation of future net cash flows were adjusted for location and quality by field, and were $61.04 per Bbl and $10.08 per MMBtu for purposes of estimating pro forma net proved reserves as of December 31, 2005 and were $57.75 per Bbl and $5.64 per MMBtu for purposes of estimating net proved reserves as of December 31, 2006. |
| (2) | Calculated by dividing proved reserves by pro forma production volumes for the years indicated. |
12
Table of Contents
| Pro forma | Nine months | |||||
| year ended | ended | |||||
| December 31, | September 30, | |||||
| 2006 | 2007 | |||||
Net production volumes: | ||||||
| Oil (MBbl) | 2,539.6 | 2,143.2 | ||||
| Natural gas (MMcf) | 10,497.6 | 8,887.5 | ||||
| Natural gas equivalent (MMcfe) | 25,735.0 | 21,746.9 | ||||
Average prices: | ||||||
| Oil, without hedges ($/Bbl) | $ | 60.13 | $ | 61.36 | ||
| Oil, with hedges ($/Bbl) | $ | 57.38 | $ | 59.79 | ||
| Natural gas, without hedges ($/Mcf) | $ | 6.94 | $ | 7.48 | ||
| Natural gas, with hedges ($/Mcf) | $ | 7.05 | $ | 7.58 | ||
| Natural gas equivalent, without hedges ($/Mcfe) | $ | 8.76 | $ | 9.10 | ||
| Natural gas equivalent, with hedges ($/Mcfe) | $ | 8.54 | $ | 8.99 | ||
Operating costs and expenses: | ||||||
| Oil and gas production ($/Mcfe) | $ | 0.95 | $ | 1.03 | ||
| Oil and gas production taxes ($/Mcfe) | $ | 0.68 | $ | 0.72 | ||
| General and administrative ($/Mcfe) | $ | 0.50 | $ | 0.64 | ||
| Depreciation and depletion expense ($/Mcfe) | $ | 2.57 | $ | 2.53 | ||
13
Table of Contents
| (Dollars in millions) | Pro forma 2005 | 2006 | ||||||
| PV-10 | $ | 1,324.5 | $ | 954.0 | ||||
| Present value of future income tax discounted at 10% | (379.7 | ) | (243.7 | ) | ||||
| Standardized measure of discounted future cash flows | $ | 944.8 | $ | 710.3 | ||||
14
Table of Contents
| Chase Group Properties | Concho Resources Inc. | |||||||||||||||||||||||||||||
| Inception | Pro forma | |||||||||||||||||||||||||||||
| (April 21, 2004) | Pro forma | nine months | ||||||||||||||||||||||||||||
| Years ended | through | Years ended | year ended | ended | Nine months | |||||||||||||||||||||||||
| December 31, | December 31, | December 31, | December 31, | September 30, | ended September 30, | |||||||||||||||||||||||||
| (In thousands) | 2004 | 2005 | 2004 | 2005 | 2006 | 2006 | 2007 | 2006 | 2007 | |||||||||||||||||||||
| Net income (loss) | $ | 53,618 | $ | 74,351 | $ | (2,656 | ) | $ | 1,954 | $ | 19,668 | $ | 31,725 | $ | 23,620 | $ | 12,723 | $ | 18,502 | |||||||||||
| Interest expense | — | — | 272 | 3,096 | 30,567 | 21,677 | 20,819 | 20,998 | 29,803 | |||||||||||||||||||||
| Income tax expense (benefit) | — | — | (915 | ) | 2,039 | 14,379 | 22,086 | 17,031 | 8,664 | 13,335 | ||||||||||||||||||||
| Depreciation, depletion and accretion | 20,459 | 19,092 | 963 | 11,574 | 61,009 | 66,520 | 55,370 | 42,366 | 55,370 | |||||||||||||||||||||
| EBITDA | $ | 74,077 | $ | 93,443 | $ | (2,336 | ) | $ | 18,663 | $ | 125,623 | $ | 142,008 | $ | 116,840 | $ | 84,751 | $ | 117,010 | |||||||||||
15
Table of Contents
| • | the level of consumer demand for oil and natural gas; |
| • | the domestic and foreign supply of oil and natural gas; |
| • | commodity processing, gathering and transportation availability, and the availability of refining capacity; |
| • | the price and level of imports of foreign oil and natural gas; |
| • | the ability of the members of the Organization of Petroleum Exporting Countries to agree to and maintain oil price and production controls; |
| • | domestic and foreign governmental regulations and taxes; |
| • | the price and availability of alternative fuel sources; |
| • | weather conditions; |
| • | political conditions or hostilities in oil and natural gas producing regions, including the Middle East and South America; |
| • | technological advances affecting energy consumption; and |
| • | worldwide economic conditions. |
16
Table of Contents
| • | delays imposed by or resulting from compliance with regulatory and contractual requirements; |
| • | pressure or irregularities in geological formations; |
| • | shortages of or delays in obtaining equipment and qualified personnel; |
| • | equipment failures or accidents; |
| • | adverse weather conditions; |
| • | reductions in oil and natural gas prices; |
| • | surface access restrictions; |
| • | title problems; and |
| • | limitations in the market for oil and natural gas. |
17
Table of Contents
18
Table of Contents
| • | the counterparty to a commodity price risk management contract may default on its contractual obligations to us; |
| • | there may be a change in the expected differential between the underlying price in a commodity price risk management agreement and actual prices received; or |
| • | market prices may exceed the prices which we are contracted to receive, resulting in our need to make significant cash payments to our contract counterparty. |
19
Table of Contents
20
Table of Contents
| • | our proved reserves; |
| • | the level of oil and natural gas we are able to produce from existing wells; |
| • | the prices at which our oil and natural gas are sold; and |
| • | our ability to acquire, locate and produce new reserves. |
21
Table of Contents
| • | the nature and timing of drilling and operational activities; |
| • | the timing and amount of capital expenditures; |
| • | the operators’ expertise and financial resources; |
| • | the approval of other participants in such properties; and |
| • | the selection of suitable technology. |
22
Table of Contents
23
Table of Contents
| • | unexpected drilling conditions; |
| • | title problems; |
| • | pressure or lost circulation in formations; |
| • | equipment failures or accidents; |
| • | adverse weather conditions; |
| • | compliance with environmental and other governmental or contractual requirements; and |
24
Table of Contents
| • | increases in the cost of, or shortages or delays in the availability of, electricity, supplies, materials, drilling or workover rigs, equipment and services. |
| • | environmental hazards, such as uncontrollable flows of oil, natural gas, brine, well fluids, toxic gas or other pollution into the environment, including groundwater contamination; |
| • | abnormally pressured or structured formations; |
| • | mechanical difficulties, such as stuck oilfield drilling and service tools and casing collapse; |
| • | fires, explosions and ruptures of pipelines; |
| • | personal injuries and death; and |
| • | natural disasters. |
| • | injury or loss of life; |
| • | damage to and destruction of property, natural resources and equipment; |
| • | pollution and other environmental damage; |
| • | regulatory investigations and penalties; |
| • | suspension of our operations; and |
| • | repair and remediation costs. |
25
Table of Contents
26
Table of Contents
| • | impair our ability to make investments and obtain additional financing for working capital, capital expenditures, acquisitions or other general corporate purposes; |
| • | limit our ability to use operating cash flow in other areas of our business because we must dedicate a substantial portion of these funds to make principal and interest payments on our indebtedness; |
27
Table of Contents
| • | limit our ability to borrow funds that may be necessary to operate or expand our business; |
| • | put us at a competitive disadvantage to competitors that have less debt; |
| • | increase our vulnerability to interest rate increases; and |
| • | hinder our ability to adjust to rapidly changing economic and industry conditions. |
| • | incurring additional indebtedness; |
| • | paying dividends; |
| • | creating certain additional liens on our assets; |
| • | entering into sale and leaseback transactions; |
| • | making investments; |
| • | entering into transactions with affiliates; |
| • | making material changes to the type of business we conduct or our business structure; |
| • | making guarantees; |
| • | disposing of assets in excess of certain permitted amounts; |
| • | merging or consolidating with other entities; and |
| • | selling all or substantially all of our assets. |
28
Table of Contents
29
Table of Contents
| • | the organization of our board of directors as a classified board, which allows no more than approximately one-third of our directors to be elected each year; |
| • | stockholders cannot remove directors from our board of directors except for cause and then only by the holders of not less than 662/3% of the voting power of all outstanding voting stock; |
| • | the prohibition of stockholder action by written consent; and |
| • | limitations on the ability of our stockholders to call special meetings and establish advance notice provisions for stockholder proposals and nominations for elections to the board of directors to be acted upon at meetings of stockholders. |
30
Table of Contents
| • | design, establish, evaluate and maintain a system of internal controls over financial reporting in compliance with the requirements of Section 404 of the Sarbanes-Oxley Act of 2002 and the related rules and regulations of the SEC and the Public Company Accounting Oversight Board; |
| • | involve and retain to a greater degree outside counsel and accountants in the above activities; and |
| • | attract and retain qualified personnel for compliance. |
31
Table of Contents
| • | business strategy; |
| • | estimated quantities of oil and natural gas reserves; |
| • | technology; |
| • | financial strategy; |
| • | oil and natural gas realized prices; |
| • | timing and amount of future production of oil and natural gas; |
| • | the amount, nature and timing of capital expenditures; |
| • | drilling of wells; |
| • | competition and government regulations; |
| • | marketing of oil and natural gas; |
| • | exploitation or property acquisitions; |
| • | costs of exploiting and developing our properties and conducting other operations; |
| • | general economic and business conditions; |
| • | cash flow and anticipated liquidity; |
| • | uncertainty regarding our future operating results; and |
| • | plans, objectives, expectations and intentions contained in this prospectus that are not historical. |
32
Table of Contents
| High | Low | |||||||
Year Ending December 31, 2007 | ||||||||
| Third Quarter (August 3, 2007 through September 30, 2007) | $ | 16.44 | $ | 11.60 | ||||
| Fourth Quarter (through November 27, 2007) | $ | 22.30 | $ | 14.30 | ||||
33
Table of Contents
| • | Prior to December 7, 2004, Concho Equity Holdings Corp. did not own any material assets and did not conduct substantial operations other than organizational activities. |
| • | On December 7, 2004, Concho Equity Holdings Corp. acquired the Lowe Properties for approximately $117 million and commenced oil and gas operations. |
| • | On February 27, 2006, the initial closing of the combination transaction occurred. Pursuant to the combination transaction, Concho Resources acquired the Chase Group Properties for approximately 35 million shares of common stock and approximately $409 million in cash. |
| • | On March 27, 2007, Concho Resources entered into a $200.0 million second lien term loan facility from which it received proceeds of $199.0 million that it used to repay the $39.8 million outstanding under its prior term loan facility and to reduce the outstanding balance under its revolving credit facility by $154.0 million, with the remaining $5.2 million used to pay loan fees, accrued interest and for general corporate purposes. |
| • | In August 2007, Concho Resources completed its initial public offering of common stock from which it received proceeds of $173.0 million that it used to retire outstanding borrowings under its second lien term loan facility totaling $86.5 million and to retire outstanding borrowings under its revolving credit facility totaling $86.5 million. |
34
Table of Contents
| Chase Group Properties | Concho Resources Inc. | |||||||||||||||||||||||||||||||
| Inception | ||||||||||||||||||||||||||||||||
| (April 21, | ||||||||||||||||||||||||||||||||
| Years ended | 2004) through | Years ended | Nine months | |||||||||||||||||||||||||||||
| (in thousands, except | December 31, | December 31, | December 31, | ended September 30, | ||||||||||||||||||||||||||||
| per share amounts) | 2002 | 2003 | 2004 | 2005 | 2004 | 2005 | 2006 | 2006 | 2007 | |||||||||||||||||||||||
| (unaudited) | (unaudited) | (unaudited) | ||||||||||||||||||||||||||||||
Statement of operations data: | ||||||||||||||||||||||||||||||||
Operating revenues: | ||||||||||||||||||||||||||||||||
| Oil sales | $ | 59,881 | $ | 62,016 | $ | 66,529 | $ | 73,132 | $ | 1,851 | $ | 31,621 | $ | 131,773 | $ | 90,737 | $ | 128,152 | ||||||||||||||
| Natural gas sales | 23,870 | 41,486 | 41,247 | 46,546 | 1,771 | 23,315 | 66,517 | 44,908 | 67,395 | |||||||||||||||||||||||
| Total operating revenues | 83,751 | 103,502 | 107,776 | 119,678 | 3,622 | 54,936 | 198,290 | 135,645 | 195,547 | |||||||||||||||||||||||
Operating costs and expenses: | ||||||||||||||||||||||||||||||||
| Oil and gas production | 10,386 | 9,868 | 11,762 | 12,979 | 512 | 10,923 | 22,060 | 14,511 | 22,309 | |||||||||||||||||||||||
| Oil and gas production taxes | 6,928 | 8,815 | 9,202 | 10,298 | 234 | 3,712 | 15,762 | 10,831 | 15,616 | |||||||||||||||||||||||
| Exploration and abandonments | 900 | 2,116 | 179 | — | 1,850 | 2,666 | 5,612 | 4,717 | 18,110 | |||||||||||||||||||||||
| Depreciation, depletion and accretion | 16,239 | 19,643 | 20,459 | 19,092 | 963 | 11,574 | 61,009 | 42,366 | 55,370 | |||||||||||||||||||||||
| Impairments of proved oil and gas properties | 1,587 | 2,065 | 3,233 | 194 | — | 2,295 | 9,891 | 5,762 | 4,577 | |||||||||||||||||||||||
| Contract drilling fees—stacked rigs | — | — | — | — | — | — | — | — | 4,269 | |||||||||||||||||||||||
| General and administrative | 1,128 | 1,246 | 1,387 | 1,702 | 3,086 | 8,055 | 12,577 | 8,003 | 13,911 | |||||||||||||||||||||||
| Stock-based compensation | — | — | — | — | 1,128 | 3,252 | 9,144 | 8,041 | 2,656 | |||||||||||||||||||||||
| Ineffective portion of cash flow hedges | — | — | — | — | — | 1,148 | (1,193 | ) | (64 | ) | 1,134 | |||||||||||||||||||||
| (Gain) loss on derivatives not designated as hedges | 3,379 | 576 | 7,936 | 1,062 | (684 | ) | 5,001 | — | — | (3,088 | ) | |||||||||||||||||||||
| Total operating costs and expenses | 40,547 | 44,329 | 54,158 | 45,327 | 7,089 | 48,626 | 134,862 | 94,167 | 134,864 | |||||||||||||||||||||||
Income (loss) from operations | 43,204 | 59,173 | 53,618 | 74,351 | (3,467 | ) | 6,310 | 63,428 | 41,478 | 60,683 | ||||||||||||||||||||||
Other income (expense): | ||||||||||||||||||||||||||||||||
| Interest expense | — | — | — | — | (272 | ) | (3,096 | ) | (30,567 | ) | (20,998 | ) | (29,803 | ) | ||||||||||||||||||
| Other, net | — | — | — | — | 168 | 779 | 1,186 | 907 | 957 | |||||||||||||||||||||||
| Total other expense | — | — | — | — | (104 | ) | (2,317 | ) | (29,381 | ) | (20,091 | ) | (28,846 | ) | ||||||||||||||||||
Income (loss) before income taxes | 43,204 | 59,173 | 53,618 | 74,351 | (3,571 | ) | 3,993 | 34,047 | 21,387 | 31,837 | ||||||||||||||||||||||
| Income tax (expense) benefit | — | — | — | — | 915 | (2,039 | ) | (14,379 | ) | (8,664 | ) | (13,335 | ) | |||||||||||||||||||
Net income (loss) | $ | 43,204 | $ | 59,173 | $ | 53,618 | $ | 74,351 | (2,656 | ) | 1,954 | 19,668 | 12,723 | 18,502 | ||||||||||||||||||
| Preferred stock dividends | (804 | ) | (4,766 | ) | (1,244 | ) | (1,210 | ) | (45 | ) | ||||||||||||||||||||||
| Effect of induced conversion of preferred stock | — | — | 11,601 | 11,601 | — | |||||||||||||||||||||||||||
Net income (loss) applicable to common shareholders | $ | (3,460 | ) | $ | (2,812 | ) | $ | 30,025 | $ | 23,114 | $ | 18,457 | ||||||||||||||||||||
EBITDA(1) (unaudited) | $ | 74,077 | $ | 93,443 | $ | (2,336 | ) | $ | 18,663 | $ | 125,623 | $ | 84,751 | $ | 117,010 | |||||||||||||||||
Basic earnings (loss) per share: | ||||||||||||||||||||||||||||||||
| Net income (loss) per share | $ | (3.48 | ) | $ | (0.70 | ) | $ | 0.63 | $ | 0.52 | $ | 0.30 | ||||||||||||||||||||
| Shares used in basic earnings (loss) per share | 994 | 4,059 | 47,287 | 44,710 | 60,648 | |||||||||||||||||||||||||||
Diluted earnings (loss) per share: | ||||||||||||||||||||||||||||||||
| Net income (loss) per share | $ | (3.48 | ) | $ | (0.70 | ) | $ | 0.59 | $ | 0.48 | $ | 0.29 | ||||||||||||||||||||
| Shares used in diluted earnings (loss) per share | 994 | 4,059 | 50,729 | 47,937 | 62,858 | |||||||||||||||||||||||||||
35
Table of Contents
| Chase Group Properties | Concho Resources Inc. | |||||||||||||||||||||||||||||||
| Inception | ||||||||||||||||||||||||||||||||
| (April 21, | ||||||||||||||||||||||||||||||||
| Years ended | 2004) through | Years ended | Nine months | |||||||||||||||||||||||||||||
| December 31, | December 31, | December 31, | ended September 30, | |||||||||||||||||||||||||||||
| (in thousands) | 2003 | 2004 | 2005 | 2004 | 2005 | 2006 | 2006 | 2007 | ||||||||||||||||||||||||
| (unaudited) | (unaudited) | |||||||||||||||||||||||||||||||
Other financial data: | ||||||||||||||||||||||||||||||||
| Net cash provided by (used in) operations | $ | 84,264 | $ | 84,202 | $ | 93,162 | $ | (2,193 | ) | $ | 25,070 | $ | 112,181 | $ | 58,941 | $ | 102,932 | |||||||||||||||
| Net cash provided by (used in) investing | (31,823 | ) | (30,045 | ) | (35,611 | ) | (122,473 | ) | (61,902 | ) | (596,852 | ) | (537,930 | ) | (115,028 | ) | ||||||||||||||||
| Net cash provided by (used in) financing | (52,441 | ) | (54,157 | ) | (57,551 | ) | 125,322 | 45,358 | 476,611 | 469,807 | 30,842 | |||||||||||||||||||||
| Capital expenditures | 29,449 | 25,451 | 32,352 | 116,880 | 72,758 | 1,226,180 | 1,162,328 | 125,055 | ||||||||||||||||||||||||
| Chase Group Properties | Concho Resources Inc. | |||||||||||||||||||||||
| As of | ||||||||||||||||||||||||
| As of December 31, | As of December 31, | September 30, | ||||||||||||||||||||||
| (in thousands) | 2002 | 2003 | 2004 | 2005 | 2004 | 2005 | 2006 | 2007 | ||||||||||||||||
| (unaudited) | (unaudited) | (unaudited) | ||||||||||||||||||||||
Balance sheet data: | ||||||||||||||||||||||||
| Cash and cash equivalents | $ | — | $ | — | $ | — | $ | — | $ | 656 | $ | 9,182 | $ | 1,122 | $ | 19,868 | ||||||||
| Property and equipment, net | 126,956 | 133,547 | 135,568 | 149,042 | 115,455 | 170,583 | 1,320,655 | 1,368,026 | ||||||||||||||||
| Total assets | 135,973 | 141,860 | 145,100 | 161,792 | 130,717 | 232,385 | 1,390,072 | 1,443,507 | ||||||||||||||||
| Long-term debt, including current maturities | — | — | — | — | 53,000 | 72,000 | 495,500 | 345,880 | ||||||||||||||||
| Stockholders’ equity/net investment | 127,821 | 134,554 | 134,014 | 150,814 | 71,710 | 109,670 | 575,156 | 773,384 | ||||||||||||||||
| (1) | EBITDA is defined as net income, plus (1) interest, the amortization of related debt issuance costs and other financial costs, net of capitalized interest, (2) federal and state income taxes and (3) depreciation, depletion and accretion. See “Prospectus summary—Non-GAAP financial measures and reconciliations.” |
36
Table of Contents
| Period from | |||||||||
| January 1, 2004 | |||||||||
| Years ended | through | ||||||||
| December 31, | November 30, | ||||||||
| Statement of revenues and direct operating expenses data: (in thousands) | 2002 | 2003 | 2004 | ||||||
(unaudited) | |||||||||
| Revenues | $ | 25,753 | $ | 32,371 | $ | 34,663 | |||
| Direct operating expenses: | |||||||||
| Lease operating expense | 7,519 | 6,652 | 6,983 | ||||||
| Production tax expense | 1,597 | 2,023 | 2,159 | ||||||
| Other expenses | — | 435 | 461 | ||||||
| Total direct operating expenses | 9,116 | 9,110 | 9,603 | ||||||
| Revenues in excess of direct operating expenses | $ | 16,637 | $ | 23,261 | $ | 25,060 | |||
37
Table of Contents
38
Table of Contents
39
Table of Contents
| • | we closed the combination transaction on February 27, 2006 and properties were contributed to us by the Chase Group that represent approximately 76% of ourPV-10 as of December 31, 2006; |
| • | we incurred approximately $405 million of new indebtedness upon the initial closing of the combination transaction; |
| • | we entered into a $200.0 million second lien term loan facility on March 27, 2007, from which we received proceeds of $199.0 million that we used to repay the $39.8 million outstanding under our prior term loan facility, to reduce the outstanding balance under our revolving credit facility by $154.0 million and the remaining $5.2 million to pay loan fees, accrued interest and for general corporate purposes; |
| • | we received proceeds of $173.0 million from our initial public offering that was completed in August 2007 that we used to retire outstanding borrowings under our second lien term loan |
40
Table of Contents
| facility totaling $86.5 million and to retire outstanding borrowings under our revolving credit facility totaling $86.5 million; and |
| • | we have incurred additional general and administrative costs as a result of the expansion of our technical and administrative staffs and as a result of increased amounts of professional fees. |
41
Table of Contents
42
Table of Contents
| Inception (April 21, | Years ended | Nine months ended | |||||||||||||||||||||
| 2004) through | December 31, | September 30, | |||||||||||||||||||||
| (in thousands, except price data) | December 31, 2004 | 2005 | 2006 | 2006 | 2007 | ||||||||||||||||||
| (unaudited) | (unaudited) | ||||||||||||||||||||||
| Oil sales | $ | 1,851 | $ | 31,621 | $ | 131,773 | $ | 90,737 | $ | 128,152 | |||||||||||||
| Natural gas sales | 1,771 | 23,315 | 66,517 | 44,908 | 67,395 | ||||||||||||||||||
| Total operating revenues | 3,622 | 54,936 | 198,290 | 135,645 | 195,547 | ||||||||||||||||||
| Operating costs and expenses | 7,089 | 48,626 | 134,862 | 94,167 | 134,864 | ||||||||||||||||||
| Interest, net and other revenue | 104 | 2,317 | 29,381 | 20,091 | 28,846 | ||||||||||||||||||
| Income (loss) before income taxes | (3,571 | ) | 3,993 | 34,047 | 21,387 | 31,837 | |||||||||||||||||
| Income tax (expense) benefit | 915 | (2,039 | ) | (14,379 | ) | (8,664 | ) | (13,335 | ) | ||||||||||||||
Net income (loss) | $ | (2,656 | ) | $ | 1,954 | $ | 19,668 | $ | 12,723 | $ | 18,502 | ||||||||||||
Production volumes (unaudited): | |||||||||||||||||||||||
| Oil (MBbl) | 44.7 | 599.0 | 2,294.8 | 1,553.7 | 2,143.2 | ||||||||||||||||||
| Natural gas (MMcf) | 290.7 | 3,403.8 | 9,506.8 | 6,634.3 | 8,887.5 | ||||||||||||||||||
| Natural gas equivalent (MMcfe) | 559.1 | 6,997.7 | 23,275.4 | 15,956.2 | 21,746.9 | ||||||||||||||||||
Average prices (unaudited): | |||||||||||||||||||||||
| Oil, without hedges ($/Bbl) | $ | 41.37 | $ | 54.71 | $ | 60.47 | $ | 63.20 | $ | 61.36 | |||||||||||||
| Oil, with hedges ($/Bbl) | 41.37 | 52.79 | 57.42 | 58.40 | 59.79 | ||||||||||||||||||
| Natural gas, without hedges ($/Mcf) | 6.09 | 6.99 | 6.87 | 6.75 | 7.48 | ||||||||||||||||||
| Natural gas, with hedges ($/Mcf) | 6.09 | 6.85 | 7.00 | 6.77 | 7.58 | ||||||||||||||||||
| Natural gas equivalent, without hedges ($/Mcfe) | 6.48 | 8.08 | 8.77 | 8.96 | 9.10 | ||||||||||||||||||
| Natural gas equivalent, with hedges ($/Mcfe) | 6.48 | 7.85 | 8.52 | 8.50 | 8.99 | ||||||||||||||||||
43
Table of Contents
| • | average realized oil prices (after giving effect to hedging activities) increased 2% from $58.40 per Bbl during the nine months ended September 30, 2006 to $59.79 per Bbl during the nine months ended September 30, 2007; |
| • | average realized natural gas prices (after giving effect to hedging activities) increased 12% from $6.77 per Mcf during the nine months ended September 30, 2006 to $7.58 per Mcf during the nine months ended September 30, 2007; and |
| • | average realized natural gas equivalent prices (after giving effect to hedging activities) increased 6% from $8.50 per Mcfe during the nine months ended September 30, 2006 to $8.99 per Mcfe during the nine months ended September 30, 2007. |
| Crude Oil Hedges | Natural Gas Hedges | |||||||||||||||
| Nine months ended | Nine months ended | |||||||||||||||
| September 30, | September 30, | |||||||||||||||
| 2006 | 2007 | 2006 | 2007 | |||||||||||||
| (unaudited) | (unaudited) | (unaudited) | (unaudited) | |||||||||||||
| Hedging revenue increase (decrease) | $ | (7,456,000 | ) | $ | (3,347,000 | ) | $ | 114,000 | $ | 909,000 | ||||||
| Hedged volumes (Bbls and MMBtus, respectively) | 740,100 | 805,350 | 3,745,500 | 4,817,400 | ||||||||||||
| Hedged revenue increase (decrease) per hedged volume | $ | (10.07 | ) | $ | (4.16 | ) | $ | 0.03 | $ | 0.19 | ||||||
44
Table of Contents
45
Table of Contents
| Nine months ended | ||||||||
| September 30, | ||||||||
| (in thousands) | 2006 | 2007 | ||||||
| (unaudited) | (unaudited) | |||||||
| Geological and geophysical | $ | 1,513 | $ | 993 | ||||
| Exploratory dry holes | 3,172 | 16,222 | ||||||
| Leasehold abandonments and other | $ | 32 | 895 | |||||
| Total exploration and abandonments | $ | 4,717 | $ | 18,110 | ||||
46
Table of Contents
47
Table of Contents
48
Table of Contents
49
Table of Contents
50
Table of Contents
51
Table of Contents
52
Table of Contents
53
Table of Contents
54
Table of Contents
55
Table of Contents
56
Table of Contents
| Drilling and recompletion opportunities in our core operating area | $ | 135.2 | |
| Projects in our emerging plays | 28.9 | ||
| Projects operated by third parties | 14.2 | ||
| Acquisition of leasehold acreage and other property interests | 4.7 | ||
| Total 2007 exploration and development budget | $ | 183.0 | |
| Drilling and recompletion opportunities in our core operating area | $ | 209.5 | |
| Projects operated by third parties | 14.3 | ||
| Emerging plays, acquisition of leasehold acreage and other property interests, and geological and geophysical | 20.0 | ||
| Maintenance capital in our core operating areas | 6.6 | ||
| Total 2008 exploration and development budget | $ | 250.4 | |
57
Table of Contents
58
Table of Contents
59
Table of Contents
| Aggregate | ||||||||||||||||||||
| Fair Market Value | remaining | Daily | Index | Contract | ||||||||||||||||
| Asset / (Liability) | volume | volume | price | period | ||||||||||||||||
| (In thousands) | ||||||||||||||||||||
| Cash flow hedges: | ||||||||||||||||||||
| Crude oil (volumes in Bbls): | ||||||||||||||||||||
| Price collar | $ | (2,278 | ) | 59,800 | 650 | $ | 37.95 - $41.75(a | ) | 10/1/07 - 12/31/07 | |||||||||||
| Price swap | (2,570 | ) | 211,600 | 2,300 | $ | 67.85(a | ) | 10/1/07 - 12/31/07 | ||||||||||||
| Price swap | (7,668 | ) | 951,600 | 2,600 | $ | 67.50(a | ) | 1/1/08 - 12/31/08 | ||||||||||||
| Cash flow hedges dedesignated: | ||||||||||||||||||||
| Natural gas (volumes in MMBtus): | ||||||||||||||||||||
| Price collar | 735 | 1,472,000 | 16,000 | $ | 5.98 - $9.75(b | )(c) | 10/1/07 - 12/31/07 | |||||||||||||
| Price collar | 1,740 | 4,941,000 | 13,500 | $ | 6.50 - $9.35(b | ) | 1/1/08 - 12/31/08 | |||||||||||||
| Price swap | 257 | 193,200 | 2,100 | $ | 7.40(b | ) | 10/1/07 - 12/31/07 | |||||||||||||
| Derivatives not designated as cash flow hedges: | ||||||||||||||||||||
| Crude oil (volumes in Bbls): | ||||||||||||||||||||
| Price swap | (33 | ) | 732,000 | 2,000 | $ | 75.78(a | )(c) | 1/1/08 - 12/31/08 | ||||||||||||
| Price swap | 71 | 730,000 | 2,000 | $ | 72.84(a | )(c) | 1/1/09 - 12/31/09 | |||||||||||||
| Net liability | $ | (9,746 | ) | |||||||||||||||||
| (a) | The index prices for the oil price collars and price swaps are based on the NYMEX-West Texas Intermediate monthly average futures price. | |
| (b) | The index prices for the natural gas price collars and price swaps are based on the Inside FERC-El Paso Permian Basin first-of-the-month spot price. | |
| (c) | Amounts disclosed represent weighted average prices. |
60
Table of Contents
| Payments due by period | |||||||||||||||
| Less than | 1 - 3 | 3 - 5 | More than | ||||||||||||
| (In thousands) | Total | 1 year | years | years | 5 years | ||||||||||
Long-term debt(a) | $ | 346,400 | $ | 2,000 | $ | 238,000 | $ | 106,400 | $ | — | |||||
Operating lease obligation(b) | 2,952 | 462 | 953 | 993 | 544 | ||||||||||
Daywork drilling contracts(c) | 18,410 | 18,410 | — | — | — | ||||||||||
Employment agreements with executive officers(d) | 2,828 | 1,700 | 1,128 | — | — | ||||||||||
Asset retirement obligations(e) | 7,277 | 1,005 | 144 | 213 | 5,915 | ||||||||||
| Total contractual cash obligations | $ | 377,867 | $ | 23,577 | $ | 240,225 | $ | 107,606 | $ | 6,459 | |||||
| (a) | See Note J—Long-term debtto our consolidated financial statements. | |
| (b) | Operating lease obligation is for office space. | |
| (c) | Consists of daywork drilling contracts related to five drilling rigs contracted for a portion of 2007 and a portion of 2008. See Note K -Commitments and contingenciesto our consolidated financial statements. | |
| (d) | Represents amounts of cash compensation we are obligated to pay to our executive officers under employment agreements assuming such employees continue to serve the entire term of their employment agreement and their cash compensation is not adjusted in the discretion of the board of directors. | |
| (e) | Amounts represent costs related to expected oil and gas property abandonments related to proved reserves by period, net of any future accretion. |
61
Table of Contents
62
Table of Contents
63
Table of Contents
64
Table of Contents
65
Table of Contents
| Years ended December 31, | ||||||
| (in thousands, except price data) | 2004 | 2005 | ||||
| Oil sales | $ | 66,529 | $ | 73,132 | ||
| Natural gas sales | 41,247 | 46,546 | ||||
| Total operating revenues | 107,776 | 119,678 | ||||
| Oil and gas production | 11,762 | 12,979 | ||||
| Oil and gas production taxes | 9,202 | 10,298 | ||||
| Depreciation, depletion and amortization | 20,196 | 18,646 | ||||
| Impairments of proved properties | 3,233 | 194 | ||||
| Exploration and abandonments | 179 | — | ||||
| Accretion of discount on asset retirement obligations | 263 | 446 | ||||
| General and administrative | 1,387 | 1,702 | ||||
| Loss on derivatives not designated as hedges | 7,936 | 1,062 | ||||
| Total operating costs and expenses | 54,158 | 45,327 | ||||
| Revenues in excess of expenses | $ | 53,618 | $ | 74,351 | ||
Production volumes (unaudited): | ||||||
| Oil (MBbl) | 1,751 | 1,429 | ||||
| Natural gas (MMcf) | 7,636 | 6,636 | ||||
| Natural gas equivalents (Mcfe) | 18,142 | 15,210 | ||||
Average prices (unaudited): | ||||||
| Oil ($/Bbl) | $ | 37.99 | $ | 51.17 | ||
| Natural gas ($/Mcf) | 5.40 | 7.01 | ||||
| Natural gas equivalents ($/Mcfe) | 5.94 | 7.87 | ||||
66
Table of Contents
67
Table of Contents
68
Table of Contents
| Nine months | ||||||||||||||||||
| As of | ended | |||||||||||||||||
| December 31, 2006 | September 30, | |||||||||||||||||
| Pro forma | 2007 | |||||||||||||||||
| Total | reserve/ | Average | ||||||||||||||||
| proved | production | Identified | Identified | net daily | ||||||||||||||
| reserves | PV-10 | index(1) | drilling | recompletion | production | |||||||||||||
| Areas | (Bcfe) | ($ in millions) | (years) | locations(2) | projects(2) | (MMcfe/d) | ||||||||||||
| Permian Basin | ||||||||||||||||||
| Southeast New Mexico | 387.5 | $ | 782.6 | 18.7 | 1,505 | 489 | 63.5 | |||||||||||
| West Texas | 70.2 | 154.5 | 15.5 | 148 | 49 | 13.1 | ||||||||||||
Emerging Plays and Other(3) | 9.1 | 16.9 | 19.2 | 23 | 2 | 3.1 | ||||||||||||
| Total | 466.8 | $ | 954.0 | 18.1 | 1,676 | 540 | 79.7 | |||||||||||
| (1) | The pro forma reserve/production index is the number of years proved reserves would last assuming current production continued at the same rate. This index is calculated by dividing pro forma production during the year ended December 31, 2006, into the proved reserve quantity as of December 31, 2006. Pro forma production during the year ended December 31, 2006 was 25,735.0 MMcfe, consisting of 20,734.0 MMcfe in the Southeast New Mexico part of the Permian Basin, 4,526.5 MMcfe in the West Texas part of the Permian Basin and 474.5 MMcfe in Emerging Plays and Other. Pro forma production information assumes the combination transaction had taken place on January 1, 2006. | |
| (2) | The identified drilling locations and identified recompletion projects listed in the table above included 817 drilling locations and recompletion projects for which proved reserves had been included in our reserve reports as of December 31, 2006. | |
| (3) | Information with respect to “Other” includes conventional oil and gas operations on properties that are not located in the Permian Basin. As of December 31, 2006, 3.1 Bcfe of the proved reserves and $5.4 million of thePV-10, as well as one of the identified drilling locations and two identified recompletion projects, were related to oil and natural gas properties categorized as “Other” and not as “Emerging Plays.” In addition, as of September 30, 2007, 39,668 gross (28,573 net) acres reflected above were categorized as “Other,” and 1.1 MMcfe/d of the average daily production during the nine months ended September 30, 2007 reflected above were categorized as “Other.” |
| • | the Northwest Shelf area in Southeast New Mexico, where we have tested one re-entry well and drilled thirteen wells targeting the Wolfcamp Carbonate; |
| • | the Central Basin Platform of West Texas, where we plan to target the Woodford Shale; |
| • | the Delaware Basin of West Texas, where we have drilled four exploratory wells targeting the Bone Spring, Atoka, Barnett and Woodford Shales; |
| • | the North Dakota portion of the Williston Basin, where we have participated in the drilling of four exploratory wells targeting the Bakken Shale; and |
69
Table of Contents
| • | the eastern Arkoma Basin in Arkansas, where we plan to drill our first test well in 2008, which will target the Fayetteville Shale. |
| • | Exploit our multi-year project inventory. We believe our multi-year drilling and exploitation inventory will allow us to grow our proved reserves and production for the next several years. As of December 31, 2006, we had identified 2,216 drilling locations and recompletion projects on our existing properties, including step-out drilling, infill drilling (including well deepening opportunities), workovers and recompletions. |
| • | Enhance production from our existing properties through development of additional producing horizons and enhanced recovery methods. We believe there are additional productive horizons underlying certain of our existing producing horizons in Southeast New Mexico that have not been fully developed. During 2006, we accelerated an evaluation, which had begun in late 2005, of the Blinebry interval, which lies below the primary producing interval under our core properties in Southeast New Mexico. During 2006, we drilled 52 wells in the Blinebry interval, all of which have since been completed as producers. At December 31, 2006, the wells in the Blinebry interval which had been drilled and completed and were producing only from the Blinebry interval were producing an average of 80 Bbl and 176 Mcf per well per day. During the nine months ended September 30, 2007, we drilled 58 Blinebry wells, of which 46 were completed as producers, 11 were awaiting completion as of September 30, 2007 and 1 was a dry hole. We intend to drill an additional 30 wells in the fourth quarter of 2007 to further evaluate the Blinebry interval. In addition, in September 2007 we began injecting water on our pilot waterflood covering approximately 160 acres in the Paddock interval of the Yeso formation. |
| • | Pursue the acquisition, exploration and development of unconventional emerging oil and natural gas resource plays. We have assembled an exploration team to target unconventional emerging resource plays where we can acquire large undeveloped acreage positions and apply horizontal drilling, advanced fracture stimulation and enhanced recovery technologies to achieve economic, repeatable production results. Members of our technical staff, consisting of seven petroleum engineers, seven geoscientists and ten landmen, have, on average, more than 23 years experience in the industry. As of September 30, 2007, we had accumulated 205,898 gross (99,769 net) acres in five unconventional emerging resource plays, and our technical team is focused on exploring, developing and exploiting these resource plays as well as evaluating and acquiring acreage in similar plays in North America. |
| • | Make opportunistic acquisitions that meet our strategic and financial objectives. We seek to acquire oil and gas properties that we believe complement our existing properties in our core |
70
Table of Contents
| • | Experienced and incentivized management team. Our executive officers average over 19 years of experience in the oil and gas industry, having led both public and private oil and natural gas exploration and production companies. These companies have had substantially all of their operations in our core area of the Permian Basin and were headquartered in Midland, Texas, which is located in the heart of the Permian Basin. Our executive officers beneficially own an aggregate of 4.5% of our outstanding common stock as of November 20, 2007, which aligns their objectives with those of our stockholders. |
| • | History of growth and capital efficiency. During the year ended December 31, 2006, we increased our total estimated net proved reserves by approximately 51 Bcfe from 416 Bcfe as of December 31, 2005, on a pro forma basis, to 467 Bcfe as of December 31, 2006, and produced approximately 26 Bcfe of oil and natural gas on a pro forma basis. In addition, following the formation of our company, we increased our average net daily production from 62 MMcfe during March 2006 to 80 MMcfe during September 2007. The increase in reserves and production during the year ended December 31, 2006 was primarily attributable to our successful drilling program in the Permian Basin. Despite increasing costs of oilfield services and equipment in our areas of operation, we added 101 Bcfe of proved reserves in 2006 through new discoveries and extensions, excluding revisions of previous estimates at a total cost of $193.3 million. |
| • | Large inventory of drilling and recompletion opportunities. Following the formation of our company, we drilled 140 gross wells in 2006, of which 125 gross wells were completed as producers, and 10 wells were dry holes. During the nine months ended September 30, 2007, we drilled 75 wells, of which 59 were completed as producers, 14 were awaiting completion as of September 30, 2007 and 2 were dry holes. In addition, following the formation of our company, we recompleted 103 wells in 2006, 98% of which were productive. During the nine months ended September 30, 2007, we recompleted 78 wells, of which 75 were completed as producers and 3 were dry holes. As of December 31, 2006, we had identified 1,676 undrilled well locations on our acreage, with proved undeveloped reserves attributed to 595 of such locations, and 540 recompletion opportunities, with proved reserves attributed to 222 of such opportunities. We plan to drill an additional 40 wells and recomplete an additional 36 wells during the fourth quarter of 2007. |
| • | Geographically concentrated operations. Our current operations are focused in the Permian Basin of Southeast New Mexico and West Texas, where 99% of our proved reserves are located. Our geographic concentration allows us to establish economies of scale with respect to drilling, production, operating and administrative costs, in addition to further leveraging our base of technical expertise in this region. |
71
Table of Contents
| • | Significant operational control. As of December 31, 2006, we operated 916 wells on properties which comprised 89% of ourPV-10. As of September 30, 2007, we operated 987 wells. Additionally, as of December 31, 2006, approximately 72% of our identified drilling locations and recompletion projects were associated with properties we operate. Our high proportion of operated properties enables us to exercise a significant level of control over the amount and timing of expenses, capital allocation and other aspects of exploration and development. |
72
Table of Contents
| Natural | ||||||||||||||||||
| Oil wells | gas wells | Total wells | ||||||||||||||||
| Gross | Net | Gross | Net | Gross | Net | |||||||||||||
| Permian Basin: | ||||||||||||||||||
| Southeast New Mexico | 1,281 | 783.8 | 186 | 54.8 | 1,467 | 838.6 | ||||||||||||
| West Texas | 424 | 137.7 | 66 | 10.9 | 490 | 148.6 | ||||||||||||
| Emerging Plays and Other | 7 | 2.2 | 43 | 7.4 | 50 | 9.6 | ||||||||||||
| Total | 1,712 | 923.7 | 295 | 73.1 | 2,007 | 996.8 | ||||||||||||
73
Table of Contents
| Developed acres | Undeveloped acres | Total acres | ||||||||||||||||
| Gross | Net | Gross | Net | Gross | Net | |||||||||||||
| Permian Basin: | ||||||||||||||||||
| Southeast New Mexico | 108,968 | 54,208 | 61,067 | 21,398 | 170,035 | 75,606 | ||||||||||||
| West Texas | 76,705 | 25,502 | 14,842 | 8,856 | 91,547 | 34,358 | ||||||||||||
Emerging Plays and Other(1) | 18,858 | 7,787 | 226,708 | 120,556 | 245,566 | 128,343 | ||||||||||||
| Total | 204,531 | 87,497 | 302,617 | 150,810 | 507,148 | 238,307 | ||||||||||||
| (1) | The following table sets forth gross and net acreage as of September 30, 2007 for each of our five emerging resource plays and our plays categorized as “Other” included in “Emerging Plays and Other.” |
| Total acres | ||||||
| Gross | Net | |||||
| Southeast New Mexico | 56,828 | 23,445 | ||||
| Central Basin Platform | 22,925 | 22,155 | ||||
| Western Delaware Basin | 68,814 | 22,794 | ||||
| Williston Basin of North Dakota | 40,309 | 16,923 | ||||
| Arkoma Basin of Arkansas | 17,022 | 14,452 | ||||
| Total Emerging Plays | 205,898 | 99,769 | ||||
| Other | 39,668 | 28,573 | ||||
| Total Emerging Plays and Other | 245,566 | 128,342 | ||||
| 2007 | 2008 | 2009 | ||||||||||||||||
| Gross | Net | Gross | Net | Gross | Net | |||||||||||||
| Permian Basin: | ||||||||||||||||||
| Southeast New Mexico | 5,805 | 2,876 | 23,696 | 7,490 | 8,601 | 3,423 | ||||||||||||
| West Texas | 3,991 | 2,072 | 14,155 | 3,200 | 2,726 | 1,975 | ||||||||||||
Emerging Plays and Other(1) | 37,341 | 30,449 | 11,358 | 2,766 | 39,111 | 16,045 | ||||||||||||
| Total | 47,137 | 35,397 | 49,209 | 13,456 | 50,438 | 21,443 | ||||||||||||
| (1) | In the Delaware Basin shale play in Culberson and Reeves Counties, Texas, we have the option to extend the expiration terms by two additional years on leases covering approximately 1,000 net acres whose original primary term expires between January and May 2008. Should we elect to exercise these extensions, our net cost would be approximately $80,000. |
74
Table of Contents
| Inception (April 21, | Nine months | |||||||||||||||||||||||
| 2004) through | Years ended December 31, | ended | ||||||||||||||||||||||
| December 31, 2004 | 2005 | 2006 | September 30, 2007 | |||||||||||||||||||||
| Gross | Net | Gross | Net | Gross | Net | Gross | Net | |||||||||||||||||
| Development wells | ||||||||||||||||||||||||
| Productive | 2.0 | 1.0 | 61.0 | 23.5 | 93.0 | 57.8 | 34.0 | 20.6 | ||||||||||||||||
| Dry | 2.0 | 1.0 | 3.0 | 1.7 | 7.0 | 2.4 | — | — | ||||||||||||||||
| Exploratory wells | ||||||||||||||||||||||||
| Productive | 3.0 | 1.5 | 8.0 | 2.2 | 37.0 | 25.4 | 37.0 | 34.4 | ||||||||||||||||
| Dry | 1.0 | 0.7 | 3.0 | 1.4 | 3.0 | 0.8 | 4.0 | 2.4 | ||||||||||||||||
| Total wells | ||||||||||||||||||||||||
| Productive | 5.0 | 2.5 | 69.0 | 25.7 | 130.0 | 83.2 | 71.0 | 55.0 | ||||||||||||||||
| Dry | 3.0 | 1.7 | 6.0 | 3.1 | 10.0 | 3.2 | 4.0 | 2.4 | ||||||||||||||||
| Total | 8.0 | 4.2 | 75.0 | 28.8 | 140.0 | 86.4 | 75.0 | 57.4 | ||||||||||||||||
75
Table of Contents
| Oil (MBbl) | Gas (MMcf) | Total (MMcfe) | PV-10 ($MM) | |||||||||
| Proved developed producing | 21,032 | 101,544 | 227,736 | $ | 619.0 | |||||||
| Proved developed non-producing | 2,411 | 10,879 | 25,345 | 52.1 | ||||||||
| Proved undeveloped | 20,879 | 88,395 | 213,669 | 282.9 | ||||||||
| Total proved | 44,322 | 200,818 | 466,750 | $ | 954.0 | |||||||
Standardized measure of discounted future net cash flows(1) | $710.3 | |||||||||||
| (1) | Standardized measure of discounted future net cash flows is computed by applying year-end prices, costs and a discount factor of 10 percent to net proved reserves, taking into account the effect of future income taxes. |
| Total | Percent of | ||||||||||||||
| Oil (MBbl) | Gas (MMcf) | (MMcfe) | total | PV-10 ($MM) | |||||||||||
| Permian Basin: | |||||||||||||||
| Southeast New Mexico | 35,084 | 177,005 | 387,509 | 83% | $ | 782.6 | |||||||||
| West Texas | 8,887 | 16,843 | 70,165 | 15% | 154.5 | ||||||||||
| Emerging Plays and Other | 351 | 6,970 | 9,076 | 2% | 16.9 | ||||||||||
| Total | 44,322 | 200,818 | 466,750 | 100% | $ | 954.0 | |||||||||
| Inception | ||||||||||||||||||
| (April 21, | ||||||||||||||||||
| 2004) | Pro forma | |||||||||||||||||
| through | Years ended | year ended | Nine months ended | |||||||||||||||
| December 31, | December 31, | December 31, | September 30, | |||||||||||||||
| 2004 | 2005 | 2006 | 2006 | 2006 | 2007 | |||||||||||||
| (unaudited) | (unaudited) | |||||||||||||||||
Net production volumes: | ||||||||||||||||||
| Oil (MBbl) | 44.7 | 599.0 | 2,294.8 | 2,539.6 | 1,553.7 | 2,143.2 | ||||||||||||
| Natural gas (MMcf) | 290.7 | 3,403.8 | 9,506.8 | 10,497.6 | 6,634.3 | 8,887.5 | ||||||||||||
| Natural gas equivalent (MMcfe) | 559.1 | 6,997.7 | 23,275.4 | 25,735.0 | 15,956.2 | 21,746.9 | ||||||||||||
76
Table of Contents
| Inception | ||||||||||||||||||
| (April 21, | ||||||||||||||||||
| 2004) | Pro forma | |||||||||||||||||
| through | Years ended | year ended | Nine months ended | |||||||||||||||
| December 31, | December 31, | December 31, | September 30, | |||||||||||||||
| 2004 | 2005 | 2006 | 2006 | 2006 | 2007 | |||||||||||||
| (unaudited) | (unaudited) | |||||||||||||||||
Average prices: | ||||||||||||||||||
| Oil, without hedges ($/Bbl) | $ | 41.37 | $ | 54.71 | $ | 60.47 | $ | 60.13 | $ | 63.20 | $ | 61.36 | ||||||
| Oil, with hedges ($/Bbl) | $ | 41.37 | $ | 52.79 | $ | 57.42 | $ | 57.38 | $ | 58.40 | $ | 59.79 | ||||||
| Natural gas, without hedges ($/Mcf) | $ | 6.09 | $ | 6.99 | $ | 6.87 | $ | 6.94 | $ | 6.75 | $ | 7.48 | ||||||
| Natural gas, with hedges ($/Mcf) | $ | 6.09 | $ | 6.85 | $ | 7.00 | $ | 7.05 | $ | 6.77 | $ | 7.58 | ||||||
| Natural gas equivalent, without hedges ($/Mcfe) | $ | 6.48 | $ | 8.08 | $ | 8.77 | $ | 8.76 | $ | 8.96 | $ | 9.10 | ||||||
| Natural gas equivalent, with hedges ($/Mcfe) | $ | 6.48 | $ | 7.85 | $ | 8.52 | $ | 8.54 | $ | 8.50 | $ | 8.99 | ||||||
Operating costs and expenses: | ||||||||||||||||||
| Oil and gas production ($/Mcfe) | $ | 0.92 | $ | 1.56 | $ | 0.95 | $ | 0.95 | $ | 0.91 | $ | 1.03 | ||||||
| Oil and gas production taxes ($/Mcfe) | $ | 0.42 | $ | 0.53 | $ | 0.68 | $ | 0.66 | $ | 0.68 | $ | 0.72 | ||||||
| General and administrative ($/Mcfe) | $ | 5.52 | $ | 1.15 | $ | 0.54 | $ | 0.50 | $ | 0.50 | $ | 0.64 | ||||||
| Depreciation and depletion expense ($/Mcfe) | $ | 1.71 | $ | 1.64 | $ | 2.61 | $ | 2.57 | $ | 2.64 | $ | 2.53 | ||||||
| Pro forma average | ||||||||||||||||||
| daily production— | Average daily production— | |||||||||||||||||
| for the year ended | for the nine months ended | |||||||||||||||||
| December 31, 2006 | September 30, 2007 | |||||||||||||||||
| Bbl | Mcf | Mcfe | Bbl | Mcf | Mcfe | |||||||||||||
| Permian Basin | ||||||||||||||||||
| Southeast New Mexico | 5,465 | 23,950 | 56,740 | 6,034 | 27,306 | 63,510 | ||||||||||||
| West Texas | 1,451 | 3,722 | 12,428 | 1,629 | 3,290 | 13,064 | ||||||||||||
| Emerging Plays and Other | 40 | 1,088 | 1,328 | 187 | 1,960 | 3,082 | ||||||||||||
| Total | 6,956 | 28,760 | 70,496 | 7,850 | 32,556 | 79,656 | ||||||||||||
77
Table of Contents
78
Table of Contents
79
Table of Contents
80
Table of Contents
81
Table of Contents
82
Table of Contents
83
Table of Contents
84
Table of Contents
85
Table of Contents
| • | require the acquisition of various permits before drilling commences; |
86
Table of Contents
| • | restrict the types, quantities and concentration of various substances that can be released into the environment in connection with oil and natural gas drilling and production, and saltwater disposal activities; | |
| • | limit or prohibit drilling activities on certain lands lying within wilderness, wetlands and other protected areas; and | |
| • | require remedial measures to mitigate pollution from former and ongoing operations, such as requirements to close pits and plug abandoned wells. |
87
Table of Contents
88
Table of Contents
89
Table of Contents
90
Table of Contents
91
Table of Contents
92
Table of Contents
| Name | Age | Title | |||
| Timothy A. Leach | 47 | Chairman of the Board, Chief Executive Officer and Director | |||
| Steven L. Beal | 48 | President, Chief Operating Officer and Director | |||
| David W. Copeland | 50 | Vice President, General Counsel and Secretary | |||
| Curt F. Kamradt | 45 | Vice President, Chief Financial Officer and Treasurer | |||
| David M. Thomas III | 53 | Vice President—Exploration and Land | |||
| E. Joseph Wright | 47 | Vice President—Engineering and Operations | |||
| Jack F. Harper | 36 | Vice President—Business Development and Capital Markets | |||
| Tucker S. Bridwell | 56 | Director | |||
| W. Howard Keenan, Jr. | 56 | Director | |||
| Ray M. Poage | 60 | Director | |||
| A. Wellford Tabor | 39 | Director | |||
93
Table of Contents
94
Table of Contents
95
Table of Contents
96
Table of Contents
| • | attract individuals with the skills necessary for us to execute our business plan; |
97
Table of Contents
| • | motivate and reward executive officers whose knowledge, skills and performance are critical to our success; |
| • | align the interests of our named executive officers and stockholders with the performance of our company on both a short-term and long-term basis; and |
| • | retain those individuals who continue to perform at or above the levels that we expect. |
98
Table of Contents
99
Table of Contents
100
Table of Contents
101
Table of Contents
102
Table of Contents
| All other | |||||||||||||||
| Name and principal position | Salary(1) | Bonus | Option awards(2) | compensation(3) | Total | ||||||||||
| Timothy A. Leach | $ | 333,333 | $ | — | $ | 603,840 | $ | 34,124 | $ | 971,297 | |||||
Chairman and Chief Executive Officer | |||||||||||||||
| Steven L. Beal | 333,333 | — | 603,840 | 18,395 | 955,568 | ||||||||||
President and Chief Operating Officer | |||||||||||||||
| David W. Copeland | 233,333 | — | 375,905 | 17,951 | 627,189 | ||||||||||
Vice President—General Counsel and Secretary | |||||||||||||||
| Curt F. Kamradt | 233,333 | — | 375,905 | 13,883 | 623,121 | ||||||||||
Vice President, Chief Financial Officer and Treasurer | |||||||||||||||
| E. Joseph Wright | 233,333 | — | 375,905 | 14,055 | 623,293 | ||||||||||
Vice President—Engineering and Operations | |||||||||||||||
| David M. Thomas III | 233,333 | — | 324,649 | 15,753 | 573,735 | ||||||||||
Vice President—Exploration and Land | |||||||||||||||
| (1) | From January 1, 2006 until the completion of the combination transaction on February 27, 2006, our named executive officers received compensation as officers of Concho Equity Holdings Corp., our predecessor for accounting purposes. For their service as named executive officers of our company from February 28, 2006 through December 31, 2006, Messrs. Leach and Beal each earned $283,333 and Messrs. Copeland, Kamradt, Wright and Thomas each earned $200,000. | |
| (2) | The amounts in this column represent the dollar amount recognized for financial statement reporting purposes with respect to the fiscal year computed in accordance with SFAS No. 123R. Please see Note H of the notes to our consolidated financial statements for a discussion of all assumptions made in determining the grant date fair values. The stock option grants are |
103
Table of Contents
| comprised of grants on February 23, 2006 and June 12, 2006. Grants made on February 23, 2006 were made under the stock option plan dated August 13, 2004, as amended and restated as of February 27, 2006. Grants made on June 12, 2006 were made under the 2006 Stock Incentive Plan dated June 1, 2006. Options granted February 23, 2006 vest at the end of three years commencing on the first anniversary of the date of grant. Options granted on June 12, 2006 vest as to1/4 of the shares underlying the option on each of the first four anniversaries of the grant date. Option awards reported for Mr. Leach are comprised of $461,520 for options granted February 23, 2006 and $142,320 for options granted June 12, 2006. Options awards reported for Mr. Beal are comprised of $461,520 for options granted February 23, 2006 and $142,320 for options granted June 12, 2006. Options awards reported for Mr. Kamradt are comprised of $205,121 for options granted February 23, 2006 and $170,784 for options granted June 12, 2006. Options awards reported for Mr. Copeland are comprised of $205,121 for options granted February 23, 2006 and $170,784 for options granted June 12, 2006. Option awards reported for Mr. Thomas are comprised of $96,938 for options granted February 23, 2006 and $227,711 for options granted June 12, 2006. Options awards reported for Mr. Wright are comprised of $205,121 for options granted February 23, 2006 and $170,784 for options granted June 12, 2006. | ||
| (3) | All other compensation reported for Mr. Leach represents a $14,987 matching contribution by our company to our 401(k) Plan, of which $12,615 was for the period from February 28, 2006 through December 31, 2006; $55 for life insurance premiums, of which $46 was for the period from February 28, 2006 through December 31, 2006; and $19,082 for personal use of our company’s airplane, of which $16,646 was for the period from February 28, 2006 through December 31, 2006. All other compensation reported for Mr. Beal represents a $14,998 matching contribution by our company to our 401(k) Plan, of which $12,616 was for the period from February 28, 2006 through December 31, 2006; $55 for life insurance premiums, of which $46 was for the period from February 28, 2006 through December 31, 2006; and $3,342 for personal use of our company’s airplane, all of which was for the period from February 28, 2006 through December 31, 2006. All other compensation reported for Mr. Kamradt represents a $13,828 matching contribution by our company to our 401(k) Plan, of which $11,828 was for the period from February 28, 2006 through December 31, 2006 and $55 for life insurance premiums, of which $46 was for the period from February 28, 2006 through December 31, 2006. All other compensation reported for Mr. Copeland represents a $14,000 matching contribution by our company to our 401(k) Plan, of which $12,000 was for the period from February 28, 2006 through December 31, 2006; $55 for life insurance premiums, of which $46 was for the period from February 28, 2006 through December 31, 2006; and $3,896 for personal use of our company’s airplane, of which $2,320 was for the period from February 28, 2006 through December 31, 2006. All other compensation reported for Mr. Thomas represents a $14,000 matching contribution by our company to our 401(k) Plan, of which $12,000 was for the period from February 28, 2006 through December 31, 2006; $55 for life insurance premiums, of which $46 was for the period from February 28, 2006 through December 31, 2006; and $1,698 for personal use of our company’s airplane, all of which was for the period from February 28, 2006 through December 31, 2006. All other compensation reported for Mr. Wright represents a $14,000 matching contribution by our company to our 401(k) Plan, of which $12,000 was for the period from February 28, 2006 through December 31, 2006 and $55 for life insurance premiums, of which $46 was for the period from February 28, 2006 through December 31, 2006. |
104
Table of Contents
| Estimated | |||||||||||||||||
| fair market | |||||||||||||||||
| value of | |||||||||||||||||
| Number of | Exercise | common | Grant date | ||||||||||||||
| securities | price of | stock on | fair value | ||||||||||||||
| underlying | option | date of | of option | ||||||||||||||
| Name | Grant date | options | awards | grant(3) | awards | ||||||||||||
| Timothy A. Leach | February 23, 2006 | 130,928 | (1) | $ | 8.00 | (1) | $ | 11.52 | $ | 568,896 | |||||||
| June 12, 2006 | 62,500 | (2) | 12.00 | (2) | 15.40 | 493,750 | |||||||||||
| Steven L. Beal | February 23, 2006 | 130,928 | (1) | 8.00 | (1) | 11.52 | 568,896 | ||||||||||
| June 12, 2006 | 62,500 | (2) | 12.00 | (2) | 15.40 | 493,750 | |||||||||||
| David W. Copeland | February 23, 2006 | 58,190 | (1) | 8.00 | (1) | 11.52 | 252,842 | ||||||||||
| June 12, 2006 | 75,000 | (2) | 12.00 | (2) | 15.40 | 592,500 | |||||||||||
| Curt F. Kamradt | February 23, 2006 | 58,190 | (1) | 8.00 | (1) | 11.52 | 252,842 | ||||||||||
| June 12, 2006 | 75,000 | (2) | 12.00 | (2) | 15.40 | 592,500 | |||||||||||
| E. Joseph Wright | February 23, 2006 | 58,190 | (1) | 8.00 | (1) | 11.52 | 252,842 | ||||||||||
| June 12, 2006 | 75,000 | (2) | 12.00 | (2) | 15.40 | 592,500 | |||||||||||
| David M. Thomas III | February 23, 2006 | 27,500 | (1) | 8.00 | (1) | 11.52 | 119,491 | ||||||||||
| June 12, 2006 | 100,000 | (2) | 12.00 | (2) | 15.40 | 790,000 | |||||||||||
| (1) | On February 23, 2006, each of our named executive officers received a stock option grant as an executive officer of Concho Equity Holdings Corp., our predecessor for accounting purposes. Upon completion of the combination transaction, each outstanding option to purchase shares of Concho Equity Holdings Corp. was converted into an option to purchase 1.25 shares of our common stock at an exercise price of $8.00 per share. The number of securities underlying the option award is shown as converted to our common stock. For each of these options, 78% of the total award originally became vested and exercisable on February 27, 2006 and the remaining 22% originally would have become exercisable on February 27, 2009. On November 16, 2007, we entered into an amendment to these option awards in order to cause these option awards to constitute deferred compensation that is compliant with Section 409A of the Internal Revenue Code of 1986, as amended, or exempt them from the application of Section 409A. This amendment provides that 19.50%, 19.50%, 7.33%, 26.83% and 26.84% of these options will become first exercisable on January 1, 2008, January 1, 2009, February 27, 2009, January 1, 2010 and January 1, 2011, respectively. Upon the occurrence of each of these exercise dates, the applicable portion of the stock option will remain exercisable until the last day of the named executive officer’s taxable year in which such exercise date occurs. These options also become exercisable in the event of (i) a separation of service from our company by the named executive officer for reasons such as death, disability or reasons other than cause or (ii) a change of control of our company. | |
| (2) | Each of these options become exercisable as to 1/4 of the shares underlying the option on each of the first four anniversaries of the grant date commencing June 12, 2007. These options also contain provisions that provide for accelerated vesting upon the occurrence of certain events following a change of control of our company, as discussed below in “—Option exercises in the last fiscal year—Employment, severance and change of control arrangements.” On November 16, 2007, we entered into an amendment to these option awards in order to cause these option awards to constitute deferred compensation that is compliant with Section 409A or exempt them from the application of Section 409A. This amendment increased the exercise price of these option awards to $15.40 per share. On November 19, 2007, we issued to each of the named executive officers an award of a number of shares of restricted stock equal to (i) the product of $3.40 and the number of shares of common stock subject to these options issued to such named executive officer, divided by (ii) $18.38, which was the mean of the high and low sales price of a share of our common stock on November 19, 2007. The shares of restricted stock vest in 25% increments on each of January 1, 2008, June 12, 2008, June 12, 2009 and June 12, 2010. | |
| (3) | The estimated fair market value of common stock on date of grant represents the per share dollar amount recognized for financial statement reporting purposes with respect to the fiscal year computed in accordance with SFAS No. 123R. |
105
Table of Contents
| Number of securities | Exercise | ||||||||||||||||
| underlying unexercised | price of | Option | |||||||||||||||
| options(1) | option | expiration | |||||||||||||||
| Name | Grant date | Exercisable | Unexercisable | awards | date | ||||||||||||
| Timothy A. Leach | August 13, 2004 | 69,630 | (2) | 19,639 | (2) | $8.00 | (2) | August 13, 2014 | |||||||||
| December 6, 2004 | 108,158 | (2) | 30,506 | (2) | 8.00 | (2) | December 6, 2014 | ||||||||||
| July 15, 2005 | 46,420 | (2) | 13,093 | (2) | 8.00 | (2) | June 15, 2015 | ||||||||||
| December 30, 2005 | 69,630 | (2) | 19,639 | (2) | 8.00 | (2) | December 30, 2015 | ||||||||||
| February 23, 2006 | 102,124 | (2) | 28,804 | (2) | 8.00 | (2) | February 23, 2016 | ||||||||||
| June 12, 2006 | 62,500 | (3) | 12.00 | (4) | June 12, 2016 | ||||||||||||
| Steven L. Beal | August 13, 2004 | 69,630 | (2) | 19,639 | (2) | $8.00 | (2) | August 13, 2014 | |||||||||
| December 6, 2004 | 108,158 | (2) | 30,506 | (2) | 8.00 | (2) | December 6, 2014 | ||||||||||
| July 15, 2005 | 46,420 | (2) | 13,093 | (2) | 8.00 | (2) | July 15, 2015 | ||||||||||
| December 30, 2005 | 69,630 | (2) | 19,639 | (2) | 8.00 | (2) | December 30, 2015 | ||||||||||
| February 23, 2006 | 102,124 | (2) | 28,804 | (2) | 8.00 | (2) | February 23, 2016 | ||||||||||
| June 12, 2006 | 62,500 | (3) | 12.00 | (4) | June 12, 2016 | ||||||||||||
| David W. Copeland | August 13, 2004 | 30,947 | (2) | 8,729 | (2) | 8.00 | (2) | August 13, 2014 | |||||||||
| December 6, 2004 | 48,071 | (2) | 13,559 | (2) | 8.00 | (2) | December 6, 2014 | ||||||||||
| July 15, 2005 | 20,631 | (2) | 5,819 | (2) | 8.00 | (2) | July 15, 2015 | ||||||||||
| December 30, 2005 | 30,947 | (2) | 8,729 | (2) | 8.00 | (2) | December 30, 2015 | ||||||||||
| February 23, 2006 | 45,388 | (2) | 12,802 | (2) | 8.00 | (2) | February 23, 2016 | ||||||||||
| June 12, 2006 | 75,000 | (3) | 12.00 | (4) | June 12, 2016 | ||||||||||||
| Curt F. Kamradt | August 13, 2004 | 30,947 | (2) | 8,729 | (2) | 8.00 | (2) | August 13, 2014 | |||||||||
| December 6, 2004 | 48,071 | (2) | 13,559 | (2) | 8.00 | (2) | December 6, 2014 | ||||||||||
| July 15, 2005 | 20,631 | (2) | 5,819 | (2) | 8.00 | (2) | July 15, 2015 | ||||||||||
| December 30, 2005 | 30,947 | (2) | 8,729 | (2) | 8.00 | (2) | December 30, 2015 | ||||||||||
| February 23, 2006 | 45,388 | (2) | 12,802 | (2) | 8.00 | (2) | February 23, 2016 | ||||||||||
| June 12, 2006 | 75,000 | (3) | 12.00 | (4) | June 12, 2016 | ||||||||||||
| E. Joseph Wright | August 13, 2004 | 30,947 | (2) | 8,729 | (2) | 8.00 | (2) | August 13, 2014 | |||||||||
| December 6, 2004 | 48,071 | (2) | 13,559 | (2) | 8.00 | (2) | December 6, 2014 | ||||||||||
| July 15, 2005 | 20,631 | (2) | 5,819 | (2) | 8.00 | (2) | July 15, 2015 | ||||||||||
| December 30, 2005 | 30,947 | (2) | 8,729 | (2) | 8.00 | (2) | December 30, 2015 | ||||||||||
| February 23, 2006 | 45,388 | (2) | 12,802 | (2) | 8.00 | (2) | February 23, 2016 | ||||||||||
| June 12, 2006 | 75,000 | (3) | 12.00 | (4) | June 12, 2016 | ||||||||||||
| David M. Thomas III | April 15, 2005 | 37,343 | (2) | 10,533 | (2) | 8.00 | (2) | April 15, 2015 | |||||||||
| July 15, 2005 | 9,750 | (2) | 2,750 | (2) | 8.00 | (2) | July 15, 2015 | ||||||||||
| December 30, 2005 | 14,625 | (2) | 4,125 | (2) | 8.00 | (2) | December 30, 2015 | ||||||||||
| February 23, 2006 | 21,450 | (2) | 6,050 | (2) | 8.00 | (2) | February 23, 2016 | ||||||||||
| June 12, 2006 | 100,000 | (3) | 12.00 | (4) | June 12, 2016 | ||||||||||||
| (1) | These options contain provisions that provide for accelerated vesting upon the occurrence of certain events following a change of control of our company, as discussed below in “—Option exercises in the last fiscal year—Employment, severance and change of control arrangements.” | |
| (2) | Prior to the completion of the combination transaction on February 27, 2006, Concho Equity Holdings Corp, our predecessor for accounting purposes, made awards of stock options to our named executive officers. Upon completion of the combination transaction, each outstanding option to purchase shares of Concho Equity Holdings Corp. was converted into an option to purchase 1.25 shares of our common stock at an exercise price of $8.00 per share. The number of securities underlying the option award is shown as converted to our common stock. For each of these options, 78% of the total award originally became vested and exercisable on February 27, 2006 and the remaining 22% originally would have become exercisable on February 27, 2009. On November 16, 2007, we entered into an amendment to these option awards in order to cause these option awards to constitute deferred compensation that is compliant with Section 409A of the Internal Revenue Code of 1986, as amended, or exempt them from the application of Section 409A. This amendment provides that 19.50%, 19.50%, |
106
Table of Contents
| 7.33%, 26.83% and 26.84% of these options will become first exercisable on January 1, 2008, January 1, 2009, February 27, 2009, January 1, 2010 and January 1, 2011, respectively. Upon the occurrence of each of these exercise dates, the applicable portion of the stock option will remain exercisable until the last day of the named executive officer’s taxable year in which such exercise date occurs. These options also become exercisable in the event of (i) a separation of service from our company by the named executive officer for reasons such as death, disability or reasons other than cause or (ii) a change of control of our company. | ||
| (3) | These options will vest in one-fourth increments on each anniversary of the grant date, commencing on June 12, 2007. | |
| (4) | On November 16, 2007, we entered into an amendment to these option awards in order to cause these option awards to constitute deferred compensation that is compliant with Section 409A or exempt them from the application of Section 409A. This amendment increased the exercise price of these option awards to $15.40 per share. On November 19, 2007, we issued to each of the named executive officers an award of a number of shares of restricted stock equal to (i) the product of $3.40 and the number of shares of common stock subject to these options issued to such named executive officer, divided by (ii) $18.38, which was the mean of the high and low sales price of a share of our common stock on November 19, 2007. The shares of restricted stock vest in 25% increments on each of January 1, 2008, June 12, 2008, June 12, 2009 and June 12, 2010. |
107
Table of Contents
108
Table of Contents
| Termination of employment by our company without | ||||||||
| “cause” (and not by reason of death or disability) or | ||||||||
| resignation following a “change in duties” | ||||||||
| Prior to, or more than two | Within two years after a | |||||||
| Name | years after a change of control | change of control | ||||||
| Timothy A. Leach | $ | 368,173(1 | ) | $ | 1,436,080(2 | ) | ||
| Steven L. Beal | 368,173(1 | ) | 1,436,080(2 | ) | ||||
| David W. Copeland | 268,173(3 | ) | 1,107,816(4 | ) | ||||
| Curt F. Kamradt | 268,173(3 | ) | 1,107,816(4 | ) | ||||
| E. Joseph Wright | 268,173(3 | ) | 1,107,816(4 | ) | ||||
| David M. Thomas III | 268,173(3 | ) | 1,177,460(4 | ) | ||||
| (1) | Includes payment of $350,000 for the continuation of salary and $18,173 for continuation of health benefits for a period of 12 months following such termination. | |
| (2) | Includes payment of $700,000 in a lump sum payment for salary, $27,259 for continuation of health benefits for a period of 18 months following such termination and $708,821 for accelerated vesting of equity awards, based on the grant date fair value of unvested stock options as of December 31, 2006 in accordance with the provisions of Statement of Financial Accounting Standards (“SFAS”) No. 123R, “Share-based Payment.” | |
| (3) | Includes payment of $250,000 for the continuation of salary and $18,173 for continuation of health benefits for a period of 12 months following such termination. | |
| (4) | Includes payment of $500,000 in a lump sum payment for salary, $27,259 for continuation of health benefits for a period of 18 months following such termination and $580,557 for accelerated vesting of equity awards for Messrs. Copeland, Kamradt and Wright and $650,201 for accelerated vesting of equity awards for Mr. Thomas, based on the grant date fair value of unvested stock options as of December 31, 2006 in accordance with the provisions of Statement of Financial Accounting Standards (“SFAS”) No. 123R, “Share-based Payment.” |
109
Table of Contents
| • | an annual retainer of $35,000; |
| • | a meeting attendance fee of $1,000 for each board meeting attended; |
| • | a committee meeting attendance fee of $500 for each board committee meeting attended; |
| • | a one-time award to each new Outside Director of 5,000 shares of restricted stock under our 2006 Stock Incentive Plan; and |
| • | on an annual basis, commencing with the second year of service, an award of 2,500 shares of restricted stock under our long-term incentive plan. |
| Name(1) | Fees | Stock Awards(2) | Total | ||||||
| Tucker S. Bridwell | $ | 17,166 | $ | 77,000 | $ | 94,166 | |||
W. Howard Keenan, Jr.(3) | 15,666 | 77,000 | 92,666 | ||||||
A. Wellford Tabor(4) | 17,166 | 77,000 | 94,166 | ||||||
G. Carl Everett(5) | 17,666 | 77,000 | 94,666 | ||||||
Larry V. Kalas(5) | 16,666 | 77,000 | 93,666 | ||||||
John A. Knorr(5) | 13,666 | 77,000 | 90,666 | ||||||
Bradley D. Bartek(5) | 14,666 | 77,000 | 91,666 | ||||||
Robert C. Chase(5) | 13,666 | 77,000 | 90,666 | ||||||
| (1) | Our employee directors have been omitted from this table because they receive no compensation for serving on our board of directors. | |
| (2) | The grant date fair value of the equity award computed in accordance with FAS 123R for each director reflected in the column below was $77,000. As of December 31, 2006, each director held 5,000 restricted stock awards in the aggregate and no option awards. | |
| (3) | Mr. Keenan remits all fees received as director compensation to Yorktown Energy Partners V, L.P. and Yorktown Energy Partners VI, L.P. and holds all securities received as director compensation for the benefit of those entities. Mr. Keenan disclaims beneficial ownership of all such securities as well as those held by those entities, except to the extent of his pecuniary interest therein. | |
| (4) | Mr. Tabor remits all fees received as director compensation to Wachovia Capital Partners (“WCP”) and holds all securities received as director compensation for the benefit of WCP. Mr. Tabor disclaims beneficial ownership of all such securities as well as those held by WCP and its affiliates, except to the extent of his pecuniary interest therein. | |
| (5) | Messrs. Everett, Kalas, Knorr, Bartek and Chase each resigned as a director on April 23, 2007. |
110
Table of Contents
| • | in cash; |
| • | if the option agreement so provides, by a “cashless exercise,” in accordance with procedures approved by the compensation committee; or |
| • | if the option agreement so provides, by delivery of a number of shares of common stock (plus cash if necessary) having a fair market value equal to the option price. |
111
Table of Contents
| • | the substitution of similar options with respect to the stock of the successor company; |
| • | the acceleration of the vesting of all or any portion of certain awards; or |
| • | the mandatory surrender to us by selected participants of some or all of the outstanding awards held by such participants, at which time we will cancel such awards and cause to be paid to each affected participant a certain amount of cash per share, as specified in the 2006 Stock Incentive Plan. |
| • | amend the 2006 Stock Incentive Plan to increase the maximum aggregate number of shares that may be issued under the 2006 Stock Incentive Plan; or |
| • | increase the maximum number of shares that may be issued under the 2006 Stock Incentive Plan through incentive stock options or change the class of individuals eligible to receive awards under the 2006 Stock Incentive Plan. |
112
Table of Contents
113
Table of Contents
| • | each person who will beneficially own more than 5% of our common stock then outstanding; |
| • | each of our named executive officers; |
| • | each of our directors; |
| • | all of our directors and executive officers as a group; and |
| • | each selling stockholder. |
| Shares beneficially | |||||||||||||||
| Shares beneficially | owned | ||||||||||||||
| owned | Number of | after this | |||||||||||||
| prior to the offering | shares | offering(1)(2) | |||||||||||||
| Name of beneficial owner | Number | % of class | offered | Number | % of class | ||||||||||
Chase Oil Corporation(3)(8) | 22,621,995 | 29.8% | |||||||||||||
Caza Energy LLC(4)(6)(8) | 2,019,402 | 2.7% | |||||||||||||
Richard L. Chase(5) | 1,011,715 | 1.3% | |||||||||||||
Robert C. Chase(6) | 3,643,638 | 4.8% | |||||||||||||
Gerene Dianne Chase Ferguson(7) | 746,800 | * | |||||||||||||
Mack C. Chase(8) | 24,641,397 | 32.5% | |||||||||||||
Yorktown Energy Partners V, L.P.(9) | 3,167,226 | 4.2% | — | 3,167,226 | 4.2% | ||||||||||
Yorktown Energy Partners VI, L.P.(9) | 7,502,774 | 9.9% | — | 7,502,774 | 9.9% | ||||||||||
Timothy A. Leach(10)(14) | 1,075,928 | 1.4% | — | 1,075,928 | 1.4% | ||||||||||
Steven L. Beal(10)(14) | 1,064,787 | 1.4% | — | 1,064,787 | 1.4% | ||||||||||
David W. Copeland(10)(14) | 494,896 | * | — | 494,896 | * | ||||||||||
Curt F. Kamradt(10)(14) | 399,896 | * | |||||||||||||
David M. ThomasIII(10)(14) | 68,811 | * | — | 68,811 | * | ||||||||||
E. Joseph Wright(10)(14) | 354,896 | * | — | 354,896 | * | ||||||||||
Tucker S. Bridwell(11)(14) | 727,220 | * | — | 727,220 | * | ||||||||||
W. Howard Keenan, Jr.(12)(14) | 10,670,000 | 14.1% | — | 10,670,000 | 14.1% | ||||||||||
A. Wellford Tabor(13)(14) | 7,500 | * | — | 7,500 | * | ||||||||||
Ray M. Poage(14) | 5,000 | * | — | 5,000 | * | ||||||||||
All directors and executive officers as a group (11 persons)(10)(11)(12)(13) | 14,873,670 | 19.5% | — | ||||||||||||
114
Table of Contents
| * | Less than 1%. |
| (1) | Assumes no exercise of the underwriters’ over-allotment option to purchase an aggregate of shares, granted by . | |
| (2) | Based upon an aggregate of 75,833,972 shares outstanding as of November 20, 2007. | |
| (3) | The address of Chase Oil Corporation is P.O. Box 1767, Artesia, NM 88211-1767. The directors of Chase Oil Corporation are Mack C. Chase, Robert C. Chase and Rebecca S. Ericson. | |
| (4) | The address of Caza Energy LLC is P.O. Box 1767, Artesia, NM 88211-1767. The managers of Caza Energy LLC are Mack C. Chase and Robert C. Chase. | |
| (5) | The address of Richard L. Chase is P.O. Box 359, Artesia, NM 88211-0359. | |
| (6) | Robert C. Chase directly owns 1,624,236 shares of common stock. Robert C. Chase is the beneficial owner of the shares owned by Caza Energy LLC, of which Robert C. Chase is a Manager and therefore shares voting and investment power with respect to the shares owned by Caza Energy LLC. Robert C. Chase disclaims beneficial ownership in the shares held by Caza Energy LLC except to the extent of his pecuniary interest in Caza Energy LLC. The address of Robert C. Chase is P.O. Box 297, Artesia, NM 88211-0297. | |
| (7) | The address of Ms. Ferguson is P.O. Box 693, Artesia, NM 88211-0693. | |
| (8) | Mack C. Chase is the beneficial owner of the shares owned by Caza Energy LLC, of which Mack C. Chase is a Manager and therefore shares voting and investment power with respect to the shares owned by Caza Energy LLC. Mack C. Chase disclaims beneficial ownership in the shares held by Caza Energy LLC except to the extent of his pecuniary interest in Caza Energy LLC. Mack C. Chase owns a majority of the voting stock of Chase Oil Corporation and therefore may be deemed to have voting and investment power with respect to the shares owned by Chase Oil Corporation. Mack C. Chase disclaims beneficial ownership in the shares owned by Chase Oil Corporation except to the extent of his pecuniary interest in Chase Oil Corporation. The address of Mack C. Chase is P.O. Box 693, Artesia, NM 88211-0693. | |
| (9) | The address of Yorktown Energy Partners V, L.P. and Yorktown Energy Partners VI, L.P. is 410 Park Avenue, 19th Floor, New York, NY 10022. Includes 2,226 shares and 5,274 shares owned by Yorktown Energy Partners V, L.P. and Yorktown Energy Partners VI, L.P., respectively, received by W. Howard Keenan, Jr. as director compensation for the benefit of those entities. | |
| (10) | The number of shares beneficially owned includes the following shares that are subject to options that were exercisable as of or will become exercisable within 60 days of, November 20, 2007: |
| Shares subject | |||
| Name of beneficial owner | to options | ||
| Timothy A. Leach | 166,838 | ||
| Steven L. Beal | 166,838 | ||
| David W. Copeland | 85,957 | ||
| Curt F. Kamradt | 85,957 | ||
| David M. Thomas III | 45,793 | ||
| E. Joseph Wright | 85,957 | ||
| (11) | Includes 426,500 shares of common stock owned by the Mansfeldt Concho Partners and 293,220 shares owned by the Dian Graves Owen Foundation. | |
| (12) | Includes 10,662,500 shares of common stock owned by Yorktown Energy Partners V, L.P. and Yorktown Energy Partners VI, L.P. W. Howard Keenan, Jr. is a member and a manager of the general partner of Yorktown Energy Partners V, L.P. and Yorktown Energy Partners VI, L.P. and holds all securities received as director compensation for the benefit of those entities. Mr. Keenan disclaims beneficial ownership of all such securities as well as those held by Yorktown Energy Partners V, L.P. and Yorktown Energy Partners VI, L.P., except to the extent of his pecuniary interest therein. | |
| (13) | Mr. Tabor is a member of Wachovia Capital Partners (“WCP”) and holds all securities received as director compensation for the benefit of WCP. Mr. Tabor disclaims beneficial ownership of all such securities as well as those held by WCP and its affiliates, except to the extent of his pecuniary interest therein. | |
| (14) | Executive officer or director of our company. |
115
Table of Contents
116
Table of Contents
117
Table of Contents
| Activity | Activity | ||||||||
| with vendor | with vendor | ||||||||
| prior to the | subsequent to the | Total | |||||||
| the combination | the combination | amount of | |||||||
Name of Vendor | transaction | transaction | expenditures | ||||||
| (in thousands) | |||||||||
| Alliance Drillings Fluids, LLC | $ | — | $ | 778 | $ | 778 | |||
| Arrowhead Pipe & Supply Co. | — | 13,566 | 13,566 | ||||||
| Catalyst Oilfield Services LLC | — | 890 | 890 | ||||||
| Deer Horn Aviation Ltd. Co. | 67 | 240 | 307 | ||||||
| Production Specialty Services, Inc. | 57 | 960 | 1,017 | ||||||
| Silver Oak Drilling, LLC | — | 13,097 | 13,097 | ||||||
| Total | $ | 124 | $ | 29,531 | $ | 29,655 | |||
| Total | |||
| amount of | |||
Name of Vendor | expenditures | ||
| (in thousands) | |||
| Alliance Drillings Fluids, LLC | $ | 875 | |
| Arrowhead Pipe & Supply Co. | — | ||
| Catalyst Oilfield Services LLC | 1,536 | ||
| Deer Horn Aviation Ltd. Co. | 330 | ||
| Production Specialty Services, Inc. | 14,634 | ||
| Silver Oak Drilling, LLC | 15,117 | ||
| Total | $ | 32,492 | |
118
Table of Contents
| As of December 31, 2006 | As of April 23, 2007 | ||||||||||||
| Aggregate | Aggregate | ||||||||||||
| principal | Accrued | principal | Accrued | ||||||||||
Name of executive officer | amount | interest | amount | interest | |||||||||
| Timothy A. Leach | $ | 2,392,665 | $ | 224,953 | $ | 2,392,665 | $ | 268,091 | |||||
| Steven L. Beal | 2,392,665 | 224,953 | 2,392,665 | 268,091 | |||||||||
| David W. Copeland | 1,063,415 | 99,980 | 1,063,415 | 119,153 | |||||||||
| Curt F. Kamradt | 1,063,415 | 99,978 | 1,063,415 | 119,151 | |||||||||
| David M. Thomas III | 1,450,100 | 117,600 | 1,450,100 | 143,745 | |||||||||
| E. Joseph Wright | 1,063,415 | 99,980 | 1,063,415 | 119,153 | |||||||||
119
Table of Contents
120
Table of Contents
| • | restricting dividends on the common stock; |
121
Table of Contents
| • | diluting the voting power of the common stock; | |
| • | impairing the liquidation rights of the common stock; and | |
| • | delaying or preventing a change in control of our company. |
122
Table of Contents
123
Table of Contents
| • | any business opportunity that is brought to the attention of a Designated Party solely in such person’s capacity as a director or officer of our company and with respect to which, at the time of such presentment, no other Designated Party has independently received notice or otherwise identified such opportunity; or |
| • | any business opportunity that is identified by a Designated Party solely through the disclosure of information by or on behalf of us. |
| • | for any breach of the director’s duty of loyalty to us or our stockholders; |
| • | for acts or omissions not in good faith or which involve intentional misconduct or a knowing violation of laws; |
| • | for unlawful payment of a dividend or unlawful stock purchase or stock redemption; and |
| • | for any transaction from which the director derived an improper personal benefit. |
124
Table of Contents
| • | before such date, the board of directors of the corporation approved either the business combination or the transaction that resulted in the stockholder becoming an interested holder; |
| • | upon completion of the transaction that resulted in the stockholder becoming an interested stockholder, the interested stockholder owned at least 85% of the voting stock of the corporation outstanding at the time the transaction began, excluding for purposes of determining the voting stock outstanding (but not the outstanding voting stock owned by the interested stockholder) those shares owned (1) by persons who are directors and also officers and (2) employee stock plans in which employee participants do not have the right to determine confidentially whether shares held subject to the plan will be tendered in a tender or exchange offer; or |
| • | on or after such date, the business combination is approved by the board of directors and authorized at an annual or special meeting of the stockholders, and not by written consent, by the affirmative vote of at least 662/3% of the outstanding voting stock that is not owned by the interested stockholder. |
| • | any merger or consolidation involving the corporation and the interested stockholder; |
| • | any sale, transfer, pledge or other disposition (in one transaction or a series of transactions) of 10% or more of the assets of the corporation involving the interested stockholder; |
| • | subject to certain exceptions, any transaction that results in the issuance or transfer by the corporation of any stock of the corporation to the interested stockholder; |
| • | any transaction involving the corporation that has the effect of increasing the proportionate share of the stock or any class or series of the corporation beneficially owned by the interested stockholder; or |
| • | the receipt by the interested stockholder of the benefit of any loss, advances, guarantees, pledges or other financial benefits by or through the corporation. |
125
Table of Contents
126
Table of Contents
| • | an individual citizen or resident of the United States, including an alien individual who is a lawful permanent resident of the United States or meets the “substantial presence” test under section 7701(b)(3) of the Internal Revenue Code of 1986, as amended (the “Code”); |
| • | a corporation (or an entity treated as a corporation for U.S. federal income tax purposes) created or organized in the United States or under the laws of the United States, any state thereof, or the District of Columbia; |
| • | a partnership (or an entity treated as a partnership for U.S. federal income tax purposes); |
| • | an estate, the income of which is subject to U.S. federal income tax regardless of its source; or |
| • | a trust, if a U.S. court can exercise primary supervision over the administration of the trust and one or more U.S. persons can control all substantial decisions of the trust, or certain other trusts that have a valid election to be treated as a U.S. person pursuant to the applicable Treasury Regulations. |
127
Table of Contents
| • | the gain is effectively connected with a trade or business carried on by theNon-U.S. Holder within the United States (and, where an income tax treaty applies, is attributable to a U.S. permanent establishment of theNon-U.S. Holder); |
| • | theNon-U.S. Holder is an individual who is present in the United States for 183 days or more in the taxable year of disposition and certain other conditions are met; or |
| • | we are or have been a “United States real property holding corporation” for U.S. federal income tax purposes and, provided our common stock is regularly traded on an established securities market, the Non-U.S. Holder holds or has held more than five percent of our common stock during specified periods as described below. |
128
Table of Contents
129
Table of Contents
130
Table of Contents
| Name | Number of shares | ||
| J.P. Morgan Securities Inc. | |||
| Banc of America Securities LLC | |||
| Total | |||
| Without | With full | |||||||
| overallotment | overallotment | |||||||
| exercise | exercise | |||||||
| Per share | $ | $ | ||||||
| Total | $ | $ | ||||||
131
Table of Contents
132
Table of Contents
133
Table of Contents
134
Table of Contents
135
Table of Contents
| Bbl | One stock tank barrel, of 42 U.S. gallons liquid volume, used herein in reference to crude oil, condensate or natural gas liquids. | |
| Bcfe | One billion cubic feet of natural gas equivalent using the ratio of one barrel of crude oil, condensate or natural gas liquids to six Mcf of natural gas. | |
| Basin | A large natural depression on the earth’s surface in which sediments accumulate. | |
| Dry hole | A well found to be incapable of producing hydrocarbons in sufficient quantities such that proceeds from the sale of such production would exceed production expenses, taxes and the royalty burden. | |
| Exploitation | A drilling or other project which may target proven or unproven reserves (such as probable or possible reserves), but which generally is reasonably expected to have lower risk. | |
| Field | An area consisting of a single reservoir or multiple reservoirs all grouped on, or related to, the same individual geological structural feature or stratigraphic condition. The field name refers to the surface area, although it may refer to both the surface and the underground productive formations. | |
| Gross wells | Are the number of wells in which a working interest is owned and net wells are the total of our fractional working interests owned in gross wells. | |
| Horizontal drilling | A drilling technique used in certain formations where a well is drilled vertically to a certain depth and then drilled at a high angle to vertical (which can be greater than 90 degrees) in order to stay within a specified interval. | |
| Infill wells | Wells drilled into the same pool as known producing wells so that oil or natural gas does not have to travel as far through the formation. | |
| MBbl | One thousand barrels of crude oil, condensate or natural gas liquids. | |
| Mcf | One thousand cubic feet of natural gas. | |
| Mcfe | One thousand cubic feet of natural gas equivalent. | |
| MMBbl | One million barrels of crude oil, condensate or natural gas liquids. | |
| MMBtu | One million British thermal units. | |
| MMcf | One million cubic feet of natural gas. | |
| MMcfe | One million cubic feet of natural gas equivalent. | |
| NYMEX | The New York Mercantile Exchange. |
136
Table of Contents
| Net acres | The percentage of total acres an owner owns out of a particular number of acres within a specified tract. An owner who has 50% interest in 100 acres owns 50 net acres. | |
| Net revenue interest | A working interest owner’s gross working interest in production, less the related royalty, overriding royalty, production payment, and net profits interests. | |
| PV-10 | When used with respect to oil and natural gas reserves,PV-10 means the estimated future gross revenue to be generated from the production of proved reserves, net of estimated production and future development and abandonment costs, using prices and costs in effect at the determination date, before income taxes, and without giving effect to non-property-related expenses, discounted to a present value using an annual discount rate of 10% in accordance with the guidelines of the SEC. | |
| Primary recovery | The period of production in which oil and natural gas is produced from its reservoir through the wellbore without enhanced recovery technologies, such as water flooding or gas injection. | |
| Proved developed reserves | Has the meaning given to such term inRule 4-10(a)(3) ofRegulation S-X, which defines proved developed reserves as: | |
| Proved developed oil and gas reserves are reserves that can be expected to be recovered through existing wells with existing equipment and operating methods. Additional oil and gas expected to be obtained through the application of fluid injection or other improved recovery techniques for supplementing the natural forces and mechanisms of primary recovery should be included as proved developed reserves only after testing by a pilot project or after the operation of an installed program has confirmed through production response that increased recovery will be achieved. | ||
| Proved reserves | Has the meaning given to such term inRule 4-10(a)(2) ofRegulation S-X, which defines proved reserves as: | |
| Proved oil and gas reserves are the estimated quantities of crude oil, natural gas, and natural gas liquids which geological and engineering data demonstrate with reasonable certainty to be recoverable in future years from known reservoirs under existing economic and operating conditions, i.e., prices and costs as of the date the estimate is made. Prices include consideration of changes in existing prices provided only by contractual arrangements, but not on escalations based upon future conditions. | ||
(i) Reservoirs are considered proved if economic producibility is supported by either actual production or conclusive formation test. The area of a reservoir considered proved includes (A) that portion delineated by drilling and defined by gas-oiland/or oil-water contacts, if any, and (B) the immediately adjoining |
137
Table of Contents
| portions not yet drilled, but which can be reasonably judged as economically productive on the basis of available geological and engineering data. In the absence of information on fluid contacts, the lowest known structural occurrence of hydrocarbons controls the lower proved limit of the reservoir. | ||
| (ii) Reserves which can be produced economically through application of improved recovery techniques (such as fluid injection) are included in the proved classification when successful testing by a pilot project, or the operation of an installed program in the reservoir, provides support for the engineering analysis on which the project or program was based. | ||
| (iii) Estimates of proved reserves do not include the following: (A) Oil that may become available from known reservoirs but is classified separately as indicated additional reserves; (B) crude oil, natural gas, and natural gas liquids, the recovery of which is subject to reasonable doubt because of uncertainty as to geology, reservoir characteristics, or economic factors; (C) crude oil, natural gas, and natural gas liquids, that may occur in undrilled prospects; and (D) crude oil, natural gas, and natural gas liquids, that may be recovered from oil shales, coal, gilsonite and other such sources. | ||
| Proved undeveloped reserves | Has the meaning given to such term inRule 4-10(a)(4) ofRegulation S-X, which defines proved undeveloped reserves as: | |
| Proved undeveloped oil and gas reserves are reserves that are expected to be recovered from new wells on undrilled acreage, or from existing wells where a relatively major expenditure is required for recompletion. Reserves on undrilled acreage shall be limited to those drilling units offsetting productive units that are reasonably certain of production when drilled. Proved reserves for other undrilled units can be claimed only where it can be demonstrated with certainty that there is continuity of production from the existing productive formation. Under no circumstances should estimates for proved undeveloped reserves be attributable to any acreage for which an application of fluid injection or other improved recovery technique is contemplated, unless such techniques have been proved effective by actual tests in the area and in the same reservoir. | ||
| Recompletion | The addition of production from another interval or formation in an existing wellbore. | |
| Reservoir | A formation beneath the surface of the earth from which hydrocarbons may be present. Itsmake-up is sufficiently homogenous to differentiate it from other formations. | |
| Secondary recovery | The recovery of oil and gas through the injection of liquids or gases into the reservoir, supplementing its natural energy. Secondary |
138
Table of Contents
| recovery methods are often applied when production slows due to depletion of the natural pressure. | ||
| Seismic survey | Also known as a seismograph survey, is a survey of an area by means of an instrument which records the travel time of the vibrations of the earth. By recording the time interval between the source of the shock wave and the reflected or refracted shock waves from various formations, geophysicists are better able to define the underground configurations. | |
| Spacing | The distance between wells producing from the same reservoir. Spacing is expressed in terms of acres, e.g.,40-acre spacing, and is established by regulatory agencies. | |
| Standardized Measure | The present value (discounted at an annual rate of 10%) of estimated future net revenues to be generated from the production of proved reserves net of estimated income taxes associated with such net revenues, as determined in accordance with Statement of Financial Accounting Standards No. 69 (using prices and costs in effect as of the period end date) without giving effect to non-property related expenses such as indirect general and administrative expenses, and debt service or to depreciation, depletion and amortization. Standardized measure does not give effect to derivative transactions. | |
| Step-out drilling | The drilling of a well adjacent to existing production in an effort to expand the aerial extent of a known producing field. | |
| Undeveloped acreage | Acreage owned or leased on which wells can be drilled or completed to a point that would permit the production of commercial quantities of oil and natural gas regardless of whether such acreage contains proved reserves. | |
| Unit | The joining of all or substantially all interests in a reservoir or field, rather than single tracts, to provide for development and operation without regard to separate property interests. Also, the area covered by a unitization agreement. | |
| Wellbore | The hole drilled by the bit that is equipped for oil or gas production on a completed well. Also called well or borehole. | |
| Working interest | The right granted to the lessee of a property to explore for and to produce and own oil, gas, or other minerals. The working interest owners bear the exploration, development, and operating costs on either a cash, penalty, or carried basis. | |
| Workover | Operations on a producing well to restore or increase production. |
139
Table of Contents
| Page | ||||
Concho Resources Inc. (Historical): | ||||
| F-2 | ||||
| F-3 | ||||
| F-4 | ||||
| F-5 | ||||
| F-7 | ||||
| F-9 | ||||
Concho Resources Inc. (Pro-forma) (Unaudited): | ||||
| F-68 | ||||
| F-69 | ||||
| F-71 | ||||
Chase Group Properties: | ||||
| F-73 | ||||
| F-74 | ||||
| F-75 | ||||
| F-76 | ||||
| F-77 | ||||
| F-78 | ||||
Lowe Properties: | ||||
| F-90 | ||||
| F-91 | ||||
| F-92 | ||||
F-1
Table of Contents
F-2
Table of Contents
| December 31, | December 31, | September 30, | ||||||||||
| (in thousands, except share and per share data) | 2005 | 2006 | 2007 | |||||||||
| (unaudited) | ||||||||||||
Assets | ||||||||||||
| Current assets: | ||||||||||||
| Cash and cash equivalents | $ | 9,182 | $ | 1,122 | $ | 19,868 | ||||||
| Accounts receivable: | ||||||||||||
| Oil and gas | 14,040 | 27,304 | 24,793 | |||||||||
| Joint operations and other | 11,890 | 22,638 | 16,027 | |||||||||
| Related parties | 18,382 | 1,449 | — | |||||||||
| Derivative instruments | — | 6,013 | 1,658 | |||||||||
| Deferred income taxes | 3,006 | 82 | 3,625 | |||||||||
| Inventory | 1,018 | 1,309 | 1,404 | |||||||||
| Prepaid insurance and other | 1,674 | 3,848 | 3,618 | |||||||||
| Total current assets | 59,192 | 63,765 | 70,993 | |||||||||
| Property and equipment, at cost: | ||||||||||||
| Oil and gas properties, successful efforts method: | ||||||||||||
| Proved properties | 157,787 | 1,159,756 | 1,266,890 | |||||||||
| Unproved properties | 21,901 | 239,462 | 237,223 | |||||||||
| Accumulated depletion and depreciation | (14,336 | ) | (84,098 | ) | (142,981 | ) | ||||||
| Total oil and gas properties, net | 165,352 | 1,315,120 | 1,361,132 | |||||||||
| Other property and equipment, net | 5,231 | 5,535 | 6,894 | |||||||||
| Total property and equipment, net | 170,583 | 1,320,655 | 1,368,026 | |||||||||
| Deferred income taxes | 1,898 | — | — | |||||||||
| Deferred loan costs, net | 411 | 4,417 | 3,737 | |||||||||
| Other assets | 301 | 1,235 | 751 | |||||||||
| Total assets | $ | 232,385 | $ | 1,390,072 | $ | 1,443,507 | ||||||
Liabilities and stockholders’ equity | ||||||||||||
| Current liabilities: | ||||||||||||
| Accounts payable: | ||||||||||||
| Trade | $ | 5,897 | $ | 16,157 | $ | 7,583 | ||||||
| Related parties | — | 3,593 | 2,941 | |||||||||
| Other current liabilities: | ||||||||||||
| Revenue payable | 7,529 | 9,901 | 4,576 | |||||||||
| Accrued drilling costs | 10,493 | 17,051 | 27,633 | |||||||||
| Accrued interest | 684 | 8,004 | 1,755 | |||||||||
| Other accrued liabilities | 3,119 | 6,220 | 7,712 | |||||||||
| Derivative instruments | 9,307 | 6,224 | 10,303 | |||||||||
| Dividends payable | 1,410 | 87 | — | |||||||||
| Income taxes payable | — | — | 225 | |||||||||
| Chase Group unaccredited investors asset purchase obligation | — | 906 | — | |||||||||
| Contingent consideration | 1,824 | — | — | |||||||||
| Current portion of long-term debt | — | 400 | 2,000 | |||||||||
| Current asset retirement obligations | 83 | 1,958 | 1,005 | |||||||||
| Total current liabilities | 40,346 | 70,501 | 65,733 | |||||||||
| Long-term debt | 72,000 | 495,100 | 343,880 | |||||||||
| Noncurrent derivative instruments | 8,865 | — | 1,514 | |||||||||
| Deferred income taxes | — | 241,752 | 251,800 | |||||||||
| Asset retirement obligations and other long-term liabilities | 1,504 | 7,563 | 7,196 | |||||||||
| Commitments and contingencies (Note K) | ||||||||||||
| Stockholders’ equity: | ||||||||||||
| Series A preferred stock, $0.01 par value; 30,000,000 shares authorized; 12,959,096 shares issued and outstanding and 1,819,140 shares partially paid at December 31, 2005, and zero shares issued and outstanding at December 31, 2006 and September 30, 2007, respectively (aggregate liquidation value $116,632 at December 31, 2005) | 130 | — | — | |||||||||
| Preferred stock, $0.001 par value; 10,000,000 shares authorized; and zero shares issued and outstanding at December 31, 2005 and 2006 and September 30, 2007 | — | — | — | |||||||||
| Common stock, $0.001 par value; 30,000,000, 300,000,000 and 300,000,000 shares authorized; 8,141,918 and 59,092,830 and 75,750,517 shares issued and outstanding at December 31, 2005 and 2006 and September 30, 2007, respectively; and 1,080,261 shares partially paid at December 31, 2005, and zero shares partially paid at December 31, 2006 and September 30, 2007, respectively | 8 | 59 | 76 | |||||||||
| Additional paid-in capital | 135,876 | 575,389 | 751,680 | |||||||||
| Notes receivable from officers and employees | (9,012 | ) | (12,858 | ) | (2,488 | ) | ||||||
| Retained earnings (accumulated deficit) | (6,272 | ) | 12,152 | 30,609 | ||||||||
| Accumulated other comprehensive income (loss) | (11,060 | ) | 414 | (6,493 | ) | |||||||
| Total stockholders’ equity | 109,670 | 575,156 | 773,384 | |||||||||
| Total liabilities and stockholders’ equity | $ | 232,385 | $ | 1,390,072 | $ | 1,443,507 | ||||||
F-3
Table of Contents
| Inception | ||||||||||||||||||||
| (April 21, | Nine months | |||||||||||||||||||
| 2004) through | Year ended | ended | ||||||||||||||||||
| December 31, | December 31, | September 30, | ||||||||||||||||||
| (in thousands, except per share amounts) | 2004 | 2005 | 2006 | 2006 | 2007 | |||||||||||||||
| (unaudited) | (unaudited) | |||||||||||||||||||
| Operating revenues: | ||||||||||||||||||||
| Oil sales | $ | 1,851 | $ | 31,621 | $ | 131,773 | $ | 90,737 | $ | 128,152 | ||||||||||
| Natural gas sales | 1,771 | 23,315 | 66,517 | 44,908 | 67,395 | |||||||||||||||
| Total operating revenues | 3,622 | 54,936 | 198,290 | 135,645 | 195,547 | |||||||||||||||
Operating costs and expenses: | ||||||||||||||||||||
| Oil and gas production | 512 | 10,923 | 22,060 | 14,511 | 22,309 | |||||||||||||||
| Oil and gas production taxes | 234 | 3,712 | 15,762 | 10,831 | 15,616 | |||||||||||||||
| Exploration and abandonments | 1,850 | 2,666 | 5,612 | 4,717 | 18,110 | |||||||||||||||
| Depreciation and depletion | 956 | 11,485 | 60,722 | 42,170 | 55,036 | |||||||||||||||
| Accretion of discount on asset retirement obligations | 7 | 89 | 287 | 196 | 334 | |||||||||||||||
| Impairments of proved oil and gas properties | — | 2,295 | 9,891 | 5,762 | 4,577 | |||||||||||||||
| Contract drilling fees — stacked rigs | — | — | — | — | 4,269 | |||||||||||||||
| General and administrative (Including non-cash stock-based compensation of $1,128, $3,252, and $9,144 for the periods ended December 31, 2004, 2005 and 2006, respectively, and $8,041 and $2,656 for the nine months ended September 30, 2006 and 2007, respectively) | 4,214 | 11,307 | 21,721 | 16,044 | 16,567 | |||||||||||||||
| Ineffective portion of cash flow hedges | — | 1,148 | (1,193 | ) | (64 | ) | 1,134 | |||||||||||||
| (Gain) loss on derivatives not designated as hedges | (684 | ) | 5,001 | — | — | (3,088 | ) | |||||||||||||
| Total operating costs and expenses | 7,089 | 48,626 | 134,862 | 94,167 | 134,864 | |||||||||||||||
Income (loss) from operations | (3,467 | ) | 6,310 | 63,428 | 41,478 | 60,683 | ||||||||||||||
Other income (expense): | ||||||||||||||||||||
| Interest expense | (272 | ) | (3,096 | ) | (30,567 | ) | (20,998 | ) | (29,803 | ) | ||||||||||
| Other, net | 168 | 779 | 1,186 | 907 | 957 | |||||||||||||||
| Total other expense | (104 | ) | (2,317 | ) | (29,381 | ) | (20,091 | ) | (28,846 | ) | ||||||||||
Income (loss) before income taxes | (3,571 | ) | 3,993 | 34,047 | 21,387 | 31,837 | ||||||||||||||
| Income tax (expense) benefit | 915 | (2,039 | ) | (14,379 | ) | (8,664 | ) | (13,335 | ) | |||||||||||
Net income (loss) | (2,656 | ) | 1,954 | 19,668 | 12,723 | 18,502 | ||||||||||||||
| Preferred stock dividends | (804 | ) | (4,766 | ) | (1,244 | ) | (1,210 | ) | (45 | ) | ||||||||||
| Effect of induced conversion of preferred stock | — | — | 11,601 | 11,601 | — | |||||||||||||||
Net income (loss) applicable to common shareholders | $ | (3,460 | ) | $ | (2,812 | ) | $ | 30,025 | $ | 23,114 | $ | 18,457 | ||||||||
Basic earnings (loss) per share: | ||||||||||||||||||||
| Net income (loss) per share | $ | (3.48 | ) | $ | (0.70 | ) | $ | 0.63 | $ | 0.52 | $ | 0.30 | ||||||||
| Shares used in basic earnings (loss) per share | 994 | 4,059 | 47,287 | 44,710 | 60,648 | |||||||||||||||
Diluted earnings (loss) per share: | ||||||||||||||||||||
| Net income (loss) per share | $ | (3.48 | ) | $ | (0.70 | ) | $ | 0.59 | $ | 0.48 | $ | 0.29 | ||||||||
| Shares used in diluted earnings (loss) per share | 994 | 4,059 | 50,729 | 47,937 | 62,858 | |||||||||||||||
F-4
Table of Contents
| Notes | Retained | Accumulated | ||||||||||||||||||||||||||||||||
| Series A | Additional | Receivable from | Earnings | Other | Total | |||||||||||||||||||||||||||||
| Preferred Stock | Common Stock | Paid-in | Officers and | (Accumulated | Comprehensive | Stockholders’ | ||||||||||||||||||||||||||||
| (in thousands) | Shares | Amount | Shares | Amount | Capital | Employees | Deficit) | Income (Loss) | Equity | |||||||||||||||||||||||||
| BALANCE AT INCEPTION (APRIL 21, 2004) | — | $ | — | — | $ | — | $ | — | $ | — | $ | — | $ | — | $ | — | ||||||||||||||||||
| Comprehensive income (loss) | ||||||||||||||||||||||||||||||||||
| Net loss | — | — | — | — | — | — | (2,656 | ) | — | (2,656 | ) | |||||||||||||||||||||||
| Deferred hedge gains, net of tax of $19 | — | — | — | — | — | — | — | 33 | 33 | |||||||||||||||||||||||||
| Total comprehensive loss | (2,623 | ) | ||||||||||||||||||||||||||||||||
| Issuance of subscribed units | 7,689 | 77 | 3,844 | 4 | 76,806 | (3,840 | ) | — | — | 73,047 | ||||||||||||||||||||||||
| Issuance of common stock | — | — | 1,006 | 1 | 1,005 | — | — | — | 1,006 | |||||||||||||||||||||||||
| Stock-based compensation for stock options | — | — | — | — | 178 | — | — | — | 178 | |||||||||||||||||||||||||
| Stock-based compensation on issuance of units | — | — | — | — | 950 | — | — | — | 950 | |||||||||||||||||||||||||
| Accrued interest—officer & employee notes | — | — | — | — | — | (44 | ) | — | — | (44 | ) | |||||||||||||||||||||||
| 6% Series A Preferred stock dividends | — | — | — | — | — | — | (804 | ) | — | (804 | ) | |||||||||||||||||||||||
| BALANCE AT DECEMBER 31, 2004 | 7,689 | $ | 77 | 4,850 | $ | 5 | $ | 78,939 | $ | (3,884 | ) | $ | (3,460 | ) | $ | 33 | $ | 71,710 | ||||||||||||||||
| Comprehensive income (loss) | ||||||||||||||||||||||||||||||||||
| Net income | — | — | — | — | — | — | 1,954 | — | 1,954 | |||||||||||||||||||||||||
| Deferred hedge losses, net of tax of ($6,550) | — | — | — | — | — | — | — | (12,147 | ) | �� | (12,147 | ) | ||||||||||||||||||||||
| Net settlement losses included in earnings, net of taxes of $568 | — | — | — | — | — | — | — | 1,054 | 1,054 | |||||||||||||||||||||||||
| Total comprehensive loss | (9,139 | ) | ||||||||||||||||||||||||||||||||
| Issuance of subscribed units | 5,270 | 53 | 2,635 | 2 | 53,029 | (4,805 | ) | — | — | 48,279 | ||||||||||||||||||||||||
| Issuance of common stock | — | — | 657 | 1 | 656 | — | — | — | 657 | |||||||||||||||||||||||||
| Stock-based compensation for stock options | — | — | — | — | 1,506 | — | — | — | 1,506 | |||||||||||||||||||||||||
| Stock-based compensation on issuance of units | — | — | — | — | 1,746 | — | — | — | 1,746 | |||||||||||||||||||||||||
| Accrued interest—officer & employee notes | — | — | — | — | — | (323 | ) | — | — | (323 | ) | |||||||||||||||||||||||
| 6% Series A Preferred stock dividends | — | — | — | — | — | — | (4,766 | ) | — | (4,766 | ) | |||||||||||||||||||||||
| BALANCE AT DECEMBER 31, 2005 | 12,959 | $ | 130 | 8,142 | $ | 8 | $ | 135,876 | $ | (9,012 | ) | $ | (6,272 | ) | $ | (11,060 | ) | $ | 109,670 | |||||||||||||||
| Comprehensive income (loss) | ||||||||||||||||||||||||||||||||||
| Net income | — | — | — | — | — | — | 19,668 | — | 19,668 | |||||||||||||||||||||||||
| Deferred hedge gains, net of tax of $4,200 | — | — | — | — | — | — | — | 7,736 | 7,736 | |||||||||||||||||||||||||
| Net settlement losses included in earnings, net of taxes of $2,030 | — | — | — | — | — | — | — | 3,738 | 3,738 | |||||||||||||||||||||||||
| Total comprehensive income | 31,142 | |||||||||||||||||||||||||||||||||
| Issuance of subscribed units | 4,518 | 45 | 2,259 | 2 | 45,329 | (3,158 | ) | — | — | 42,218 | ||||||||||||||||||||||||
| Issuance of common stock | — | — | 578 | 1 | 577 | — | — | — | 578 | |||||||||||||||||||||||||
| Conversion of preferred stock | (17,477 | ) | (175 | ) | 13,106 | 13 | 162 | — | — | — | — | |||||||||||||||||||||||
| Issuance of common stock for acquisition | — | — | 34,795 | 35 | 384,301 | — | — | — | 384,336 | |||||||||||||||||||||||||
| Restricted stock issued as stock-based compensation | — | — | 214 | — | 1,044 | — | — | — | 1,044 | |||||||||||||||||||||||||
| Cancellation of restricted stock | — | — | (1 | ) | — | — | — | — | — | — | ||||||||||||||||||||||||
| Stock-based compensation for stock options | — | — | — | — | 7,125 | — | — | — | 7,125 | |||||||||||||||||||||||||
| Stock-based compensation on issuance of units | — | — | — | — | 975 | — | — | — | 975 | |||||||||||||||||||||||||
| Accrued interest—officer & employee notes | — | — | — | — | — | (688 | ) | — | — | (688 | ) | |||||||||||||||||||||||
| 6% Series A Preferred stock dividends | — | — | — | — | — | — | (1,244 | ) | — | (1,244 | ) | |||||||||||||||||||||||
| BALANCE AT DECEMBER 31, 2006 | — | $ | — | 59,093 | $ | 59 | $ | 575,389 | $ | (12,858 | ) | $ | 12,152 | $ | 414 | $ | 575,156 | |||||||||||||||||
F-5
Table of Contents
| Notes | Retained | Accumulated | |||||||||||||||||||||||||||||
| Series A | Additional | Receivable from | Earnings | Other | Total | ||||||||||||||||||||||||||
| Preferred Stock | Common Stock | Paid-in | Officers and | (Accumulated | Comprehensive | Stockholders’ | |||||||||||||||||||||||||
| (in thousands) | Shares | Amount | Shares | Amount | Capital | Employees | Deficit) | Income (Loss) | Equity | ||||||||||||||||||||||
| Comprehensive income | |||||||||||||||||||||||||||||||
| Net income | — | — | — | — | — | — | 18,502 | — | 18,502 | ||||||||||||||||||||||
| Deferred hedge losses, net of tax of ($5,977) | — | — | — | — | — | — | — | (8,323 | ) | (8,323 | ) | ||||||||||||||||||||
| Net settlement losses included in earnings, net of tax of $1,022 | — | — | — | — | — | — | — | 1,416 | 1,416 | ||||||||||||||||||||||
| Total comprehensive income | 11,595 | ||||||||||||||||||||||||||||||
| Restricted stock issued as stock-based compensation | — | — | 138 | — | 1,007 | — | — | — | 1,007 | ||||||||||||||||||||||
| Stock-based compensation for stock options | — | — | — | — | 1,649 | — | — | — | 1,649 | ||||||||||||||||||||||
| Issuance of common stock for acquisition obligation | — | — | 54 | — | 650 | — | — | — | 650 | ||||||||||||||||||||||
| Net proceeds from initial public equity offering | — | — | 16,466 | 17 | 172,985 | — | — | — | 173,002 | ||||||||||||||||||||||
| Proceeds from officer and employee notes | — | — | — | — | — | 10,644 | — | — | 10,644 | ||||||||||||||||||||||
| Accrued interest—officer and employee notes | — | — | — | — | — | (274 | ) | — | — | (274 | ) | ||||||||||||||||||||
| 6% Series A preferred stock dividends | — | — | — | — | — | — | (45 | ) | — | (45 | ) | ||||||||||||||||||||
| BALANCE AT SEPTEMBER 30, 2007 | — | $ | — | 75,751 | $ | 76 | $ | 751,680 | $ | (2,488 | ) | $ | 30,609 | $ | (6,493 | ) | $ | 773,384 | |||||||||||||
F-6
Table of Contents
| Period from | ||||||||||||||||||||
| inception | ||||||||||||||||||||
| (April 21, 2004) | Nine months | |||||||||||||||||||
| through | Year ended | Year ended | ended | |||||||||||||||||
| December 31, | December 31, | December 31, | September 30, | |||||||||||||||||
| (in thousands) | 2004 | 2005 | 2006 | 2006 | 2007 | |||||||||||||||
| (unaudited) | (unaudited) | |||||||||||||||||||
| CASH FLOWS FROM OPERATING ACTIVITIES: | ||||||||||||||||||||
| Net income (loss) | $ | (2,656 | ) | $ | 1,954 | $ | 19,668 | $ | 12,723 | $ | 18,502 | |||||||||
| Adjustments to reconcile net income (loss) to net cash provided by (used in) operating activities: | ||||||||||||||||||||
| Depreciation and depletion | 956 | 11,485 | 60,722 | 42,170 | 55,036 | |||||||||||||||
| Impairments of proved oil and gas properties | — | 2,295 | 9,891 | 5,762 | 4,577 | |||||||||||||||
| Accretion of discount on asset retirement obligations | 7 | 89 | 287 | 196 | 334 | |||||||||||||||
| Exploration expense, including dry holes | 1,636 | 1,549 | 3,387 | 3,204 | 17,117 | |||||||||||||||
| Non-cash compensation expense | 1,128 | 3,252 | 9,144 | 8,041 | 2,656 | |||||||||||||||
| Gas imbalances | — | (37 | ) | 82 | (7 | ) | 33 | |||||||||||||
| Ineffective portion of cash flow hedges | — | 1,148 | (1,193 | ) | (64 | ) | 1,134 | |||||||||||||
| Deferred rent liability | 10 | 11 | 262 | 49 | 33 | |||||||||||||||
| Deferred income taxes | (915 | ) | 1,974 | 12,618 | 7,603 | 11,460 | ||||||||||||||
| Interest accrued on officer and employee notes | (44 | ) | (323 | ) | (688 | ) | (510 | ) | (274 | ) | ||||||||||
| Amortization of deferred loan costs | 9 | 134 | 1,494 | 1,157 | 3,251 | |||||||||||||||
| Amortization of discount on long-term debt | — | — | — | — | 480 | |||||||||||||||
| (Gain) loss on sale of other property and equipment | (18 | ) | 21 | (3 | ) | — | — | |||||||||||||
| (Gain) loss on derivatives not designated as hedges | (684 | ) | 5,001 | — | — | (3,088 | ) | |||||||||||||
| Dedesignated cash flow hedges reclassed from AOCI | — | — | — | — | (722 | ) | ||||||||||||||
| Changes in operating assets and liabilities, net of acquisitions: | ||||||||||||||||||||
| Accounts receivable | (4,732 | ) | (15,621 | ) | (27,683 | ) | (25,943 | ) | 11,355 | |||||||||||
| Prepaid insurance and other | (126 | ) | (1,548 | ) | (2,465 | ) | (1,752 | ) | 135 | |||||||||||
| Other assets | (12 | ) | — | 12 | — | — | ||||||||||||||
| Accounts payable | 2,445 | 3,452 | 13,853 | 2,373 | (9,230 | ) | ||||||||||||||
| Revenue payable | 166 | 6,958 | 2,372 | (289 | ) | (5,325 | ) | |||||||||||||
| Accrued liabilities | 443 | 2,786 | 3,101 | 204 | 1,492 | |||||||||||||||
| Accrued interest | 194 | 490 | 7,320 | 4,024 | (6,249 | ) | ||||||||||||||
| Income taxes payable | — | — | — | — | 225 | |||||||||||||||
| Net cash provided by (used in) operating activities | (2,193 | ) | 25,070 | 112,181 | 58,941 | 102,932 | ||||||||||||||
| CASH FLOWS FROM INVESTING ACTIVITIES: | ||||||||||||||||||||
| Capital expenditures on oil and gas properties | (6,450 | ) | (52,768 | ) | (182,389 | ) | (122,839 | ) | (113,936 | ) | ||||||||||
| Acquisition of oil and gas properties and other assets | (114,649 | ) | (2,855 | ) | (413,229 | ) | (413,842 | ) | (256 | ) | ||||||||||
| Additions to other property and equipment | (1,374 | ) | (4,061 | ) | (1,234 | ) | (1,249 | ) | (2,218 | ) | ||||||||||
| Proceeds from the sale of oil and gas properties | — | — | — | — | 96 | |||||||||||||||
| Proceeds from other assets | — | 817 | — | — | — | |||||||||||||||
| Settlements (paid) received on derivatives not designated as hedges | — | (3,035 | ) | — | — | 1,286 | ||||||||||||||
| Net cash used in investing activities | (122,473 | ) | (61,902 | ) | (596,852 | ) | (537,930 | ) | (115,028 | ) | ||||||||||
| CASH FLOWS FROM FINANCING ACTIVITIES: | ||||||||||||||||||||
| Proceeds from issuance of long-term debt | 53,000 | 63,400 | 664,993 | 563,005 | 283,600 | |||||||||||||||
| Payments of long-term debt | — | (44,400 | ) | (241,493 | ) | (150,000 | ) | (433,700 | ) | |||||||||||
| Proceeds from issuance of subscribed units and common stock | 74,053 | 30,621 | 61,178 | 61,178 | 173,002 | |||||||||||||||
| Payments of preferred stock dividends | — | (4,160 | ) | (2,567 | ) | (2,542 | ) | (132 | ) | |||||||||||
| Proceeds from notes payable—affiliate | 4,100 | — | — | — | — | |||||||||||||||
| Payments of notes payable—affiliate | (4,100 | ) | — | — | — | — | ||||||||||||||
F-7
Table of Contents
| Period from | ||||||||||||||||||||
| inception | ||||||||||||||||||||
| (April 21, 2004) | Nine months | |||||||||||||||||||
| through | Year ended | Year ended | ended | |||||||||||||||||
| December 31, | December 31, | December 31, | September 30, | |||||||||||||||||
| (in thousands) | 2004 | 2005 | 2006 | 2006 | 2007 | |||||||||||||||
| (unaudited) | (unaudited) | |||||||||||||||||||
| Proceeds from repayment of officer and employee notes | — | — | — | — | 10,644 | |||||||||||||||
| Payments for loan origination costs | (450 | ) | (103 | ) | (5,500 | ) | (5,500 | ) | (2,572 | ) | ||||||||||
| Bank overdrafts | — | — | — | 3,666 | — | |||||||||||||||
| Premiums paid on derivatives not designated as hedges | (1,281 | ) | — | — | — | — | ||||||||||||||
| Net cash provided by financing activities | 125,322 | 45,358 | 476,611 | 469,807 | 30,842 | |||||||||||||||
| Net increase (decrease) in cash and cash equivalents | 656 | 8,526 | (8,060 | ) | (9,182 | ) | 18,746 | |||||||||||||
| BEGINNING CASH AND CASH EQUIVALENTS | — | 656 | 9,182 | 9,182 | 1,122 | |||||||||||||||
| ENDING CASH AND CASH EQUIVALENTS | $ | 656 | $ | 9,182 | $ | 1,122 | $ | — | $ | 19,868 | ||||||||||
| SUPPLEMENTAL CASH FLOWS: | ||||||||||||||||||||
| Cash paid for interest and fees, net of $0, $370, $2,129, $1,415 and $2,160 capitalized | $ | 67 | $ | 2,449 | $ | 23,881 | $ | 11,294 | $ | 28,233 | ||||||||||
| Cash paid for income taxes | $ | — | $ | 100 | $ | 1,725 | $ | 100 | $ | 2,050 | ||||||||||
| NON-CASH INVESTING AND FINANCING ACTIVITIES: | ||||||||||||||||||||
| Issuance of common stock in acquisition of oil and gas properties and other assets | $ | — | $ | — | $ | 384,336 | $ | 384,336 | $ | 650 | ||||||||||
| Deferred tax effect of acquired oil and gas properties | $ | — | $ | — | $ | 227,735 | $ | 227,537 | $ | — | ||||||||||
| Issuance of notes receivable in connection with capital options | $ | 3,840 | $ | 4,805 | $ | 3,158 | $ | 3,158 | $ | — | ||||||||||
F-8
Table of Contents
Notes to consolidated financial statements
(Information as of and for the nine months ended September 30, 2006 and 2007 is unaudited)
F-9
Table of Contents
F-10
Table of Contents
F-11
Table of Contents
F-12
Table of Contents
| December 31, | September 30, | ||||||||
| (In thousands) | 2005 | 2006 | 2007 | ||||||
| Wells in progress | $ | 1,190 | $ | 916 | $ | 3,104 | |||
| Capitalized exploratory well costs that have been capitalized for a period of one year or less | 2,765 | 14,042 | 15,398 | ||||||
| Capitalized exploratory well costs that have been capitalized for a period greater than one year | — | 4,915 | 3,329 | ||||||
| Total exploratory well costs | $ | 3,955 | $ | 19,873 | $ | 21,831 | |||
F-13
Table of Contents
F-14
Table of Contents
| Inception | |||||||||||
| (April 21, 2004) | |||||||||||
| through | Year ended | Year ended | |||||||||
| December 31, | December 31, | December 31, | |||||||||
| (in thousands) | 2004 | 2005 | 2006 | ||||||||
| Beginning capitalized exploratory well costs | $ | — | $ | 2,149 | $ | 3,955 | |||||
| Additions to exploratory well costs pending the determination of proved reserves | 2,149 | 5,556 | 41,956 | ||||||||
| Reclassifications due to determination of proved reserves | — | (3,749 | ) | (25,762 | ) | ||||||
| Exploratory well costs charged to expense | — | (1 | ) | (276 | ) | ||||||
| Ending capitalized exploratory well costs | $ | 2,149 | $ | 3,955 | $ | 19,873 | |||||
F-15
Table of Contents
F-16
Table of Contents
F-17
Table of Contents
F-18
Table of Contents
F-19
Table of Contents
| (in thousands) | ||||
| Proved oil and gas properties | $ | 106,485 | ||
| Unproved oil and gas properties | 7,904 | |||
| Commercial real estate | 1,672 | |||
| Assets held for sale — preferential rights | 2,209 | |||
| Vehicles and other | 42 | |||
| Total assets acquired | 118,312 | |||
| Net gas imbalance liability | (194 | ) | ||
| Asset retirement obligations | (883 | ) | ||
| Total liabilities assumed | (1,077 | ) | ||
| Net purchase price | $ | 117,235 | ||
| (in thousands) | ||||
| Proved oil and gas properties | $ | 830,540 | ||
| Unproved oil and gas properties | 200,000 | |||
| Total assets acquired | 1,030,540 | |||
| Asset retirement obligations | (6,158 | ) | ||
| Chase investors asset purchase obligation | (906 | ) | ||
| Deferred tax liability | (227,735 | ) | ||
| Total liabilities assumed | (234,799 | ) | ||
| Net purchase price | $ | 795,741 | ||
F-20
Table of Contents
| Pro forma | |||||||||
| Pro forma | Nine months | ||||||||
| Year ended December 31, | ended September 30, | ||||||||
| (in thousands, except per share data) (unaudited) | 2005 | 2006 | 2006 | ||||||
| Operating revenues | $ | 174,614 | $ | 219,746 | $ | 157,101 | |||
| Net income applicable to common shareholders | $ | 19,006 | $ | 23,451 | $ | 16,951 | |||
| Earnings per common share: | |||||||||
| Basic | $ | 0.42 | $ | 0.43 | $ | 0.31 | |||
| Diluted | $ | 0.42 | $ | 0.41 | $ | 0.30 | |||
F-21
Table of Contents
| December 31, | September 30, | |||||||||||
| (in thousands) | 2005 | 2006 | 2007 | |||||||||
| Asset retirement obligations, beginning of period | $ | 890 | $ | 1,120 | $ | 8,700 | ||||||
| Liability incurred upon acquiring and drilling wells | 196 | 7,443 | 309 | |||||||||
| Accretion expense | 89 | 287 | 334 | |||||||||
| Liabilities settled upon plugging and abandoning wells | (2 | ) | — | (34 | ) | |||||||
| Revisions to estimated cash flows | (53 | ) | (150 | ) | (2,032 | ) | ||||||
| Asset retirement obligations, end of period | $ | 1,120 | $ | 8,700 | $ | 7,277 | ||||||
F-22
Table of Contents
| Note G. | Stockholders’ equity and stock issued subject to limited recourse notes |
F-23
Table of Contents
F-24
Table of Contents
| • | the number of shares in any series |
| • | voting powers, if any |
| • | redemption provisions, if any |
| • | dividend rate and other dividend attributes and |
| • | convertible features or attached rights, if any. |
F-25
Table of Contents
F-26
Table of Contents
| 2004 | 2005 | 2006 | |||||||
| Risk-free interest rates | 3.14% | 3.76% | 4.37% | ||||||
| Expected life | 4.00 years | 3.28 years | 2.61 years | ||||||
| Expected volatility | 43.30% | 34.99% | 34.33% | ||||||
| Expected dividend yield | 0% | 0% | 0% | ||||||
| Number of | Weighted | ||||||||
| Bundled Capital | average | Grant date | |||||||
| Options | exercise price | fair value | |||||||
| Period from inception (April 21, 2004) | |||||||||
| through December 31, 2004 | |||||||||
| Outstanding at beginning of period | — | $ | — | ||||||
| Bundled Capital Options granted | 1,100,000 | $ | 9.52 | $ | 2,310,000 | ||||
| Cancelled / forfeited | — | $ | — | ||||||
| Outstanding at end of period | 1,100,000 | $ | 9.52 | ||||||
| Vested outstanding at end of period | 421,299 | $ | 9.52 | ||||||
| Year ended December 31, 2005 | |||||||||
| Outstanding at beginning of period | 1,100,000 | $ | 9.52 | ||||||
| Bundled Capital Options granted | — | $ | — | $ | — | ||||
| Cancelled / forfeited | — | $ | — | ||||||
| Outstanding at end of period | 1,100,000 | $ | 9.52 | ||||||
| Vested outstanding at end of period | 696,303 | $ | 9.52 | ||||||
F-27
Table of Contents
| Number of | Weighted | ||||||
| Bundled Capital | average | ||||||
| Options | exercise price | ||||||
| Year ended December 31, 2006 | |||||||
| Outstanding at beginning of period | 1,100,000 | $ | 9.52 | ||||
| Cancelled / forfeited | (161,697 | ) | $ | 9.52 | |||
| Outstanding at end of period | 938,303 | $ | 9.52 | ||||
| Vested outstanding at end of period | 938,303 | $ | 9.52 | ||||
| Nine months ended September 30, 2007 | |||||||
| Outstanding at beginning of period | 938,303 | $ | 9.52 | ||||
| Bundled Capital Options exercised | (938,303 | ) | $ | 9.52 | |||
| Outstanding at end of period | — | $ | — | ||||
| Vested outstanding at end of period | — | $ | — | ||||
| Vested Bundled Capital Options Outstanding and Exercisable | |||||||||||
| Weighted | |||||||||||
| Number | average | Weighted | |||||||||
| outstanding, | remaining | average | |||||||||
| vested and | contractual | exercise | Intrinsic | ||||||||
| Date | exercisable | life | price | value | |||||||
| December 31, 2006 | 938,303 | 3.45 years | $ | 9.52 | $ | 45,655,000 | |||||
F-28
Table of Contents
| Number of | Weighted | |||||||||
| Capital | average | Grant date | ||||||||
| Options | exercise price | fair value | ||||||||
| Period from inception (April 21, 2004) | ||||||||||
| through December 31, 2004 | ||||||||||
| Outstanding at beginning of period | — | $ | — | |||||||
| $10 Capital Options granted | 85,000 | $ | 8.40 | $ | 169,000 | |||||
| Cancelled / forfeited | — | $ | — | |||||||
| Outstanding at end of period | 85,000 | $ | 8.40 | |||||||
| Vested outstanding at end of period | 32,555 | $ | 8.40 | |||||||
| Year ended December 31, 2005 | ||||||||||
| Outstanding at beginning of period | 85,000 | $ | 8.40 | |||||||
| $10 Capital Options granted | 277,500 | $ | 9.05 | $ | 1,528,000 | |||||
| $15 Capital Options granted | 120,000 | $ | 12.28 | $ | 251,000 | |||||
| Cancelled / forfeited | — | $ | — | |||||||
| Outstanding at end of period | 482,500 | $ | 9.74 | |||||||
| Vested outstanding at end of period | 305,422 | $ | 9.74 | |||||||
| Year ended December 31, 2006 | ||||||||||
| Outstanding at beginning of period | 482,500 | $ | 9.74 | |||||||
| $10 Capital Options granted | — | $ | — | $ | — | |||||
| $15 Capital Options granted | 16,000 | $ | 12.13 | $ | 45,000 | |||||
| Cancelled / forfeited | (73,279 | ) | $ | 9.81 | ||||||
| Outstanding at end of period | 425,221 | $ | 9.81 | |||||||
| Vested outstanding at end of period | 425,221 | $ | 9.81 | |||||||
| Nine months ended September 30, 2007 | ||||||||||
| Outstanding at beginning of period | 425,221 | $ | 9.81 | |||||||
| $10 Capital Options exercised | (179,557 | ) | $ | 9.30 | ||||||
| $15 Capital Options exercised | (8,530 | ) | $ | 12.13 | ||||||
| Outstanding at end of period | 237,134 | $ | 10.12 | |||||||
| Vested outstanding at end of period | 237,134 | $ | 10.12 | |||||||
F-29
Table of Contents
| Vested Capital Options Outstanding and Exercisable | |||||||||||||||
| Weighted | |||||||||||||||
| Number | average | Weighted | |||||||||||||
| outstanding, | remaining | average | |||||||||||||
| Exercise | vested and | contractual | exercise | Intrinsic | |||||||||||
| Date | prices | exercisable | life | price | value | ||||||||||
| December 31, 2006 | |||||||||||||||
| $ | 10.00 | 309,213 | 3.61 years | $ | 8.90 | $ | 3,268,000 | ||||||||
| $ | 15.00 | 116,008 | 3.83 years | $ | 12.26 | $ | 633,000 | ||||||||
| 425,221 | $ | 9.81 | $ | 3,901,000 | |||||||||||
| September 30, 2007 | |||||||||||||||
| $ | 10.00 | 129,656 | 2.79 years | $ | 8.33 | $ | 970,000 | ||||||||
| $ | 15.00 | 107,478 | 3.07 years | $ | 12.27 | $ | 237,000 | ||||||||
| 237,134 | $ | 10.12 | $ | 1,207,000 | |||||||||||
F-30
Table of Contents
| Inception | |||||||||||||||
| (April 21, 2004) | |||||||||||||||
| through | Year ended | Year ended | Nine months ended | ||||||||||||
| December 31, | December 31, | December 31, | September 30, | ||||||||||||
| 2004 | 2005 | 2006 | 2006 | 2007 | |||||||||||
| Stock-based compensation expense from Capital Options: | $ | 950,000 | $ | 1,746,000 | $ | 975,000 | $ | 975,000 | $ | — | |||||
| Bundled Capital Options | |||||||||||||||
| Stock-based compensation expense | $ | 885,000 | $ | 578,000 | $ | 508,000 | $ | 508,000 | $ | — | |||||
| Options vesting during period | 421,299 | 275,004 | 242,000 | 242,000 | — | ||||||||||
| Weighted average grant date fair value per option | $ | 2.10 | $ | 2.10 | $ | 2.10 | $ | 2.10 | $ | — | |||||
| Capital Options | |||||||||||||||
| Stock-based compensation expense | $ | 65,000 | $ | 1,168,000 | $ | 467,000 | $ | 467,000 | $ | — | |||||
| Options vesting during period | 32,555 | 272,867 | 119,799 | 119,799 | — | ||||||||||
| Weighted average grant date fair value per option | $ | 2.00 | $ | 4.28 | $ | 3.90 | $ | 3.90 | $ | — | |||||
F-31
Table of Contents
| Bundled Capital Option | Bundled Capital Option | |||||||||||||||||
| Preferred Unit(a) | ||||||||||||||||||
| CEHC preferred | ||||||||||||||||||
| Bundled | stock to | Total | Total | |||||||||||||||
| Capital | Common | Common | Resources | common | preferred | |||||||||||||
| Options(b) | stock(c) | stock | common stock | stock | stock | |||||||||||||
| CEHC vested | 938,303 | 4,480,157 | 938,303 | 938,303 | 5,418,460 | 938,303 | ||||||||||||
| Conversion ratios | 1.00 | 0.50 | 0.50 | 0.75 | ||||||||||||||
| Resources vested | 938,303 | 2,240,083 | 469,156 | 703,730 | 3,412,969 | — | ||||||||||||
| Capital Option | Capital Option | ||||||||||||||
| Preferred Unit(a) | |||||||||||||||
| CEHC preferred | |||||||||||||||
| stock to | Total | Total | |||||||||||||
| Capital | Common | Resources | common | preferred | |||||||||||
| Options(d) | stock | common stock | stock | stock | |||||||||||
| CEHC vested | 425,221 | 425,221 | 425,221 | 425,221 | 425,221 | ||||||||||
| Conversion ratios | 1.00 | 0.50 | 0.75 | ||||||||||||
| Resources vested | 425,221 | 212,613 | 318,923 | 531,536 | — | ||||||||||
| (a) | Each Preferred Unit reflects one share of CEHC preferred stock and one-half of a share of CEHC common stock. Each share of CEHC preferred stock can be converted into 0.75 shares of Resources common stock. | |
| (b) | Each Bundled Capital Option reflects 2.387 shares of CEHC common stock and one Preferred Unit. Each Bundled Capital Option can be converted into 3.637 shares of Resources common stock. | |
| (c) | The Officers agreed to purchase 2.387 shares of CEHC common stock for each Preferred Unit purchased. | |
| (d) | Each Capital Option reflects one Preferred Unit. Each Capital Option can be converted into 1.25 shares of Resources common stock. |
F-32
Table of Contents
F-33
Table of Contents
F-34
Table of Contents
| Number of | Grant date | ||||||
| common shares | fair value | ||||||
| Restricted stock: | |||||||
| Outstanding at January 1, 2006 | — | ||||||
| Shares granted | 213,584 | $ | 3,289,000 | ||||
| Shares canceled / forfeited | (1,368 | ) | |||||
| Lapse of restrictions | — | ||||||
| Outstanding at December 31, 2006 | 212,216 | ||||||
| Shares granted | 137,540 | $ | 2,033,000 | ||||
| Shares cancelled / forfeited | — | ||||||
| Lapse of restrictions | (60,000 | ) | |||||
| Outstanding at September 30, 2007 | 289,756 | ||||||
F-35
Table of Contents
| Inception | |||||||||||||||||||
| (April 21, 2004) | January 1, 2006 | ||||||||||||||||||
| through | Year ended | through February 27, | |||||||||||||||||
| December 31, 2004 | December 31, 2005 | 2006 | |||||||||||||||||
| Weighted | Weighted | Weighted | |||||||||||||||||
| Number of | average | Number of | average | Number of | average | ||||||||||||||
| units(a) | price | units(a) | price | units(a) | price | ||||||||||||||
| Stock options for Preferred Units: | |||||||||||||||||||
| Outstanding at beginning of period | — | $ | — | 724,257 | $ | 10.00 | 1,365,075 | $ | 10.32 | ||||||||||
| Options granted | 724,257 | $ | 10.00 | 665,247 | $ | 10.66 | 514,267 | $ | 10.68 | ||||||||||
| Options forfeited | — | $ | — | (24,429 | ) | $ | 10.00 | — | $ | — | |||||||||
| Options exercised | — | $ | — | — | $ | — | — | $ | — | ||||||||||
| Outstanding at end of period | 724,257 | $ | 10.00 | 1,365,075 | $ | 10.32 | 1,879,342 | $ | 10.42 | ||||||||||
| Exercisable at end of period | — | $ | — | 182,033 | $ | 10.00 | 1,562,770 | $ | 10.51 | ||||||||||
| (a) | Each option Unit can be exercised for one Preferred Unit which is comprised of one-half of a share of CEHC common stock and one share of CEHC preferred stock. |
F-36
Table of Contents
| CEHC | CEHC | Resources | |||||||||||
| Unit Option | Unit | Conversion | Option | Resources | |||||||||
| Exercise Price | Options | Rate | Exercise Price | Options | |||||||||
| $ | 10.00 | 1,721,010 | 1.25:1 | $ | 8.00 | 2,151,129 | |||||||
| $ | 15.00 | 158,332 | 1.25:1 | $ | 12.00 | 197,984 | |||||||
| Total | 1,879,342 | Total | 2,349,113 | ||||||||||
| Risk-free interest rate | 4.47 | % | ||
| Expected term (years) | 6.25 | |||
| Expected volatility | 37.33 | % | ||
| Expected dividend yield | 0.00 | % | ||
F-37
Table of Contents
| February 27, 2006 | Nine months ended | |||||||||||||
| through December 31, | September 30, | |||||||||||||
| 2006 | 2007 | |||||||||||||
| Weighted | Weighted | |||||||||||||
| Number of | average | Number of | average | |||||||||||
| options(a) | price | options(a) | price | |||||||||||
| Stock options: | ||||||||||||||
| Outstanding at beginning of period | 2,349,113 | $ | 8.34 | 2,797,997 | $ | 8.93 | ||||||||
| Options granted | 450,000 | $ | 12.00 | 215,000 | $ | 12.85 | ||||||||
| Options forfeited | (1,116 | ) | $ | 10.88 | (1,275 | ) | $ | 8.00 | ||||||
| Options exercised | — | $ | — | — | $ | — | ||||||||
| Outstanding at end of period | 2,797,997 | $ | 8.93 | 3,011,722 | $ | 9.21 | ||||||||
| Exercisable at end of period | 1,952,274 | $ | 8.40 | 2,063,499 | $ | 8.60 | ||||||||
| (a) | One option can be exercised for one share of Resources common stock. |
| Vested options outstanding and exercisable | |||||||||||||||
| Weighted | |||||||||||||||
| Number | average | Weighted | |||||||||||||
| outstanding, | remaining | average | |||||||||||||
| Exercise | vested and | contractual | exercise | Intrinsic | |||||||||||
| Date | prices | exercisable | life | price | value | ||||||||||
| December 31, 2006 | |||||||||||||||
| $ | 8.00 | 1,755,094 | 8.47 years | $ | 8.00 | $ | 15,099,000 | ||||||||
| $ | 12.00 | 197,180 | 8.86 years | $ | 12.00 | $ | 769,000 | ||||||||
| 1,952,274 | $ | 8.40 | $ | 15,868,000 | |||||||||||
| September 30, 2007 | |||||||||||||||
| $ | 8.00 | 1,753,819 | 7.72 years | $ | 8.00 | $ | 11,944,000 | ||||||||
| $ | 12.00 | 309,680 | 8.33 years | $ | 12.00 | $ | 870,000 | ||||||||
| 2,063,499 | $ | 8.60 | $ | 12,814,000 | |||||||||||
F-38
Table of Contents
| Inception | Nine | ||||||||||||||
| (April 21, 2004) | Year ended | months ended | |||||||||||||
| through December 31, | December 31, | September 30, | |||||||||||||
| 2004 | 2005 | 2006 | 2006 | 2007 | |||||||||||
| Grant date fair value: | |||||||||||||||
Time vesting options(a) | $ | 2,013,000 | $ | 2,891,000 | $ | 1,931,000 | $ | 1,931,000 | $ | 87,000 | |||||
| Performance vesting options: | |||||||||||||||
Officers(b) | 557,000 | 606,000 | 500,000 | 500,000 | — | ||||||||||
Certain employee(b) | — | 91,000 | 31,000 | 31,000 | — | ||||||||||
Non-officers(c) | 107,000 | 278,000 | 142,000 | 142,000 | — | ||||||||||
Current officer stock options(d) | — | — | 3,555,000 | 3,555,000 | 1,156,000 | ||||||||||
| Total | $ | 2,677,000 | $ | 3,866,000 | $ | 6,159,000 | $ | 6,159,000 | $ | 1,243,000 | |||||
| Stock-based compensation expense from stock options: | |||||||||||||||
Time vesting options(a) | $ | 178,000 | $ | 1,506,000 | $ | 5,085,000 | $ | 5,085,000 | $ | 6,000 | |||||
| Performance vesting options: | |||||||||||||||
Officers(b) | — | — | 477,000 | 335,000 | 420,000 | ||||||||||
Certain employee(b) | — | — | 34,000 | 24,000 | — | ||||||||||
Non-officers(c) | — | — | 505,000 | 505,000 | 30,000 | ||||||||||
Current officer stock options(d) | — | — | 1,024,000 | 558,000 | 1,193,000 | ||||||||||
| Total | $ | 178,000 | $ | 1,506,000 | $ | 7,125,000 | $ | 6,507,000 | $ | 1,649,000 | |||||
| (a) | Options granted prior to February 27, 2006, vested immediately as of the date of the Combination, as a result of a change of control. Options granted thereafter vest using a four year graded vesting schedule by approval from the Board of Directors. | |
| (b) | Options granted prior to February 27, 2006, vest using a three year cliff vesting schedule by approval from CEHC’s Board of Directors. | |
| (c) | Vested as of the date of the Combination by approval from CEHC’s Board of Directors. | |
| (d) | Vest using a four year graded vesting schedule by approval from the Board of Directors. |
F-39
Table of Contents
| 2004 | 2005 | 2006 | |||||||
| Risk-free interest rates | 3.29% | 4.12% | 4.81% | ||||||
| Expected term | 3.81 years | 2.89 years | 2.87 years | ||||||
| Expected volatility | 40.24% | 34.87% | 37.12% | ||||||
| Expected dividend yield | — | — | — | ||||||
F-40
Table of Contents
| Hedged period | |||||||
| As of December 31, 2006: | 2007 | 2008 | |||||
Natural gas price collars: | |||||||
| Volume (MMBtu/day) | 16,000 | 13,500 | |||||
Index price per MMBtu(a) | $5.98–$9.75 | (c) | $6.50–$9.35 | ||||
Crude oil price collars: | |||||||
| Volume (Bbl/day) | 650 | ||||||
NYMEX price per Bbl(b) | $37.95–$41.75 | ||||||
Crude oil price swaps: | |||||||
| Volume (Bbl/day) | 2,300 | 2,600 | |||||
NYMEX price per Bbl(b) | $67.85 | $67.50 | |||||
| (a) | The index prices for the natural gas price collars are based on the Inside FERC-El Paso Natural Gas Permian Basinfirst-of-the-month spot price. | |
| (b) | The index prices for the crude oil price collars and price swaps are based on the NYMEX-West Texas Intermediate monthly average spot price. | |
| (c) | Amounts disclosed represent weighted average prices. |
F-41
Table of Contents
F-42
Table of Contents
| Fair Market Value | Aggregate | |||||||||||||||||
| Asset/(Liability) | remaining | Daily | Index | Contract | ||||||||||||||
| (in thousands) | volume | volume | price | period | ||||||||||||||
Cash flow hedges: | ||||||||||||||||||
Crude oil (volumes in Bbls): | ||||||||||||||||||
| Price collar | $ | (2,278) | 59,800 | 650 | $ | 37.95–$41.75 | (a) | 10/1/07–12/31/07 | ||||||||||
| Price swap | (2,570) | 211,600 | 2,300 | $ | 67.85 | (a) | 10/1/07–12/31/07 | |||||||||||
| Price swap | (7,668) | 951,600 | 2,600 | $ | 67.50 | (a) | 1/1/08–12/31/08 | |||||||||||
| Cash flow hedges dedesignated: | ||||||||||||||||||
Natural gas (volumes in MMBtus): | ||||||||||||||||||
| Price collar | 735 | 1,472,000 | 16,000 | $ | 5.98–$9.75 | (b)(c) | 10/1/07–12/31/07 | |||||||||||
| Price collar | 1,740 | 4,941,000 | 13,500 | $ | 6.50–$9.35 | (b) | 1/1/08–12/31/08 | |||||||||||
| Price swap | 257 | 193,200 | 2,100 | $ | 7.40 | (b) | 10/1/07–12/31/07 | |||||||||||
Derivatives not designated as cash flow hedges: | ||||||||||||||||||
Crude oil (volumes in Bbls): | ||||||||||||||||||
| Price swap | (33) | 732,000 | 2,000 | $ | 75.78 | (a)(c) | 1/1/08–12/31/08 | |||||||||||
| Price swap | 71 | 730,000 | 2,000 | $ | 72.84 | (a)(c) | 1/1/09–12/31/09 | |||||||||||
| Net liability | $ | (9,746) | ||||||||||||||||
| (a) | The index prices for the oil price collars and price swaps are based on the NYMEX–West Texas Intermediate monthly average futures prices. | |
| (b) | The index prices for the natural gas price collars and price swaps are based on the Inside FERC–El Paso Permian Basin first-of-the-month spot price. | |
| (c) | Amounts disclosed represent weighted average prices. |
F-43
Table of Contents
| Nine months ended | ||||||||
| September 30, | ||||||||
| (in thousands) | 2006 | 2007 | ||||||
Effect of derivatives included in oil and gas revenue: | ||||||||
| Cash payments on cash flow hedges in oil sales | $ | (7,456 | ) | $ | (3,347 | ) | ||
| Cash receipts from cash flow hedges in gas sales | 114 | 187 | ||||||
| Dedesignated cash flow hedges reclassed from AOCI | — | 722 | ||||||
| Total oil and gas revenue from derivatives | $ | (7,342 | ) | $ | (2,438 | ) | ||
Gain (loss) on derivatives not designated as cash flow hedges: | ||||||||
| Mark-to-market | $ | — | $ | 1,802 | ||||
| Cash receipts on dedesignated derivatives | — | 1,286 | ||||||
| Total gain (loss) on derivatives not designated as cash flow hedges | $ | — | $ | 3,088 | ||||
| Ineffective portion of cash flow hedges | $ | 64 | $ | (1,134 | ) | |||
Accumulated other comprehensive income (loss): | ||||||||
| Cash flow hedges: | ||||||||
| Mark-to-market of cash flow hedges gain (loss) | $ | 5,552 | $ | (14,300 | ) | |||
| Reclassification adjustment for (gains) losses included in net income | 7,342 | 3,160 | ||||||
| Net AOCI upon dedesignation at June 30, 2007 | — | (407 | ) | |||||
| Net change, before taxes | 12,894 | (11,547 | ) | |||||
| Tax effect | (4,518 | ) | 4,822 | |||||
| Net change, net of tax | $ | 8,376 | $ | (6,725 | ) | |||
| Dedesignated cash flow hedges: | ||||||||
| Net AOCI upon dedesignation at June 30, 2007 | $ | — | $ | 407 | ||||
| Reclassification adjustment for (gains) losses included in net income | — | (722 | ) | |||||
| Total net change in AOCI (loss), net tax | — | (315 | ) | |||||
| Tax effect | — | 133 | ||||||
| Net change, net of tax | $ | — | $ | (182 | ) | |||
| Total changes in accumulated other comprehensive income (loss), net of tax | $ | 8,376 | $ | (6,907 | ) | |||
| Net income | 12,723 | 18,502 | ||||||
| Total comprehensive income | $ | 21,099 | $ | 11,595 | ||||
F-44
Table of Contents
| Cash payment to the Chase Group in the Combination | $ | 400,000,000 | |
| Repay balance on prior revolving credit facility | 15,900,000 | ||
| Bank fees and legal costs | 5,100,000 | ||
| $ | 421,000,000 | ||
F-45
Table of Contents
F-46
Table of Contents
F-47
Table of Contents
F-48
Table of Contents
| (in thousands) | |||
| 2007 | $ | 400 | |
| 2008 | 400 | ||
| 2009 | 400 | ||
| 2010 | 456,100 | ||
| 2011 | 38,200 | ||
| Total | $ | 495,500 | |
| (in thousands) | |||
| 2007 | $ | 500 | |
| 2008 | 2,000 | ||
| 2009 | 2,000 | ||
| 2010 | 236,000 | ||
| 2011 | 2,000 | ||
| 2012 and thereafter | 103,900 | ||
| Total | $ | 346,400 | |
| (in thousands) | |||
| 2007 | $ | 438 | |
| 2008 | 439 | ||
| 2009 | 449 | ||
| 2010 | 458 | ||
| 2011 | 468 | ||
| 2012 and thereafter | 873 | ||
| Total future minimum lease commitments | $ | 3,125 | |
F-49
Table of Contents
| (in thousands) | |||
| 2007 | $ | 115 | |
| 2008 | 464 | ||
| 2009 | 474 | ||
| 2010 | 484 | ||
| 2011 | 494 | ||
| 2012 and thereafter | 921 | ||
| Total future minimum lease commitments | $ | 2,952 | |
F-50
Table of Contents
F-51
Table of Contents
F-52
Table of Contents
F-53
Table of Contents
F-54
Table of Contents
F-55
Table of Contents
| Periods ending | Nine months ending | |||||||||||||||
| December 31, | September 30, | |||||||||||||||
| (In thousands) | 2004 | 2005 | 2006 | 2006 | 2007 | |||||||||||
| Current income tax expense federal and state | $ | — | $ | 65 | $ | 1,761 | $ | 1,061 | $ | 1,875 | ||||||
| Deferred income tax expense (benefit) federal and state | (915 | ) | 1,974 | 12,618 | 7,603 | 11,460 | ||||||||||
| Income tax expense (benefit) | $ | (915 | ) | $ | 2,039 | $ | 14,379 | $ | 8,664 | $ | 13,335 | |||||
| Periods ending | Nine months ending | |||||||||||||||
| December 31, | September 30, | |||||||||||||||
| (In thousands) | 2004 | 2005 | 2006 | 2006 | 2007 | |||||||||||
| Income (loss) at U.S. federal statutory rate | $ | (1,214 | ) | $ | 1,358 | $ | 11,916 | $ | 7,485 | $ | 11,143 | |||||
| State income taxes | (34 | ) | 70 | 2,083 | 894 | 2,192 | ||||||||||
| Stock-based compensation | 333 | 611 | 380 | 285 | — | |||||||||||
| Income tax expense (benefit) | $ | (915 | ) | $ | 2,039 | $ | 14,379 | $ | 8,664 | $ | 13,335 | |||||
F-56
Table of Contents
| December 31, | September 30, | |||||||||||
| (In thousands) | 2005 | 2006 | 2007 | |||||||||
| Deferred tax asset: | ||||||||||||
| Federal net operating loss | $ | 3,192 | $ | — | $ | — | ||||||
| Stock-based compensation | 590 | 3,776 | — | |||||||||
| Financial instruments | 6,365 | — | 3,625 | |||||||||
| Other | 95 | 301 | — | |||||||||
| Total deferred tax assets | 10,242 | 4,077 | 3,625 | |||||||||
| Deferred tax liability: | ||||||||||||
| Oil and gas properties, principally due to differences in basis resulting from acquisitions and depletion and the deduction of intangible drilling costs for tax purposes | (5,338 | ) | (245,464 | ) | (252,261 | ) | ||||||
| Financial instruments | — | (283 | ) | 461 | ||||||||
| Total deferred tax liabilities | (5,338 | ) | (245,747 | ) | (251,800 | ) | ||||||
| Net deferred tax asset (liability) | $ | 4,904 | $ | (241,670 | ) | $ | (248,175 | ) | ||||
F-57
Table of Contents
F-58
Table of Contents
F-59
Table of Contents
F-60
Table of Contents
| Nine months ended | |||||||||||||||
| For the years ended December 31, | September 30, | ||||||||||||||
| (in thousands) | 2004 | 2005 | 2006 | 2006 | 2007 | ||||||||||
| Weighted average common shares outstanding: | |||||||||||||||
| Basic | 994 | 4,059 | 47,287 | 44,710 | 60,648 | ||||||||||
| Dilutive Bundled Capital Options | — | — | 2,516 | 2,443 | 1,130 | ||||||||||
| Dilutive Capital Options | — | — | 192 | 174 | 163 | ||||||||||
| Dilutive common stock options | — | — | 714 | 602 | 852 | ||||||||||
| Dilutive restrictive stock | — | — | 20 | 8 | 65 | ||||||||||
| Diluted | 994 | 4,059 | 50,729 | 47,937 | 62,858 | ||||||||||
F-61
Table of Contents
| December 31, | ||||||
| (in thousands) | 2004 | 2005 | ||||
| Series A preferred stock | 7,235 | 11,957 | ||||
Bundled Capital Options(a) | 1,100 | 1,100 | ||||
Capital Options(a) | 85 | 483 | ||||
Common stock options(a) | 362 | 683 | ||||
| (a) | For unit options, this excludes the preferred stock portion. |
F-62
Table of Contents
F-63
Table of Contents
| Period from | ||||||||||||||||
| April 21, 2004 | ||||||||||||||||
| (inception) | ||||||||||||||||
| through | Years ended | Nine months ended | ||||||||||||||
| December 31, | December 31, | September 30, | ||||||||||||||
| (in thousands) | 2004 | 2005 | 2006 | 2006 | 2007 | |||||||||||
| Property acquisition costs: | ||||||||||||||||
| Proved | $ | 99,382 | $ | 7,834 | $ | 824,382 | $ | 822,810 | $ | 11,801 | ||||||
| Unproved | 10,112 | 14,694 | 217,788 | 218,848 | (2,239 | ) | ||||||||||
| Exploration | 3,198 | 7,301 | 49,394 | 27,912 | 70,973 | |||||||||||
| Development | 1,931 | 38,727 | 126,089 | 85,235 | 44,253 | |||||||||||
| Capitalized asset retirement obligations | 883 | 141 | 7,293 | 6,274 | (1,951 | ) | ||||||||||
| Total costs incurred for oil and gas properties | $ | 115,506 | $ | 68,697 | $ | 1,224,946 | $ | 1,161,079 | $ | 122,837 | ||||||
F-64
Table of Contents
| 2004 | 2005 | 2006 | ||||||||||||||||||||||
| Oil and | Natural | Oil and | Natural | Oil and | Natural | |||||||||||||||||||
| condensate | gas | condensate | gas | condensate | gas | |||||||||||||||||||
| (in thousands) | (MBbls) | (MMcf) | (MBbls) | (MMcf) | (MBbls) | (MMcf) | ||||||||||||||||||
| Total proved reserves | ||||||||||||||||||||||||
| Balance, January 1 | — | — | 6,553 | 35,464 | 9,658 | 49,530 | ||||||||||||||||||
Purchase ofminerals-in-place | 6,191 | 32,609 | 191 | 1,095 | 27,163 | 137,963 | ||||||||||||||||||
| New discoveries and extensions | 407 | 3,146 | 3,256 | 15,864 | 10,226 | 39,427 | ||||||||||||||||||
| Revisions of previous estimates | — | — | 257 | 511 | (430 | ) | (16,595 | ) | ||||||||||||||||
| Production from continuing operations | (45 | ) | (291 | ) | (599 | ) | (3,404 | ) | (2,295 | ) | (9,507 | ) | ||||||||||||
| Balance, December 31 | 6,553 | 35,464 | 9,658 | 49,530 | 44,322 | 200,818 | ||||||||||||||||||
| Proved developed reserves: | ||||||||||||||||||||||||
| January 1 | — | — | 4,536 | 24,366 | 6,502 | 34,160 | ||||||||||||||||||
| December 31 | 4,536 | 24,366 | 6,502 | 34,160 | 23,443 | 112,423 | ||||||||||||||||||
F-65
Table of Contents
F-66
Table of Contents
| (in thousands) | 2004 | 2005 | 2006 | |||||||||
| Oil and gas producing activities: | ||||||||||||
| Future cash inflows | $ | 479,083 | $ | 972,662 | $ | 3,560,326 | ||||||
| Future production costs | (175,319 | ) | (289,938 | ) | (995,335 | ) | ||||||
| Future development and abandonment costs | (26,371 | ) | (62,275 | ) | (484,462 | ) | ||||||
| Future income tax expense | (59,849 | ) | (186,539 | ) | (530,212 | ) | ||||||
| Future net cash flows | 217,544 | 433,910 | 1,550,317 | |||||||||
| 10% annual discount factor | (83,244 | ) | (210,148 | ) | (839,968 | ) | ||||||
| Standardized measure of discounted future cash flows | $ | 134,300 | $ | 223,762 | $ | 710,349 | ||||||
| (in thousands) | 2004 | 2005 | 2006 | |||||||||
Purchases ofminerals-in-place | $ | 140,598 | $ | 7,612 | $ | 795,072 | ||||||
| Extensions and discoveries | 12,074 | 98,826 | 156,266 | |||||||||
| Net changes in prices and production costs | — | 99,041 | (109,264 | ) | ||||||||
| Oil and gas sales, net of production costs | (2,876 | ) | (40,301 | ) | (160,468 | ) | ||||||
| Changes in future development costs | — | (1,649 | ) | (6,085 | ) | |||||||
| Revisions of previous quantity estimates | — | 7,302 | (51,147 | ) | ||||||||
| Accretion of discount | — | 14,933 | 17,317 | |||||||||
| Changes in production rates, timing and other | (471 | ) | (12,596 | ) | (10,119 | ) | ||||||
| Change in present value of future net revenues | 149,325 | 173,168 | 631,572 | |||||||||
| Net change in present value of future income taxes | (15,025 | ) | (83,706 | ) | (144,985 | ) | ||||||
| 134,300 | 89,462 | 486,587 | ||||||||||
| Balance, beginning of year | — | 134,300 | 223,762 | |||||||||
| Balance, end of year | $ | 134,300 | $ | 223,762 | $ | 710,349 | ||||||
F-67
Table of Contents
F-68
Table of Contents
Unaudited pro forma combined statement of operations
Year ended December 31, 2006
| Chase Group | |||||||||||||||
| Properties | |||||||||||||||
| historical | |||||||||||||||
| for the two | |||||||||||||||
| months ended | Pro Forma | ||||||||||||||
| Resources | February 28, | adjustments | |||||||||||||
| (in thousands, except per share amounts) | historical | 2006 | (Notes B & C) | Pro forma | |||||||||||
Operating Revenues: | |||||||||||||||
| Oil sales | $ | 131,773 | $ | 13,940 | $ | 145,713 | |||||||||
| Natural gas sales | 66,517 | 7,516 | 74,033 | ||||||||||||
| Total operating revenues | 198,290 | 21,456 | 219,746 | ||||||||||||
Operating costs and expenses: | |||||||||||||||
| Oil and gas production | 22,060 | 2,396 | 24,456 | ||||||||||||
| Oil and gas production taxes | 15,762 | 1,840 | 17,602 | ||||||||||||
| Exploration and abandonments | 5,612 | — | 5,612 | ||||||||||||
| Depreciation and depletion | 60,722 | 2,217 | 3,211 | (a) | 66,150 | ||||||||||
| Accretion of discount on asset retirement obligations | 287 | 83 | 370 | ||||||||||||
| Impairments of proved oil and gas properties | 9,891 | 1 | 9,892 | ||||||||||||
| General and administrative (including non-cash stock-based compensation) | 21,721 | 284 | 22,005 | ||||||||||||
| Ineffective portion of cash flow hedges | (1,193 | ) | — | (1,193 | ) | ||||||||||
| Total operating costs and expenses | 134,862 | 6,821 | 144,894 | ||||||||||||
Income from operations | 63,428 | 14,635 | 74,852 | ||||||||||||
Other income (expense): | |||||||||||||||
| Interest expense | (30,567 | ) | — | (5,020 | )(b) | (21,677 | ) | ||||||||
| 13,837 | (e) | ||||||||||||||
| 73 | (f) | ||||||||||||||
| Other, net | 1,186 | — | (550 | )(g) | 636 | ||||||||||
| Total other expense | (29,381 | ) | — | (21,041 | ) | ||||||||||
Income before income taxes | 34,047 | 14,635 | 53,811 | ||||||||||||
| Income tax expense | (14,379 | ) | — | (7,707 | )(h) | (22,086 | ) | ||||||||
Net income | 19,668 | 14,635 | 31,725 | ||||||||||||
| Preferred stock dividends | (1,244 | ) | — | 1,244 | (c) | — | |||||||||
| Effect of induced conversion of preferred stock | 11,601 | — | (11,601 | )(d) | — | ||||||||||
Net income applicable to common shareholders | $ | 30,025 | $ | 14,635 | $ | 31,725 | |||||||||
Basic earnings per share: | |||||||||||||||
| Net income per share | $ | 0.63 | $ | 0.45 | |||||||||||
| Shares used in basic earnings per share | 47,287 | 23,347 | 70,634 | ||||||||||||
Diluted earnings per share: | |||||||||||||||
| Net income per share | $ | 0.59 | $ | 0.43 | |||||||||||
| Shares used in diluted earnings per share | 50,729 | 23,443 | 74,172 | ||||||||||||
F-69
Table of Contents
Unaudited pro forma combined statement of operations
Nine months ended September 30, 2007
| Pro forma | ||||||||||||
| Resources | adjustments | |||||||||||
| (in thousands, except per share amounts) | historical | (Note C) | Pro forma | |||||||||
Operating revenues: | ||||||||||||
| Oil sales | $ | 128,152 | $ | 128,152 | ||||||||
| Natural gas sales | 67,395 | 67,395 | ||||||||||
| Total operating revenues | 195,547 | 195,547 | ||||||||||
Operating costs and expenses: | ||||||||||||
| Oil and gas production | 22,309 | 22,309 | ||||||||||
| Oil and gas production taxes | 15,616 | 15,616 | ||||||||||
| Exploration and abandonments | 18,110 | 18,110 | ||||||||||
| Depreciation and depletion | 55,036 | 55,036 | ||||||||||
| Accretion of discount on asset retirement obligations | 334 | 334 | ||||||||||
| Impairments of proved oil and gas properties | 4,577 | 4,577 | ||||||||||
| Contract drilling fees-stacked rigs | 4,269 | 4,269 | ||||||||||
| General and administrative (including non-cash stock-based compensation) | 16,567 | 16,567 | ||||||||||
| Ineffective portion of cash flow hedges | 1,134 | 1,134 | ||||||||||
| Gain on derivatives not designated as hedges | (3,088 | ) | (3,088 | ) | ||||||||
| Total operating costs and expenses | 134,864 | 134,864 | ||||||||||
Income from operations | 60,683 | 60,683 | ||||||||||
Other income (expense): | ||||||||||||
| Interest expense | (29,803 | ) | 8,959 | (e) | (20,819 | ) | ||||||
| 25 | (f) | |||||||||||
| Other, net | 957 | (170 | )(g) | 787 | ||||||||
| Total other expense | (28,846 | ) | (20,032 | ) | ||||||||
Income before income taxes | 31,837 | 40,651 | ||||||||||
| Income tax expenses | (13,335 | ) | (3,696 | )(h) | (17,031 | ) | ||||||
Net income | 18,502 | 23,620 | ||||||||||
| Preferred stock dividends | (45 | ) | 45 | (c) | — | |||||||
Net income applicable to common shareholders | $ | 18,457 | $ | 23,620 | ||||||||
Basic earnings per common share: | ||||||||||||
| Net income per share | $ | 0.30 | $ | 0.31 | ||||||||
| Shares used in basic earnings per share | 60,648 | 16,466 | 77,114 | |||||||||
Diluted earnings per share: | ||||||||||||
| Net income per share | $ | 0.29 | $ | 0.30 | ||||||||
| Shares used in diluted earnings per share | 62,858 | 16,466 | 79,324 | |||||||||
F-70
Table of Contents
| (in thousands) | ||||
| Proved oil and gas properties | $ | 830,540 | ||
| Unproved oil and gas properties | 200,000 | |||
| Total assets acquired | $ | 1,030,540 | ||
| Asset requirement obligations | (6,158 | ) | ||
| Chase investors asset purchase obligation | (906 | ) | ||
| Deferred tax liability | (227,735 | ) | ||
| Total liabilities assumed | $ | (234,799 | ) | |
| Net purchase price | $ | 795,741 | ||
| (a) | To adjust depreciation and depletion for the Chase Group Properties for the acquisition cost recorded by Resources. |
F-71
Table of Contents
| (b) | To adjust interest expense for borrowings of approximately $411 million under Resources’ bank credit facility to effect the Combination calculated at the Resources borrowing rate of 7.85% at December 31, 2006. If the Company’s borrowing rate at December 31, 2006 increased 1/8%, the Company would incur an additional $514,000 of annual interest expense, and if the rate decreased 1/8%, the Company would incur $514,000 less of interest expense. | |
| (c) | To adjust preferred stock dividends accrued from January 1, 2005 on Series A preferred shares of CEHC which were converted to Resources common shares as of the date of the Combination and to adjust for preferred stock dividends accrued from January 1, 2006 on Series A preferred shares of CEHC for employees who exchanged their common and preferred shares of CEHC for common shares of Resources on April 16, 2007. | |
| (d) | To eliminate the effects of the induced conversion of preferred stock on February 23, 2006. |
| (e) | To reduce pro forma interest expense resulting from the pro forma repayment and elimination of $173.0 million indebtedness with net proceeds of the Company’s initial public offering and the repayment of Notes receivable from officers. | |
| (f) | To reduce the amortization of deferred loan fees included in interest expense for the effect of the elimination of deferred loan fees associated with our 2nd Lien Credit Facility as if the Company’s initial public offering had taken place on January 1, 2006. | |
| The Company applied a portion of the proceeds received from its initial public offering as partial repayment of its New 2nd Lien Credit Facility in 2007. As a result, the Company wrote-off approximately $1.0 million in deferred loan fees and original issue discount associated with such credit facility. This write-off has not been included in the pro forma combined statements of operations. | ||
| (g) | To reduce pro forma interest income, classified in the statement of operations asOther income, resulting from the pro forma repayment and elimination of $10.4 millionNotes receivable from officers with their share of net proceeds from the Company’s initial public offering. Proceeds from the repayment ofNotes receivable from officers are applied to the repayment of a portion of the Company’s 1st Lien Credit Facility. | |
| (h) | To adjust income taxes for the Combination of the Chase Group Properties and the Company’s initial public offering at its effective income tax rate. |
F-72
Table of Contents
F-73
Table of Contents
| DECEMBER 31, (in thousands) | 2004 | 2005 | ||||||
ASSETS | ||||||||
| CURRENT ASSETS: | ||||||||
| Accounts receivable: | ||||||||
| Oil and gas sales | $ | 9,532 | $ | 3,949 | ||||
| Oil and gas related party | — | 7,224 | ||||||
| Derivative instruments | — | 1,577 | ||||||
| Total current assets | 9,532 | 12,750 | ||||||
| OIL AND GAS PROPERTIES, SUCCESSFUL EFFORTS METHOD: | ||||||||
| Proved properties | 238,544 | 270,453 | ||||||
| Unproved properties | 1,078 | 1,042 | ||||||
| Salt water disposal system | 966 | 1,214 | ||||||
| Accumulated depletion, depreciation and amortization | (105,020 | ) | (123,667 | ) | ||||
| Total oil and gas properties, net | 135,568 | 149,042 | ||||||
| TOTAL ASSETS | $ | 145,100 | $ | 161,792 | ||||
LIABILITIES AND NET INVESTMENT | ||||||||
| CURRENT LIABILITIES: | ||||||||
| Accounts payable: | ||||||||
| Trade | $ | 352 | $ | 2,153 | ||||
| Related party | 45 | 277 | ||||||
| Current portion of asset retirement obligations | 245 | 402 | ||||||
| Derivative instruments | 3,263 | — | ||||||
| Accrued liabilities | 567 | 615 | ||||||
| Total current liabilities | 4,472 | 3,447 | ||||||
| ASSET RETIREMENT OBLIGATIONS, LESS CURRENT PORTION | 6,614 | 7,531 | ||||||
| COMMITMENTS AND CONTINGENCIES (note K) | ||||||||
| NET INVESTMENT | 134,014 | 150,814 | ||||||
| TOTAL LIABILITIES AND NET INVESTMENT | $ | 145,100 | $ | 161,792 | ||||
F-74
Table of Contents
| Year Ended December 31, (in thousands) | 2003 | 2004 | 2005 | ||||||
| REVENUES: | |||||||||
| Oil sales | $ | 62,016 | $ | 66,529 | $ | 73,132 | |||
| Gas sales | 41,486 | 41,247 | 46,546 | ||||||
| 103,502 | 107,776 | 119,678 | |||||||
| COSTS AND EXPENSES: | |||||||||
| Oil and gas production | 9,868 | 11,762 | 12,979 | ||||||
| Oil and gas production taxes | 8,815 | 9,202 | 10,298 | ||||||
| Depreciation, depletion and amortization | 19,475 | 20,196 | 18,646 | ||||||
| Impairments of proved properties | 2,065 | 3,233 | 194 | ||||||
| Abandonment expense | 2,116 | 179 | — | ||||||
| Accretion of discount on asset retirement obligations | 168 | 263 | 446 | ||||||
| General and administrative | 1,246 | 1,387 | 1,702 | ||||||
| Loss on derivatives not designated as hedges | 576 | 7,936 | 1,062 | ||||||
| 44,329 | 54,158 | 45,327 | |||||||
| Revenues in excess of expenses | $ | 59,173 | $ | 53,618 | $ | 74,351 | |||
F-75
Table of Contents
| Years Ended December 31, 2003, 2004, and 2005 (in thousands) | Total | |||
| BALANCE AT JANUARY 1, 2003 | $ | 127,821 | ||
| Net change in investment | (52,441 | ) | ||
| Revenues in excess of expenses | 59,173 | |||
| BALANCE AT DECEMBER 31, 2003 | 134,553 | |||
| Net change in investment | (54,157 | ) | ||
| Revenues in excess of expenses | 53,618 | |||
| BALANCE AT DECEMBER 31, 2004 | 134,014 | |||
| Net change in investment | (57,551 | ) | ||
| Revenues in excess of expenses | 74,351 | |||
| BALANCE AT DECEMBER 31, 2005 | $ | 150,814 | ||
F-76
Table of Contents
| Year Ended December 31, (in thousands) | 2003 | 2004 | 2005 | |||||||||
| CASH FLOWS FROM OPERATING ACTIVITIES: | ||||||||||||
| Revenues in excess of expenses | $ | 59,173 | $ | 53,618 | $ | 74,351 | ||||||
| Adjustments to reconcile revenues in excess of expenses to net cash provided by operating activities: | ||||||||||||
| Depreciation, depletion and amortization | 19,475 | 20,196 | 18,646 | |||||||||
| Impairments of proved properties | 2,065 | 3,233 | 194 | |||||||||
| Abandonment expense | 2,116 | 179 | — | |||||||||
| Accretion of discount on asset retirement obligations | 168 | 263 | 446 | |||||||||
| Loss on derivative instruments not designated as hedges | 576 | 7,936 | 1,062 | |||||||||
| Changes in operating assets and liabilities: | ||||||||||||
| Accounts receivable | 704 | (1,219 | ) | (1,641 | ) | |||||||
| Accounts payable | (45 | ) | (12 | ) | 113 | |||||||
| Accrued liabilities | 33 | 36 | 48 | |||||||||
| Cash settlements of asset retirement obligations | (1 | ) | (28 | ) | (57 | ) | ||||||
| Net cash provided by operating activities | 84,264 | 84,202 | 93,162 | |||||||||
| CASH FLOWS FROM INVESTING ACTIVITIES: | ||||||||||||
| Cash settlements on derivative instruments | (2,374 | ) | (4,673 | ) | (5,902 | ) | ||||||
| Additions to oil and gas properties | (29,449 | ) | (25,372 | ) | (29,709 | ) | ||||||
| Net cash used in investing activities | (31,823 | ) | (30,045 | ) | (35,611 | ) | ||||||
| CASH FLOWS FROM FINANCING ACTIVITIES: | ||||||||||||
| Net change in investment | (52,441 | ) | (54,157 | ) | (57,551 | ) | ||||||
| Net cash used in financing activities | (52,441 | ) | (54,157 | ) | (57,551 | ) | ||||||
| Net change in cash | — | — | — | |||||||||
| BEGINNING CASH | — | — | — | |||||||||
| ENDING CASH | $ | — | $ | — | $ | — | ||||||
F-77
Table of Contents
F-78
Table of Contents
F-79
Table of Contents
F-80
Table of Contents
F-81
Table of Contents
F-82
Table of Contents
| (In thousands) | 2003 | 2004 | 2005 | |||||||||
| Asset retirement obligations, beginning of year | $ | 4,805 | $ | 5,538 | $ | 6,859 | ||||||
| Liability incurred upon acquiring and drilling wells | 663 | 991 | 790 | |||||||||
| Liability settled upon plugging and abandoning wells | (1 | ) | (28 | ) | (57 | ) | ||||||
| Revisions to estimated cash flows | (97 | ) | 95 | (105 | ) | |||||||
| Accretion expense | 168 | 263 | 446 | |||||||||
| Asset retirement obligations, end of year | $ | 5,538 | $ | 6,859 | $ | 7,933 | ||||||
F-83
Table of Contents
| Contract Period | ||||||
| As of December 31, 2005 | 2005 | 2006 | ||||
| Daily gas production: | ||||||
| Swap: | ||||||
| Volume (MMBtu/day) | — | 5,000 | ||||
| Index price per MMBtu | — | $ | 10.73 | |||
NYMEX price per MMBtu(a) | — | $ | 8.66 | |||
| Contract Period | ||||||
| As of December 31, 2004 | 2005 | 2006 | ||||
| Daily oil production: | ||||||
| Collar Options: | ||||||
| Volume (Bbl/day) | 2,000 | — | ||||
NYMEX price per Bbl(b) | $ | 50.40 | — | |||
| Floor | $ | 28.00 | — | |||
| Ceiling | $ | 37.00 | — | |||
| Collar Options: | ||||||
| Volume (Bbl/day) | 2,000 | — | ||||
NYMEX price per Bbl(b) | $ | 50.40 | — | |||
| Floor | $ | 31.00 | — | |||
| Ceiling | $ | 40.00 | — | |||
| (a) | Amount disclosed represents U.S. Natural Gas Wellhead price monthly average spot price. | |
| (b) | Amount disclosed represents NYMEX West Texas Intermediate monthly average spot price. |
| 2003 | $ | 576,000 | |
| 2004 | 7,936,000 | ||
| 2005 | 1,062,000 | ||
F-84
Table of Contents
F-85
Table of Contents
| (In thousands) | December 31, 2004 | December 31, 2005 | ||||||
| Oil and gas properties: | ||||||||
| Proved | $ | 238,544 | $ | 270,453 | ||||
| Unproved | 1,078 | 1,042 | ||||||
| Less accumulated depletion, depreciation, and amortization | (105,020 | ) | (123,667 | ) | ||||
| Net capitalized costs for oil and gas properties | $ | 134,602 | $ | 147,828 | ||||
| Year Ended | Year Ended | |||||
| (In thousands) | December 31, 2004 | December 31, 2005 | ||||
| Property acquisition costs: | ||||||
| Proved | $ | 1,277 | $ | 8,283 | ||
| Unproved | 333 | — | ||||
| Development | 22,755 | 23,384 | ||||
| Asset retirement costs | 1,086 | 685 | ||||
| Costs incurred for oil and gas properties | $ | 25,451 | $ | 32,352 | ||
F-86
Table of Contents
| 2003 | 2004 | 2005 | ||||||||||||||||||||||
| Oil and | Natural | Oil and | Natural | Oil and | Natural | |||||||||||||||||||
| Condensate | Gas | Condensate | Gas | Condensate | Gas | |||||||||||||||||||
| (MBbls) | (MMcf) | (MBbls) | (MMcf) | (MBbls) | (MMcf) | |||||||||||||||||||
| Total Proved Reserves | ||||||||||||||||||||||||
| Balance, beginning of year | 28,234 | 139,362 | 27,520 | 140,464 | 26,692 | 139,118 | ||||||||||||||||||
Purchase ofminerals-in-place | — | — | — | — | 733 | 1,457 | ||||||||||||||||||
| New discoveries and extensions | 147 | 433 | 85 | 150 | 1,118 | 2,438 | ||||||||||||||||||
| Revisions of previous estimates | 1,264 | 9,327 | 838 | 6,140 | 719 | 5,031 | ||||||||||||||||||
| Production | (2,125 | ) | (8,658 | ) | (1,751 | ) | (7,636 | ) | (1,429 | ) | (6,636 | ) | ||||||||||||
| Balance, end of year | 27,520 | 140,464 | 26,692 | 139,118 | 27,833 | 141,408 | ||||||||||||||||||
| Proved Developed Reserves: | ||||||||||||||||||||||||
| Beginning of year | 14,915 | 77,934 | 14,104 | 79,802 | 13,318 | 78,121 | ||||||||||||||||||
| End of year | 14,104 | 79,802 | 13,318 | 78,121 | 13,365 | 77,331 | ||||||||||||||||||
F-87
Table of Contents
| December 31, | December 31, | December 31, | ||||||||||
| (In thousands) | 2003 | 2004 | 2005 | |||||||||
| Oil and gas producing activities: | ||||||||||||
| Future cash inflows | $ | 1,586,671 | $ | 1,895,936 | $ | 2,980,762 | ||||||
| Future production costs, abandonment and taxes | (446,938 | ) | (503,389 | ) | (677,934 | ) | ||||||
| Future development costs | (203,403 | ) | (255,054 | ) | (302,331 | ) | ||||||
| Future net cash flows | 936,330 | 1,137,493 | 2,000,497 | |||||||||
| 10% annual discount factor | (478,073 | ) | (591,352 | ) | (998,521 | ) | ||||||
| Standardized measure of discounted future cash flows | $ | 458,257 | $ | 546,141 | $ | 1,001,976 | ||||||
| December 31, | December 31, | December 31, | ||||||||||
| (In thousands) | 2003 | 2004 | 2005 | |||||||||
Purchases ofminerals-in-place | $ | — | $ | — | $ | 12,380 | ||||||
| Extensions and discoveries | 2,000 | 1,114 | 17,706 | |||||||||
| Net changes in prices and production costs | 79,426 | 139,744 | 411,692 | |||||||||
| Oil and gas sales, net of production costs | (84,819 | ) | (86,812 | ) | (96,401 | ) | ||||||
| Revisions of previous quantity estimates | 31,036 | 25,440 | 34,010 | |||||||||
| Accretion of discount | 40,195 | 45,826 | 54,614 | |||||||||
| Development costs changes | (22,269 | ) | (31,502 | ) | (18,275 | ) | ||||||
| Changes in production rates, timing and other | 10,735 | (5,926 | ) | 40,109 | ||||||||
| Change in present value of future net revenues | 56,304 | 87,884 | 455,835 | |||||||||
| Balance, beginning of year | 401,953 | 458,257 | 546,141 | |||||||||
| Balance, end of year | $ | 458,257 | $ | 546,141 | $ | 1,001,976 | ||||||
F-88
Table of Contents
F-89
Table of Contents
Concho Equity Holdings Corp.:
F-90
Table of Contents
| 11 months | ||||||
| Year ended | ended | |||||
| December 31, | November 30, | |||||
| (in thousands) | 2003 | 2004 | ||||
Revenues: | ||||||
| Oil and gas sales | $ | 31,392 | $ | 33,753 | ||
| Interest and other | 979 | 910 | ||||
| Total revenues | 32,371 | 34,663 | ||||
Direct operating expenses: | ||||||
| Lease operating expense | 6,652 | 6,983 | ||||
| Production taxes | 2,023 | 2,159 | ||||
| Other expenses | 435 | 461 | ||||
| Total direct operating expenses | 9,110 | 9,603 | ||||
Revenues in excess of direct operating expenses | $ | 23,261 | $ | 25,060 | ||
F-91
Table of Contents
direct operating expenses
For the year ended December 31, 2003 and
period from January 1, 2004 to November 30, 2004
F-92
Table of Contents
F-93
Table of Contents
| Year ended | 11 months ended | |||||||||||||||
| December 31, 2003 | November 30, 2004 | |||||||||||||||
| Oil and | Natural | Oil and | Natural | |||||||||||||
| condensate | gas | condensate | gas | |||||||||||||
| (MBbls) | (MMcf) | (MBbls) | (MMcf) | |||||||||||||
| Total Proved Reserves | ||||||||||||||||
| Balance at beginning of period | 6,186 | 34,596 | 5,763 | 33,455 | ||||||||||||
| New discoveries and extensions | 88 | 1,872 | 31 | 91 | ||||||||||||
| Revisions of previous estimates | 55 | 45 | 928 | 1,557 | ||||||||||||
| Production from continuing operations | (566 | ) | (3,058 | ) | (483 | ) | (2,778 | ) | ||||||||
| Balance at end of period | 5,763 | 33,455 | 6,239 | 32,325 | ||||||||||||
| Proved Developed Reserves | ||||||||||||||||
| Balance at end of period | 4,179 | 25,434 | 4,497 | 23,562 | ||||||||||||
F-94
Table of Contents
| 11 months | ||||||||
| 9 Year ended | ended | |||||||
| December 31, | November 30, | |||||||
| 2003 | 2004 | |||||||
| (in thousands) | (in thousands) | |||||||
| Oil and gas producing activities: | ||||||||
| Future cash inflows | $ | 316,376 | $ | 517,956 | ||||
| Future production costs | (128,943 | ) | (177,881 | ) | ||||
| Future development and abandonment costs | (29,729 | ) | (22,115 | ) | ||||
| Future net cash flows | 157,704 | 317,960 | ||||||
| 10% annual discount factor | (78,094 | ) | (149,811 | ) | ||||
| Standardized measure of discounted future cash flows | $ | 79,610 | $ | 168,149 | ||||
| 11 months | ||||||||
| Year ended | ended | |||||||
| December 31, | November 30, | |||||||
| 2003 | 2004 | |||||||
| (in thousands) | (in thousands) | |||||||
| Purchases of minerals in place | $ | — | $ | — | ||||
| Extensions and discoveries, less related cost | 5,987 | 994 | ||||||
| Net changes in prices and production costs | (4,241 | ) | 65,771 | |||||
| Oil and gas sales, net of production costs | (22,717 | ) | (24,611 | ) | ||||
| Revisions of previous quantity estimates | 437 | 16,149 | ||||||
| Accretion of discount | 7,362 | 7,961 | ||||||
| Changes in production rates, timing and other | 19,159 | 22,275 | ||||||
| Change in present value of future net revenues | 5,987 | 88,539 | ||||||
| Balance, beginning of year | 73,623 | 79,610 | ||||||
| Balance, end of year | $ | 79,610 | $ | 168,149 | ||||
F-95
Table of Contents
![[NSA Letterhead]](https://capedge.com/proxy/S-1/0000950134-07-024580/h51487h5148750.gif)
| Net Reserves | Future Net Revenue ($) | |||||||||||||||
| Oil | Gas | Present Worth | ||||||||||||||
| Category | (Barrels) | (MCF) | Total | at 10% | ||||||||||||
| Proved Developed | ||||||||||||||||
| Producing | 7,025,581 | 28,408,884 | 304,584,100 | 169,222,500 | ||||||||||||
| Non-Producing | 577,258 | 5,311,605 | 39,230,900 | 14,646,900 | ||||||||||||
| Proved Undeveloped | 3,610,267 | 11,328,375 | 125,088,200 | 45,328,700 | ||||||||||||
| Total Proved | 11,213,106 | 45,048,864 | 468,903,200 | 229,198,100 | ||||||||||||
| 4500 Thanksgiving Tower • 1601 Elm Street • Dallas, Texas75201-4754 • Ph:214-969-5401 • Fax:214-969-5411 | nsai@nsai-petro.com |
| 1221 Lamar Street, Suite 1200 • Houston, Texas77010-3072 • Ph:713-654-4950 • Fax:713-654-4951 | netherlandsewell.com |
A-1
Table of Contents
![[NSA Logo]](https://capedge.com/proxy/S-1/0000950134-07-024580/h51487h5148751.gif)
A-2
Table of Contents
| By: | /s/ C.H. (Scott) Rees III, P.E. |
| By: | /s/ G. Lance Binder, P.E. |
A-3
Table of Contents
Adapted from Securities and Exchange Commission
Regulation S-XRule 4-10(a)
A-4
Table of Contents
Adapted from Securities and Exchange Commission
Regulation S-XRule 4-10(a)
A-5
Table of Contents
Adapted from Securities and Exchange Commission
Regulation S-XRule 4-10(a)
| (A) | oil that may become available from known reservoirs but is classified separately as “indicated additional reserves”; |
| (B) | crude oil, natural gas, and natural gas liquids, the recovery of which is subject to reasonable doubt because of uncertainty as to geology, reservoir characteristics, or economic factors; | |
| (C) | crude oil, natural gas, and natural gas liquids, that may occur in undrilled prospects; and |
| (D) | crude oil, natural gas, and natural gas liquids, that may be recovered from oil shales, coal, gilsonite and other such sources. |
A-6
Table of Contents
Adapted from Securities and Exchange Commission
Regulation S-XRule 4-10(a)
A-7
Table of Contents
Adapted from Securities and Exchange Commission
Regulation S-XRule 4-10(a)
A-8
Table of Contents
Adapted from Securities and Exchange Commission
Regulation S-XRule 4-10(a)
| (g) | Topic 12 of Accounting Series Release No. 257 of the Staff Accounting Bulletins states: In certain instances, proved reserves may be assigned to reservoirs on the basis of a combination of electrical and other type logs and core analyses which indicate the reservoirs are analogous to similar reservoirs in the same field which are producing or have demonstrated the ability to produce on a formation test. |
A-9
Table of Contents
As of
12-31-6
| Cog Oil & Gas LP Interest | Summary — All Properties |
| Gross Revenue | ||||||||||||||||||||||||||||||||||||||||||||||||
| Gross | Net | Gross | Net | Incl Prod+Adval Taxes | Prod+Av | Net Cap | Operating | Net | Cum P.W. | |||||||||||||||||||||||||||||||||||||||
| Period | Oil/cond | Oil/cond | Gas | Gas | Oil | Gas | Total | Taxes | Cost | Expense | Revenue | 10.000% | ||||||||||||||||||||||||||||||||||||
| Ending | MBBL | MBBL | MMCF | MMCF | M$ | M$ | M$ | M$ | M$ | M$ | M$ | M$ | ||||||||||||||||||||||||||||||||||||
12-31- 7 | 3199.669 | 823.536 | 24450.690 | 4005.191 | 46680.9 | 19275.9 | 65956.8 | 6064.6 | 23522.6 | 8878.0 | 27491.6 | 25765.6 | ||||||||||||||||||||||||||||||||||||
12-31- 8 | 3212.573 | 824.063 | 23094.982 | 3952.675 | 46744.2 | 18993.7 | 65737.9 | 6041.2 | 35131.1 | 9215.5 | 15350.1 | 38927.7 | ||||||||||||||||||||||||||||||||||||
12-31- 9 | 3282.296 | 891.661 | 22269.744 | 3839.593 | 50466.4 | 18488.8 | 68955.2 | 6322.4 | 11428.3 | 9576.7 | 41627.8 | 71695.4 | ||||||||||||||||||||||||||||||||||||
| 12-31-10 | 2968.204 | 803.848 | 19825.327 | 3295.627 | 45342.7 | 15823.0 | 61165.7 | 5562.6 | 2018.8 | 9668.6 | 43915.7 | 103203.3 | ||||||||||||||||||||||||||||||||||||
| 12-31-11 | 2676.701 | 695.398 | 16985.892 | 2783.567 | 39210.3 | 13363.4 | 52573.7 | 4774.2 | 622.4 | 9611.8 | 37565.3 | 127704.6 | ||||||||||||||||||||||||||||||||||||
| 12-31-12 | 2483.810 | 626.504 | 14881.742 | 2420.963 | 35372.7 | 11692.7 | 47065.4 | 4276.9 | 1653.2 | 9507.5 | 31627.8 | 146438.8 | ||||||||||||||||||||||||||||||||||||
| 12-31-13 | 2312.396 | 573.578 | 13148.341 | 2116.431 | 32410.9 | 10277.8 | 42688.7 | 3878.9 | 310.3 | 9352.5 | 29147.0 | 162152.1 | ||||||||||||||||||||||||||||||||||||
| 12-31-14 | 2112.708 | 516.919 | 11622.560 | 1858.132 | 29184.4 | 9008.5 | 38192.9 | 3459.5 | 385.3 | 9004.0 | 25344.1 | 174567.8 | ||||||||||||||||||||||||||||||||||||
| 12-31-15 | 1942.136 | 470.228 | 10387.162 | 1661.131 | 26525.7 | 8046.2 | 34571.9 | 3127.2 | 349.7 | 8670.2 | 22424.8 | 184556.7 | ||||||||||||||||||||||||||||||||||||
| 12-31-16 | 1817.021 | 434.486 | 9504.547 | 1544.437 | 24494.4 | 7470.0 | 31964.4 | 2892.1 | 457.4 | 8580.5 | 20034.4 | 192666.4 | ||||||||||||||||||||||||||||||||||||
| 12-31-17 | 1731.750 | 404.446 | 8727.324 | 1430.286 | 22787.0 | 6918.6 | 29705.6 | 2685.2 | 386.8 | 8503.0 | 18130.6 | 199339.8 | ||||||||||||||||||||||||||||||||||||
| 12-31-18 | 1661.803 | 378.513 | 8353.596 | 1414.999 | 21306.6 | 6858.6 | 28165.2 | 2547.4 | 349.9 | 8302.9 | 16965.0 | 205016.1 | ||||||||||||||||||||||||||||||||||||
| 12-31-19 | 1575.032 | 351.499 | 7510.065 | 1247.434 | 19752.6 | 6043.8 | 25796.4 | 2317.8 | 299.7 | 8022.3 | 15156.6 | 209626.1 | ||||||||||||||||||||||||||||||||||||
| 12-31-20 | 1478.254 | 325.439 | 6800.844 | 1124.854 | 18279.7 | 5453.8 | 23733.5 | 2128.1 | 188.3 | 7881.7 | 13535.4 | 213369.8 | ||||||||||||||||||||||||||||||||||||
| 12-31-21 | 1288.768 | 297.743 | 6043.443 | 1019.599 | 16709.3 | 4936.0 | 21645.3 | 1940.8 | 77.7 | 7515.9 | 12110.9 | 216415.5 | ||||||||||||||||||||||||||||||||||||
| SUBTOTAL | 33743.121 | 8417.861 | 203606.259 | 33714.919 | 475267.8 | 162650.8 | 637918.6 | 58018.9 | 77181.5 | 132291.1 | 370427.1 | 216415.5 | ||||||||||||||||||||||||||||||||||||
| REMAING | 8799.659 | 2795.245 | 62534.918 | 11333.945 | 157538.4 | 54598.1 | 212136.5 | 19011.3 | 887.7 | 93761.4 | 98476.1 | 229198.1 | ||||||||||||||||||||||||||||||||||||
| TOTAL OF 65.0 YRS | 42542.780 | 11213.106 | 266141.177 | 45048.864 | 632806.2 | 217248.9 | 850055.1 | 77030.2 | 78069.2 | 226052.5 | 468903.2 | 229198.1 | ||||||||||||||||||||||||||||||||||||
| CUM PROD | 96643.548 | 1244209.325 | ||||||||||||||||||||||||||||||||||||||||||||||
| ULTIMATE | 139186.328 | 1510350.502 | ||||||||||||||||||||||||||||||||||||||||||||||
| FOR | 8.00 | PCT, | PRESENT WORTH | M$ | 256230.5 | |||||||||||||||
| FOR | 12.00 | PCT, | PRESENT WORTH | M$ | 207055.9 | |||||||||||||||
| FOR | 15.00 | PCT, | PRESENT WORTH | M$ | 180500.2 | |||||||||||||||
| FOR | 20.00 | PCT, | PRESENT WORTH | M$ | 148144.4 | |||||||||||||||
| FOR | 25.00 | PCT, | PRESENT WORTH | M$ | 125216.3 |
A-10
Table of Contents
As of
12-31-6
| Cog Oil & Gas LP Interest | Summary — All Properties |
| Gross Revenue | ||||||||||||||||||||||||||||||||||||||||||||||||
| Gross | Net | Gross | Net | Incl Prod+Adval Taxes | Prod+Av | Net Cap | Operating | Net | Cum P.W. | |||||||||||||||||||||||||||||||||||||||
| Period | Oil/cond | Oil/cond | Gas | Gas | Oil | Gas | Total | Taxes | Cost | Expense | Revenue | 10.000% | ||||||||||||||||||||||||||||||||||||
| Ending | MBBL | MBBL | MMCF | MMCF | M$ | M$ | M$ | M$ | M$ | M$ | M$ | M$ | ||||||||||||||||||||||||||||||||||||
12-31- 7 | 2762.958 | 670.536 | 21341.080 | 3203.759 | 37977.3 | 15413.2 | 53390.5 | 4893.8 | 0.0 | 8475.2 | 40021.5 | 38278.1 | ||||||||||||||||||||||||||||||||||||
12-31- 8 | 2342.335 | 549.859 | 17133.873 | 2480.192 | 31124.8 | 11968.8 | 43093.6 | 3937.4 | 0.0 | 8354.8 | 30801.4 | 65031.8 | ||||||||||||||||||||||||||||||||||||
12-31- 9 | 2082.950 | 480.240 | 14693.301 | 2104.968 | 27180.6 | 10175.3 | 37355.9 | 3405.7 | 0.0 | 8174.5 | 25775.7 | 85376.8 | ||||||||||||||||||||||||||||||||||||
| 12-31-10 | 1884.684 | 430.692 | 12967.634 | 1858.733 | 24373.9 | 8994.7 | 33368.6 | 3040.8 | 0.0 | 8094.2 | 22233.6 | 101328.4 | ||||||||||||||||||||||||||||||||||||
| 12-31-11 | 1694.589 | 388.017 | 11599.098 | 1664.089 | 21950.1 | 8057.6 | 30007.7 | 2739.2 | 0.0 | 8021.9 | 19246.6 | 113881.3 | ||||||||||||||||||||||||||||||||||||
| 12-31-12 | 1559.214 | 356.997 | 10457.550 | 1502.883 | 20190.2 | 7277.4 | 27467.6 | 2504.7 | 0.0 | 7873.5 | 17089.4 | 124014.7 | ||||||||||||||||||||||||||||||||||||
| 12-31-13 | 1435.576 | 330.782 | 9480.021 | 1354.603 | 18702.0 | 6565.6 | 25267.6 | 2299.4 | 0.0 | 7709.3 | 15258.9 | 132238.6 | ||||||||||||||||||||||||||||||||||||
| 12-31-14 | 1316.163 | 305.889 | 8567.040 | 1222.115 | 17286.6 | 5926.3 | 23212.9 | 2111.2 | 0.0 | 7379.3 | 13722.4 | 138961.5 | ||||||||||||||||||||||||||||||||||||
| 12-31-15 | 1208.778 | 283.731 | 7732.036 | 1101.372 | 16026.8 | 5341.7 | 21368.5 | 1942.2 | 0.0 | 7037.4 | 12388.9 | 144480.1 | ||||||||||||||||||||||||||||||||||||
| 12-31-16 | 1123.511 | 266.177 | 7096.232 | 1012.323 | 15031.4 | 4911.9 | 19943.3 | 1811.1 | 0.0 | 6930.2 | 11202.0 | 149015.4 | ||||||||||||||||||||||||||||||||||||
| 12-31-17 | 1045.095 | 250.172 | 6519.186 | 933.088 | 14124.8 | 4529.4 | 18654.2 | 1692.1 | 0.0 | 6847.4 | 10114.7 | 152738.6 | ||||||||||||||||||||||||||||||||||||
| 12-31-18 | 971.997 | 233.709 | 5969.685 | 853.534 | 13194.5 | 4154.6 | 17349.1 | 1572.0 | 0.0 | 6662.4 | 9114.7 | 155789.0 | ||||||||||||||||||||||||||||||||||||
| 12-31-19 | 900.907 | 217.416 | 5486.989 | 782.153 | 12273.8 | 3813.1 | 16086.9 | 1452.2 | 0.0 | 6424.9 | 8209.8 | 158286.5 | ||||||||||||||||||||||||||||||||||||
| 12-31-20 | 838.336 | 203.943 | 5028.201 | 721.817 | 11514.4 | 3527.2 | 15041.6 | 1356.9 | 0.0 | 6321.2 | 7363.5 | 160323.2 | ||||||||||||||||||||||||||||||||||||
| 12-31-21 | 704.656 | 187.389 | 4484.484 | 665.744 | 10569.5 | 3251.4 | 13820.9 | 1247.1 | 0.0 | 5974.4 | 6599.4 | 161982.4 | ||||||||||||||||||||||||||||||||||||
| SUBTOTAL | 21871.749 | 5155.549 | 148556.410 | 21461.373 | 291520.7 | 103908.2 | 395428.9 | 36005.8 | 0.0 | 110280.6 | 249142.5 | 161982.4 | ||||||||||||||||||||||||||||||||||||
| REMAING | 4860.515 | 1870.032 | 43555.071 | 6947.511 | 105960.0 | 34444.3 | 140404.3 | 12556.5 | 0.0 | 72406.2 | 55441.6 | 169222.5 | ||||||||||||||||||||||||||||||||||||
| TOTAL OF 50.0 YRS | 26732.264 | 7025.581 | 192111.481 | 28408.884 | 397480.7 | 138352.5 | 535833.2 | 48562.3 | 0.0 | 182686.8 | 304584.1 | 169222.5 | ||||||||||||||||||||||||||||||||||||
| CUM PROD | 96643.225 | 1243502.217 | ||||||||||||||||||||||||||||||||||||||||||||||
| ULTIMATE | 123375.489 | 1435613.698 | ||||||||||||||||||||||||||||||||||||||||||||||
| FOR | 8.00 | PCT, | PRESENT WORTH | M$ | 184710.2 | |||||||||||||||
| FOR | 12.00 | PCT, | PRESENT WORTH | M$ | 156474.9 | |||||||||||||||
| FOR | 15.00 | PCT, | PRESENT WORTH | M$ | 141071.9 | |||||||||||||||
| FOR | 20.00 | PCT, | PRESENT WORTH | M$ | 122050.8 | |||||||||||||||
| FOR | 25.00 | PCT, | PRESENT WORTH | M$ | 108305.0 |
A-11
Table of Contents
As of
12-31-6
| Cog Oil & Gas LP Interest | Summary — All Properties |
| Gross Revenue | ||||||||||||||||||||||||||||||||||||||||||||||||
| Gross | Net | Gross | Net | Incl Prod+Adval Taxes | Prod+Av | Net Cap | Operating | Net | Cum P.W. | |||||||||||||||||||||||||||||||||||||||
| Period | Oil/cond | Oil/cond | Gas | Gas | Oil | Gas | Total | Taxes | Cost | Expense | Revenue | 10.000% | ||||||||||||||||||||||||||||||||||||
| Ending | MBBL | MBBL | MMCF | MMCF | M$ | M$ | M$ | M$ | M$ | M$ | M$ | M$ | ||||||||||||||||||||||||||||||||||||
12-31- 7 | 99.185 | 37.564 | 1854.805 | 455.414 | 2108.0 | 2160.6 | 4268.6 | 401.2 | 3406.3 | 129.9 | 331.2 | 185.7 | ||||||||||||||||||||||||||||||||||||
12-31- 8 | 106.263 | 35.476 | 1752.726 | 424.279 | 2008.3 | 2032.4 | 4040.7 | 379.8 | 842.2 | 174.2 | 2644.5 | 2484.3 | ||||||||||||||||||||||||||||||||||||
12-31- 9 | 98.650 | 34.416 | 1349.869 | 335.515 | 1961.4 | 1621.6 | 3583.0 | 342.5 | 34.8 | 212.5 | 2993.2 | 4849.4 | ||||||||||||||||||||||||||||||||||||
| 12-31-10 | 73.116 | 25.770 | 961.269 | 243.176 | 1462.1 | 1173.8 | 2635.9 | 249.0 | 0.0 | 212.4 | 2174.5 | 6411.5 | ||||||||||||||||||||||||||||||||||||
| 12-31-11 | 62.574 | 21.942 | 746.019 | 194.949 | 1243.8 | 939.3 | 2183.1 | 205.4 | 90.0 | 216.3 | 1671.4 | 7501.0 | ||||||||||||||||||||||||||||||||||||
| 12-31-12 | 72.013 | 24.883 | 646.164 | 170.997 | 1424.6 | 829.9 | 2254.5 | 207.6 | 39.5 | 231.4 | 1776.0 | 8550.6 | ||||||||||||||||||||||||||||||||||||
| 12-31-13 | 68.130 | 24.256 | 535.695 | 145.893 | 1393.5 | 714.2 | 2107.7 | 191.3 | 0.0 | 230.5 | 1685.9 | 9459.8 | ||||||||||||||||||||||||||||||||||||
| 12-31-14 | 58.326 | 21.491 | 462.845 | 128.693 | 1232.2 | 626.9 | 1859.1 | 168.2 | 75.0 | 224.7 | 1391.2 | 10139.9 | ||||||||||||||||||||||||||||||||||||
| 12-31-15 | 49.890 | 18.785 | 411.633 | 116.478 | 1074.9 | 564.0 | 1638.9 | 148.6 | 50.0 | 226.4 | 1213.9 | 10681.3 | ||||||||||||||||||||||||||||||||||||
| 12-31-16 | 47.714 | 17.624 | 482.087 | 141.279 | 1007.7 | 672.3 | 1680.0 | 155.1 | 143.3 | 238.7 | 1142.9 | 11142.7 | ||||||||||||||||||||||||||||||||||||
| 12-31-17 | 46.586 | 16.808 | 507.471 | 148.457 | 960.8 | 707.7 | 1668.5 | 156.2 | 72.7 | 245.4 | 1194.2 | 11582.6 | ||||||||||||||||||||||||||||||||||||
| 12-31-18 | 51.964 | 18.973 | 829.471 | 246.915 | 1075.4 | 1192.9 | 2268.3 | 216.8 | 50.2 | 250.9 | 1750.4 | 12167.8 | ||||||||||||||||||||||||||||||||||||
| 12-31-19 | 59.107 | 21.976 | 605.882 | 181.651 | 1228.8 | 875.1 | 2103.9 | 193.9 | 0.0 | 252.9 | 1657.1 | 12672.3 | ||||||||||||||||||||||||||||||||||||
| 12-31-20 | 50.202 | 18.880 | 483.510 | 146.235 | 1054.4 | 702.5 | 1756.9 | 161.0 | 0.0 | 243.7 | 1352.2 | 13046.9 | ||||||||||||||||||||||||||||||||||||
| 12-31-21 | 45.772 | 16.794 | 416.188 | 125.140 | 938.7 | 598.6 | 1537.3 | 140.8 | 25.0 | 241.4 | 1130.1 | 13330.8 | ||||||||||||||||||||||||||||||||||||
| SUBTOTAL | 989.492 | 355.638 | 12045.634 | 3205.071 | 20174.6 | 15411.8 | 35586.4 | 3317.4 | 4829.0 | 3331.3 | 24108.7 | 13330.8 | ||||||||||||||||||||||||||||||||||||
| REMAING | 453.475 | 221.620 | 9427.261 | 2106.534 | 12537.5 | 9955.8 | 22493.3 | 2084.7 | 887.7 | 4398.7 | 15122.2 | 14646.9 | ||||||||||||||||||||||||||||||||||||
| TOTAL OF 65.0 YRS | 1442.967 | 577.258 | 21472.895 | 5311.605 | 32712.1 | 25367.6 | 58079.7 | 5402.1 | 5716.7 | 7730.0 | 39230.9 | 14646.9 | ||||||||||||||||||||||||||||||||||||
| CUM PROD | 0.323 | 707.108 | ||||||||||||||||||||||||||||||||||||||||||||||
| ULTIMATE | 1443.290 | 22180.003 | ||||||||||||||||||||||||||||||||||||||||||||||
| FOR | 8.00 | PCT, | PRESENT WORTH | M$ | 16750.1 | |||||||||||||||
| FOR | 12.00 | PCT, | PRESENT WORTH | M$ | 12998.0 | |||||||||||||||
| FOR | 15.00 | PCT, | PRESENT WORTH | M$ | 11095.3 | |||||||||||||||
| FOR | 20.00 | PCT, | PRESENT WORTH | M$ | 8866.2 | |||||||||||||||
| FOR | 25.00 | PCT, | PRESENT WORTH | M$ | 7331.3 |
A-12
Table of Contents
As of
12-31-6
| Cog Oil & Gas LP Interest | Summary — All Properties |
| Gross Revenue | ||||||||||||||||||||||||||||||||||||||||||||||||
| Gross | Net | Gross | Net | Incl Prod+Adval Taxes | Prod+Av | Net Cap | Operating | Net | CUM P.W. | |||||||||||||||||||||||||||||||||||||||
| Period | Oil/cond | Oil/cond | Gas | Gas | Oil | Gas | Total | Taxes | Cost | Expense | Revenue | 10.000% | ||||||||||||||||||||||||||||||||||||
| Ending | MBBL | MBBL | MMCF | MMCF | M$ | M$ | M$ | M$ | M$ | M$ | M$ | M$ | ||||||||||||||||||||||||||||||||||||
12-31- 7 | 337.526 | 115.436 | 1254.805 | 346.018 | 6595.6 | 1702.1 | 8297.7 | 769.6 | 20116.3 | 272.9 | −12861.1 | −12698.2 | ||||||||||||||||||||||||||||||||||||
12-31- 8 | 763.975 | 238.728 | 4208.383 | 1048.204 | 13611.1 | 4992.5 | 18603.6 | 1724.0 | 34288.9 | 686.5 | −18095.8 | −28588.4 | ||||||||||||||||||||||||||||||||||||
12-31- 9 | 1100.696 | 377.005 | 6226.574 | 1399.110 | 21324.4 | 6691.9 | 28016.3 | 2574.2 | 11393.5 | 1189.7 | 12858.9 | −18530.8 | ||||||||||||||||||||||||||||||||||||
| 12-31-10 | 1010.404 | 347.386 | 5896.424 | 1193.718 | 19506.7 | 5654.5 | 25161.2 | 2272.8 | 2018.8 | 1362.0 | 19507.6 | −4536.6 | ||||||||||||||||||||||||||||||||||||
| 12-31-11 | 919.538 | 285.439 | 4640.775 | 924.529 | 16016.4 | 4366.5 | 20382.9 | 1829.6 | 532.4 | 1373.6 | 16647.3 | 6322.3 | ||||||||||||||||||||||||||||||||||||
| 12-31-12 | 852.583 | 244.624 | 3778.028 | 747.083 | 13757.9 | 3585.4 | 17343.3 | 1564.6 | 1613.7 | 1402.6 | 12762.4 | 13873.5 | ||||||||||||||||||||||||||||||||||||
| 12-31-13 | 808.690 | 218.540 | 3132.625 | 615.935 | 12315.4 | 2998.0 | 15313.4 | 1388.2 | 310.3 | 1412.7 | 12202.2 | 20453.7 | ||||||||||||||||||||||||||||||||||||
| 12-31-14 | 738.219 | 189.539 | 2592.675 | 507.324 | 10665.6 | 2455.3 | 13120.9 | 1180.1 | 310.3 | 1400.0 | 10230.5 | 25466.4 | ||||||||||||||||||||||||||||||||||||
| 12-31-15 | 683.468 | 167.712 | 2243.493 | 443.281 | 9424.0 | 2140.5 | 11564.5 | 1036.4 | 299.7 | 1406.4 | 8822.0 | 29395.3 | ||||||||||||||||||||||||||||||||||||
| 12-31-16 | 645.796 | 150.685 | 1926.228 | 390.835 | 8455.3 | 1885.8 | 10341.1 | 925.9 | 314.1 | 1411.6 | 7689.5 | 32508.3 | ||||||||||||||||||||||||||||||||||||
| 12-31-17 | 640.069 | 137.466 | 1700.667 | 348.741 | 7701.4 | 1681.5 | 9382.9 | 836.9 | 314.1 | 1410.2 | 6821.7 | 35018.6 | ||||||||||||||||||||||||||||||||||||
| 12-31-18 | 637.842 | 125.831 | 1554.440 | 314.550 | 7036.7 | 1511.1 | 8547.8 | 758.6 | 299.7 | 1389.6 | 6099.9 | 37059.3 | ||||||||||||||||||||||||||||||||||||
| 12-31-19 | 615.018 | 112.107 | 1417.194 | 283.630 | 6250.0 | 1355.6 | 7605.6 | 671.7 | 299.7 | 1344.5 | 5289.7 | 38667.3 | ||||||||||||||||||||||||||||||||||||
| 12-31-20 | 589.716 | 102.616 | 1289.133 | 256.802 | 5710.9 | 1224.1 | 6935.0 | 610.2 | 188.3 | 1316.8 | 4819.7 | 39999.7 | ||||||||||||||||||||||||||||||||||||
| 12-31-21 | 538.340 | 93.560 | 1142.771 | 228.715 | 5201.1 | 1086.0 | 6287.1 | 552.9 | 52.7 | 1300.1 | 4381.4 | 41102.3 | ||||||||||||||||||||||||||||||||||||
| SUBTOTAL | 10881.880 | 2906.674 | 43004.215 | 9048.475 | 163572.5 | 43330.8 | 206903.3 | 18695.7 | 72352.5 | 18679.2 | 97175.9 | 41102.3 | ||||||||||||||||||||||||||||||||||||
| REMAING | 3485.669 | 703.593 | 9552.586 | 2279.900 | 39040.9 | 10198.0 | 49238.9 | 4370.1 | 0.0 | 16956.5 | 27912.3 | 45328.7 | ||||||||||||||||||||||||||||||||||||
| TOTAL OF 53.7 YRS | 14367.549 | 3610.267 | 52556.801 | 11328.375 | 202613.4 | 53528.8 | 256142.2 | 23065.8 | 72352.5 | 35635.7 | 125088.2 | 45328.7 | ||||||||||||||||||||||||||||||||||||
| CUM PROD | 0.000 | 0.000 | ||||||||||||||||||||||||||||||||||||||||||||||
| ULTIMATE | 14367.549 | 52556.801 | ||||||||||||||||||||||||||||||||||||||||||||||
| FOR | 8.00 | PCT, | PRESENT WORTH | M$ | 54770.2 | |||||||||||||||
| FOR | 12.00 | PCT, | PRESENT WORTH | M$ | 37583.0 | |||||||||||||||
| FOR | 15.00 | PCT, | PRESENT WORTH | M$ | 28333.0 | |||||||||||||||
| FOR | 20.00 | PCT, | PRESENT WORTH | M$ | 17227.4 | |||||||||||||||
| FOR | 25.00 | PCT, | PRESENT WORTH | M$ | 9580.0 |
A-13
Table of Contents
Vice President
Operations & Engineering
COG Operating, LLC
550 West Texas Avenue, Suite 1300
Midland, Texas 79701
| Re: | Evaluation Summary — SEC Pricing COG Operating, LLC Interests Eddy and Lea Counties, New Mexico Proved Reserves As of December 31, 2006 |
| Proved | Proved | |||||||||||||||||||
| Developed | Developed | Proved | ||||||||||||||||||
| Proved | Producing | Non-Producing | Undeveloped | |||||||||||||||||
| Net Reserves | ||||||||||||||||||||
| Oil/Condensate | - Mbbl | 33,109 | 14,006 | 1,834 | 17,269 | |||||||||||||||
| Gas | - MMcf | 155,770 | 73,135 | 5,568 | 77,067 | |||||||||||||||
| Revenue | ||||||||||||||||||||
| Oil/Condensate | - M$ | 1,844,603 | 782,051 | 102,820 | 959,732 | |||||||||||||||
| Gas | - M$ | 865,667 | 414,331 | 30,355 | 420,981 | |||||||||||||||
| Severance and Ad Valorem Taxes | - M$ | 274,752 | 121,818 | 13,322 | 139,612 | |||||||||||||||
| Operating Expenses | - M$ | 417,513 | 261,077 | 13,530 | 142,906 | |||||||||||||||
| Investments | - M$ | 431,690 | 0.0 | 19,407 | 412,283 | |||||||||||||||
| Operating Income (BFIT) | - M$ | 1,586,316 | 813,487 | 86,916 | 685,913 | |||||||||||||||
| Discounted @ 10% | - M$ | 720,299 | 445,258 | 37,406 | 237,634 | |||||||||||||||
B-1
Table of Contents
COG Operating, LLC
January 25, 2007
Page 2
B-2
Table of Contents
| JPMorgan | Banc of America Securities LLC |
Table of Contents
Information not required in prospectus
| Item 13. | Other expenses of issuance and distribution |
| Securities and Exchange Commission registration fee | $ | 6,288 | |
| FINRA filing fee | 20,980 | ||
| Accounting fees and expenses | 250,000 | ||
| Legal fees and expenses | 250,000 | ||
| Printing and engraving expenses | 350,000 | ||
| Transfer agent and registrar fees and expenses | 5,000 | ||
| Other expenses | 17,732 | ||
| Total | $ | 900,000 | |
| Item 14. | Indemnification of directors and officers |
II-1
Table of Contents
| • | us, except for: |
| • | claims regarding the indemnitee’s rights under the indemnification agreement; | |
| • | claims to enforce a right to indemnification under any statute or law; and | |
| • | counter-claims against us in a proceeding brought by us against the indemnitee; or |
| • | any other person, except for claims approved by our board of directors. |
II-2
Table of Contents
| Item 15. | Recent sales of unregistered securities |
II-3
Table of Contents
II-4
Table of Contents
| Item 16. | Exhibits and financial statement schedules |
| Number | Exhibit | |||
| 1 | .1* | Form of Underwriting Agreement | ||
| 2 | .1† | Combination Agreement dated February 24, 2006, among Concho Resources Inc., Concho Equity Holdings Corp., Chase Oil Corporation, Caza Energy LLC and the other signatories thereto (incorporated herein by reference to Exhibit 2.1 filed with the Registration Statement onForm S-1 (RegistrationNo. 333-142315) filed by Concho Resources Inc.) | ||
| 3 | .1 | Second Amended and Restated Certificate of Incorporation of Concho Resources Inc. (incorporated herein by reference to Exhibit 3.1 filed with the Current Report onForm 8-K filed by Concho Resources Inc. on August 8, 2007) | ||
| 3 | .2 | Amended and Restated Bylaws of Concho Resources Inc. (incorporated herein by reference to Exhibit 3.2 filed with the Current Report onForm 8-K filed by Concho Resources Inc. on August 8, 2007) | ||
| 4 | .1 | Specimen Common Stock Certificate (incorporated herein by reference to Exhibit 4.1 filed with the Registration Statement onForm S-1 (RegistrationNo. 333-142315) filed by Concho Resources Inc.) | ||
| 5 | .1* | Opinion of Vinson & Elkins L.L.P. | ||
| 10 | .1 | Credit Agreement dated February 24, 2006, among Concho Resources Inc., JPMorgan Chase Bank, N.A., as administrative agent, Bank of America, N.A., as syndication agent, Wachovia Bank, National Association, and BNP Paribas, as documentation agents, and the other lenders party thereto (incorporated herein by reference to Exhibit 10.1 filed with the Registration Statement onForm S-1 (RegistrationNo. 333-142315) filed by Concho Resources Inc.) | ||
| 10 | .2 | Second Lien Credit Agreement dated March 27, 2007, among Concho Resources Inc., Bank of America, N.A., as administrative agent, and Banc of America LLC, as sole lead arranger and sole booking manager (incorporated herein by reference to Exhibit 10.2 filed with the Registration Statement onForm S-1 (RegistrationNo. 333-142315) filed by Concho Resources Inc.) | ||
| 10 | .3 | Transition Services Agreement dated April 23, 2007, between COG Operating LLC and Mack Energy Corporation (incorporated herein by reference to Exhibit 10.3 filed with the Registration Statement onForm S-1 (RegistrationNo. 333-142315) filed by Concho Resources Inc.) | ||
| 10 | .4 | Form of Drilling Agreement with Silver Oak Drilling, LLC (incorporated herein by reference to Exhibit 10.4 filed with the Registration Statement onForm S-1 (RegistrationNo. 333-142315) filed by Concho Resources Inc.) | ||
| 10 | .5 | Salt Water Disposal System Ownership and Operating Agreement dated February 24, 2006, among COG Operating LLC, Chase Oil Corporation, Caza Energy LLC and Mack Energy Corporation (incorporated herein by reference to Exhibit 10.5 filed with the Registration Statement onForm S-1 (RegistrationNo. 333-142315) filed by Concho Resources Inc.) | ||
| 10 | .6 | Software License Agreement dated March 2, 2006, between Enertia Software Systems and Concho Resources Inc. (incorporated herein by reference to Exhibit 10.6 filed with the Registration Statement onForm S-1 (RegistrationNo. 333-142315) filed by Concho Resources Inc.) | ||
II-5
Table of Contents
| Number | Exhibit | |||
| 10 | .7 | Leasehold Acquisition Agreement dated April 1, 2005, by and between Trey Resources, Inc. and COG Oil and Gas LP (incorporated herein by reference to Exhibit 10.7 filed with the Registration Statement onForm S-1 (RegistrationNo. 333-142315) filed by Concho Resources Inc.) | ||
| 10 | .8 | Transfer of Operating Rights (Sublease) in a Lease for Oil and Gas for Valhalla properties (incorporated herein by reference to Exhibit 10.8 filed with the Registration Statement onForm S-1 (RegistrationNo. 333-142315) filed by Concho Resources Inc.) | ||
| 10 | .9 | Assignment of Oil and Gas Leases from Caza Energy LLC (incorporated herein by reference to Exhibit 10.9 filed with the Registration Statement onForm S-1 (RegistrationNo. 333-142315) filed by Concho Resources Inc.) | ||
| 10 | .10 | Escrow Agreement dated February 27, 2006, among Concho Resources Inc., Timothy A. Leach, Steven L. Beal, David W. Copeland, Curt F. Kamradt and E. Joseph Wright and the other signatories thereto (incorporated herein by reference to Exhibit 10.10 filed with the Registration Statement onForm S-1 (RegistrationNo. 333-142315) filed by Concho Resources Inc.) | ||
| 10 | .11 | Business Opportunities Agreement dated February 27, 2006, among Concho Resources Inc. and the other signatories thereto (incorporated herein by reference to Exhibit 10.11 filed with the Registration Statement onForm S-1 (RegistrationNo. 333-142315) filed by Concho Resources Inc.) | ||
| 10 | .12 | Registration Rights Agreement dated February 27, 2006, among Concho Resources Inc. and the other signatories thereto (incorporated herein by reference to Exhibit 10.12 filed with the Registration Statement onForm S-1 (RegistrationNo. 333-142315) filed by Concho Resources Inc.) | ||
| 10 | .13 | Concho Resources Inc. 2006 Stock Incentive Plan (incorporated herein by reference to Exhibit 10.13 filed with the Registration Statement onForm S-1 (RegistrationNo. 333-142315) filed by Concho Resources Inc.) | ||
| 10 | .14 | [Reserved] | ||
| 10 | .15 | Form of Nonstatutory Stock Option Agreement (incorporated herein by reference to Exhibit 10.15 filed with the Registration Statement onForm S-1 (RegistrationNo. 333-142315) filed by Concho Resources Inc.) | ||
| 10 | .16 | Form of Restricted Stock Agreement (for employees) (incorporated herein by reference to Exhibit 10.16 filed with the Registration Statement onForm S-1 (RegistrationNo. 333-142315) filed by Concho Resources Inc.) | ||
| 10 | .17 | Form of Restricted Stock Agreement (for non-employee directors) (incorporated herein by reference to Exhibit 10.17 filed with the Registration Statement onForm S-1 (RegistrationNo. 333-142315) filed by Concho Resources Inc.) | ||
| 10 | .18 | Employment Agreement dated July 14, 2006, between Concho Resources Inc. and Timothy A. Leach (incorporated herein by reference to Exhibit 10.18 filed with the Registration Statement onForm S-1 (RegistrationNo. 333-142315) filed by Concho Resources Inc.) | ||
| 10 | .19 | Employment Agreement dated July 14, 2006, between Concho Resources Inc. and Steven L. Beal (incorporated herein by reference to Exhibit 10.19 filed with the Registration Statement onForm S-1 (RegistrationNo. 333-142315) filed by Concho Resources Inc.) | ||
| 10 | .20 | Employment Agreement dated July 14, 2006, between Concho Resources Inc. and David W. Copeland (incorporated herein by reference to Exhibit 10.20 filed with the Registration Statement onForm S-1 (RegistrationNo. 333-142315) filed by Concho Resources Inc.) | ||
II-6
Table of Contents
| Number | Exhibit | |||
| 10 | .21 | Employment Agreement dated July 14, 2006, between Concho Resources Inc. and Curt F. Kamradt (incorporated herein by reference to Exhibit 10.21 filed with the Registration Statement onForm S-1 (RegistrationNo. 333-142315) filed by Concho Resources Inc.) | ||
| 10 | .22 | Employment Agreement dated July 14, 2006, between Concho Resources Inc. and David M. Thomas III (incorporated herein by reference to Exhibit 10.22 filed with the Registration Statement onForm S-1 (RegistrationNo. 333-142315) filed by Concho Resources Inc.) | ||
| 10 | .23 | Employment Agreement dated July 14, 2006, between Concho Resources Inc. and E. Joseph Wright (incorporated herein by reference to Exhibit 10.23 filed with the Registration Statement onForm S-1 (RegistrationNo. 333-142315) filed by Concho Resources Inc.) | ||
| 10 | .24 | Form of Indemnification Agreement between Concho Resources Inc. and each of the officers and directors thereof (incorporated herein by reference to Exhibit 10.24 filed with the Registration Statement onForm S-1 (RegistrationNo. 333-142315) filed by Concho Resources Inc.) | ||
| 10 | .25# | Gas Purchase Contract between COG Oil & Gas LP and Duke Energy Field Services, LP dated November 1, 2006 (incorporated herein by reference to Exhibit 10.25 filed with the Registration Statement onForm S-1 (RegistrationNo. 333-142315) filed by Concho Resources Inc.) | ||
| 10 | .26 | Letter agreement between COG Operating LLC and Navajo Refining Company, L.P. dated January 15, 2007 (incorporated herein by reference to Exhibit 10.26 filed with the Registration Statement onForm S-1 (RegistrationNo. 333-142315) filed by Concho Resources Inc.) | ||
| 10 | .27 | First Amendment to Credit Agreement, dated as of July 6, 2006, among Concho Resources Inc., certain of its subsidiaries, JPMorgan Chase Bank, N.A. and the other leaders party thereto. (incorporated herein by reference to Exhibit 10.27 filed with the Registration Statement onForm S-1 (RegistrationNo. 333-142315) filed by Concho Resources Inc.) | ||
| 10 | .28 | Second Amendment to Credit agreement, dated as of March 7, 2007, among Concho Resources Inc., certain of its subsidiaries, JPMorgan Chase Bank, N.A. and the other leaders party thereto. (incorporated herein by reference to Exhibit 10.28 filed with the Registration Statement onForm S-1 (RegistrationNo. 333-142315) filed by Concho Resources Inc.) | ||
| 10 | .29 | Form of option letter agreement among Concho Resources Inc., Concho Equity Holdings Corp. and each of Messrs. Leach and Beal (incorporated herein by reference to Exhibit 10.29 filed with the Registration Statement onForm S-1 (RegistrationNo. 333-142315) filed by Concho Resources Inc.) | ||
II-7
Table of Contents
| Number | Exhibit | |||
| 10 | .30 | Form of option letter agreement among Concho Resources Inc., Concho Equity Holdings Corp. and each of Messrs. Copeland, Kamradt, Thomas and Wright (incorporated herein by reference to Exhibit 10.30 filed with the Registration Statement onForm S-1 (RegistrationNo. 333-142315) filed by Concho Resources Inc.) | ||
| 10 | .31 | First Amendment to Employment Agreement, dated August 21, 2007, by and between Concho Resources Inc. and Timothy A. Leach (incorporated herein by reference to Exhibit 10.3 filed with the Current Report on Form 8-K filed by Concho Resources Inc. on August 24, 2007) | ||
| 10 | .32 | First Amendment to Employment Agreement, dated August 21, 2007, by and between Concho Resources Inc. and Steven L. Beal (incorporated herein by reference to Exhibit 10.4 filed with the Current Report on Form 8-K filed by Concho Resources Inc. on August 24, 2007) | ||
| 10 | .33 | First Amendment to Employment Agreement, dated August 21, 2007, by and between Concho Resources Inc. and David W. Copeland (incorporated herein by reference to Exhibit 10.5 filed with the Current Report on Form 8-K filed by Concho Resources Inc. on August 24, 2007) | ||
| 10 | .34 | First Amendment to Employment Agreement, dated August 21, 2007, by and between Concho Resources Inc. and Curt F. Kamradt (incorporated herein by reference to Exhibit 10.6 filed with the Current Report on Form 8-K filed by Concho Resources Inc. on August 24, 2007) | ||
| 10 | .35 | First Amendment to Employment Agreement, dated August 21, 2007, by and between Concho Resources Inc. and E. Joseph Wright (incorporated herein by reference to Exhibit 10.7 filed with the Current Report on Form 8-K filed by Concho Resources Inc. on August 24, 2007) | ||
| 10 | .36 | First Amendment to Employment Agreement, dated August 31, 2007, by and between Concho Resources Inc. and David M. Thomas III (incorporated herein by reference to Exhibit 10.9 filed with the Quarterly Report on Form 10-Q filed by Concho Resources Inc. on September 10, 2007) | ||
| 10 | .37 | Form of Amendment to Stock Option Award Agreement with executive officers related to the Pre-Combination Options (incorporated herein by reference to Exhibit 10.1 filed with the Current Report on Form8-K filed by Concho Resources Inc. on November 20, 2007) | ||
| 10 | .38 | Form of Amendment to Nonstatutory Stock Option Agreement with executive officers related to the June 2006 Options (incorporated herein by reference to Exhibit 10.2 filed with the Current Report on Form8-K filed by Concho Resources Inc. on November 20, 2007) | ||
| 10 | .39 | Form of Restricted Stock Agreement (incorporated herein by reference to Exhibit 10.3 filed with the Current Report on Form 8-K filed by Concho Resources Inc. on November 20, 2007) | ||
| 21 | .1 | Subsidiaries of Concho Resources Inc. (incorporated herein by reference to Exhibit 21.1 filed with the Registration Statement onForm S-1 (Registration No.333-142315) filed by Concho Resources Inc.) | ||
| 23 | .1* | Consent of Grant Thornton LLP — Tulsa | ||
| 23 | .2* | Consent of Grant Thornton LLP — Kansas City | ||
| 23 | .3* | Consent of Grant Thornton LLP — Dallas | ||
II-8
Table of Contents
| Number | Exhibit | |||
| 23 | .4* | Consent of Netherland, Sewell & Associates, Inc. | ||
| 23 | .5* | Consent of Cawley, Gillespie & Associates, Inc. | ||
| 23 | .6* | Consent of Vinson & Elkins L.L.P. (included as part of Exhibit 5.1) | ||
| 24 | .1* | Power of Attorney | ||
| * | Filed herewith. | |
| † | The Combination Agreement filed as Exhibit 2.1 omits certain of the schedules and exhibits to the Combination Agreement in accordance with Item 601 (b)(2) of Regulation S-K. A list briefly identifying the contents of all omitted schedules and exhibits is included with the Combination Agreement filed as Exhibit 2.1. Concho Resources agrees to furnish supplementally a copy of any omitted schedule or exhibit to the Securities and Exchange Commission upon request. | |
| # | Confidential treatment of certain provisions of this exhibit has previously been granted by the Securities and Exchange Commission. Omitted material for which confidential treatment has been granted has been filed separately with the Securities and Exchange Commission. |
| Item 17. | Undertakings |
II-9
Table of Contents
| By: | /s/ Timothy A. Leach |
| Title: | Chairman and Chief Executive Officer |
| Signature | Title | Date | ||||
/s/ Timothy A. Leach | Chairman, Chief Executive Officer and Director (principal executive officer) | November 28, 2007 | ||||
/s/ Steven L. Beal | President, Chief Operating Officer and Director | November 28, 2007 | ||||
/s/ Curt F. Kamradt | Vice President, Chief Financial Officer and Treasurer (principal financial and accounting officer) | November 28, 2007 | ||||
* | Director | November 28, 2007 | ||||
* | Director | November 28, 2007 | ||||
* | Director | November 28, 2007 | ||||
* | Director | November 28, 2007 | ||||
| *By: | /s/ Timothy A. Leach | |||||
II-10
Table of Contents
| Number | Exhibit | |||
| 1 | .1* | Form of Underwriting Agreement | ||
| 2 | .1† | Combination Agreement dated February 24, 2006, among Concho Resources Inc., Concho Equity Holdings Corp., Chase Oil Corporation, Caza Energy LLC and the other signatories thereto (incorporated herein by reference to Exhibit 2.1 filed with the Registration Statement onForm S-1 (RegistrationNo. 333-142315) filed by Concho Resources Inc.) | ||
| 3 | .1 | Second Amended and Restated Certificate of Incorporation of Concho Resources Inc. (incorporated herein by reference to Exhibit 3.1 filed with the Current Report onForm 8-K filed by Concho Resources Inc. on August 8, 2007) | ||
| 3 | .2 | Amended and Restated Bylaws of Concho Resources Inc. (incorporated herein by reference to Exhibit 3.2 filed with the Current Report onForm 8-K filed by Concho Resources Inc. on August 8, 2007) | ||
| 4 | .1 | Specimen Common Stock Certificate (incorporated herein by reference to Exhibit 4.1 filed with the Registration Statement onForm S-1 (RegistrationNo. 333-142315) filed by Concho Resources Inc.) | ||
| 5 | .1* | Opinion of Vinson & Elkins L.L.P. | ||
| 10 | .1 | Credit Agreement dated February 24, 2006, among Concho Resources Inc., JPMorgan Chase Bank, N.A., as administrative agent, Bank of America, N.A., as syndication agent, Wachovia Bank, National Association, and BNP Paribas, as documentation agents, and the other lenders party thereto (incorporated herein by reference to Exhibit 10.1 filed with the Registration Statement onForm S-1 (RegistrationNo. 333-142315) filed by Concho Resources Inc.) | ||
| 10 | .2 | Second Lien Credit Agreement dated March 27, 2007, among Concho Resources Inc., Bank of America, N.A., as administrative agent, and Banc of America LLC, as sole lead arranger and sole booking manager (incorporated herein by reference to Exhibit 10.2 filed with the Registration Statement onForm S-1 (RegistrationNo. 333-142315) filed by Concho Resources Inc.) | ||
| 10 | .3 | Transition Services Agreement dated April 23, 2007, between COG Operating LLC and Mack Energy Corporation (incorporated herein by reference to Exhibit 10.3 filed with the Registration Statement onForm S-1 (RegistrationNo. 333-142315) filed by Concho Resources Inc.) | ||
| 10 | .4 | Form of Drilling Agreement with Silver Oak Drilling, LLC (incorporated herein by reference to Exhibit 10.4 filed with the Registration Statement onForm S-1 (RegistrationNo. 333-142315) filed by Concho Resources Inc.) | ||
| 10 | .5 | Salt Water Disposal System Ownership and Operating Agreement dated February 24, 2006, among COG Operating LLC, Chase Oil Corporation, Caza Energy LLC and Mack Energy Corporation (incorporated herein by reference to Exhibit 10.5 filed with the Registration Statement onForm S-1 (RegistrationNo. 333-142315) filed by Concho Resources Inc.) | ||
| 10 | .6 | Software License Agreement dated March 2, 2006, between Enertia Software Systems and Concho Resources Inc. (incorporated herein by reference to Exhibit 10.6 filed with the Registration Statement onForm S-1 (RegistrationNo. 333-142315) filed by Concho Resources Inc.) | ||
Table of Contents
| Number | Exhibit | |||
| 10 | .7 | Leasehold Acquisition Agreement dated April 1, 2005, by and between Trey Resources, Inc. and COG Oil and Gas LP (incorporated herein by reference to Exhibit 10.7 filed with the Registration Statement onForm S-1 (RegistrationNo. 333-142315) filed by Concho Resources Inc.) | ||
| 10 | .8 | Transfer of Operating Rights (Sublease) in a Lease for Oil and Gas for Valhalla properties (incorporated herein by reference to Exhibit 10.8 filed with the Registration Statement onForm S-1 (RegistrationNo. 333-142315) filed by Concho Resources Inc.) | ||
| 10 | .9 | Assignment of Oil and Gas Leases from Caza Energy LLC (incorporated herein by reference to Exhibit 10.9 filed with the Registration Statement onForm S-1 (RegistrationNo. 333-142315) filed by Concho Resources Inc.) | ||
| 10 | .10 | Escrow Agreement dated February 27, 2006, among Concho Resources Inc., Timothy A. Leach, Steven L. Beal, David W. Copeland, Curt F. Kamradt and E. Joseph Wright and the other signatories thereto (incorporated herein by reference to Exhibit 10.10 filed with the Registration Statement onForm S-1 (RegistrationNo. 333-142315) filed by Concho Resources Inc.) | ||
| 10 | .11 | Business Opportunities Agreement dated February 27, 2006, among Concho Resources Inc. and the other signatories thereto (incorporated herein by reference to Exhibit 10.11 filed with the Registration Statement onForm S-1 (RegistrationNo. 333-142315) filed by Concho Resources Inc.) | ||
| 10 | .12 | Registration Rights Agreement dated February 27, 2006, among Concho Resources Inc. and the other signatories thereto (incorporated herein by reference to Exhibit 10.12 filed with the Registration Statement onForm S-1 (RegistrationNo. 333-142315) filed by Concho Resources Inc.) | ||
| 10 | .13 | Concho Resources Inc. 2006 Stock Incentive Plan (incorporated herein by reference to Exhibit 10.13 filed with the Registration Statement onForm S-1 (RegistrationNo. 333-142315) filed by Concho Resources Inc.) | ||
| 10 | .14 | [Reserved] | ||
| 10 | .15 | Form of Nonstatutory Stock Option Agreement (incorporated herein by reference to Exhibit 10.15 filed with the Registration Statement onForm S-1 (RegistrationNo. 333-142315) filed by Concho Resources Inc.) | ||
| 10 | .16 | Form of Restricted Stock Agreement (for employees) (incorporated herein by reference to Exhibit 10.16 filed with the Registration Statement onForm S-1 (RegistrationNo. 333-142315) filed by Concho Resources Inc.) | ||
| 10 | .17 | Form of Restricted Stock Agreement (for non-employee directors) (incorporated herein by reference to Exhibit 10.17 filed with the Registration Statement onForm S-1 (RegistrationNo. 333-142315) filed by Concho Resources Inc.) | ||
| 10 | .18 | Employment Agreement dated July 14, 2006, between Concho Resources Inc. and Timothy A. Leach (incorporated herein by reference to Exhibit 10.18 filed with the Registration Statement onForm S-1 (RegistrationNo. 333-142315) filed by Concho Resources Inc.) | ||
| 10 | .19 | Employment Agreement dated July 14, 2006, between Concho Resources Inc. and Steven L. Beal (incorporated herein by reference to Exhibit 10.19 filed with the Registration Statement onForm S-1 (RegistrationNo. 333-142315) filed by Concho Resources Inc.) | ||
Table of Contents
| Number | Exhibit | |||
| 10 | .20 | Employment Agreement dated July 14, 2006, between Concho Resources Inc. and David W. Copeland (incorporated herein by reference to Exhibit 10.20 filed with the Registration Statement onForm S-1 (RegistrationNo. 333-142315) filed by Concho Resources Inc.) | ||
| 10 | .21 | Employment Agreement dated July 14, 2006, between Concho Resources Inc. and Curt F. Kamradt (incorporated herein by reference to Exhibit 10.21 filed with the Registration Statement onForm S-1 (RegistrationNo. 333-142315) filed by Concho Resources Inc.) | ||
| 10 | .22 | Employment Agreement dated July 14, 2006, between Concho Resources Inc. and David M. Thomas III (incorporated herein by reference to Exhibit 10.22 filed with the Registration Statement onForm S-1 (RegistrationNo. 333-142315) filed by Concho Resources Inc.) | ||
| 10 | .23 | Employment Agreement dated July 14, 2006, between Concho Resources Inc. and E. Joseph Wright (incorporated herein by reference to Exhibit 10.23 filed with the Registration Statement onForm S-1 (RegistrationNo. 333-142315) filed by Concho Resources Inc.) | ||
| 10 | .24 | Form of Indemnification Agreement between Concho Resources Inc. and each of the officers and directors thereof (incorporated herein by reference to Exhibit 10.24 filed with the Registration Statement onForm S-1 (RegistrationNo. 333-142315) filed by Concho Resources Inc.) | ||
| 10 | .25# | Gas Purchase Contract between COG Oil & Gas LP and Duke Energy Field Services, LP dated November 1, 2006 (incorporated herein by reference to Exhibit 10.25 filed with the Registration Statement onForm S-1 (RegistrationNo. 333-142315) filed by Concho Resources Inc.) | ||
| 10 | .26 | Letter agreement between COG Operating LLC and Navajo Refining Company, L.P. dated January 15, 2007 (incorporated herein by reference to Exhibit 10.26 filed with the Registration Statement onForm S-1 (RegistrationNo. 333-142315) filed by Concho Resources Inc.) | ||
| 10 | .27 | First Amendment to Credit Agreement, dated as of July 6, 2006, among Concho Resources Inc., certain of its subsidiaries, JPMorgan Chase Bank, N.A. and the other leaders party thereto. (incorporated herein by reference to Exhibit 10.27 filed with the Registration Statement onForm S-1 (RegistrationNo. 333-142315) filed by Concho Resources Inc.) | ||
| 10 | .28 | Second Amendment to Credit agreement, dated as of March 7, 2007, among Concho Resources Inc., certain of its subsidiaries, JPMorgan Chase Bank, N.A. and the other leaders party thereto. (incorporated herein by reference to Exhibit 10.28 filed with the Registration Statement onForm S-1 (RegistrationNo. 333-142315) filed by Concho Resources Inc.) | ||
| 10 | .29 | Form of option letter agreement among Concho Resources Inc., Concho Equity Holdings Corp. and each of Messrs. Leach and Beal (incorporated herein by reference to Exhibit 10.29 filed with the Registration Statement onForm S-1 (RegistrationNo. 333-142315) filed by Concho Resources Inc.) | ||
| 10 | .30 | Form of option letter agreement among Concho Resources Inc., Concho Equity Holdings Corp. and each of Messrs. Copeland, Kamradt, Thomas and Wright (incorporated herein by reference to Exhibit 10.30 filed with the Registration Statement onForm S-1 (RegistrationNo. 333-142315) filed by Concho Resources Inc.) | ||
Table of Contents
| Number | Exhibit | |||
| 10 | .31 | First Amendment to Employment Agreement, dated August 21, 2007, by and between Concho Resources Inc. and Timothy A. Leach (incorporated herein by reference to Exhibit 10.3 filed with the Current Report on Form 8-K filed by Concho Resources Inc. on August 24, 2007) | ||
| 10 | .32 | First Amendment to Employment Agreement, dated August 21, 2007, by and between Concho Resources Inc. and Steven L. Beal (incorporated herein by reference to Exhibit 10.4 filed with the Current Report on Form 8-K filed by Concho Resources Inc. on August 24, 2007) | ||
| 10 | .33 | First Amendment to Employment Agreement, dated August 21, 2007, by and between Concho Resources Inc. and David W. Copeland (incorporated herein by reference to Exhibit 10.5 filed with the Current Report on Form 8-K filed by Concho Resources Inc. on August 24, 2007) | ||
| 10 | .34 | First Amendment to Employment Agreement, dated August 21, 2007, by and between Concho Resources Inc. and Curt F. Kamradt (incorporated herein by reference to Exhibit 10.6 filed with the Current Report on Form 8-K filed by Concho Resources Inc. on August 24, 2007) | ||
| 10 | .35 | First Amendment to Employment Agreement, dated August 21, 2007, by and between Concho Resources Inc. and E. Joseph Wright (incorporated herein by reference to Exhibit 10.7 filed with the Current Report on Form 8-K filed by Concho Resources Inc. on August 24, 2007) | ||
| 10 | .36 | First Amendment to Employment Agreement, dated August 31, 2007, by and between Concho Resources Inc. and David M. Thomas III (incorporated herein by reference to Exhibit 10.9 filed with the Quarterly Report on Form 10-Q filed by Concho Resources Inc. on September 10, 2007) | ||
| 10 | .37 | Form of Amendment to Stock Option Award Agreement with executive officers related to the Pre-Combination Options (incorporated herein by reference to Exhibit 10.1 filed with the Current Report onForm 8-K filed by Concho Resources Inc. on November 20, 2007) | ||
| 10 | .38 | Form of Amendment to Nonstatutory Stock Option Agreement with executive officers related to the June 2006 Options (incorporated herein by reference to Exhibit 10.2 filed with the Current Report onForm 8-K filed by Concho Resources Inc. on November 20, 2007) | ||
| 10 | .39 | Form of Restricted Stock Agreement (incorporated herein by reference to Exhibit 10.3 filed with the Current Report onForm 8-K filed by Concho Resources Inc. on November 20, 2007) | ||
| 21 | .1 | Subsidiaries of Concho Resources Inc. (incorporated herein by reference to Exhibit 21.1 filed with the Registration Statement onForm S-1 (RegistrationNo. 333-142315) filed by Concho Resources Inc.) | ||
| 23 | .1* | Consent of Grant Thornton LLP — Tulsa | ||
| 23 | .2* | Consent of Grant Thornton LLP — Kansas City | ||
| 23 | .3* | Consent of Grant Thornton LLP — Dallas | ||
| 23 | .4* | Consent of Netherland, Sewell & Associates, Inc. | ||
| 23 | .5* | Consent of Cawley, Gillespie & Associates, Inc. | ||
| 23 | .6* | Consent of Vinson & Elkins L.L.P. (included as part of Exhibit 5.1) | ||
| 24 | .1* | Power of Attorney | ||
| * | Filed herewith. |
Table of Contents
| † | The Combination Agreement filed as Exhibit 2.1 omits certain of the schedules and exhibits to the Combination Agreement in accordance with Item 601(b)(2) ofRegulation S-K. A list briefly identifying the contents of all omitted schedules and exhibits is included with the Combination Agreement filed as Exhibit 2.1. Concho Resources agrees to furnish supplementally a copy of any omitted schedule or exhibit to the Securities and Exchange Commission upon request. | |
| # | Confidential treatment of certain provisions of this exhibit has previously been granted by the Securities and Exchange Commission. Omitted material for which confidential treatment has been granted has been filed separately with the Securities and Exchange Commission. |