Exhibit 99.2
1 NASDAQ: PBIB November 2007

2 Disclaimer This presentation contains forward-looking statements that involve risks and uncertainties. These forward-looking statements are based on management’s current expectations. Porter Bancorp’s actual results in future periods may differ materially from those currently expected due to various factors, including those risk factors described in documents that the Company files with the Securities and Exchange Commission, including the Company’s most recent Annual Report on Form 10-K and Quarterly Report on Form 10-Q. The forward-looking statements in this presentation are made as of the date of the presentation and Porter Bancorp does not assume any responsibility to update these statements.

3 IPO Date: NASDAQ Symbol: Shares Outstanding: Market Capitalization:(1) Average Daily Volume:(2) Insider Ownership: September 22, 2006 PBIB 7.63 Million $161 Million 3,459 Shares 69% Notes: (1) Based on October 18, 2007 closing price of $21.15 (2) 2007 year-to-date per NASDAQ Stock Overview
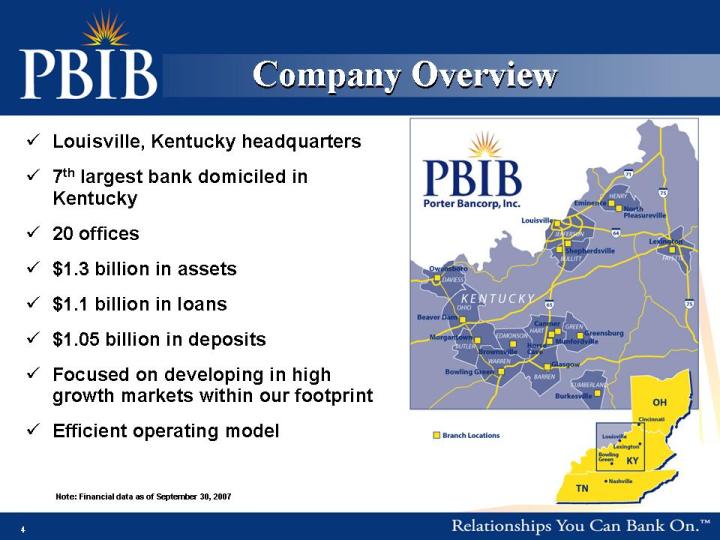
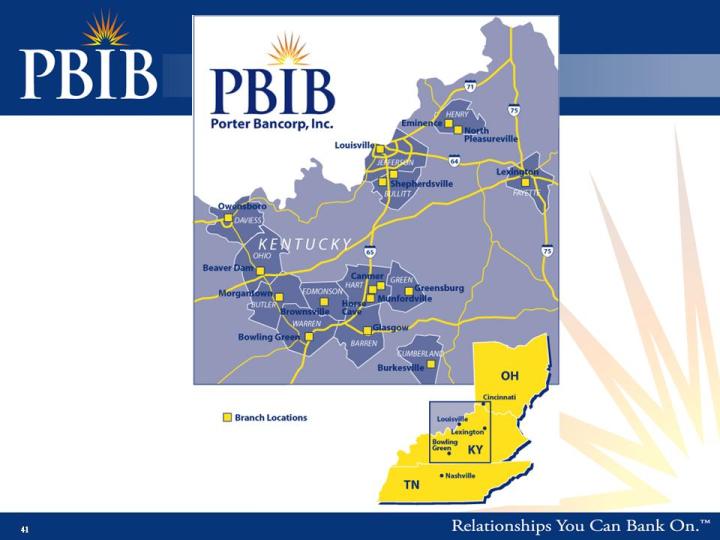
4 Louisville, Kentucky headquarters 7th largest bank domiciled in Kentucky 20 offices $1.3 billion in assets $1.1 billion in loans $1.05 billion in deposits Focused on developing in high growth markets within our footprint Efficient operating model Note: Financial data as of September 30, 2007 Company Overview
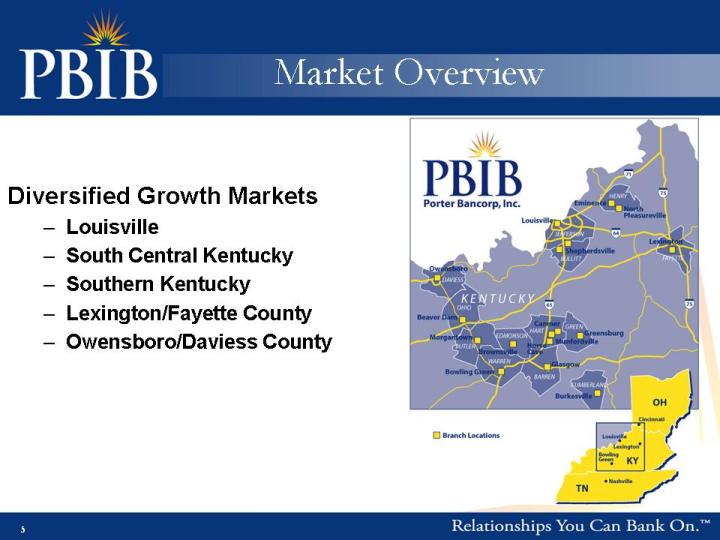
5 Market Overview Diversified Growth Markets Louisville South Central Kentucky Southern Kentucky Lexington/Fayette County Owensboro/Daviess County
6 16th largest city in the U.S. and largest city in Kentucky Economic and job growth rates are greater than the national average Strong commercial loan demand Diversified economy Large employers include UPS, GE, Humana, YUM! Brands, Ford New distribution businesses attributed to UPS hub – Best Buy, Gordon Foods, Johnson & Johnson, Zappos, Geek Squad Home of University of Louisville – J. Chester Porter serves as Chairman of Board of Trustees Louisville Market

7 Hart, Green and Cumberland counties Community markets Stable source of deposits and loans Lower cost of funds PBIB’s main back-office location Fort Knox consolidation relocation (BRAC) Agricultural and service-based economy South Central Kentucky Market
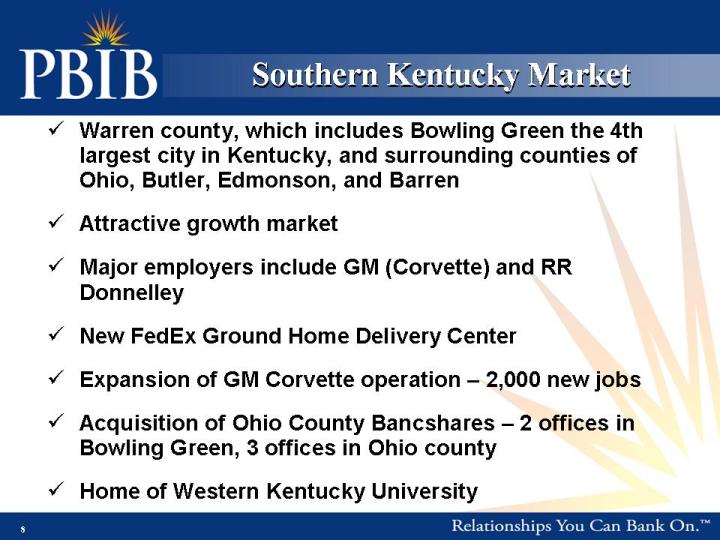
8 Warren county, which includes Bowling Green the 4th largest city in Kentucky, and surrounding counties of Ohio, Butler, Edmonson, and Barren Attractive growth market Major employers include GM (Corvette) and RR Donnelley New FedEx Ground Home Delivery Center Expansion of GM Corvette operation – 2,000 new jobs Acquisition of Ohio County Bancshares – 2 offices in Bowling Green, 3 offices in Ohio county Home of Western Kentucky University Southern Kentucky Market

9 Lexington/Fayette County 2nd largest city in Kentucky Financial, educational, retail, healthcare and cultural center for Bluegrass Region of Central Kentucky and Eastern Kentucky Attractive growth market Diversified economy Home of University of Kentucky Large employers include Toyota, Lexmark, IBM Global Services and Valvoline Owensboro/Daviess County 3rd largest city in Kentucky Industrial, medical, retail and cultural hub for Western Kentucky Diversified economy Home of two four year liberal arts colleges (Brescia University and Kentucky Wesleyan College) Large employers include Owensboro Medical Health System, Texas Gas, US Bank Home Mortgage and Toyotetsu 2007 Market Expansion
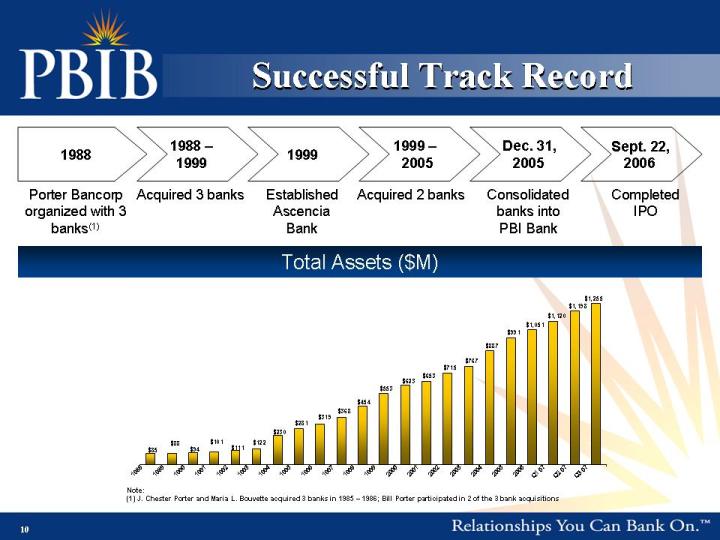
10 Note: (1) J. Chester Porter and Maria L. Bouvette acquired 3 banks in 1985 – 1986; Bill Porter participated in 2 of the 3 bank acquisitions1988Porter Bancorp organized with 3 banks(1)1988 – 1999 Acquired 3 banks 1999 Established Ascencia Bank 1999–2005 Acquired 2 banks Dec. 31, 2005 Consolidated banks into PBI Bank Total Assets ($M) Sept. 22, 2006 Completed IPO Successful Track Record (Gp:) $281 (Gp:) $553 (Gp:) $653 (Gp:) $715 (Gp:) $767 (Gp:) $887 (Gp:) $991 (Gp:) $1,051 (Gp:) $1,120 (Gp:) $1,198 (Gp:) $1,255 (Gp:) $623 (Gp:) $454 (Gp:) $319 (Gp:) $368 (Gp:) $230 (Gp:) $122 (Gp:) $85 (Gp:) $88 (Gp:) $94 (Gp:) $101 (Gp:) $111 (Gp:) 1988 (Gp:) 1989 (Gp:) 1990 (Gp:) 1991 (Gp:) 1992 (Gp:) 1993 (Gp:) 1994 (Gp:) 1995 (Gp:) 1996 (Gp:) 1997 (Gp:) 1998 (Gp:) 1999 (Gp:) 2000 (Gp:) 2001 (Gp:) 2002 (Gp:) 2003 (Gp:) 2004 (Gp:) 2005 (Gp:) 2006 (Gp:) Q1 07 (Gp:) Q2 07 (Gp:) Q3 07
11 Experienced management team Extensive market knowledge and community relationships Acquisition and integration capabilities Scalable operating platform Highly efficient organizational structure Diversified funding sources Highly focused on profits Operating Strengths
12 We will expand our presence in fast growing markets by adding strategically located new offices and making selective acquisitions Focus on markets with attractive growth prospects Strategic de novo branching Selective acquisitions Experienced integrators Extensive market knowledge and contacts Accretive to earnings in first year Continue marketing our new brand – top of mind awareness Increasing core deposits Open new retail offices (two over next twelve months – Shepherdsville and Lexington) Growth Strategies
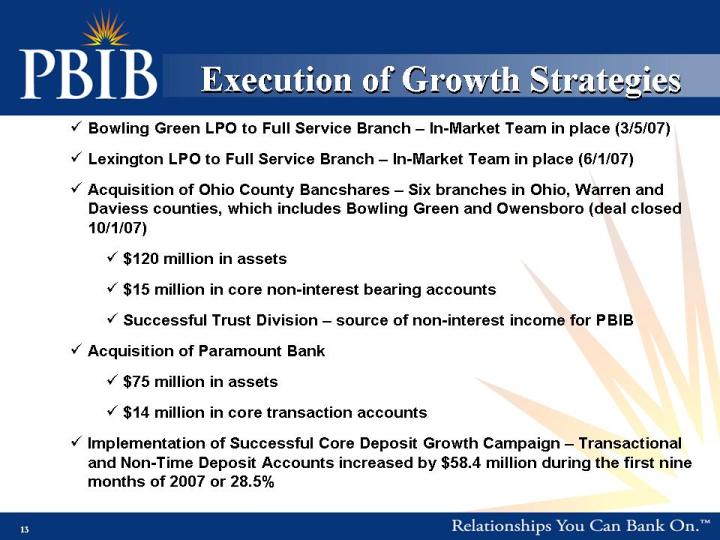
13 Execution of Growth Strategies Bowling Green LPO to Full Service Branch – In-Market Team in place (3/5/07) Lexington LPO to Full Service Branch – In-Market Team in place (6/1/07) Acquisition of Ohio County Bancshares – Six branches in Ohio, Warren and Daviess counties, which includes Bowling Green and Owensboro (deal closed 10/1/07) $120 million in assets $15 million in core non-interest bearing accounts Successful Trust Division – source of non-interest income for PBIB Acquisition of Paramount Bank $75 million in assets $14 million in core transaction accounts Implementation of Successful Core Deposit Growth Campaign – Transactional and Non-Time Deposit Accounts increased by $58.4 million during the first nine months of 2007 or 28.5%

14 Analysis of Ohio County Bancshares Acquisition Key Deal Points Six branch locations – Bowling Green, Owensboro and Beaver Dam $120 million in assets $100 million in deposits $15 million in non-interest bearing accounts or 15% of total deposits Accretive to earnings Dilution to book value less than 3% Price to tangible book – approximately 190% Core deposit premium – less than 7%

15 Key Deal Points Excellent location $75 million in assets $65 million in deposits $14 million in transaction accounts ($6 million in non-interest bearing accounts) Accretive to earnings Dilution to book value approximately 5% Deposit premium – approximately 7% Analysis of Paramount Bank Acquisition
16 Financial Highlights
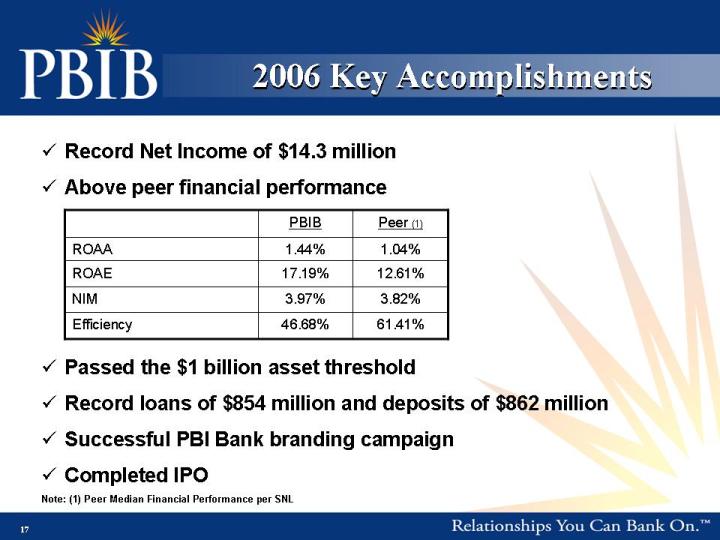
17 2006 Key Accomplishments Record Net Income of $14.3 million Above peer financial performance Passed the $1 billion asset threshold Record loans of $854 million and deposits of $862 million Successful PBI Bank branding campaign Completed IPO Note: (1) Peer Median Financial Performance per SNL

18 Asset Growth ($ in millions) (Gp:) $887 (Gp:) $991 (Gp:) $1,051 (Gp:) $1,120 (Gp:) $1,198 (Gp:) $1,255 (Gp:) $0 (Gp:) $200 (Gp:) $400 (Gp:) $600 (Gp:) $800 (Gp:) $1,000 (Gp:) $1,200 (Gp:) $1,400 (Gp:) 2004 (Gp:) 2005 (Gp:) 2006 (Gp:) Q1 07 (Gp:) Q2 07 (Gp:) Q3 07

19 Loan Growth ($ in millions) (Gp:) $734 (Gp:) $792 (Gp:) $854 (Gp:) $927 (Gp:) $983 (Gp:) $1,075 (Gp:) $0 (Gp:) $200 (Gp:) $400 (Gp:) $600 (Gp:) $800 (Gp:) $1,000 (Gp:) $1,200 (Gp:) 2004 (Gp:) 2005 (Gp:) 2006 (Gp:) Q1 07 (Gp:) Q2 07 (Gp:) Q3 07
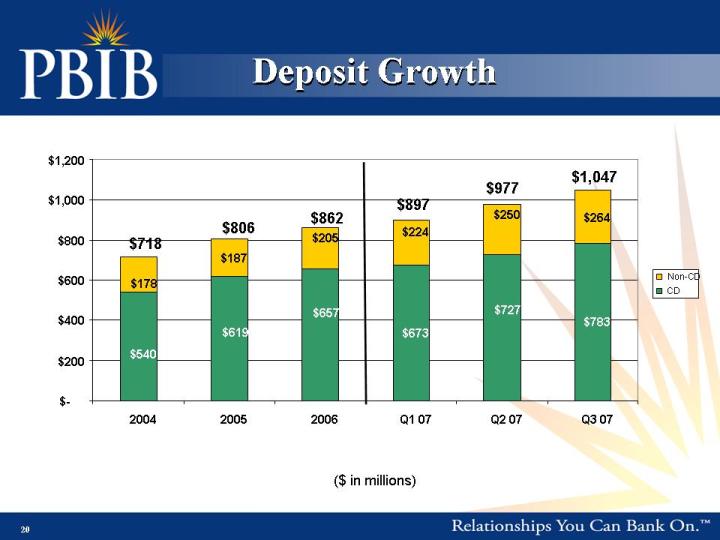
20 Deposit Growth ($ in millions) $673 $783 $187 $264 $727 $657 $540 $619 $178 $205 $224 $250 $- $200 $400 $600 $800 $1,000 $1,200 2004 2005 2006 Q1 07 Q2 07 Q3 07 Non-CD CD $718 $806 $862 $897 $977 $1,047
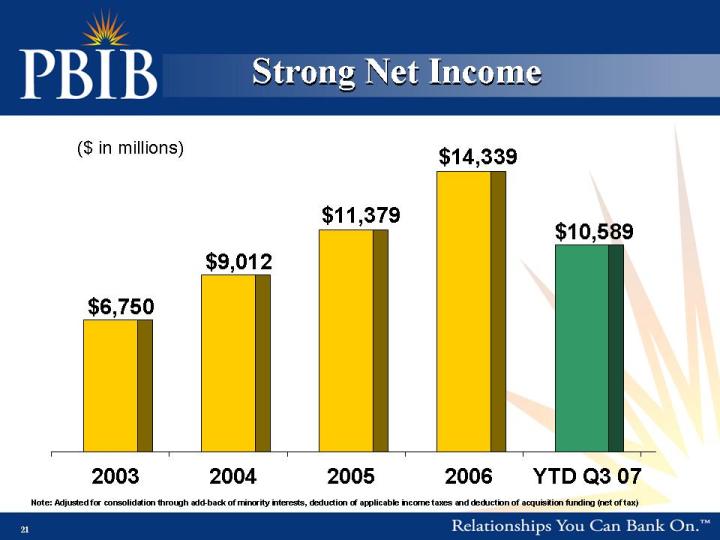
21 Strong Net Income ($ in millions) Note: Adjusted for consolidation through add-back of minority interests, deduction of applicable income taxes and deduction of acquisition funding (net of tax) (Gp:) $6,750 (Gp:) $9,012 (Gp:) $11,379 (Gp:) $14,339 (Gp:) $10,589 (Gp:) 2003 (Gp:) 2004 (Gp:) 2005 (Gp:) 2006 (Gp:) YTD Q3 07

22 Solid Net Interest Margin (Gp:) 3.71% (Gp:) 3.84% (Gp:) 4.06% (Gp:) 3.97% (Gp:) 2003 (Gp:) 2004 (Gp:) 2005 (Gp:) 2006
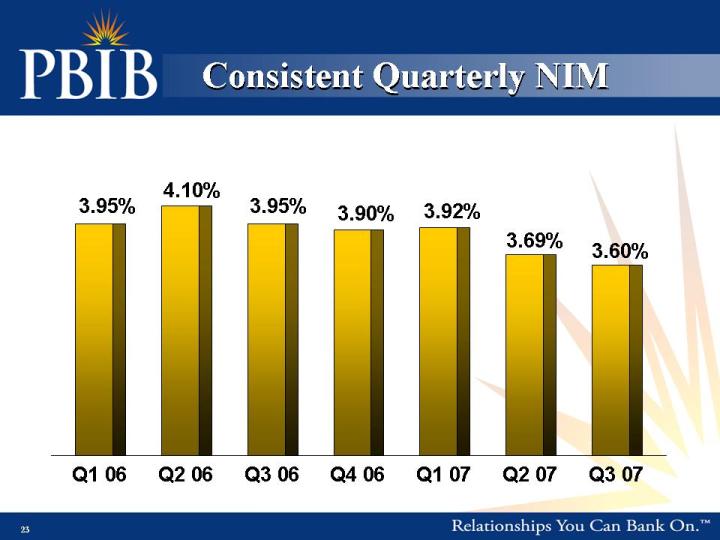
23 Consistent Quarterly NIM (Gp:) 3.95% (Gp:) 4.10% (Gp:) 3.95% (Gp:) 3.90% (Gp:) 3.92% (Gp:) 3.69% (Gp:) 3.60% (Gp:) Q1 06 (Gp:) Q2 06 (Gp:) Q3 06 (Gp:) Q4 06 (Gp:) Q1 07 (Gp:) Q2 07 (Gp:) Q3 07
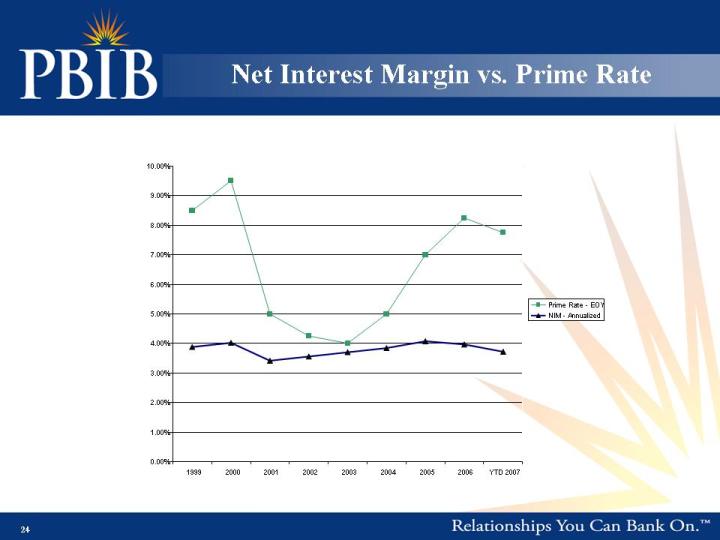
24 Net Interest Margin vs. Prime Rate (Gp:) 0.00% (Gp:) 1.00% (Gp:) 2.00% (Gp:) 3.00% (Gp:) 4.00% (Gp:) 5.00% (Gp:) 6.00% (Gp:) 7.00% (Gp:) 8.00% (Gp:) 9.00% (Gp:) 10.00% (Gp:) 1999 (Gp:) 2000 (Gp:) 2001 (Gp:) 2002 (Gp:) 2003 (Gp:) 2004 (Gp:) 2005 (Gp:) 2006 (Gp:) YTD 2007 (Gp:) Prime Rate - EOY (Gp:) NIM - Annualized
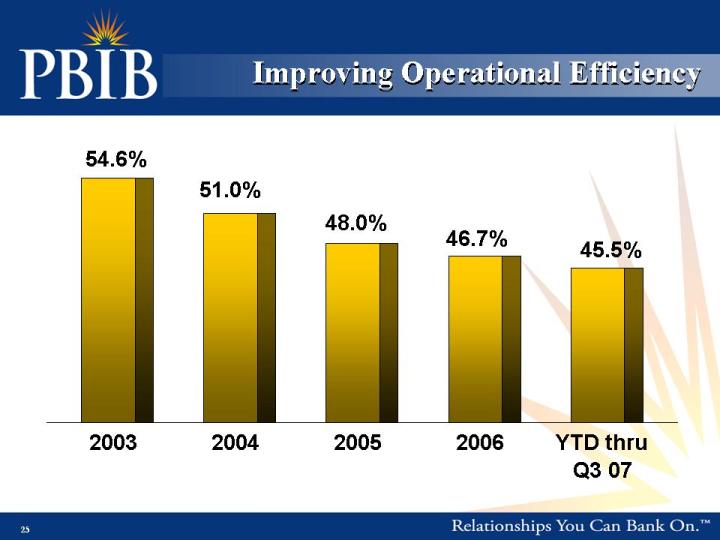
25 Improving Operational Efficiency (Gp:) 54.6% (Gp:) 51.0% (Gp:) 48.0% (Gp:) 46.7% (Gp:) 45.5% (Gp:) 2003 (Gp:) 2004 (Gp:) 2005 (Gp:) 2006 (Gp:) YTD thru (Gp:) Q3 07

26 Strong Return on Assets Note: Adjusted for consolidation through add-back of minority interests, deduction of applicable income taxes and deduction of acquisition funding (net of tax) (Gp:) 0.91% (Gp:) 1.09% (Gp:) 1.21% (Gp:) 1.44% (Gp:) 1.22% (Gp:) 2003 (Gp:) 2004 (Gp:) 2005 (Gp:) 2006 (Gp:) YTD thru (Gp:) Q3 07
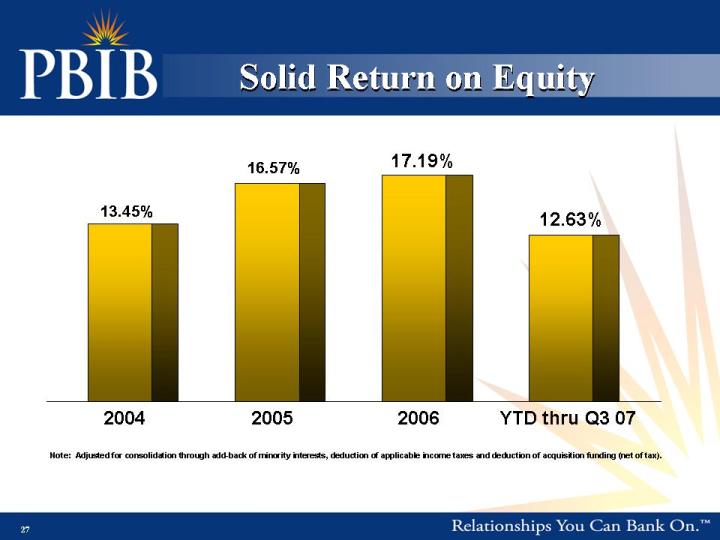
27 Solid Return on Equity Note: Adjusted for consolidation through add-back of minority interests, deduction of applicable income taxes and deduction of acquisition funding (net of tax). (Gp:) 13.45% (Gp:) 16.57% (Gp:) 17.19% (Gp:) 12.63% (Gp:) 2004 (Gp:) 2005 (Gp:) 2006 (Gp:) YTD thru Q3 07
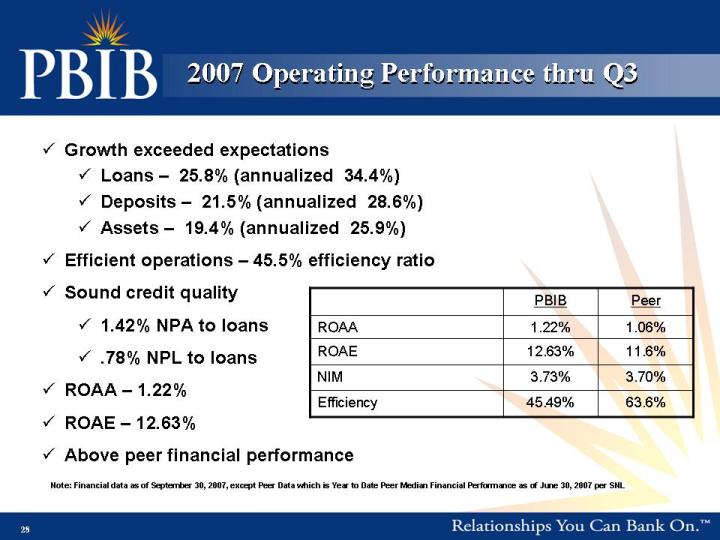
28 2007 Operating Performance thru Q3 Growth exceeded expectations Loans – 25.8% (annualized 34.4%) Deposits – 21.5% (annualized 28.6%) Assets – 19.4% (annualized 25.9%) Efficient operations – 45.5% efficiency ratio Sound credit quality 1.42% NPA to loans .78% NPL to loans ROAA – 1.22% ROAE – 12.63% Above peer financial performance Note: Financial data as of September 30, 2007, except Peer Data which is Year to Date Peer Median Financial Performance as of June 30, 2007 per SNL

29 Note: (1) As of September 30, 2007 Primary focus on residential and commercial real estate (including farmland) and construction – real estate lending 86% of total loans at September 30, 2007 Granular portfolio No “subprime” exposure Loyal and experienced producers Team approach to customers Locally empowered lenders with timely decision making Loan Portfolio (1) Total Loans: $1.1B Loan Stratification Highlights (Gp:) Agricultural (Gp:) 1.4% (Gp:) Consumer (Gp:) 3.0% (Gp:) C & I (Gp:) 7.6% (Gp:) Home Equity (Gp:) 1.8% (Gp:) Farmland (Gp:) 6.4% (Gp:) Other (Gp:) 0.1% (Gp:) Commercial Real Estate (Gp:) 30.6% (Gp:) Construction Real Estate (Gp:) 26.4% (Gp:) Residential Real Estate (Gp:) 22.7%
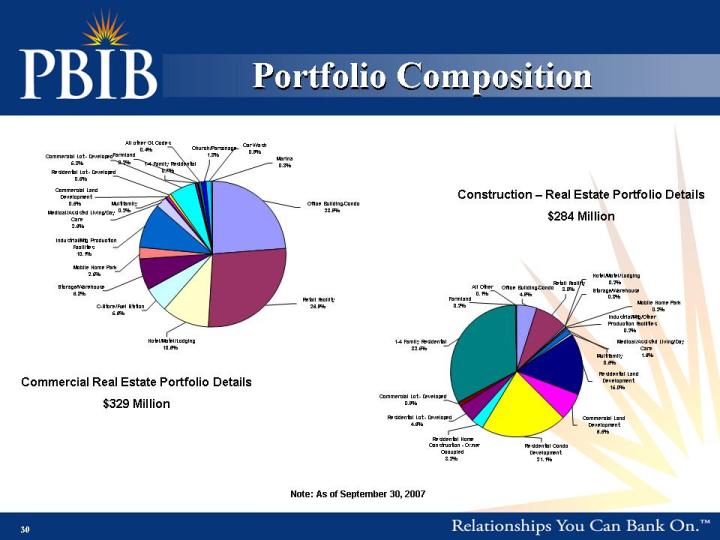
30 Portfolio Composition Note: As of September 30, 2007 Commercial Real Estate Portfolio Details $329 Million Construction – Real Estate Portfolio Details $284 Million (Gp:) Office Building/Condo (Gp:) 23.9% (Gp:) Retail Facility (Gp:) 26.9% (Gp:) Hotel/Motel/Lodging (Gp:) 10.6% (Gp:) C-Store/Fuel Station (Gp:) 5.6% (Gp:) Storage/Warehouse (Gp:) 6.8% (Gp:) Mobile Home Park (Gp:) 2.5% (Gp:) Multifamily (Gp:) 0.2% (Gp:) Industrial/Mfg Production (Gp:) Facilities (Gp:) 10.1% (Gp:) 1-4 Family Residential (Gp:) 0.7% (Gp:) Farmland (Gp:) 0.2% (Gp:) Medical/Assisted Living/Day (Gp:) Care (Gp:) 2.6% (Gp:) Commercial Lot - Developed (Gp:) 5.8% (Gp:) Commercial Land (Gp:) Development (Gp:) 0.5% (Gp:) Residential Lot - Developed (Gp:) 0.5% (Gp:) All other GL Codes (Gp:) 0.4% (Gp:) Church/Parsonage (Gp:) 1.3% (Gp:) Car Wash (Gp:) 0.9% (Gp:) Marina (Gp:) 0.3% (Gp:) Residential Lot - Developed (Gp:) 4.6% (Gp:) Commercial Land (Gp:) Development (Gp:) 6.5% (Gp:) Residential Condo (Gp:) Development (Gp:) 21.1% (Gp:) Residential Home (Gp:) Construction - Owner (Gp:) Occupied (Gp:) 3.2% (Gp:) Commercial Lot - Developed (Gp:) 0.9% (Gp:) 1-4 Family Residential (Gp:) 32.5% (Gp:) Storage/Warehouse (Gp:) 0.3% (Gp:) Residential Land (Gp:) Development (Gp:) 15.0% (Gp:) Industrial/Mfg/Other (Gp:) Production Facilities (Gp:) 0.2% (Gp:) Mobile Home Park (Gp:) 0.2% (Gp:) Hotel/Motel/Lodging (Gp:) 0.2% (Gp:) Multifamily (Gp:) 0.6% (Gp:) Medical/Assisted Living/Day (Gp:) Care (Gp:) 1.6% (Gp:) Retail Facility (Gp:) 8.0% (Gp:) Office Building/Condo (Gp:) 4.9% (Gp:) All Other (Gp:) 0.1% (Gp:) Farmland (Gp:) 0.2%
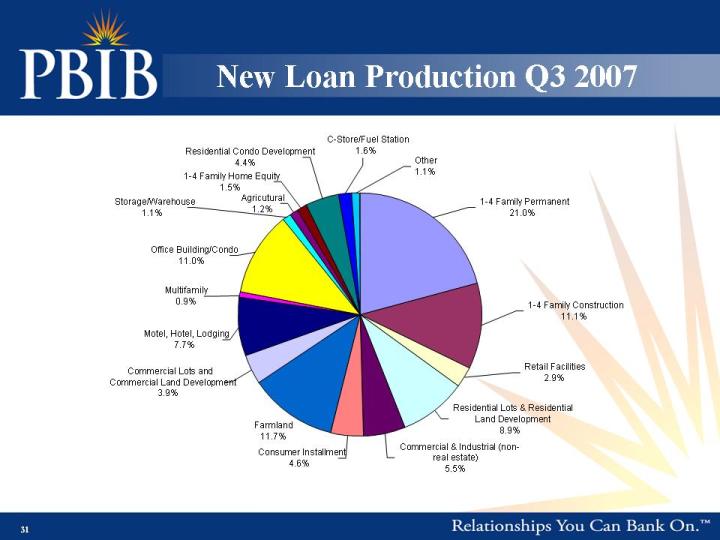
31 New Loan Production Q3 2007 (Gp:) Residential Lots & Residential (Gp:) Land Development (Gp:) 8.9% (Gp:) Commercial & Industrial (non- (Gp:) real estate) (Gp:) 5.5% (Gp:) Consumer Installment (Gp:) 4.6% (Gp:) Farmland (Gp:) 11.7% (Gp:) Multifamily (Gp:) 0.9% (Gp:) Motel, Hotel, Lodging (Gp:) 7.7% (Gp:) Commercial Lots and (Gp:) Commercial Land Development (Gp:) 3.9% (Gp:) Retail Facilities (Gp:) 2.9% (Gp:) 1-4 Family Construction (Gp:) 11.1% (Gp:) Office Building/Condo (Gp:) 11.0% (Gp:) Other (Gp:) 1.1% (Gp:) 1-4 Family Permanent (Gp:) 21.0% (Gp:) Agricutural (Gp:) 1.2% (Gp:) Storage/Warehouse (Gp:) 1.1% (Gp:) 1-4 Family Home Equity (Gp:) 1.5% (Gp:) Residential Condo Development (Gp:) 4.4% (Gp:) C-Store/Fuel Station (Gp:) 1.6%
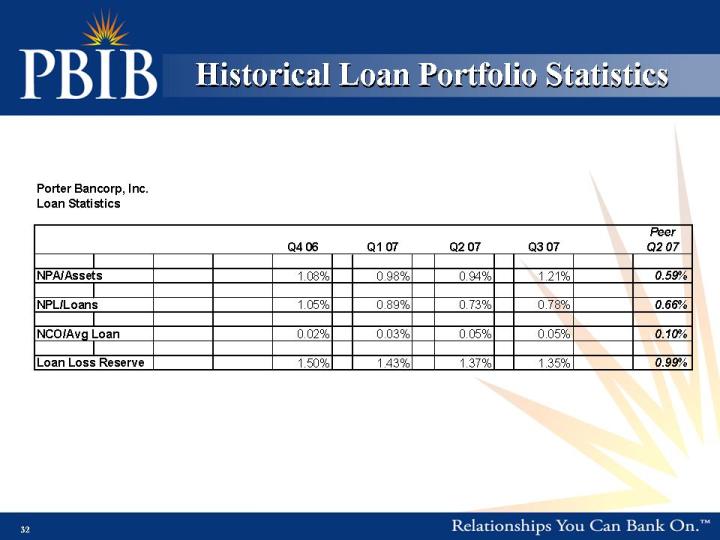
32 Historical Loan Portfolio Statistics
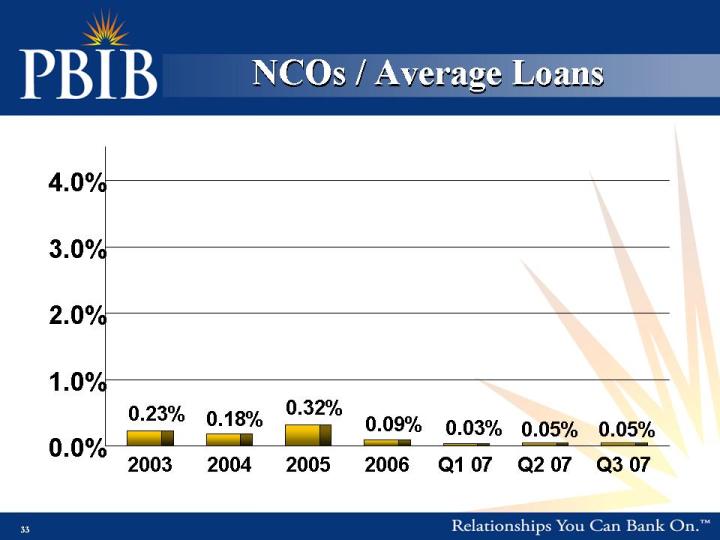
33 NCOs / Average Loans (Gp:) 0.23% (Gp:) 0.18% (Gp:) 0.32% (Gp:) 0.09% (Gp:) 0.03% (Gp:) 0.05% (Gp:) 0.05% (Gp:) 0.0% (Gp:) 1.0% (Gp:) 2.0% (Gp:) 3.0% (Gp:) 4.0% (Gp:) 2003 (Gp:) 2004 (Gp:) 2005 (Gp:) 2006 (Gp:) Q1 07 (Gp:) Q2 07 (Gp:) Q3 07

34 Note: (1) For the quarter ended September 30, 2007; rate based on average daily deposit balances Deposit Mix (1) Total Deposits: $ 1.05B Cost of Deposits:(1) 4.93% Effective core deposit growth initiatives Core non-interest bearing deposits up 8.6% (YTD thru Q3) High CD retention rates Focus on core deposit development Online banking division a ready source of alternative funding (used to pre-fund loan growth in new and current markets) Deposit Stratification Highlights (Gp:) CD's $100k or greater (Gp:) 23% (Gp:) CD's less than $100k (Gp:) 52% (Gp:) NOW and Money (Gp:) Market (Gp:) 16% (Gp:) Savings (Gp:) 2% (Gp:) Non-Interest Bearing (Gp:) DDA (Gp:) 7%
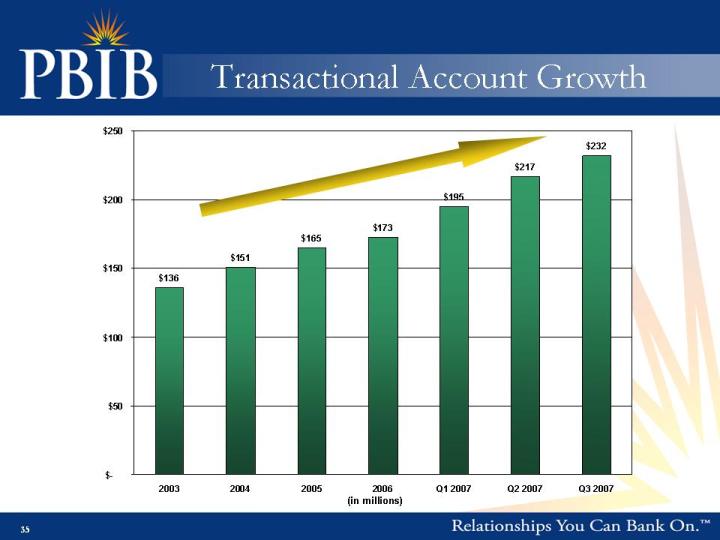
35 Transactional Account Growth (in millions)
36 Investment Highlights

37 Attractive, diversified growth markets History of executing growth strategy Scalable platform for expansion Efficient operating model Solid operating performance Undervalued investment opportunity Investment Highlights
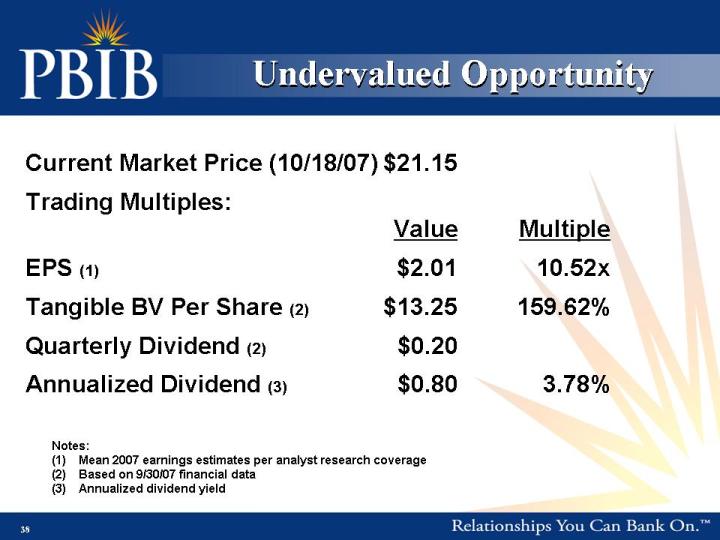
38 Undervalued Opportunity Current Market Price (10/18/07)$21.15 Trading Multiples:ValueMultiple EPS (1)$2.0110.52x Tangible BV Per Share (2)$13.25159.62% Quarterly Dividend (2)$0.20 Annualized Dividend (3)$0.803.78% Notes: Mean 2007 earnings estimates per analyst research coverage Based on 9/30/07 financial data Annualized dividend yield

39 Contact Information Maria L. Bouvette David B. Pierce President and CEOChief Financial Officer Porter Bancorp, Inc. 2500 Eastpoint Parkway Louisville, KY 40223 502-499-4800 www.pbibank.com

40 Addendum
41
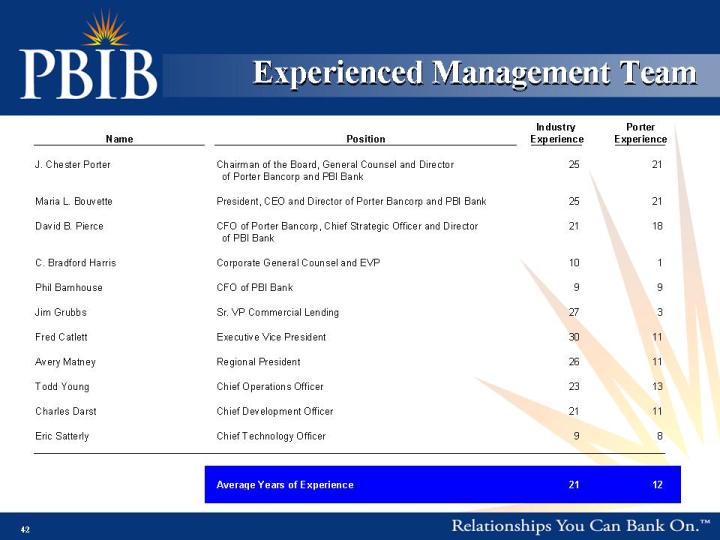
42 Experienced Management Team
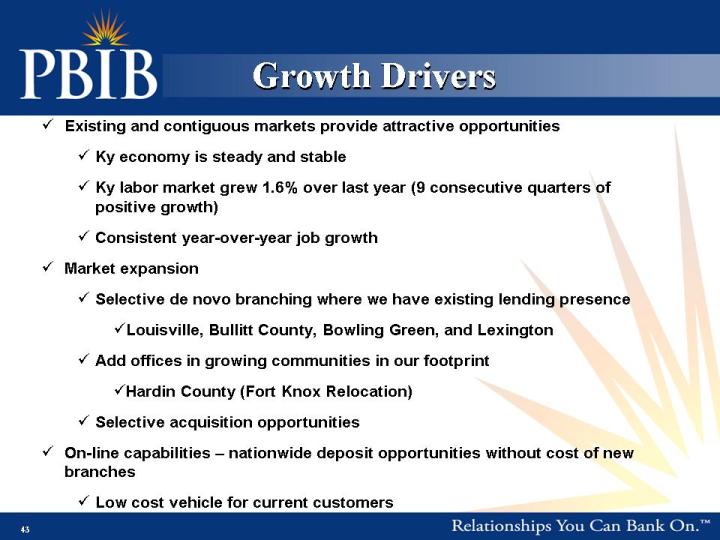
43 Existing and contiguous markets provide attractive opportunities Ky economy is steady and stable Ky labor market grew 1.6% over last year (9 consecutive quarters of positive growth) Consistent year-over-year job growth Market expansion Selective de novo branching where we have existing lending presence Louisville, Bullitt County, Bowling Green, and Lexington Add offices in growing communities in our footprint Hardin County (Fort Knox Relocation) Selective acquisition opportunities On-line capabilities – nationwide deposit opportunities without cost of new branches Low cost vehicle for current customers Growth Drivers
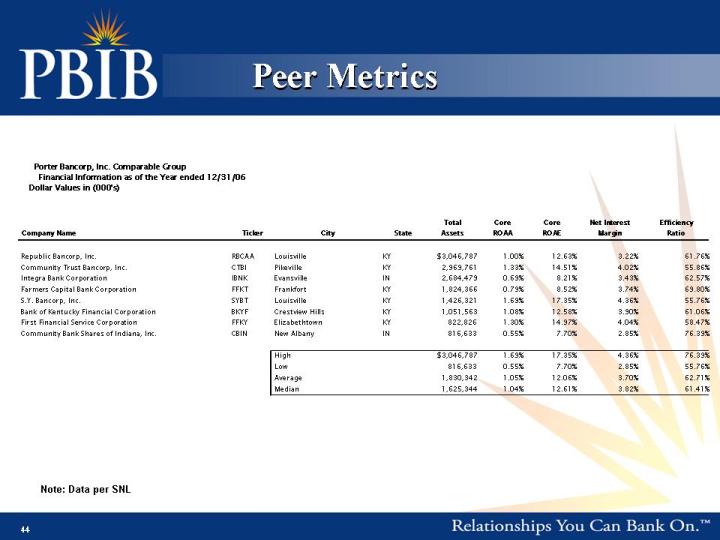
44 Peer Metrics Note: Data per SNL (Gp:) Porter Bancorp, Inc. Comparable Group (Gp:) Financial Information as of the Year ended 12/31/06 (Gp:) Dollar Values in (000's) (Gp:) Total (Gp:) Core (Gp:) Core (Gp:) Net Interest (Gp:) Efficiency (Gp:) Company Name (Gp:) Ticker (Gp:) City (Gp:) State (Gp:) Assets (Gp:) ROAA (Gp:) ROAE (Gp:) Margin (Gp:) Ratio (Gp:) Republic Bancorp, Inc. (Gp:) RBCAA (Gp:) Louisville (Gp:) KY (Gp:) $3,046,787 (Gp:) 1.00% (Gp:) 12.63% (Gp:) 3.22% (Gp:) 61.76% (Gp:) Community Trust Bancorp, Inc. (Gp:) CTBI (Gp:) Pikeville (Gp:) KY (Gp:) 2,969,761 (Gp:) 1.33% (Gp:) 14.51% (Gp:) 4.02% (Gp:) 55.86% (Gp:) Integra Bank Corporation (Gp:) IBNK (Gp:) Evansville (Gp:) IN (Gp:) 2,684,479 (Gp:) 0.69% (Gp:) 8.21% (Gp:) 3.43% (Gp:) 62.57% (Gp:) Farmers Capital Bank Corporation (Gp:) FFKT (Gp:) Frankfort (Gp:) KY (Gp:) 1,824,366 (Gp:) 0.79% (Gp:) 8.52% (Gp:) 3.74% (Gp:) 69.80% (Gp:) S.Y. Bancorp, Inc. (Gp:) SYBT (Gp:) Louisville (Gp:) KY (Gp:) 1,426,321 (Gp:) 1.69% (Gp:) 17.35% (Gp:) 4.36% (Gp:) 55.76% (Gp:) Bank of Kentucky Financial Corporation (Gp:) BKYF (Gp:) Crestview Hills (Gp:) KY (Gp:) 1,051,563 (Gp:) 1.08% (Gp:) 12.58% (Gp:) 3.90% (Gp:) 61.06% (Gp:) First Financial Service Corporation (Gp:) FFKY (Gp:) Elizabethtown (Gp:) KY (Gp:) 822,826 (Gp:) 1.30% (Gp:) 14.97% (Gp:) 4.04% (Gp:) 58.47% (Gp:) Community Bank Shares of Indiana, Inc. (Gp:) CBIN (Gp:) New Albany (Gp:) IN (Gp:) 816,633 (Gp:) 0.55% (Gp:) 7.70% (Gp:) 2.85% (Gp:) 76.39% (Gp:) High (Gp:) $3,046,787 (Gp:) 1.69% (Gp:) 17.35% (Gp:) 4.36% (Gp:) 76.39% (Gp:) Low (Gp:) 816,633 (Gp:) 0.55% (Gp:) 7.70% (Gp:) 2.85% (Gp:) 55.76% (Gp:) Average (Gp:) 1,830,342 (Gp:) 1.05% (Gp:) 12.06% (Gp:) 3.70% (Gp:) 62.71% (Gp:) Median (Gp:) 1,625,344 (Gp:) 1.04% (Gp:) 12.61% (Gp:) 3.82% (Gp:) 61.41%
45 Peer Metrics Note: Data per SNL
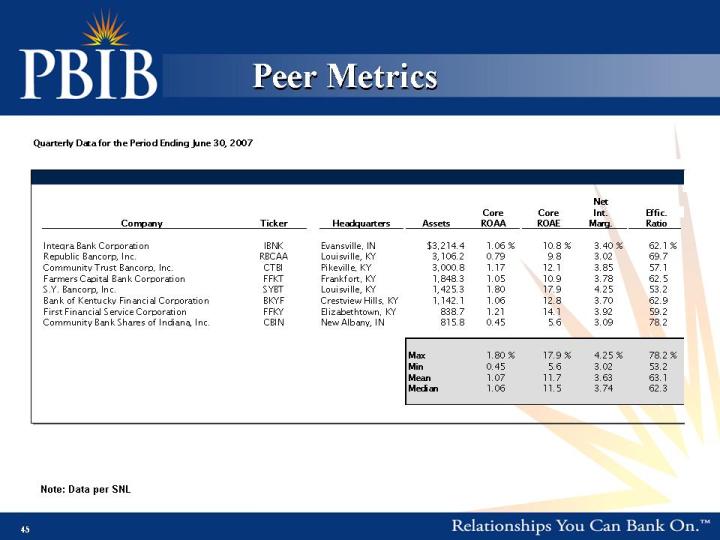
46 Peer Metrics Note: Data per SNL (Gp:) Year to Data information for the Period Ending June 30, 2007 (Gp:) Net (Gp:) Core (Gp:) Core (Gp:) Int. (Gp:) Effic. (Gp:) (Gp:) Company (Gp:) Ticker (Gp:) Headquarters (Gp:) Assets (Gp:) ROAA (Gp:) ROAE (Gp:) Marg. (Gp:) Ratio (Gp:) Integra Bank Corporation (Gp:) IBNK (Gp:) Evansville, IN (Gp:) $3,214.4 (Gp:) 1.08 (Gp:) % (Gp:) 11.5 (Gp:) % (Gp:) 3.43 (Gp:) % (Gp:) 64.0 (Gp:) % (Gp:) Republic Bancorp, Inc. (Gp:) RBCAA (Gp:) Louisville, KY (Gp:) 3,106.2 (Gp:) 0.94 (Gp:) 11.8 (Gp:) 3.38 (Gp:) 63.3 (Gp:) Community Trust Bancorp, Inc. (Gp:) CTBI (Gp:) Pikeville, KY (Gp:) 3,000.8 (Gp:) 1.12 (Gp:) 11.7 (Gp:) 3.82 (Gp:) 60.5 (Gp:) Farmers Capital Bank Corporation (Gp:) FFKT (Gp:) Frankfort, KY (Gp:) 1,848.3 (Gp:) 1.03 (Gp:) 10.6 (Gp:) 3.70 (Gp:) 64.4 (Gp:) S.Y. Bancorp, Inc. (Gp:) SYBT (Gp:) Louisville, KY (Gp:) 1,425.3 (Gp:) 1.71 (Gp:) 17.1 (Gp:) 4.21 (Gp:) 53.9 (Gp:) Bank of Kentucky Financial Corporation (Gp:) BKYF (Gp:) Crestview Hills, KY (Gp:) 1,142.1 (Gp:) 0.94 (Gp:) 11.4 (Gp:) 3.70 (Gp:) 64.9 (Gp:) First Financial Service Corporation (Gp:) FFKY (Gp:) Elizabethtown, KY (Gp:) 838.7 (Gp:) 1.16 (Gp:) 13.4 (Gp:) 3.91 (Gp:) 60.8 (Gp:) Community Bank Shares of Indiana, Inc. (Gp:) CBIN (Gp:) New Albany, IN (Gp:) 815.8 (Gp:) 0.48 (Gp:) 5.9 (Gp:) 3.04 (Gp:) 77.2 (Gp:) Max (Gp:) 1.71 (Gp:) % (Gp:) 17.1 (Gp:) % (Gp:) 4.21 (Gp:) % (Gp:) 77.2 (Gp:) % (Gp:) Min (Gp:) 0.48 (Gp:) 5.9 (Gp:) 3.04 (Gp:) 53.9 (Gp:) Mean (Gp:) 1.06 (Gp:) 11.7 (Gp:) 3.65 (Gp:) 63.6 (Gp:) Median (Gp:) 1.06 (Gp:) 11.6 (Gp:) 3.70 (Gp:) 63.6

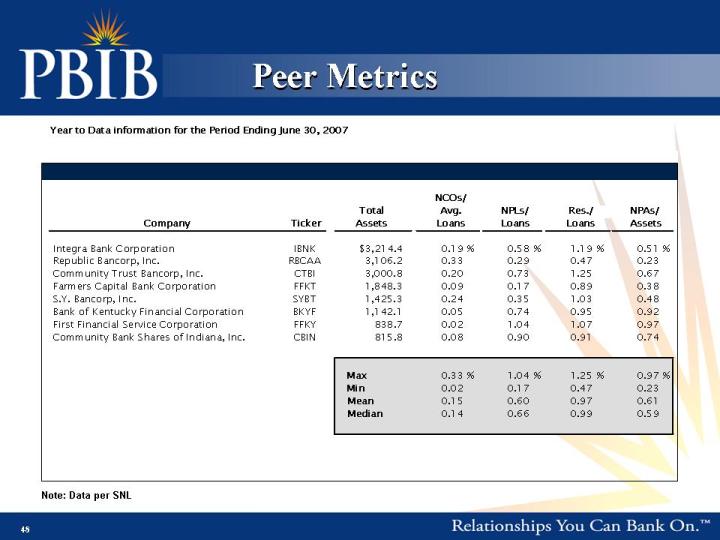
47 Peer Metrics Note: Data per SNL (Gp:) Quarterly Data for the Period Ending June 30, 2007 (Gp:) NCOs/ (Gp:) Total (Gp:) Avg. (Gp:) NPLs/ (Gp:) Res./ (Gp:) NPAs/ (Gp:) (Gp:) Company (Gp:) Ticker (Gp:) Assets (Gp:) Loans (Gp:) Loans (Gp:) Loans (Gp:) Assets (Gp:) Integra Bank Corporation (Gp:) IBNK (Gp:) $3,214.4 (Gp:) 0.22 (Gp:) % (Gp:) 0.58 (Gp:) % (Gp:) 1.19 (Gp:) % (Gp:) 0.51 (Gp:) % (Gp:) Republic Bancorp, Inc. (Gp:) RBCAA (Gp:) 3,106.2 (Gp:) 0.08 (Gp:) 0.29 (Gp:) 0.47 (Gp:) 0.23 (Gp:) Community Trust Bancorp, Inc. (Gp:) CTBI (Gp:) 3,000.8 (Gp:) 0.22 (Gp:) 0.73 (Gp:) 1.25 (Gp:) 0.67 (Gp:) Farmers Capital Bank Corporation (Gp:) FFKT (Gp:) 1,848.3 (Gp:) 0.12 (Gp:) 0.17 (Gp:) 0.89 (Gp:) 0.38 (Gp:) S.Y. Bancorp, Inc. (Gp:) SYBT (Gp:) 1,425.3 (Gp:) 0.20 (Gp:) 0.35 (Gp:) 1.03 (Gp:) 0.48 (Gp:) Bank of Kentucky Financial Corporation (Gp:) BKYF (Gp:) 1,142.1 (Gp:) -0.01 (Gp:) 0.74 (Gp:) 0.95 (Gp:) 0.92 (Gp:) First Financial Service Corporation (Gp:) FFKY (Gp:) 838.7 (Gp:) 0.02 (Gp:) 1.04 (Gp:) 1.07 (Gp:) 0.97 (Gp:) Community Bank Shares of Indiana, Inc. (Gp:) CBIN (Gp:) 815.8 (Gp:) 0.05 (Gp:) 0.90 (Gp:) 0.91 (Gp:) 0.74 (Gp:) (Gp:) Max (Gp:) 0.22 (Gp:) % (Gp:) 1.04 (Gp:) % (Gp:) 1.25 (Gp:) % (Gp:) 0.97 (Gp:) % (Gp:) Min (Gp:) -0.01 (Gp:) 0.17 (Gp:) 0.47 (Gp:) 0.23 (Gp:) Mean (Gp:) 0.11 (Gp:) 0.60 (Gp:) 0.97 (Gp:) 0.61 (Gp:) Median (Gp:) 0.10 (Gp:) 0.66 (Gp:) 0.99 (Gp:) 0.59
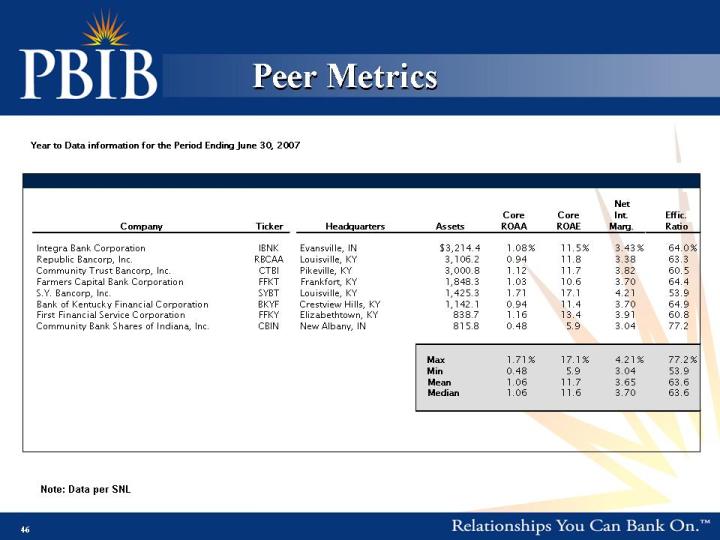
48 Peer Metrics Note: Data per SNL (Gp:) Year to Data information for the Period Ending June 30, 2007 (Gp:) NCOs/ (Gp:) Total (Gp:) Avg. (Gp:) NPLs/ (Gp:) Res./ (Gp:) NPAs/ (Gp:) (Gp:) Company (Gp:) Ticker (Gp:) Assets (Gp:) Loans (Gp:) Loans (Gp:) Loans (Gp:) Assets (Gp:) Integra Bank Corporation (Gp:) IBNK (Gp:) $3,214.4 (Gp:) 0.19 (Gp:) % (Gp:) 0.58 (Gp:) % (Gp:) 1.19 (Gp:) % (Gp:) 0.51 (Gp:) % (Gp:) Republic Bancorp, Inc. (Gp:) RBCAA (Gp:) 3,106.2 (Gp:) 0.33 (Gp:) 0.29 (Gp:) 0.47 (Gp:) 0.23 (Gp:) Community Trust Bancorp, Inc. (Gp:) CTBI (Gp:) 3,000.8 (Gp:) 0.20 (Gp:) 0.73 (Gp:) 1.25 (Gp:) 0.67 (Gp:) Farmers Capital Bank Corporation (Gp:) FFKT (Gp:) 1,848.3 (Gp:) 0.09 (Gp:) 0.17 (Gp:) 0.89 (Gp:) 0.38 (Gp:) S.Y. Bancorp, Inc. (Gp:) SYBT (Gp:) 1,425.3 (Gp:) 0.24 (Gp:) 0.35 (Gp:) 1.03 (Gp:) 0.48 (Gp:) Bank of Kentucky Financial Corporation (Gp:) BKYF (Gp:) 1,142.1 (Gp:) 0.05 (Gp:) 0.74 (Gp:) 0.95 (Gp:) 0.92 (Gp:) First Financial Service Corporation (Gp:) FFKY (Gp:) 838.7 (Gp:) 0.02 (Gp:) 1.04 (Gp:) 1.07 (Gp:) 0.97 (Gp:) Community Bank Shares of Indiana, Inc. (Gp:) CBIN (Gp:) 815.8 (Gp:) 0.08 (Gp:) 0.90 (Gp:) 0.91 (Gp:) 0.74 (Gp:) (Gp:) Max (Gp:) 0.33 (Gp:) % (Gp:) 1.04 (Gp:) % (Gp:) 1.25 (Gp:) % (Gp:) 0.97 (Gp:) % (Gp:) Min (Gp:) 0.02 (Gp:) 0.17 (Gp:) 0.47 (Gp:) 0.23 (Gp:) Mean (Gp:) 0.15 (Gp:) 0.60 (Gp:) 0.97 (Gp:) 0.61 (Gp:) Median (Gp:) 0.14 (Gp:) 0.66 (Gp:) 0.99 (Gp:) 0.59
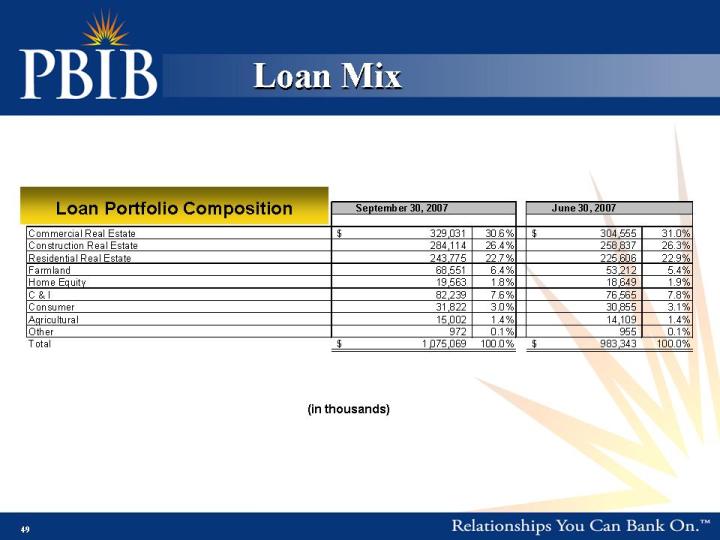
49 Loan Mix (in thousands) Loan Portfolio Composition

50 Loan Portfolio Trends (in millions) (Gp:) - (Gp:) 50 (Gp:) 100 (Gp:) 150 (Gp:) 200 (Gp:) 250 (Gp:) 300 (Gp:) 350 (Gp:) Commercial (Gp:) Real Estate (Gp:) Construction (Gp:) Real Estate (Gp:) Residential (Gp:) Real Estate (Gp:) Farmland (Gp:) Home Equity (Gp:) C & I (Gp:) Consumer (Gp:) Agricultural (Gp:) Other (Gp:) 12/31/06 (Gp:) 03/31/07 (Gp:) 06/30/07 (Gp:) 09/30/07
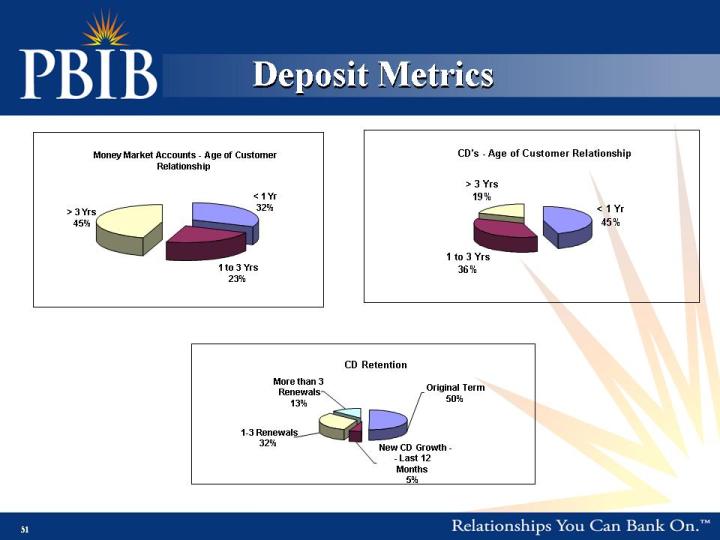
51 Deposit Metrics (Gp:) Money Market Accounts - Age of Customer (Gp:) Relationship (Gp:) 1 to 3 Yrs (Gp:) 23% (Gp:) < 1 Yr (Gp:) 32% (Gp:)> 3 Yrs (Gp:) 45% (Gp:) CD's - Age of Customer Relationship (Gp:) < 1 Yr (Gp:) 45% (Gp:) 1 to 3 Yrs (Gp:) 36% (Gp:)> 3 Yrs (Gp:) 19% (Gp:) CD Retention (Gp:) New CD Growth - (Gp:) - Last 12 (Gp:) Months (Gp:) 5% (Gp:) 1-3 Renewals (Gp:) 32% (Gp:) More than 3 (Gp:) Renewals (Gp:) 13% (Gp:) Original Term (Gp:) 50%