Exhibit 99.2
1 NASDAQ: PBIB July/August 2008
2 Disclaimer This presentation contains forward-looking statements that involve risks and uncertainties. These forward-looking statements are based on management’s current expectations. Porter Bancorp’s actual results in future periods may differ materially from those currently expected due to various factors, including those risk factors described in documents that the Company files with the Securities and Exchange Commission, including the Company’s most recent Annual Report on Form 10-K and Quarterly Report on Form 10-Q. The forward-looking statements in this presentation are made as of the date of the presentation and Porter Bancorp does not assume any responsibility to update these statements.
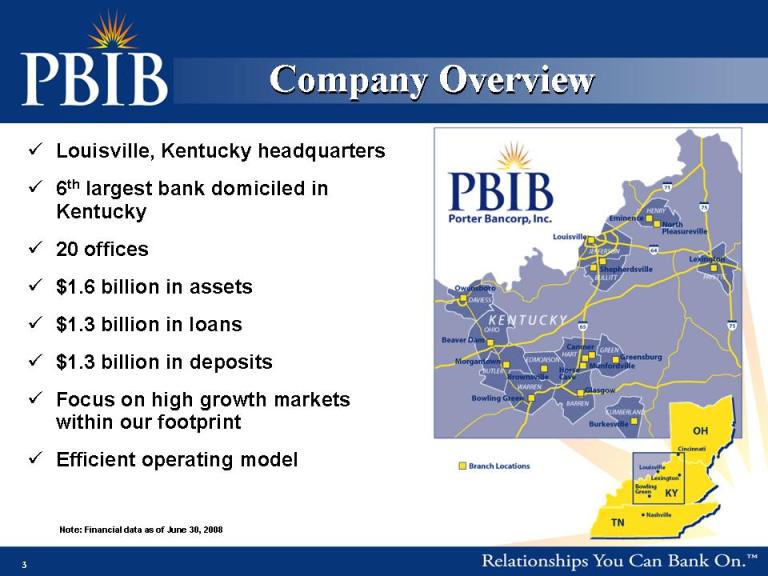
3 Louisville, Kentucky headquarters 6th largest bank domiciled in Kentucky 20 offices $1.6 billion in assets $1.3 billion in loans $1.3 billion in deposits Focus on high growth markets within our footprint Efficient operating model Note: Financial data as of June 30, 2008 Company Overview
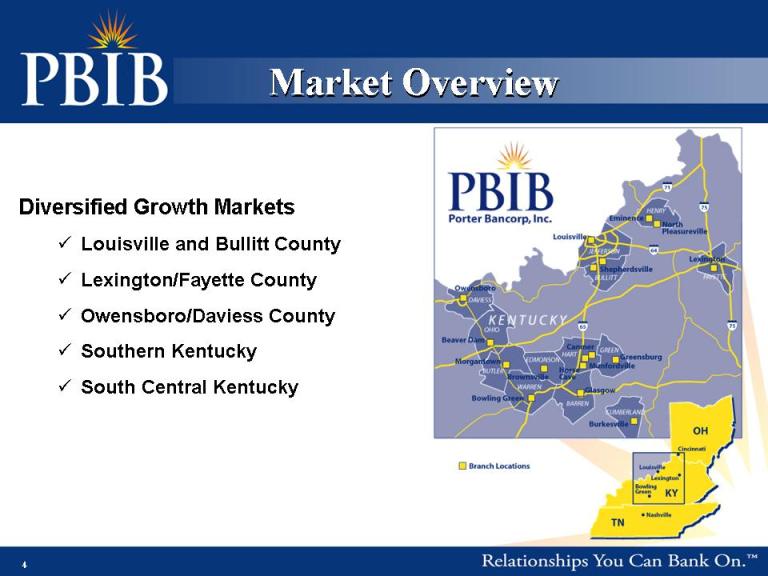
4 Market Overview Diversified Growth Markets Louisville and Bullitt County Lexington/Fayette County Owensboro/Daviess County Southern Kentucky South Central Kentucky
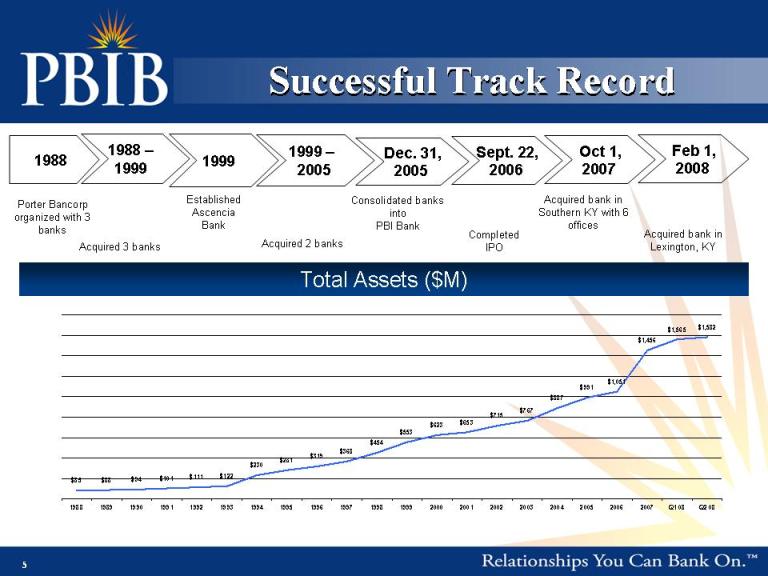
5 1988 Porter Bancorp organized with 3 banks 1988 – 1999 Acquired 3 banks 1999 Established Ascencia Bank 1999 – 2005 Acquired 2 banks Dec. 31, 2005 Consolidated banks into PBI Bank Total Assets ($M) Sept. 22, 2006 Completed IPO Successful Track Record Oct 1, 2007 Feb 1, 2008 Acquired bank in Southern KY with 6 offices Acquired bank in Lexington, KY
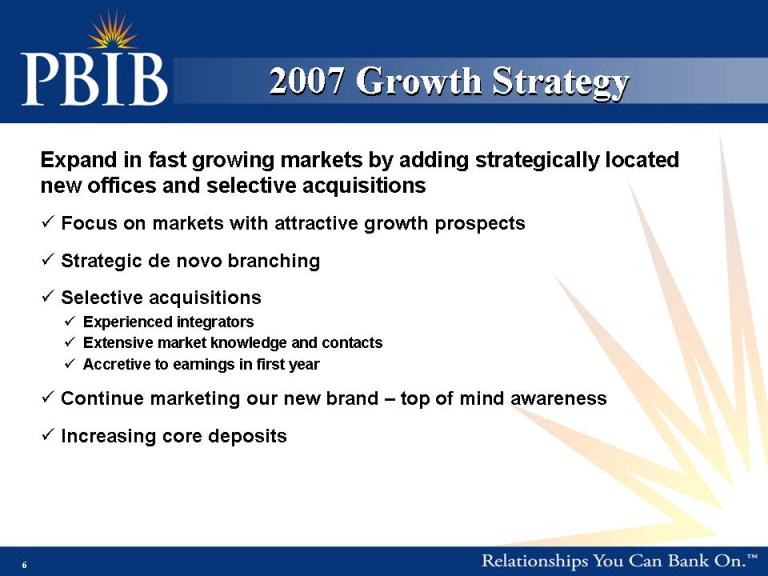
6 Expand in fast growing markets by adding strategically located new offices and selective acquisitions Focus on markets with attractive growth prospects Strategic de novo branching Selective acquisitions Experienced integrators Extensive market knowledge and contacts Accretive to earnings in first year Continue marketing our new brand – top of mind awareness Increasing core deposits 2007 Growth Strategy
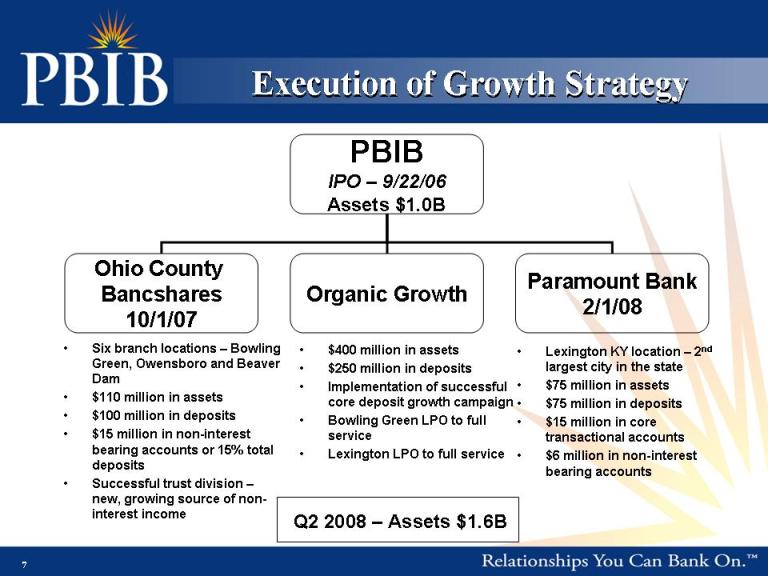
7 Execution of Growth Strategy Six branch locations – Bowling Green, Owensboro and Beaver Dam $110 million in assets $100 million in deposits $15 million in non-interest bearing accounts or 15% total deposits Successful trust division – new, growing source of non-interest income Body: Lexington KY location – 2nd largest city in the state $75 million in assets $75 million in deposits $15 million in core transactional accounts $6 million in non-interest bearing accounts Q2 2008 – Assets $1.6B $400 million in assets $250 million in deposits Implementation of successful core deposit growth campaign Bowling Green LPO to full service Lexington LPO to full service
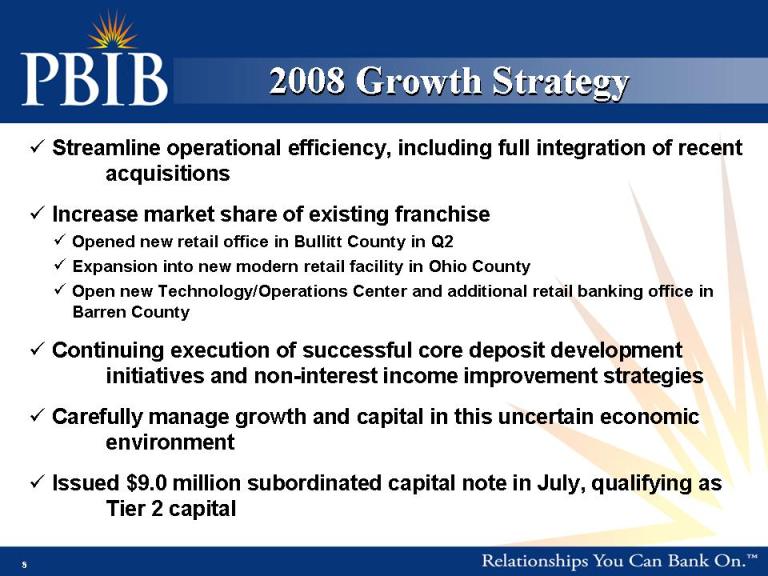
8 Streamline operational efficiency, including full integration of recent acquisitions Increase market share of existing franchise Opened new retail office in Bullitt County in Q2 Expansion into new modern retail facility in Ohio County Open new Technology/Operations Center and additional retail banking office in Barren County Continuing execution of successful core deposit development initiatives and non-interest income improvement strategies Carefully manage growth and capital in this uncertain economic environment Issued $9.0 million subordinated capital note in July, qualifying as Tier 2 capital 2008 Growth Strategy

9 Financial Highlights
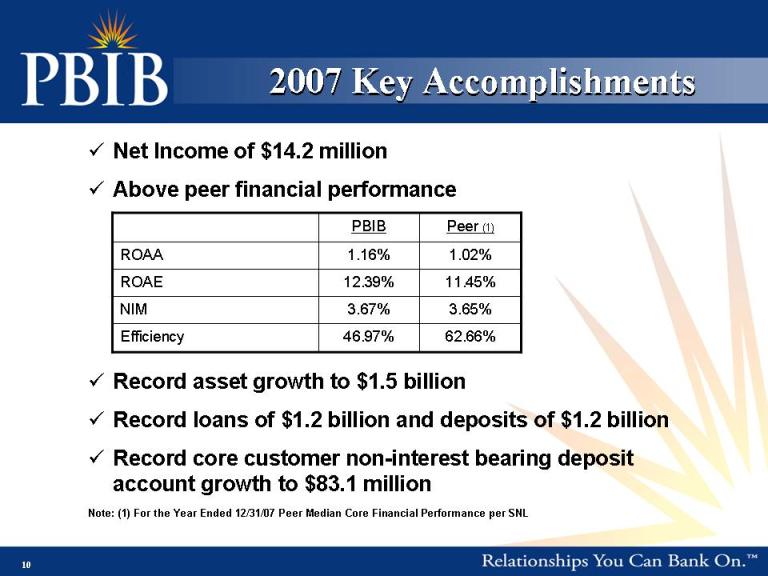
10 2007 Key Accomplishments Net Income of $14.2 million Above peer financial performance Record asset growth to $1.5 billion Record loans of $1.2 billion and deposits of $1.2 billion Record core customer non-interest bearing deposit account growth to $83.1 million Note: (1) For the Year Ended 12/31/07 Peer Median Core Financial Performance per SNL
11 2007 Operating Performance Growth exceeded expectations Loans – 42.8% Deposits – 35.4% Assets – 38.5% Efficient operations – 47.0% efficiency ratio Sound credit quality 1.17% NPA to assets 1.04% NPL to loans ROAA – 1.16% ROAE – 12.39% Above peer financial performance
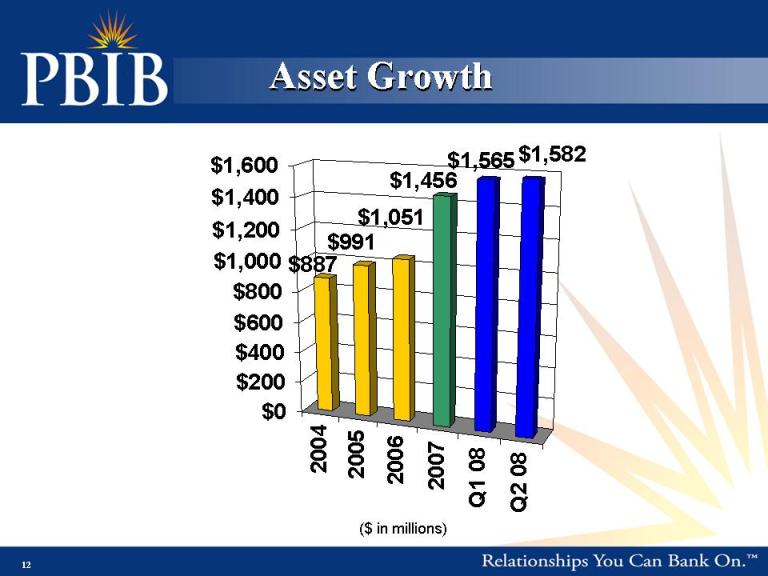
12 Asset Growth ($ in millions)
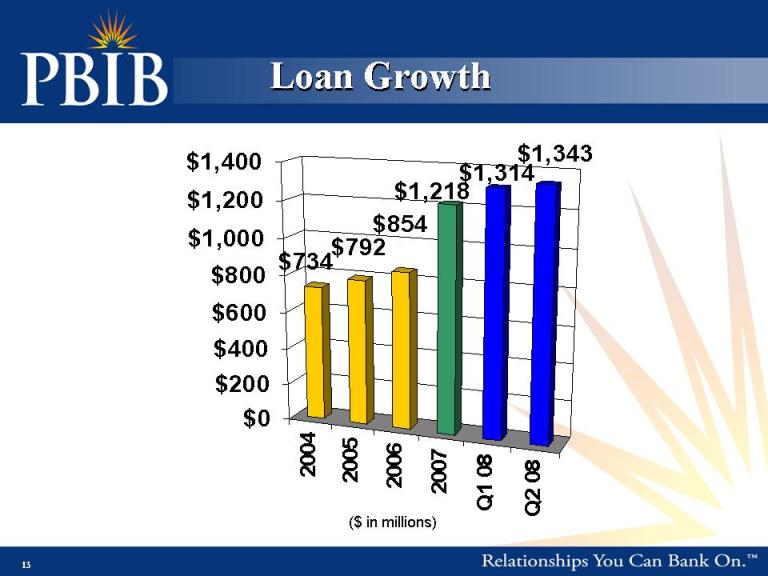
13 Loan Growth ($ in millions)
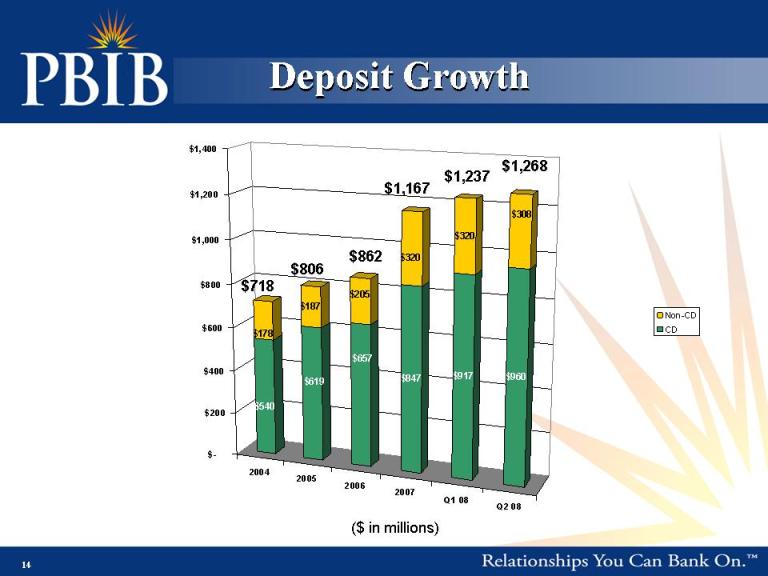
14 Deposit Growth ($ in millions) $718 $806 $862 $1,167 $1,237 $1,268
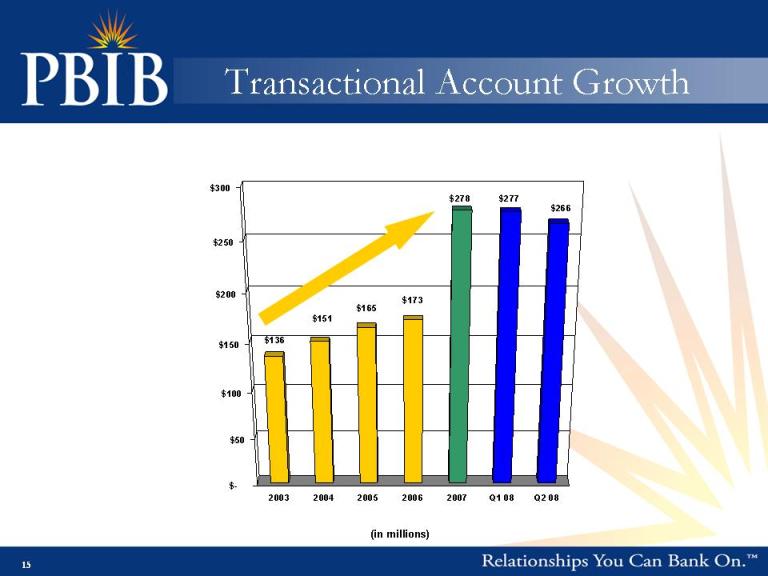
15 Transactional Account Growth (in millions)
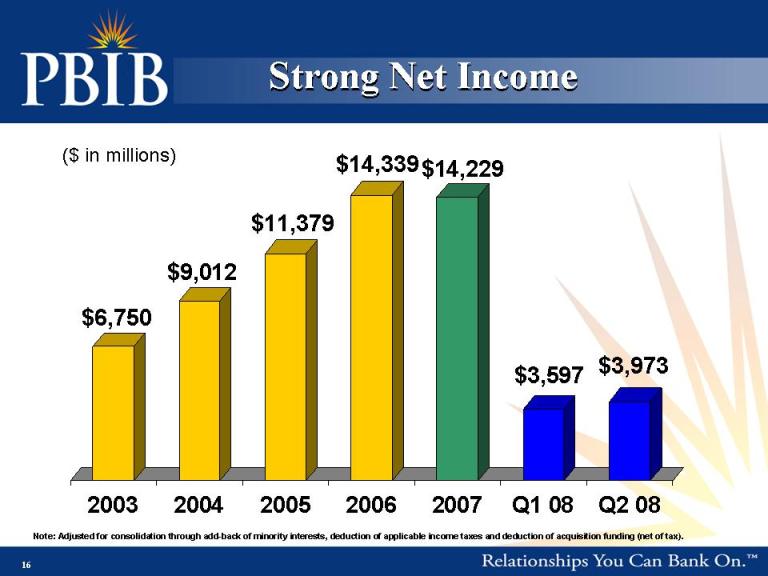
16 Strong Net Income ($ in millions) Note: Adjusted for consolidation through add-back of minority interests, deduction of applicable income taxes and deduction of acquisition funding (net of tax).
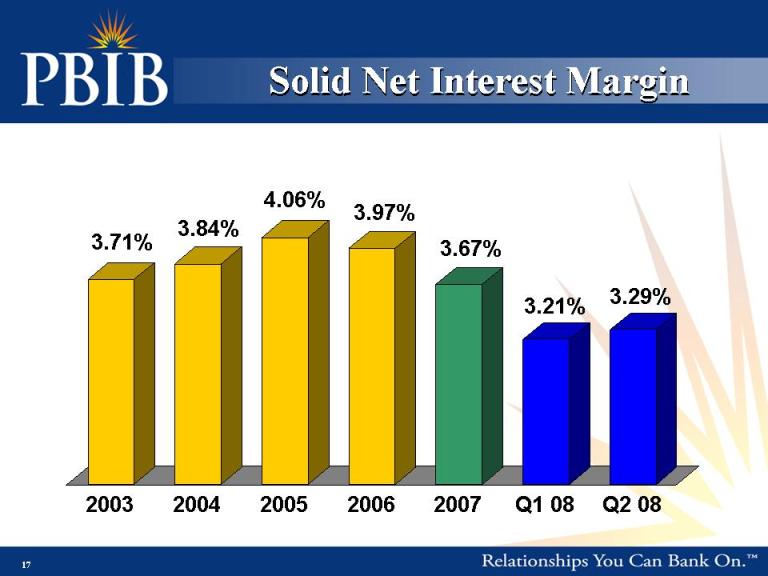
17 Solid Net Interest Margin
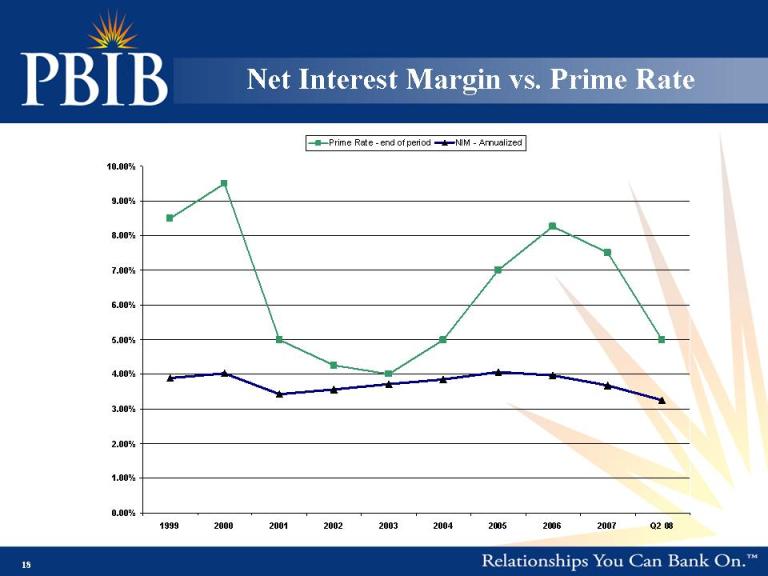
18 Net Interest Margin vs. Prime Rate
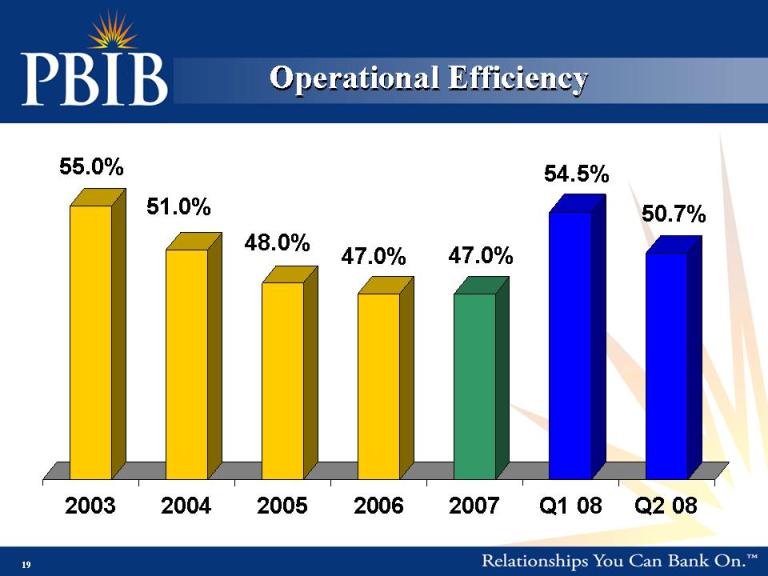
19 Operational Efficiency
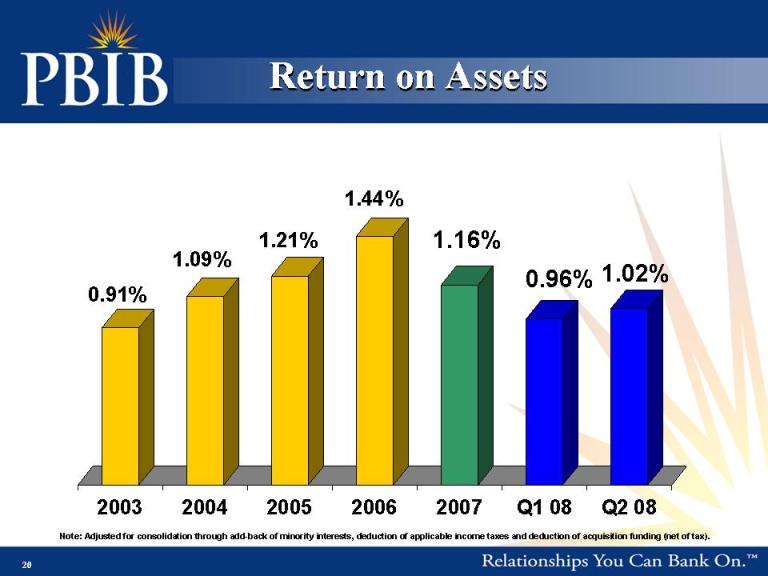
20 Return on Assets Note: Adjusted for consolidation through add-back of minority interests, deduction of applicable income taxes and deduction of acquisition funding (net of tax).

21 Return on Equity Note: Adjusted for consolidation through add-back of minority interests, deduction of applicable income taxes and deduction of acquisition funding (net of tax).
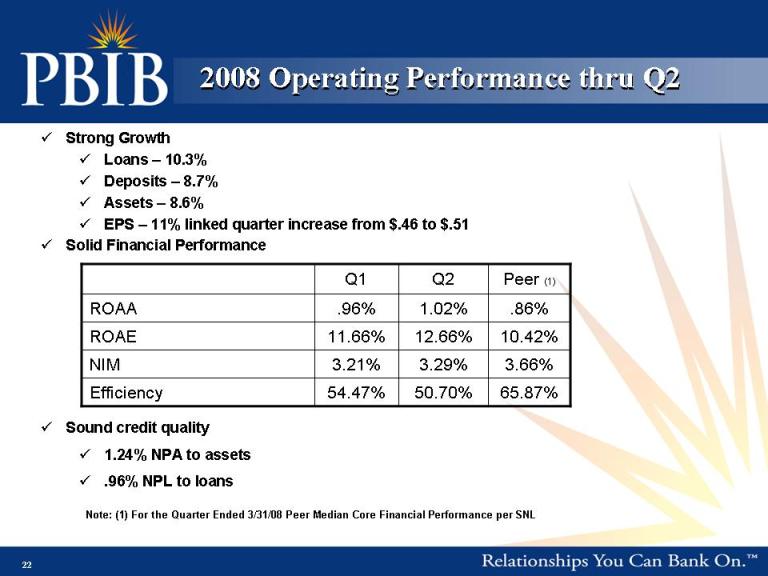
22 2008 Operating Performance thru Q2 Strong Growth Loans – 10.3% Deposits – 8.7% Assets – 8.6% EPS – 11% linked quarter increase from $.46 to $.51 Solid Financial Performance Sound credit quality 1.24% NPA to assets .96% NPL to loans Note: (1) For the Quarter Ended 3/31/08 Peer Median Core Financial Performance per SNL
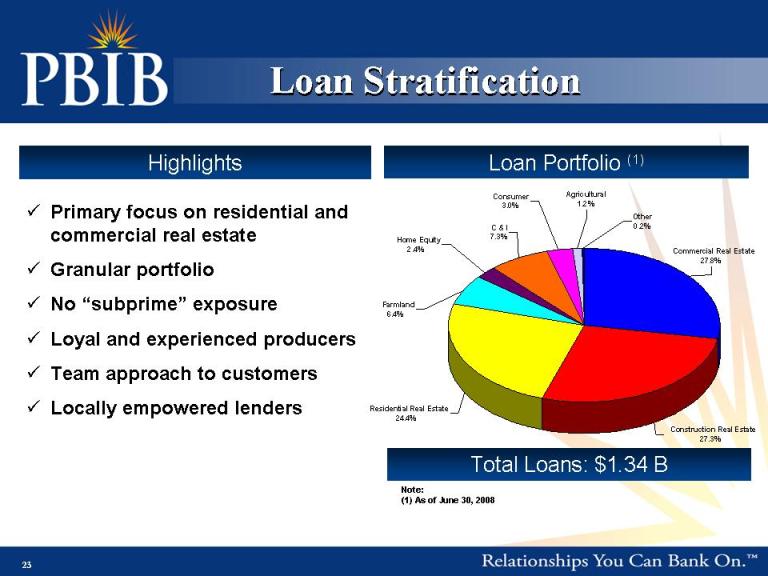
23 Note: (1) As of June 30, 2008 Primary focus on residential and commercial real estate Granular portfolio No “subprime” exposure Loyal and experienced producers Team approach to customers Locally empowered lenders Loan Portfolio (1) Total Loans: $1.34 B Loan Stratification Highlights
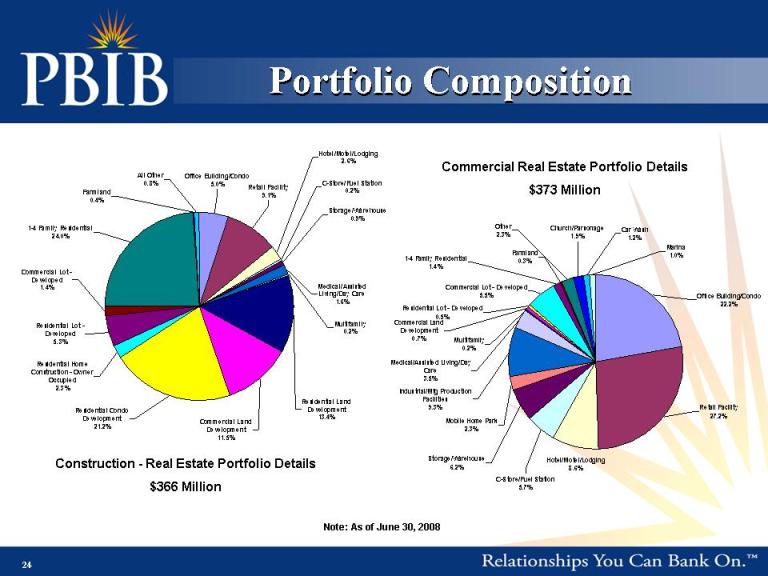
24 Portfolio Composition Note: As of June 30, 2008 Construction - Real Estate Portfolio Details $366 Million Commercial Real Estate Portfolio Details $373 Million
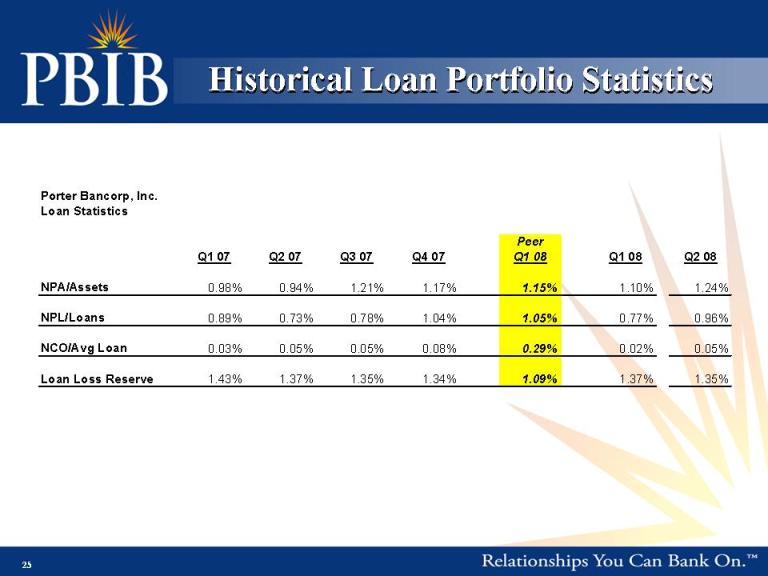
25 Historical Loan Portfolio Statistics
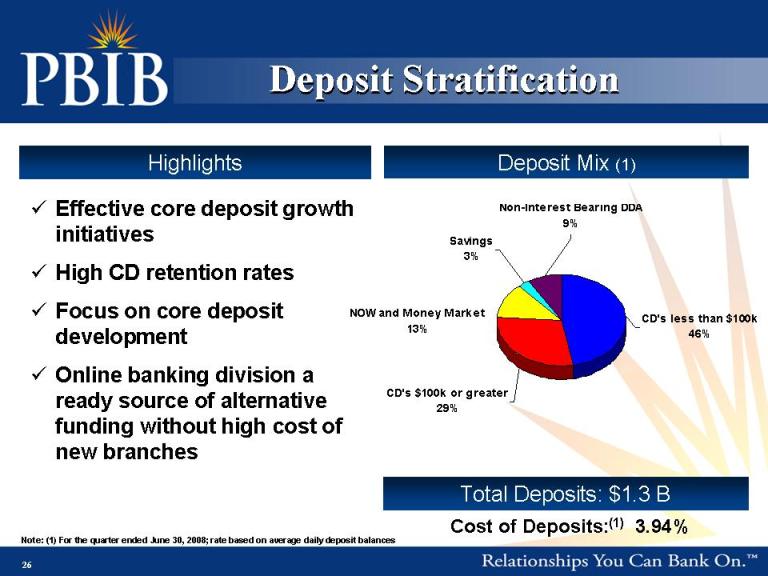
26 Note: (1) For the quarter ended June 30, 2008; rate based on average daily deposit balances Deposit Mix (1) Total Deposits: $1.3 B Cost of Deposits:(1) 3.94% Effective core deposit growth initiatives High CD retention rates Focus on core deposit development Online banking division a ready source of alternative funding without high cost of new branches Deposit Stratification Highlights

27 Investment Highlights
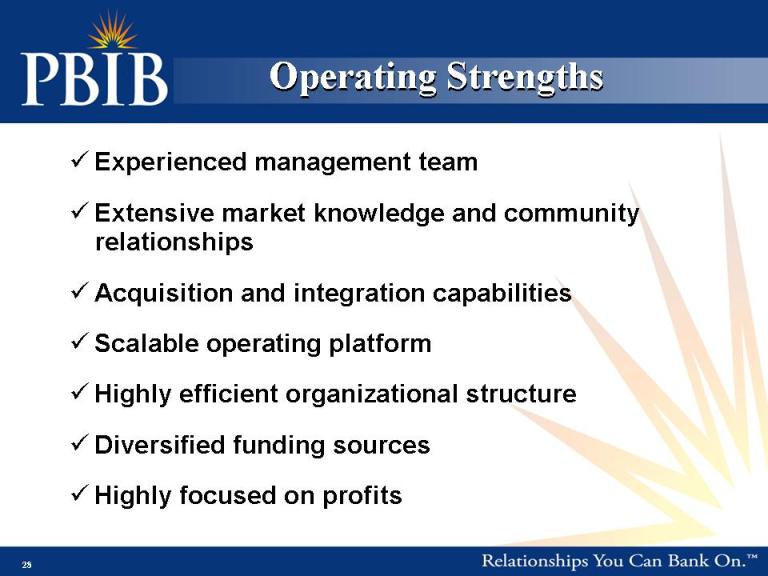
28 Experienced management team Extensive market knowledge and community relationships Acquisition and integration capabilities Scalable operating platform Highly efficient organizational structure Diversified funding sources Highly focused on profits Operating Strengths
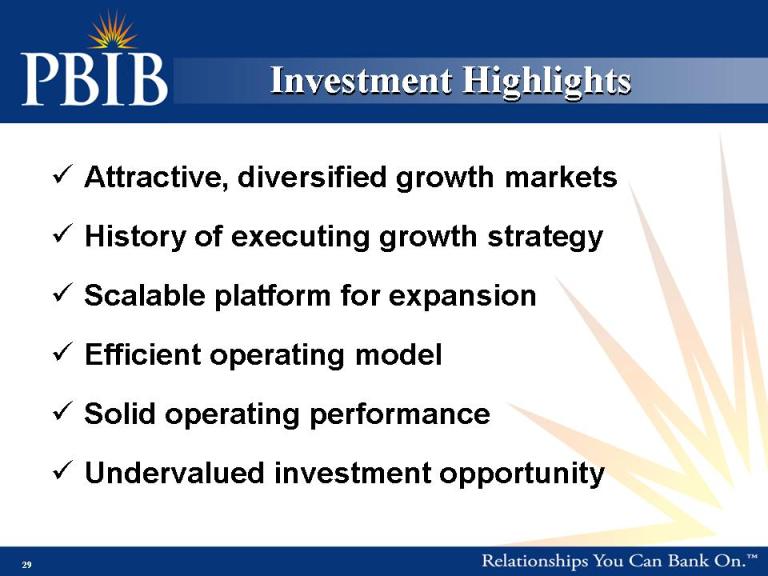
29 Attractive, diversified growth markets History of executing growth strategy Scalable platform for expansion Efficient operating model Solid operating performance Undervalued investment opportunity Investment Highlights
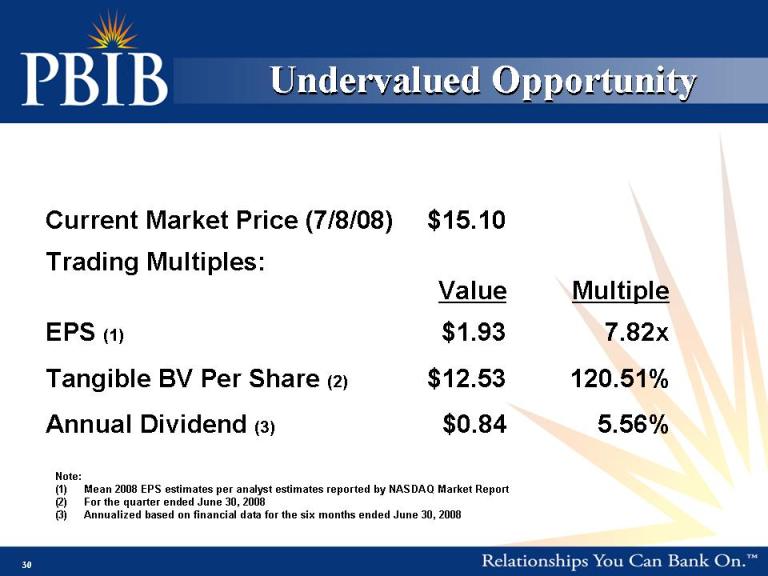
30 Undervalued Opportunity Current Market Price (7/8/08) $15.10 Trading Multiples: Value Multiple EPS (1) $1.93 7.82x Tangible BV Per Share (2) $12.53 120.51% Annual Dividend (3) $0.84 5.56% Note: (1) Mean 2008 EPS estimates per analyst estimates reported by NASDAQ Market Report For the quarter ended June 30, 2008 Annualized based on financial data for the six months ended June 30, 2008

31 Addendum
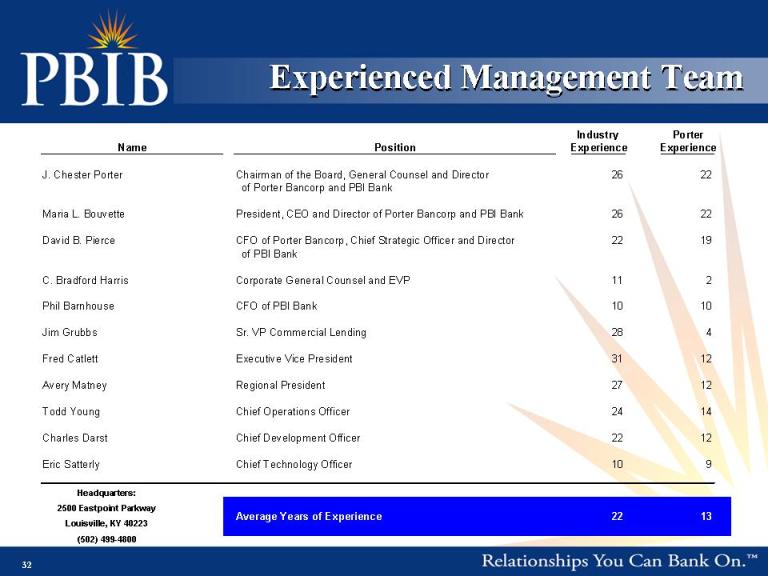
32 Experienced Management Team Headquarters: 2500 Eastpoint Parkway Louisville, KY 40223 (502) 499-4800
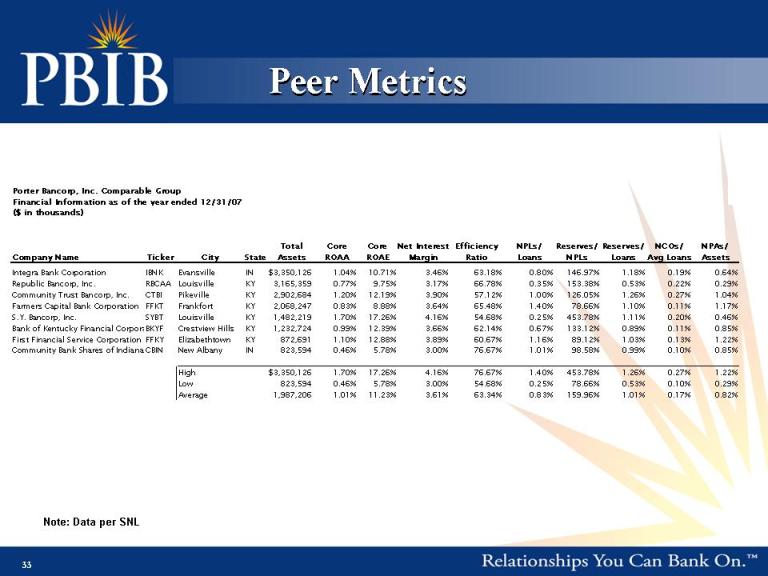
33 Peer Metrics Note: Data per SNL

34 Peer Metrics Note: Data per SNL
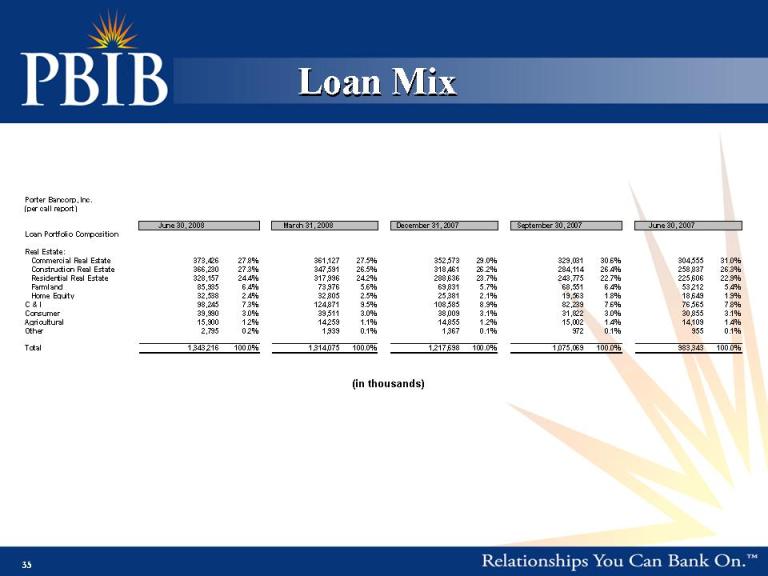
35 Loan Mix (in thousands)