Exhibit 99.2
1 Porter Bancorp, Inc. NASDAQ: PBIB November 2008 Relationships You Can Bank On.TM PBIB
2 Disclaimer This presentation contains forward-looking statements that involve risks and uncertainties. These forward-looking statements are based on management’s current expectations. Porter Bancorp’s actual results in future periods may differ materially from those currently expected due to various factors, including those risk factors described in documents that the Company files with the Securities and Exchange Commission, including the Company’s most recent Annual Report on Form 10-K and Quarterly Report on Form 10-Q. The forward-looking statements in this presentation are made as of the date of the presentation and Porter Bancorp does not assume any responsibility to update these statements.
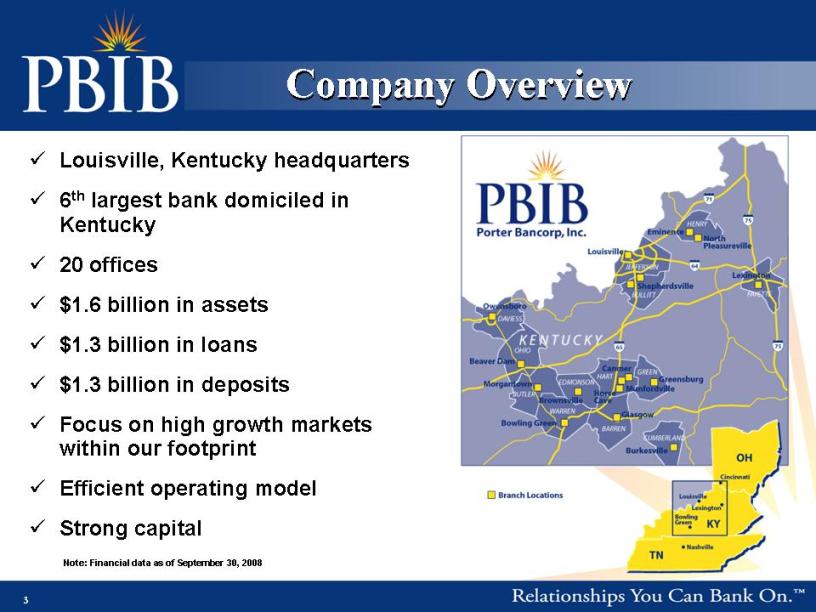
3 Louisville, Kentucky headquarters 6th largest bank domiciled in Kentucky 20 offices $1.6 billion in assets $1.3 billion in loans $1.3 billion in deposits Focus on high growth markets within our footprint Efficient operating model Strong capital Note: Financial data as of September 30, 2008 Company Overview Branch Locations Eminence North Pleasureville Lexington Henry Fayette Jefferson Shepherdsville Bullitt Daviess Owensboro Ohio Beaver Dam Morgantown Butler Brownsville Edmonson Warren Bowling Green Canmer Hart Horse Cave Green Greensburg Munfordville Glasgow Barren Cumberland Burkesville
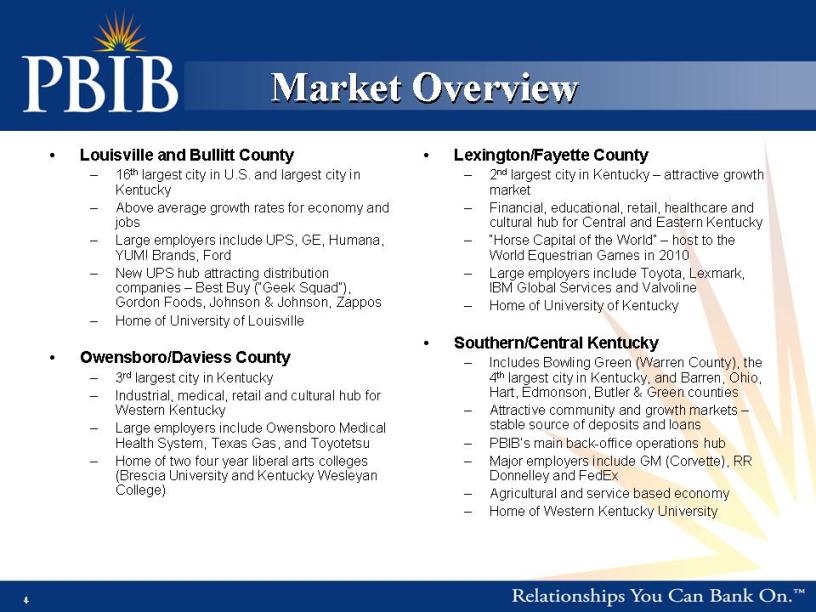
4 Title: Market Overview Body: Louisville and Bullitt County 16th largest city in U.S. and largest city in Kentucky Above average growth rates for economy and jobs Large employers include UPS, GE, Humana, YUM! Brands, Ford New UPS hub attracting distribution companies – Best Buy (“Geek Squad”), Gordon Foods, Johnson & Johnson, Zappos Home of University of Louisville Owensboro/Daviess County 3rd largest city in Kentucky Industrial, medical, retail and cultural hub for Western Kentucky Large employers include Owensboro Medical Health System, Texas Gas, and Toyotetsu Home of two four year liberal arts colleges (Brescia University and Kentucky Wesleyan College) Body: Lexington/Fayette County 2nd largest city in Kentucky – attractive growth market Financial, educational, retail, healthcare and cultural hub for Central and Eastern Kentucky “Horse Capital of the World” – host to the World Equestrian Games in 2010 Large employers include Toyota, Lexmark, IBM Global Services and Valvoline Home of University of Kentucky Southern/Central Kentucky Includes Bowling Green (Warren County), the 4th largest city in Kentucky, and Barren, Ohio, Hart, Edmonson, Butler & Green counties Attractive community and growth markets – stable source of deposits and loans PBIB’s main back-office operations hub Major employers include GM (Corvette), RR Donnelley and FedEx Agricultural and service based economy Home of Western Kentucky University
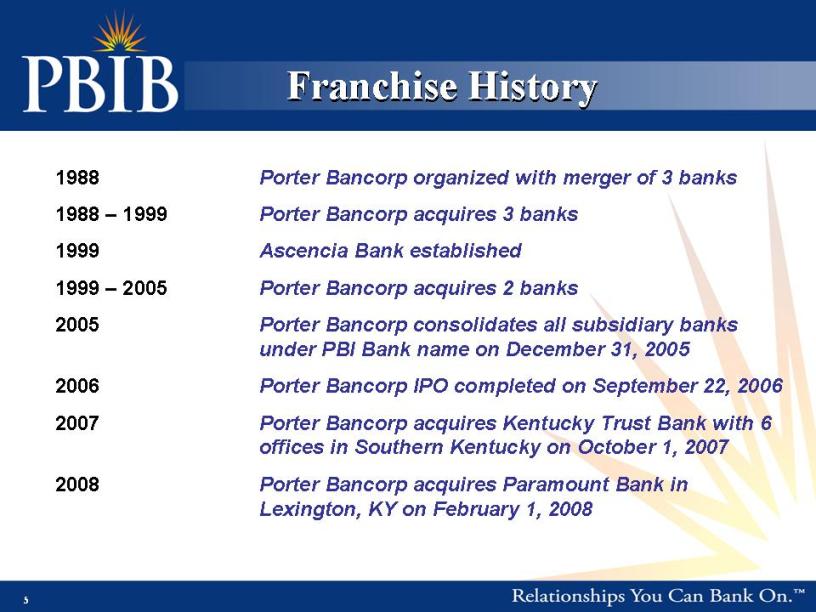
5 Franchise History 1988 Porter Bancorp organized with merger of 3 banks 1988 – 1999 Porter Bancorp acquires 3 banks 1999 Ascencia Bank established 1999 – 2005 Porter Bancorp acquires 2 banks 2005 Porter Bancorp consolidates all subsidiary banks under PBI Bank name on December 31, 2005 2006 Porter Bancorp IPO completed on September 22, 2006 2007 Porter Bancorp acquires Kentucky Trust Bank with 6 offices in Southern Kentucky on October 1, 2007 2008 Porter Bancorp acquires Paramount Bank in Lexington, KY on February 1, 2008
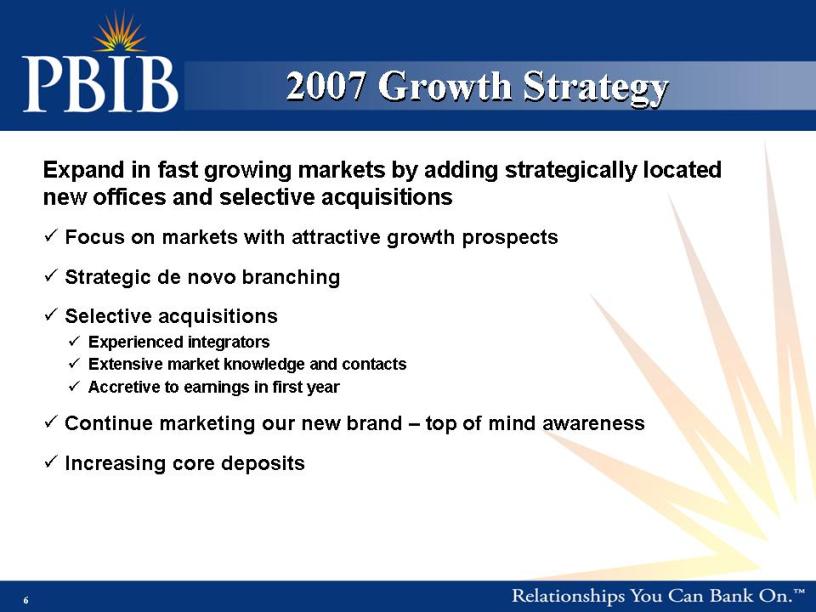
6 Expand in fast growing markets by adding strategically located new offices and selective acquisitions Focus on markets with attractive growth prospects Strategic de novo branching Selective acquisitions Experienced integrators Extensive market knowledge and contacts Accretive to earnings in first year Continue marketing our new brand – top of mind awareness Increasing core deposits 2007 Growth Strategy
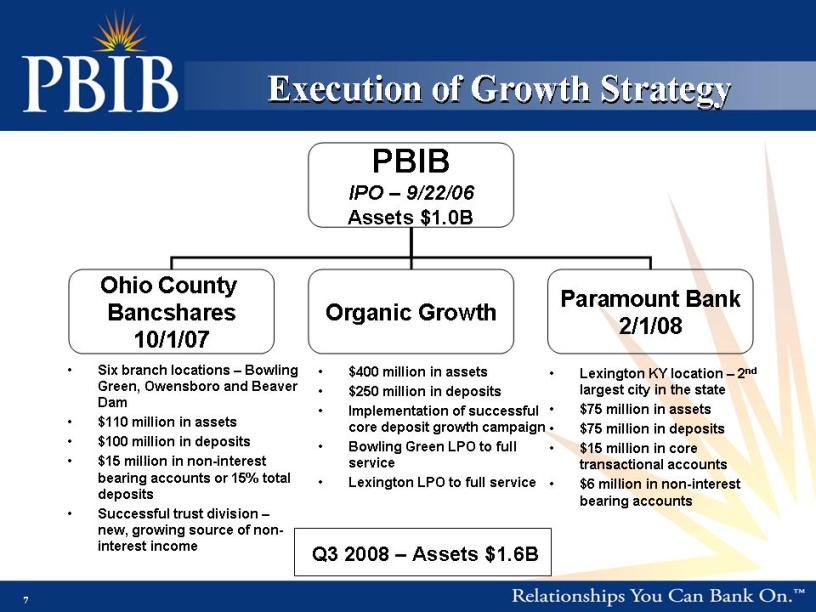
7 Execution of Growth Strategy Body: Six branch locations – Bowling Green, Owensboro and Beaver Dam $110 million in assets $100 million in deposits $15 million in non-interest bearing accounts or 15% total deposits Successful trust division – new, growing source of non-interest income Body: Lexington KY location – 2nd largest city in the state $75 million in assets $75 million in deposits $15 million in core transactional accounts $6 million in non-interest bearing accounts Q3 2008 – Assets $1.6B $400 million in assets $250 million in deposits Implementation of successful core deposit growth campaign Bowling Green LPO to full service Lexington LPO to full service PBIB IPO – 9/22/06 Assets $1.0B Ohio County Bancshares 10/1/07 Organic Growth Paramount Bank 2/1/08
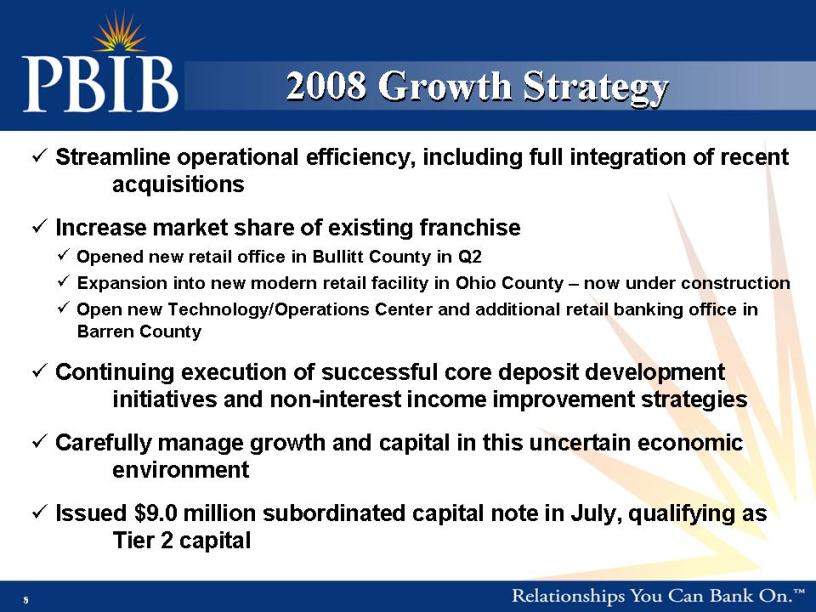
8 Streamline operational efficiency, including full integration of recent acquisitions Increase market share of existing franchise Opened new retail office in Bullitt County in Q2 Expansion into new modern retail facility in Ohio County – now under construction Open new Technology/Operations Center and additional retail banking office in Barren County Continuing execution of successful core deposit development initiatives and non-interest income improvement strategies Carefully manage growth and capital in this uncertain economic environment Issued $9.0 million subordinated capital note in July, qualifying as Tier 2 capital 2008 Growth Strategy

9 Financial Highlights
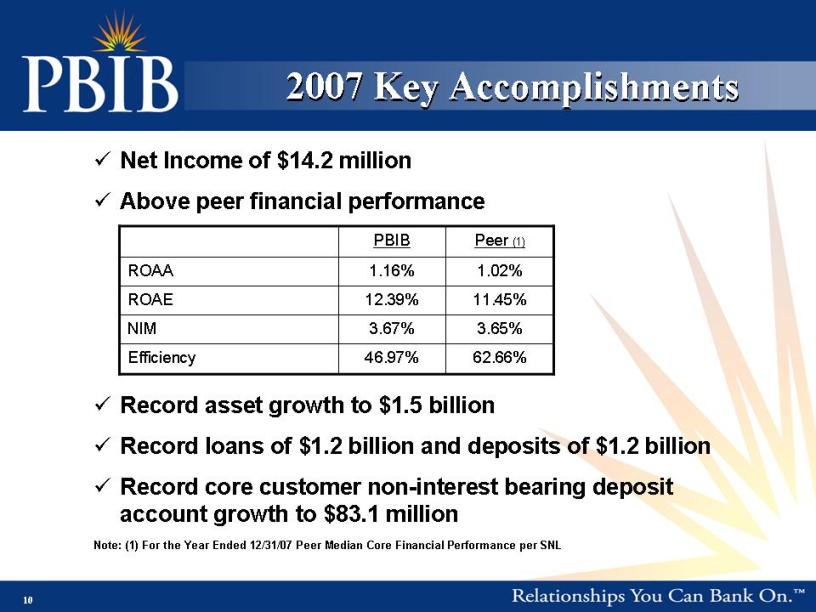
10 2007 Key Accomplishments Net Income of $14.2 million Above peer financial performance Record asset growth to $1.5 billion Record loans of $1.2 billion and deposits of $1.2 billion Record core customer non-interest bearing deposit account growth to $83.1 million Note: (1) For the Year Ended 12/31/07 Peer Median Core Financial Performance per SNL PBIB Peer (1) ROAA 1.16% 1.02% ROAE 12.39% 11.45% NIM 3.67% 3.65% Efficiency 46.97% 62.66%
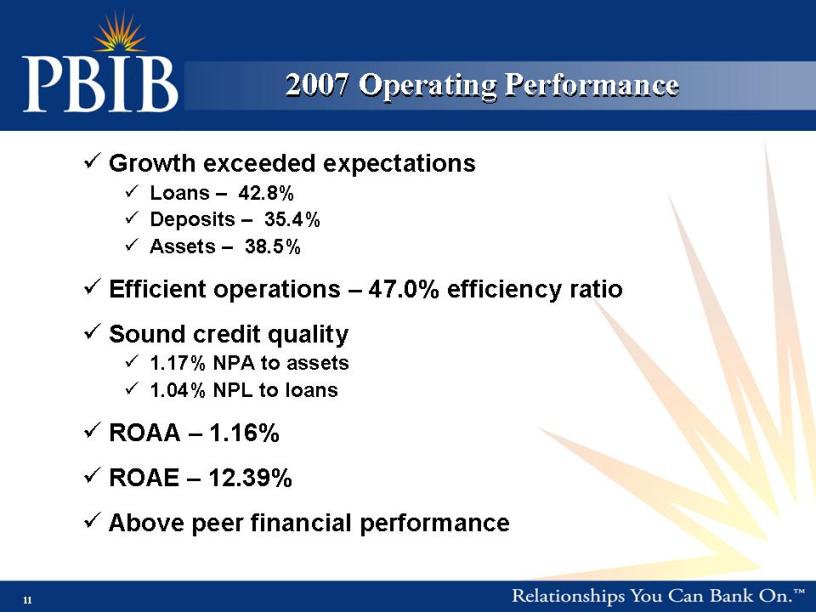
11 2007 Operating Performance Growth exceeded expectations Loans – 42.8% Deposits – 35.4% Assets – 38.5% Efficient operations – 47.0% efficiency ratio Sound credit quality 1.17% NPA to assets 1.04% NPL to loans ROAA – 1.16% ROAE – 12.39% Above peer financial performance
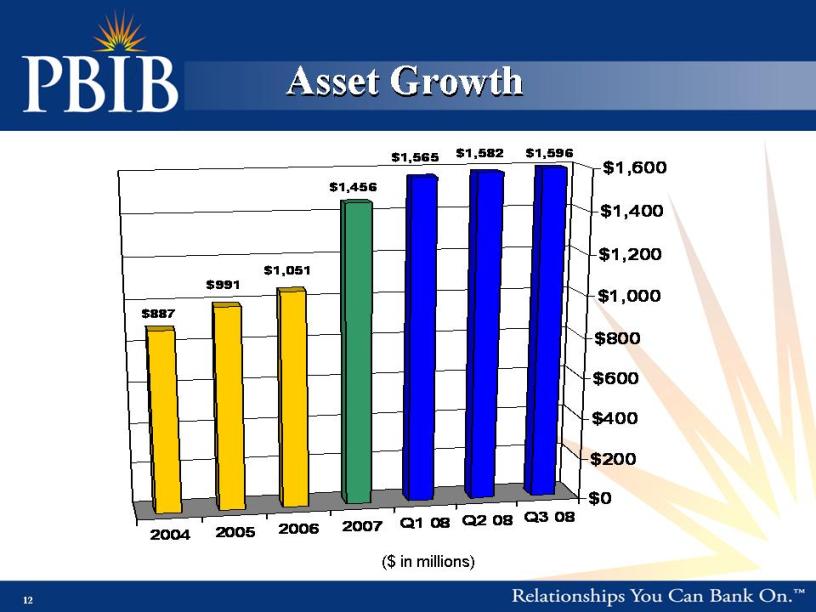
12 Asset Growth ($ in millions) 2004 2005 2006 2007 Q1 08 Q2 08 Q3 08 $0 $200 $400 $600 $800 $1,000 $1,200 $1,400 $1,600 $887 $991 $1,051 $1,456 $1,565 $1,582 $1,596
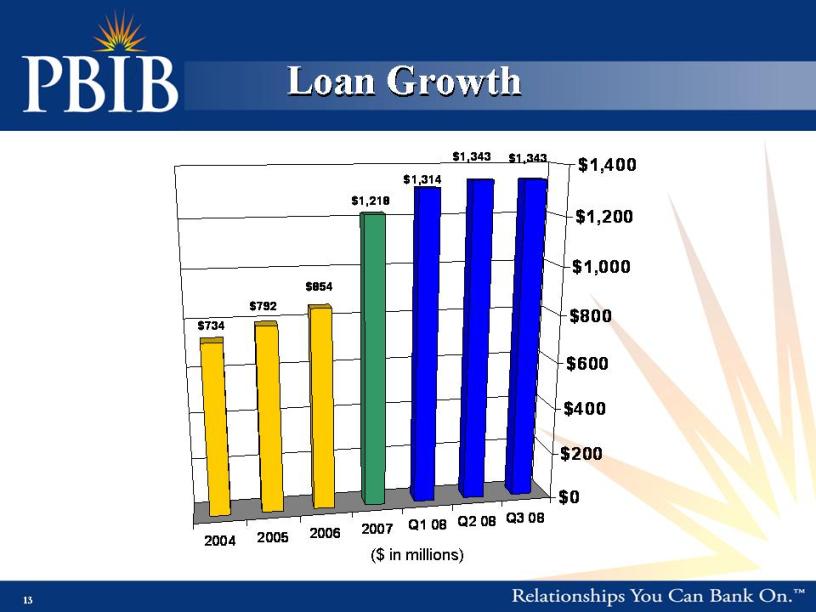
13 Loan Growth ($ in millions) 2004 2005 2006 2007 Q1 08 Q2 08 Q3 08 $0 $200 $400 $600 $800 $1,000 $1,200 $1,400 $734 $792 $854 $1,218 $1,314 $1,343 $1,343

14 Deposit Growth ($ in millions) 2004 2005 2006 2007 Q1 08 Q2 08 Q3 08 $0 $200 $400 $600 $800 $1,000 $1,200 $1,400 $540 $619 $657 $847 $917 $960 $987 $178 $187 $205 $320 $320 $308 $285 Non-CD CD
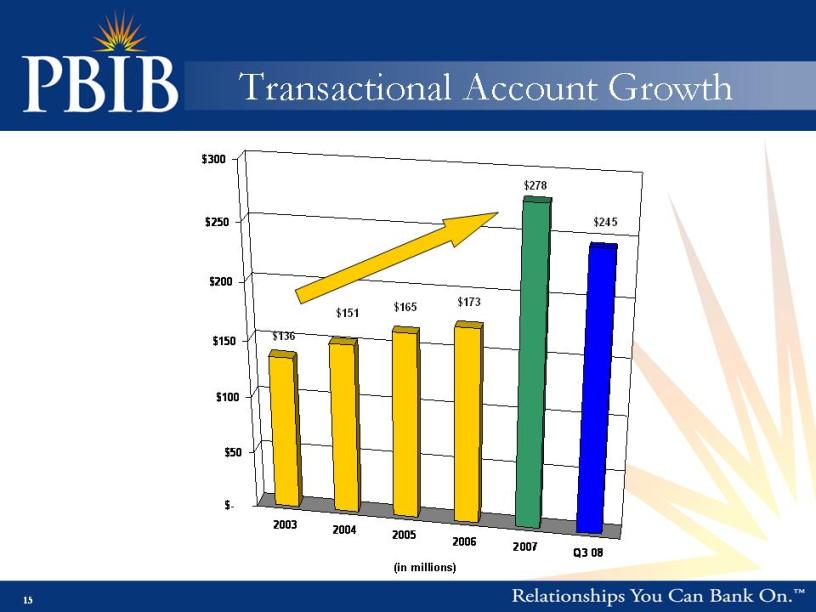
15 Title: Transactional Account Growth (in millions) 2003 2004 2005 2006 2007 Q3 08 $- $50 $100 $150 $200 $250 $300 $136 $151 $165 $173 $278 $245

16 Strong Net Income ($ in millions) Note: Adjusted for consolidation through add-back of minority interests, deduction of applicable income taxes and deduction of acquisition funding (net of tax). 2003 2004 2005 2006 2007 Q1 08 Q2 08 Q3 08 $6,750 $9,012 $11,379 $14,339 $14,229 $3,597 $3,973 $4,100
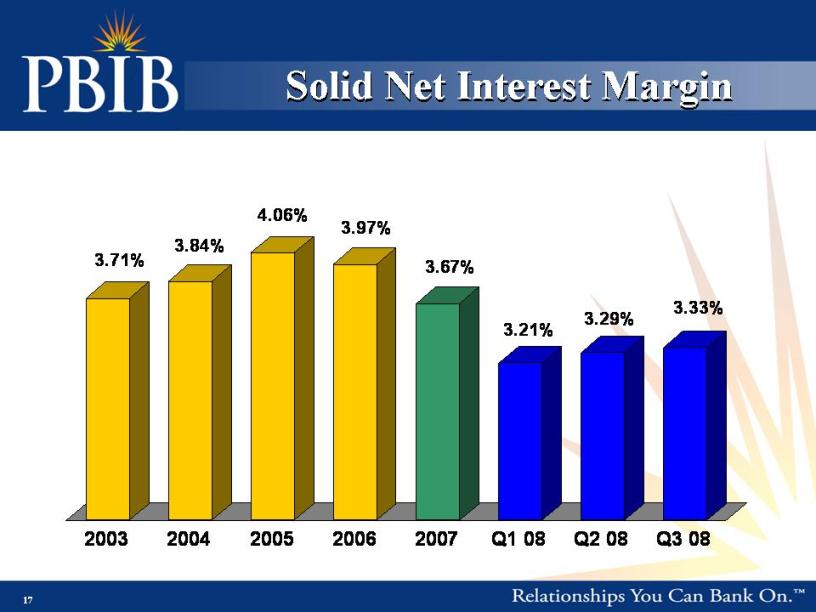
17 Solid Net Interest Margin 2003 2004 2005 2006 2007 Q1 08 Q2 08 Q3 08 3.71% 3.84% 4.06% 3.97% 3.67% 3.21% 3.29% 3.33%
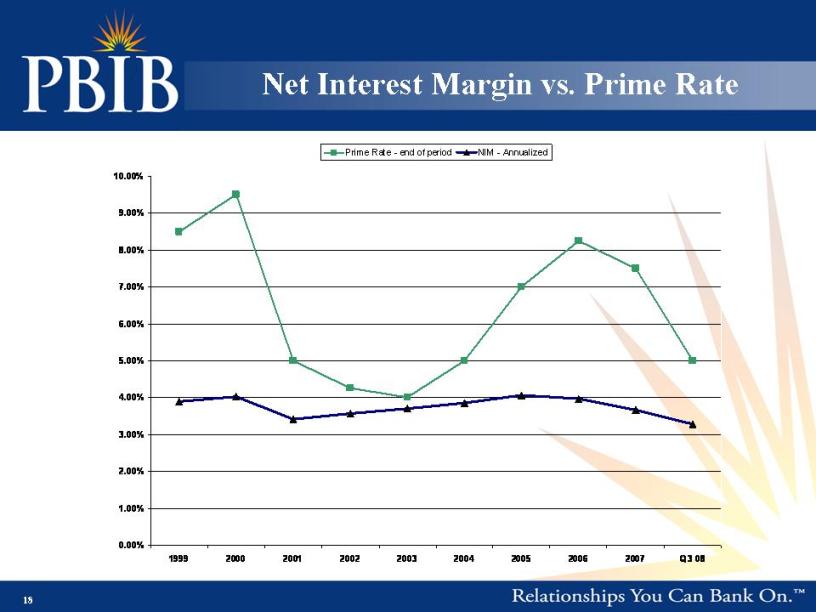
18 Net Interest Margin vs. Prime Rate 1999 2000 2001 2002 2003 2004 2005 2006 2007 Q3 08 0.00% 1.00% 2.00% 3.00% 4.00% 5.00% 6.00% 7.00% 8.00% 9.00% 10.00% Prime Rate – end of period NIM – Annualized
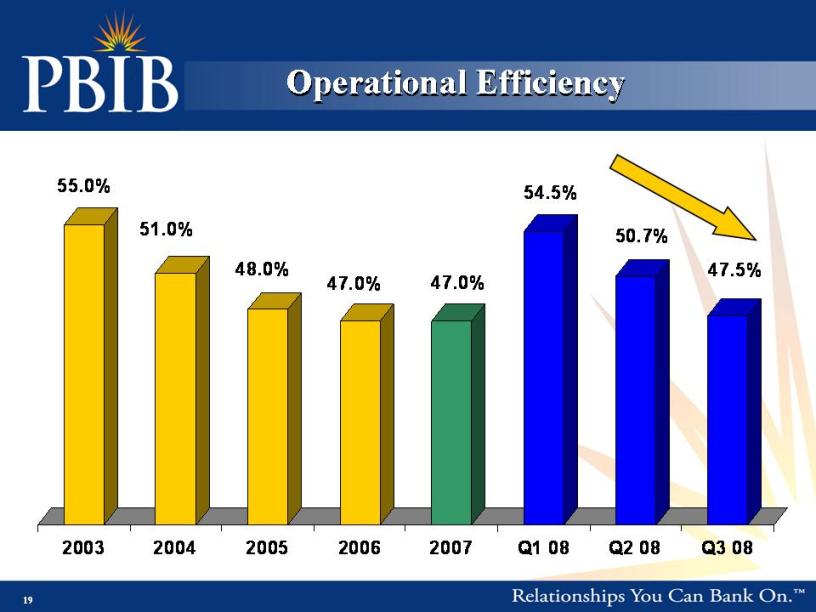
19 Operational Efficiency 2003 2004 2005 2006 2007 Q1 08 Q2 08 Q3 08 55.0% 51.0% 48.0% 47.0% 47.0% 54.5% 50.7% 47.5%
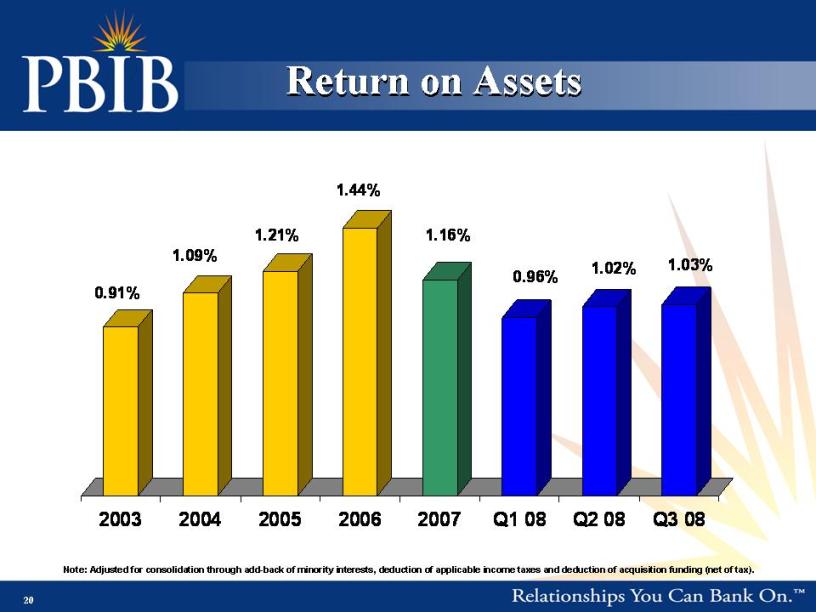
20 Return on Assets Note: Adjusted for consolidation through add-back of minority interests, deduction of applicable income taxes and deduction of acquisition funding (net of tax). 2003 2004 2005 2006 2007 Q1 08 Q2 08 Q3 08 0.91% 1.09% 1.21% 1.44% 1.16% 0.96% 1.02% 1.03%
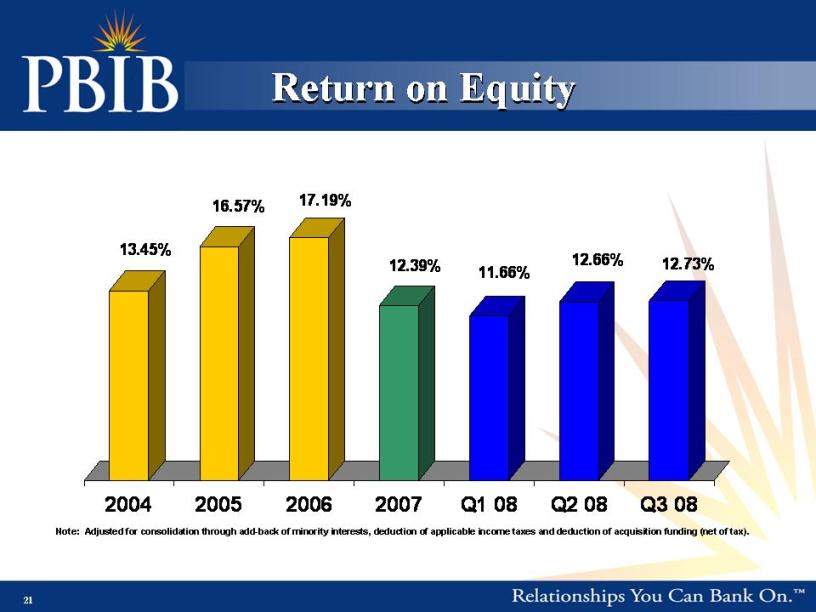
21 Return on Equity Note: Adjusted for consolidation through add-back of minority interests, deduction of applicable income taxes and deduction of acquisition funding (net of tax). 2004 2005 2006 2007 Q1 08 Q2 08 Q3 08 13.45% 16.57% 17.19% 12.39% 11.66% 12.66% 12.73%

22 2008 Operating Performance thru Q3 Strong Growth Loans – 10.2% Deposits – 9.0% Assets – 9.6% EPS – 18.2% comparative quarter increase from $.44 to $.52 Solid Financial Performance Sound credit quality 1.44% NPA to assets 1.15% NPL to loans Note: (1) For the Quarter Ended 6/30/08 Peer Median Core Financial Performance per SNL Q1 Q2 Q3 Peer (1) ROAA .96% 1.02% 1.03% .94% ROAE 11.66% 12.66% 12.73% 11.14% NIM 3.21% 3.29% 3.33% 3.76% Efficiency 54.47% 50.70% 47.47% 60.59%
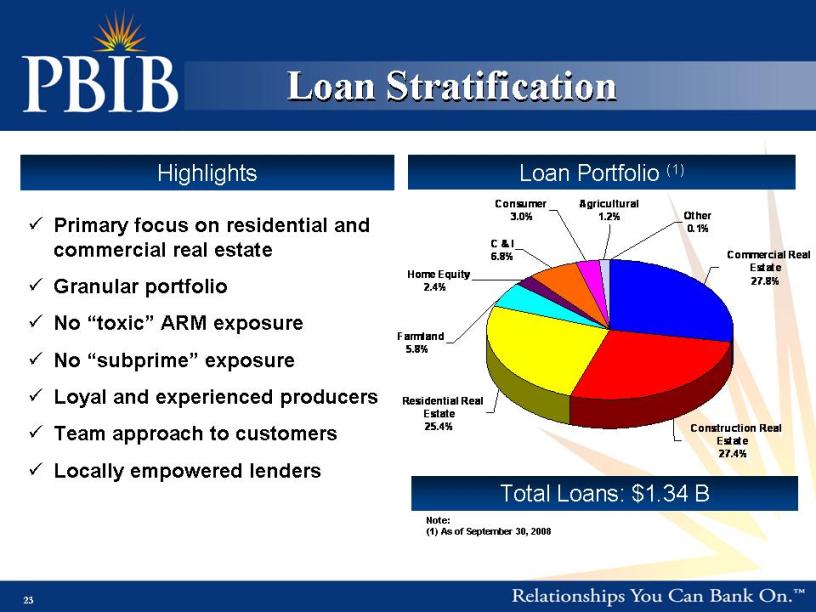
23 Note: (1) As of September 30, 2008 Primary focus on residential and commercial real estate Granular portfolio No “toxic” ARM exposure No “subprime” exposure Loyal and experienced producers Team approach to customers Locally empowered lenders Loan Portfolio (1) Total Loans: $1.34 B Loan Stratification Highlights Residential Real Estate 25.4% Farmland 5.8% Home Equity 2.4% C & I 6.8% Consumer 3.0% Agricultural 1.2% Other 0.1% Commercial Real Estate 27.8% Construction Real Estate 27.4%
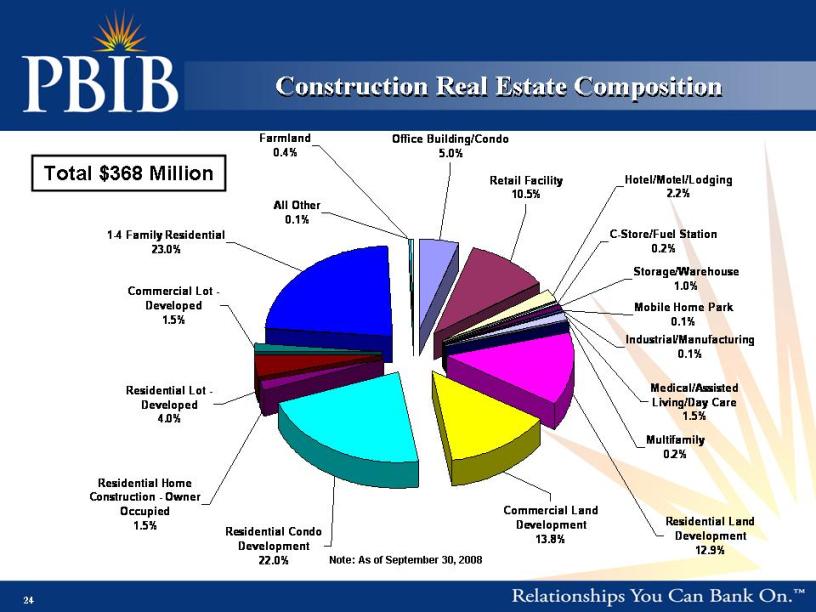
24 Construction Real Estate Composition Note: As of September 30, 2008 Total $368 Million Office Building/Condo 5.0% Retail Facility 10.5% Hotel/Motel/Lodging 2.2% C-Store/Fuel Station 0.2% Storage/Warehouse 1.0% Mobile Home Park 0.1% Industrial/Manufacturing 0.1% Medical/Assisted Living/Day Care 1.5% Multifamily 0.2% Residential Land Development 12.9% Commercial Land Development 13.8% Residential Condo Development 22.0% Residential Home Construction – Owner Occupied 1.5% Residential Lot – Developed 4.0% Commercial Lot – Developed 1.5% 1-4 Family Residential 23.0% All Other 0.1% Farmland 0.4%
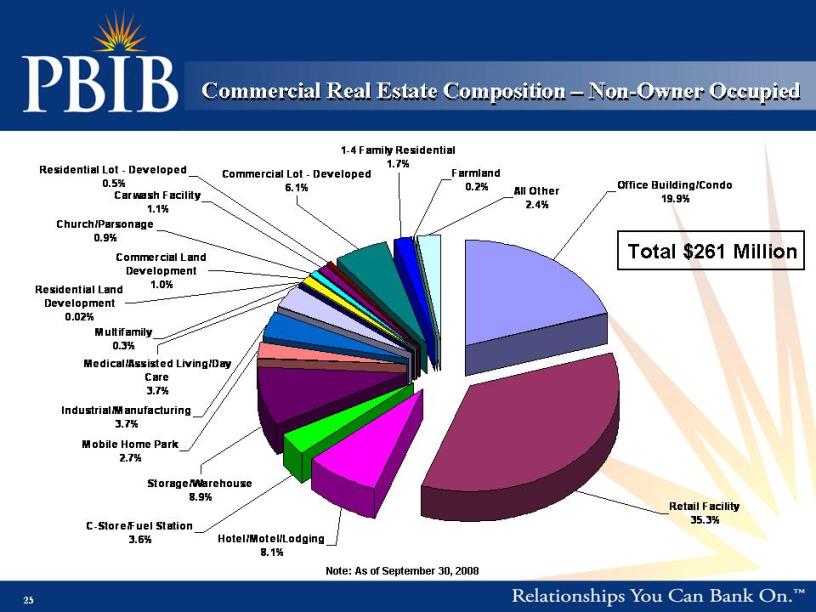
25 Commercial Real Estate Composition – Non-Owner Occupied Note: As of September 30, 2008 Total $261 Million Hotel/Motel/Lodging 8.1% C-Store/Fuel Station 3.6% Storage/Warehouse 8.9% Mobile Home Park 2.7% Industrial/Manufacturing 3.7% Medical/Assisted Living/Day Care 3.7% Multifamily 0.3% Residential Land Development 0.02% Commercial Land Development 1.0% Church/Parsonage 0.9% Carwash Facility 1.1% Residential Lot – Developed 0.5% Commercial Lot – Developed 6.1% 1-4 Family Residential 1.7% Farmland 0.2% All Other 2.4% Office Building/Condo 19.9% Retail Facility 35.3%
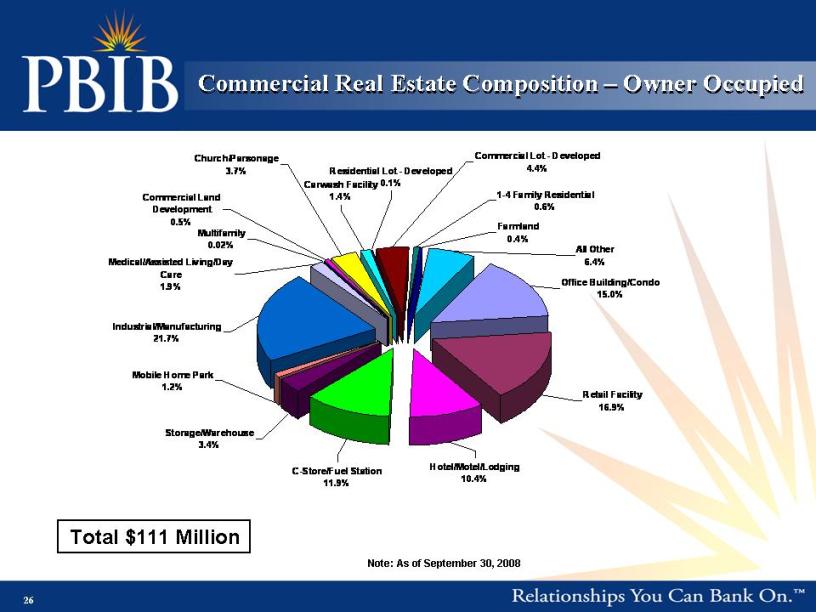
26 Commercial Real Estate Composition – Owner Occupied Note: As of September 30, 2008 Total $111 Million Hotel/Motel/Lodging 10.4% C-Store/Fuel Station 11.9% Storage/Warehouse 3.4% Mobile Home Park 1.2% Industrial/Manufacturing 21.7% Medical/Assisted Living/Day Care 1.9% Multifamily 0.02% Commercial Land Development 0.5% Church/Parsonage 3.7% Carwash Facility 1.4% Residential Lot – Developed 0.1% Commercial Lot – Developed 4.4% 1-4 Family Residential 0.6% Farmland 0.4% All Other 6.4% Office Building/Condo 15.0% Retail Facility 16.9%
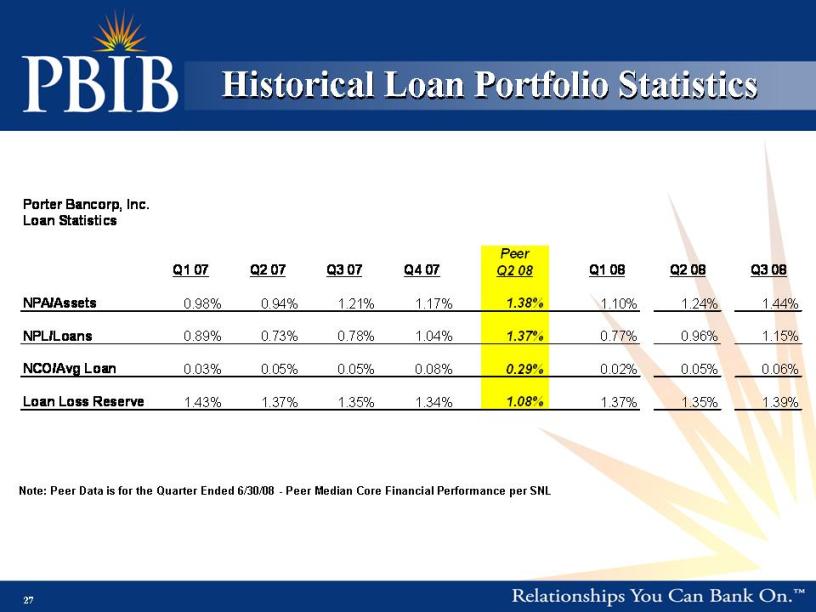
27 Historical Loan Portfolio Statistics Note: Peer Data is for the Quarter Ended 6/30/08 - Peer Median Core Financial Performance per SNL Porter Bancorp, Inc. Loan Statistics Q1 07 Q2 07 Q3 07 Q4 07 Peer Q2 08 Q1 08 Q2 08 Q3 08 NPA/Assets 0.98% 0.94% 1.21% 1.17% 1.38% 1.10% 1.24% 1.44% NPL/Loans 0.89% 0.73% 0.78% 1.04% 1.37% 0.77% 0.96% 1.15% NCO/Avg Loan 0.03% 0.05% 0.05% 0.08% 0.29% 0.02% 0.05% 0.06% Loan Loss Reserve 1.43% 1.37% 1.35% 1.34% 1.08% 1.37% 1.35% 1.39%
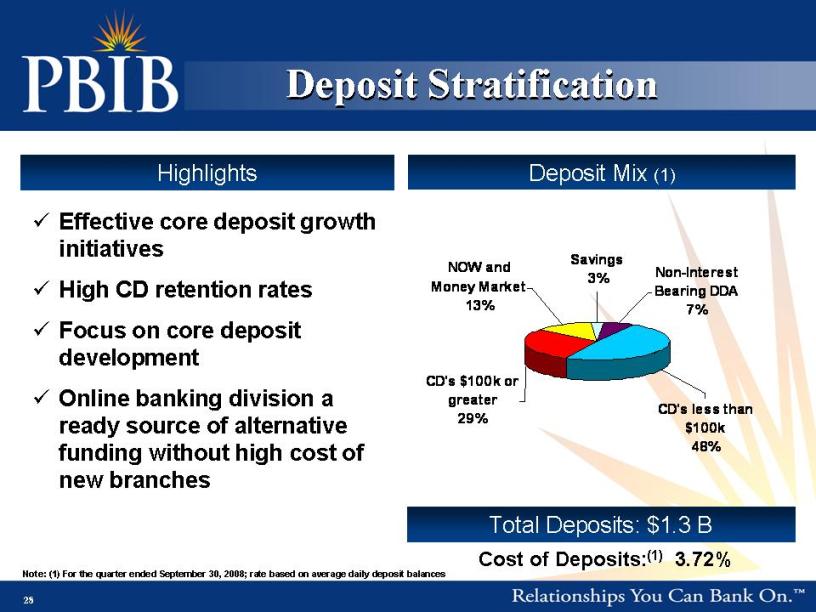
28 Note: (1) For the quarter ended September 30, 2008; rate based on average daily deposit balances Deposit Mix (1) Total Deposits: $1.3 B Cost of Deposits:(1) 3.72% Effective core deposit growth initiatives High CD retention rates Focus on core deposit development Online banking division a ready source of alternative funding without high cost of new branches Deposit Stratification Highlights Savings 3% Non-Interest Bearing DDA 7% CD’s less than $100k 48% CD’s $100k or greater 29% NOW and Money Market 13%
29 Investment Highlights
30 Experienced management team Extensive market knowledge and community relationships Acquisition and integration capabilities Scalable operating platform Highly efficient organizational structure Diversified funding sources Highly focused on profits Strong capital Operating Strengths
31 Attractive, diversified growth markets Successful history of executing growth strategy Scalable platform for expansion Efficient operating model Solid operating performance Undervalued investment opportunity Investment Highlights
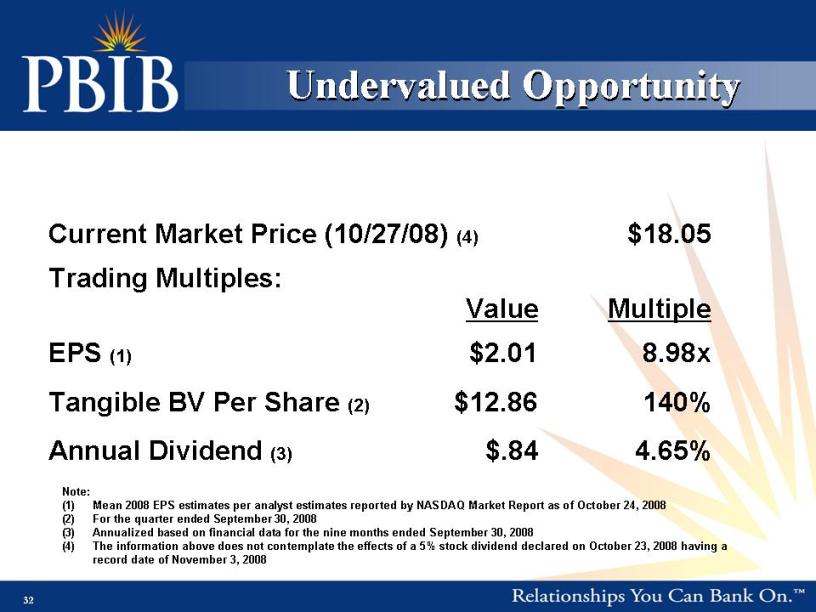
32 Undervalued Opportunity Current Market Price (10/27/08) (4) $18.05 Trading Multiples: Value Multiple EPS (1) $2.01 8.98x Tangible BV Per Share (2) $12.86 140% Annual Dividend (3) $.84 4.65% Note: (1) Mean 2008 EPS estimates per analyst estimates reported by NASDAQ Market Report as of October 24, 2008 (2) For the quarter ended September 30, 2008 (3) Annualized based on financial data for the nine months ended September 30, 2008 (4) The information above does not contemplate the effects of a 5% stock dividend declared on October 23, 2008 having a record date of November 3, 2008
33 Addendum
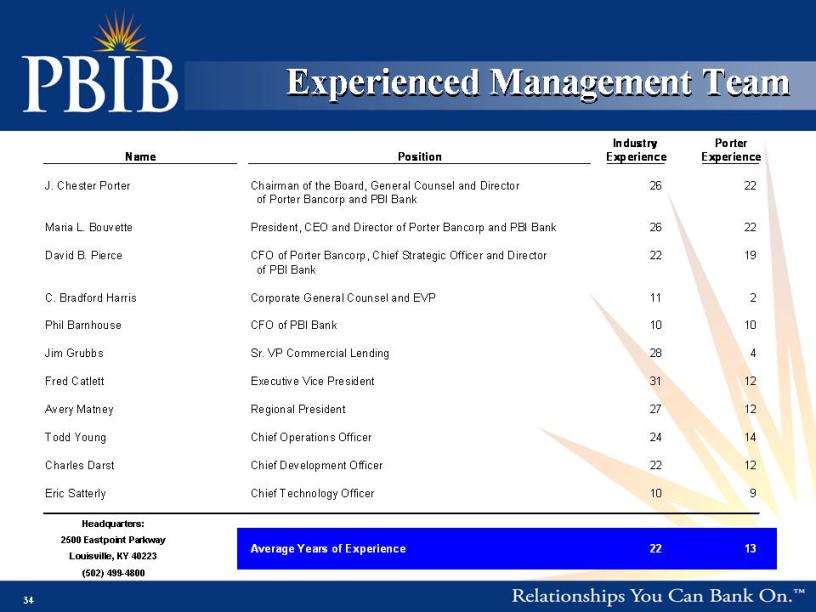
34 Experienced Management Team Headquarters: 2500 Eastpoint Parkway Louisville, KY 40223 (502) 499-4800 Name Position Industry Experience Porter Experience J. Chester Porter Chairman of the Board, General Counsel and Director of Porter Bancorp and PBI Bank 26 22 Maria L. Bouvette President, CEO and Director of Porter Bancorp and PBI Bank 26 22 David B. Pierce CFO of Porter Bancorp, Chief Strategic Officer and Director of PBI Bank 22 19 C. Bradford Harris Corporate General Counsel and EVP 11 2 Phil Barnhouse CFO of PBI Bank 10 10 Jim Grubbs Sr. VP Commercial Lending 28 4 Fred Catlett Executive Vice President 31 12 Avery Matney Regional President 27 12 Todd Young Chief Operations Officer 24 14 Charles Darst Chief Development Officer 22 12 Eric Satterly Chief Technology Officer 10 9 Average Years of Experience 22 13

35 Porter Bancorp, Inc. Comparable Group Financial Information as of the year ended 12/31/07 ($ in thousands) Total Assets Core ROAA Core ROAE Net Interest Margin Efficiency Ratio NPLs/Loans Reserves/NPLs Reserves/Loans NCOs/Avg Loans NPAs/Assets Company Name Ticker City State Integra Bank Corporation IBNK Evansville IN $3,350,126 1.04% 10.71% 3.46% 63.18% 0.80% 146.97% 1.18% 0.19% 0.64% Republic Bancorp, Inc. RBCAA Louisville KY 3,165,359 0.77% 9.75% 3.17% 66.78% 0.35% 153.38% 0.53% 0.22% 0.29% Community Trust Bancorp, Inc. CTBI Pikeville KY 2,902,684 1.20% 12.19% 3.90% 57.12% 1.00% 126.05% 1.26% 0.27% 1.04% Farmers Capital Bank Corporation FFKT Frankfort KY 2,068,247 0.83% 8.88% 3.64% 65.48% 1.40% 78.66% 1.10% 0.11% 1.17% S.Y. Bancorp, Inc. SYBT Louisville KY 1,482,219 1.70% 17.26% 4.16% 54.68% 0.25% 453.78% 1.11% 0.20% 0.46% Bank of Kentucky Financial Corporation BKYF Crestview Hills KY 1,232,724 0.99% 12.39% 3.66% 62.14% 0.67% 133.12% 0.89% 0.11% 0.85% First Financial Service Corporation FFKY Elizabethtown KY 872,691 1.10% 12.88% 3.89% 60.67% 1.16% 89.12% 1.03% 0.13% 1.22% Community Bank Shares of Indiana, Inc. CBIN New Albany IN 823,594 0.46% 5.78% 3.00% 76.67% 1.01% 98.58% 0.99% 0.10% 0.85% High $3,350,126 1.70% 17.26% 4.16% 76.67% 1.40% 453.78% 1.26% 0.27% 1.22% Low 823,594 0.46% 5.78% 3.00% 54.68% 0.25% 78.66% 0.53% 0.10% 0.29% Average 1,987,206 1.01% 11.23% 3.61% 63.34% 0.83% 159.96% 1.01% 0.17% 0.82% Median 1,775,233 1.02% 11.45% 3.65% 62.66% 0.90% 129.59% 1.07% 0.16% 0.85% Peer Metrics Note: Data per SNL
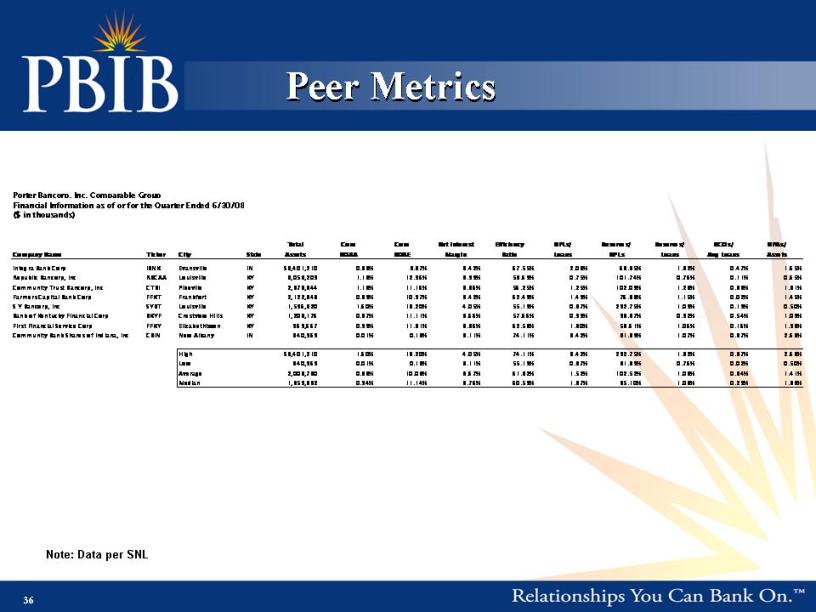
36 Porter Bancorp, Inc. Comparable Group Financial Information as of or for the Quarter Ended 6/30/08 ($ in thousands) Total Core Core Net Interest Efficiency NPLs/ Reserves/ Reserves/ NCOs/ NPAs/ Company Name Ticker City State Assets ROAA ROAE Margin Ratio Loans NPLs Loans Avg Loans Assets Integra Bank Corp IBNK Evansville IN $3,401,210 0.38% 3.87% 3.42% 67.55% 2.08% 63.35% 1.32% 0.47% 1.65% Republic Bancorp, Inc RBCAA Louisville KY 3,053,209 1.13% 12.96% 3.99% 58.69% 0.75% 101.74% 0.76% 0.11% 0.65% Community Trust Bancorp, Inc CTBI Pikeville KY 2,878,344 1.18% 11.16% 3.86% 56.25% 1.25% 102.09% 1.28% 0.38% 1.31% Farmers Capital Bank Corp FFKT Frankfort KY 2,122,343 0.89% 10.97% 3.42% 62.49% 1.49% 76.83% 1.15% 0.02% 1.45% S Y Bancorp, Inc SYBT Louisville KY 1,596,320 1.60% 18.20% 4.05% 55.19% 0.37% 292.75% 1.09% 0.19% 0.50% Bank of Kentucky Financial Corp BKYF Crestview Hills KY 1,208,176 0.87% 11.11% 3.66% 57.66% 0.99% 93.37% 0.92% 0.54% 1.09% First Financial Service Corp FFKY Elizabethtown KY 969,667 0.99% 11.81% 3.86% 62.58% 1.80% 58.61% 1.06% 0.16% 1.93% Community Bank Shares of Indiana, Inc CBIN New Albany IN 840,969 0.01% 0.18% 3.11% 74.11% 3.42% 31.39% 1.07% 0.87% 2.68% High $3,401,210 1.60% 18.20% 4.05% 74.11% 3.42% 292.75% 1.32% 0.87% 2.68% Low 840,969 0.01% 0.18% 3.11% 55.19% 0.37% 31.39% 0.76% 0.02% 0.50% Average 2,008,780 0.88% 10.03% 3.67% 61.82% 1.52% 102.52% 1.08% 0.34% 1.41% Median 1,859,332 0.94% 11.14% 3.76% 60.59% 1.37% 85.10% 1.08% 0.29% 1.38% Peer Metrics Note: Data per SNL
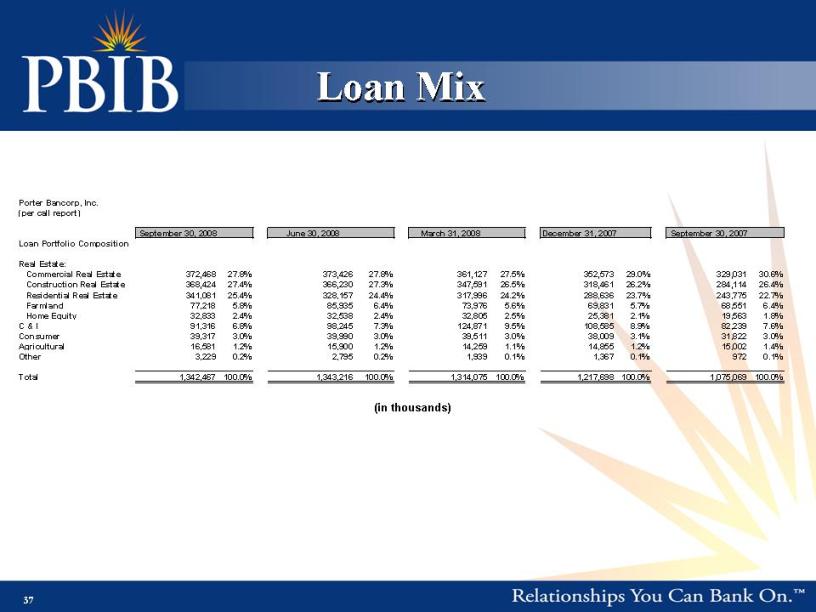
37 Porter Bancorp, Inc. (per call report) September 30, 2008 June 30, 2008 March 31, 2008 December 31, 2007 September 30, 2007 Loan Portfolio Composition Real Estate: Commercial Real Estate 372,468 27.8% 373,426 27.8% 361,127 27.5% 352,573 29.0% 329,031 30.6% Construction Real Estate 368,424 27.4% 366,230 27.3% 347,591 26.5% 318,461 26.2% 284,114 26.4% Residential Real Estate 341,081 25.4% 328,157 24.4% 317,996 24.2% 288,636 23.7% 243,775 22.7% Farmland 77,218 5.8% 85,935 6.4% 73,976 5.6% 69,831 5.7% 68,551 6.4% Home Equity 32,833 2.4% 32,538 2.4% 32,805 2.5% 25,381 2.1% 19,563 1.8% C & I 91,316 6.8% 98,245 7.3% 124,871 9.5% 108,585 8.9% 82,239 7.6% Consumer 39,317 3.0% 39,990 3.0% 39,511 3.0% 38,009 3.1% 31,822 3.0% Agricultural 16,581 1.2% 15,900 1.2% 14,259 1.1% 14,855 1.2% 15,002 1.4% Other 3,229 0.2% 2,795 0.2% 1,939 0.1% 1,367 0.1% 972 0.1% Total 1,342,467 100.0% 1,343,216 100.0% 1,314,075 100.0% 1,217,698 100.0% 1,075,069 100.0% Loan Mix (in thousands)
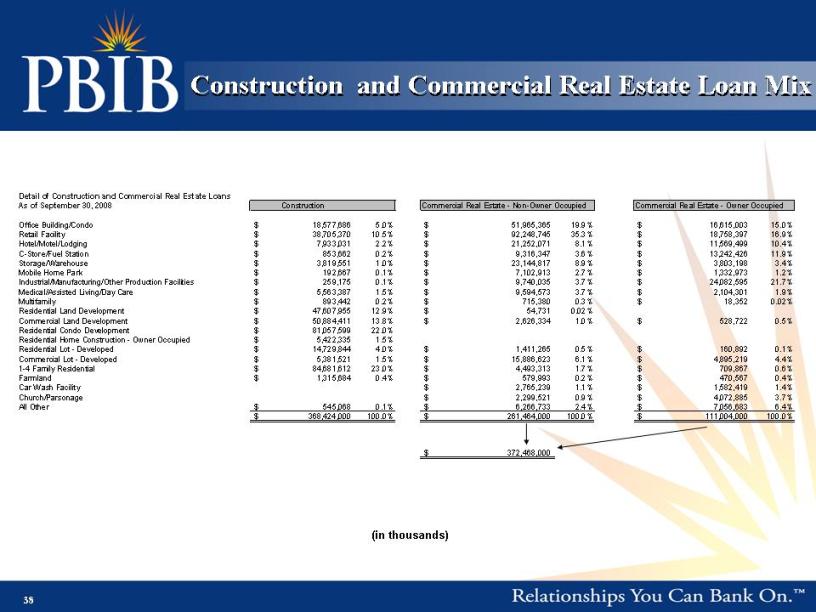
38 Detail of Construction and Commercial Real Estate Loans As of September 30, 2008 Construction Commercial Real Estate - Non-Owner Occupied Commercial Real Estate - Owner Occupied Office Building/Condo 18,577,686 $ 5.0% 51,965,365 $ 19.9% 16,615,003 $ 15.0% Retail Facility 38,705,370 $ 10.5% 92,248,745 $ 35.3% 18,758,397 $ 16.9% Hotel/Motel/Lodging 7,933,031 $ 2.2% 21,252,071 $ 8.1% 11,569,499 $ 10.4% C-Store/Fuel Station 853,662 $ 0.2% 9,316,347 $ 3.6% 13,242,426 $ 11.9% Storage/Warehouse 3,819,551 $ 1.0% 23,144,817 $ 8.9% 3,803,198 $ 3.4% Mobile Home Park 192,667 $ 0.1% 7,102,913 $ 2.7% 1,332,973 $ 1.2% Industrial/Manufacturing/Other Production Facilities 259,175 $ 0.1% 9,740,035 $ 3.7% 24,082,595 $ 21.7% Medical/Assisted Living/Day Care 5,563,387 $ 1.5% 9,594,573 $ 3.7% 2,104,301 $ 1.9% Multifamily 893,442 $ 0.2% 715,380 $ 0.3% 18,352 $ 0.02% Residential Land Development 47,607,955 $ 12.9% 54,731 $ 0.02% Commercial Land Development 50,884,411 $ 13.8% 2,626,334 $ 1.0% 528,722 $ 0.5% Residential Condo Development 81,057,599 $ 22.0% Residential Home Construction - Owner Occupied 5,422,335 $ 1.5% Residential Lot - Developed 14,729,844 $ 4.0% 1,411,265 $ 0.5% 160,892 $ 0.1% Commercial Lot - Developed 5,381,521 $ 1.5% 15,886,623 $ 6.1% 4,895,219 $ 4.4% 1-4 Family Residential 84,681,612 $ 23.0% 4,493,313 $ 1.7% 709,867 $ 0.6% Farmland 1,315,684 $ 0.4% 579,993 $ 0.2% 470,567 $ 0.4% Car Wash Facility 2,765,239 $ 1.1% 1,582,419 $ 1.4% Church/Parsonage 2,299,521 $ 0.9% 4,072,885 $ 3.7% All Other 545,068 $ 0.1% 6,266,733 $ 2.4% 7,056,683 $ 6.4% 368,424,000 $ 100.0% 261,464,000 $ 100.0% 111,004,000 $ 100.0% 372,468,000 $ Construction and Commercial Real Estate Loan Mix (in thousands)