Exhibit 99.2
NASDAQ NASDAQ: PBIB 2nd Quarter 2009
This presentation contains forward-looking statements that p g involve risks and uncertainties. These forward-looking statements are based on management’s current expectations. Porter Bancorp’s periods Bancorp s actual results in future may differ materially from those currently expected due to various factors, including those risk factors described in documents that the Company files with the Securities and Exchange Commission, including the Company’s most recent Annual Report on Form 10-K and Quarterly Report on Form 10-Q. The forward-looking statements in this presentation are made as of the date of the presentation and Porter Bancorp does not assume any statements responsibility to update these statements.
Market Overview and Franchise History Financial Highlights Summary of 2nd Quarter 2009 and Full Year 2008 Performance Loan Composition and Credit Quality Deposits Capital Strength Investment Considerations Going Forward Operating Strengths 2009 Growth Strategy 2009 Key 3 Strategic Initiatives Company Overview

Louisville, Kentucky headquarters 6th largest bank domiciled in Kentucky 19 offices $1.7 billion in assets $1.4 billion in loans $1.4 billion in deposits Focus on high growth markets within our footprint Efficient operating model 4 Note: Financial data as of June 30, 2009 Strong capital base
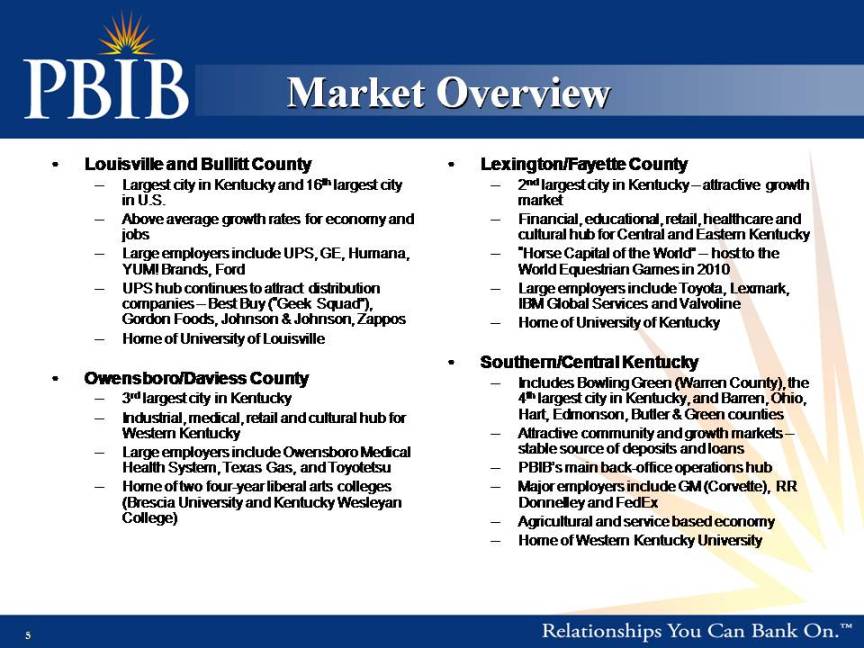
Market Overview • Louisville and Bullitt County Largest largest • Lexington/Fayette County 2nd largest in attractive – city in Kentucky and 16th city in U.S. – Above average growth rates for economy and jobs – Large employers include UPS, GE, Humana, YUM! Brands, Ford – city Kentucky – growth market – Financial, educational, retail, healthcare and cultural hub for Central and Eastern Kentucky – “Horse Capital of the World” – host to the World Equestrian Games in 2010 – UPS hub continues to attract distribution companies – Best Buy (“Geek Squad”), Gordon Foods, Johnson & Johnson, Zappos – Home of University of Louisville – Large employers include Toyota, Lexmark, IBM Global Services and Valvoline – Home of University of Kentucky • Southern/Central Kentucky • Owensboro/Daviess County – 3rd largest city in Kentucky – Industrial, medical, retail and cultural hub for Western Kentucky – Large employers include Owensboro Medical Health – Includes Bowling Green (Warren County), the 4th largest city in Kentucky, and Barren, Ohio, Hart, Edmonson, Butler & Green counties – Attractive community and growth markets – stable source of deposits and loans PBIB’ Health System, Texas Gas, and Toyotetsu – Home of two four-year liberal arts colleges (Brescia University and Kentucky Wesleyan College) – PBIB’s main back-office operations hub – Major employers include GM (Corvette), RR Donnelley and FedEx – Agricultural and service based economy – Home of Western Kentucky University 5
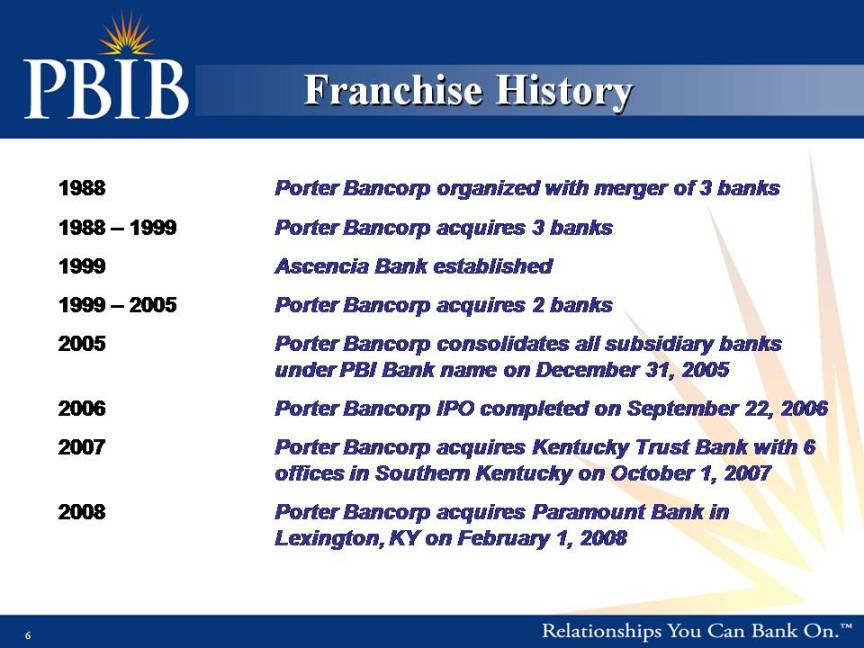
History Franchise 1988 with merger 3 banks Porter Bancorp organized of 1988 – 1999 Porter Bancorp acquires 3 banks 1999 Ascencia Bank established 1999 – 2005 Porter Bancorp acquires 2 banks 2005 Porter Bancorp consolidates all subsidiary banks under PBI Bank on 31 name December 31, 2005 2006 Porter Bancorp IPO completed on September 22, 2006 2007 Porter Bancorp acquires Kentucky Trust Bank with 6 offices in Southern Kentucky on October 1, 2007 2008 Porter Bancorp acquires Paramount Bank in Lexington, KY on February 1, 2008 6

Financial Highlights 7
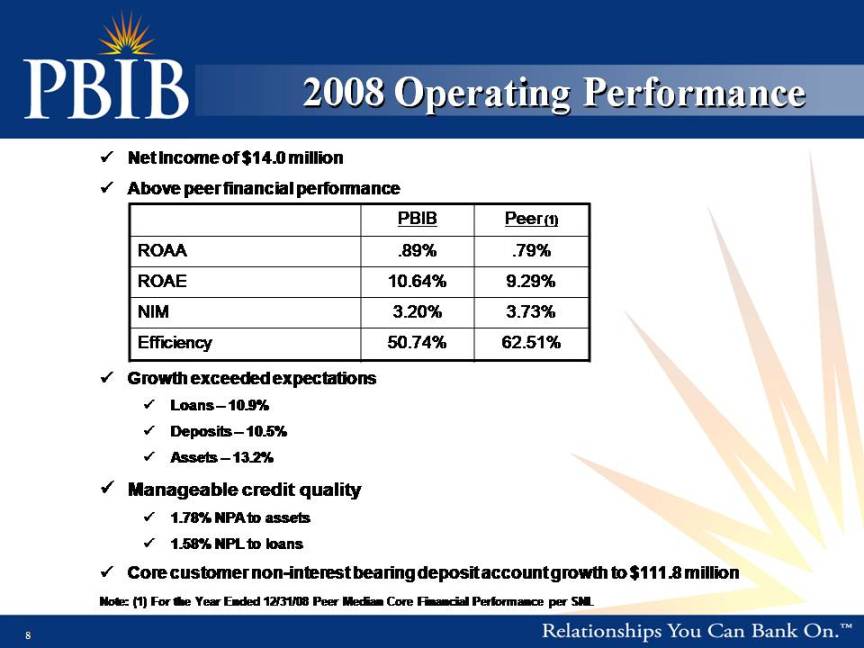
Operating Performance 2008 Net Income of $14.0 million Ab fi i l f Above peer financial performance PBIB Peer (1) ROAA .89% .79% ROAE 10 64% 9 29% 10.64% 9.29% NIM 3.20% 3.73% Efficiency 50.74% 62.51% Growth exceeded expectations Loans – 10.9% Deposits – 10.5% Assets – 13.2% Manageable credit quality 1.78% NPA to assets 1.58% NPL to loans 8 Core customer non-interest bearing deposit account growth to $111.8 million Note: (1) For the Year Ended 12/31/08 Peer Median Core Financial Performance per SNL
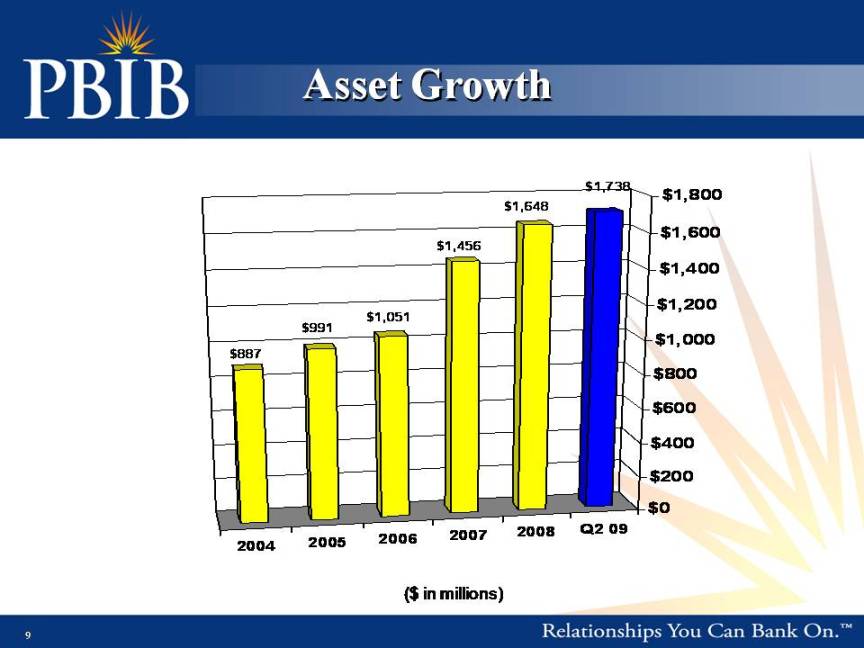
Asset Growth $1 738 1,738 $1,648 $1,456 $1,400 $1,600 $1,800 $1,051 $991 $887 $800 $1,000 $1,200 , $400 $600 2004 2005 2006 2007 2008 Q2 09 $0 $200 9 ($ in millions)
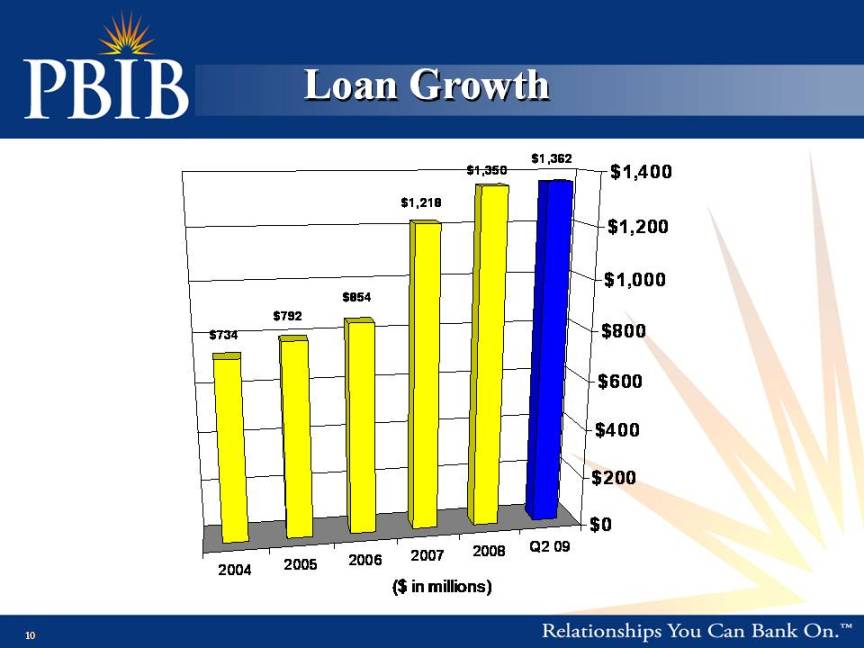
Loan Growth $1,362 $1,350 $1,400 $1,218 $1 000 $1,200 $854 $792 $734 $800 1,000 $400 $600 2006 2007 2008 Q2 09 $0 $200 10 ($ in millions) 2004 2005
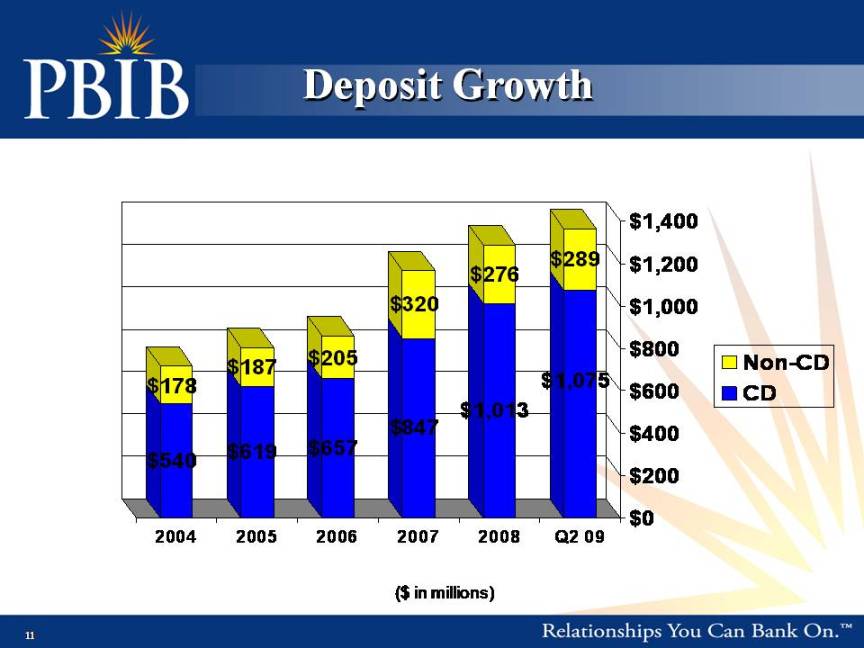
Deposit Growth $289 $276 $1,200 $1,400 $ $320 $205 $187 $800 $1,000 Non-CD 1,075 $1,013 $847 $657 $619 $540 $178 $400 $600 o C CD $0 $200 2004 2005 2006 2007 2008 Q2 09 11 ($ in millions)
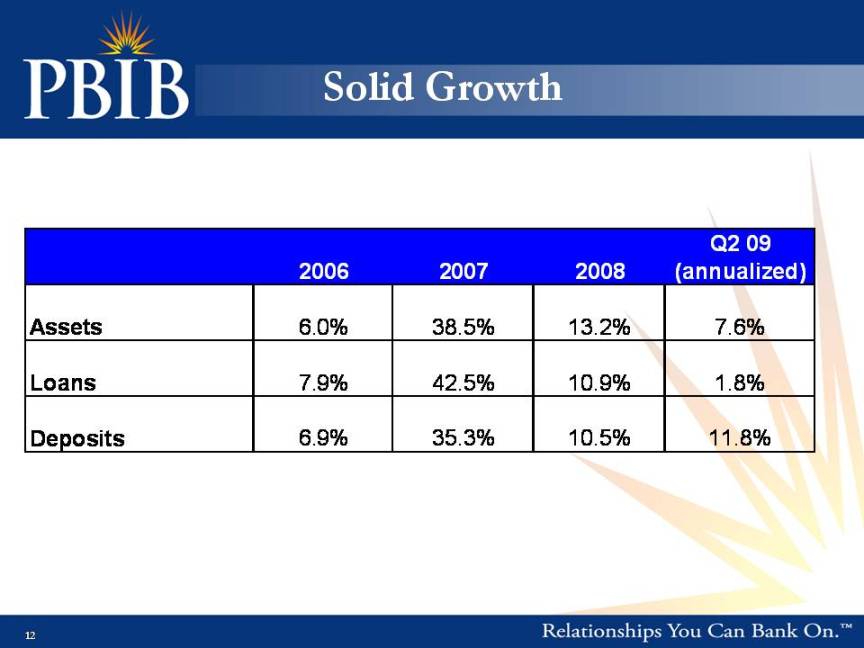
Solid Growth Q2 09 2006 2007 2008 (annualized) Assets 6.0% 38.5% 13.2% 7.6% Loans 7.9% 42.5% 10.9% 1.8% Deposits 6.9% 35.3% 10.5% 11.8% 12
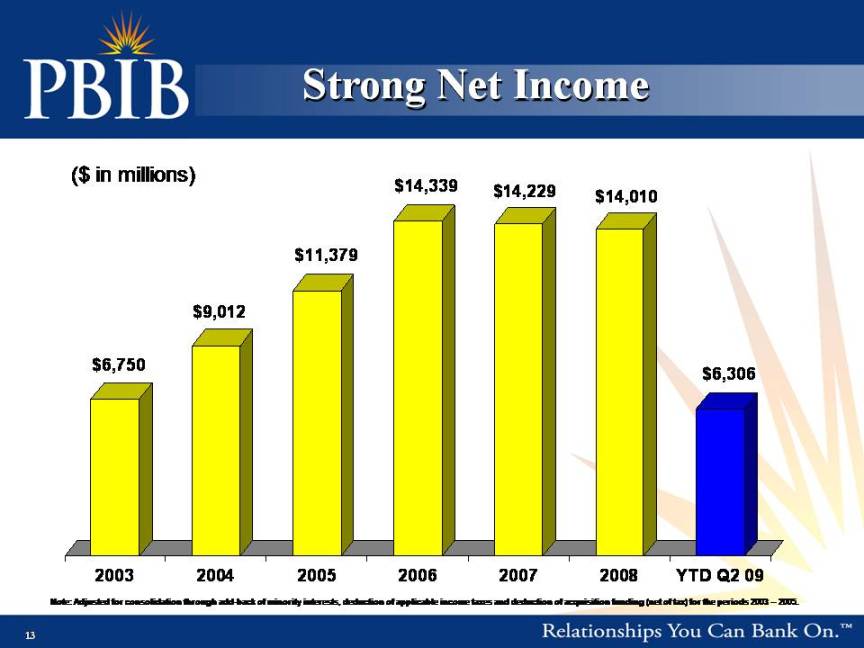
Strong Net Income $14 339 $14 229 ($ in millions) $11,379 14,339 14,229 $14,010 ( ) $6,750 $9,012 $6 306 6,306 13 2003 2004 2005 2006 2007 2008 YTD Q2 09 Note: Adjusted for consolidation through add-back of minority interests, deduction of applicable income taxes and deduction of acquisition funding (net of tax) for the periods 2003 – 2005.
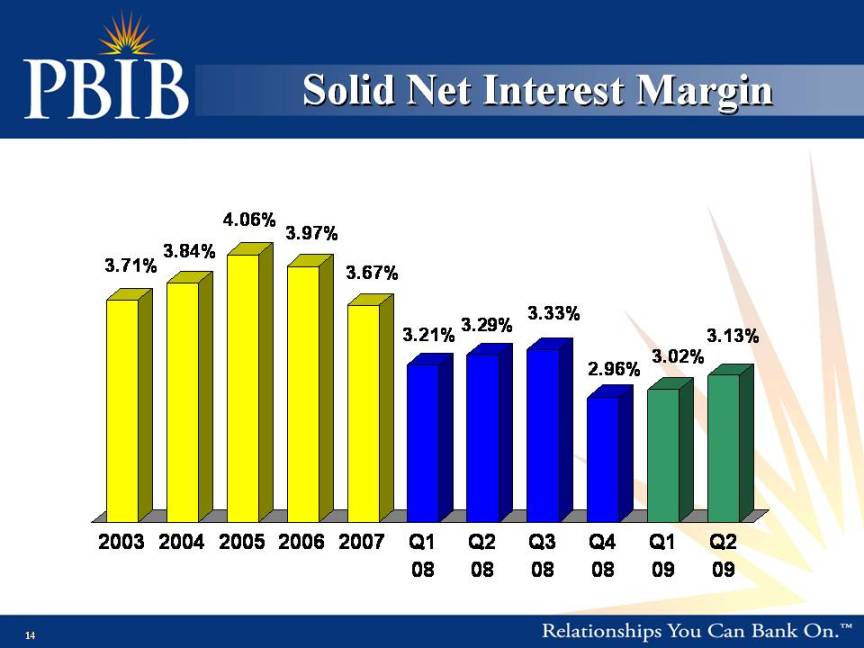
Interest Solid Net Margin 3.71% 3.84% 4.06% 3.97% 3.67% 3.21% 3.29% 3.33% 2 96% 3.02% 3.13% 2.96% 2003 2004 2005 2006 2007 Q1 Q2 Q3 Q4 Q1 Q2 14 08 08 08 08 09 09
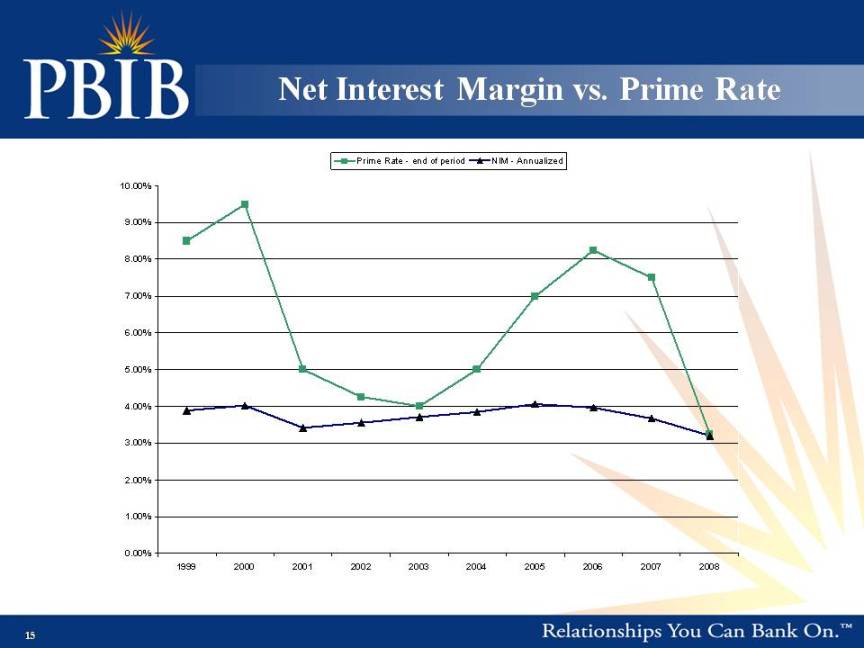
Net Interest vs Prime Rate Margin vs. 10 00% Prime Rate - end of period NIM - Annualized 8.00% 9.00% 10.00% 5 00% 6.00% 7.00% 3.00% 4.00% 5.00% 0 00% 1.00% 2.00% 15 0.00% 1999 2000 2001 2002 2003 2004 2005 2006 2007 2008
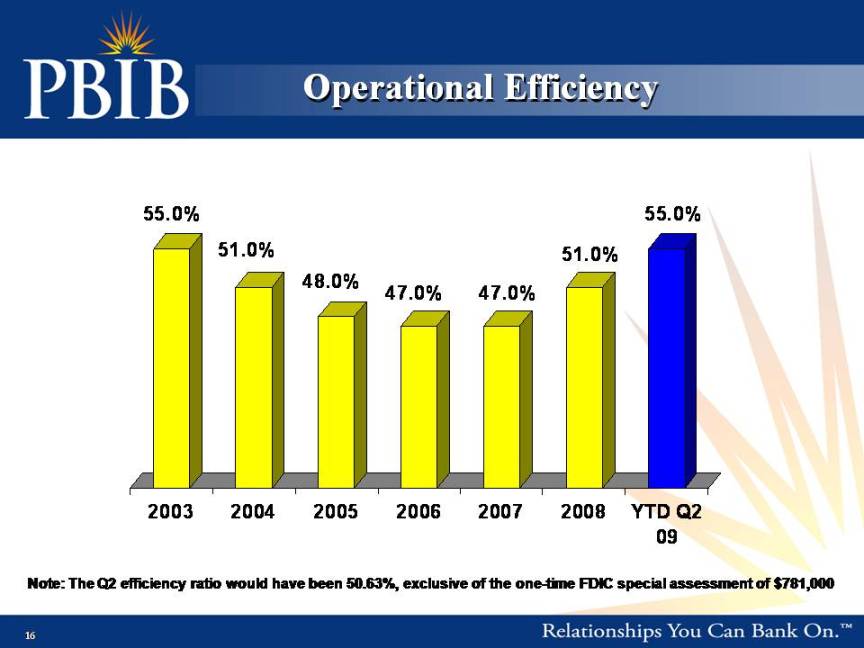
Efficiency Operational 55.0% 51.0% 48 0% 51.0% 55.0% 48.0% 47.0% 47.0% 2003 2004 2005 2006 2007 2008 YTD Q2 09 16 Note: The Q2 efficiency ratio would have been 50.63%, exclusive of the one-time FDIC special assessment of $781,000
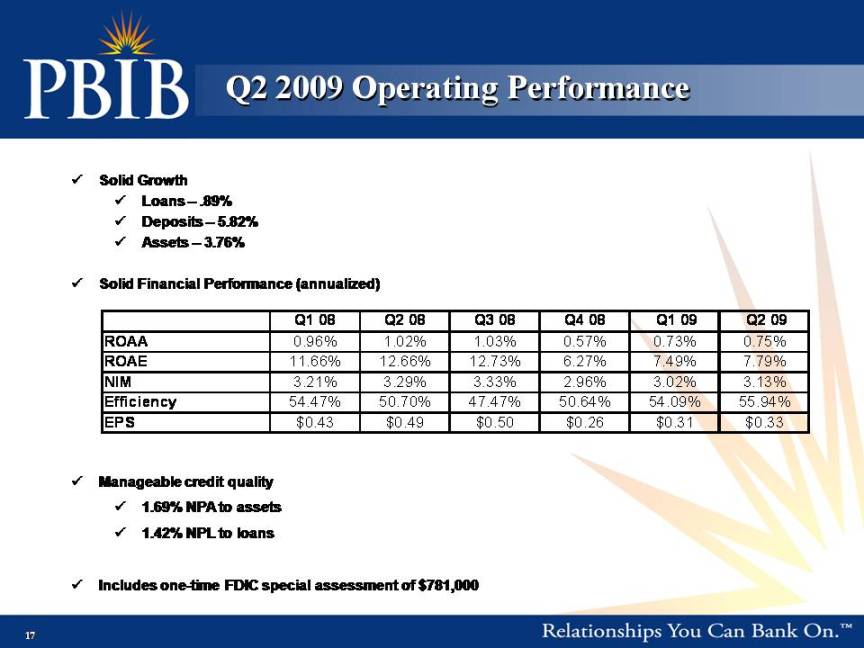
Q2 Performance 2009 Operating Solid Growth Loans – .89% Deposits – 5.82% Assets – 3.76% Solid Financial Performance (annualized) Q1 08 Q2 08 Q3 08 Q4 08 Q1 09 Q2 09 ROAA 0.96% 1.02% 1.03% 0.57% 0.73% 0.75% ROAE 11.66% 12.66% 12.73% 6.27% 7.49% 7.79% NIM 3.21% 3.29% 3.33% 2.96% 3.02% 3.13% Efficiency 54.47% 50.70% 47.47% 50.64% 54.09% 55.94% EPS $0.43 $0.49 $0.50 $0.26 $0.31 $0.33 Manageable credit quality 1.69% NPA to assets 1.42% NPL to loans 17 Includes one-time FDIC special assessment of $781,000
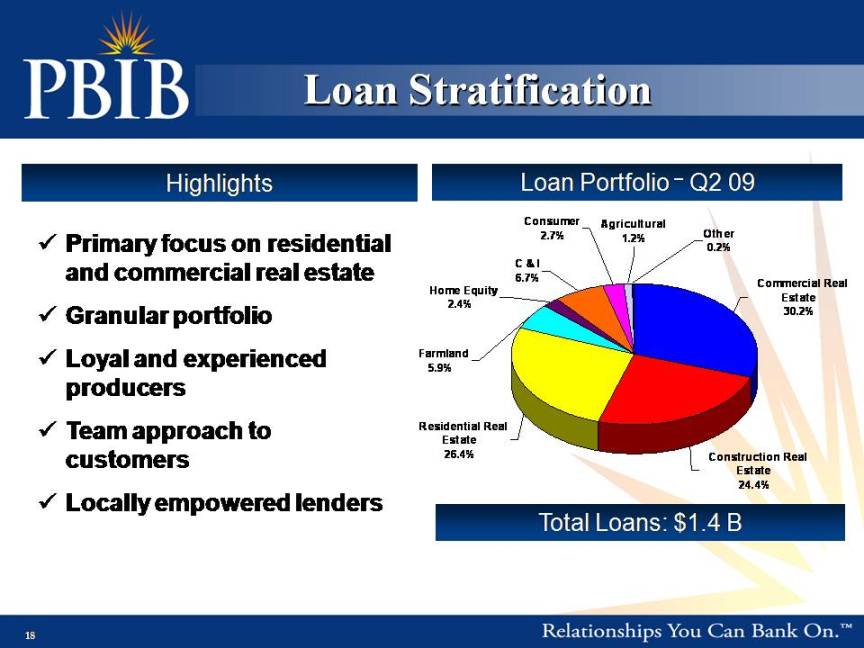
Loan – Stratification Highlights Primary focus on residential and commercial real Portfolio Q2 09 Other 0.2% C & I 6 7% Consumer 2.7% Agricultural 1.2% estate Granular portfolio Loyal and experienced Commercial Real Estate 30.2% Farmland 5.9% Home Equity 2.4% 6.7% y p producers Team approach to customers Residential Real Estate 26.4% Construction Real Locally empowered lenders Total Loans: $1.4 B Estate 24.4% 18
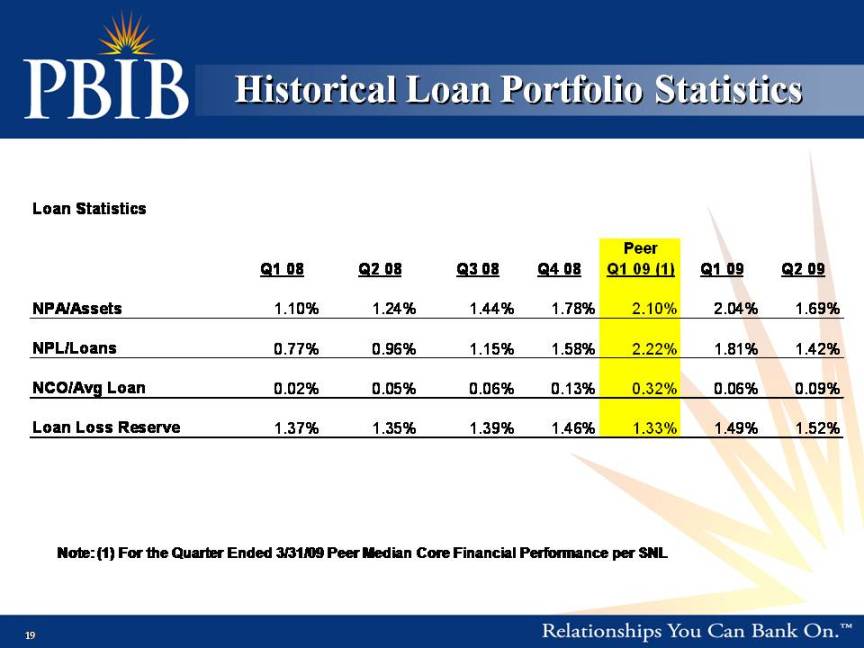
Portfolio Historical Loan Statistics Peer Q1 08 Q2 08 Q3 08 Q4 08 Q1 09 (1) Q1 09 Q2 09 NPA/Assets 1.10% 1.24% 1.44% 1.78% 2.10% 2.04% 1.69% NPL/Loans 0.77% 0.96% 1.15% 1.58% 2.22% 1.81% 1.42% NCO/Avg Loan 0.02% 0.05% 0.06% 0.13% 0.32% 0.06% 0.09% Loan Loss Reserve 1.37% 1.35% 1.39% 1.46% 1.33% 1.49% 1.52% Note: 1) For 19 (the Quarter Ended 3/31/09 Peer Median Core Financial Performance per SNL
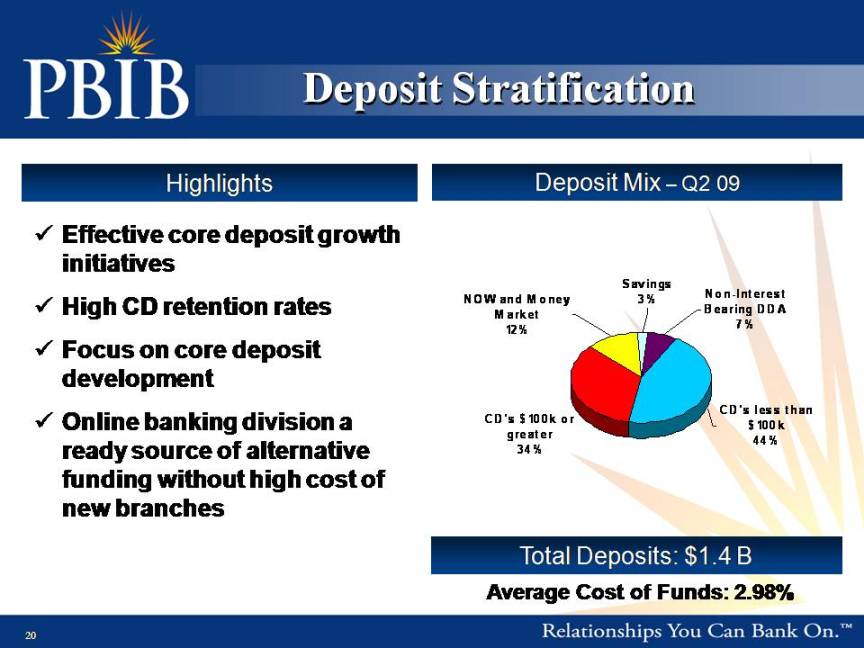
Deposit Stratification Q2 Highlights Deposit Mix – 09 Effective core deposit growth initiatives High CD retention rates Focus on core deposit d l t NOW and M oney M arket 12% Savings 3% Non-Interest Bearing DDA 7% development Online banking division a ready source of alternative CD's less than $ 100k 44% CD's $ 100k o r greater 34% 1 4 y funding without high cost of new branches 20 Total Deposits: $1.4 B Average Cost of Funds: 2.98%
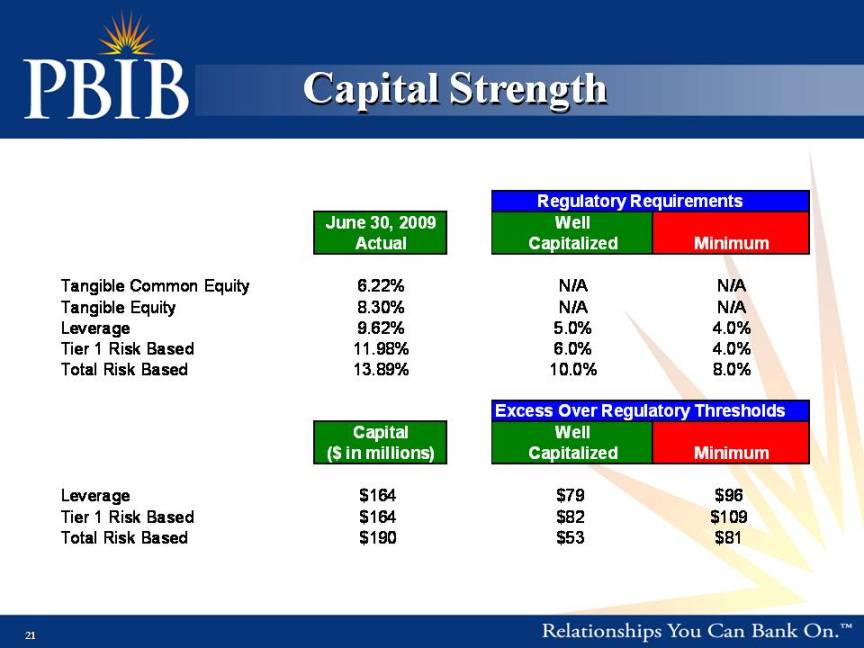
Capital Strength Regulatory Requirements June 30, 2009 Well Actual Capitalized Minimum Tangible Common Equity 6.22% N/A N/A Tangible Equity 8.30% N/A N/A Leverage 9.62% 5.0% 4.0% Tier 1 Risk Based 11.98% 6.0% 4.0% 13 89% 10 0% 8 0% Total Risk Based 13.89% 10.0% 8.0% Excess Over Regulatory Thresholds Capital Well ($ in millions) Capitalized Minimum ( ) Leverage $164 $79 $96 Tier 1 Risk Based $164 $82 $109 Total Risk Based $190 $53 $81 21
Investment Highlights 22
Operating Strengths Experienced management team Extensive market knowledge and community relationships Acquisition and integration experience efficient organizational structure Highly Diversified funding sources Highly focused on profits Strong capital base 23
2009 Growth Strategy Increase managed market share of existing franchise – growth Expand core deposit development initiatives and noninterest income improvement strategies Continue long-term strategy of considering M&A opportunities that arise pp Remain disciplined and focused Accretive to earnings in first full year Markets with high growth potential Strong management team compatible with our culture 24
Key Strategic Initiatives 2009 Client-driven service that consistently provides better value Rational exceptional risk taking and risk management Maintain strict focus on credit quality in this challenging environment Earnings growth Consistent, superior operational efficiency Targeted and disciplined investments for the future 25
Investment Considerations Attractive, diversified growth markets Successful history of executing growth strategy Scalable operating platform Efficient operating model Solid operating performance Undervalued investment opportunity 26
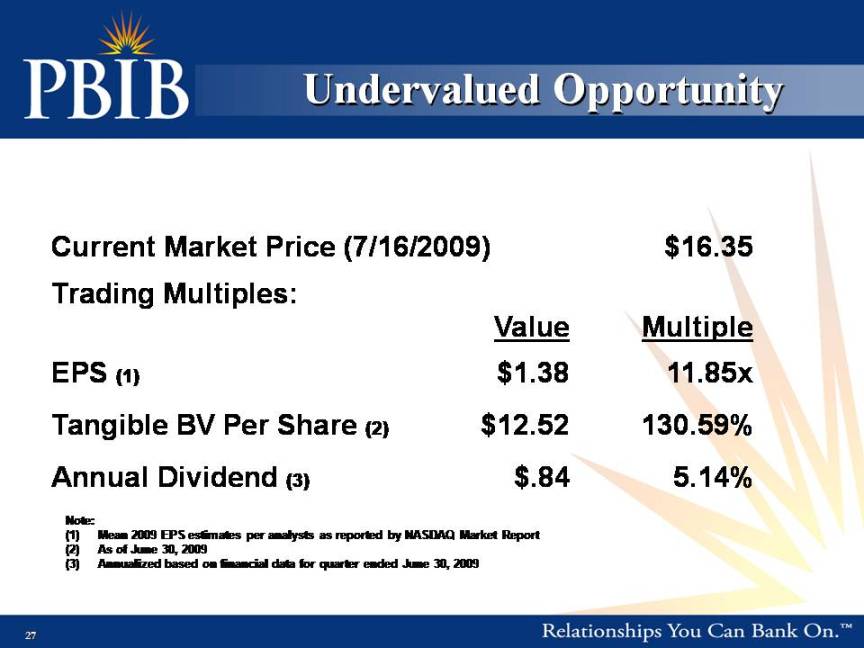
Undervalued Opportunity Current Market Price (7/16/2009) $16.35 Trading Multiples: Value Multiple EPS (1) $1 38 11 85x 1.38 11.85x Tangible BV Per Share (2) $12.52 130.59% Annual Dividend (3) $.84 5.14% Note: (1) Mean 2009 EPS estimates per analysts as reported by NASDAQ Market Report ( 2) As of June 30, 2009 27 ) , (3) Annualized based on financial data for quarter ended June 30, 2009
Addendum 28
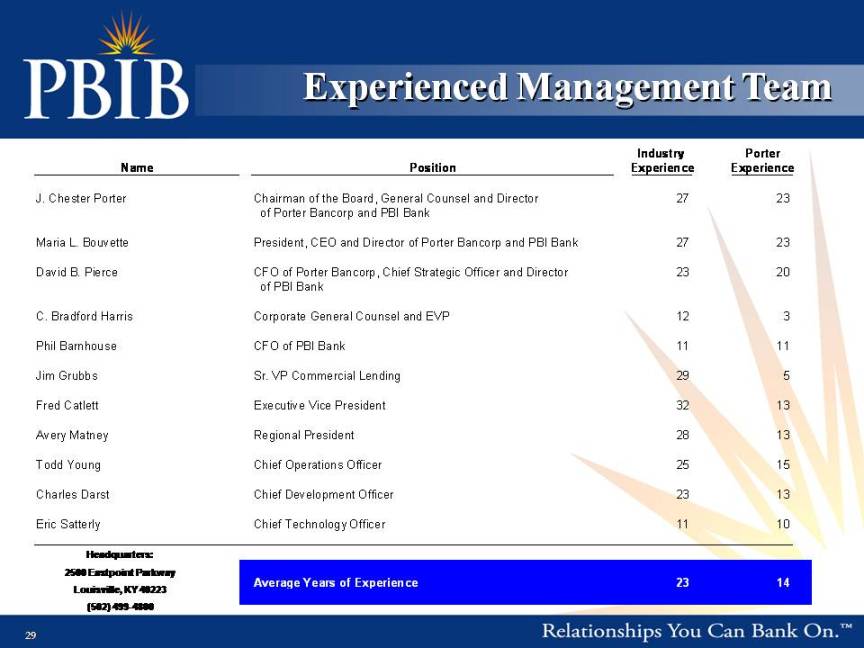
Experienced Management Team Industry Porter Name Position Experience Experience J. Chester Porter Chairman of the Board, General Counsel and Director 27 23 of Porter Bancorp and PBI Bank Maria L. Bouvette President, CEO and Director of Porter Bancorp and PBI Bank 27 23 David B. Pierce CFO of Porter Bancorp, Chief Strategic Officer and Director 23 20 p g of PBI Bank C. Bradford Harris Corporate General Counsel and EVP 12 3 Phil Barnhouse CFO of PBI Bank 11 11 Jim Grubbs Sr. VP Commercial Lending 29 5 Fred Catlett Executive Vice President 32 13 Avery Matney Regional President 28 13 Todd Chief 25 15 Headquarters: Young Operations Officer Charles Darst Chief Development Officer 23 13 Eric Satterly Chief Technology Officer 11 10 29 2500 Eastpoint Parkway Louisville, KY 40223 (502) 499-4800 Average Years of Experience 23 14
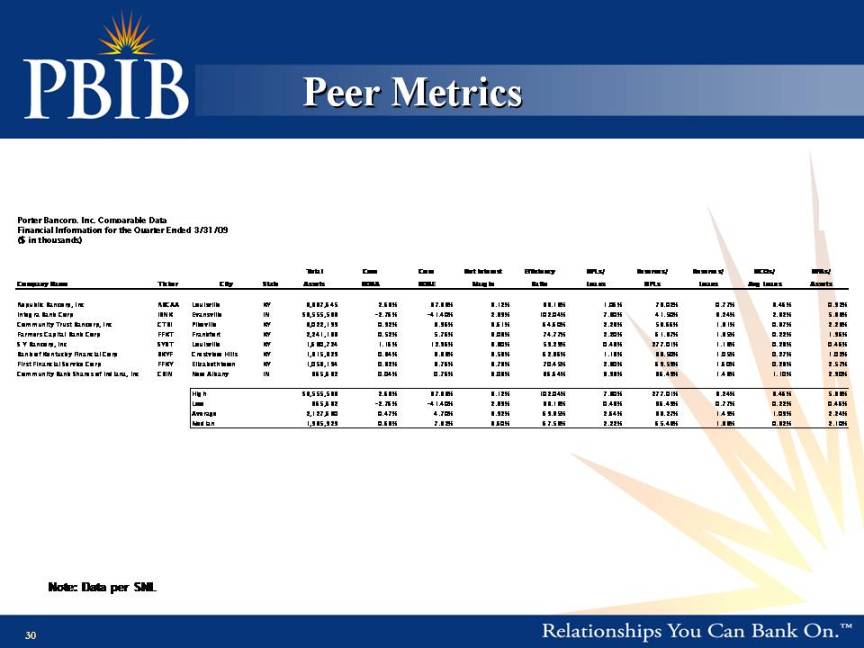
Metrics Peer Porter Bancorp, Inc. Comparable Data Financial Information for the Quarter Ended 3/31/09 ($ in thousands) Total Core Core Net Interest Efficiency NPLs/ Reserves/ Reserves/ NCOs/ NPAs/ Company Name Ticker City State Assets ROAA ROAE Margin Ratio Loans NPLs Loans Avg Loans Assets Republic Bancorp, Inc RBCAA Louisville KY 3,337,645 2.68% 37.88% 8.12% 38.13% 1.06% 73.02% 0.77% 3.46% 0.92% Integra Bank Corp IBNK Evansville IN $3,555,533 -2.76% -41.40% 2.39% 102.04% 7.80% 41.50% 3.24% 2.82% 5.88% Community Trust Bancorp, Inc CTBI Pikeville KY 3,022,199 0.92% 8.96% 3.61% 64.60% 2.23% 58.66% 1.31% 0.37% 2.23% Farmers Capital Bank Corp FFKT Frankfort KY 2,241,133 0.52% 5.76% 3.03% 74.77% 2.20% 61.37% 1.35% 0.22% 1.96% S Y Bancorp, Inc SYBT Louisville KY 1,630,724 1.16% 12.96% 3.80% 59.29% 0.43% 277.01% 1.18% 0.23% 0.46% Bank of Kentucky Financial Corp BKYF Crestview Hills KY 1,315,329 0.84% 8.88% 3.58% 62.86% 1.18% 88.50% 1.05% 0.27% 1.02% First Financial Service Corp FFKY Elizabethtown KY 1,053,194 0.32% 3.76% 3.73% 70.45% 2.30% 69.59% 1.60% 0.23% 2.57% Community Bank Shares of Indiana, Inc CBIN New Albany IN 865,682 0.04% 0.76% 3.08% 86.64% 3.93% 36.49% 1.43% 1.10% 2.90% High $3,555,533 2.68% 37.88% 8.12% 102.04% 7.80% 277.01% 3.24% 3.46% 5.88% Low 865,682 -2.76% -41.40% 2.39% 38.13% 0.43% 36.49% 0.77% 0.22% 0.46% Average 2,127,680 0.47% 4.70% 3.92% 69.85% 2.64% 88.27% 1.49% 1.09% 2.24% Median 1,935,929 0.68% 7.32% 3.60% 67.53% 2.22% 65.48% 1.33% 0.32% 2.10% 30 Note: Data per SNL
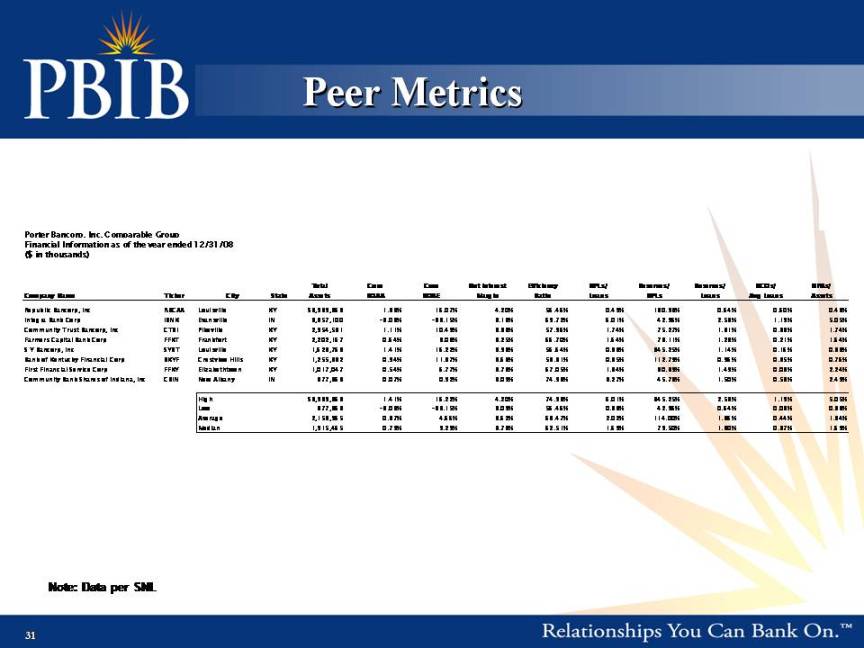
Metrics Peer Porter Bancorp, Inc. Comparable Group Financial Information as of the year ended 12/31/08 ($ in thousands) Total Core Core Net Interest Efficiency NPLs/ Reserves/ Reserves/ NCOs/ NPAs/ Company Name Ticker City State Assets ROAA ROAE Margin Ratio Loans NPLs Loans Avg Loans Assets Republic Bancorp, Inc RBCAA Louisville KY $3,939,368 1.33% 16.07% 4.20% 56.46% 0.49% 130.98% 0.64% 0.60% 0.43% Integra Bank Corp IBNK Evansville IN 3,357,100 -3.08% -33.15% 3.18% 69.72% 6.01% 42.96% 2.58% 1.19% 5.05% Community Trust Bancorp, Inc CTBI Pikeville KY 2,954,531 1.11% 10.49% 3.88% 57.96% 1.74% 75.27% 1.31% 0.38% 1.74% Farmers Capital Bank Corp FFKT Frankfort KY 2,202,167 0.64% 8.08% 3.25% 66.70% 1.64% 78.11% 1.28% 0.21% 1.64% S Y Bancorp, Inc SYBT Louisville KY 1,628,763 1.41% 16.22% 3.93% 56.64% 0.33% 345.25% 1.14% 0.16% 0.38% Bank of Kentucky Financial Corp BKYF Crestview Hills KY 1,255,382 0.94% 11.87% 3.68% 58.31% 0.85% 112.79% 0.96% 0.35% 0.76% FFKY Elizabethtown KY 1 017 047 0 54% 6 77% 3 78% 67 05% 1 84% 80 89% 1 49% 0 08% 2 24% First Financial Service Corp 1,017,047 0.54% 6.77% 3.78% 67.05% 1.84% 80.89% 1.49% 0.08% 2.24% Community Bank Shares of Indiana, Inc CBIN New Albany IN 877,363 0.07% 0.92% 3.09% 74.93% 3.27% 45.78% 1.50% 0.58% 2.49% High $3,939,368 1.41% 16.22% 4.20% 74.93% 6.01% 345.25% 2.58% 1.19% 5.05% Low 877,363 -3.08% -33.15% 3.09% 56.46% 0.33% 42.96% 0.64% 0.08% 0.38% Average 2,153,965 0.37% 4.66% 3.62% 63.47% 2.02% 114.00% 1.36% 0.44% 1.84% Median 1,915,465 0.79% 9.29% 3.73% 62.51% 1.69% 79.50% 1.30% 0.37% 1.69% 31 Note: Data per SNL
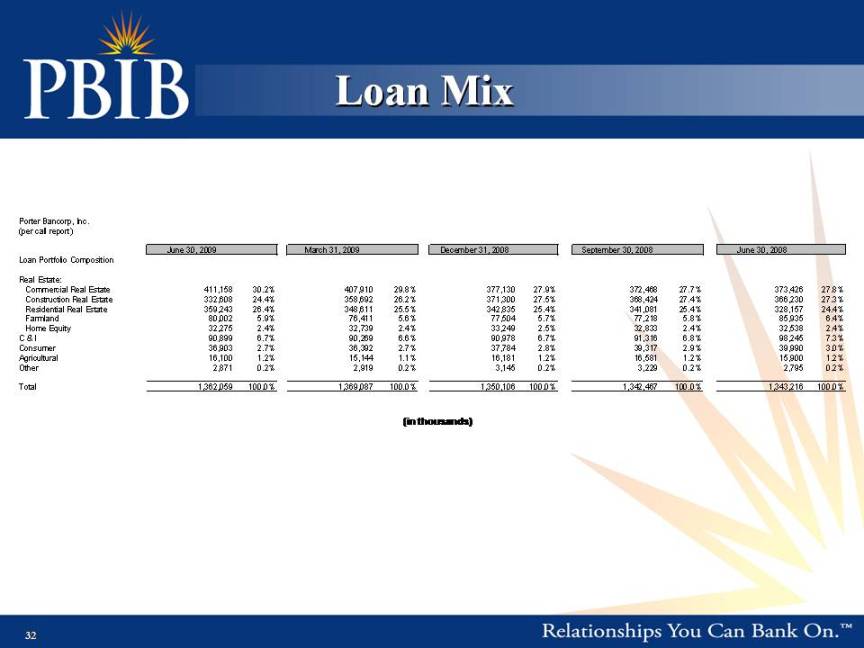
Loan Mix Porter Bancorp, Inc. (per call report) June 30, 2009 March 31, 2009 December 31, 2008 September 30, 2008 June 30, 2008 Loan Portfolio Composition Real Estate: Commercial Real Estate 411,158 30.2% 407,910 29.8% 377,130 27.9% 372,468 27.7% 373,426 27.8% Construction Real Estate 332,608 24.4% 358,692 26.2% 371,300 27.5% 368,424 27.4% 366,230 27.3% Residential Real Estate 359,243 26.4% 348,611 25.5% 342,835 25.4% 341,081 25.4% 328,157 24.4% Farmland 80,002 5.9% 76,411 5.6% 77,504 5.7% 77,218 5.8% 85,935 6.4% Home Equity 32,275 2.4% 32,739 2.4% 33,249 2.5% 32,833 2.4% 32,538 2.4% C & I 90,899 6.7% 90,269 6.6% 90,978 6.7% 91,316 6.8% 98,245 7.3% Consumer 36,903 2.7% 36,392 2.7% 37,784 2.8% 39,317 2.9% 39,990 3.0% Agricultural 16,100 1.2% 15,144 1.1% 16,181 1.2% 16,581 1.2% 15,900 1.2% Other 2,871 0.2% 2,919 0.2% 3,145 0.2% 3,229 0.2% 2,795 0.2% (in thousands) , , , , , Total 1,362,059 100.0% 1,369,087 100.0% 1,350,106 100.0% 1,342,467 100.0% 1,343,216 100.0% 32
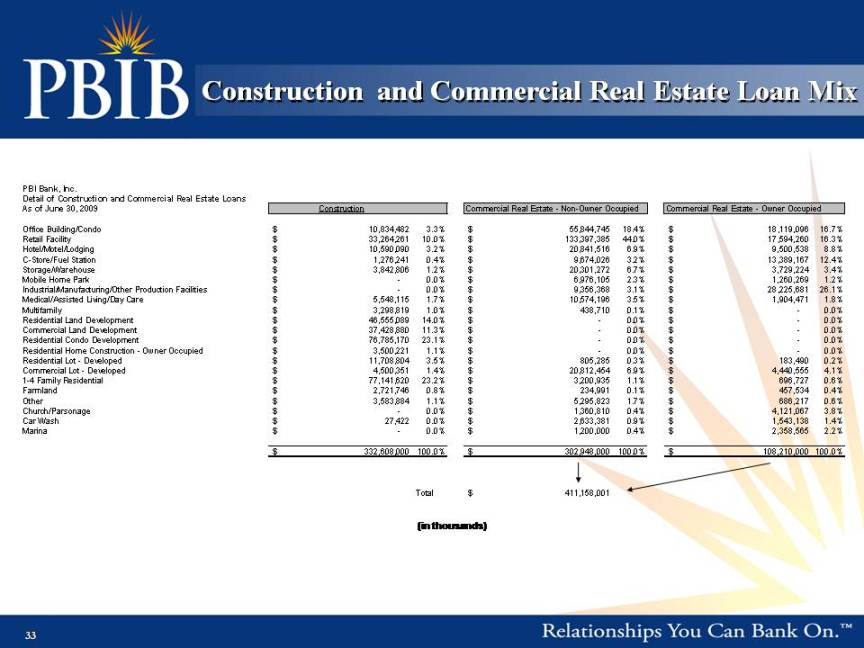
and Commercial Real Estate Loan Mix Construction PBI B k I Bank, Inc. Detail of Construction and Commercial Real Estate Loans As of June 30, 2009 Construction Commercial Real Estate - Non-Owner Occupied Commercial Real Estate - Owner Occupied Office Building/Condo 10,834,482 $ 3.3% 55,844,745 $ 18.4% 18,119,096 $ 16.7% Retail Facility 33,264,261 $ 10.0% 133,397,385 $ 44.0% 17,594,260 $ 16.3% Hotel/Motel/Lodging 10,590,090 $ 3.2% 20,841,516 $ 6.9% 9,500,538 $ 8.8% C-Store/Fuel Station 1,276,241 $ 0.4% 9,674,026 $ 3.2% 13,389,167 $ 12.4% Storage/Warehouse 3,842,806 $ 1.2% 20,301,272 $ 6.7% 3,729,224 $ 3.4% $ 0 0% 6 976 105 $ 2 3% 1 260 269 $ 1 2% Mobile Home Park - 0.0% 6,976,105 2.3% 1,260,269 1.2% Industrial/Manufacturing/Other Production Facilities - $ 0.0% 9,356,368 $ 3.1% 28,225,681 $ 26.1% Medical/Assisted Living/Day Care 5,548,115 $ 1.7% 10,574,196 $ 3.5% 1,904,471 $ 1.8% Multifamily 3,298,819 $ 1.0% 438,710 $ 0.1% - $ 0.0% Residential Land Development 46,555,089 $ 14.0% - $ 0.0% - $ 0.0% Commercial Land Development 37,428,880 $ 11.3% - $ 0.0% - $ 0.0% Residential Condo Development 76,785,170 $ 23.1% - $ 0.0% - $ 0.0% Residential Home Construction - Owner Occupied 3,500,221 $ 1.1% - $ 0.0% - $ 0.0% Residential Lot - Developed 11,708,804 $ 3.5% 805,285 $ 0.3% 183,490 $ 0.2% 4 500 351 $ 1 4% 20 812 454 $ 6 9% 4 440 555 $ 4 1% Commercial Lot - Developed 4,500,351 1.4% 20,812,454 6.9% 4,440,555 4.1% 1-4 Family Residential 77,141,620 $ 23.2% 3,200,935 $ 1.1% 696,727 $ 0.6% Farmland 2,721,746 $ 0.8% 234,991 $ 0.1% 457,534 $ 0.4% Other 3,583,884 $ 1.1% 5,295,823 $ 1.7% 686,217 $ 0.6% Church/Parsonage - $ 0.0% 1,360,810 $ 0.4% 4,121,067 $ 3.8% Car Wash 27,422 $ 0.0%