
NASDAQ: PBIB 1st Quarter 2010
Disclaimer This presentation contains forward-looking statements that involve risks and uncertainties. These forward-looking statements are based on management’s current expectations. Porter Bancorp’s actual results in future periods may differ materially from those currently expected due to various factors, including those risk factors described in documents that the Company files with the Securities and Exchange Commission, including the Company’s most recent Annual Report on Form 10-K and Quarterly Report on Form 10-Q. The forward-looking statements in this presentation are made as of the date of the presentation and Porter Bancorp does not assume any responsibility to update these statements.
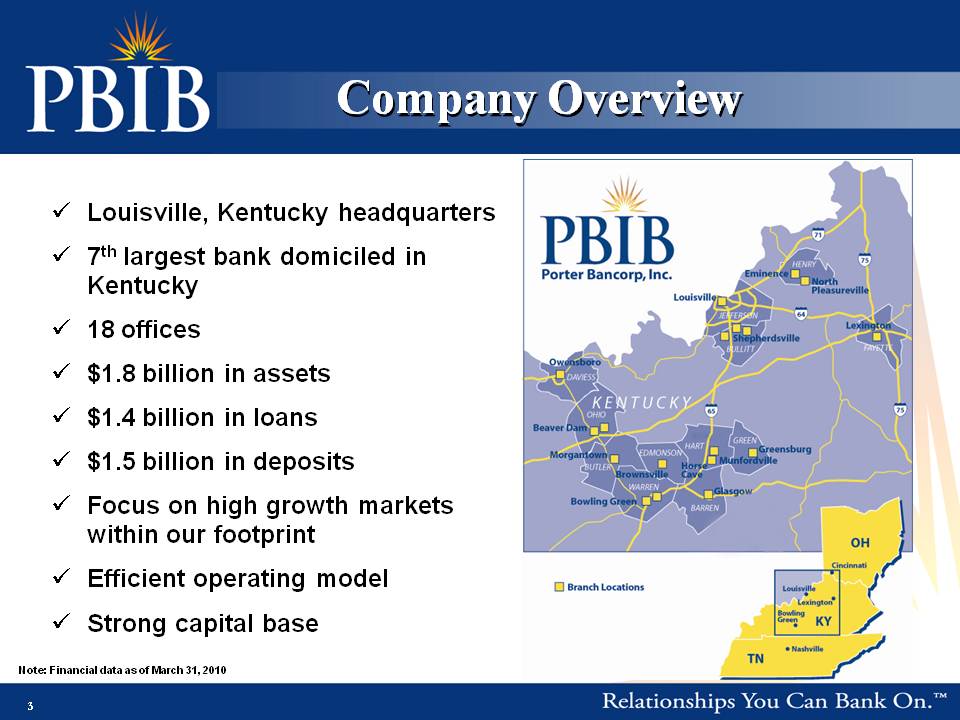
Company Overview Louisville, Kentucky headquarters 7th largest bank domiciled in Kentucky 18 offices $1.8 billion in assets $1.4 billion in loans $1.5 billion in deposits Focus on high growth markets within our footprint Efficient operating model Strong capital base Note: Financial data as of March 31, 2010
Market Overview Louisville and Bullitt County Largest city in Kentucky and 16th largest city in U.S. Above average growth rates for economy and jobs Large employers include UPS, GE, Humana, YUM! Brands, Ford UPS hub continues to attract distribution companies – Best Buy (“Geek Squad”), Gordon Foods, Johnson & Johnson, Zappos Home of University of Louisville Owensboro/Daviess County 3rd largest city in Kentucky Industrial, medical, retail and cultural hub for Western Kentucky Large employers include Owensboro Medical Health System, Texas Gas, and Toyotetsu Home of two four-year liberal arts colleges (Brescia University and Kentucky Wesleyan College) Lexington/Fayette County 2nd largest city in Kentucky – attractive growth market Financial, educational, retail, healthcare and cultural hub for Central and Eastern Kentucky “Horse Capital of the World” – host to the World Equestrian Games in 2010 Large employers include Toyota, Lexmark, IBM Global Services and Valvoline Home of University of Kentucky Southern/Central Kentucky Includes Bowling Green (Warren County), the 4th largest city in Kentucky, and Barren, Ohio, Hart, Edmonson, Butler & Green counties Attractive community and growth markets – stable source of deposits and loans PBIB’s main back-office operations hub Major employers include GM (Corvette), RR Donnelley and FedEx Agricultural and service based economy Home of Western Kentucky University
Franchise History Porter Bancorp organized with merger of 3 banks 1988 – 1999 Porter Bancorp acquires 3 banks Ascencia Bank established 1999 – 2005 Porter Bancorp acquires 2 banks Porter Bancorp consolidates all subsidiary banks under PBI Bank name on December 31, 2005 Porter Bancorp IPO completed on September 22, 2006 Porter Bancorp acquires Kentucky Trust Bank with 6 offices in Southern Kentucky on October 1, 2007 Porter Bancorp acquires Paramount Bank in Lexington, KY on February 1, 2008

Financial Highlights
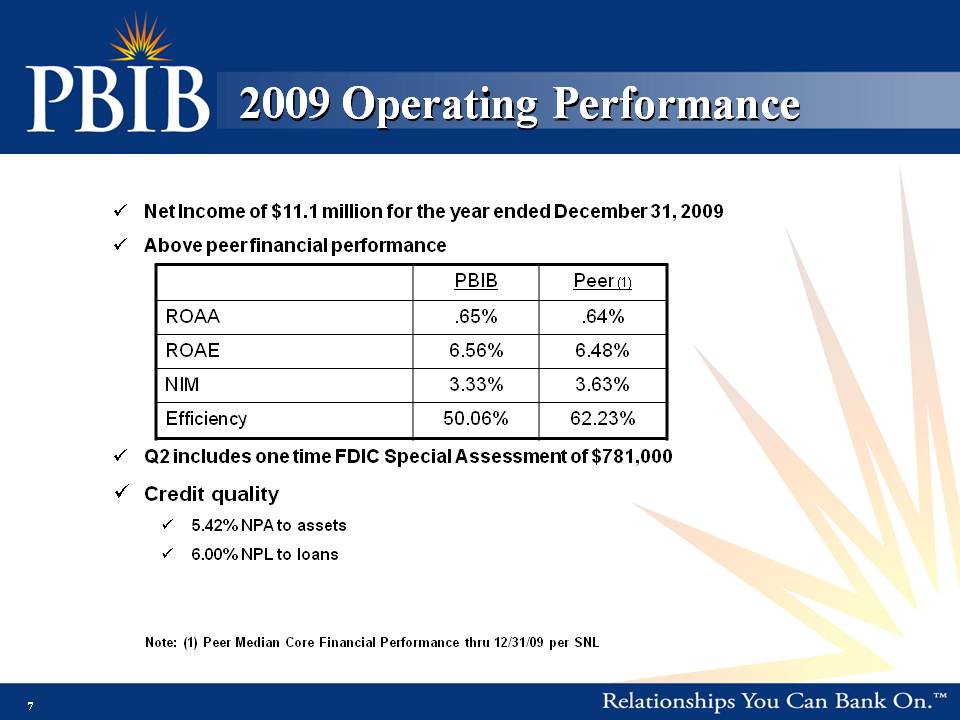
2009 Operating Performance Net Income of $11.1 million for the year ended December 31, 2009Above peer financial performance Q2 includes one time FDIC Special Assessment of $781,000Credit quality 5.42% NPA to assets 6.00% NPL to loans Note: (1) Peer Median Core Financial Performance thru 12/31/09 per SNL
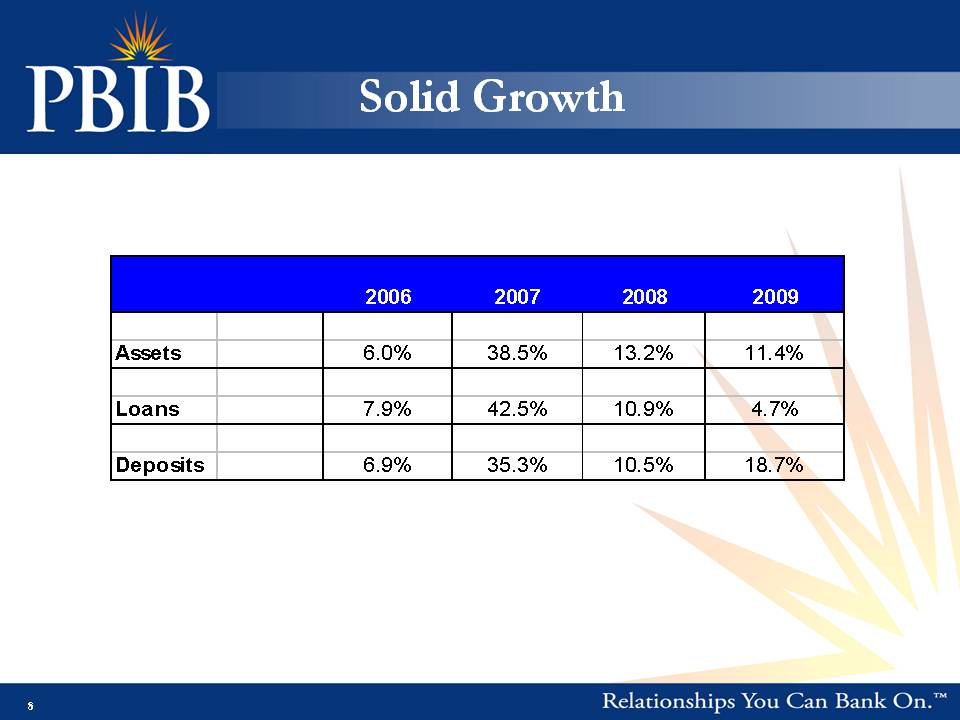
Solid Growth
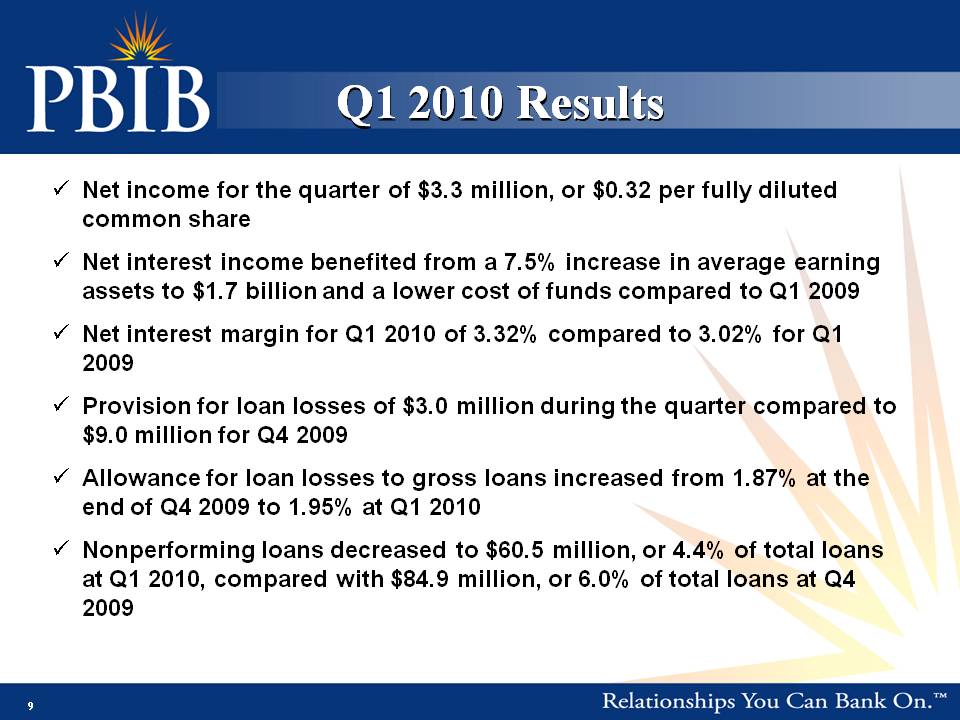
Q1 2010 Results Net income for the quarter of $3.3 million, or $0.32 per fully diluted common share Net interest income benefited from a 7.5% increase in average earning assets to $1.7 billion and a lower cost of funds compared to Q1 2009 Net interest margin for Q1 2010 of 3.32% compared to 3.02% for Q1 2009 Provision for loan losses of $3.0 million during the quarter compared to $9.0 million for Q4 2009Allowance for loan losses to gross loans increased from 1.87% at the end of Q4 2009 to 1.95% at Q1 2010 Nonperforming loans decreased to $60.5 million, or 4.4% of total loans at Q1 2010, compared with $84.9 million, or 6.0% of total loans at Q4 2009
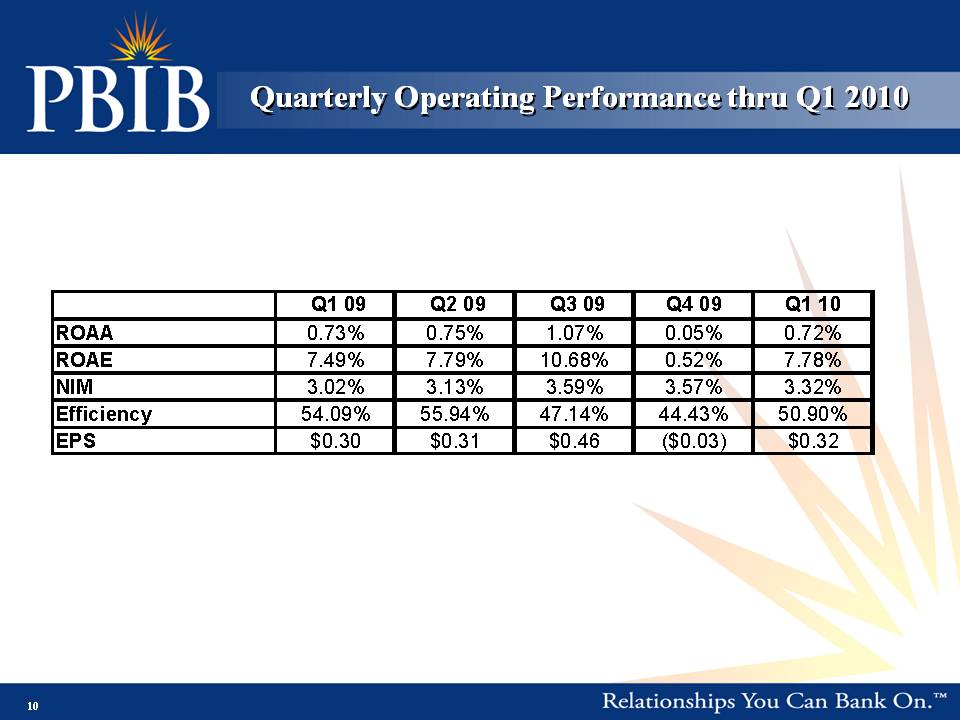
Quarterly Operating Performance thru Q1 2010
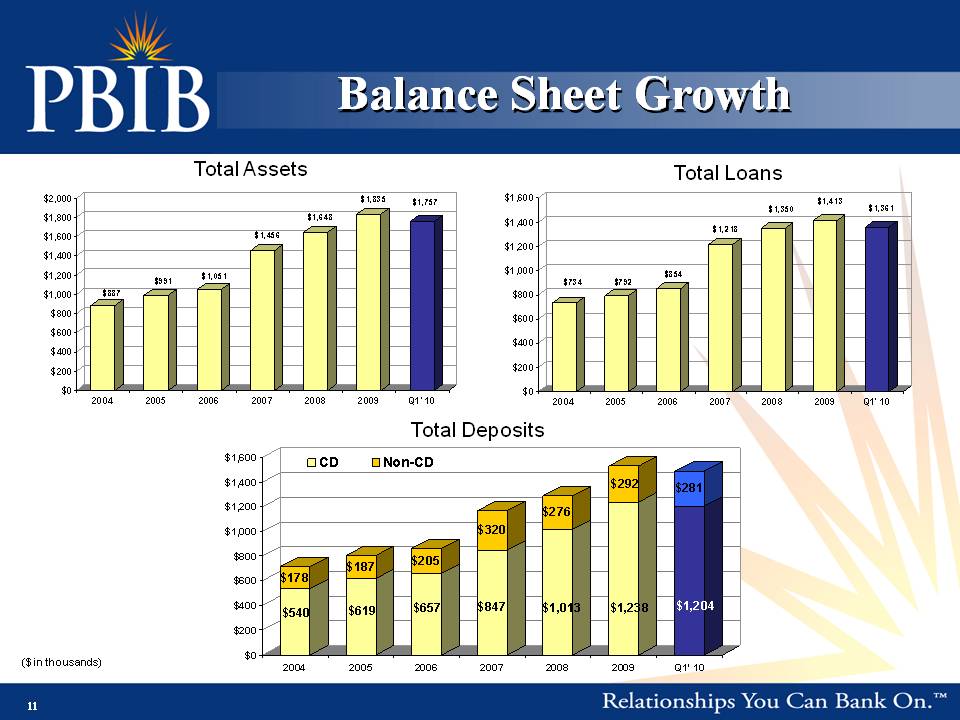
Balance Sheet Growth Total Assets Total Loans Total Deposits ($ in thousands)
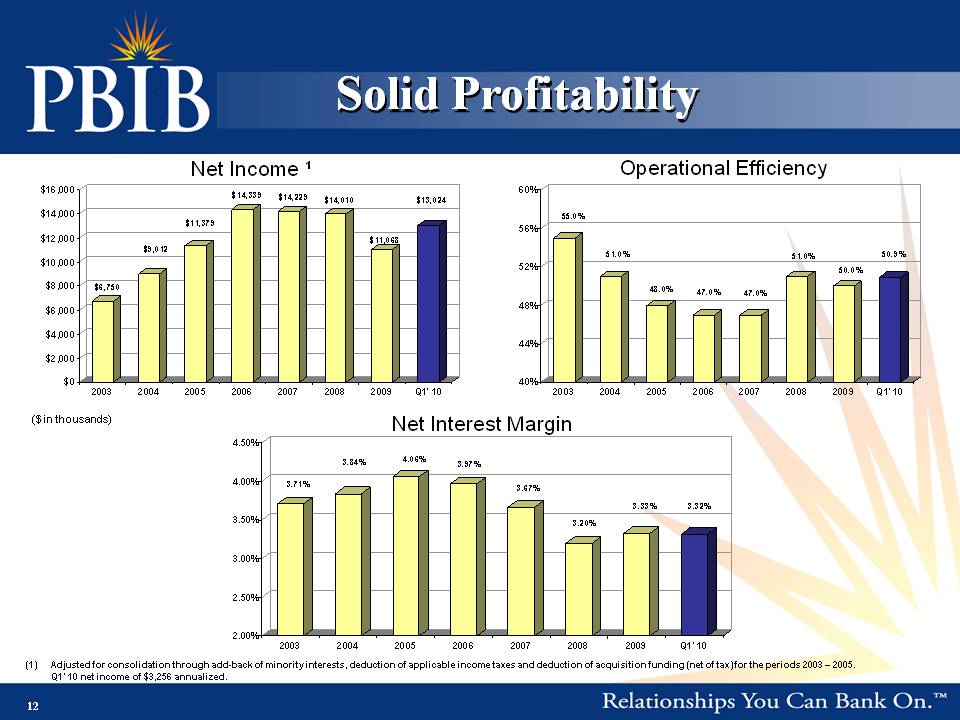
Solid Profitability Adjusted for consolidation through add-back of minority interests, deduction of applicable income taxes and deduction of acquisition funding (net of tax) for the periods 2003 – 2005. Q1’ 10 net income of $3,256 annualized. ($ in thousands) Net Income Operational Efficiency Net Interest Margin
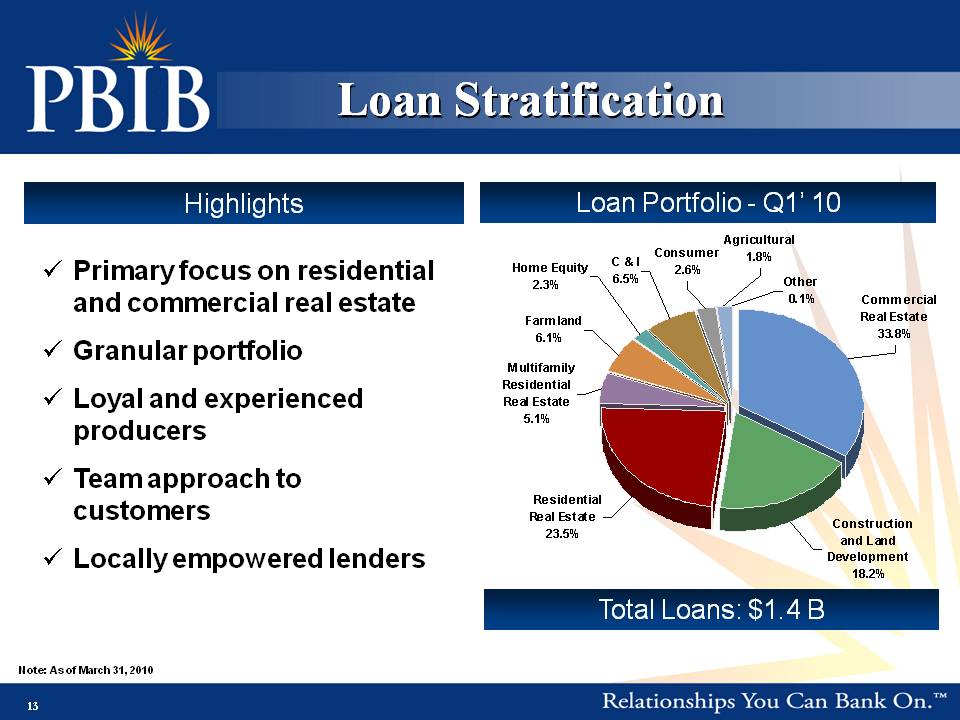
Primary focus on residential and commercial real estate Granular portfolio Loyal and experienced producers Team approach to customers Locally empowered lenders Loan Portfolio - Q1’ 10 Total Loans: $1.4 B Loan Stratification Highlights Note: As of March 31, 2010
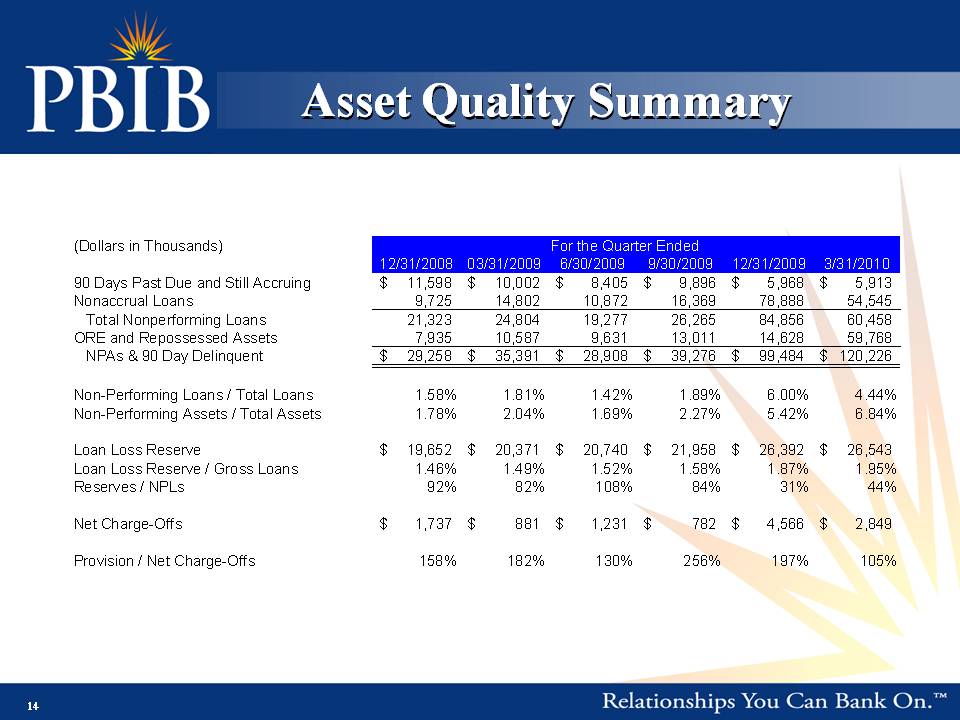
Asset Quality Summary
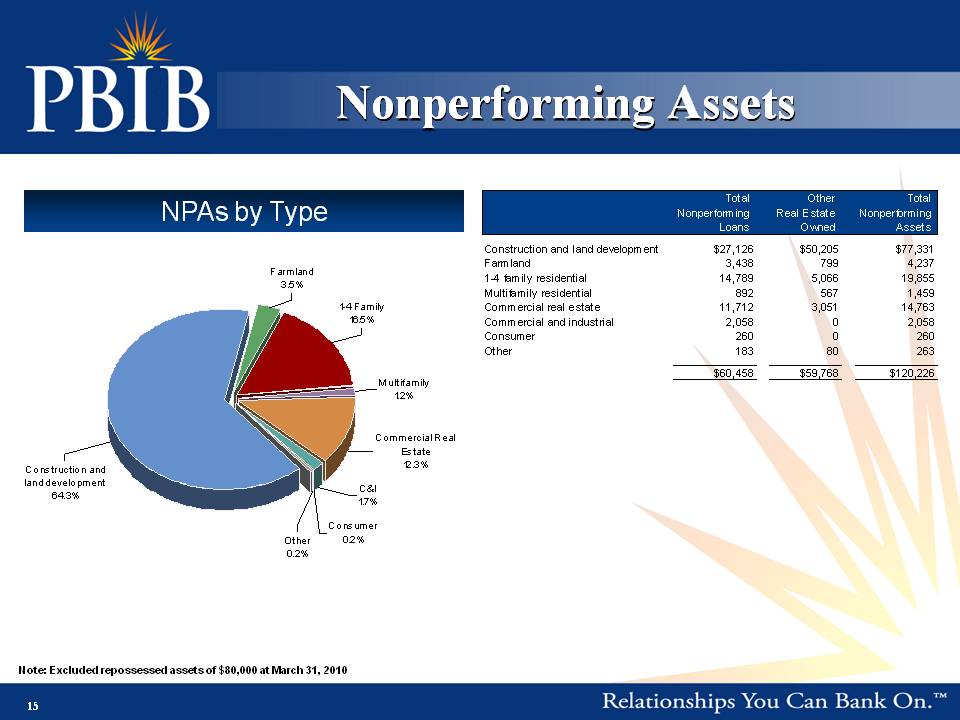
Nonperforming Assets NPAs by Type Note: Excluded repossessed assets of $80,000 at March 31, 2010
Proactive Approach to Credit Enhanced/reorganized credit analysis division with additional staffing; experienced senior credit analyst/underwriters Hired workout specialist and established real estate division to aggressively reduce NPA’s Emphasis on careful review of project viability and gaining control of collateral by working with borrowers Essential problem solving as it helps to avoid the lagging legal system Protects equity in the property PBIB is a motivated seller with buyer programs available, does not rely on builder profit Continue to operate only in existing markets where the lending landscape is well understood Focused on reducing construction and development lending Successful disposal of approximately $18 million in NPA/OREO in Q1 Evidence of progress – lots of traffic at projects; 23% increase in home sales (March 2010); 17% increase in building permits (Feb 2010); median home price up 9% (March 2010)
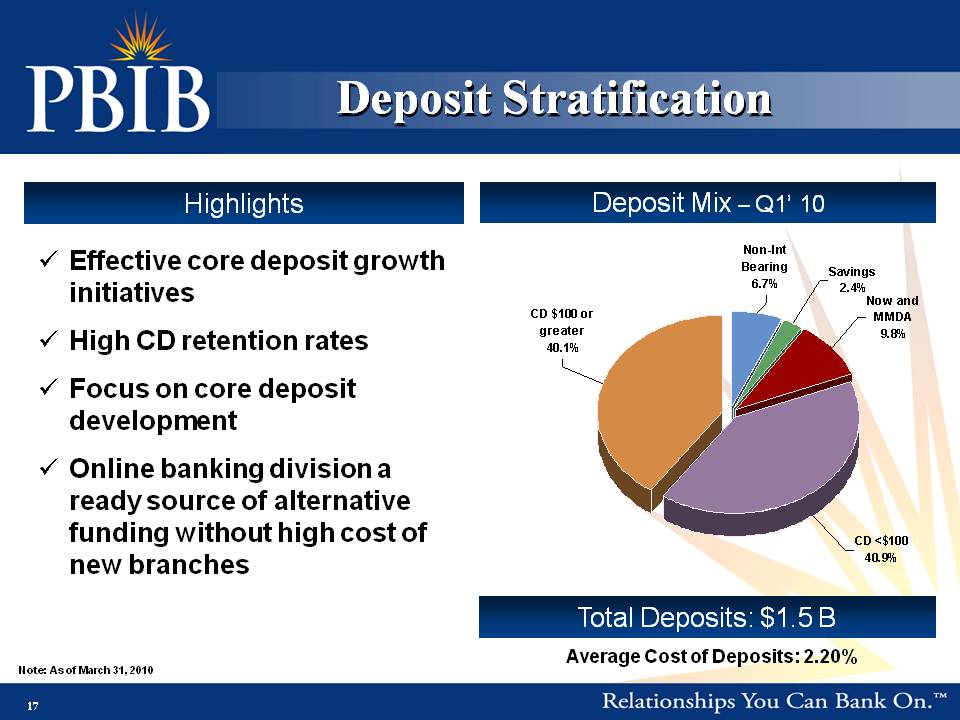
Deposit Mix – Q1’ 10 Total Deposits: $1.5 B Effective core deposit growth initiativesHigh CD retention rates Focus on core deposit development Online banking division a ready source of alternative funding without high cost of new branches Deposit Stratification Highlights Note: As of March 31, 2010 Average Cost of Deposits: 2.20%
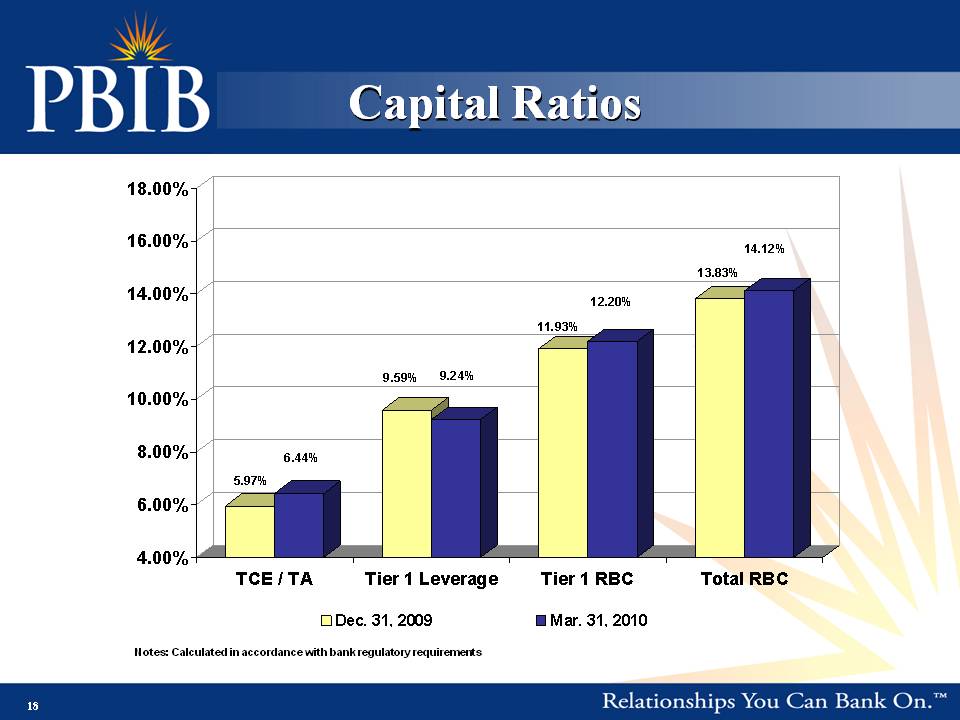
Capital Ratios Notes: Calculated in accordance with bank regulatory requirements
Investment Highlights
2010 Key Strategic Initiatives Client-driven service that consistently provides better value Rational risk taking in challenging environment Maintain focus on credit quality Earnings growth Consistent, superior operational efficiency Targeted and disciplined investments for the future
Growth Strategy Increase market share of existing franchise – managed growth Expand core deposit development initiatives and non-interest income improvement strategies Continue long-term strategy of considering M&A opportunities that arise Remain disciplined and focused Accretive to earnings in first full year Markets with high growth potential Strong management team compatible with our culture
Addendum
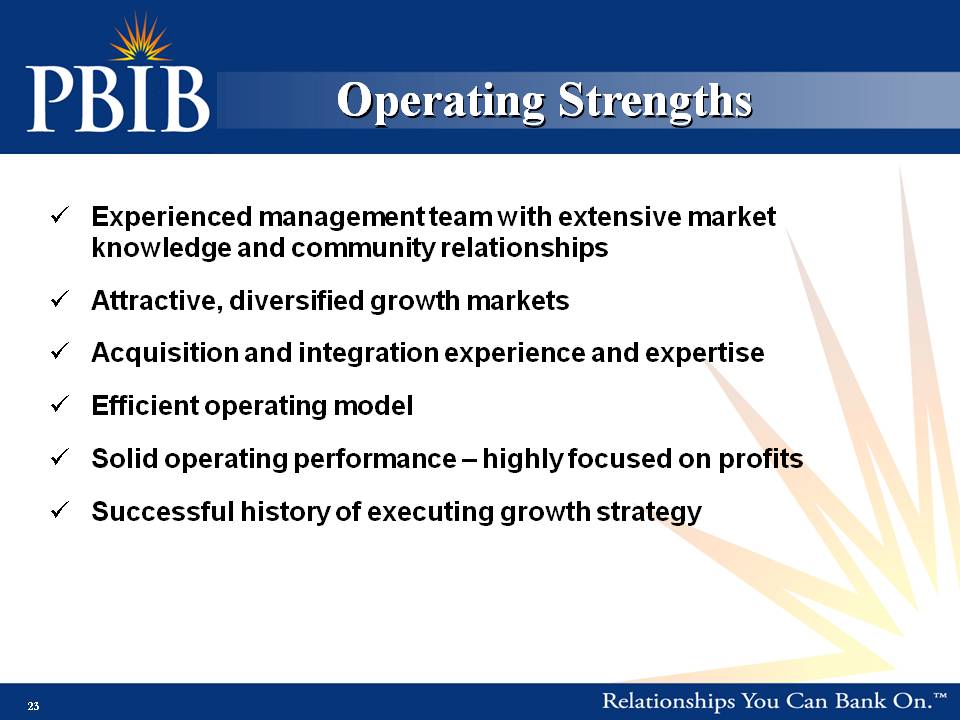
Experienced management team with extensive market knowledge and community relationships Attractive, diversified growth markets Acquisition and integration experience and expertise Efficient operating model Solid operating performance – highly focused on profits Successful history of executing growth strategy Operating Strengths
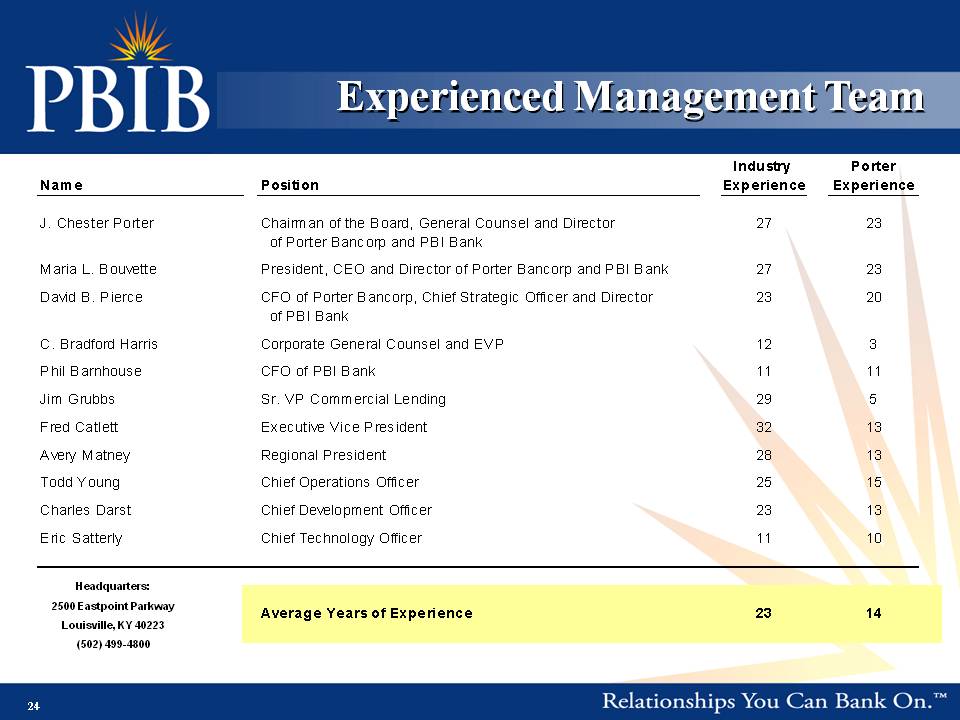
Experienced Management Team Headquarters: 2500 Eastpoint Parkway Louisville, KY 40223(502) 499-4800
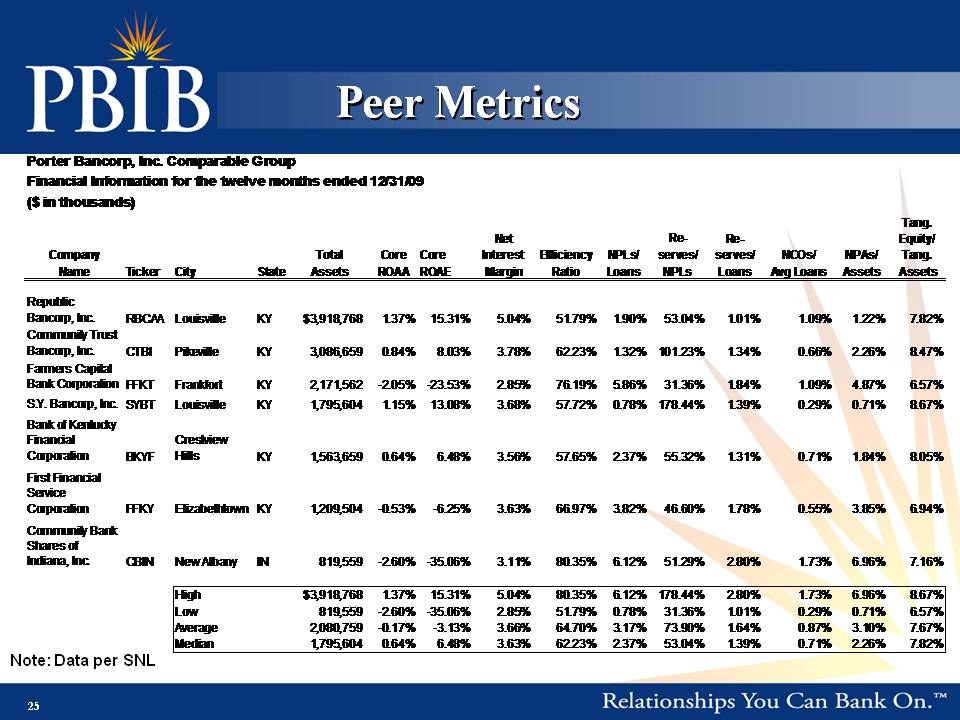
Peer Metrics Note: Data per SNL
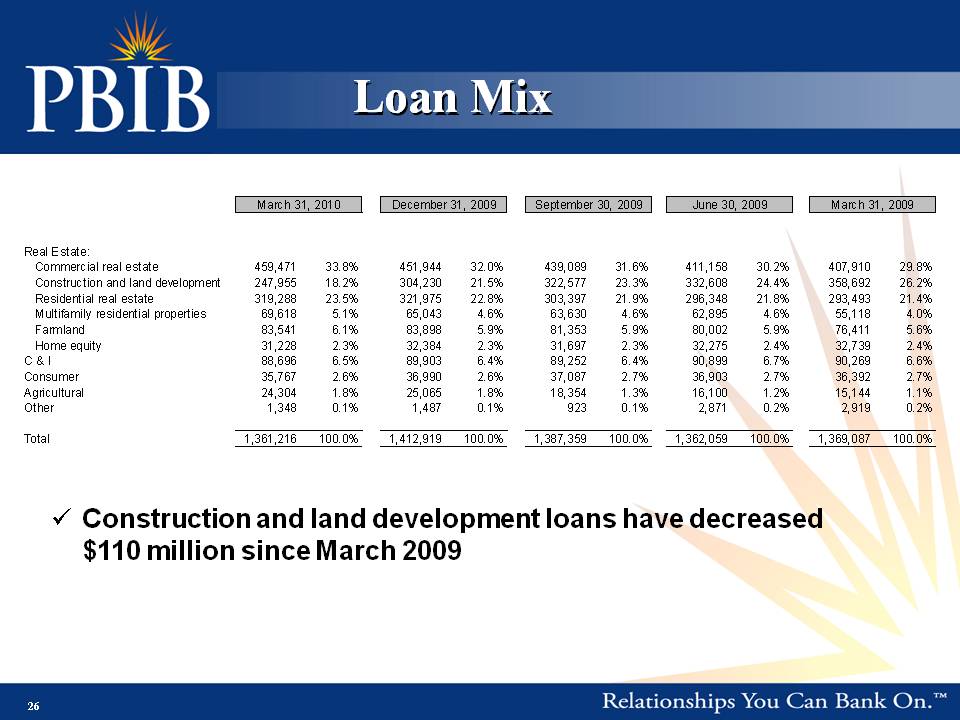
Loan Mix Construction and land development loans have decreased $110 million since March 2009
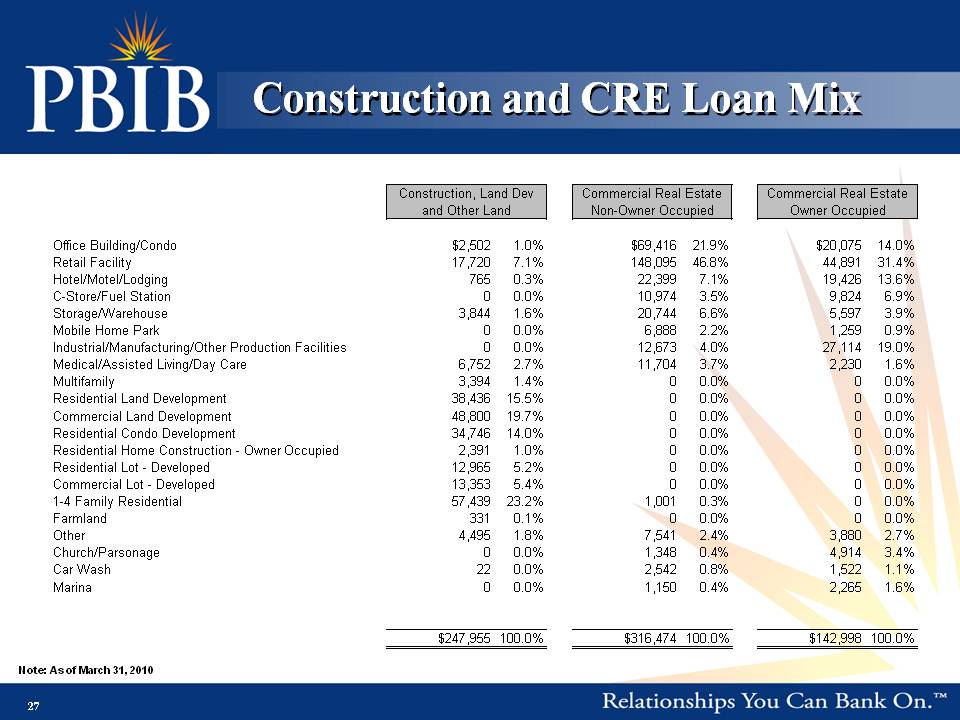
Construction and CRE Loan Mix Note: As of March 31, 2010