Exhibit 99.2
NASDAQ NASDAQ: PBIB 2nd Quarter 2010 1
Disclaimer This presentation contains forward-looking statements that p g involve risks and uncertainties. These forward-looking statements are based on management’s current expectations. Porter Bancorp’s periods Bancorp s actual results in future may differ materially from those currently expected due to various factors, including those risk factors described in documents that the Company files with the Securities and Exchange Commission, including the Company’s most recent Annual Report on Form 10-K and Quarterly Report on Form 10-Q. The forward-looking y p g statements in this presentation are made as of the date of the presentation and Porter Bancorp does not assume any responsibility to update these statements. 2

Company Overview .. Louisville, Kentucky headquarters .. 7th largest bank domiciled in Kentucky .. 18 offices .. $1.8 billion in assets .. $1 3 billion 1.3 billion in loans .. $1.4 billion in deposits .. Operates in attractive, diversified growth markets .. Capital strength Note: Financial data as of June 30, 2010 3
Company Overview/Strategy .. Through de novo growth and strategic acquisitions, has expanded its footprint to the 4 largest Kentucky markets – the fastest growing segments of the state .. Experienced management team with extensive market knowledge and p g g community relationships .. Acquisition and integration experience and expertise .. Efficient operating model .. Solid operating performance – highly focused on profits .. Successful history of executing growth strategy .. – positioned to withstand current Proactive offensive capital raise well economic cycle and prospectively benefit from opportunities created during this cycle 4
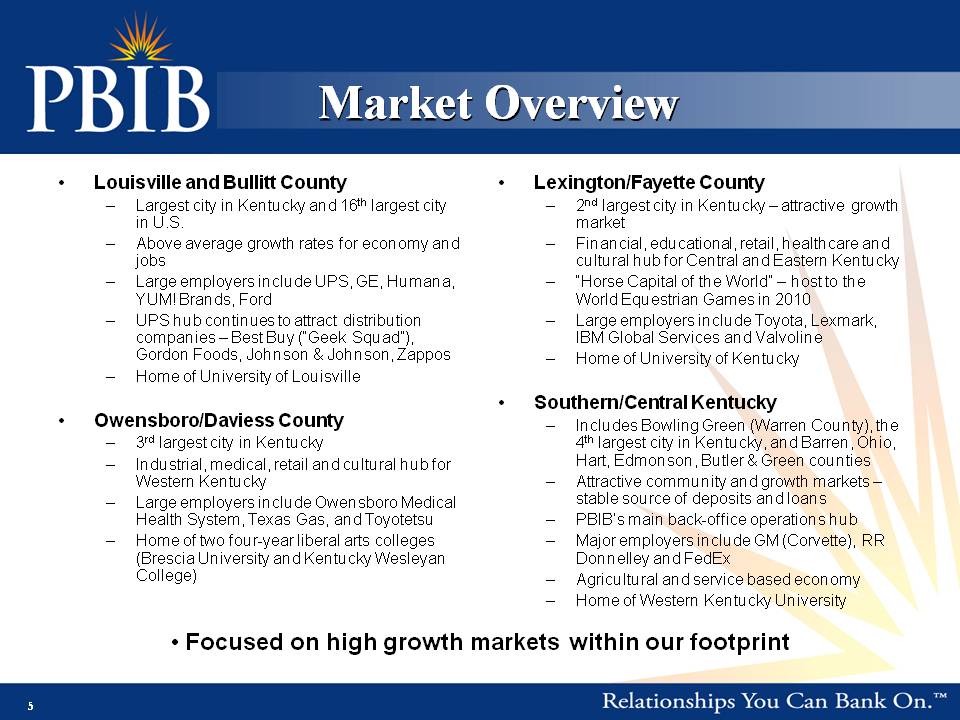
Market Overview Louisville and Bullitt County Largest largest Lexington/Fayette County 2nd largest in attractive – city in Kentucky and 16th city in U.S. – Above average growth rates for economy and jobs – Large employers include UPS, GE, Humana, YUM! Brands, Ford – city Kentucky – growth market – Financial, educational, retail, healthcare and cultural hub for Central and Eastern Kentucky – “Horse Capital of the World” – host to the World Equestrian Games in 2010 – UPS hub continues to attract distribution companies – Best Buy (“Geek Squad”), Gordon Foods, Joh nson & Johnson, Zappos – Home of University of Louisville – Large employers include Toyota, Lexmark, IBM Global Services and Valvoline – Home of University of Kentucky Southern/Central Kentucky Owensboro/Daviess County – 3rd largest city in Kentucky – Industrial, medical, retail and cultural hub for Western Kentucky – Large employers include Owensboro Medical – Includes Bowling Green (Warren County), the 4th largest city in Kentucky, and Barren, Ohio, Hart, Edmonson, Butler & Green counties – Attractive community and growth markets – stable source of deposits and loans PBIB’ Health System, Texas Gas, and Toyotetsu – Home of two four-year liberal arts colleges (Brescia University and Kentucky Wesleyan College) � 60;– PBIB’s main back-office operations hub – Major employers include GM (Corvette), RR Donnelley and FedEx – Agricultural and service based economy – Home of Western Kentucky University Focused on high growth markets within our footprint 5

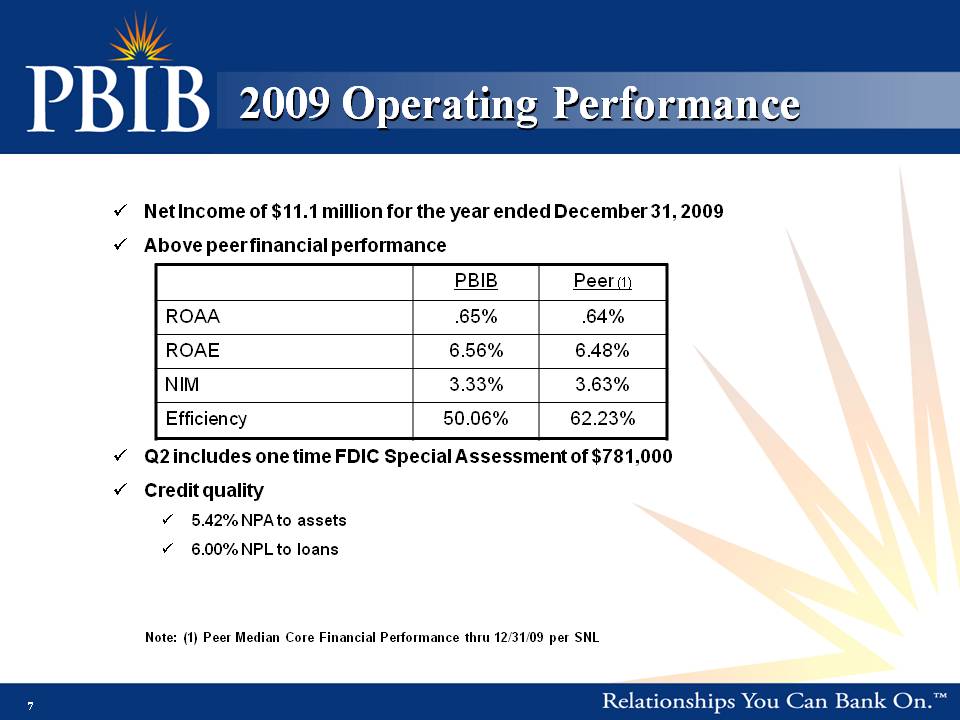
2009 Operating Performance Net Income of $11.1 million for the year ended December 31, 2009.. Above peer financial performance PBIB Peer (1) ROAA .65% .64% ROAE 6.56% 6.48% NIM 3.33% 3.63% .. Q2 includes one time FDIC Special Assessment of $781,000 .. Credit quality .. Efficiency 50.06% 62.23% 5.42% NPA to assets .. 6.00% NPL to loans Note: (1) Peer Median Core Financial Performance thru 12/31/09 per SNL 7
Solid Historical Growth 2006 2007 2008 2009 Assets 6.0% 38.5% 13.2% 11.4% Loans 7 9% 42 5% 10 9% 4 7% 7.9% 42.5% 10.9% 4.7% Deposits 6.9% 35.3% 10.5% 18.7% 8

Results Q2 2010 .. Net loss for the quarter of $.8 million; ($0.15) per fully diluted common share .. Net interest margin for Q2 2010 of 3.71% compared to 3.13% for Q2 2009 .. Provision for loan losses of $6.6 million during the quarter; writedowns of OREO of $3.4 million .. Efficiency ratio of 69.1% in Q2 2010 compared to 50.90% for Q1 2010; our Q2 2010 ratio increased from 48.7% to 69.1% as a result of $3.4 million in OREO write-downs .. Allowance for loan losses to gross loans increased from 1.95% at the end of Q1 2010 to 2.01% at Q2 2010 .. Nonperforming loans decreased 19.5 % to $48.7 million, or 3.64% of total loans at Q2 2010, compared with $60.5 million, or 4.44% of total loans at Q1 2010 .. Nonperf orming assets decreased 2.5 % to $117.2 million, or 6.65% of total assets at Q2 2010, compared with $120.2 million, or 6.84% of total assets at Q1 2010 .. Successful completion of a $27 million private stock offering 9
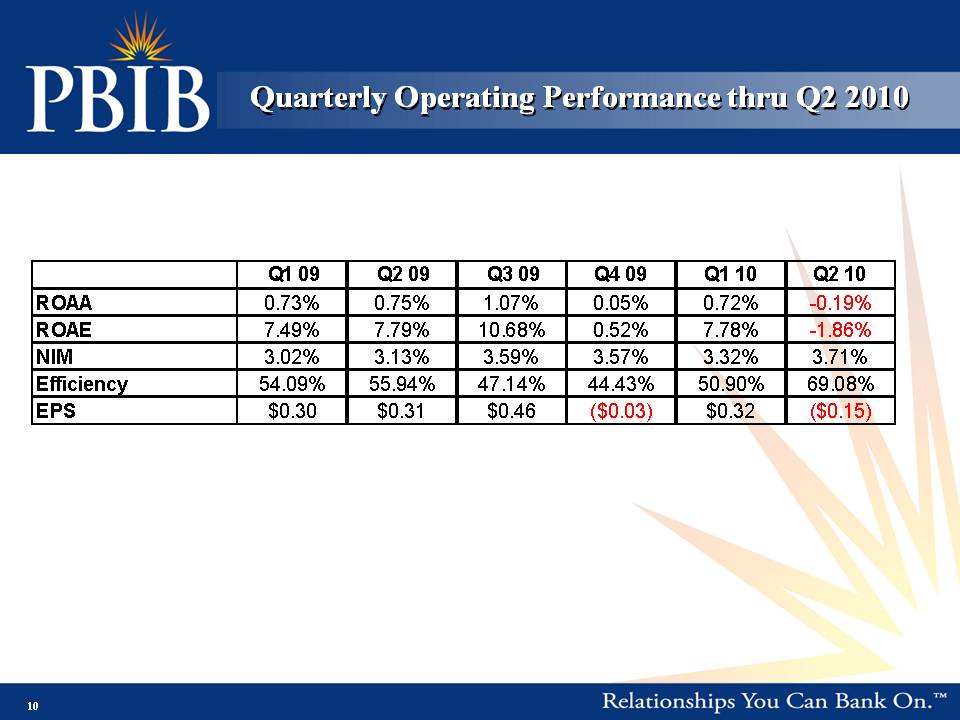
Operating Quarterly Performance thru Q2 2010 Q1 09 Q2 09 Q3 09 Q4 09 Q1 10 Q2 10 ROAA 0.73% 0.75% 1.07% 0.05% 0.72% -0.19% ROAE 7.49% 7.79% 10.68% 0.52% 7.78% -1.86% NIM 3.02% 3.13% 3.59% 3.57% 3.32% 3.71% Efficiency 54.09% 55.94% 47.14% 44.43% 50.90% 69.08% EPS $0 30 $0 31 $0 46 ($0 03) $0 32 ($0 15) 0.30 0.31 0.46 0.03) 0.32 0.15) 10
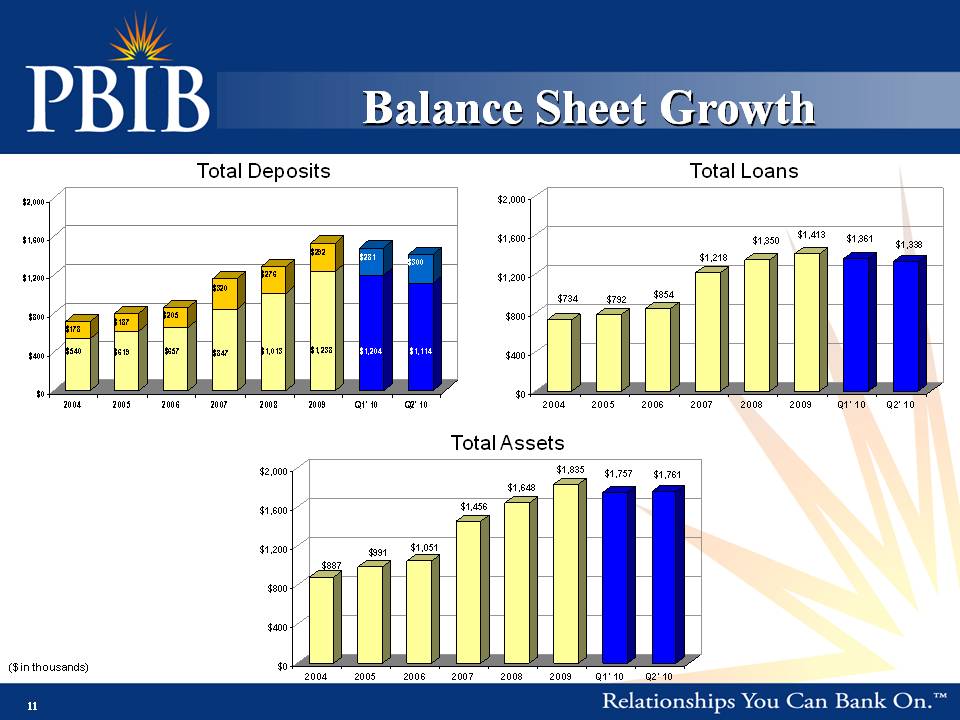
Sheet $2,000 Growth Balance Total Deposits $2,000 Total Loans $320 $276 $292 $281 $300 $1,200 $1,600 $734 $792 $854 $1,218 $1,350 $1,413 $1,361 $1,338 $1,200 $1,600 $540 $178 $619 $187 $657 $205 $847 $1,013 $1,238 $1,204 $1,114 $0 $400 $800 2004 2005 2006 2007 2008 2009 Q1' 10 Q2' 10 $0 $400 $800 2004 2005 2006 2007 2008 2009 Q1' 10 Q2' 10 $1,456 $1,648 $1,835 $1,757 $1,761 $1,600 $2,000 Total Assets $887 $991 $1,05 1 $800 $1,200 , 11
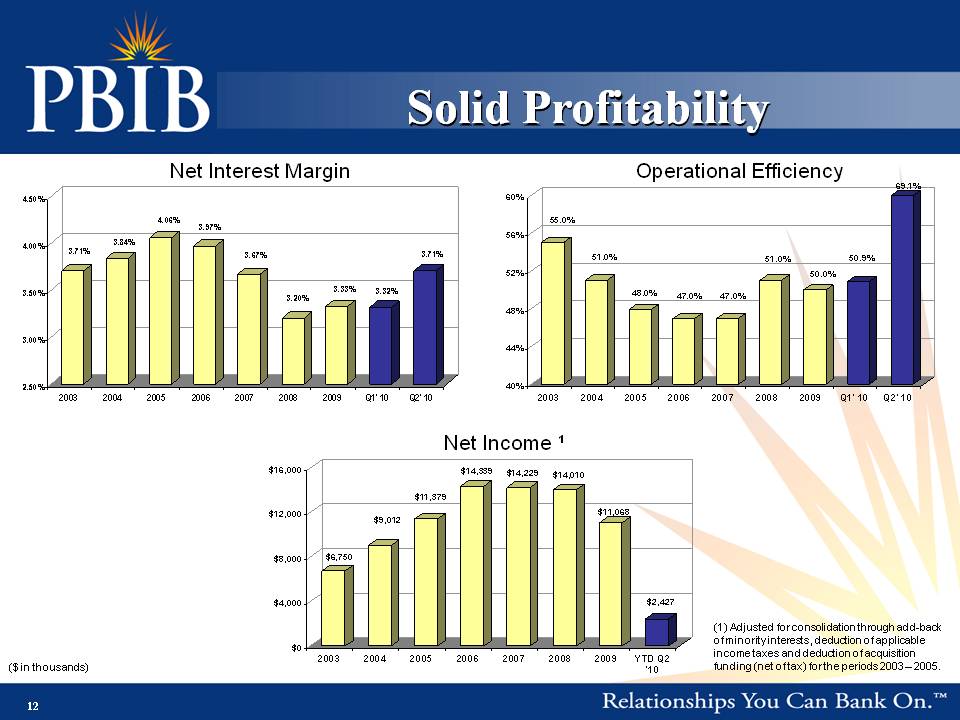
$0 $400 2004 2005 2006 2007 2008 2009 Q1' 10 Q2' 10 ($ in thousands) Solid Profitability Operational Efficiency 69.1% 60% Net Interest Margin 4.50% 55.0% 51.0% 48.0% 47.0% 47.0% 51.0% 50.0% 50.9% 48% 52% 56% 3.71% 3.84% 4.06% 3.97% 3.67% 3.20% 3.33% 3.32% 3.71% 3.50% 4.00% 40% 44% 2003 2004 2005 2006 2007 2008 2009 Q1' 10 Q2' 10 2.50% 3.00% 2003 2004 2005 2006 2007 2008 2009 Q1' 10 Q2' 10 Net Income ¹ $11,379 $14,339 $14, 229 $14,010 $11 068 $12 000 $16,000 $6,750 $9,012 11,068 $2,427 $4,000 $8,000 12,000 12 ($ in thousands) $0 2003 2004 2005 2006 2007 2008 2009 YTD Q2 '10 (1) Adjusted for consolidation through add-back of minority interests, deduction of applicable income taxes and deduction of acquisition funding (net of tax) for the periods 2003 – 2005.
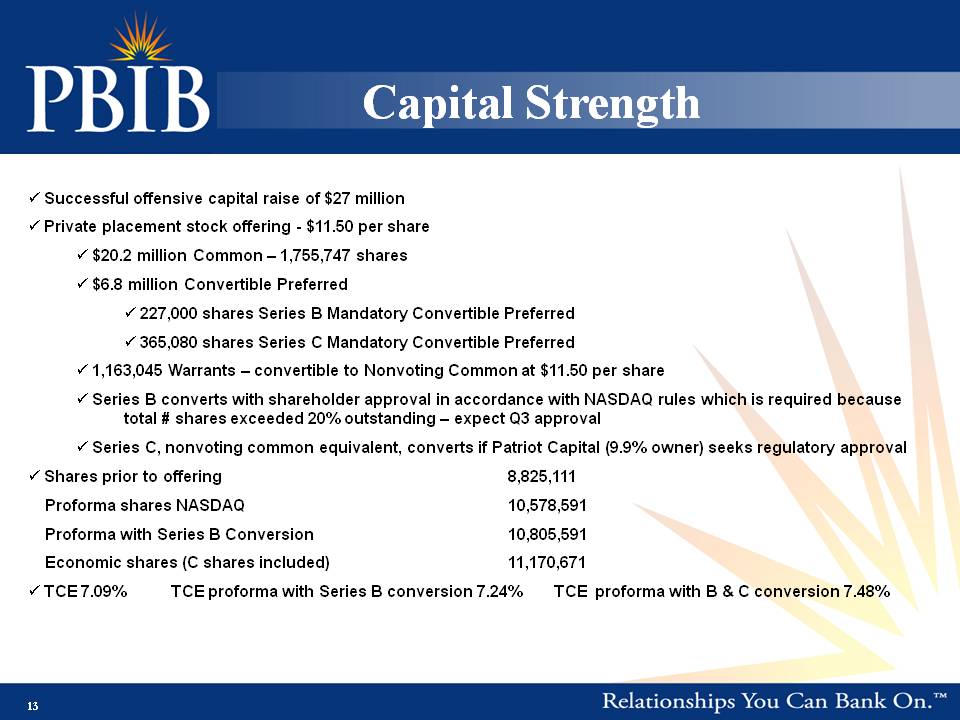
Capital Strength .. Successful offensive capital raise of $27 million p .. Private placement stock offering - $11.50 per share .. $20.2 million Common – 1,755,747 shares .. $6.8 million Convertible Preferred .. 227 000 227,000 shares Series Mandatory Convertible Preferred .. 365,080 shares Series C Mandatory Convertible Preferred .. 1,163,045 Warrants – convertible to Nonvoting Common at $11.50 per share .. Series B converts with shareholder approval in accordance with NASDAQ rules which is required because total # shares exceeded 20% outstanding – expect Q3 approval .. Series C, nonvoting common equivalent, converts if Patriot Capital (9.9% owner) seeks regulatory approval .. Shares prior to offering 8,825,111 Proforma shares NASDAQ 10,578,591 Proforma with Series B Conversion 10,805,591 Economic shares (C shares included) 11,170,671 .. TCE 7.09% TCE proforma with Series B conversion 7.24% TCE proforma with B & C conversion 7.48% 13

Capital Ratios 18.00% 14.00% 13.83% 15.93% 14.00% 16.00% 9.59% 11.11% 11.93% 10.00% 12.00% 5.97% 7.09% 6.00% 8.00% 4.00% TCE / TA Tier 1 Leverage Tier 1 RBC Total RBC D 31 J 30 14 Notes: Calculated in accordance with bank regulatory requirements Dec. 31, 2009 June 30, 2010 Loan – Q2’ 10
Loan Stratification Highlights .. Primary focus on residential and commercial real Portfolio Q2 Other 0.1% Agricultural 1.8% C & I 6.5% Commercial Consumer 2.6% Home Equity 2.3% estate .. Granular portfolio .. Loyal and experienced Farmland 6.3% Real Estate 34.5% Multifamily Residential Real y p producers .. Team approach to customers Estate 5.2% Residential .. Locally empowered lenders Real Estate 23.9% Construction and Land Development 16.7% 15 Total Lo ans: $1.3 B Note: As of June 30, 2010
Asset Quality .. Negatively impacted by C&D portfolio g y p y p .. Substantially increased reserves .. Successful reduction of CRE concentrations .. Aggressive management of NPL/NPA .. Proactive approach to credit .. Critical review of loan portfolio valuations (new appraisals or internal analysis) focusing on C&D, OREO, and classified credits , .. Evidence of progress 16
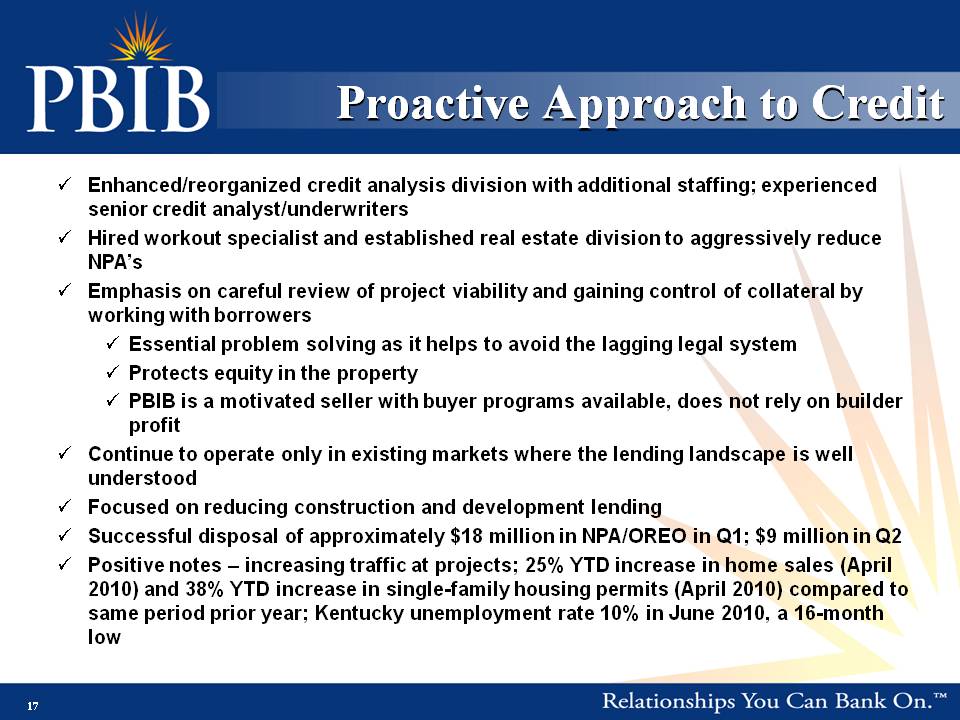
Proactive Approach to Credit Enhanced/reorganized credit analysis division with additional staffing; experienced i dit l t/ d it senior credit analyst/underwriters .. Hired workout specialist and established real estate division to aggressively reduce NPA’s .. Emphasis on careful review of project viability and gaining control of collateral by ki i h b working with borrowers .. Essential problem solving as it helps to avoid the lagging legal system .. Protects equity in the property .. PBIB is a motivated seller with buyer programs available, does not rely on builder y p g , y profit .. Continue to operate only in existing markets where the lending landscape is well understood .. construction and development lending Focused on reducing .. Successful disposal of approximately $18 million in NPA/OREO in Q1; $9 million in Q2 .. Positive notes – increasing traffic at projects; 25% YTD increase in home sales (April 2010) and 38% YTD increase in single-family housing permits (April 2010) compared to same period prior year; Kentucky unemployment rate 10% in 2010 16-month June 2010, a 16 month low 17
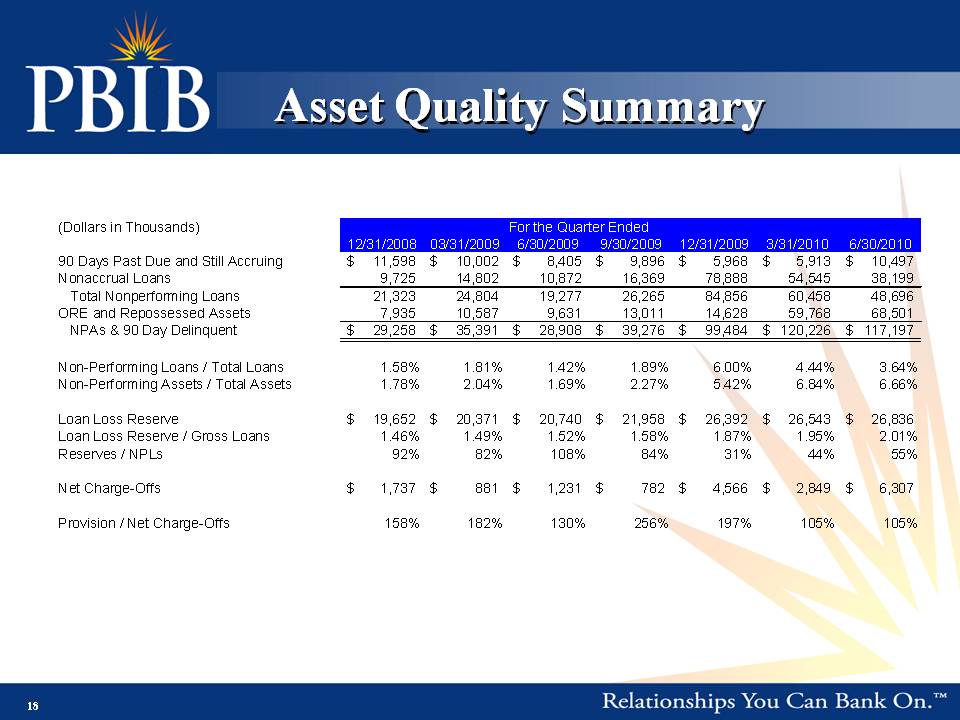
Asset Quality Summary (Dollars in Thousands) For the Quarter Ended 12/31/2008 03/31/2009 6/30/2009 9/30/2009 12/31/2009 3/31/2010 6/30/2010 90 Days Past Due and Still Accruing 11,598 $ 10,002 $ 8,405 $ 9,896 $ 5,968 $ 5,913 $ 10,497 $ Nonaccrual Loans 9,725 14,802 10,872 16,369 78,888 54,545 38,199 Total Nonperforming Loans 21,323 24,804 19,277 26,265 84,856 60,458 48,696 ORE d R d A t 7 935 10 587 9 631 13 011 14 628 59 768 68 501 and Repossessed Assets 7,935 10,587 9,631 13,011 14,628 59,768 68,501 NPAs & 90 Day Delinquent 29,258 $ 35,391 $ 28,908 $ 39,276 $ 99,484 $ 120,226 $ 117,197 $ Non-Performing Loans / Total Loans 1.58% 1.81% 1.42% 1.89% 6.00% 4.44% 3.64% Non-Performing Assets / Total Assets 1.78% 2.04% 1.69% 2.27% 5.42% 6.84% 6.66% Loan Loss Reserve 19,652 $ 20,371 $ 20,740 $ 21,958 $ 26,392 $ 26,543 $ 26,836 $ Loan Loss Reserve / Gross Loans 1.46% 1.49% 1.52% 1.58% 1.87% 1.95% 2.01% Reserves / NPLs 92% 82% 108% 84% 31% 44% 55% Net Charge-Offs 1,737 $ 881 $ 1,231 $ 782 $ 4,566 $ 2,849 $ 6,307 $ Provision / Net Charge-Offs 158% 182% 130% 256% 197% 105% 105% 18
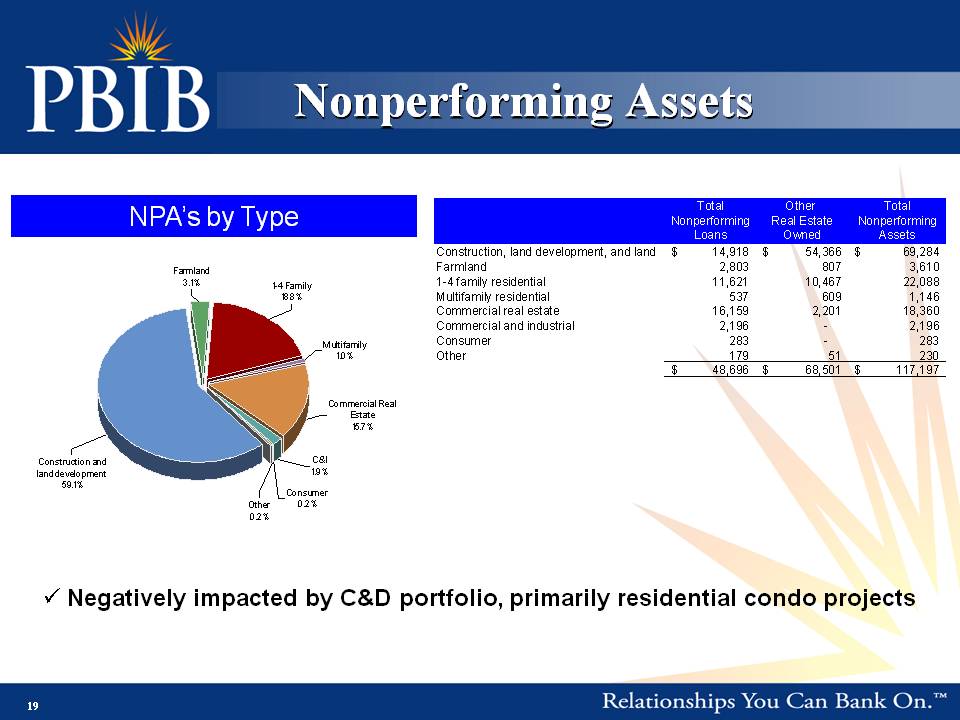
Assets Nonperforming Total Other Total NPA’s by Type 1-4 Family 18.8% Farmland 3.1% Nonperforming Real Estate Nonperforming Loans Owned Assets Construction, land development, and land 14,918 $ 54,366 $ 69,284 $ Farmland 2,803 807 3,610 1-4 family residential 11,621 10,467 22,088 Multifamily residential 537 609 1,146 C il l tt 16 159 2 201 18 360 Commercial Real Multifamily 1.0% Commercial real estate 16,159 2,201 18,360 Commercial and industrial 2,196 - 2,196 Consumer 283 - 283 Other 179 51 230 48,696 $ 68,501 $ 117,197 $ Estate 15.7% Consumer 0.2%&# 160; Construction and land development 59.1% Other 0 2% C&I 1.9% 0.2% .. Negatively impacted by C&D portfolio, primarily residential condo projects 19
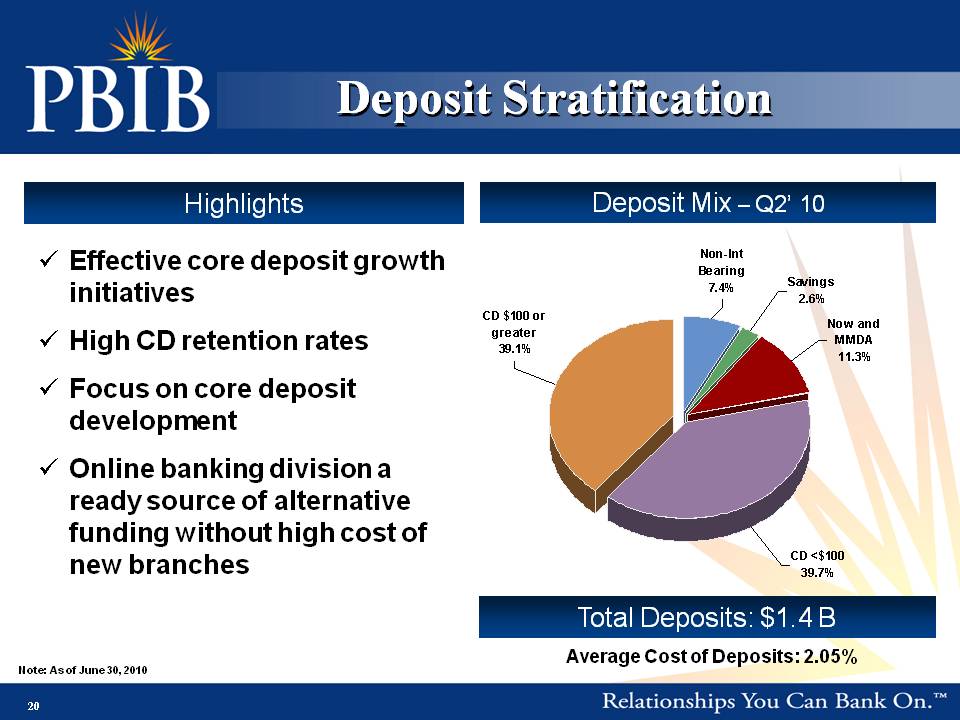
Deposit Stratification Q2’ 10 Highlights Deposit Mix – Q2 .. Effective core deposit growth initiatives Non-Int Bearing 7.4% Savings 2.6% .. High CD retention rates .. Focus on core deposit d l t CD $100 or greater 39.1% Now and MMDA 11.3% development .. Online banking division a ready source of alternative 1 4 y funding without high cost of new branches CD <$100 39.7% 20 Total Deposits: $1.4 B Note: As of June 30, 2010 Average Cost of Deposits: 2.05%
2010 Key Initiatives .. Maintain focus on credit quality and enhancement of credit operations .. Increase market share of existing franchise – managed growth g g g .. Expand core deposit development initiatives and non-interest income improvement strategies .. Continue long-term strategy of targeted and disciplined M&A opportunities .. Accretive earnings to in first full year .. Markets with high growth potential .. Strong management team compatible with our culture 21 .. FDIC assisted and non-FDIC assisted
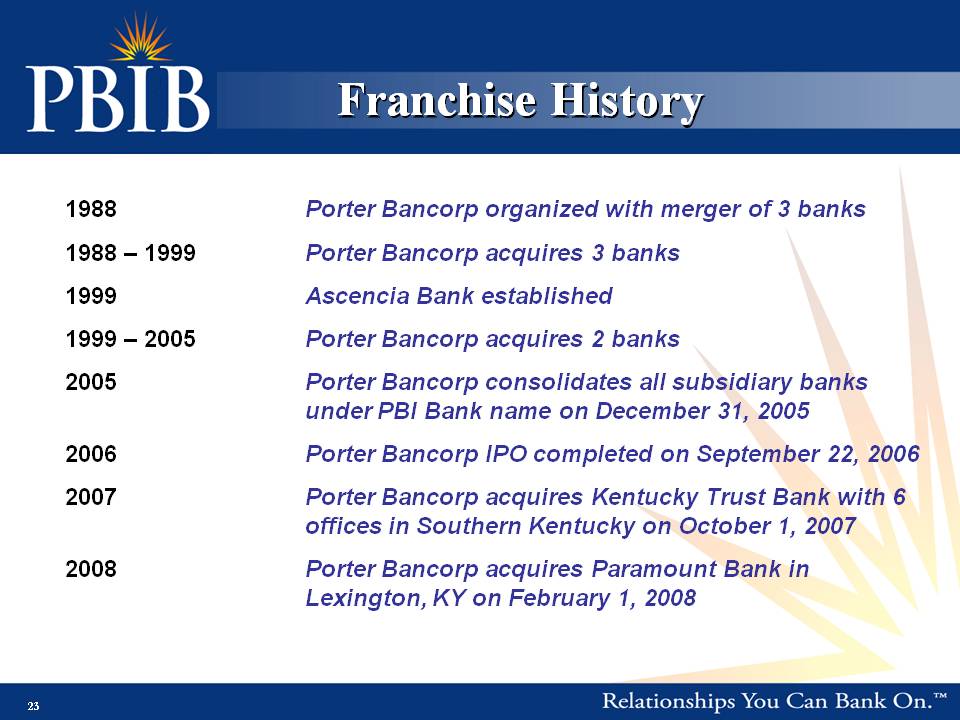
History Franchise 1988 with merger 3 banks Porter Bancorp organized of 1988 – 1999 Porter Bancorp acquires 3 banks 1999 Ascencia Bank established 1999 – 2005 Porter Bancorp acquires 2 banks 2005 Porter Bancorp consolidates all subsidiary banks under PBI Bank on 31 name December 31, 2005 2006 Porter Bancorp IPO completed on September 22, 2006 2007 Porter Bancorp acquires Kentucky Trust Bank with 6 offices in Southern Kentucky on October 1, 2007 2008 Porter Bancorp acquires Paramount Bank in Lexington, KY on February 1, 2008 23
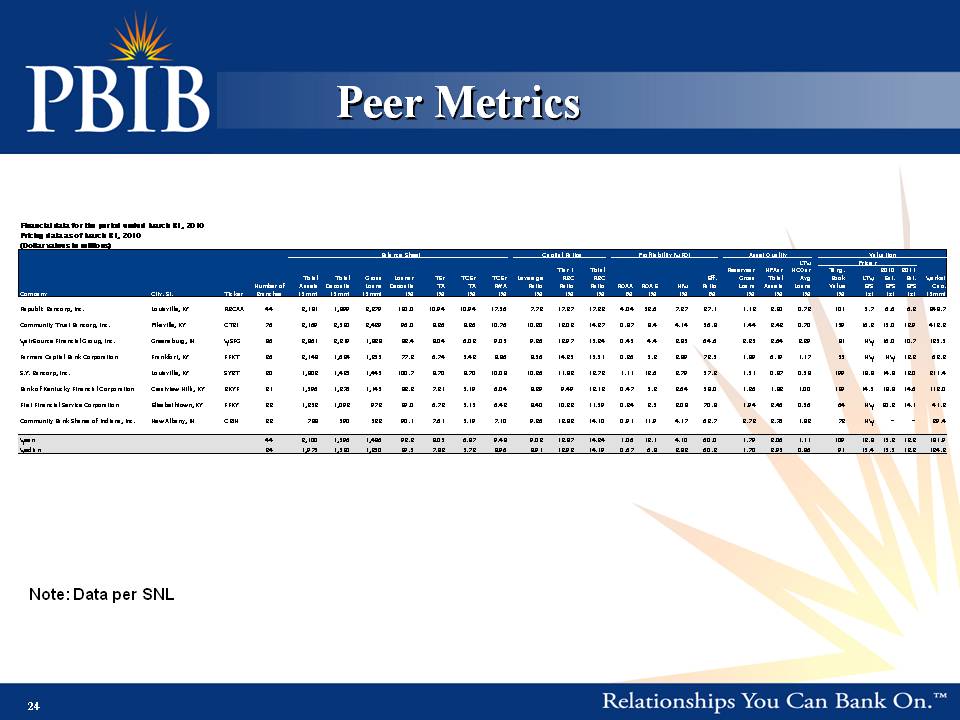
Peer Metrics Financial data for the period ended March 31, 2010 Pricing data as of March 31, 2010 (Dollar values in millions) Balance Sheet Capital Ratios Profitability (MRQ) Asset Quality Valuation LTM Tier 1 Total Reserves/ NPAs/ NCOs/ Tang. 2010 2011 Total Total Gross Loans/ TE/ TCE/ TCE/ Leverage RBC RBC Eff. Gross Total Avg Book LTM Est. Est. Market Number of Assets Deposits Loans Deposits TA TA RWA Ratio Ratio Ratio ROAA ROAE NIM Ratio Loans Assets Loans Value EPS EPS EPS Cap. Company City, St. Ticker Branches ($mm) ($mm) ($mm) (%) (%) (%) (%) (%) (%) (%) (%) (%) (%) (%) (%) (%) (%) (%) (x) (x) (x) ($mm) Republic Bancorp Inc Louisville RBCAA 44 3 181 1 899 2 279 120 0 10 94 10 94 17 56 7 73 17 27 17 33 4 04 53 6 7 27 37 1 1 13 2 30 0 72 101 5 7 6 6 6 3 348 7 Price / Bancorp, Inc. Louisville, KY 3,181 1,899 2,279 120.0 10.94 10.94 17.56 7.73 17.27 17.33 4.04 53.6 7.27 37.1 1.13 2.30 0.72 5.7 6.6 6.3 348.7 Community Trust Bancorp, Inc. Pikeville, KY CTBI 76 3,169 2,530 2,429 96.0 8.36 8.36 10.76 10.30 13.02 14.27 0.87 8.4 4.14 56.8 1.44 2.43 0.70 159 16.3 15.0 13.9 412.2 Main Source Financial Group, Inc. Greensburg, IN MSFG 86 2,861 2,219 1,828 82.4 8.04 6.03 9.05 9.26 13.97 15.24 0.45 4.4 3.85 64.6 2.35 3.64 2.29 81 NM 16.0 10.7 135.5 Farmers Capital Bank Corporation Frankfort, KY FFKT 36 2,148 1,624 1,255 77.3 6.74 5.42 8.86 8.56 14.25 15.51 0.36 5.2 2.89 72.5 1.89 6.19 1.17 55 NM NM 13.2 63.3 S.Y. Bancorp, Inc. Louisville, KY SYBT 30 1,802 1,435 1,445 100.7 8.70 8.70 10.08 10.26 11.83 13.73 1.11 12.6 3.79 57.3 1.51 0.87 0.58 199 18.8 14.8 13.0 311.4 Bank of Kentucky Financial Corporation Crestview Hills, KY BKYF 31 1,596 1,376 1,145 83.2 7.31 5.19 6.04 8.29 9.49 12.13 0.47 5.3 3.64 58.0 1.36 1.83 1.00 139 14.5 18.8 14.6 113.0 First Financial Service Corporation Elizabethtown, KY FFKY 22 1,253 1,092 972 89.0 6.73 5.15 6.42 8.40 10.33 11.59 0.24 3.5 3.08 70.8 1.94 3.46 0.56 64 NM 20.3 14.1 41.3 Community Bank Shares of Indiana, Inc. New Albany, IN CBIN 23 788 590 532 90.1 7.61 5.19 7.10 9.36 12.83 14.10 0.91 11.9 4.17 62.7 2.73 3.76 1.82 72 NM - - 29.4 Mean 44 2,100 1,596 1,486 92.3 8.05 6.87 9.48 9.02 12.87 14.24 1.06 13.1 4.10 60.0 1.79 3.06 1.11 109 13.8 15.3 12.2 181.9 Median 34 1,975 1,530 1,350 89.5 7.83 5.73 8.96 8.91 12.93 14.19 0.67 6.8 3.82 60.3 1.70 2.95 0.86 91 15.4 15.5 13.2 124.3 Note: Data per SNL 24
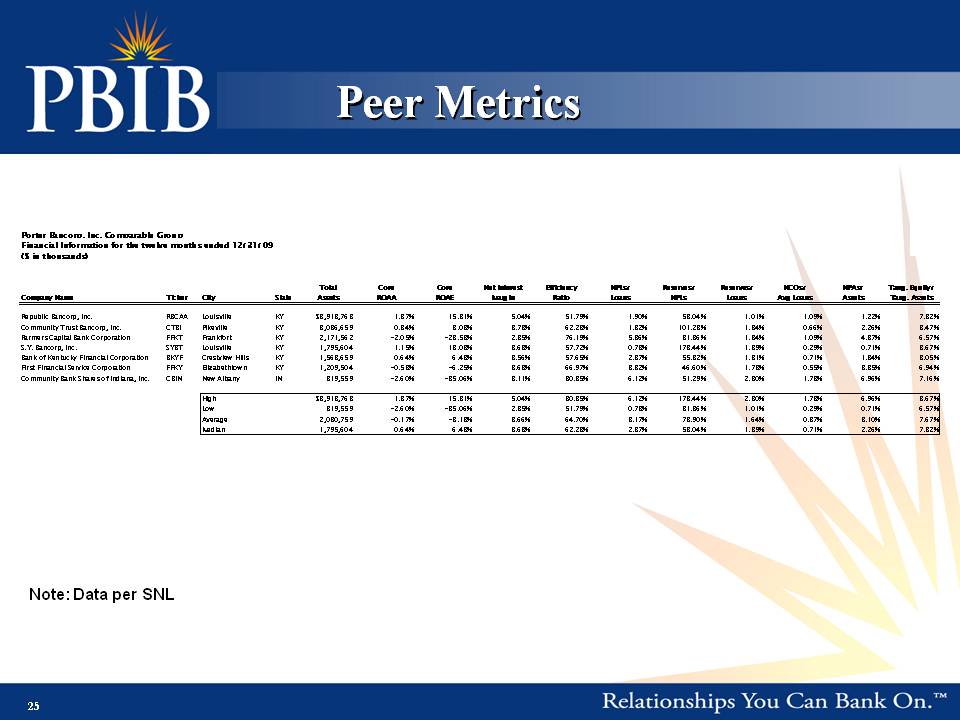
Peer Metrics Porter Bancorp, Inc. Comparable Group Financial Information for the twelve months ended 12/31/09 ($ in thousands) Total Core Core Net Interest Efficiency e NPLs/ Reserves/ Reserves/ NCOs/ NPAs/ Tang. Equity/ Company Name Ticker City State Assets ROAA ROAE Margin Ratio A Loans NPLs Loans Avg Loans Assets Tang. Assets Republic Bancorp, Inc. RBCAA Louisville KY $3,918,768 1.37% 15.31% 5.04% 51.79% 1.90% 53.04% 1.01% 1.09% 1.22% 7.82% Community Trust Bancorp, Inc. CTBI Pikeville KY 3,086,659 0.84% 8.03% 3.78% 62.23% 1.32% 101.23% 1.34% 0.66% 2.26% 8.47% Farmers Capital Bank Corporation FFKT Frankfort KY 2,171,562 -2.05% -23.53% 2.85% 76.19% 5.86% 31.36% 1.84% 1.09% 4.87% 6.57% S.Y. Bancorp, Inc. SYBT Louisville KY 1,795 ,604 1.15% 13.08% 3.68% 57.72% 0.78% 178.44% 1.39% 0.29% 0.71% 8.67% Bank of Kentucky Financial Corporation BKYF Crestview Hills KY 1,563,659 0.64% 6.48% 3.56% 57.65% 2.37% 55.32% 1.31% 0.71% 1.84% 8.05% First Financial Service Corporation FFKY Elizabethtown KY 1,209,504 -0.53% -6.25% 3.63% 66.97% 3.82% 46.60% 1.78% 0.55% 3.85% 6.94% Community Bank Shares of Indiana, Inc. CBIN New Albany IN 819,559 -2.60% -35.06% 3.11% 80.35% 6.12% 51.29% 2.80% 1.73% 6.96% 7.16% High $3,918,768 1.37% 15.31% 5.04% 80.35% 6.12% 178.44% 2.80% 1.73% 6.96% 8.67% Low 819,559 -2.60% -35.06% 2.85% 51.79% 0.78% 31.36% 1.01% 0.29% 0.71% 6.57% Average 2,080,759 -0.17% -3.13% 3.66% 64.70% 3.17% 73.90% 1.64% 0.87% 3.10% 7.67% Median 1,795,604 0.64% 6.48% 3.63% 62.23% 2.37% 53.04% 1.39% 0.71% 2.26% 7.82% Note: Data per SNL 25

Loan Mix Porter Bancorp, Inc. (per call report) June 30, 2010 March 31, 2010 December 31, 2009 September 30, 2009 June 30, 2009 March 31, 2009 Loan Portfolio Composition: Real Estate: Commercial real estate 461,976 34.5% 459,471 33.8% 451,944 32.0% 439,089 31.6% 411,158 30.2% 407,910 29.8% Construction, land development, and other land loans 223,148 16.7% 247,955 18.2% 304,230 21.5% 322,577 23.3% 332,608 24.4% 358,692 26.2% Residential real estate 319,663 23.9% 319,288 23.5% 321,975 22.8% 303,397 21.9% 296,348 21.8% 293,493 21.4% Multifamily residential properties 69,941 5.2% 69,618 5.1% 65,043 4.6% 63,630 4.6% 62,895 4.6% 55,118 4.0% Farmland 84,481 6.3% 83,541 6.1% 83,898 5.9% 81,353 5.9% 80,002 5.9% 76,411 5.6%� 0; Home equity 31,291 2.3% 31,228 2.3% 32,384 2.3% 31,697 2.3% 32,275 2.4% 32,739 2.4% C & I 86,925 6.5% 88,696 6.5% 89,903 6.4% 89,252 6.4% 90,899 6.7% 90,269 6.6% Consumer 34,587 2.6% 35,767 2.6% 36,990 2.6% 37,087 2.7% 36,903 2.7% 36,392 2.7% Agricultural 24,086 1.8% 24,304 1.8% 25,065 1.8% 18,354 1.3% 16,100 1.2% 15,144 1.1% Other 1,410 0.1% 1,348 0.1% 1,487 0.1% 923 0.1% 2,871 0.2% 2,919 0.2% Total 1,337,508 100.0% 1,361,216 100.0% 1,412,919 100.0% 1,387,359 100.0% 1,362,059 100.0% 1,369,087 100.0% .. Construction and land development loans have decreased $136 million since March 2009 26
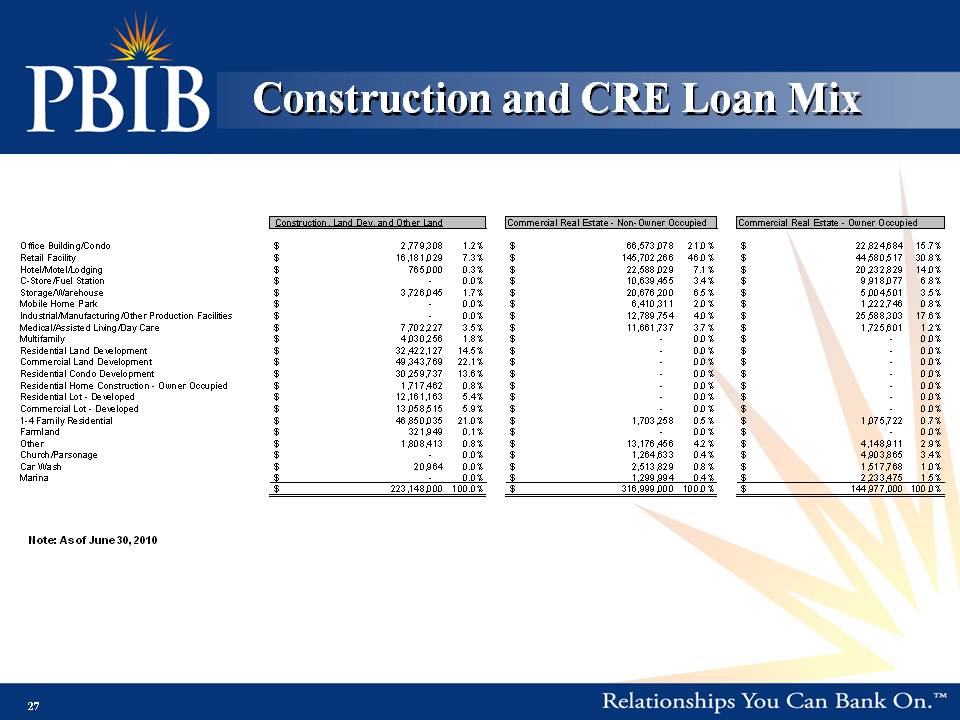
Construction and CRE Loan Mix Construction, Land Dev, and Other Land Commercial Real Estate - Non-Owner Occupied Commercial Real Estate - Owner Occupied Office Building/Condo 2,779,308 $ 1.2% 66,573,078 $ 21.0% 22,824,684 $ 15.7% Retail Facility 16,181,029 $ 7.3% 145,702,266 $ 46.0% 44,580,517 $ 30.8% Hotel/Motel/Lodging 765,000 $ 0.3% 22,588,029 $ 7.1% 20,232,829 $ 14.0% C-Store/Fuel Station - $ 0.0% 10,639,455 $ 3.4% 9,918,077 $ 6.8% Storage/Warehouse 3,726,045 $ 1.7% 20,676,200 $ 6.5% 5,004,501 $ 3.5% Mobile Home Park - $ 0.0% 6,410,311 $ 2.0% 1,222,746 $ 0.8% Industrial/Manufacturing/Other Production Facilities - $ 0.0% 12,789,754 $ 4.0% 25,588,303 $ 17.6% Medical/Assisted Living/Day Care 7,702,227 $ 3.5% 11,661,737 $ 3.7% 1 ,725,601 $ 1.2% Multifamily 4,030,256 $ 1.8% - $ 0.0% - $ 0.0% Residential Land Development 32,422,127 $ 14.5% - $ 0.0% - $ 0.0% Commercial Land Development 49,343,769 $ 22.1% - $ 0.0% - $ 0.0% Residential Condo Development 30,259,737 $ 13.6% - $ 0.0% - $ 0.0% Residential Home Construction - Owner Occupied 1,717,462 $ 0.8% - $ 0.0% - $ 0.0% Residential Lot - Developed 12,161,163 $ 5.4% - $ 0.0% - $ 0.0% Commercial - Developed 13,058,515 $ 5.9% - $ 0.0% - $ 0.0% Lot 1-4 Family Residential 46,850,035 $ 21.0% 1,703,258 $ 0.5% 1,075,722 $ 0.7% Farmland 321,949 $ 0.1% - $ 0.0% - $ 0.0% Other 1,808,413 $ 0.8% 13,176,456 $ 4.2% 4,148,911 $ 2.9% Church/Parsonage - $ 0.0% 1,264,633 $ 0.4% 4,903,865 $ 3.4% Car Wash 20,964 $ 0.0% 2,513,829 $ 0.8% 1,517,768 $ 1.0% Marina - $ 0.0% 1,299,994 $ 0.4% 2,233,475 $ 1.5% 223,148,000 $ 100.0% 316,999,000 $ 100.0% 144,977,000 $ 100.0% Note: As of June 30, 2010 27