
Safety, Efficacy, and Pharmacodynamics of Omav (Omaveloxolone) in Friedreich’s Ataxia Patients (MOXIe Trial): Part 1 Results Exhibit 99.3
Summary of MOXIe Part 1 Study Results Dose-dependent, placebo-corrected improvements on multiple endpoints including mFARS and peak work The optimal dose of omaveloxolone was identified and demonstrated: Marked activation of Nrf2 Clear improvements in markers of metabolism and mitochondrial function Substantial improvements in neurological and muscular function that correlate with Nrf2 induction and markers of mitochondrial function Identified patients with a musculoskeletal foot deformity called pes cavus as being unable to adequately perform certain aspects of the efficacy assessments Omaveloxolone was well-tolerated across all dose levels Sufficient evidence to proceed with Part 2, expected to begin in the second half of 2017 2
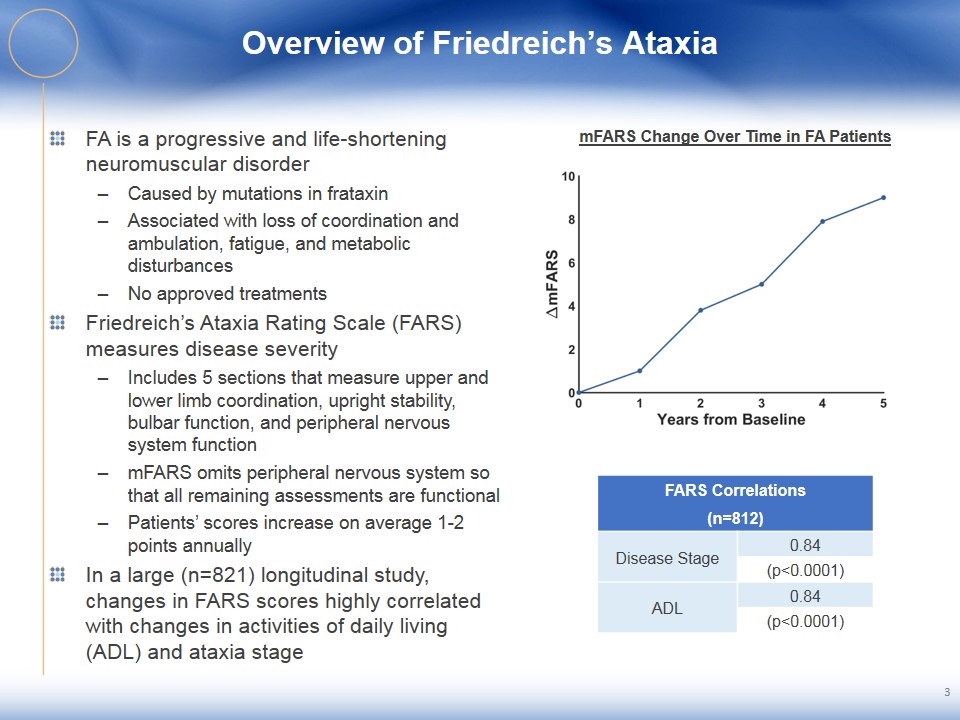
Overview of Friedreich’s Ataxia FA is a progressive and life-shortening neuromuscular disorder Caused by mutations in frataxin Associated with loss of coordination and ambulation, fatigue, and metabolic disturbances No approved treatments Friedreich’s Ataxia Rating Scale (FARS) measures disease severity Includes 5 sections that measure upper and lower limb coordination, upright stability, bulbar function, and peripheral nervous system function mFARS omits peripheral nervous system so that all remaining assessments are functional Patients’ scores increase on average 1-2 points annually In a large (n=821) longitudinal study, changes in FARS scores highly correlated with changes in activities of daily living (ADL) and ataxia stage 3 mFARS Change Over Time in FA Patients FARS Correlations (n=812) Disease Stage 0.84 (p<0.0001) ADL 0.84 (p<0.0001)
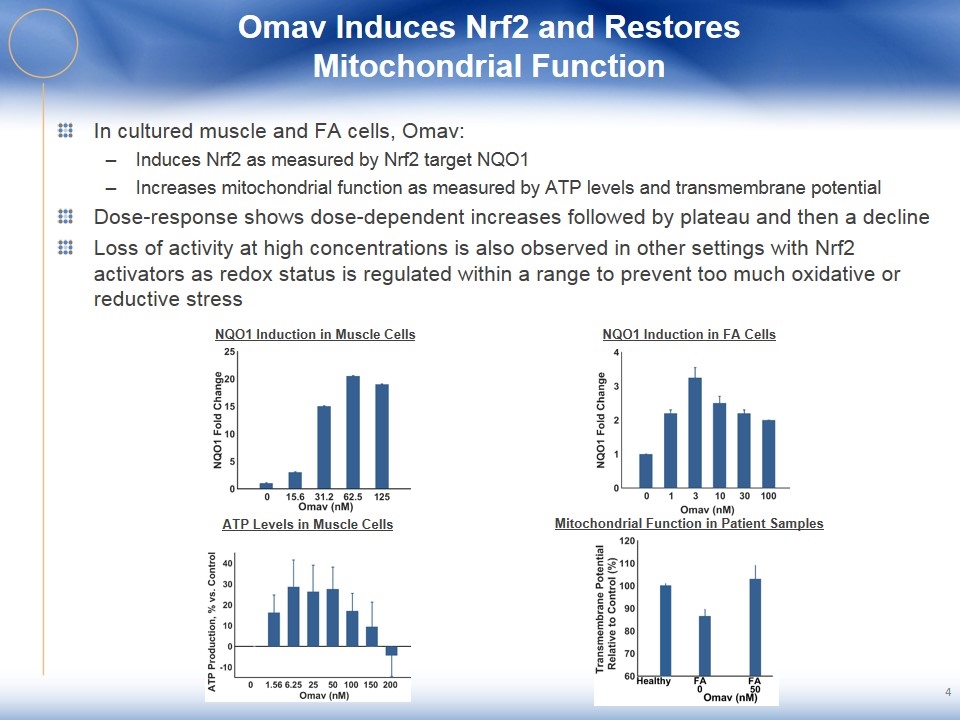
Omav Induces Nrf2 and Restores Mitochondrial Function 4 In cultured muscle and FA cells, Omav: Induces Nrf2 as measured by Nrf2 target NQO1 Increases mitochondrial function as measured by ATP levels and transmembrane potential Dose-response shows dose-dependent increases followed by plateau and then a decline Loss of activity at high concentrations is also observed in other settings with Nrf2 activators as redox status is regulated within a range to prevent too much oxidative or reductive stress NQO1 Induction in Muscle Cells NQO1 Induction in FA Cells ATP Levels in Muscle Cells Mitochondrial Function in Patient Samples
5 MOXIe Study Design and Patient Disposition MOXIe designed as a two-part study Part 1 designed to assess multiple endpoints across a range of doses Part 2 designed to confirm efficacy and safety Part 1: Phase 2, double-blind, randomized, placebo-controlled, dose-ranging, multi-center, international trial 69 total patients randomized 3:1 to Omav or placebo across 7 dose levels 12 week treatment duration Safety overseen by data safety monitoring board Not powered for efficacy; assessing dose-dependent activity and separation from placebo Multiple clinical assessments of muscular and neurological function assessed in Part I Muscular: peak work during exercise testing (primary endpoint) Neurological: mFARS (key secondary endpoint) and timed 25 foot walk test Omav was well-tolerated with one Omav and one placebo discontinuation Baseline characteristics were generally balanced across treatment groups
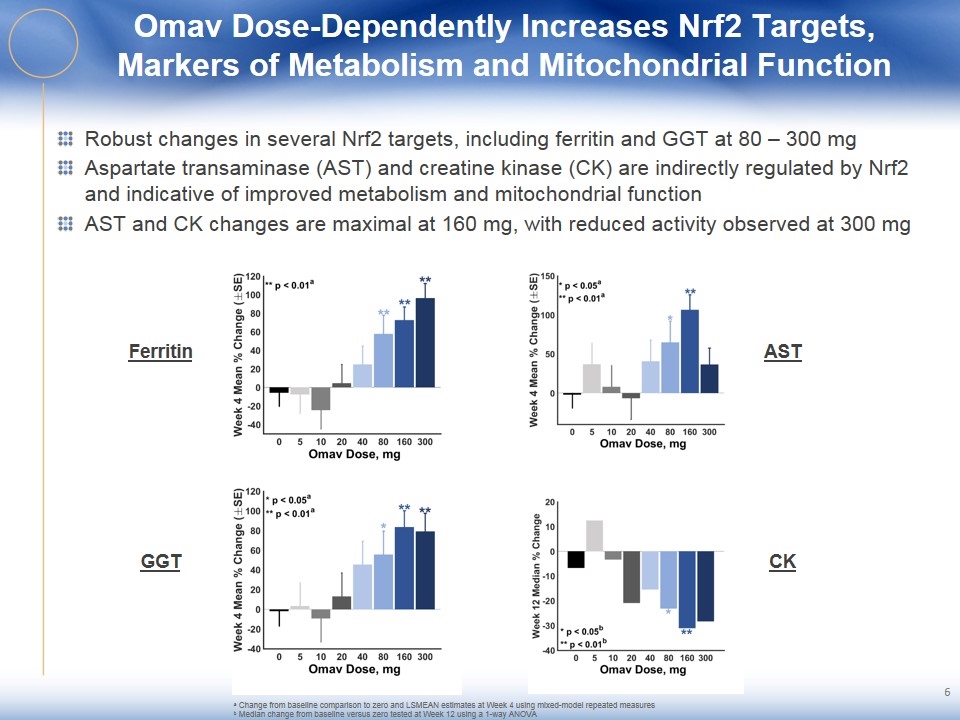
Omav Dose-Dependently Increases Nrf2 Targets, Markers of Metabolism and Mitochondrial Function Robust changes in several Nrf2 targets, including ferritin and GGT at 80 – 300 mg Aspartate transaminase (AST) and creatine kinase (CK) are indirectly regulated by Nrf2 and indicative of improved metabolism and mitochondrial function AST and CK changes are maximal at 160 mg, with reduced activity observed at 300 mg Ferritin GGT AST CK a Change from baseline comparison to zero and LSMEAN estimates at Week 4 using mixed-model repeated measures b Median change from baseline versus zero tested at Week 12 using a 1-way ANOVA
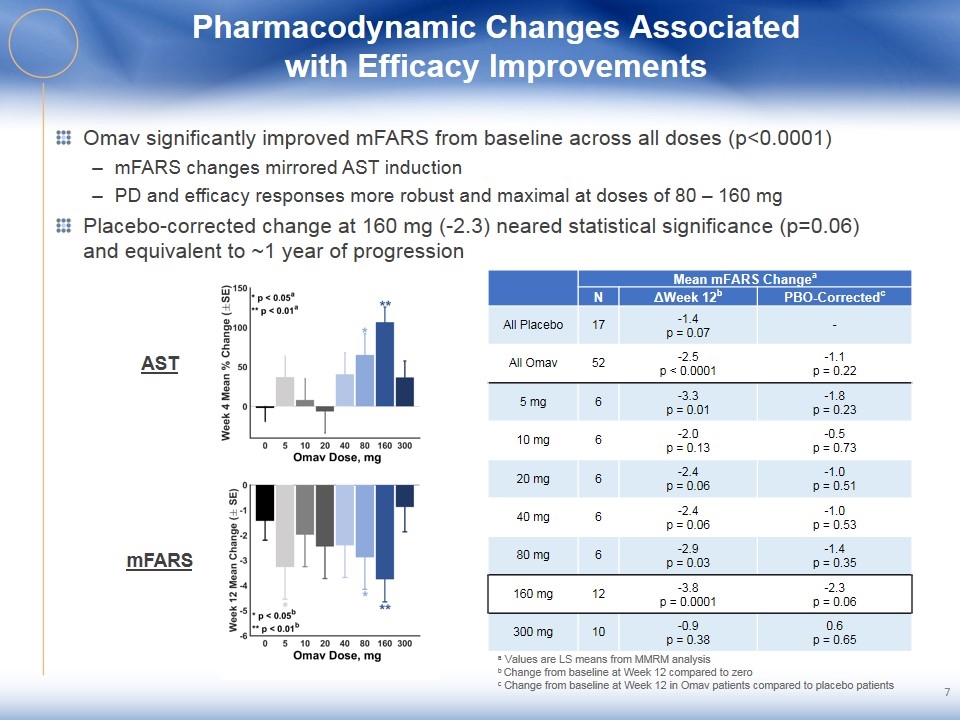
Pharmacodynamic Changes Associated with Efficacy Improvements Omav significantly improved mFARS from baseline across all doses (p<0.0001) mFARS changes mirrored AST induction PD and efficacy responses more robust and maximal at doses of 80 – 160 mg Placebo-corrected change at 160 mg (-2.3) neared statistical significance (p=0.06) and equivalent to ~1 year of progression AST mFARS a Values are LS means from MMRM analysis b Change from baseline at Week 12 compared to zero c Change from baseline at Week 12 in Omav patients compared to placebo patients Mean mFARS Changea N ΔWeek 12b PBO-Correctedc All Placebo 17 -1.4 p = 0.07 - All Omav 52 -2.5 p < 0.0001 -1.1 p = 0.22 5 mg 6 -3.3 p = 0.01 -1.8 p = 0.23 10 mg 6 -2.0 p = 0.13 -0.5 p = 0.73 20 mg 6 -2.4 p = 0.06 -1.0 p = 0.51 40 mg 6 -2.4 p = 0.06 -1.0 p = 0.53 80 mg 6 -2.9 p = 0.03 -1.4 p = 0.35 160 mg 12 -3.8 p = 0.0001 -2.3 p = 0.06 300 mg 10 -0.9 p = 0.38 0.6 p = 0.65
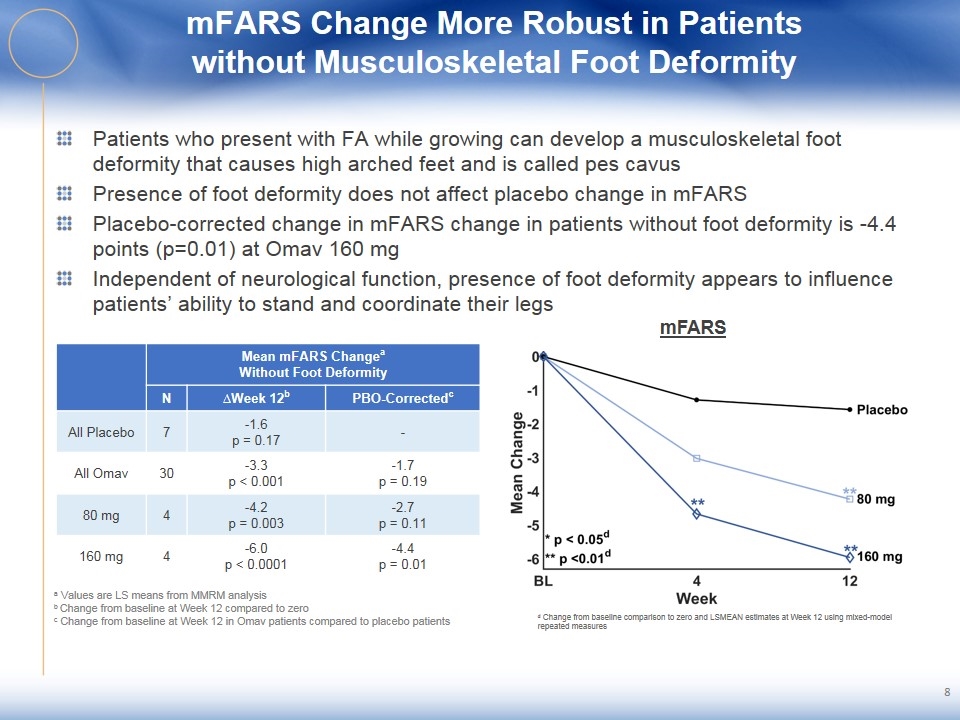
mFARS Change More Robust in Patients without Musculoskeletal Foot Deformity Patients who present with FA while growing can develop a musculoskeletal foot deformity that causes high arched feet and is called pes cavus Presence of foot deformity does not affect placebo change in mFARS Placebo-corrected change in mFARS change in patients without foot deformity is -4.4 points (p=0.01) at Omav 160 mg Independent of neurological function, presence of foot deformity appears to influence patients’ ability to stand and coordinate their legs 8 Mean mFARS Changea Without Foot Deformity N ∆Week 12b PBO-Correctedc All Placebo 7 -1.6 p = 0.17 - All Omav 30 -3.3 p < 0.001 -1.7 p = 0.19 80 mg 4 -4.2 p = 0.003 -2.7 p = 0.11 160 mg 4 -6.0 p < 0.0001 -4.4 p = 0.01 mFARS a Values are LS means from MMRM analysis b Change from baseline at Week 12 compared to zero c Change from baseline at Week 12 in Omav patients compared to placebo patients d Change from baseline comparison to zero and LSMEAN estimates at Week 12 using mixed-model repeated measures
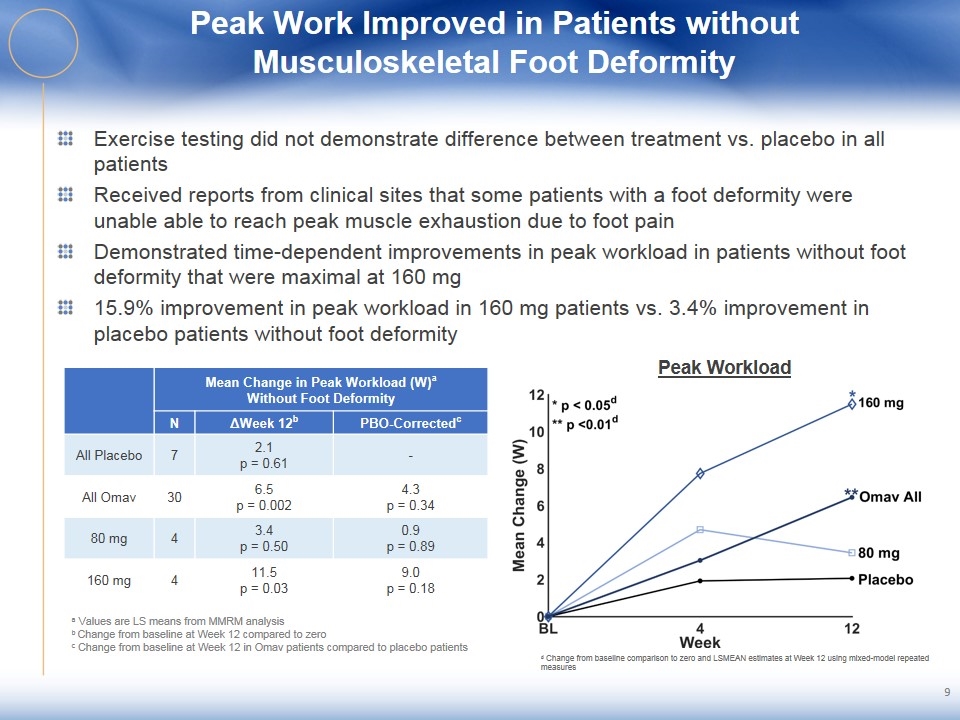
Peak Work Improved in Patients without Musculoskeletal Foot Deformity Exercise testing did not demonstrate difference between treatment vs. placebo in all patients Received reports from clinical sites that some patients with a foot deformity were unable able to reach peak muscle exhaustion due to foot pain Demonstrated time-dependent improvements in peak workload in patients without foot deformity that were maximal at 160 mg 15.9% improvement in peak workload in 160 mg patients vs. 3.4% improvement in placebo patients without foot deformity 9 Peak Workload Mean Change in Peak Workload (W)a Without Foot Deformity N ΔWeek 12b PBO-Correctedc All Placebo 7 2.1 p = 0.61 - All Omav 30 6.5 p = 0.002 4.3 p = 0.34 80 mg 4 3.4 p = 0.50 0.9 p = 0.89 160 mg 4 11.5 p = 0.03 9.0 p = 0.18 a Values are LS means from MMRM analysis b Change from baseline at Week 12 compared to zero c Change from baseline at Week 12 in Omav patients compared to placebo patients d Change from baseline comparison to zero and LSMEAN estimates at Week 12 using mixed-model repeated measures
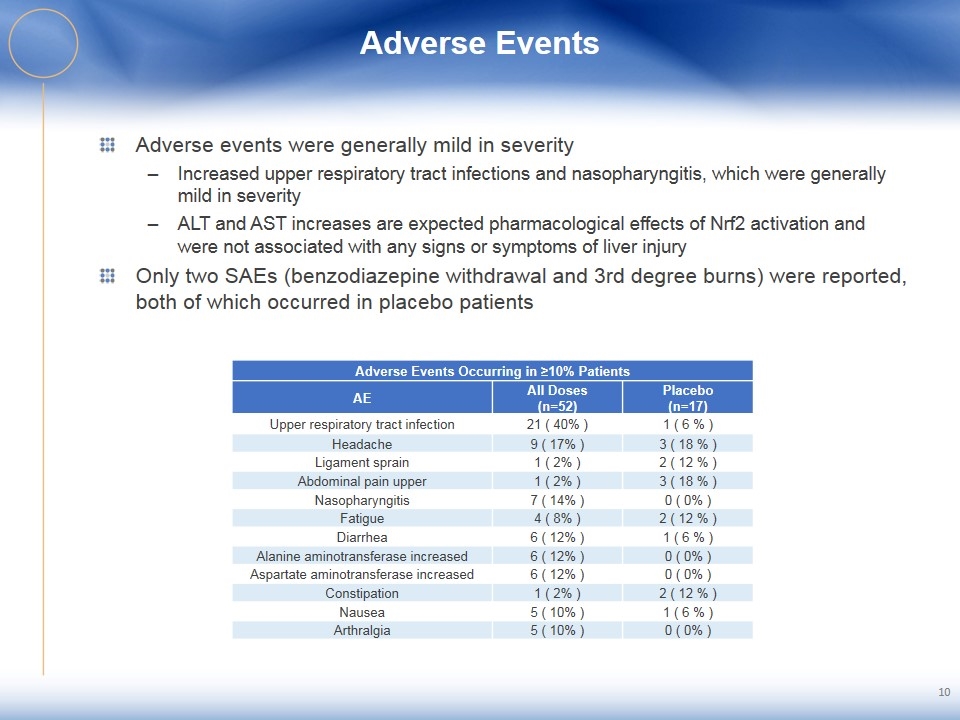
Adverse Events Adverse events were generally mild in severity Increased upper respiratory tract infections and nasopharyngitis, which were generally mild in severity ALT and AST increases are expected pharmacological effects of Nrf2 activation and were not associated with any signs or symptoms of liver injury Only two SAEs (benzodiazepine withdrawal and 3rd degree burns) were reported, both of which occurred in placebo patients 10 Adverse Events Occurring in ≥10% Patients AE All Doses (n=52) Placebo (n=17) Upper respiratory tract infection 21 ( 40% ) 1 ( 6 % ) Headache 9 ( 17% ) 3 ( 18 % ) Ligament sprain 1 ( 2% ) 2 ( 12 % ) Abdominal pain upper 1 ( 2% ) 3 ( 18 % ) Nasopharyngitis 7 ( 14% ) 0 ( 0% ) Fatigue 4 ( 8% ) 2 ( 12 % ) Diarrhea 6 ( 12% ) 1 ( 6 % ) Alanine aminotransferase increased 6 ( 12% ) 0 ( 0% ) Aspartate aminotransferase increased 6 ( 12% ) 0 ( 0% ) Constipation 1 ( 2% ) 2 ( 12 % ) Nausea 5 ( 10% ) 1 ( 6 % ) Arthralgia 5 ( 10% ) 0 ( 0% )
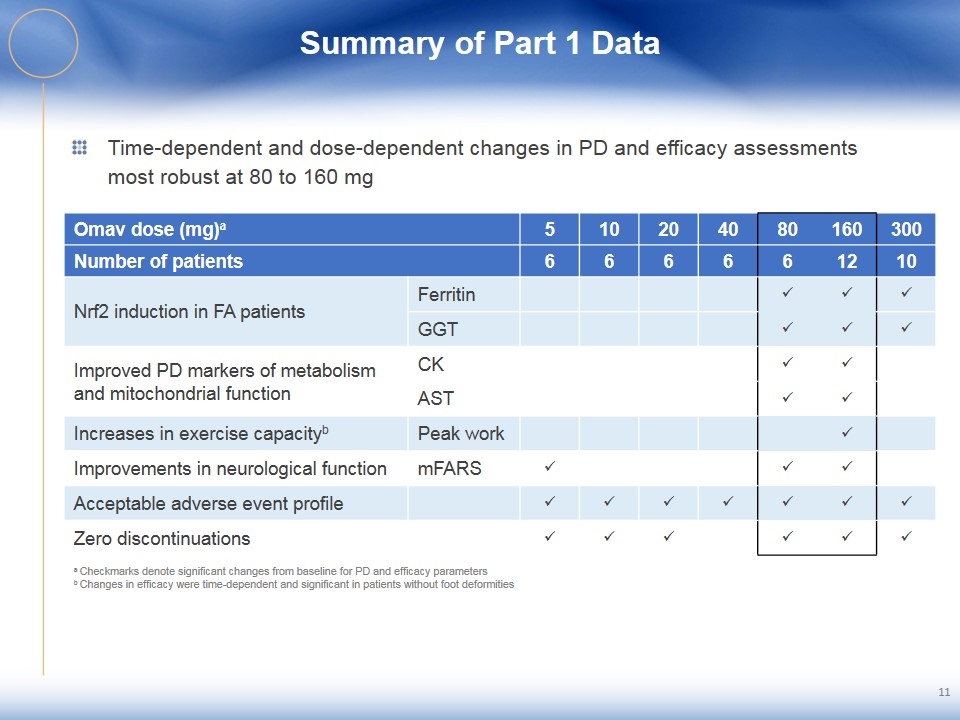
Summary of Part 1 Data Time-dependent and dose-dependent changes in PD and efficacy assessments most robust at 80 to 160 mg 11 Omav dose (mg)a 5 10 20 40 80 160 300 Number of patients 6 6 6 6 6 12 10 Nrf2 induction in FA patients Ferritin ü ü ü GGT ü ü ü Improved PD markers of metabolism and mitochondrial function CK ü ü AST ü ü Increases in exercise capacityb Peak work ü Improvements in neurological function mFARS ü ü ü Acceptable adverse event profile ü ü ü ü ü ü ü Zero discontinuations ü ü ü ü ü ü a Checkmarks denote significant changes from baseline for PD and efficacy parameters b Changes in efficacy were time-dependent and significant in patients without foot deformities
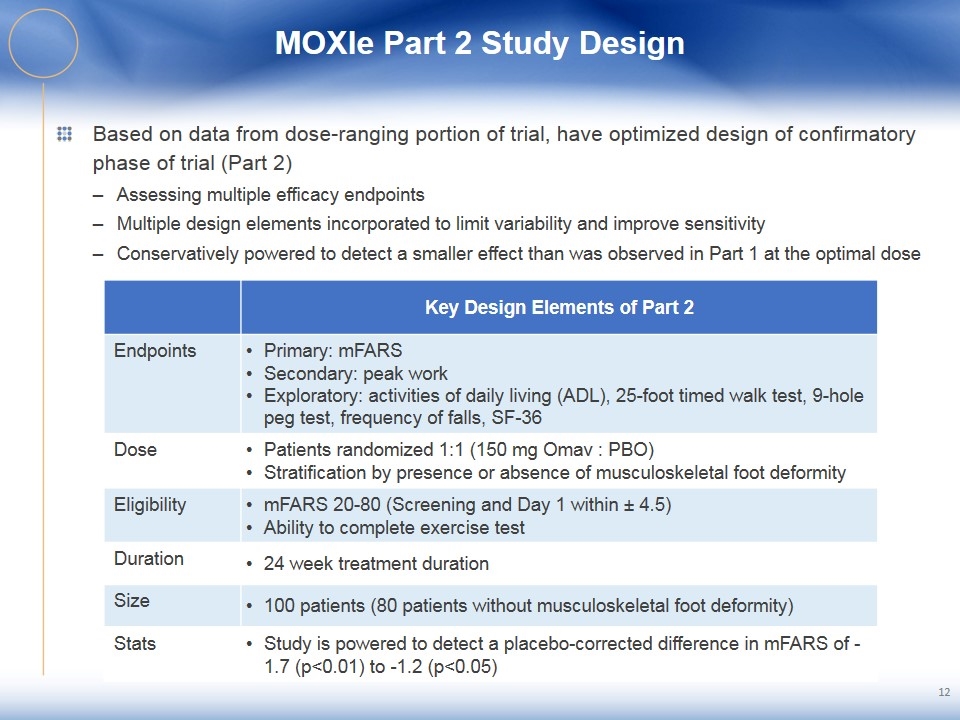
MOXIe Part 2 Study Design Based on data from dose-ranging portion of trial, have optimized design of confirmatory phase of trial (Part 2) Assessing multiple efficacy endpoints Multiple design elements incorporated to limit variability and improve sensitivity Conservatively powered to detect a smaller effect than was observed in Part 1 at the optimal dose 12 Key Design Elements of Part 2 Endpoints Primary: mFARS Secondary: peak work Exploratory: activities of daily living (ADL), 25-foot timed walk test, 9-hole peg test, frequency of falls, SF-36 Dose Patients randomized 1:1 (150 mg Omav : PBO) Stratification by presence or absence of musculoskeletal foot deformity Eligibility mFARS 20-80 (Screening and Day 1 within ± 4.5) Ability to complete exercise test Duration 24 week treatment duration Size 100 patients (80 patients without musculoskeletal foot deformity) Stats Study is powered to detect a placebo-corrected difference in mFARS of -1.7 (p<0.01) to -1.2 (p<0.05)
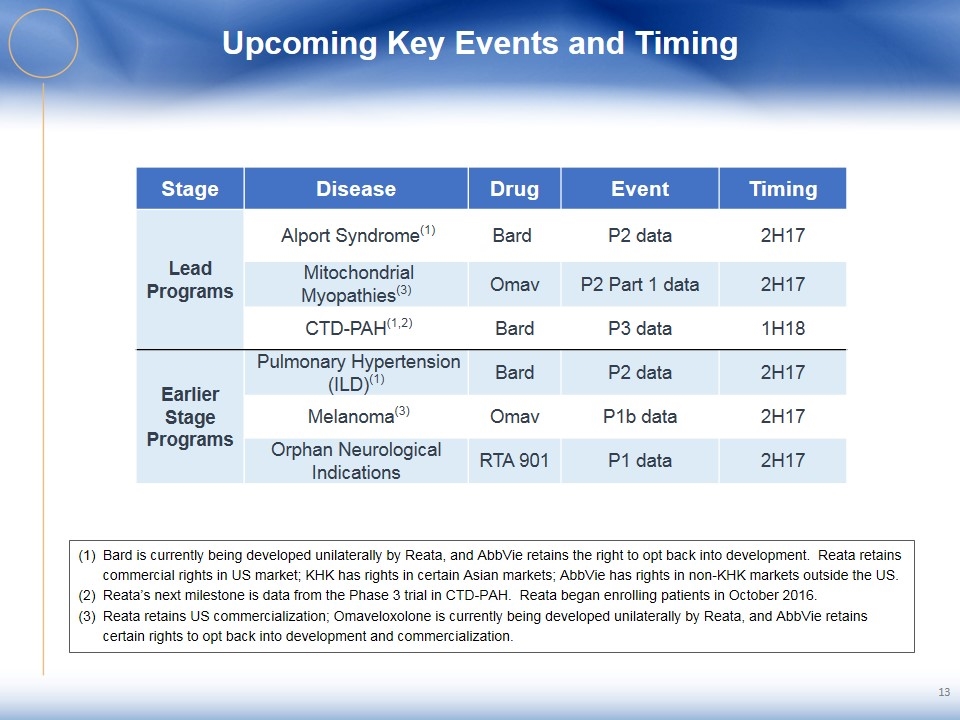
Upcoming Key Events and Timing Bard is currently being developed unilaterally by Reata, and AbbVie retains the right to opt back into development. Reata retains commercial rights in US market; KHK has rights in certain Asian markets; AbbVie has rights in non-KHK markets outside the US. Reata’s next milestone is data from the Phase 3 trial in CTD-PAH. Reata began enrolling patients in October 2016. Reata retains US commercialization; Omaveloxolone is currently being developed unilaterally by Reata, and AbbVie retains certain rights to opt back into development and commercialization. 13 Stage Disease Drug Event Timing Lead Programs Alport Syndrome(1) Bard P2 data 2H17 Mitochondrial Myopathies(3) Omav P2 Part 1 data 2H17 CTD-PAH(1,2) Bard P3 data 1H18 Earlier Stage Programs Pulmonary Hypertension (ILD)(1) Bard P2 data 2H17 Melanoma(3) Omav P1b data 2H17 Orphan Neurological Indications RTA 901 P1 data 2H17


