Legacy Reserves LP
RBC MLP Conference

November 15, 2007

Page 2
Forward-Looking Statements
Statements made by representatives of Legacy Reserves LP (the “Partnership”) during the course
of this presentation that are not historical facts are forward-looking statements. These statements
are based on certain assumptions made by the Partnership based on management’s experience
and perception of historical trends, current conditions, anticipated future developments and other
factors believed to be appropriate. Such statements are subject to a number of assumptions, risks
and uncertainties, many of which are beyond the control of the Partnership, which may cause actual
results to differ materially from those implied or expressed by the forward-looking statements. These
include risks relating to financial performance and results, availability of sufficient cash flow to pay
distributions and execute our business plan, prices and demand for oil a
nd natural gas, our ability to
replace reserves and efficiently exploit our current reserves, our ability to make acquisitions on
economically acceptable terms, and other important factors that could cause actual results to differ
materially from those anticipated or implied in the forward-looking statements.  Please see the
factors described in the Partnership’s Annual Report on Form 10-K in Item 1A under “Risk Factors”.
The Partnership undertakes no obligation to publicly update any forward-looking statements,
whether as a result of new information or future events.
Page 3
Other
Related
Entities
Dale Brown &
Jack McGraw
form
Partnership
Cary &
Dale Brown
form
Moriah
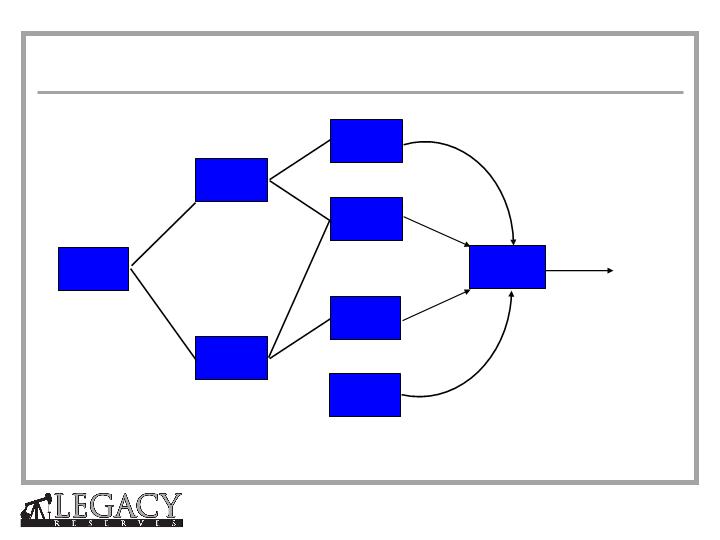
Formation Transaction
Through
Private Placement
1981
1991
2005
March
2006
January
2007
IPO
Brothers
Production
Company
Brothers
Moriah
Brothers
MBN
Moriah
Legacy
Kyle McGraw
&
Cary Brown
Assume
Management
Legacy History
Page 4
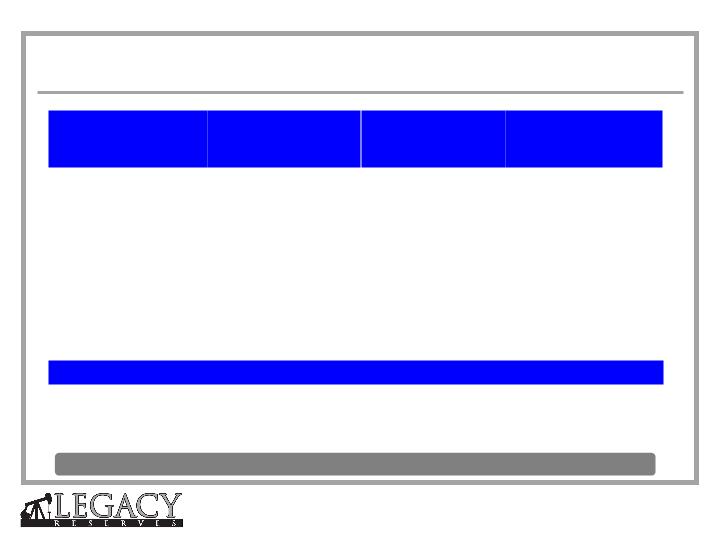
Name | Title | Years Experience in the Permian Basin | Years Experience in the Oil & Gas Industry |
Cary D. Brown, CPA | Chairman & CEO | 15 | 17 |
Steven H. Pruett | President & CFO | 18 | 23 |
Kyle A. McGraw | EVP, Business Development & Land | 24 | 24 |
Paul T. Horne | VP, Operations | 21 | 23 |
William M. Morris, CPA | VP, Controller & CAO | 25 | 26 |
William D. Sullivan
Former EVP
Anadarko Petroleum
G. Larry Lawrence
Former Controller
Pure Resources
Kyle D. Vann
Former CEO
Entergy - Koch, LP
Independent Board Members
Legacy Management Team
Page 5
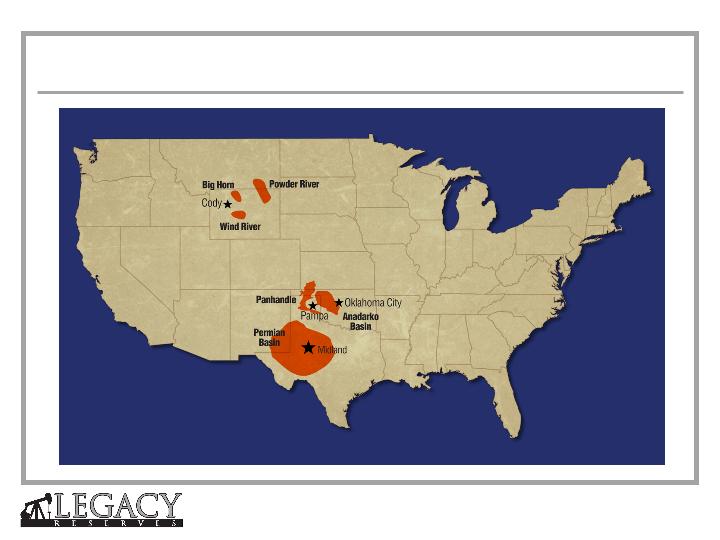
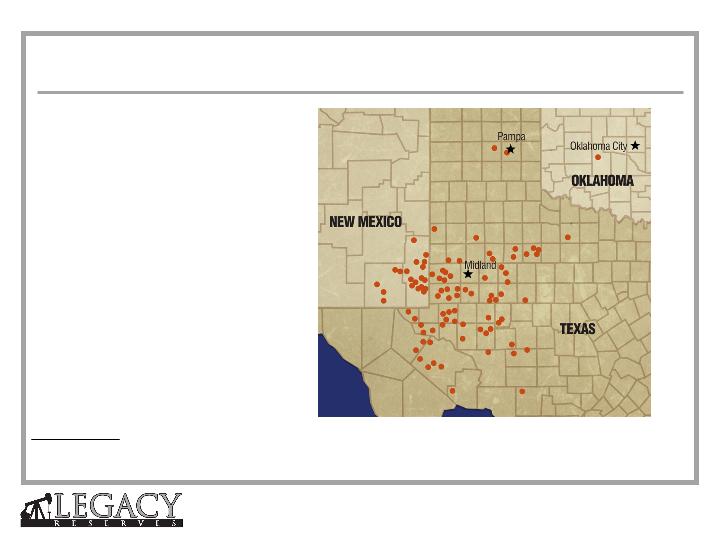
Asset Overview
Page 6
(1)Taken from reserve reports prepared by LaRoche Petroleum Consultants, Ltd. as of 12/31/06 for Legacy Reserves LP plus proved reserves from 2007 acquisitions from internal
reserve reports: Binger (4.1 MMBoe), TSF/Ameristate (1.4 MMBoe), Slaughter/Rocker A (1.0 MMBoe), Raven (1.2 MMBoe), TOC (4.0 MMBoe), Summit (0.7 MMBoe) and
Pan-Ellis/Mariner/SMB (0.77 MMBoe).
(2)Pro forma 2007 acquisitions of Binger, TSF, Ameristate, Slaughter/Rocker A, Raven, Samson, Carlow, TOC, Summit and Pan-Ellis/Mariner/SMB.
Legacy Base Asset Overview
q32.3 MMBoe of proved reserves (1)
qReserves-to-production ratio of over 15
years
qDiversified across over 3,000 wells
q70% operated
q6,100 net Boe per day (2)
q74% liquids
Page 7
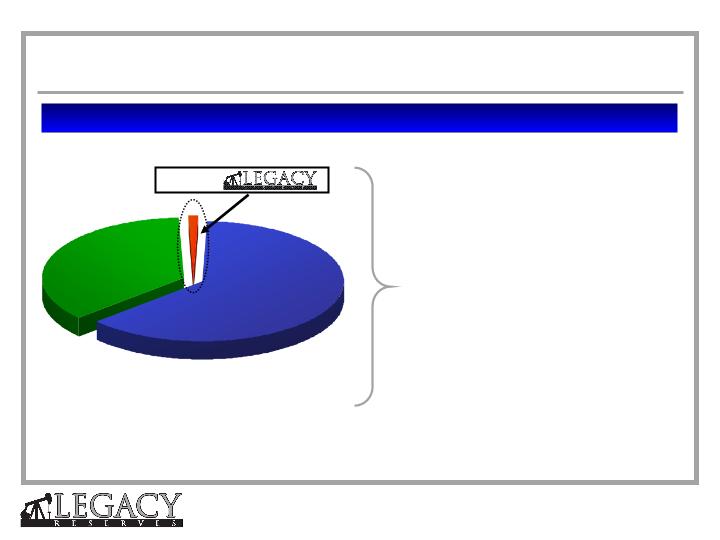
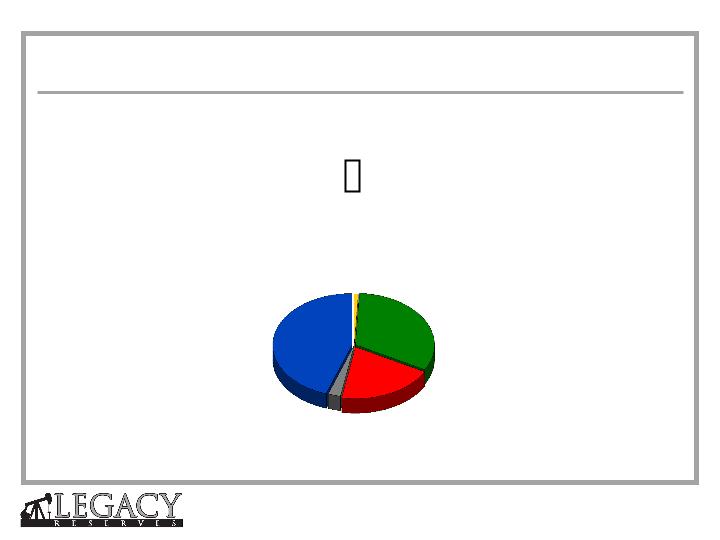
Top 5
Operators
1,700+
Operators
0.3%
(1)  Ownership based on production.  Permian Basin includes Texas Railroad Commission Districts 7C, 8, 8A and Lea and Eddy County, New Mexico.
Permian Basin data as of July 31, 2005; Legacy production data as of September 30, 2006.
63.6%
36.1%
Permian Basin Ownership Profile (1)
Consolidation Opportunities in the Permian Basin
qFragmented ownership provides numerous
acquisition opportunities
qAcquisition niche - large PDP component
qConnected in Permian Basin deal network

Page 8
$334 million of purchases
at an average cost of
$9.12 per Boe of proved
reserves in over 38 deals
13.4
20.2
36.7
6.8
13.4
6.8
13.4
16.5
Acquired Reserves (1999 - 2007)
Legacy & Predecessor Acquisition History
Page 9
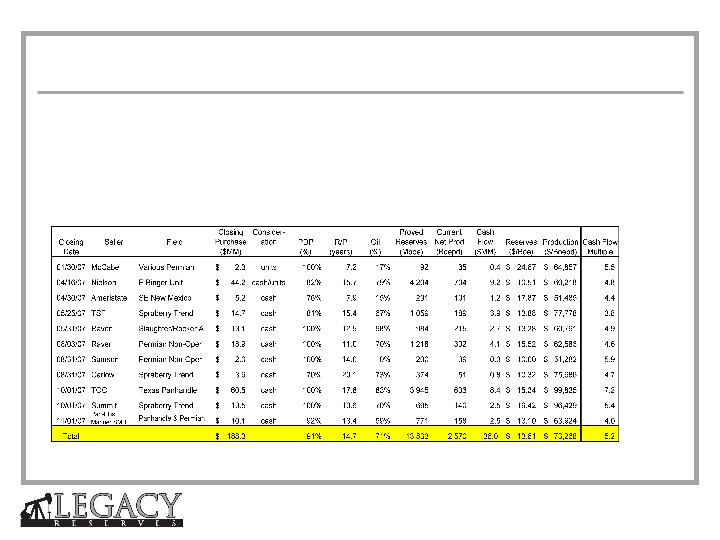
Legacy 2007 YTD Acquisitions
qClosed $188 million of acquisitions in 2007
qThirteen negotiated transactions averaging:
–$13.61 per Boe of proved reserves
–91% PDP, R/P ratio of 14.7 years
–$73,268 per Boepd
–5.2 times cash flow

Page 10
Financial Summary
Page 11
Financial and Operating Data - Latest Twelve Months
qThird Quarter earnings continue solid growth trend
–14.4% sequential volume growth over Q2
–Q3 production, revenue, distributable cash flow, and adjusted EBITDA exceeded analyst estimates
–Q3 does not include contribution from Panhandle, Summit and November acquisitions
(1)Please see pages 19 and 20
Consensus Analyst
($ in millions)
12-31-06
3-31-07
6-30-07
9-30-07
Estimates - Q3 2007
Production (Boe/d)
3,625
3,655
4,540
5,195
5,083
Revenue with realized hedges
$18.5
$18.4
$24.1
$29.8
$27.4
Distributable Cash Flow
$1.6
$6.8
$9.5
$14.5
$12.5
Distributable Cash Flow per Unit
$0.08
$0.36
$0.36
$0.56
$0.48
Adjusted EBITDA
(1)
$11.3
$11.1
$14.7
$18.9
$17.4
Quarter Ending
Summary Financial Information

Page 12
(1)Acquisitions closed subsequent to 9/30/2007, including cash flow adjustment paid to Legacy at deal closing.
(2)Excludes estimated offering expenses.
($ in millions)
9/30/2007
Acquisition
PIPE Offering
9/30/2007
Actual
Adjustments
(1)
Adjustments
(2)
Pro Forma
(2)
Cash
5.1
$
6.7
$
-
$
11.8
$
Total Debt
93.0
$
82.0
$
(75.0)
$
100.0
$
Partners' Equity
244.5
-
75.0
319.5
Total Capitalization
342.6
$
88.7
$
-
$
431.3
$
Pro Forma Capitalization
Page 13
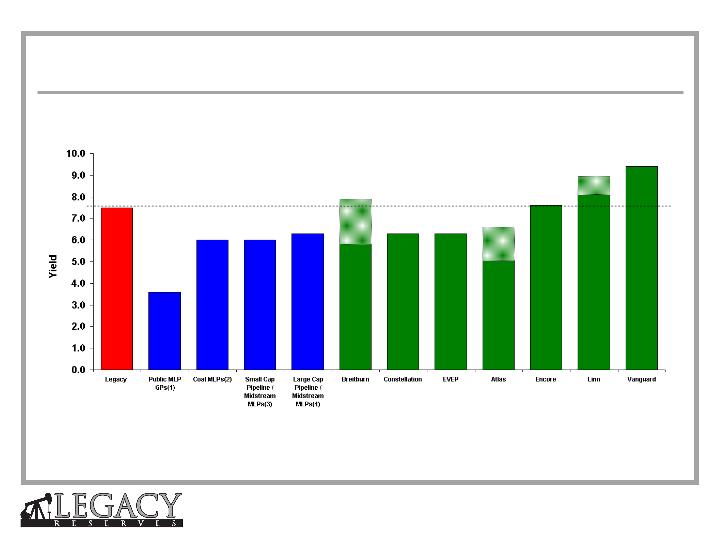
7.5%
3.6%
6.0%
6.0%
6.3%
5.8%
6.3%
6.3%
5.1%
8.1%
7.6%
Legacy as of 11/12/07. Other Energy MLP’s as of 11/8//07
As of 10/30/07:
(1) Includes General Partners of Alliance, Atlas, Buckeye, Crosstex, Energy Transfer, Enterprise, Hiland, Inergy, Magellan, Markwest, NuStar, Penn Virginia.
(2) Includes Alliance, Natural Resource Partners, Penn Virginia.
(3) Includes Atlas, Cheniere, Copano, Crosstex, DCP, Duncan, Eagle Rock, Genesis, Global, Hiland, Holly, Quicksilver, MarkWest, Martin, Regency, Sem Group, Spectra, Sunoco, Targa, TC, Transmontaigne, Williams.
(4) Includes Buckeye, Boardwalk, Enbridge, Energy Transfer, Enterprise, Kinder Morgan, Magellan, NuStar, Oneok, Plains, TEPPCO, NuStar.
7.9%
6.6%
9.0%
9.4%
Comparable Company Trading Yields
Page 14
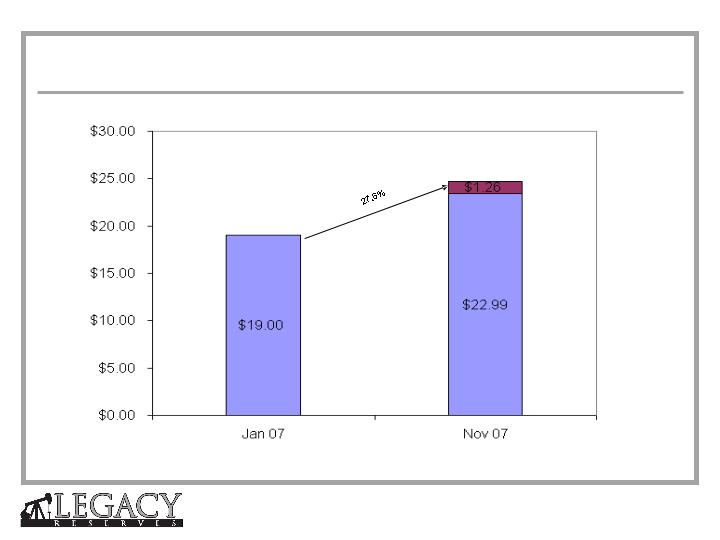
Note: Reflects closing price of 11/12/07
Legacy Unit Returns 2007 YTD
Page 15
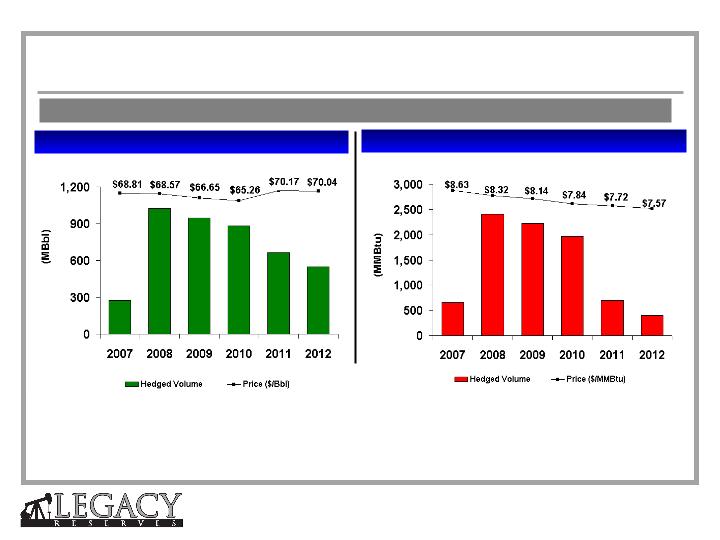
(1)WTI oil swaps used to hedge NGL production in 2009 (85,200 Bbls), 2010 (84,600 Bbls), 2011 (78,000 Bbls) and 2012 (75,600 Bbls).
(2)Includes NYMEX and Waha / ANR-OK swaps, where the latter indexes trade at a discount to NYMEX Henry Hub but better reflect what Legacy is paid for its
natural gas.
656 *
2,403
2,217
1,963
274 *
1,025
948
883
550
665
Oil (1)
Natural Gas (2)
Over 74% of forecasted production hedged for 2007-08 and over 60% hedged through 2010.
694
* 4th Quarter 2007 Volumes
404
Commodity Price Hedging Summary
Page 16
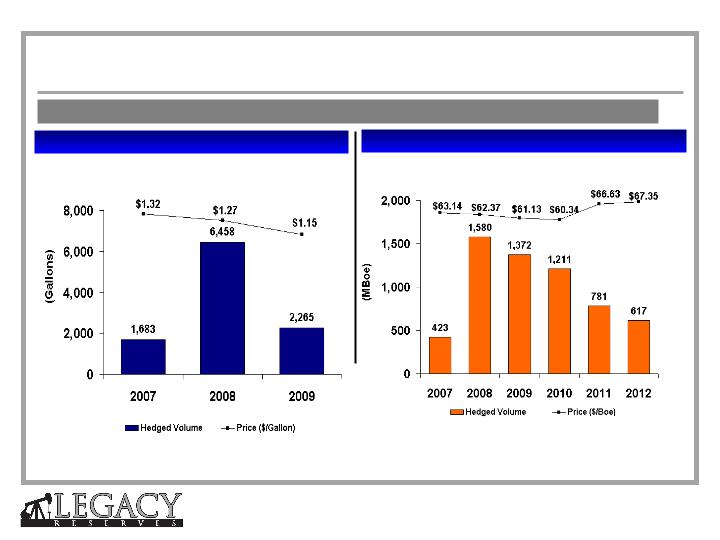
*
*
NGL’s
BOE’s
Over 74% of forecasted production hedged for 2007-08 and over 60% hedged through 2010.
* 4th Quarter 2007 volumes
Commodity Price Hedging Summary
Page 17
GP Interest
<0.1%
Public
Unitholders
32.4%
144A & PIPE
Unitholders
20%
Sellers of Assets to
Legacy
2.5%
Founding Investors,
Directors and Management
45%
Ticker:LGCY
Exchange:NASDAQ
Unit Price (11/12/07):$22.99 per unit
Quarterly Distribution:$0.43 per unit
Yield:7.5%
Market Capitalization:$683 million
Note: Ownership as of 11/12/07
Legacy Ownership

Page 18
Legacy Summary
qOnly MLP focused on the oil-weighted Permian Basin and Mid-continent regions
qExperienced management team with significant equity ownership
qSignificant organic and external growth opportunities
qLong-lived, diversified multi-pay properties
qDemonstrated reserve replacement capability
qLong-term hedges in place
qTax advantaged yield
qLow level of debt
qMLP structure with no IDRs

Page 19
Adjusted EBITDA Reconciliation
This presentation, the financial tables and other supplemental information, including the reconciliations
of certain non-generally accepted accounting principles ("non-GAAP") measures to their nearest
comparable generally accepted accounting principles ("GAAP") measures, may be used periodically
by management when discussing Legacy's financial results with investors and analysts and they are
also available on Legacy's website under the Investor Relations tab.  Adjusted EBITDA is defined in
our revolving credit facility as net income (loss) plus interest expense; depletion, depreciation,
amortization and accretion; impairment of long-lived assets; (gain) loss on sale of partnership
investment; (gain) loss on sale of assets; equity in (income) loss of partnerships; non-cash
compensation expense and unrealized (gain) loss on oil and natural gas swaps.  Adjusted EB
ITDA is
presented as management believes it provides additional information and metrics relative to the
performance of Legacy's business, such as the cash distributions we expect to pay to our unitholders,
as well as our ability to meet our debt covenant compliance tests. Management believes that these
financial measures indicate to investors whether or not cash flow is being generated at a level that can
sustain or support an increase in our quarterly distribution rates. Adjusted EBITDA may not be
comparable to a similarly titled measure of other publicly traded limited partnerships or limited liability
companies because all companies may not calculate Adjusted EBITDA in the same manner.
Page 20
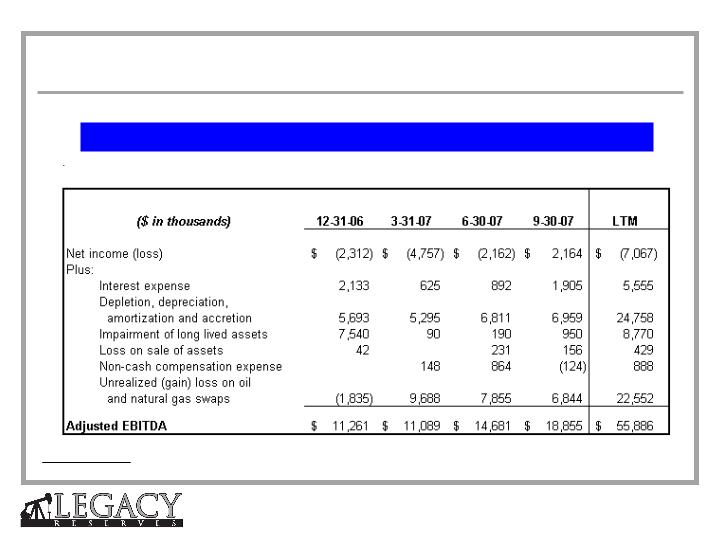
Note: Adjusted EBITDA is a non-GAAP financial measure.
Reconciliation of Net Income to Adjusted EBITDA
Adjusted EBITDA Reconciliation
Legacy Reserves LP