Hood River Small-Cap Growth Fund
Semi-Annual Report
December 31, 2016
Table of Contents
| Sector Allocation of Portfolio Assets | 3 |
| Schedule of Investments | 4 |
| Statement of Assets and Liabilities | 10 |
| Statement of Operations | 11 |
| Statements of Changes in Net Assets | 12 |
| Financial Highlights | 14 |
| Notes to the Financial Statements | 16 |
| Expense Example | 26 |
| Notice to Shareholders | 28 |
| Privacy Notice | 29 |
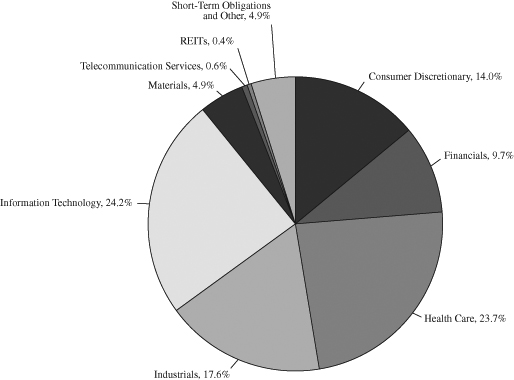
| SECTOR ALLOCATION OF PORTFOLIO ASSETS |
| at December 31, 2016 (Unaudited) |
Percentages represent market value as a percentage of net assets.
| SCHEDULE OF INVESTMENTS |
| at December 31, 2016 (Unaudited) |
| | | | | | | |
| COMMON STOCKS – 94.7% | | Shares | | | Value | |
| | | | | | | |
| CONSUMER DISCRETIONARY – 14.0% | | | | | | |
| | | | | | | |
| Auto Components – 1.4% | | | | | | |
| Drew Industries, Inc. | | | 22,027 | | | $ | 2,373,409 | |
| | | | | | | | | |
| Distributors – 1.2% | | | | | | | | |
| Pool Corp. | | | 19,797 | | | | 2,065,619 | |
| | | | | | | | | |
| Diversified Consumer Services – 1.8% | | | | | | | | |
| Chegg, Inc. (a) | | | 233,758 | | | | 1,725,134 | |
| Grand Canyon Education, Inc. (a) | | | 23,848 | | | | 1,393,916 | |
| | | | | | | | 3,119,050 | |
| Hotels, Restaurants & Leisure – 1.5% | | | | | | | | |
| SeaWorld Entertainment, Inc. | | | 141,279 | | | | 2,674,412 | |
| | | | | | | | | |
| Internet & Direct Marketing Retail – 0.7% | | | | | | | | |
| Nutrisystem, Inc. | | | 34,759 | | | | 1,204,399 | |
| | | | | | | | | |
| Leisure Products – 2.9% | | | | | | | | |
| Brunswick Corp. | | | 57,646 | | | | 3,144,013 | |
| Nautilus, Inc. (a) | | | 98,054 | | | | 1,813,999 | |
| | | | | | | | 4,958,012 | |
| Specialty Retail – 4.5% | | | | | | | | |
| Finish Line, Inc. | | | 71,772 | | | | 1,350,031 | |
| Genesco, Inc. (a) | | | 28,476 | | | | 1,768,360 | |
| Hibbett Sports, Inc. (a) | | | 33,971 | | | | 1,267,118 | |
| MarineMax, Inc. (a) | | | 63,297 | | | | 1,224,797 | |
| Sportsman’s Warehouse Holdings, Inc. (a) | | | 114,863 | | | | 1,078,564 | |
| Zumiez, Inc. (a) | | | 49,404 | | | | 1,079,477 | |
| | | | | | | | 7,768,347 | |
| TOTAL CONSUMER DISCRETIONARY | | | | | | | 24,163,248 | |
| | | | | | | | | |
| FINANCIALS – 9.7% | | | | | | | | |
| | | | | | | | | |
| Banks – 7.9% | | | | | | | | |
| Bank of the Ozarks, Inc. | | | 113,298 | | | | 5,958,342 | |
| IBERIABANK Corp. | | | 15,918 | | | | 1,333,132 | |
| Webster Financial Corp. | | | 31,867 | | | | 1,729,741 | |
| Western Alliance Bancorp (a) | | | 95,319 | | | | 4,642,988 | |
| | | | | | | | 13,664,203 | |
The accompanying notes are an integral part of these financial statements.
| SCHEDULE OF INVESTMENTS (Continued) |
| at December 31, 2016 (Unaudited) |
| | | | | | | |
| COMMON STOCKS – 94.7% (Continued) | | Shares | | | Value | |
| | | | | | | |
| FINANCIALS – 9.7% (Continued) | | | | | | |
| | | | | | | |
| Consumer Finance – 0.6% | | | | | | |
| PRA Group, Inc. (a) | | | 26,560 | | | $ | 1,038,496 | |
| | | | | | | | | |
| Insurance – 1.2% | | | | | | | | |
| James River Group Holdings Ltd. (c) | | | 34,414 | | | | 1,429,902 | |
| Kinsale Capital Group, Inc. | | | 17,920 | | | | 609,459 | |
| | | | | | | | 2,039,361 | |
| TOTAL FINANCIALS | | | | | | | 16,742,060 | |
| | | | | | | | | |
| HEALTH CARE – 23.7% | | | | | | | | |
| | | | | | | | | |
| Biotechnology – 4.8% | | | | | | | | |
| Agios Pharmaceuticals, Inc. (a) | | | 15,530 | | | | 648,067 | |
| Ligand Pharmaceuticals, Inc. (a) | | | 24,386 | | | | 2,477,861 | |
| MacroGenics, Inc. (a) | | | 66,449 | | | | 1,358,218 | |
| Neurocrine Biosciences, Inc. (a) | | | 28,335 | | | | 1,096,565 | |
| Prothena Corp. PLC (a)(c) | | | 24,865 | | | | 1,223,109 | |
| Ultragenyx Pharmaceutical, Inc. (a) | | | 21,906 | | | | 1,540,211 | |
| | | | | | | | 8,344,031 | |
| Health Care Equipment & Supplies – 6.1% | | | | | | | | |
| Integra LifeSciences Holdings Corp. (a) | | | 52,926 | | | | 4,540,522 | |
| NuVasive, Inc. (a) | | | 88,626 | | | | 5,969,847 | |
| | | | | | | | 10,510,369 | |
| Health Care Providers & Services – 6.5% | | | | | | | | |
| AMN Healthcare Services, Inc. (a) | | | 56,884 | | | | 2,187,190 | |
| Healthways, Inc. (a) | | | 125,346 | | | | 2,851,621 | |
| LHC Group, Inc. (a) | | | 25,241 | | | | 1,153,514 | |
| Surgical Care Affiliates, Inc. (a) | | | 21,712 | | | | 1,004,614 | |
| VCA, Inc. (a) | | | 33,061 | | | | 2,269,638 | |
| WellCare Health Plans, Inc. (a) | | | 12,105 | | | | 1,659,353 | |
| | | | | | | | 11,125,930 | |
| Health Care Technology – 2.0% | | | | | | | | |
| HMS Holdings Corp. (a) | | | 70,056 | | | | 1,272,217 | |
| Tabula Rasa HealthCare, Inc. (a) | | | 81,314 | | | | 1,218,084 | |
| Vocera Communications, Inc. (a) | | | 54,781 | | | | 1,012,900 | |
| | | | | | | | 3,503,201 | |
The accompanying notes are an integral part of these financial statements.
| SCHEDULE OF INVESTMENTS (Continued) |
| at December 31, 2016 (Unaudited) |
| | | | | | | |
| COMMON STOCKS – 94.7% (Continued) | | Shares | | | Value | |
| | | | | | | |
| HEALTH CARE – 23.7% (Continued) | | | | | | |
| | | | | | | |
| Life Sciences Tools & Services – 4.3% | | | | | | |
| Charles River Laboratories International, Inc. (a) | | | 35,718 | | | $ | 2,721,355 | |
| PRA Health Sciences, Inc. (a) | | | 84,958 | | | | 4,682,885 | |
| | | | | | | | 7,404,240 | |
| TOTAL HEALTH CARE | | | | | | | 40,887,771 | |
| | | | | | | | | |
| INDUSTRIALS – 17.6% | | | | | | | | |
| | | | | | | | | |
| Aerospace & Defense – 1.0% | | | | | | | | |
| Hexcel Corp. | | | 34,417 | | | | 1,770,410 | |
| | | | | | | | | |
| Building Products – 1.2% | | | | | | | | |
| Patrick Industries, Inc. (a) | | | 15,376 | | | | 1,173,189 | |
| PGT Innovations, Inc. (a) | | | 78,253 | | | | 895,997 | |
| | | | | | | | 2,069,186 | |
| Commercial Services & Supplies – 0.5% | | | | | | | | |
| Herman Miller, Inc. | | | 27,641 | | | | 945,322 | |
| | | | | | | | | |
| Construction & Engineering – 4.5% | | | | | | | | |
| MasTec, Inc. (a) | | | 159,249 | | | | 6,091,274 | |
| Quanta Services, Inc. (a) | | | 47,164 | | | | 1,643,666 | |
| | | | | | | | 7,734,940 | |
| Electrical Equipment – 0.7% | | | | | | | | |
| Energous Corp. (a) | | | 70,354 | | | | 1,185,465 | |
| | | | | | | | | |
| Professional Services – 3.4% | | | | | | | | |
| Navigant Consulting, Inc. (a) | | | 100,523 | | | | 2,631,692 | |
| On Assignment, Inc. (a) | | | 71,646 | | | | 3,163,887 | |
| | | | | | | | 5,795,579 | |
| Road & Rail – 3.5% | | | | | | | | |
| Old Dominion Freight Line, Inc. (a) | | | 37,204 | | | | 3,191,731 | |
| Swift Transportation Co. (a) | | | 120,183 | | | | 2,927,658 | |
| | | | | | | | 6,119,389 | |
| Trading Companies & Distributors – 1.7% | | | | | | | | |
| Beacon Roofing Supply, Inc. (a) | | | 35,960 | | | | 1,656,677 | |
| BMC Stock Holdings, Inc. (a) | | | 62,143 | | | | 1,211,789 | |
| | | | | | | | 2,868,466 | |
The accompanying notes are an integral part of these financial statements.
| SCHEDULE OF INVESTMENTS (Continued) |
| at December 31, 2016 (Unaudited) |
| | | | | | | |
| COMMON STOCKS – 94.7% (Continued) | | Shares | | | Value | |
| | | | | | | |
| INDUSTRIALS – 17.6% (Continued) | | | | | | |
| | | | | | | |
| Transportation Infrastructure – 1.1% | | | | | | |
| Macquarie Infrastructure Corp. | | | 22,819 | | | $ | 1,864,312 | |
| TOTAL INDUSTRIALS | | | | | | | 30,353,069 | |
| | | | | | | | | |
| INFORMATION TECHNOLOGY – 24.2% | | | | | | | | |
| | | | | | | | | |
| Communications Equipment – 4.6% | | | | | | | | |
| Applied Optoelectronics, Inc. (a) | | | 69,443 | | | | 1,627,744 | |
| Finisar Corp. (a) | | | 63,589 | | | | 1,924,839 | |
| Lumentum Holdings, Inc. (a) | | | 59,260 | | | | 2,290,399 | |
| Oclaro, Inc. (a) | | | 234,465 | | | | 2,098,462 | |
| | | | | | | | 7,941,444 | |
| Electronic Equipment, Instruments & Components – 2.8% | | | | | | | | |
| Airgain, Inc. (a) | | | 47,365 | | | | 682,056 | |
| Fabrinet (a)(c) | | | 31,265 | | | | 1,259,980 | |
| Orbotech Ltd. (a)(c) | | | 81,283 | | | | 2,715,665 | |
| Uni-Pixel, Inc. (a) | | | 127,472 | | | | 125,292 | |
| | | | | | | | 4,782,993 | |
| Internet Software & Services – 3.5% | | | | | | | | |
| 2U, Inc. (a) | | | 20,348 | | | | 613,492 | |
| Bazaarvoice, Inc. (a) | | | 281,612 | | | | 1,365,818 | |
| Brightcove, Inc. (a) | | | 72,502 | | | | 583,641 | |
| Five9, Inc. (a) | | | 119,124 | | | | 1,690,370 | |
| LogMeIn, Inc. | | | 17,615 | | | | 1,700,728 | |
| | | | | | | | 5,954,049 | |
| IT Services – 0.7% | | | | | | | | |
| CACI International, Inc. (a) | | | 9,437 | | | | 1,173,019 | |
| | | | | | | | | |
| Semiconductors & Semiconductor Equipment – 10.1% | | | | | | | | |
| Advanced Micro Devices, Inc. (a) | | | 523,322 | | | | 5,934,471 | |
| Axcelis Technologies, Inc. (a) | | | 78,348 | | | | 1,139,963 | |
| Cirrus Logic, Inc. (a) | | | 64,143 | | | | 3,626,645 | |
| FormFactor, Inc. (a) | | | 134,094 | | | | 1,501,853 | |
| Microsemi Corp. (a) | | | 72,336 | | | | 3,903,974 | |
| Nanometrics, Inc. (a) | | | 39,280 | | | | 984,357 | |
| Ultratech, Inc. (a) | | | 12,209 | | | | 292,772 | |
| | | | | | | | 17,384,035 | |
The accompanying notes are an integral part of these financial statements.
| SCHEDULE OF INVESTMENTS (Continued) |
| at December 31, 2016 (Unaudited) |
| | | | | | | |
| COMMON STOCKS – 94.7% (Continued) | | Shares | | | Value | |
| | | | | | | |
| INFORMATION TECHNOLOGY – 24.2% (Continued) | | | | | | |
| | | | | | | |
| Software – 2.5% | | | | | | |
| Callidus Software, Inc. (a) | | | 138,214 | | | $ | 2,321,995 | |
| Digimarc Corp. (a) | | | 39,931 | | | | 1,197,930 | |
| Proofpoint, Inc. (a) | | | 11,733 | | | | 828,937 | |
| | | | | | | | 4,348,862 | |
| TOTAL INFORMATION TECHNOLOGY | | | | | | | 41,584,402 | |
| | | | | | | | | |
| MATERIALS – 4.9% | | | | | | | | |
| | | | | | | | | |
| Chemicals – 2.4% | | | | | | | | |
| Ingevity Corp. (a) | | | 44,329 | | | | 2,431,889 | |
| Trinseo SA (c) | | | 28,649 | | | | 1,698,886 | |
| | | | | | | | 4,130,775 | |
| Construction Materials – 0.9% | | | | | | | | |
| US Concrete, Inc. (a) | | | 25,103 | | | | 1,644,246 | |
| | | | | | | | | |
| Containers & Packaging – 1.6% | | | | | | | | |
| Berry Plastics Group, Inc. (a) | | | 54,987 | | | | 2,679,517 | |
| TOTAL MATERIALS | | | | | | | 8,454,538 | |
| | | | | | | | | |
| TELECOMMUNICATION SERVICES – 0.6% | | | | | | | | |
| | | | | | | | | |
| Wireless Telecommunication Services – 0.6% | | | | | | | | |
| Boingo Wireless, Inc. (a) | | | 88,321 | | | | 1,076,633 | |
| TOTAL TELECOMMUNICATION SERVICES | | | | | | | 1,076,633 | |
| TOTAL COMMON STOCKS | | | | | | | | |
| (Cost $134,100,516) | | | | | | | 163,261,721 | |
The accompanying notes are an integral part of these financial statements.
| SCHEDULE OF INVESTMENTS (Continued) |
| at December 31, 2016 (Unaudited) |
| | | | | | | |
| REITS – 0.4% | | Shares | | | Value | |
| Hannon Armstrong Sustainable | | | | | | |
| Infrastructure Capital, Inc. | | | 40,542 | | | $ | 769,892 | |
| TOTAL REITS | | | | | | | | |
| (Cost $731,069) | | | | | | | 769,892 | |
| | | | | | | | | |
| | | | | | | | | |
| RIGHTS – 0.0% | | | | | | | | |
| Dyax Corp. – Contingent Value Rights (a)(d)(e) | | | 26,407 | | | | 0 | |
| TOTAL RIGHTS | | | | | | | | |
| (Cost $0) | | | | | | | 0 | |
| | | | | | | | | |
| | | | | | | | | |
| SHORT-TERM INVESTMENTS – 4.4% | | | | | | | | |
| MONEY MARKET FUNDS – 4.4% | | | | | | | | |
| First American Treasury Obligations Fund – | | | | | | | | |
| Class Z, 0.39% (b) | | | 7,556,591 | | | | 7,556,591 | |
| TOTAL SHORT-TERM INVESTMENTS | | | | | | | | |
| (Cost $7,556,591) | | | | | | | 7,556,591 | |
| TOTAL INVESTMENTS | | | | | | | | |
| (Cost $142,388,176) – 99.5% | | | | | | | 171,588,204 | |
| Other Assets in Excess of Liabilities – 0.5% | | | | | | | 832,587 | |
| TOTAL NET ASSETS – 100.0% | | | | | | $ | 172,420,791 | |
Percentages are stated as a percent of net assets.
| (a) | Non-income producing security. |
| (b) | The rate shown represents the fund’s 7-day yield as of December 31, 2016. |
| (c) | U.S. traded security of a foreign issuer or corporation. |
| (d) | Illiquid security; a security may be considered illiquid if it lacks a readily available market. As of December 31, 2016, the value of these securities was $0 or 0.00% of total net assets. |
| (e) | Security valued at fair value using methods determined in good faith by or at the discretion of members of the Valuation Committee. |
The Global Industry Classification Standard (GICS®) was developed by and/or is the exclusive property of MSCI, Inc. and Standard & Poor’s Financial Services LLC (“S&P”). GICS is a service mark of MSCI and S&P and has been licensed for use by Hood River Capital Management LLC.
The accompanying notes are an integral part of these financial statements.
| STATEMENT OF ASSETS AND LIABILITIES |
| at December 31, 2016 (Unaudited) |
| Assets: | | | |
| Investments, at value (cost of $142,388,176) | | $ | 171,588,204 | |
| Receivables: | | | | |
| Securities sold | | | 3,890,044 | |
| Fund shares sold | | | 405,326 | |
| Dividends and interest | | | 57,639 | |
| Prepaid expenses | | | 33,002 | |
| Total assets | | | 175,974,215 | |
| | | | | |
| Liabilities: | | | | |
| Payables: | | | | |
| Securities purchased | | | 3,314,122 | |
| Fund shares redeemed | | | 16,489 | |
| Advisory fee | | | 132,737 | |
| Administration and accounting fees | | | 39,736 | |
| Distribution fees | | | 387 | |
| Reports to shareholders | | | 8,109 | |
| Compliance expense | | | 3,050 | |
| Custody fees | | | 4,390 | |
| Trustee fees | | | 1,729 | |
| Transfer agent fees and expenses | | | 17,079 | |
| Other accrued expenses | | | 15,596 | |
| Total liabilities | | | 3,553,424 | |
| Net assets | | $ | 172,420,791 | |
| | | | | |
| Net assets consist of: | | | | |
| Capital stock | | $ | 144,086,857 | |
| Accumulated net investment loss | | | (1,076,442 | ) |
| Accumulated net realized gain on investments | | | 210,348 | |
| Net unrealized appreciation on investments | | | 29,200,028 | |
| Net assets | | $ | 172,420,791 | |
| | | | | |
| Investor Shares: | | | | |
| Net assets applicable to outstanding Investor Class shares | | $ | 1,051,873 | |
| Shares issued (Unlimited number of beneficial | | | | |
| interest authorized, $0.01 par value) | | | 31,515 | |
| Net asset value and redemption price per share | | $ | 33.38 | |
| | | | | |
| Institutional Shares: | | | | |
| Net assets applicable to outstanding Institutional Class shares | | $ | 171,368,918 | |
| Shares issued (Unlimited number of beneficial | | | | |
| interest authorized, $0.01 par value) | | | 5,120,206 | |
| Net asset value, offering price and redemption price per share | | $ | 33.47 | |
The accompanying notes are an integral part of these financial statements.
| STATEMENT OF OPERATIONS |
| For the Six Months Ended December 31, 2016 (Unaudited) |
| Investment income: | | | |
| Dividends | | $ | 277,211 | |
| Interest | | | 7,627 | |
| Total investment income | | | 284,838 | |
| | | | | |
| Expenses: | | | | |
| Advisory fees (Note 4) | | | 780,035 | |
| Administration and accounting fees (Note 4) | | | 57,235 | |
| Distribution fees (Note 5) | | | | |
| Distribution fees – Investor Shares | | | 399 | |
| Transfer agent fees and expenses | | | 29,486 | |
| Federal and state registration fees | | | 30,114 | |
| Audit fees | | | 9,746 | |
| Compliance expense | | | 6,050 | |
| Legal fees | | | 4,050 | |
| Reports to shareholders | | | 2,857 | |
| Trustees’ fees and expenses | | | 4,790 | |
| Custody fees | | | 12,838 | |
| Other | | | 5,033 | |
| Total expenses before reimbursement from advisor | | | 942,633 | |
| Expenses waived by advisor (Note 4) | | | (92,031 | ) |
| Net expenses | | | 850,602 | |
| Net investment loss | | | (565,764 | ) |
| | | | | |
| Realized and unrealized gain on investments: | | | | |
| Net realized gain on investments | | | 8,774,289 | |
| Net change in unrealized appreciation on investments | | | 16,352,764 | |
| Net realized and unrealized gain on investments | | | 25,127,053 | |
| Net increase in net assets resulting from operations | | $ | 24,561,289 | |
The accompanying notes are an integral part of these financial statements.
| STATEMENTS OF CHANGES IN NET ASSETS |
| |
| | | Six Months Ended | | | | |
| | | December 31, 2016 | | | Year Ended | |
| | | (Unaudited) | | | June 30, 2016 | |
| Operations: | | | | | | |
| Net investment loss | | $ | (565,764 | ) | | $ | (510,678 | ) |
| Net realized gain (loss) on investments | | | 8,774,289 | | | | (7,303,117 | ) |
| Net change in unrealized appreciation | | | | | | | | |
| (depreciation) on investments | | | 16,352,764 | | | | (3,148,437 | ) |
| Net increase (decrease) in net assets | | | | | | | | |
| resulting from operations | | | 24,561,289 | | | | (10,962,232 | ) |
| | | | | | | | | |
| Distributions to Shareholders From: | | | | | | | | |
| Net realized gains | | | | | | | | |
| Investor shares | | | — | | | | (374 | ) |
| Institutional shares | | | — | | | | (6,796,491 | ) |
| Total distributions | | | — | | | | (6,796,865 | ) |
| | | | | | | | | |
| Capital Share Transactions: | | | | | | | | |
| Proceeds from shares sold | | | | | | | | |
| Investor shares | | | 1,033,943 | | | | 37,225 | |
| Institutional shares | | | 35,899,745 | | | | 77,470,215 | |
| Proceeds from shares issued to holders | | | | | | | | |
| in reinvestment of dividends | | | | | | | | |
| Investor shares | | | — | | | | 374 | |
| Institutional shares | | | — | | | | 6,283,327 | |
| Cost of shares redeemed | | | | | | | | |
| Investor shares | | | (65,837 | ) | | | (12 | ) |
| Institutional shares | | | (22,389,620 | ) | | | (29,984,212 | ) |
| Redemption fees retained | | | | | | | | |
| Investor shares | | | 658 | | | | 1 | |
| Institutional shares | | | 2,943 | | | | 15,296 | |
| Net increase in net assets from | | | | | | | | |
| capital share transactions | | | 14,481,832 | | | | 53,822,214 | |
| Total increase in net assets | | | 39,043,121 | | | | 36,063,117 | |
| | | | | | | | | |
| Net Assets: | | | | | | | | |
| Beginning of period | | | 133,377,670 | | | | 97,314,553 | |
| End of period | | $ | 172,420,791 | | | $ | 133,377,670 | |
| Accumulated net investment loss | | $ | (1,076,442 | ) | | $ | (510,678 | ) |
The accompanying notes are an integral part of these financial statements.
| STATEMENTS OF CHANGES IN NET ASSETS (Continued) |
| |
| | | Six Months Ended | | | | |
| | | December 31, 2016 | | | Year Ended | |
| | | (Unaudited) | | | June 30, 2016 | |
| Changes in Shares Outstanding: | | | | | | |
| Shares sold | | | | | | |
| Investor shares | | | 32,161 | | | | 1,359 | |
| Institutional shares | | | 1,119,468 | | | | 2,630,309 | |
| Proceeds from shares issued to holders | | | | | | | | |
| in reinvestment of dividends | | | | | | | | |
| Investor shares | | | — | | | | 13 | |
| Institutional shares | | | — | | | | 213,937 | |
| Shares redeemed | | | | | | | | |
| Investor shares | | | (2,017 | ) | | | (1 | ) |
| Institutional shares | | | (707,548 | ) | | | (1,046,825 | ) |
| Net increase in shares outstanding | | | 442,064 | | | | 1,798,792 | |
The accompanying notes are an integral part of these financial statements.
For a capital share outstanding throughout the period
Investor Shares
| | | Six Months | | | July 7, | |
| | | Ended | | | 2015 | |
| | | December 31, | | | through | |
| | | 2016 | | | June 30, | |
| | | (Unaudited) | | | 2016* | |
| Net Asset Value – Beginning of Period | | $ | 28.25 | | | $ | 33.18 | |
| | | | | | | | | |
| Income from Investment Operations: | | | | | | | | |
Net investment loss1 | | | (0.14 | ) | | | (0.19 | ) |
| Net realized and unrealized gain (loss) on investments | | | 5.20 | | | | (3.05 | ) |
| Total from investment operations | | | 5.06 | | | | (3.24 | ) |
| | | | | | | | | |
| Less Distributions: | | | | | | | | |
| Distributions from net realized gains | | | — | | | | (1.69 | ) |
| Total distributions | | | — | | | | (1.69 | ) |
| | | | | | | | | |
| Redemption fees | | | 0.07 | | | | — | 2 |
| | | | | | | | | |
| Net Asset Value – End of Period | | $ | 33.38 | | | $ | 28.25 | |
| | | | | | | | | |
| Total Return | | 18.16 | %^ | | (9.96 | %)^ |
| | | | | | | | | |
| Ratios and Supplemental Data: | | | | | | | | |
| Net assets, end of period (thousands) | | $ | 1,052 | | | $ | 39 | |
| Ratio of operating expenses to average net assets: | | | | | | | | |
| Before Waivers | | | 1.47 | %+ | | | 1.65 | %+ |
| After Waivers | | | 1.34 | %+ | | | 1.34 | %+ |
| Ratio of net investment income (loss) to average net assets: | | | | | | | | |
| Before Waivers | | | (0.98 | )%+ | | | (0.99 | )%+ |
| After Waivers | | | (0.85 | )%+ | | | (0.68 | )%+ |
| Portfolio turnover rate | | 71 | %^ | | | 170 | %3 |
| * | Operations commenced for the Investor Shares on July 7, 2015. |
| + | Annualized |
| ^ | Not Annualized |
1 | The net investment income (loss) per share was calculated using the average shares outstanding method. |
2 | Amount is less than $0.01. |
3 | Portfolio turnover was calculated on the basis of the Fund as a whole. The rate presented represents portfolio turnover for the entire fiscal year. |
The accompanying notes are an integral part of these financial statements.
For a capital share outstanding throughout the period
Institutional Shares
| | | Six Months | | | | | | | | | | | | | | | | |
| | | Ended | | | Year | | | Year | | | Year | | | Year | | | Year | |
| | | December 31, | | | Ended | | | Ended | | | Ended | | | Ended | | | Ended | |
| | | 2016 | | | June 30, | | | June 30, | | | June 30, | | | June 30, | | | June 30, | |
| | | (Unaudited) | | | 2016 | | | 2015 | | | 2014 | | | 2013 | | | 2012 | |
| Net Asset Value – | | | | | | | | | | | | | | | | | | |
| Beginning of Period | | $ | 28.32 | | | $ | 33.43 | | | $ | 29.09 | | | $ | 23.31 | | | $ | 17.72 | | | $ | 18.40 | |
| | | | | | | | | | | | | | | | | | | | | | | | | |
| Income from | | | | | | | | | | | | | | | | | | | | | | | | |
| Investment Operations: | | | | | | | | | | | | | | | | | | | | | | | | |
Net investment loss1 | | | (0.12 | ) | | | (0.13 | ) | | | (0.24 | ) | | | (0.22 | ) | | | (0.12 | ) | | | (0.15 | ) |
| Net realized and | | | | | | | | | | | | | | | | | | | | | | | | |
| unrealized gain (loss) | | | | | | | | | | | | | | | | | | | | | | | | |
| on investments | | | 5.27 | | | | (3.29 | ) | | | 4.58 | | | | 6.00 | | | | 5.71 | | | | (0.53 | ) |
| Total from | | | | | | | | | | | | | | | | | | | | | | | | |
| investment operations | | | 5.15 | | | | (3.42 | ) | | | 4.34 | | | | 5.78 | | | | 5.59 | | | | (0.68 | ) |
| | | | | | | | | | | | | | | | | | | | | | | | | |
| Less Distributions: | | | | | | | | | | | | | | | | | | | | | | | | |
| Distributions from net | | | | | | | | | | | | | | | | | | | | | | | | |
| realized gains | | | — | | | | (1.69 | ) | | | — | | | | — | | | | — | | | | — | |
| Total distributions | | | — | | | | (1.69 | ) | | | — | | | | — | | | | — | | | | — | |
| | | | | | | | | | | | | | | | | | | | | | | | | |
| Redemption fees | | | — | 2 | | | — | 2 | | | — | 2 | | | — | 2 | | | — | 2 | | | — | 2 |
| | | | | | | | | | | | | | | | | | | | | | | | | |
| Net Asset Value – | | | | | | | | | | | | | | | | | | | | | | | | |
| End of Period | | $ | 33.47 | | | $ | 28.32 | | | $ | 33.43 | | | $ | 29.09 | | | $ | 23.31 | | | $ | 17.72 | |
| | | | | | | | | | | | | | | | | | | | | | | | | |
| Total Return | | 18.18 | %^ | | | (10.41 | %) | | | 14.92 | % | | | 24.80 | % | | | 31.55 | % | | | (3.70 | %) |
| | | | | | | | | | | | | | | | | | | | | | | | | |
| Ratios and | | | | | | | | | | | | | | | | | | | | | | | | |
| Supplemental Data: | | | | | | | | | | | | | | | | | | | | | | | | |
| Net assets, end of | | | | | | | | | | | | | | | | | | | | | | | | |
| period (thousands) | | $ | 171,369 | | | $ | 133,339 | | | $ | 97,315 | | | $ | 83,966 | | | $ | 59,893 | | | $ | 57,643 | |
| Ratio of operating | | | | | | | | | | | | | | | | | | | | | | | | |
| expenses to average | | | | | | | | | | | | | | | | | | | | | | | | |
| net assets: | | | | | | | | | | | | | | | | | | | | | | | | |
| Before Waivers | | | 1.21 | %+ | | | 1.40 | % | | | 1.45 | % | | | 1.48 | % | | | 1.59 | % | | | 1.57 | % |
| After Waivers | | | 1.09 | %+ | | | 1.09 | % | | | 1.20 | % | | | 1.25 | % | | | 1.25 | % | | | 1.25 | % |
| Ratio of net investment | | | | | | | | | | | | | | | | | | | | | | | | |
| income (loss) to | | | | | | | | | | | | | | | | | | | | | | | | |
| average net assets: | | | | | | | | | | | | | | | | | | | | | | | | |
| Before Waivers | | | (0.84 | %)+ | | | (0.75 | %) | | | (1.04 | %) | | | (1.05 | %) | | | (0.92 | %) | | | (1.20 | %) |
| After Waivers | | | (0.72 | %)+ | | | (0.44 | %) | | | (0.79 | %) | | | (0.82 | %) | | | (0.58 | %) | | | (0.88 | )% |
| Portfolio turnover rate | | 71 | %^ | | | 170 | % | | | 142 | % | | | 115 | % | | | 119 | % | | | 138 | % |
+ | Annualized |
| ^ | Not Annualized |
1 | The net investment loss per share was calculated using the average shares outstanding method. |
2 | Amount is less than $0.01. |
The accompanying notes are an integral part of these financial statements.
| NOTES TO FINANCIAL STATEMENTS |
| at December 31, 2016 (Unaudited) |
NOTE 1 – ORGANIZATION
The Hood River Small-Cap Growth Fund (formerly, the Roxbury/Hood River Small-Cap Growth Fund) (the “Small-Cap Growth Fund” or the “Fund”) is a series of Manager Directed Portfolios (formerly, The Roxbury Funds) (the “Trust”). The Trust is registered under the Investment Company Act of 1940, as amended (the “1940 Act”), as a diversified open-end investment management company and was organized as a Delaware statutory trust on April 4, 2006. The investment objective of the Fund is long-term growth of capital. The Fund’s Institutional Shares commenced operations on January 2, 2003. The Fund’s Investor Shares commenced operations on July 7, 2015. Each class of shares differs principally in its respective distribution expenses. Each class of shares has identical rights to earnings, assets and voting privileges, except for class-specific expenses and exclusive rights to vote on matters affecting only individual classes.
NOTE 2 – SIGNIFICANT ACCOUNTING POLICIES
The following is a summary of significant accounting policies consistently followed by the Fund. These policies are in conformity with U.S. generally accepted accounting principles (“GAAP”).
| | A. | Security Valuation: All investments in securities are recorded at their estimated fair value, as described in Note 3. |
| | B. | Federal Income Taxes: It is the Fund’s policy to comply with the requirements of Subchapter M of the Internal Revenue Code applicable to regulated investment companies and to distribute substantially all of its taxable income to its shareholders. Therefore, no federal income or excise tax provisions are required. |
| | | The Fund recognizes the tax benefits of uncertain tax positions only where the position is “more likely than not” to be sustained assuming examination by tax authorities. Management has analyzed the Fund’s tax positions, and has concluded that no liability for unrecognized tax benefits should be recorded related to uncertain tax positions to be taken or expected to be taken on a tax return. The tax returns for the Fund for the prior three fiscal years are open for examination. The Fund identifies its major tax jurisdictions as U.S. Federal and the state of Delaware. |
| | C. | Securities Transactions, Income and Distributions: Securities transactions are accounted for on the trade date. Realized gains and losses on securities sold are determined on the basis of identified cost. Interest income is recorded on an accrual basis. Dividend income and distributions to shareholders are recorded on the ex-dividend date. Withholding taxes on foreign dividends have been provided for in accordance with the Fund’s understanding of the applicable country’s tax rules and rates. |
| | | The Fund distributes substantially all of its net investment income, if any, and net realized capital gains, if any, annually. Distributions from net realized gains for |
| NOTES TO FINANCIAL STATEMENTS (Continued) |
| at December 31, 2016 (Unaudited) |
| | | book purposes may include short-term capital gains. All short-term capital gains are included in ordinary income for tax purposes. The amount of dividends and distributions to shareholders from net investment income and net realized capital gains is determined in accordance with federal income tax regulations, which differ from GAAP. To the extent these book/tax differences are permanent, such amounts are reclassified within the capital accounts based on their federal tax treatment. |
| | | Investment income, expenses (other than those specific to the class of shares), and realized and unrealized gains and losses on investments are allocated to the separate classes of the Fund’s shares based upon their relative net assets on the date income is earned or expensed and realized and unrealized gains and losses are incurred. |
| | | The Fund is charged for those expenses that are directly attributable to it, such as investment advisory, custody and transfer agent fees. Expenses that are not attributable to a Fund are typically allocated among the funds in the Trust proportionately based on allocation methods approved by the Board of Trustees (the “Board”). Common expenses of the Trust are typically allocated among the funds in the Trust based on a fund’s respective net assets, or by other equitable means. |
| | D. | Use of Estimates: The preparation of financial statements in conformity with GAAP requires management to make estimates and assumptions that affect the reported amounts of assets and liabilities at the date of the financial statements and the reported amounts of increases and decreases in net assets during the reporting period. Actual results could differ from those estimates. |
| | E. | Redemption Fees: Each share class of the Hood River Small-Cap Growth Fund charges a 1% redemption fee to most shareholders who redeem shares held for 60 days or less. Such fees are retained by the Fund and accounted for as an addition to paid-in capital. |
| | F. | Mutual Fund and ETF Trading Risk: The Fund may invest in other mutual funds that are either open-end or closed-end investment companies as well as ETFs. ETFs are investment companies that are bought and sold on a national securities exchange. Unlike mutual funds, ETFs do not necessarily trade at the net asset values of their underlying securities, which means an ETF could potentially trade above or below the value of the underlying portfolios. Additionally, because ETFs trade like stocks on exchanges, they are subject to trading and commission costs unlike mutual funds. Also, both mutual funds and ETFs have management fees that are part of its costs, and the Fund will indirectly bear their proportionate share of the costs. |
| | G. | Reclassification of Capital Accounts: GAAP requires that certain components of net assets relating to permanent differences be reclassified between financial and tax reporting. These reclassifications have no effect on net assets or net asset value per share. For the most recent fiscal year end, the Fund made the following permanent tax adjustments on the Statement of Assets and Liabilities: |
| NOTES TO FINANCIAL STATEMENTS (Continued) |
| at December 31, 2016 (Unaudited) |
| | | Accumulated | Accumulated | |
| | | Net Investment | Net Realized | Capital |
| | | Income/(Loss) | Gain/(Loss) | Stock |
| | Small-Cap Growth Fund | $293,210 | $ — | $(293,210) |
NOTE 3 – SECURITIES VALUATION
The Fund has adopted authoritative fair value accounting standards which establish an authoritative definition of fair value and set out a hierarchy for measuring fair value. These standards require additional disclosures about the various inputs and valuation techniques used to develop the measurements of fair value, a discussion of changes in valuation techniques and related inputs during the period, and expanded disclosure of valuation levels for major security types. These inputs are summarized in the three broad levels listed below:
| | Level 1 – | Unadjusted quoted prices in active markets for identical assets or liabilities that the Fund has the ability to access. |
| | Level 2 – | Observable inputs other than quoted prices included in level 1 that are observable for the asset or liability, either directly or indirectly. These inputs may include quoted prices for the identical instrument on an inactive market, prices for similar instruments, interest rates, prepayment speeds, credit risk, yield curves, default rates and similar data. |
| | Level 3 – | Unobservable inputs for the asset or liability, to the extent relevant observable inputs are not available, representing the Fund’s own assumptions about the assumptions a market participant would use in valuing the asset or liability, and would be based on the best information available. |
Following is a description of the valuation techniques applied to the Fund’s major categories of assets and liabilities measured at fair value on a recurring basis.
Equity Securities: Equity securities, including common stocks, preferred stocks, foreign-issued common stocks, exchange-traded funds, closed-end mutual funds and real estate investment trusts (REITs), that are primarily traded on a national securities exchange shall be valued at the last sale price on the exchange on which they are primarily traded on the day of valuation or, if there has been no sale on such day, at the mean between the bid and asked prices. Securities primarily traded in the NASDAQ Global Market System for which market quotations are readily available shall be valued using the NASDAQ Official Closing Price (“NOCP”). If the NOCP is not available, such securities shall be valued at the last sale price on the day of valuation, or if there has been no sale on such day, at the mean between the bid and asked prices. Over-the-counter securities which are not traded in the NASDAQ Global Market System shall be valued at the mean between the bid and asked prices. To the extent these securities are actively traded and valuation adjustments are not applied, they are categorized in level 1 of the fair value hierarchy.
| NOTES TO FINANCIAL STATEMENTS (Continued) |
| at December 31, 2016 (Unaudited) |
Investment Companies: Investments in open-end mutual funds, including money market funds, are generally priced at their net asset value per share and will be classified in level 1 of the fair value hierarchy.
The Board delegated day-to-day valuation issues to a Valuation Committee of the Trust which, as of December 31, 2016, was comprised of representatives from U.S.Bancorp Fund Services, LLC, the Fund’s administrator. The function of the Valuation Committee is to value securities where current and reliable market quotations are not readily available, or the closing price does not represent fair value, by following procedures approved by the Board. These procedures consider many factors, including the type of security, size of holding, trading volume and news events. All actions taken by the Valuation Committee are subsequently reviewed and ratified by the Board.
Depending on the relative significance of the valuation inputs, fair valued securities may be classified in either level 2 or level 3 of the fair value hierarchy.
The inputs or methodology used for valuing securities are not an indication of the risk associated with investing in those securities. The following is a summary of the fair valuation hierarchy of the Small-Cap Growth Fund’s securities as of December 31, 2016:
| | | Level 1 | | | Level 2 | | | Level 3 | | | Total | |
| Common Stocks | | | | | | | | | | | | |
| Consumer Discretionary | | $ | 24,163,248 | | | $ | — | | | $ | — | | | $ | 24,163,248 | |
| Financials | | | 16,742,060 | | | | — | | | | — | | | | 16,742,060 | |
| Health Care | | | 40,887,771 | | | | — | | | | — | | | | 40,887,771 | |
| Industrials | | | 30,353,069 | | | | — | | | | — | | | | 30,353,069 | |
| Information Technology | | | 41,584,402 | | | | — | | | | — | | | | 41,584,402 | |
| Materials | | | 8,454,538 | | | | — | | | | — | | | | 8,454,538 | |
| Telecommunication Services | | | 1,076,633 | | | | — | | | | — | | | | 1,076,633 | |
| Total Common Stock | | | 163,261,721 | | | | — | | | | — | | | | 163,261,721 | |
| REITs | | | 769,892 | | | | — | | | | — | | | | 769,892 | |
| Rights | | | — | | | | — | | | | — | | | | — | |
| Short-Term Investments | | | 7,556,591 | | | | — | | | | — | | | | 7,556,591 | |
| Total Investments in Securities | | $ | 171,588,204 | | | $ | — | | | $ | — | | | $ | 171,588,204 | |
Refer to the Fund’s schedule of investments for a detailed break-out of securities by industry classification. Transfers between levels are recognized at the end of the reporting period. During the six months ended December 31, 2016, the Fund recognized no transfers between levels. There was one level 3 security held in the Fund on December 31, 2016.
| NOTES TO FINANCIAL STATEMENTS (Continued) |
| at December 31, 2016 (Unaudited) |
Level 3 Reconciliation Disclosure
The following is a reconciliation of Level 3 assets for which significant unobservable inputs were used to determine fair value.
| | | Investments in Securities, at Value |
| | Balance as of June 30, 2016 | | $ | — | |
| | Accrued discounts/premiums | | | — | |
| | Realized gain/(loss) | | | — | |
| | Change in unrealized appreciation/(depreciation) | | | — | |
| | Purchases | | | — | |
| | Sales | | | — | |
| | Transfers in and/or out of level 3 | | | — | |
| | Balance as of December 31, 2016 | | $ | — | * |
| | * | On January 25, 2016, the Fund held common shares of Dyax Corp (DYAX). DYAX was acquired by Shire and the Fund received in exchange for each DYAX share a payment in cash, as well as a contingent value right (CVR). With no observable market price for the CVR, there is no objective ongoing source of valuation data for this instrument. Accordingly, the security is valued at zero and categorized as level 3 on the fair value hierarchy. |
The Level 3 investments as of December 31, 2016, represented 0.00% of net assets and did not warrant a disclosure of significant unobservable inputs.
NOTE 4 – INVESTMENT ADVISORY FEE AND OTHER TRANSACTIONS WITH AFFILIATES
For the six months ended December 31, 2016, Hood River Capital Management LLC, (the “Advisor”) provided the Fund with investment management services under an Investment Advisory Agreement. The Advisor furnishes all investment advice, office space, and facilities, and provides most of the personnel needed by the Fund. As compensation for its services, the Advisor is entitled to a monthly fee at an annual rate of 1.00% for the Small-Cap Growth Fund based upon the average daily net assets of the Fund. For the six months ended December 31, 2016, the Small-Cap Growth Fund incurred $780,035 in advisory fees. Advisory fees payable at December 31, 2016 for the Small-Cap Growth Fund were $132,737.
The Fund is responsible for its own operating expenses. The Advisor has contractually agreed to waive its fees and/or absorb expenses of the Fund to ensure that the net annual operating expenses [excluding Acquired Fund Fees and Expenses, taxes, brokerage commissions, interest and extraordinary expenses (collectively, “Excludable Expenses”)] do not exceed the following amounts of the average daily net assets for each class of shares:
| Small-Cap Growth Fund |
| Investor Shares | 1.34% |
| Institutional Shares | 1.09% |
| NOTES TO FINANCIAL STATEMENTS (Continued) |
| at December 31, 2016 (Unaudited) |
For the six months ended December 31, 2016, the Advisor reduced its fees and absorbed Fund expenses in the amount of $92,031 for the Small-Cap Growth Fund.
U.S. Bancorp Fund Services, LLC (the “Administrator”) acts as the Fund’s Administrator under an Administration Agreement. The Administrator prepares various federal and state regulatory filings, reports and returns for the Fund; prepares reports and materials to be supplied to the Trustees; monitors the activities of the Fund’s custodian, transfer agent and accountants; coordinates the preparation and payment of the Fund’s expenses and reviews the Fund’s expense accruals. U.S. Bancorp Fund Services, LLC also serves as the fund accountant and transfer agent to the Fund. Vigilant Compliance, LLC serves as the Chief Compliance Officer to the Fund. U.S. Bank N.A., an affiliate of U.S. Bancorp Fund Services, serves as the Fund’s custodian. For the six months ended December 31, 2016, the Fund incurred the following expenses for administration, fund accounting, transfer agency, custody and Chief Compliance Officer fees:
| | Administration & fund accounting | | $ | 57,235 | |
| | Custody | | $ | 12,838 | |
| | Transfer agency(a) | | $ | 19,606 | |
| | Chief Compliance Officer | | $ | 6,050 | |
| | | | | | |
| | (a) Does not include out-of-pocket expenses. | | | | |
At December 31, 2016, the Fund had payables due to U.S. Bancorp Fund Services, LLC for administration, fund accounting, transfer agency and Chief Compliance Officer fees and to U.S. Bank N.A. for custody fees in the following amounts:
| | Administration & fund accounting | | $ | 39,736 | |
| | Custody | | $ | 4,390 | |
| | Transfer agency(a) | | $ | 9,918 | |
| | Chief Compliance Officer | | $ | 3,050 | |
| | | | | | |
| | (a) Does not include out-of-pocket expenses. | | | | |
Quasar Distributors, LLC (the “Distributor”) acts as the Fund’s principal underwriter in a continuous public offering of the Fund’s shares. The Distributor is an affiliate of the Administrator.
Certain officers of the Fund are employees of the Administrator. A Trustee of the Trust is affiliated with USBFS and U.S. Bank N.A. This same Trustee is an interested person of the Distributor.
NOTE 5 – DISTRIBUTION AGREEMENT AND PLAN
The Fund has adopted a Distribution Plan pursuant to Rule 12b-1 (the “Plan”). The Plan permits the Fund to pay for distribution and related expenses at an annual rate of up to 0.25% of the average daily net assets of the Fund’s Investor Class shares. The expenses covered by the Plan may include costs in connection with the promotion and distribution of shares and the provision of personal services to shareholders, including, but not necessarily
| NOTES TO FINANCIAL STATEMENTS (Continued) |
| at December 31, 2016 (Unaudited) |
limited to, advertising, compensation to underwriters, dealers and selling personnel, the printing and mailing of prospectuses to other than current Fund shareholders, and the printing and mailing of sales literature. Payments made pursuant to the Plan will represent compensation for distribution and service activities, not reimbursements for specific expenses incurred. For the six months ended December 31, 2016, the Small-Cap Growth Fund incurred distribution expenses on its Investor Class shares of $399.
NOTE 6 – SECURITIES TRANSACTIONS
For the six months ended December 31, 2016, the cost of purchases and the proceeds from sales of securities, excluding short-term securities, were as follows:
| | | Purchases | Sales |
| | Small-Cap Growth Fund | $113,974,955 | $106,667,144 |
There were no purchases or sales of long-term U.S. Government securities.
NOTE 7 – INCOME TAXES AND DISTRIBUTIONS TO SHAREHOLDERS
As of the most recent fiscal year end, the components of accumulated earnings/(losses) on a tax basis were as follows:
| | | | Small-Cap | |
| | | | Growth Fund | |
| | Cost of investments(a) | | $ | 121,626,181 | |
| | Gross unrealized appreciation | | | 17,145,915 | |
| | Gross unrealized depreciation | | | (5,647,964 | ) |
| | Net unrealized appreciation | | | 11,497,951 | |
| | Undistributed ordinary income | | | — | |
| | Undistributed long-term capital gain | | | — | |
| | Total distributable earnings | | | — | |
| | Other accumulated gains/(losses) | | | (7,725,306 | ) |
| | Total accumulated earnings/(losses) | | $ | 3,772,645 | |
| | (a) | The difference between the book basis and tax basis net unrealized appreciation and cost is attributable primarily to wash sales. |
As of the most recent fiscal year end, the Small-Cap Growth Fund had no long-term tax basis capital losses to offset future capital gains.
The tax character of distributions paid during 2016 was as follows:
| | | | Six Months Ended | | | | |
| | | | December 31, 2016 | | | Year Ended | |
| | | | (Unaudited) | | | June 30, 2016 | |
| | Small-Cap Growth Fund | | | | | | |
| | Ordinary income | | $ | — | | | $ | — | |
| | Long-term capital gains | | $ | — | | | $ | 6,796,865 | |
| NOTES TO FINANCIAL STATEMENTS (Continued) |
| at December 31, 2016 (Unaudited) |
As of the most recent fiscal year end, the Fund deferred, on a tax basis, post-October losses of:
| Late Year Ordinary | |
Loss Deferral | Capital |
| $510,678 | $7,214,628 |
Net qualified late year losses include post-October losses, which are incurred after October 31, 2015 and within a Fund’s taxable year, and are deemed to arise on the first day of the Fund’s next taxable year.
NOTE 8 – PRINCIPAL RISKS
The following is a list of certain risks that may apply to your investment in the Fund. Further information about investment risks is available in the Fund’s Statement of Additional Information.
Market Risk: The risk that the market value of a security may go up or down in response to many factors including the historical and prospective earnings of the issuer, the value of its assets, general economic conditions, interest rates, investor perceptions and market liquidity. Price changes may be temporary or last for extended periods.
Small Company Risk: Companies in which the Fund invests may be more vulnerable than larger companies to adverse business or economic developments. Small-cap companies may also have limited product lines, markets, or financial resources, may be dependent on relatively small or inexperienced management groups, and may operate in industries characterized by rapid technological obsolescence. Securities of such companies may be less liquid, more volatile and more difficult to value than securities of larger companies and therefore may involve greater risk than investing in large companies.
Growth Investing Risk: An investment in a growth-oriented fund may be more volatile than the rest of the U.S. market as a whole. If the investment adviser’s assessment of a company’s prospects for earnings growth or how other investors will value the company’s earnings growth is incorrect, the stock may fail to reach the value that the adviser has placed on it. Growth stock prices tend to fluctuate more dramatically than the overall stock market.
Foreign Security Risk: Foreign investments involve risks relating to political, economic, regulatory, or social instability, military action or unrest, or diplomatic developments and may be affected by actions of foreign governments adverse to the interest of U.S. investors.
IPO Risk: The Fund may purchase securities of companies engaged in initial public offerings (“IPOs”). The price of securities purchased in IPOs can be very volatile. The Fund’s investments in IPO shares may include the securities of “unseasoned” companies (companies with less than three years of continuous operations), which present risks considerably greater than common stocks of more established companies. These companies may be involved in new and evolving businesses and may be vulnerable to competition and changes in technology, markets and economic conditions. They may be more dependent on key managers and third parties and may have limited product lines.
| NOTES TO FINANCIAL STATEMENTS (Continued) |
| at December 31, 2016 (Unaudited) |
The effect of IPO investments on a Fund’s performance depends on a variety of factors, including the number of IPOs the Fund invests in relative to the size of the Fund, and whether and to what extent a security purchased in an IPO appreciates or depreciates in value. When the Fund’s asset base is small, a significant portion of the Fund’s performance could be attributable to investments in IPOs because such investments would have a magnified impact on the Fund. As the Fund’s asset grow, the effect of the Fund’s investments in IPOs on the Fund’s performance probably will decline, which could reduce the Fund’s performance.
Liquidity Risk: Certain securities may be difficult or impossible to sell at the time and the price that the seller would like. While the markets in securities of small companies have grown rapidly in recent years, such securities may trade less frequently and in smaller volumes than more widely held securities. The values of these securities may fluctuate more sharply than those of other securities, and the Fund may experience some difficulty in establishing or closing out positions in these securities at prevailing market prices. There may be less publicly available information about the issuers of these securities or less market interest in such securities than in the case of larger companies, and it may take a longer period of time for the prices of such securities to reflect the full value of their issuers’ underlying earnings potential or assets.
NOTE 9 – COMMITMENTS AND CONTINGENCIES
In the normal course of business, the Fund enters into contracts that contain a variety of representations and warranties and which provide general indemnifications. The Fund’s maximum exposure under these arrangements is unknown, as this would involve future claims that may be made against the Fund that have not yet occurred. However, based on experience, the Fund expects the risk of loss to be remote.
NOTE 10 – SUBSEQUENT EVENTS
On February 6, 2017 the Board of the Trust approved the reduction of the Fund’s management fee from 1.00% to 0.90% of the average daily net assets of the Fund, to be effective March 1, 2017. On February 6, 2017 the Board also adopted a Shareholder Servicing Plan on behalf of the Fund’s Institutional Shares and Investor Shares, to be effective March 1, 2017, that allows the Fund to make payments to financial intermediaries and other service providers for Institutional Shares and Investor Shares shareholders in return for shareholder servicing and maintenance of Institutional Shares and Investor Shares shareholder accounts. These shareholder servicing and maintenance fees may not exceed 0.10% per year of the Fund’s average daily net assets for Institutional Shares and Investor Shares, respectively and may not be used to pay for any services in connection with the distribution and sale of Institutional Shares or Investor Shares. Also effective March 1, 2017, the Advisor has contractually agreed to waive a portion of its fees and reimburse certain expenses for the Fund to limit the total annual fund operating expenses (excluding taxes, Rule 12b-1 fees, shareholder servicing fees, extraordinary expenses, brokerage commissions, interest and acquired fund fees and expenses
| NOTES TO FINANCIAL STATEMENTS (Continued) |
| at December 31, 2016 (Unaudited) |
(collectively, “Excludable Expenses”)) to 0.99%. To the extent the Fund or a share class of the Fund incurs Excludable Expenses, the Fund’s total annual fund operating expenses after fee waivers and/or expense reimbursements may be greater than 0.99%. The waivers and reimbursements will remain in effect through December 31, 2020 unless terminated sooner by mutual agreement of the Board and Hood River. Effective March 1, 2017, Retirement Shares have been established as a new share class of the Fund.
NOTE 11 – OTHER INFORMATION
The name of the Trust has been changed to Manager Directed Portfolios effective July 1, 2016. The Board has approved the retention of U.S. Bancorp Fund Services, LLC (“USBFS”), U.S. Bank N.A. (“U.S. Bank”), Quasar Distributors LLC (“Quasar”) and Vigilant Compliance, LLC (“Vigilant”) as new service providers to the Trust. The new service agreements became effective on July 1, 2016. The Administration Agreement with Roxbury was terminated on June 30, 2016. The prior service agreements with BNY Mellon were terminated on June 30, 2016. In preparing the financial statements as of December 31, 2016, management considered the impact of subsequent events for potential recognition or disclosure in the financial statements and had concluded that no additional disclosures are necessary other than those mentioned above.
| EXPENSE EXAMPLE |
| December 31, 2016 (Unaudited) |
As a shareholder of the Fund, you incur two types of costs: (1) transaction costs including sales charges (loads) and redemption fees, if applicable; and (2) ongoing costs, including management fees; distribution and/or service (12b-1 fees); and other Fund expenses. This Example is intended to help you understand your ongoing costs (in dollars) of investing in the Fund and to compare these costs with the ongoing costs of investing in other mutual funds.
The Example is based on an investment of $1,000 invested at the beginning of the period indicated and held for the entire period from July 1, 2016 to December 31, 2016.
Actual Expenses
The information in the table under the heading "Actual" provides information about actual account values and actual expenses. You may use the information in these columns together with the amount you invested, to estimate the expenses that you paid over the period. Simply divide your account value by $1,000 (for example, an $8,600 account value divided by $1,000 = 8.6), then multiply the result by the number in the row entitled "Expenses Paid During Period" to estimate the expenses you paid on your account during this period. There are some account fees that are charged to certain types of accounts, such as Individual Retirement Accounts (generally, a $15 fee is charged to the account annually) that would increase the amount of expenses paid on your account. The example below does not include portfolio trading commissions and related expenses and other extraordinary expenses as determined under generally accepted accounting principles.
Hypothetical Example for Comparison Purposes
The information in the table under the heading "Hypothetical (5% return before expenses)" provides information about hypothetical account values and hypothetical expenses based on the Fund’s actual expense ratio and assumed rate of return of 5% per year before expenses, which is not the Fund’s actual return. The hypothetical account values and expenses may not be used to estimate the actual ending account balance or expenses you paid for the period. You may use this information to compare the ongoing costs of investing in the Fund and other funds. To do so, compare this 5% hypothetical example with the 5% hypothetical examples that appear in the shareholder reports of the other funds. As noted above, there are some account fees that are charged to certain types of accounts that would increase the amount of expense paid on your account.
Please note that the expenses shown in the table are meant to highlight your ongoing costs only and do not reflect any transaction costs, such as sales charges (loads), redemption fees, or exchange fees. Therefore, the information under the heading "Hypothetical (5% return before expenses)" is useful in comparing ongoing costs only, and will not help you determine the relative total costs of owning different funds. In addition, if these transactional costs were included, your costs would have been higher.
| EXPENSE EXAMPLE (Continued) |
| December 31, 2016 (Unaudited) |
| | Beginning | Ending | Expenses Paid |
| | Account Value | Account Value | During Period(1) |
| | 7/1/2016 | 12/31/2016 | 7/1/2016 – 12/31/2016 |
| Actual | | | |
| Investor Shares | $1,000.00 | $1,181.60 | $7.37 |
| Institutional Shares | $1,000.00 | $1,181.80 | $5.99 |
| | | | |
| Hypothetical (5% return | | | |
| before expenses) | | | |
| Investor Shares | $1,000.00 | $1,018.45 | $6.82 |
| Institutional Shares | $1,000.00 | $1,019.71 | $5.55 |
(1) | Expenses are equal to the Investor and Institutional Shares’ annualized expense ratios of 1.34% and 1.09%, respectively, multiplied by the average account value over the period, multiplied by 184/365 (to reflect the period). |
| NOTICE TO SHAREHOLDERS |
| at December 31, 2016 (Unaudited) |
How to Obtain a Copy of the Fund’s Proxy Voting Policies
A description of the policies and procedures that the Fund uses to determine how to vote proxies relating to portfolio securities is available without charge, upon request, by calling 1-800-497-2960 or on the U.S. Securities and Exchange Commission’s (“SEC”) website at http://www.sec.gov.
How to Obtain a Copy of the Fund’s Proxy Voting Records for the most recent 12-Month Period Ended June 30
Information regarding how the Fund voted proxies relating to portfolio securities during the most recent 12-month period ended June 30 is available no later than August 31 without charge, upon request, by calling 1-800-497-2960. Furthermore, you can obtain the Fund’s proxy voting records on the SEC’s website at http://www.sec.gov.
Quarterly Filings on Form N-Q
The Fund files its complete schedule of portfolio holdings with the SEC for the first and third quarters of each fiscal year on Form N-Q. The Fund’s Form N-Q is available on the SEC’s website at http://www.sec.gov. The Fund’s Form N-Q may be reviewed and copied at the SEC’s Public Reference Room in Washington, DC, and information on the operation of the Public Reference Room may be obtained by calling 1-202-551-8090. Information included in the Fund’s Form N-Q is also available, upon request, by calling 1-800-497-2960.
Householding
In an effort to decrease costs, the Fund intends to reduce the number of duplicate prospectuses and annual and semi-annual reports you receive by sending only one copy of each to those addresses shared by two or more accounts and to shareholders the Transfer Agent reasonably believes are from the same family or household. Once implemented, if you would like to discontinue householding for your accounts, please call toll-free at 1-800-497-2960 to request individual copies of these documents. Once the Transfer Agent receives notice to stop householding, the Transfer Agent will begin sending individual copies thirty days after receiving your request. This policy does not apply to account statements.
| | FACTS | | WHAT DOES THE HOOD RIVER SMALL-CAP GROWTH FUND (“THE FUND”) DO WITH YOUR PERSONAL INFORMATION? | |
| | | | | |
| | Why? | | Financial companies choose how they share your personal information. Federal law gives consumers the right to limit some but not all sharing. Federal law also requires us to tell you how we collect, share, and protect your personal information. Please read this notice carefully to understand what we do. | |
| | | | | |
| | What? | | The types of personal information we collect and share depends on the product or service you have with us. This information can include: | |
| | | | • Social Security number | |
| | | | • account balances | |
| | | | • account transactions | |
| | | | • transaction history | |
| | | | • wire transfer instructions | |
| | | | • checking account information | |
| | | | When you are no longer our customer, we continue to share your information as described in this notice. | |
| | | | | |
| | How? | | All financial companies need to share customers’ personal information to run their everyday business. In the section below, we list the reasons financial companies can share their customers’ personal information; the reasons the Fund chooses to share; and whether you can limit this sharing. | |
| | | | | |
| | | Does the | Can you limit |
| | Reasons we can share your personal information | Fund share? | this sharing? |
| | For our everyday business purposes – such as to process your | Yes | No |
| | transactions, maintain your account(s), respond to court orders | | |
| | and legal investigations, or report to credit bureaus. | | |
| | For our marketing purposes – | Yes | No |
| | to offer our products and services to you | | |
| | For joint marketing with other financial companies | No | We do not share |
| | For our affiliates’ everyday business purposes – | Yes | No |
| | information about your transactions and experiences | | |
| | For our affiliates’ everyday business purposes – | No | We do not share |
| | information about your creditworthiness | | |
| | For our affiliates to market to you – The Fund may share | Yes | Yes |
| | information with our affiliates about shareholders or shareholder | | |
| | accounts in order to make shareholders aware of services and | | |
| | products which the Fund thinks may be of interest or value to them | | |
| | For nonaffiliates to market to you | No | We do not share |
| | To Limit the | | To limit our sharing, please notify us in the following way: | |
| | Fund’s Sharing | | • Contact the Fund by calling our toll-free phone number 1-800-497-2960. | |
| | | | Your choice to limit the personal information the Fund shares with its affiliates will apply until you request a change. If you are a new customer, we can begin sharing your information with our affiliates for marketing purposes 30 days from the date we sent this notice. When you are no longer a customer, we continue to share your information as described in this notice. | |
| | | | | |
| | Questions? | | If you have any questions or concerns regarding this notice or the Fund’s privacy policies, please contact us at 800-497-2960. | |
| PRIVACY NOTICE (Continued) |
| |
State Disclosures – In addition to the rights described below and in this notice, you may have other rights under state laws. We will comply with the applicable state laws with respect to our information practices.
California and Vermont have other protections under state law. If you primary mailing address is in California or Vermont, we will not share your financial information that we collect except as permitted by law, including, for example, with your consent or to service your account. We will also not use your information for joint marketing purposes. We do not share customer information with third parties except as permitted by law.
| | Who we are | | | |
| | Who is providing | | The Fund is an open-end management investment company registered under the | |
| | this notice? | | Investment Company Act of 1940. | |
| | What we do | | | |
| | How does the Fund | | To protect your personal information from unauthorized access and use, we use | |
| | protect my personal | | security measures that comply with federal law. These measures include computer | |
| | information? | | safeguards and secured files and buildings. | |
| | How does the Fund | | We collect your personal information, for example, when you | |
| | collect my personal | | • open an account | |
| | information? | | • provide account information | |
| | | | • give us your contact information | |
| | | | • make a wire transfer | |
| | | | • tell us where to send the money | |
| | | | We collect your personal information from others, such as credit bureaus, affiliates or other companies. | |
| | Why can’t I limit | | Federal law gives you the right to limit only | |
| | all sharing? | | • sharing for affiliates’ everyday business purposes – information about your creditworthiness | |
| | | | • affiliates from using your information to market to you | |
| | | | • sharing for nonaffiliates to market to you | |
| | | | State laws and individual companies may give you additional rights to limit sharing. | |
| | Definitions | | | |
| | Affiliates | | Companies related by common ownership or control. They can be financial and nonfinancial companies. | |
| | | | • The Fund’s affiliates are Hood River Capital Management LLC, investment advisor to the Hood River Small-Cap Growth Fund. | |
| | Nonaffiliates | | Companies not related by common ownership or control. They can be financial and nonfinancial companies. | |
| | | | • The Fund does not share with nonaffiliates so they can market to you. | |
| | Joint marketing | | A formal agreement between nonaffiliated financial companies that together market financial products or services to you. | |
| | | | • The Fund does not jointly market. | |
(This Page Intentionally Left Blank.)
Investment Advisor
Hood River Capital Management LLC
1 SW Columbia Street, Suite 630
Portland, OR 97258
Distributor
Quasar Distributors, LLC
615 East Michigan Street, 4th Floor
Milwaukee, WI 53202
Transfer Agent
U.S. Bancorp Fund Services, LLC
615 East Michigan Street
Milwaukee, WI 53202
(800) 497-2960
Custodian
U.S. Bank National Association
Custody Operations
1555 North River Center Drive, Suite 302
Milwaukee, WI 53212
Independent Registered Public Accounting Firm
BBD, LLP
1835 Market Street, 26th floor
Philadelphia, PA 19103
Legal Counsel
Godfrey & Kahn S.C.
833 East Michigan Street, Suite 1800
Milwaukee, WI 53202
This report is intended for shareholders of the Fund and may not be used as sales literature unless preceded or accompanied by a current prospectus.
Past performance results shown in this report should not be considered a representation of future performance. Share price and returns will fluctuate so that shares, when redeemed, may be worth more or less than their original cost. Statements and other information herein are dated and are subject to change.
Mar Vista Strategic Growth Fund
Semi-Annual Report
December 31, 2016
Table of Contents
| Sector Allocation of Portfolio Assets | 3 |
| Schedule of Investments | 4 |
| Statement of Assets and Liabilities | 8 |
| Statement of Operations | 9 |
| Statements of Changes in Net Assets | 10 |
| Financial Highlights | 12 |
| Notes to the Financial Statements | 14 |
| Expense Example | 22 |
| Notice to Shareholders | 24 |
| Privacy Notice | 25 |
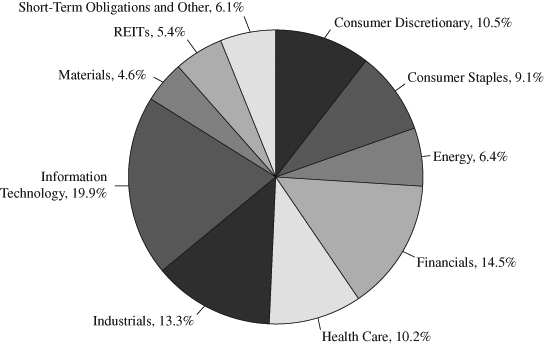
| SECTOR ALLOCATION OF PORTFOLIO ASSETS |
| at December 31, 2016 (Unaudited) |
Percentages represent market value as a percentage of net assets.
| SCHEDULE OF INVESTMENTS |
| at December 31, 2016 (Unaudited) |
| | | | | | | |
| COMMON STOCKS – 88.5% | | Shares | | | Value | |
| | | | | | | |
| CONSUMER DISCRETIONARY – 10.5% | | | | | | |
| | | | | | | |
| Hotels, Restaurants & Leisure – 4.0% | | | | | | |
| Starbucks Corp. | | | 20,635 | | | $ | 1,145,655 | |
| | | | | | | | | |
| Internet & Direct Marketing Retail – 1.5% | | | | | | | | |
| Amazon.com, Inc. (a) | | | 579 | | | | 434,175 | |
| | | | | | | | | |
| Specialty Retail – 3.7% | | | | | | | | |
| O’Reilly Automotive, Inc. (a) | | | 1,577 | | | | 439,053 | |
| TJX Companies, Inc. | | | 8,608 | | | | 646,719 | |
| | | | | | | | 1,085,772 | |
| Textiles, Apparel & Luxury Goods – 1.3% | | | | | | | | |
| Nike, Inc. | | | 7,187 | | | | 365,315 | |
| TOTAL CONSUMER DISCRETIONARY | | | | | | | 3,030,917 | |
| | | | | | | | | |
| CONSUMER STAPLES – 9.1% | | | | | | | | |
| | | | | | | | | |
| Beverages – 3.9% | | | | | | | | |
| PepsiCo, Inc. | | | 10,844 | | | | 1,134,608 | |
| | | | | | | | | |
| Food Products – 2.2% | | | | | | | | |
| Mondelez International, Inc. | | | 14,142 | | | | 626,915 | |
| | | | | | | | | |
| Personal Products – 3.0% | | | | | | | | |
| Unilever NV – ADR (c) | | | 21,568 | | | | 885,582 | |
| TOTAL CONSUMER STAPLES | | | | | | | 2,647,105 | |
| | | | | | | | | |
| ENERGY – 6.4% | | | | | | | | |
| | | | | | | | | |
| Energy Equipment & Services – 6.4% | | | | | | | | |
| Core Laboratories NV (c) | | | 7,178 | | | | 861,647 | |
| Schlumberger Ltd. (c) | | | 11,662 | | | | 979,025 | |
| TOTAL ENERGY | | | | | | | 1,840,672 | |
| | | | | | | | | |
| FINANCIALS – 14.5% | | | | | | | | |
| | | | | | | | | |
| Banks – 2.7% | | | | | | | | |
| U.S. Bancorp (d) | | | 15,014 | | | | 771,269 | |
The accompanying notes are an integral part of these financial statements.
| SCHEDULE OF INVESTMENTS (Continued) |
| at December 31, 2016 (Unaudited) |
| | | | | | | |
| COMMON STOCKS – 88.5% (Continued) | | Shares | | | Value | |
| | | | | | | |
| FINANCIALS – 14.5% (Continued) | | | | | | |
| | | | | | | |
| Capital Markets – 1.8% | | | | | | |
| Moody’s Corp. | | | 5,634 | | | $ | 531,117 | |
| | | | | | | | | |
| Diversified Financial Services – 6.1% | | | | | | | | |
| Berkshire Hathaway, Inc. (a) | | | 10,857 | | | | 1,769,474 | |
| | | | | | | | | |
| Insurance – 3.9% | | | | | | | | |
| Markel Corp. (a) | | | 1,255 | | | | 1,135,148 | |
| TOTAL FINANCIALS | | | | | | | 4,207,008 | |
| | | | | | | | | |
| HEALTH CARE – 10.2% | | | | | | | | |
| | | | | | | | | |
| Life Sciences Tools & Services – 3.4% | | | | | | | | |
| Mettler-Toledo International, Inc. (a) | | | 2,335 | | | | 977,338 | |
| | | | | | | | | |
| Pharmaceuticals – 6.8% | | | | | | | | |
| Allergan PLC (a)(c) | | | 5,576 | | | | 1,170,961 | |
| Johnson & Johnson | | | 6,868 | | | | 791,262 | |
| | | | | | | | 1,962,223 | |
| TOTAL HEALTH CARE | | | | | | | 2,939,561 | |
| | | | | | | | | |
| INDUSTRIALS – 13.3% | | | | | | | | |
| | | | | | | | | |
| Aerospace & Defense – 3.8% | | | | | | | | |
| TransDigm Group, Inc. | | | 4,374 | | | | 1,088,951 | |
| | | | | | | | | |
| Electrical Equipment – 1.6% | | | | | | | | |
| Sensata Technologies Holding NV (a)(c) | | | 11,679 | | | | 454,897 | |
| | | | | | | | | |
| Industrial Conglomerates – 3.9% | | | | | | | | |
| Honeywell International, Inc. | | | 9,835 | | | | 1,139,385 | |
| | | | | | | | | |
| Machinery – 1.9% | | | | | | | | |
| Fortive Corp. | | | 10,381 | | | | 556,733 | |
| | | | | | | | | |
| Road & Rail – 2.1% | | | | | | | | |
| Kansas City Southern | | | 7,259 | | | | 615,926 | |
| TOTAL INDUSTRIALS | | | | | | | 3,855,892 | |
The accompanying notes are an integral part of these financial statements.
| SCHEDULE OF INVESTMENTS (Continued) |
| at December 31, 2016 (Unaudited) |
| | | | | | | |
| COMMON STOCKS – 88.5% (Continued) | | Shares | | | Value | |
| | | | | | | |
| INFORMATION TECHNOLOGY – 19.9% | | | | | | |
| | | | | | | |
| Internet Software & Services – 5.9% | | | | | | |
| Alphabet, Inc. (a) | | | 1,303 | | | $ | 1,005,682 | |
| Facebook, Inc. (a) | | | 5,925 | | | | 681,671 | |
| | | | | | | | 1,687,353 | |
| IT Services – 2.0% | | | | | | | | |
| Visa, Inc. | | | 7,523 | | | | 586,944 | |
| | | | | | | | | |
| Software – 8.6% | | | | | | | | |
| Adobe Systems, Inc. (a) | | | 6,251 | | | | 643,540 | |
| Intuit, Inc. | | | 7,493 | | | | 858,773 | |
| Oracle Corp. | | | 25,800 | | | | 992,010 | |
| | | | | | | | 2,494,323 | |
| Technology Hardware, Storage & Peripherals – 3.4% | | | | | | | | |
| Apple, Inc. | | | 8,572 | | | | 992,809 | |
| TOTAL INFORMATION TECHNOLOGY | | | | | | | 5,761,429 | |
| | | | | | | | | |
| MATERIALS – 4.6% | | | | | | | | |
| | | | | | | | | |
| Chemicals – 4.6% | | | | | | | | |
| Ecolab, Inc. | | | 7,464 | | | | 874,930 | |
| Praxair, Inc. | | | 3,758 | | | | 440,400 | |
| TOTAL MATERIALS | | | | | | | 1,315,330 | |
| TOTAL COMMON STOCKS | | | | | | | | |
| (Cost $21,679,982) | | | | | | | 25,597,914 | |
| | | | | | | | | |
| REITS – 5.4% | | | | | | | | |
| American Tower Corp. | | | 14,819 | | | | 1,566,072 | |
| TOTAL REITS | | | | | | | | |
| (Cost $1,263,402) | | | | | | | 1,566,072 | |
The accompanying notes are an integral part of these financial statements.
| SCHEDULE OF INVESTMENTS (Continued) |
| at December 31, 2016 (Unaudited) |
| | | | | | | |
| SHORT-TERM INVESTMENTS – 6.0% | | Shares | | | Value | |
| | | | | | | |
| MONEY MARKET FUNDS – 6.0% | | | | | | |
| First American Treasury Obligations Fund – | | | | | | |
| Class Z, 0.39% (b) | | | 1,746,827 | | | $ | 1,746,827 | |
| TOTAL SHORT-TERM INVESTMENTS | | | | | | | | |
| (Cost $1,746,827) | | | | | | | 1,746,827 | |
| TOTAL INVESTMENTS | | | | | | | | |
| (Cost $24,690,211) – 99.9% | | | | | | | 28,910,813 | |
| Other Assets in Excess of Liabilities – 0.1% | | | | | | | 8,979 | |
| TOTAL NET ASSETS – 100.00% | | | | | | $ | 28,919,792 | |
Percentages are stated as a percent of net assets.
ADR – American Depositary Receipt
PLC – Public Limited Company
| (a) | Non-income producing security. |
| (b) | The rate shown represents the fund’s 7-day yield as of December 31, 2016. |
| (c) | U.S. traded security of a foreign issuer or corporation. |
| (d) | Investment in affiliated security. Quasar Distributors, LLC, which serves as the fund’s distributor, is a subsidiary of U.S. Bancorp. Details of transactions with this affiliated company for the six months ended December 31, 2016 were as follows: |
| | Beginning | Purchase | Sales | Ending | Dividend | | Market |
| Issuer | Cost | Cost | Cost | Cost | Income | Shares | Value |
| U.S. Bancorp | $613,631 | $0 | $0 | $613,631 | $8,408 | 15,014 | $771,269 |
The Global Industry Classification Standard (GICS®) was developed by and/or is the exclusive property of MSCI, Inc. and Standard & Poor’s Financial Services LLC (“S&P”). GICS is a service mark of MSCI and S&P and has been licensed for use by Mar Vista Investment Partners, LLC.
The accompanying notes are an integral part of these financial statements.
| STATEMENT OF ASSETS AND LIABILITIES |
| at December 31, 2016 (Unaudited) |
| Assets: | | | |
| Investments in unaffiliated securities, at value (cost of $24,076,580) | | $ | 28,139,544 | |
| Investments in affiliated securities, at value (cost of $613,631) | | | 771,269 | |
| Receivables: | | | | |
| Securities sold | | | 20 | |
| Fund shares sold | | | 10,268 | |
| Dividends and interest | | | 37,675 | |
| Prepaid expenses | | | 19,886 | |
| Total assets | | | 28,978,662 | |
| | | | | |
| Liabilities: | | | | |
| Payables: | | | | |
| Advisory fee | | | 15,891 | |
| Administration and accounting fees | | | 11,225 | |
| Reports to shareholders | | | 8,333 | |
| Compliance expense | | | 2,050 | |
| Custody fees | | | 976 | |
| Transfer agent fees and expenses | | | 6,577 | |
| Trustee fees | | | 1,285 | |
| Other accrued expenses | | | 12,533 | |
| Total liabilities | | | 58,870 | |
| | | | | |
| Net assets | | $ | 28,919,792 | |
| | | | | |
| Net assets consist of: | | | | |
| Capital stock | | $ | 24,614,782 | |
| Accumulated net investment income | | | 24,406 | |
| Accumulated net realized gain on investments | | | 60,002 | |
| Net unrealized appreciation on investments | | | 4,220,602 | |
| Net assets | | $ | 28,919,792 | |
| | | | | |
| Institutional Shares: | | | | |
| Net assets applicable to outstanding Institutional Shares | | $ | 28,919,792 | |
| Shares issued (Unlimited number of beneficial | | | | |
| interest authorized, $0.01 par value) | | | 1,853,156 | |
| Net asset value, offering price and redemption price per share | | $ | 15.61 | |
The accompanying notes are an integral part of these financial statements.
| STATEMENT OF OPERATIONS |
| For the Six Months Ended December 31, 2016 (Unaudited) |
| Investment income: | | | |
Dividend income from unaffiliated securities1 | | $ | 248,098 | |
| Dividend income from affiliated securities | | | 8,408 | |
| Interest | | | 3,369 | |
| Total investment income | | | 259,875 | |
| | | | | |
| Expenses: | | | | |
| Advisory fees (Note 4) | | | 103,504 | |
| Administration and accounting fees (Note 4) | | | 16,618 | |
| Transfer agent fees and expenses | | | 18,589 | |
| Federal and state registration fees | | | 17,896 | |
| Audit fees | | | 9,746 | |
| Compliance expense | | | 6,050 | |
| Legal fees | | | 6,050 | |
| Reports to shareholders | | | 1,721 | |
| Trustees’ fees and expenses | | | 4,790 | |
| Custody fees | | | 2,570 | |
| Other | | | 5,476 | |
| Total expenses before reimbursement from advisor | | | 193,010 | |
| Expense waivers and reimbursement from advisor (Note 4) | | | (68,806 | ) |
| Net expenses | | | 124,204 | |
| Net investment income | | | 135,671 | |
| | | | | |
| Realized and unrealized gain on investments: | | | | |
| Net realized gain on unaffiliated investments | | | 64,310 | |
| Net change in unrealized appreciation on investments | | | 121,650 | |
| Net realized and unrealized gain on investments | | | 185,960 | |
| Net increase in net assets resulting from operations | | $ | 321,631 | |
1 | Net of foreign taxes withheld of $3,250. |
The accompanying notes are an integral part of these financial statements.
| STATEMENTS OF CHANGES IN NET ASSETS |
| |
| | | Six Months Ended | | | | |
| | | December 31, 2016 | | | Year Ended | |
| | | (Unaudited) | | | June 30, 2016 | |
| Operations: | | | | | | |
| Net investment income | | $ | 135,671 | | | $ | 44,563 | |
| Net realized gain on investments | | | 64,310 | | | | 282,923 | |
| Net change in unrealized appreciation | | | | | | | | |
| on investments | | | 121,650 | | | | 873,718 | |
| Net increase in net assets | | | | | | | | |
| resulting from operations | | | 321,631 | | | | 1,201,204 | |
| | | | | | | | | |
| Distributions to Shareholders From: | | | | | | | | |
| Net investment income | | | | | | | | |
| Institutional shares | | | (139,573 | ) | | | (16,245 | ) |
| Net realized gains | | | | | | | | |
| Institutional shares | | | (133,879 | ) | | | (736,502 | ) |
| Total distributions | | | (273,452 | ) | | | (752,747 | ) |
| | | | | | | | | |
| Capital Share Transactions: | | | | | | | | |
| Proceeds from shares sold | | | | | | | | |
| Institutional shares | | | 5,538,901 | | | | 10,210,921 | |
| Proceeds from shares issued to holders | | | | | | | | |
| in reinvestment of dividends | | | | | | | | |
| Institutional shares | | | 237,878 | | | | 590,635 | |
| Cost of shares redeemed | | | | | | | | |
| Institutional shares | | | (2,293,764 | ) | | | (6,401,517 | ) |
| Redemption fees retained | | | | | | | | |
| Institutional shares | | | 133 | | | | 344 | |
| Net increase in net assets from | | | | | | | | |
| capital share transactions | | | 3,483,148 | | | | 4,400,383 | |
| Total increase in net assets | | | 3,531,327 | | | | 4,848,840 | |
| | | | | | | | | |
| Net Assets: | | | | | | | | |
| Beginning of period | | | 25,388,465 | | | | 20,539,625 | |
| End of period | | $ | 28,919,792 | | | $ | 25,388,465 | |
| Accumulated net investment income | | $ | 24,406 | | | $ | 28,308 | |
The accompanying notes are an integral part of these financial statements.
| STATEMENTS OF CHANGES IN NET ASSETS (Continued) |
| |
| | | Six Months Ended | | | | |
| | | December 31, 2016 | | | Year Ended | |
| | | (Unaudited) | | | June 30, 2016 | |
| Changes in Shares Outstanding: | | | | | | |
| Shares sold | | | | | | |
| Institutional shares | | | 350,734 | | | | 692,934 | |
| Proceeds from shares issued to holders | | | | | | | | |
| in reinvestment of dividends | | | | | | | | |
| Institutional shares | | | 15,084 | | | | 39,455 | |
| Shares redeemed | | | | | | | | |
| Institutional shares | | | (146,487 | ) | | | (432,926 | ) |
| Net increase in shares outstanding | | | 219,331 | | | | 299,463 | |
The accompanying notes are an integral part of these financial statements.
For a capital share outstanding throughout the period
Institutional Shares
| | | Six Months | | | | | | | | | | | | | | | | |
| | | Ended | | | Year | | | Year | | | Year | | | Year | | | Period | |
| | | December 31, | | | Ended | | | Ended | | | Ended | | | Ended | | | Ended | |
| | | 2016 | | | June 30, | | | June 30, | | | June 30, | | | June 30, | | | June 30, | |
| | | (Unaudited) | | | 2016 | | | 2015 | | | 2014 | | | 2013 | | | 2012* | |
| Net Asset Value – | | | | | | | | | | | | | | | | | | | |
| Beginning of Period | | $ | 15.54 | | | $ | 15.39 | | | $ | 15.41 | | | $ | 12.80 | | | $ | 11.00 | | | $ | 10.00 | |
| | | | | | | | | | | | | | | | | | | | | | | | | |
| Income from | | | | | | | | | | | | | | | | | | | | | | | | |
| Investment Operations: | | | | | | | | | | | | | | | | | | | | | | | | |
Net investment income1 | | | 0.08 | | | | 0.03 | | | | 0.04 | | | | 0.08 | | | | 0.10 | | | | 0.08 | |
| Net realized and | | | | | | | | | | | | | | | | | | | | | | | | |
| unrealized gain | | | | | | | | | | | | | | | | | | | | | | | | |
| on investments | | | 0.14 | | | | 0.63 | | | | 1.11 | | | | 3.35 | | | | 1.92 | | | | 0.92 | |
| Total from | | | | | | | | | | | | | | | | | | | | | | | | |
| investment operations | | | 0.22 | | | | 0.66 | | | | 1.15 | | | | 3.43 | | | | 2.02 | | | | 1.00 | |
| | | | | | | | | | | | | | | | | | | | | | | | | |
| Less Distributions: | | | | | | | | | | | | | | | | | | | | | | | | |
| Dividends from net | | | | | | | | | | | | | | | | | | | | | | | | |
| investment income | | | (0.08 | ) | | | (0.01 | ) | | | (0.06 | ) | | | (0.15 | ) | | | (0.13 | ) | | | — | |
| Distributions from | | | | | | | | | | | | | | | | | | | | | | | | |
| net realized gains | | | (0.07 | ) | | | (0.50 | ) | | | (1.11 | ) | | | (0.67 | ) | | | (0.09 | ) | | | — | |
| Total distributions | | | (0.15 | ) | | | (0.51 | ) | | | (1.17 | ) | | | (0.82 | ) | | | (0.22 | ) | | | — | |
| | | | | | | | | | | | | | | | | | | | | | | | | |
| Redemption fees | | | — | 2 | | | — | 2 | | | — | | | | — | 2 | | | — | 2 | | | — | 2 |
| | | | | | | | | | | | | | | | | | | | | | | | | |
| Net Asset Value – | | | | | | | | | | | | | | | | | | | | | | | | |
| End of Period | | $ | 15.61 | | | $ | 15.54 | | | $ | 15.39 | | | $ | 15.41 | | | $ | 12.80 | | | $ | 11.00 | |
| | | | | | | | | | | | | | | | | | | | | | | | | |
| Total Return | | 1.40 | %^ | | | 4.44 | % | | | 7.67 | % | | | 27.71 | % | | | 18.55 | % | | 10.00 | %^ |
| * | Operations commenced on November 1, 2011. |
| + | Annualized |
| ^ | Not Annualized |
1 | The net investment loss per share was calculated using the average shares outstanding method. |
2 | Amount is less than $0.01. |
The accompanying notes are an integral part of these financial statements.
| FINANCIAL HIGHLIGHTS (Continued) |
| |
For a capital share outstanding throughout the period
Institutional Shares
| | | Six Months | | | | | | | | | | | | | | | | |
| | | Ended | | | Year | | | Year | | | Year | | | Year | | | Period | |
| | | December 31, | | | Ended | | | Ended | | | Ended | | | Ended | | | Ended | |
| | | 2016 | | | June 30, | | | June 30, | | | June 30, | | | June 30, | | | June 30, | |
| | | (Unaudited) | | | 2016 | | | 2015 | | | 2014 | | | 2013 | | | 2012* | |
| Ratios and | | | | | | | | | | | | | | | | | | | |
| Supplemental Data: | | | | | | | | | | | | | | | | | | | |
| Net assets, end of | | | | | | | | | | | | | | | | | | | |
| period (thousands) | | $ | 28,920 | | | $ | 25,388 | | | $ | 20,540 | | | $ | 13,678 | | | $ | 8,665 | | | $ | 6,483 | |
| Ratio of operating | | | | | | | | | | | | | | | | | | | | | | | | |
| expenses to average | | | | | | | | | | | | | | | | | | | | | | | | |
| net assets: | | | | | | | | | | | | | | | | | | | | | | | | |
| Before Waivers | | | | | | | | | | | | | | | | | | | | | | | | |
| and Reimbursements | | | 1.40 | %+ | | | 1.74 | % | | | 2.23 | % | | | 2.79 | % | | | 3.99 | % | | | 4.85 | %+ |
| After Waivers | | | | | | | | | | | | | | | | | | | | | | | | |
| and Reimbursements | | | 0.90 | %+ | | | 0.90 | % | | | 0.90 | % | | | 0.90 | % | | | 0.90 | % | | | 0.90 | %+ |
| Ratio of net investment | | | | | | | | | | | | | | | | | | | | | | | | |
| income (loss) | | | | | | | | | | | | | | | | | | | | | | | | |
| to average net assets: | | | | | | | | | | | | | | | | | | | | | | | | |
| Before Waivers | | | | | | | | | | | | | | | | | | | | | | | | |
| and Reimbursements | | | 0.48 | %+ | | | (0.65 | %) | | | (1.15 | %) | | | (1.31 | %) | | | (2.27 | %) | | | (2.83 | %)+ |
| After Waivers | | | | | | | | | | | | | | | | | | | | | | | | |
| and Reimbursements | | | 0.98 | %+ | | | 0.19 | % | | | 0.18 | % | | | 0.58 | % | | | 0.82 | % | | | 1.12 | %+ |
| Portfolio turnover rate | | 7 | %^ | | | 40 | % | | | 33 | % | | | 31 | % | | | 59 | % | | 27 | %^ |
| * | Operations commenced on November 1, 2011. |
| + | Annualized |
| ^ | Not Annualized |
1 | The net investment loss per share was calculated using the average shares outstanding method. |
2 | Amount is less than $0.01. |
The accompanying notes are an integral part of these financial statements.
| NOTES TO FINANCIAL STATEMENTS |
| December 31, 2016 (Unaudited) |
NOTE 1 – ORGANIZATION
The Mar Vista Strategic Growth Fund (formerly, the Roxbury/Mar Vista Strategic Growth Fund) (the “Strategic Growth Fund” or the “Fund”) is a series of Manager Directed Portfolios (formerly, The Roxbury Funds) (the “Trust”). The Trust is registered under the Investment Company Act of 1940, as amended (the “1940 Act”), as a diversified open-end investment management company and was organized as a Delaware statutory trust on April 4, 2006. The investment objective of the Fund is long-term growth of capital. The Fund commenced operations on November 1, 2011, and offers Institutional Shares.
NOTE 2 – SIGNIFICANT ACCOUNTING POLICIES
The following is a summary of significant accounting policies consistently followed by the Fund. These policies are in conformity with U.S. generally accepted accounting principles (“GAAP”).
| | A. | Security Valuation: All investments in securities are recorded at their estimated fair value, as described in Note 3. |
| | B. | Federal Income Taxes: It is the Fund’s policy to comply with the requirements of Subchapter M of the Internal Revenue Code applicable to regulated investment companies and to distribute substantially all of its taxable income to its shareholders. Therefore, no federal income or excise tax provisions are required. |
| | | The Fund recognizes the tax benefits of uncertain tax positions only where the position is “more likely than not” to be sustained assuming examination by tax authorities. Management has analyzed the Fund’s tax positions, and has concluded that no liability for unrecognized tax benefits should be recorded related to uncertain tax positions to be taken or expected to be taken on a tax return. The tax returns for the Fund for the prior three fiscal years are open for examination. The Fund identifies its major tax jurisdictions as U.S. Federal and the state of Delaware. |
| | C. | Securities Transactions, Income and Distributions: Securities transactions are accounted for on the trade date. Realized gains and losses on securities sold are determined on the basis of identified cost. Interest income is recorded on an accrual basis. Dividend income and distributions to shareholders are recorded on the ex-dividend date. Withholding taxes on foreign dividends have been provided for in accordance with the Fund’s understanding of the applicable country’s tax rules and rates. |
| | | The Fund distributes substantially all of its net investment income, if any, and net realized capital gains, if any, annually. Distributions from net realized gains for book purposes may include short-term capital gains. All short-term capital gains are included in ordinary income for tax purposes. The amount of dividends and distributions to shareholders from net investment income and net realized capital |
| NOTES TO FINANCIAL STATEMENTS (Continued) |
| December 31, 2016 (Unaudited) |
| | | gains is determined in accordance with federal income tax regulations, which differ from GAAP. To the extent these book/tax differences are permanent, such amounts are reclassified within the capital accounts based on their federal tax treatment. |
| | | Investment income, expenses (other than those specific to the class of shares), and realized and unrealized gains and losses on investments are allocated to the separate classes of the Fund’s shares based upon their relative net assets on the date income is earned or expensed and realized and unrealized gains and losses are incurred. |
| | | The Fund is charged for those expenses that are directly attributable to it, such as investment advisory, custody and transfer agent fees. Expenses that are not attributable to a Fund are typically allocated among the funds in the Trust proportionately based on allocation methods approved by the Board of Trustees (the “Board”). Common expenses of the Trust are typically allocated among the funds in the Trust based on a fund’s respective net assets, or by other equitable means. |
| | D. | Use of Estimates: The preparation of financial statements in conformity with GAAP requires management to make estimates and assumptions that affect the reported amounts of assets and liabilities at the date of the financial statements and the reported amounts of increases and decreases in net assets during the reporting period. Actual results could differ from those estimates. |
| | E. | Redemption Fees: The Mar Vista Strategic Growth Fund charges a 0.75% redemption fee to most shareholders who redeem shares held for 60 days or less. Such fees are retained by the Fund and accounted for as an addition to paid-in capital. |
| | F. | Mutual Fund and ETF Trading Risk: The Fund may invest in other mutual funds that are either open-end or closed-end investment companies as well as ETFs. ETFs are investment companies that are bought and sold on a national securities exchange. Unlike mutual funds, ETFs do not necessarily trade at the net asset values of their underlying securities, which means an ETF could potentially trade above or below the value of the underlying portfolios. Additionally, because ETFs trade like stocks on exchanges, they are subject to trading and commission costs unlike mutual funds. Also, both mutual funds and ETFs have management fees that are part of their costs, and the Fund will indirectly bear its proportionate share of the costs. |
| | G. | Reclassification of Capital Accounts: GAAP requires that certain components of net assets relating to permanent differences be reclassified between financial and tax reporting. These reclassifications have no effect on net assets or net asset value per share. For the most recent fiscal year end, the Fund made the following permanent tax adjustments on the Statement of Assets and Liabilities: |
| | | Accumulated | Accumulated | |
| | | Net Investment | Net Realized | Capital |
| | | Income/(Loss) | Gain/(Loss) | Stock |
| | Strategic Growth Fund | $(10) | $10 | $ — |
| NOTES TO FINANCIAL STATEMENTS (Continued) |
| December 31, 2016 (Unaudited) |
NOTE 3 – SECURITIES VALUATION
The Fund has adopted authoritative fair value accounting standards which establish an authoritative definition of fair value and set out a hierarchy for measuring fair value. These standards require additional disclosures about the various inputs and valuation techniques used to develop the measurements of fair value, a discussion of changes in valuation techniques and related inputs during the period, and expanded disclosure of valuation levels for major security types. These inputs are summarized in the three broad levels listed below:
| | Level 1 – | Unadjusted quoted prices in active markets for identical assets or liabilities that the Fund has the ability to access. |
| | Level 2 – | Observable inputs other than quoted prices included in level 1 that are observable for the asset or liability, either directly or indirectly. These inputs may include quoted prices for the identical instrument on an inactive market, prices for similar instruments, interest rates, prepayment speeds, credit risk, yield curves, default rates and similar data. |
| | Level 3 – | Unobservable inputs for the asset or liability, to the extent relevant observable inputs are not available, representing the Fund’s own assumptions about the assumptions a market participant would use in valuing the asset or liability, and would be based on the best information available. |
Following is a description of the valuation techniques applied to the Fund’s major categories of assets and liabilities measured at fair value on a recurring basis.
Equity Securities: Equity securities, including common stocks, preferred stocks, foreign-issued common stocks, exchange-traded funds, closed-end mutual funds and real estate investment trusts (REITs), that are primarily traded on a national securities exchange shall be valued at the last sale price on the exchange on which they are primarily traded on the day of valuation or, if there has been no sale on such day, at the mean between the bid and asked prices. Securities primarily traded in the NASDAQ Global Market System for which market quotations are readily available shall be valued using the NASDAQ Official Closing Price (“NOCP”). If the NOCP is not available, such securities shall be valued at the last sale price on the day of valuation, or if there has been no sale on such day, at the mean between the bid and asked prices. Over-the-counter securities which are not traded in the NASDAQ Global Market System shall be valued at the mean between the bid and asked prices. To the extent these securities are actively traded and valuation adjustments are not applied, they are categorized in level 1 of the fair value hierarchy.
Investment Companies: Investments in open-end mutual funds, including money market funds, are generally priced at their net asset value per share and will be classified in level 1 of the fair value hierarchy.
Exchange-Traded Notes: Investments in exchange-traded notes are actively traded on a national securities exchange and are valued based on the last sales price from the exchange and are categorized in level 1 of the fair value hierarchy.
| NOTES TO FINANCIAL STATEMENTS (Continued) |
| December 31, 2016 (Unaudited) |
The Board has delegated day-to-day valuation issues to a Valuation Committee of Manager Directed Portfolios which is comprised of representatives from U.S. Bancorp Fund Services, LLC, the Fund’s administrator. The function of the Valuation Committee is to value securities where current and reliable market quotations are not readily available, or the closing price does not represent fair value, by following procedures approved by the Board. These procedures consider many factors, including the type of security, size of holding, trading volume, and news events. All actions taken by the Valuation Committee are subsequently reviewed and ratified by the Board.
Depending on the relative significance of the valuation inputs, fair valued securities may be classified in either level 2 or level 3 of the fair value hierarchy.
The inputs or methodology used for valuing securities are not an indication of the risk associated with investing in those securities. The following is a summary of the fair valuation hierarchy of the Strategic Growth Fund’s securities as of December 31, 2016:
| | | Level 1 | | | Level 2 | | | Level 3 | | | Total | |
| Common Stocks | | | | | | | | | | | | |
| Consumer Discretionary | | $ | 3,030,917 | | | $ | — | | | $ | — | | | $ | 3,030,917 | |
| Consumer Staples | | | 2,647,105 | | | | — | | | | — | | | | 2,647,105 | |
| Energy | | | 1,840,672 | | | | — | | | | — | | | | 1,840,672 | |
| Financials | | | 4,207,008 | | | | — | | | | — | | | | 4,207,008 | |
| Health Care | | | 2,939,561 | | | | — | | | | — | | | | 2,939,561 | |
| Industrials | | | 3,855,892 | | | | — | | | | — | | | | 3,855,892 | |
| Information Technology | | | 5,761,429 | | | | — | | | | — | | | | 5,761,429 | |
| Materials | | | 1,315,330 | | | | — | | | | — | | | | 1,315,330 | |
| Total Common Stock | | | 25,597,914 | | | | — | | | | — | | | | 25,597,914 | |
| REITs | | | 1,566,072 | | | | — | | | | — | | | | 1,566,072 | |
| Short-Term Investments | | | 1,746,827 | | | | — | | | | — | | | | 1,746,827 | |
| Total Investments in Securities | | $ | 28,910,813 | | | $ | — | | | $ | — | | | $ | 28,910,813 | |
Refer to the Fund’s schedule of investments for a detailed break-out of securities by industry classification. Transfers between levels are recognized at the end of the reporting period. During the six months ended December 31, 2016, the Fund recognized no transfers between levels. There were no level 3 securities held in the Fund on December 31, 2016.
NOTE 4 – INVESTMENT ADVISORY FEE AND OTHER TRANSACTIONS WITH AFFILIATES
For the six months ended December 31, 2016, Mar Vista Investment Partners, LLC (the “Advisor”) provided the Fund with investment management services under an Investment Advisory Agreement. The Advisor furnishes all investment advice, office space, and facilities, and provides most of the personnel needed by the Fund. As compensation for its services, the Advisor is entitled to a monthly fee at an annual rate of
| NOTES TO FINANCIAL STATEMENTS (Continued) |
| December 31, 2016 (Unaudited) |
0.75% for the Strategic Growth Fund based upon the average daily net assets of the Fund. For the six months ended December 31, 2016, the Strategic Growth Fund incurred $103,504 in advisory fees. Advisory fees payable at December 31, 2016, for the Strategic Growth Fund were $15,891.
The Fund is responsible for its own operating expenses. The Advisor has contractually agreed to waive its fees and/or absorb expenses of the Fund to ensure that the net annual operating expenses (excluding Acquired Fund Fees and Expenses, taxes, brokerage commissions, interest and extraordinary expenses (collectively, “Excludable Expenses”)) do not exceed the following amounts of the average daily net assets of the Fund:
| Strategic Growth Fund |
| Institutional Shares | 0.90% |
For the six months ended December 31, 2016, the Advisor reduced its fees and absorbed Fund expenses in the amount of $68,806 for the Strategic Growth Fund.
U.S. Bancorp Fund Services, LLC (the “Administrator”) acts as the Fund’s Administrator under an Administration Agreement. The Administrator prepares various federal and state regulatory filings, reports and returns for the Fund; prepares reports and materials to be supplied to the Trustees; monitors the activities of the Fund’s custodian, transfer agent and accountants; coordinates the preparation and payment of the Fund’s expenses and reviews the Fund’s expense accruals. U.S. Bancorp Fund Services, LLC also serves as the fund accountant and transfer agent to the Fund. Vigilant Compliance, LLC serves as the Chief Compliance Officer to the Fund. U.S. Bank N.A., an affiliate of U.S. Bancorp Fund Services, serves as the Fund’s custodian. For the six months ended December 31, 2016, the Fund incurred the following expenses for administration, fund accounting, transfer agency, custody and Chief Compliance Officer fees:
| | Strategic Growth Fund | |
| | | | | | |
| | Administration & fund accounting | | $ | 16,618 | |
| | Custody | | $ | 2,570 | |
| | Transfer agency(a) | | $ | 10,342 | |
| | Chief Compliance Officer | | $ | 6,050 | |
| | | | | | |
| | (a) Does not include out-of-pocket expenses. | | | | |
At December 31, 2016, the Fund had payables due to U.S. Bancorp Fund Services, LLC for administration, fund accounting, transfer agency and Chief Compliance Officer fees and to U.S. Bank N.A. for custody fees in the following amounts:
| | Strategic Growth Fund | |
| | | | | | |
| | Administration & fund accounting | | $ | 11,225 | |
| | Custody | | $ | 976 | |
| | Transfer agency(a) | | $ | 4,016 | |
| | Chief Compliance Officer | | $ | 2,050 | |
| | | | | | |
| | (a) Does not include out-of-pocket expenses. | | | | |
| NOTES TO FINANCIAL STATEMENTS (Continued) |
| December 31, 2016 (Unaudited) |
Quasar Distributors, LLC (the “Distributor”) acts as the Fund’s principal underwriter in a continuous public offering of the Fund’s shares. The Distributor is an affiliate of the Administrator.
Certain officers of the Fund are employees of the Administrator. A Trustee of the Trust is affiliated with USBFS and U.S. Bank N.A. This same Trustee is an interested person of the Distributor.
NOTE 5 – SECURITIES TRANSACTIONS
For the six months ended December 31, 2016, the cost of purchases and the proceeds from sales of securities, excluding short-term securities, were as follows:
| | | Purchases | Sales |
| | Strategic Growth Fund | $5,615,787 | $1,830,110 |
There were no purchases or sales of long-term U.S. Government securities.
NOTE 6 – INCOME TAXES AND DISTRIBUTIONS TO SHAREHOLDERS
As of the most recent fiscal year end, the components of accumulated earnings/(losses) on a tax basis were as follows:
| | | | Strategic | |
| | | | Growth Fund | |
| | Cost of investments(a) | | $ | 21,206,779 | |
| | Gross unrealized appreciation | | | 4,691,985 | |
| | Gross unrealized depreciation | | | (597,330 | ) |
| | Net unrealized appreciation | | | 4,094,655 | |
| | Undistributed ordinary income | | | 28,308 | |
| | Undistributed long-term capital gain | | | 133,868 | |
| | Total distributable earnings | | | 162,176 | |
| | Other accumulated gains | | | — | |
| | Total accumulated earnings | | $ | 4,256,831 | |
| | (a) | The difference between the book basis and tax basis net unrealized appreciation and cost is attributable primarily to wash sales. |
As of the most recent fiscal year end, the Strategic Growth Fund had no long-term tax basis capital losses to offset future capital gains.
The tax character of distributions paid during 2016 was as follows:
| | | Six Months Ended | |
| | | December 31, 2016 | Year Ended |
| | | (Unaudited) | June 30, 2016 |
| | Strategic Growth Fund | | |
| | Ordinary income | $139,573 | $183,033 |
| | Long-term capital gains | $133,879 | $569,714 |
| NOTES TO FINANCIAL STATEMENTS (Continued) |
| December 31, 2016 (Unaudited) |
NOTE 7 – PRINCIPAL RISKS
The following is a list of certain risks that may apply to your investment in the Fund. Further information about investment risks is available in the Fund’s Statement of Additional Information.
Market Risk: The risk that the market value of a security may go up or down in response to many factors including the historical and prospective earnings of the issuer, the value of its assets, general economic conditions, interest rates, investor perceptions and market liquidity. Price changes may be temporary or last for extended periods.
Growth Investing Risk: The risk that an investment in a growth-oriented fund may be more volatile than the rest of the U.S. market as a whole. If the investment adviser’s assessment of a company’s prospects for earnings growth or how other investors will value the company’s earnings growth is incorrect, the process of the stock may fail to reach the value that the adviser has placed on it. Growth stock prices tend to fluctuate more dramatically than the overall stock market.
Foreign Security Risk: Foreign investments involve risks relating to political, economic, regulatory, or social instability, military action or unrest, or diplomatic developments and may be affected by actions of foreign governments adverse to the interest of U.S. investors.
IPO Risk: The Fund may purchase securities of companies engaged in initial public offerings (“IPOs”). The price of securities purchased in IPOs can be very volatile. The Fund’s investments in IPO shares may include the securities of “unseasoned” companies (companies with less than three years of continuous operations), which present risks considerably greater than common stocks of more established companies. These companies may be involved in new and evolving businesses and may be vulnerable to competition and changes in technology, markets and economic conditions. They may be more dependent on key managers and third parties and may have limited product lines. The effect of IPO investments on a Fund’s performance depends on a variety of factors, including the number of IPOs the Fund invests in relative to the size of the Fund, and whether and to what extent a security purchased in an IPO appreciates or depreciates in value. When the Fund’s asset base is small, a significant portion of the Fund’s performance could be attributable to investments in IPOs because such investments would have a magnified impact on the Fund. As the Fund’s asset grow, the effect of the Fund’s investments in IPOs on the Fund’s performance probably will decline, which could reduce the Fund’s performance.
NOTE 8 – COMMITMENTS AND CONTINGENCIES
In the normal course of business, the Fund enters into contracts that contain a variety of representations and warranties and which provide general indemnifications. The Fund’s maximum exposure under these arrangements is unknown, as this would involve future claims that may be made against the Fund that have not yet occurred. However, based on experience, the Fund expects the risk of loss to be remote.
| NOTES TO FINANCIAL STATEMENTS (Continued) |
| December 31, 2016 (Unaudited) |
NOTE 9 – SUBSEQUENT EVENTS
The name of the Trust has been changed to Manager Directed Portfolios effective July 1, 2016. The Board has approved the retention of U.S. Bancorp Fund Services, LLC (“USBFS”), U.S. Bank N.A. (“U.S. Bank”), Quasar Distributors LLC (“Quasar”) and Vigilant Compliance, LLC (“Vigilant”) as new service providers to the Trust. The new service agreements became effective on July 1, 2016. The Administration Agreement with Roxbury was terminated on June 30, 2016. The prior service agreements with BNY Mellon were terminated on June 30, 2016. In preparing the financial statements as of December 31, 2016, management considered the impact of subsequent events for potential recognition or disclosure in the financial statements and had concluded that no additional disclosures are necessary other than those mentioned above.
| EXPENSE EXAMPLE |
| December 31, 2016 (Unaudited) |
As a shareholder of the Fund, you incur two types of costs: (1) transaction costs including sales charges (loads) and redemption fees, if applicable; and (2) ongoing costs, including management fees; distribution and/or service (12b-1 fees); and other Fund expenses. This Example is intended to help you understand your ongoing costs (in dollars) of investing in the Fund and to compare these costs with the ongoing costs of investing in other mutual funds.
The Example is based on an investment of $1,000 invested at the beginning of the period indicated and held for the entire period from July 1, 2016 to December 31, 2016.
Actual Expenses
The information in the table under the heading “Actual” provides information about actual account values and actual expenses. You may use the information in these columns together with the amount you invested, to estimate the expenses that you paid over the period. Simply divide your account value by $1,000 (for example, an $8,600 account value divided by $1,000 = 8.6), then multiply the result by the number in the row entitled “Expenses Paid During Period” to estimate the expenses you paid on your account during this period. There are some account fees that are charged to certain types of accounts, such as Individual Retirement Accounts (generally, a $15 fee is charged to the account annually) that would increase the amount of expenses paid on your account. The example below does not include portfolio trading commissions and related expenses and other extraordinary expenses as determined under generally accepted accounting principles.
Hypothetical Example for Comparison Purposes
The information in the table under the heading “Hypothetical (5% return before expenses)” provides information about hypothetical account values and hypothetical expenses based on the Fund’s actual expense ratio and assumed rate of return of 5% per year before expenses, which is not the Fund’s actual return. The hypothetical account values and expenses may not be used to estimate the actual ending account balance or expenses you paid for the period. You may use this information to compare the ongoing costs of investing in the Fund and other funds. To do so, compare this 5% hypothetical example with the 5% hypothetical examples that appear in the shareholder reports of the other funds. As noted above, there are some account fees that are charged to certain types of accounts that would increase the amount of expense paid on your account.
Please note that the expenses shown in the table are meant to highlight your ongoing costs only and do not reflect any transaction costs, such as sales charges (loads), redemption fees, or exchange fees. Therefore, the information under the heading “Hypothetical (5% return before expenses)” is useful in comparing ongoing costs only, and will not help you determine the relative total costs of owning different funds. In addition, if these transactional costs were included, your costs would have been higher.
| EXPENSE EXAMPLE (Continued) |
| December 31, 2016 (Unaudited) |
| | Beginning | Ending | Expenses Paid |
| | Account Value | Account Value | During Period(1) |
| | 7/1/2016 | 12/31/2016 | 7/1/2016 – 12/31/2016 |
| Actual | | | |
| Institutional Shares | $1,000.00 | $1,014.00 | $4.57 |
| | | | |
| Hypothetical (5% return | | | |
| before expenses) | | | |
| Institutional Shares | $1,000.00 | $1,020.67 | $4.58 |
(1) | Expenses are equal to the Institutional Shares’ annualized expense ratio of 0.90%, multiplied by the average account value over the period, multiplied by 184/365 (to reflect the period). |
| NOTICE TO SHAREHOLDERS |
| at December 31, 2016 (Unaudited) |
How to Obtain a Copy of the Fund’s Proxy Voting Policies
A description of the policies and procedures that the Fund uses to determine how to vote proxies relating to portfolio securities is available without charge, upon request, by calling 1-844-737-6847 or on the U.S. Securities and Exchange Commission’s (“SEC”) website at http://www.sec.gov.
How to Obtain a Copy of the Fund’s Proxy Voting Records for the most recent 12-Month Period Ended June 30
Information regarding how the Fund voted proxies relating to portfolio securities during the most recent 12-month period ended June 30 is available no later than August 31 without charge, upon request, by calling 1-844-737-6847. Furthermore, you can obtain the Fund’s proxy voting records on the SEC’s website at http://www.sec.gov.
Quarterly Filings on Form N-Q
The Fund files its complete schedule of portfolio holdings with the SEC for the first and third quarters of each fiscal year on Form N-Q. The Fund’s Form N-Q is available on the SEC’s website at http://www.sec.gov. The Fund’s Form N-Q may be reviewed and copied at the SEC’s Public Reference Room in Washington, DC, and information on the operation of the Public Reference Room may be obtained by calling 1-202-551-8090. Information included in the Fund’s Form N-Q is also available, upon request, by calling 1-844-737-6847.
Householding
In an effort to decrease costs, the Fund intends to reduce the number of duplicate prospectuses and annual and semi-annual reports you receive by sending only one copy of each to those addresses shared by two or more accounts and to shareholders the Transfer Agent reasonably believes are from the same family or household. Once implemented, if you would like to discontinue householding for your accounts, please call toll-free at 1-844-737-6847 to request individual copies of these documents. Once the Transfer Agent receives notice to stop householding, the Transfer Agent will begin sending individual copies thirty days after receiving your request. This policy does not apply to account statements.
Other Tax Information (Unaudited)
For the most recent fiscal year ended June 30, 2016, 54.50% of dividends paid from net investment income qualify for the dividends received deduction available to corporate shareholders of the Fund. For shareholders of the Fund, 58.99% of the dividend income distributed for the most recent fiscal year ended June 30, 2016 is designated as qualified dividend income under the Jobs and Growth Relief Act of 2003. The percentage of taxable ordinary income distributions that are designated as short-term capital gain distributions under Internal Revenue Section 871(k)(2)(C) for the Fund was 91.12%.
| | FACTS | | WHAT DOES THE MAR VISTA STRATEGIC GROWTH FUND (“THE FUND”) DO WITH YOUR PERSONAL INFORMATION? | |
| | | | | |
| | Why? | | Financial companies choose how they share your personal information. Federal law gives consumers the right to limit some but not all sharing. Federal law also requires us to tell you how we collect, share, and protect your personal information. Please read this notice carefully to understand what we do. | |
| | | | | |
| | What? | | The types of personal information we collect and share depends on the product or service you have with us. This information can include: | |
| | | | • Social Security number | |
| | | | • account balances | |
| | | | • account transactions | |
| | | | • transaction history | |
| | | | • wire transfer instructions | |
| | | | • checking account information | |
| | | | When you are no longer our customer, we continue to share your information as described in this notice. | |
| | | | | |
| | How? | | All financial companies need to share customers’ personal information to run their everyday business. In the section below, we list the reasons financial companies can share their customers’ personal information; the reasons the Fund chooses to share; and whether you can limit this sharing. | |
| | | | | |
| | | Does the | Can you limit |
| | Reasons we can share your personal information | Fund share? | this sharing? |
| | For our everyday business purposes – such as to process your | Yes | No |
| | transactions, maintain your account(s), respond to court orders | | |
| | and legal investigations, or report to credit bureaus. | | |
| | For our marketing purposes – | Yes | No |
| | to offer our products and services to you | | |
| | For joint marketing with other financial companies | No | We do not share |
| | For our affiliates’ everyday business purposes – | Yes | No |
| | information about your transactions and experiences | | |
| | For our affiliates’ everyday business purposes – | No | We do not share |
| | information about your creditworthiness | | |
| | For our affiliates to market to you – The Fund may share | Yes | Yes |
| | information with our affiliates about shareholders or shareholder | | |
| | accounts in order to make shareholders aware of services and | | |
| | products which the Fund thinks may be of interest or value to them | | |
| | For nonaffiliates to market to you | No | We do not share |
| | To Limit the | | To limit our sharing, please notify us in the following way: | |
| | Fund’s Sharing | | • Contact the Fund by calling our toll-free phone number 1-844-737-6847. | |
| | | | Your choice to limit the personal information the Fund shares with its affiliates will apply until you request a change. If you are a new customer, we can begin sharing your information with our affiliates for marketing purposes 30 days from the date we sent this notice. When you are no longer a customer, we continue to share your information as described in this notice. | |
| | | | | |
| | Questions? | | If you have any questions or concerns regarding this notice or the Fund’s privacy policies, please contact us at 844-737-6847. | |
| PRIVACY NOTICE (Continued) |
| |
State Disclosures – In addition to the rights described below and in this notice, you may have other rights under state laws. We will comply with the applicable state laws with respect to our information practices.
California and Vermont have other protections under state law. If you primary mailing address is in California or Vermont, we will not share your financial information that we collect except as permitted by law, including, for example, with your consent or to service your account. We will also not use your information for joint marketing purposes. We do not share customer information with third parties except as permitted by law.
| | Who we are | | |
| | Who is providing | The Fund is an open-end management investment company registered under the | |
| | this notice? | Investment Company Act of 1940. | |
| | What we do | | |
| | How does the Fund | To protect your personal information from unauthorized access and use, we use | |
| | protect my personal | security measures that comply with federal law. These measures include computer | |
| | information? | safeguards and secured files and buildings. | |
| | How does the Fund | We collect your personal information, for example, when you | |
| | collect my personal | • open an account | |
| | information? | • provide account information | |
| | | • give us your contact information | |
| | | • make a wire transfer | |
| | | • tell us where to send the money | |
| | | We collect your personal information from others, such as credit bureaus, affiliates or other companies. | |
| | Why can’t I limit | Federal law gives you the right to limit only | |
| | all sharing? | • sharing for affiliates’ everyday business purposes – information about your creditworthiness | |
| | | • affiliates from using your information to market to you | |
| | | • sharing for nonaffiliates to market to you | |
| | | State laws and individual companies may give you additional rights to limit sharing. | |
| | Definitions | | |
| | Affiliates | Companies related by common ownership or control. They can be financial and nonfinancial companies. | |
| | | • The Fund’s affiliates are Mar Vista Investment Partners, investment advisor to the Mar Vista Strategic Growth Fund and Roxbury Capital Management, LLC, subadministrator to Roxbury. | |
| | Nonaffiliates | Companies not related by common ownership or control. They can be financial and nonfinancial companies. | |
| | | • The Fund does not share with nonaffiliates so they can market to you. | |
| | Joint marketing | A formal agreement between nonaffiliated financial companies that together market financial products or services to you. | |
| | | • The Fund does not jointly market. | |
(This Page Intentionally Left Blank.)
Investment Advisor
Mar Vista Investment Partners, LLC
11150 Santa Monica Blvd., Suite 320
Los Angeles, CA 90025
Distributor
Quasar Distributors, LLC
615 East Michigan Street, 4th Floor
Milwaukee, WI 53202
Transfer Agent
U.S. Bancorp Fund Services, LLC
615 East Michigan Street
Milwaukee, WI 53202
(844) 737-6847
Custodian
U.S. Bank National Association
Custody Operations
1555 North River Center Drive, Suite 302
Milwaukee, WI 53212
Independent Registered Public Accounting Firm
BBD, LLP
1835 Market Street, 26th floor
Philadelphia, PA 19103
Legal Counsel
Godfrey & Kahn S.C.
833 East Michigan Street, Suite 1800
Milwaukee, WI 53202
This report is intended for shareholders of the Fund and may not be used as sales literature unless preceded or accompanied by a current prospectus.
Past performance results shown in this report should not be considered a representation of future performance. Share price and returns will fluctuate so that shares, when redeemed, may be worth more or less than their original cost. Statements and other information herein are dated and are subject to change.
Item 2. Code of Ethics.
Not applicable for semi-annual reports.
Item 3. Audit Committee Financial Experts.
Not applicable for semi-annual reports.
Item 4. Principal Accountant Fees and Services.
Not applicable for semi-annual reports.
Item 5. Audit Committee of Listed Registrants.
Not applicable to registrants who are not listed issuers (as defined in Rule 10A-3 under the Securities Exchange Act of 1934).
Item 6. Investments.
| (a) | Schedule of Investments is included as part of the report to shareholders filed under Item 1 of this Form. |
Item 7. Disclosure of Proxy Voting Policies and Procedures for Closed-End Management Investment Companies.
Not applicable to open-end investment companies.
Item 8. Portfolio Managers of Closed-End Management Investment Companies.
Not applicable to open-end investment companies.
Item 9. Purchases of Equity Securities by Closed‑End Management Investment Company and Affiliated Purchasers.
Not applicable to open-end investment companies.
Item 10. Submission of Matters to a Vote of Security Holders.
There have been no material changes to the procedures by which shareholders may recommend nominees to the Registrant’s Board of Trustees.
Item 11. Controls and Procedures.
| (a) | The Registrant’s President/Principal Executive Officer and Treasurer/Principal Financial Officer have reviewed the Registrant's disclosure controls and procedures (as defined in Rule 30a-3(c) under the Investment Company Act of 1940, as amended, (the “Act”)) as of a date within 90 days of the filing of this report, as required by Rule 30a-3(b) under the Act and Rules 13a-15(b) or 15d‑15(b) under the Securities Exchange Act of 1934. Based on their review, such officers have concluded that the disclosure controls and procedures are effective in ensuring that information required to be disclosed in this report is appropriately recorded, processed, summarized and reported and made known to them by others within the Registrant and by the Registrant’s service provider. |
| (b) | There were no changes in the Registrant's internal control over financial reporting (as defined in Rule 30a-3(d) under the Act) that occurred during the second fiscal quarter of the period covered by this report that has materially affected, or is reasonably likely to materially affect, the Registrant's internal control over financial reporting. |
Item 12. Exhibits.
| (a) | (1) Any code of ethics or amendment thereto, that is subject to the disclosure required by Item 2, to the extent that the registrant intends to satisfy Item 2 requirements through filing an exhibit. Not applicable. |
(2) A separate certification for each principal executive and principal financial officer pursuant to Section 302 of the Sarbanes-Oxley Act of 2002. Filed herewith.
(3) Any written solicitation to purchase securities under Rule 23c‑1 under the Act sent or given during the period covered by the report by or on behalf of the registrant to 10 or more persons. Not applicable to open-end investment companies.
| (b) | Certifications pursuant to Section 906 of the Sarbanes‑Oxley Act of 2002. Furnished herewith. |
SIGNATURES
Pursuant to the requirements of the Securities Exchange Act of 1934 and the Investment Company Act of 1940, as amended, the registrant has duly caused this report to be signed on its behalf by the undersigned, thereunto duly authorized.
(Registrant) Manager Directed Portfolios
By (Signature and Title)* /s/Douglas J. Neilson
Douglas J. Neilson, President
Date 3/6/2017
Pursuant to the requirements of the Securities Exchange Act of 1934 and the Investment Company Act of 1940, as amended, this report has been signed below by the following persons on behalf of the registrant and in the capacities and on the dates indicated.
By (Signature and Title)* /s/Douglas J. Neilson
Douglas J. Neilson, President
Date 3/6/2017
By (Signature and Title)* /s/Matthew J. McVoy
Matthew J. McVoy, Treasurer
Date 3/6/2017
* Print the name and title of each signing officer under his or her signature.