UNITED STATES
SECURITIES AND EXCHANGE COMMISSION
Washington, D.C. 20549
SECURITIES AND EXCHANGE COMMISSION
Washington, D.C. 20549
FORM N-CSR
CERTIFIED SHAREHOLDER REPORT OF REGISTERED
MANAGEMENT INVESTMENT COMPANIES
Investment Company Act file number 811-21897
Manager Directed Portfolios
(Exact name of registrant as specified in charter)
(Exact name of registrant as specified in charter)
615 East Michigan Street
Milwaukee, WI 53202
(Address of principal executive offices) (Zip code)
(Address of principal executive offices) (Zip code)
Douglas J. Neilson, President
Manager Directed Portfolios
c/o U.S. Bank Global Fund Services
811 East Wisconsin Avenue, 8th Floor
Milwaukee, WI 53202
(Name and address of agent for service)
(Name and address of agent for service)
(414) 287-3101
Registrant's telephone number, including area code
Date of fiscal year end: October 31, 2018
Date of reporting period: October 31, 2018
Item 1. Reports to Stockholders.
Marmont Redwood
International Equity Fund
Annual Report
October 31, 2018
Marmont Redwood International Equity Fund
Table of Contents
| Letter to Shareholders | 3 | ||
| Investment Highlights | 5 | ||
| Sector Allocation | 6 | ||
| Schedule of Investments | 7 | ||
| Statement of Assets and Liabilities | 10 | ||
| Statement of Operations | 11 | ||
| Statement of Changes in Net Assets | 12 | ||
| Financial Highlights | 13 | ||
| Notes to the Financial Statements | 15 | ||
| Report of Independent Registered Public Accounting Firm | 25 | ||
| Expense Example | 26 | ||
| Notice to Shareholders | 28 | ||
| Trustees and Officers | 29 | ||
| Notice of Privacy Policy & Practices | 32 |
Marmont Redwood International Equity Fund
| LETTER TO SHAREHOLDERS |
Dear Shareholders:
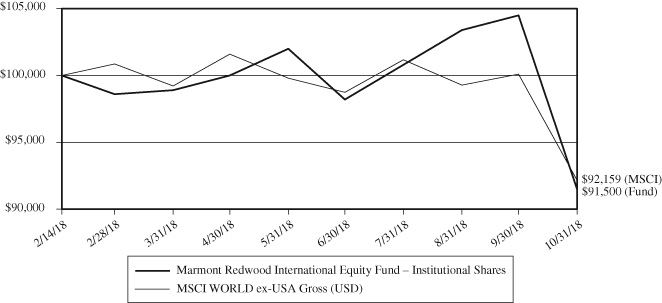
Since the Marmont Redwood International Equity Fund’s (the “Fund”) inception date on February 14, 2018, the Fund generated a return of -8.50% (Institutional Shares). This performance compared to -7.84% for its benchmark, the MSCI World ex-USA Gross (USD) for the same period. For the six-month period ending October 31, 2018, the Fund generated a return of -8.50% (Institutional Shares) and in the same six-month period, the MSCI World ex-USA Gross (USD) generated a -9.29% return.
Since the Fund’s inception, the top five portfolio contributors for the portfolio were: Burford Capital Limited, Fast Retailing Co., Ltd., Lundin Petroleum AB, Recruit Holdings Co., Ltd., and Rogers Communications Inc. Class B. Burford has benefited from the sharp rise in demand for financing to underwrite large-scale litigation. Growth in multi-case deals has increased the addressable market and improved the economics to Burford. Fast Retailing, the owner of the Japanese fast-fashion brand Uniqlo, is aggressively utilizing technology to optimize their supply and distribution chains as they expand in International markets, notably China. Lundin, a cost-advantaged Energy Exploration and Production company, is capitalizing on significant production expansion opportunities within its current footprint. Recruit owns key asset Indeed.com, which is disrupting the online recruiting space with a success-based revenue model, and successfully expanding outside of its core US market. Rogers, Canada’s leading connectivity player, is rolling out Comcast’s X1 technology platform to its subscribers, which is resulting in decreased churn and improved customer experiences.
The Fund’s since inception top five portfolio detractors were: Wynn Macau Ltd., Ashtead Group plc, Nintendo Co., Ltd., Hong Kong Exchanges & Clearing Ltd., and UniCredit S.p.A. Wynn Macau has suffered with the rest of the Macua gaming companies as concerns about a macro-economic slowdown, increased regulation, and the looming risks of expiring concessions. Despite delivering strong US leasing results, Ashtead’s stock has been negatively impacted by the slowdown in European activity. We expect the secular shift towards leasing machinery to continue, and view Ashtead as well-positioned to capitalize on this trend. Nintendo was impacted by concerns about their new Switch console, and by weakness in the overall video game group market. We continue to expect healthy operating profit growth over the next several years, driven in large part by the Switch console cycle and Nintendo’s proprietary Intellectual Property. The Hong Kong Exchanges suffered due to its large direct exposure to Chinese equities, which represents >70% of trading volumes and >60% of the exchange’s market value. UniCredit was negatively impacted by the outcome of the Italian elections which brought Euro-skeptic leadership into power and undermined confidence in Italian banks.
2018 has been a volatile year, with a dramatic divergence between US and International markets and currencies and punctuated by a significant October correction. The Fund’s relative performance has also been a tale of two periods; with strong outperformance
3
Marmont Redwood International Equity Fund
through September partially offset by a challenging October. Given rising US rates, escalating trade rhetoric, the possibility of a poorly managed Brexit, and moderating growth in the Eurozone and key Emerging Markets, the case for caution has strengthened from a year ago. That said, given our bottom-up stock selection methodology, Redwood’s approach for the Fund does not change. As always, we look to build a portfolio full of companies which we expect to deliver earnings growth materially above consensus expectations, which most are currently doing. This has been, and we think should continue to be, the driver of our long-term performance and we remain optimistically committed to the core approach that guides our stock selection.
Sincerely,
Redwood Investments, LLC
This material represents the manager’s assessment of the portfolio and market environment at a specific point in time and should not be relied upon by the reader as research or investment advice.
Fund holdings and/or sector allocations are subject to change at any time and should not be considered recommendations to buy or sell any security. Please see the Schedule of Investments in this report for a complete list of Fund holdings.
Mutual fund investing involves risk, including the loss of principal. Investments in foreign securities involve greater volatility and political, economic, and currency risks and differences in accounting methods. These risks are greater in emerging markets. Diversification does not assure a profit, nor does it protect against a loss in a declining market.
Must be preceded or accompanied by a prospectus.
The Marmont Redwood International Equity Fund is distributed by Quasar Distributors, LLC.
You cannot invest directly into an index.
The MSCI World ex-USA Gross Index captures large and mid-cap representation across 22 of 23 Developed Markets countries excluding the United States. With 1,013 constituents, the index covers approximately 85% of the free float-adjusted market capitalization in each country.
4
Marmont Redwood International Equity Fund
Investment Highlights (Unaudited)
Comparison of the Change in Value of a Hypothetical $100,000 Investment
in the Marmont Redwood International Equity Fund – Institutional Shares and
MSCI World ex-USA Gross (USD)
| Since Inception | |
| Total Return Period Ended October 31, 2018: | (2/14/2018) |
| Marmont Redwood International Equity Fund – Institutional Shares | -8.50% |
Marmont Redwood International Equity Fund – Retail Shares(1) | -8.63% |
| MSCI World ex-USA Gross (USD) | -7.84% |
| Expense ratios*: | Gross 1.58%, Net 1.00% (Institutional Shares); |
| Gross 1.83%, Net 1.25% (Retail Shares) |
Performance data quoted represents past performance; past performance does not guarantee future results. The investment return and principal value of an investment will fluctuate so that an investor’s shares, when redeemed, may be worth more or less than their original cost. Current performance of the Fund may be lower or higher than the performance quoted. Performance data current to the most recent month end may be obtained by calling 1-833-MAR-MONT.
This chart illustrates the performance of a hypothetical $100,000 investment made in the Fund on February 14, 2018, the Fund’s inception date. Returns reflect the reinvestment of dividends and capital gain distributions. The performance data and expense ratios shown reflect a contractual fee waiver made by the Adviser, currently, through February 14, 2021. In the absence of fee waivers, returns would be reduced. The performance data and graph do not reflect the deduction of taxes that a shareholder may pay on dividends, capital gain distributions, or redemption of Fund shares. This chart does not imply any future performance.
(1) | The inception date of the Retail Shares is September 17, 2018. Performance shown prior to the inception of the Retail Shares reflects the performance of the Institutional Shares and includes expenses that are applicable to, and are higher than, those of the Institutional Shares. The actual performance during the period September 17, 2018 (Retail Share inception) through October 31, 2018 was -11.34%. |
| * | The expense ratios presented are from the most recent prospectus. |
5
Marmont Redwood International Equity Fund
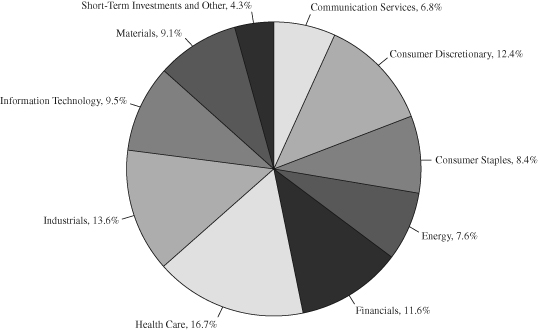
| SECTOR ALLOCATION OF PORTFOLIO ASSETS |
| at October 31, 2018 (Unaudited) |
| COUNTRY ALLOCATION OF PORTFOLIO ASSETS |
| at October 31, 2018 (Unaudited) |
| Switzerland | 16.8 | % | |||
| Japan | 16.7 | % | |||
| France | 9.5 | % | |||
| Canada | 9.0 | % | |||
| United Kingdom | 7.3 | % | |||
| Sweden | 6.9 | % | |||
| Germany | 5.4 | % | |||
| Australia | 5.0 | % | |||
| Spain | 4.6 | % | |||
| Netherlands | 3.0 | % | |||
| Ireland | 2.9 | % | |||
| Guernsey | 2.7 | % | |||
| Singapore | 2.2 | % | |||
| Israel | 1.9 | % | |||
| Belgium | 1.8 | % | |||
| Short-Term Investments and Other | 4.3 | % |
Percentages represent market value as a percentage of net assets.
6
Marmont Redwood International Equity Fund
| SCHEDULE OF INVESTMENTS |
| at October 31, 2018’ |
| Number of | ||||||||
| COMMON STOCKS – 95.7% | Shares | Value | ||||||
| Communication Services – 6.8% | ||||||||
| Nintendo Co. Ltd. | 1,173 | $ | 366,214 | |||||
| Rogers Communications, Inc. – Class B | 8,709 | 448,466 | ||||||
| 814,680 | ||||||||
| Consumer Discretionary – 12.4% | ||||||||
| Aristocrat Leisure Ltd. | 15,830 | 298,299 | ||||||
| Fast Retailing Co. Ltd. | 603 | 303,614 | ||||||
| LVMH Moet Hennessy Louis Vuitton SE | 1,278 | 387,750 | ||||||
| Puma SE | 470 | 241,682 | ||||||
| Suzuki Motor Corp. | 5,056 | 252,126 | ||||||
| 1,483,471 | ||||||||
| Consumer Staples – 8.4% | ||||||||
| Coca-Cola HBC AG | 11,439 | 337,892 | ||||||
| Remy Cointreau SA | 1,924 | 228,371 | ||||||
| Shiseido Co. Ltd. | 3,002 | 189,413 | ||||||
| Unicharm Corp. | 9,417 | 255,471 | ||||||
| 1,011,147 | ||||||||
| Energy – 7.6% | ||||||||
| Encana Corp. | 22,365 | 228,331 | ||||||
| Lundin Petroleum AB | 10,928 | 332,475 | ||||||
| Repsol SA | 19,201 | 343,098 | ||||||
| 903,904 | ||||||||
| Financials – 11.6% | ||||||||
| Burford Capital Ltd. | 15,191 | 322,004 | ||||||
| DBS Group Holdings Ltd. | 15,574 | 264,251 | ||||||
| Partners Group Holding AG | 565 | 402,254 | ||||||
| The Toronto-Dominion Bank | 7,124 | 395,203 | ||||||
| 1,383,712 | ||||||||
| Health Care – 16.7% | ||||||||
| ICON PLC (a) | 2,559 | 353,347 | ||||||
| Ipsen SA | 2,407 | 333,737 | ||||||
| Lonza Group AG | 999 | 314,125 | ||||||
| Roche Holding AG | 1,857 | 451,924 | ||||||
| Swedish Orphan Biovitrum AB (a) | 12,881 | 262,936 | ||||||
| Vifor Pharma AG | 1,985 | 286,890 | ||||||
| 2,002,959 | ||||||||
The accompanying notes are an integral part of these financial statements.
7
Marmont Redwood International Equity Fund
| SCHEDULE OF INVESTMENTS (Continued) |
| at October 31, 2018 |
| Number of | ||||||||
| COMMON STOCKS – 95.7% (Continued) | Shares | Value | ||||||
| Industrials – 13.6% | ||||||||
| Ashtead Group PLC | 14,263 | $ | 352,109 | |||||
| Bunzl PLC | 10,268 | 302,905 | ||||||
| Experian PLC | 9,378 | 215,686 | ||||||
| HOCHTIEF AG | 1,422 | 210,723 | ||||||
| International Consolidated Airlines Group SA | 27,285 | 210,353 | ||||||
| Recruit Holdings Co. Ltd. | 12,298 | 330,073 | ||||||
| 1,621,849 | ||||||||
| Information Technology – 9.5% | ||||||||
| Computershare Ltd. | 21,789 | 305,976 | ||||||
| Hexagon AB | 4,726 | 231,308 | ||||||
| Nice Ltd. (a) | 2,124 | 225,372 | ||||||
| Ubisoft Entertainment SA (a) | 2,125 | 190,617 | ||||||
| Wirecard AG | 1,014 | 189,675 | ||||||
| 1,142,948 | ||||||||
| Materials – 9.1% | ||||||||
| Koninklijke DSM NV | 4,058 | 354,297 | ||||||
| Sika AG | 1,703 | 218,363 | ||||||
| Taiyo Nippon Sanso Corp. | 18,856 | 303,059 | ||||||
| Umicore SA | 4,534 | 213,428 | ||||||
| 1,089,147 | ||||||||
| TOTAL COMMON STOCKS | ||||||||
| (Cost $12,505,331) | 11,453,817 | |||||||
The accompanying notes are an integral part of these financial statements.
8
Marmont Redwood International Equity Fund
| SCHEDULE OF INVESTMENTS (Continued) |
| at October 31, 2018 |
| Number of | ||||||||
| SHORT-TERM INVESTMENTS – 4.5% | Shares | Value | ||||||
| MONEY MARKET FUNDS – 4.5% | ||||||||
| First American Government Obligations Fund – | ||||||||
| Class X, 2.09% (b) | 542,439 | $ | 542,439 | |||||
| TOTAL SHORT-TERM INVESTMENTS | ||||||||
| (Cost $542,439) | 542,439 | |||||||
| TOTAL INVESTMENTS | ||||||||
| (Cost $13,047,770) – 100.2% | 11,996,256 | |||||||
| Liabilities in Excess of Other Assets – (0.2)% | (25,832 | ) | ||||||
| TOTAL NET ASSETS – 100.0% | $ | 11,970,424 | ||||||
Percentages are stated as a percent of net assets.
PLC – Public Limited Company
| (a) | Non-income producing security. |
| (b) | The rate shown represents the fund’s 7-day yield as of October 31, 2018. |
The Global Industry Classification Standard (GICS®) was developed by and/or is the exclusive property of MSCI, Inc. and Standard & Poor’s Financial Services LLC (“S&P”). GICS is a service mark of MSCI and S&P and has been licensed for use by U.S. Bancorp Fund Services, LLC.
The accompanying notes are an integral part of these financial statements.
9
Marmont Redwood International Equity Fund
| STATEMENT OF ASSETS AND LIABILITIES |
| at October 31, 2018 |
| Assets: | ||||
| Investments, at value (cost of $13,047,770) | $ | 11,996,256 | ||
| Receivables: | ||||
| Dividends and interest | 8,189 | |||
| Due from advisor | 20,094 | |||
| Prepaid expenses | 19,839 | |||
| Total assets | 12,044,378 | |||
| Liabilities: | ||||
| Payables: | ||||
| Administration and fund accounting fees | 27,396 | |||
| Distribution fees | 230 | |||
| Reports to shareholders | 5,328 | |||
| Compliance expense | 2,737 | |||
| Custody fees | 5,813 | |||
| Trustee fees | 2,393 | |||
| Transfer agent fees and expenses | 11,268 | |||
| Other accrued expenses | 18,789 | |||
| Total liabilities | 73,954 | |||
| Net assets | $ | 11,970,424 | ||
| Net assets consist of: | ||||
| Paid in capital | $ | 13,227,672 | ||
| Total accumulated deficit | (1,257,248 | ) | ||
| Net assets | $ | 11,970,424 | ||
| Institutional Shares: | ||||
| Net assets applicable to outstanding Institutional Shares | $ | 9,580,125 | ||
| Shares issued (Unlimited number of beneficial | ||||
| interest authorized, $0.01 par value) | 1,047,168 | |||
| Net asset value, offering price and redemption price per share | $ | 9.15 | ||
| Retail Shares: | ||||
| Net assets applicable to outstanding Retail Shares | $ | 2,390,299 | ||
| Shares issued (Unlimited number of | ||||
| beneficial interest authorized, $0.01 par value) | 261,363 | |||
| Net asset value, offering price and redemption price per share | $ | 9.15 | ||
The accompanying notes are an integral part of these financial statements.
10
Marmont Redwood International Equity Fund
| STATEMENT OF OPERATIONS |
| For the Period Ended October 31, 2018* |
| Investment income: | ||||
| Dividends (net of foreign taxes withheld of $1,978) | $ | 15,917 | ||
| Interest | 4,704 | |||
| Total investment income | 20,621 | |||
| Expenses: | ||||
| Investment advisory fees (Note 4) | 19,910 | |||
| Administration fees (Note 4) | 68,506 | |||
| Distribution fees (Note 5) | ||||
| Distribution fees – Retail Shares | 230 | |||
| Transfer agent fees and expenses | 29,716 | |||
| Federal and state registration fees | 23,474 | |||
| Audit fees | 13,500 | |||
| Compliance expense | 11,584 | |||
| Legal fees | 8,516 | |||
| Reports to shareholders | 5,387 | |||
| Trustees’ fees and expenses | 6,742 | |||
| Custody fees | 24,864 | |||
| Other | 6,387 | |||
| Total expenses before reimbursement from advisor | 218,816 | |||
| Expense reimbursement from advisor (Note 4) | (198,676 | ) | ||
| Net expenses | 20,140 | |||
| Net investment income | 481 | |||
| Realized and unrealized gain (loss): | ||||
| Net realized gain (loss) on transactions from: | ||||
| Investments | (228,215 | ) | ||
| Foreign currency transactions | 4,932 | |||
| Net change in unrealized gain (loss) on: | ||||
| Investments | (1,051,514 | ) | ||
| Foreign currency translations | (27 | ) | ||
| Net realized and unrealized loss | (1,274,824 | ) | ||
| Net decrease in net assets resulting from operations | $ | (1,274,343 | ) | |
| * | The Marmont Redwood International Equity Fund – Institutional Shares commenced operations on February 14, 2018. The Retail Shares commenced operations on September 17, 2018. |
The accompanying notes are an integral part of these financial statements.
11
Marmont Redwood International Equity Fund
| STATEMENT OF CHANGES IN NET ASSETS |
| Period Ended | ||||
| October 31, 2018* | ||||
| Operations: | ||||
| Net investment income | $ | 481 | ||
| Net realized loss on investments and foreign currency transactions | (223,283 | ) | ||
| Net change in unrealized loss on investments | ||||
| and foreign currency translations | (1,051,541 | ) | ||
| Net decrease in net assets resulting from operations | (1,274,343 | ) | ||
| Capital Share Transactions: | ||||
| Proceeds from shares sold | ||||
| Retail Shares | 2,488,184 | |||
| Institutional Shares | 10,788,798 | |||
| Cost of shares redeemed | ||||
| Retail Shares | — | |||
| Institutional Shares | (32,215 | ) | ||
| Net increase in net assets from capital share transactions | 13,244,767 | |||
| Total increase in net assets | 11,970,424 | |||
| Net Assets: | ||||
| Beginning of period | — | |||
| End of period | $ | 11,970,424 | ||
| Changes in Shares Outstanding: | ||||
| Shares sold | ||||
| Retail Shares | 261,363 | |||
| Institutional Shares | 1,050,588 | |||
| Shares redeemed | ||||
| Institutional Shares | (3,420 | ) | ||
| Net increase in shares outstanding | 1,308,531 | |||
| * | The Marmont Redwood International Equity Fund – Institutional Shares commenced operations on February 14, 2018. The Retail Shares commenced operations on September 17, 2018. |
The accompanying notes are an integral part of these financial statements.
12
Marmont Redwood International Equity Fund
| FINANCIAL HIGHLIGHTS |
For a capital share outstanding throughout the period
Institutional Shares
| February 14, 2018* | ||||
| through | ||||
| October 31, 2018 | ||||
| Net Asset Value – Beginning of Period | $ | 10.00 | ||
| Income (Loss) from Investment Operations: | ||||
Net investment income/(loss)1 | — | 2 | ||
| Net realized and unrealized loss | (0.85 | ) | ||
| Total from investment operations | (0.85 | ) | ||
| Net Asset Value – End of Period | $ | 9.15 | ||
| Total Return | (8.50 | )%^ | ||
| Ratios and Supplemental Data: | ||||
| Net assets, end of period (thousands) | $ | 9,580 | ||
| Ratio of operating expenses to average net assets: | ||||
| Before reimbursements | 11.31 | %+ | ||
| After reimbursements | 1.00 | %+ | ||
| Ratio of net investment income to average net assets: | ||||
| Before reimbursements | (10.25 | )%+ | ||
| After reimbursements | 0.06 | %+ | ||
Portfolio turnover rate3 | 53 | %^ | ||
| * | Commencement of operations for Institutional Shares was February 14, 2018. |
+ | Annualized |
| ^ | Not Annualized |
1 | The net investment income per share was calculated using the average shares outstanding method. |
2 | Amount is less than $0.01 per share. |
3 | Portfolio turnover was calculated on the basis of the Fund as a whole. The rate presented represents portfolio turnover for the entire fiscal period. |
The accompanying notes are an integral part of these financial statements.
13
Marmont Redwood International Equity Fund
| FINANCIAL HIGHLIGHTS |
For a capital share outstanding throughout the period
Retail Shares
| September 17, 2018* | ||||
| through | ||||
| October 31, 2018 | ||||
| Net Asset Value – Beginning of Period | $ | 10.32 | ||
| Income (Loss) from Investment Operations: | ||||
Net investment loss1 | (0.01 | ) | ||
| Net realized and unrealized loss | (1.16 | ) | ||
| Total from investment operations | (1.17 | ) | ||
| Net Asset Value – End of Period | $ | 9.15 | ||
| Total Return | (11.34 | )%^ | ||
| Ratios and Supplemental Data: | ||||
| Net assets, end of period (thousands) | $ | 2,390 | ||
| Ratio of operating expenses to average net assets: | ||||
| Before reimbursements | 4.43 | %+ | ||
| After reimbursements | 1.25 | %+ | ||
| Ratio of net investment income to average net assets: | ||||
| Before reimbursements | (3.99 | )%+ | ||
| After reimbursements | (0.81 | )%+ | ||
Portfolio turnover rate2 | 53 | %^ | ||
| * | Commencement of operations for Retail Shares was September 17, 2018. |
+ | Annualized |
| ^ | Not Annualized |
1 | The net investment loss per share was calculated using the average shares outstanding method. |
2 | Portfolio turnover was calculated on the basis of the Fund as a whole. The rate presented represents portfolio turnover for the entire fiscal period. |
The accompanying notes are an integral part of these financial statements.
14
Marmont Redwood International Equity Fund
| NOTES TO FINANCIAL STATEMENTS |
| at October 31, 2018 |
NOTE 1 – ORGANIZATION
The Marmont Redwood International Equity Fund (the “Fund”) is a series of Manager Directed Portfolios (the “Trust”). The Trust is registered under the Investment Company Act of 1940, as amended (the “1940 Act”), and was organized as a Delaware statutory trust on April 4, 2006. The Fund is an open-end investment management company and is a diversified series of the Trust. The Fund’s Institutional Shares commenced operations on February 14, 2018. The Fund’s Retail Shares commenced operations on September 17, 2018. Each class of shares differs principally in its respective distribution expenses. Each class of shares has identical rights to earnings, assets and voting privileges, except for class-specific expenses and exclusive rights to vote on matters affecting only individual classes. Marmont Partners LLC (the “Advisor”) serves as the investment advisor to the Fund. Redwood Investments, LLC (the “Sub-Advisor”) serves as the sub-advisor to the Fund. As an investment company, the Fund follows the investment company accounting and reporting guidance of the Financial Accounting Standards Board (“FASB”) Accounting Standard Codification Topic 946 Financial Services – Investment Companies. The investment objective of the Fund is to seek long term capital appreciation.
NOTE 2 – SIGNIFICANT ACCOUNTING POLICIES
The following is a summary of significant accounting policies consistently followed by the Fund. These policies are in conformity with U.S. generally accepted accounting principles (“GAAP”).
| A. | Security Valuation: All investments in securities are recorded at their estimated fair value, as described in Note 3. | |
| B. | Federal Income Taxes: It is the Fund’s policy to comply with the requirements of Subchapter M of the Internal Revenue Code applicable to regulated investment companies and to distribute substantially all of its taxable income to its shareholders. Therefore, no federal income or excise tax provisions are required. | |
| The Fund recognizes the tax benefits of uncertain tax positions only where the position is “more likely than not” to be sustained assuming examination by tax authorities. Management has analyzed the Fund’s tax positions, and has concluded that no liability for unrecognized tax benefits should be recorded related to uncertain tax positions to be taken or expected to be taken in the Fund’s 2018 tax returns. The Fund identifies its major tax jurisdictions as U.S. Federal and the state of Delaware. | ||
| C. | Securities Transactions, Income and Distributions: Securities transactions are accounted for on the trade date. Realized gains and losses on securities sold are determined on the basis of identified cost. Interest income is recorded on an accrual basis. Dividend income and distributions to shareholders are recorded on the ex-dividend date. Withholding taxes on foreign dividends have been provided for in accordance with the Fund’s understanding of the applicable country’s tax rules and rates. |
15
Marmont Redwood International Equity Fund
| NOTES TO FINANCIAL STATEMENTS (Continued) |
| at October 31, 2018 |
| The Fund distributes substantially all of its net investment income, if any, and net realized capital gains, if any, annually. Distributions from net realized gains for book purposes may include short-term capital gains. All short-term capital gains are included in ordinary income for tax purposes. The amount of dividends and distributions to shareholders from net investment income and net realized capital gains is determined in accordance with federal income tax regulations, which may differ from GAAP. To the extent these book/tax differences are permanent, such amounts are reclassified within the capital accounts based on their federal tax treatment. | ||
| The Fund is charged for those expenses that are directly attributable to it, such as investment advisory, custody and transfer agent fees. Expenses that are not attributable to a Fund are typically allocated among the funds in the Trust proportionately based on allocation methods approved by the Board of Trustees (the “Board”). Common expenses of the Trust are typically allocated among the funds in the Trust based on a fund’s respective net assets, or by other equitable means. | ||
| D. | Use of Estimates: The preparation of financial statements in conformity with GAAP requires management to make estimates and assumptions that affect the reported amounts of assets and liabilities at the date of the financial statements and the reported amounts of increases and decreases in net assets during the reporting period. Actual results could differ from those estimates. | |
| E. | Reclassification of Capital Accounts: GAAP requires that certain components of net assets relating to permanent differences be reclassified between financial and tax reporting. These reclassifications have no effect on net assets or net asset value per share. | |
| F. | Foreign Currency: Values of investments denominated in foreign currencies are converted into U.S. dollars using the spot market rate of exchange at the time of valuation. Purchases and sales of investments and income are translated into U.S. dollars using the spot market rate of exchange prevailing on the respective dates of such transactions. The Fund does not isolate the portion of the results of operations resulting from fluctuations in foreign exchange rates on investments from fluctuations resulting from changes in the market prices of securities held. Such fluctuations are included with the net realized and unrealized gain/loss on investments. Foreign investments present additional risks due to currency fluctuations, economic and political factors, lower liquidity, government regulations, differences in accounting standards, and other factors. | |
| G. | Events Subsequent to the Fiscal Period End: In preparing the financial statements as of October 31, 2018, management considered the impact of subsequent events for potential recognition or disclosure in the financial statements and had concluded that no additional disclosures are necessary. |
16
Marmont Redwood International Equity Fund
| NOTES TO FINANCIAL STATEMENTS (Continued) |
| at October 31, 2018 |
| H. | Recent Accounting Pronouncements and Rule Issuances: In August 2018, FASB issued ASU 2018-13, Fair Value Measurement (Topic 820): Disclosure Framework—Changes to the Disclosure Requirements for Fair Value Measurement (“ASU 2018-13”). The primary focus of ASU 2018-13 is to improve the effectiveness of the disclosure requirements for fair value measurements. The changes affect all companies that are required to include fair value measurement disclosures. In general, the amendments in ASU 2018-13 are effective for all entities for fiscal years and interim periods within those fiscal years, beginning after December 15, 2019. An entity is permitted to early adopt the removed or modified disclosures upon the issuance of ASU 2018-13 and may delay adoption of the additional disclosures, which are required for public companies only, until their effective date. Management has evaluated the impact of this change in guidance, and due to the permissibility of early adoption, modified the Fund’s fair value disclosures for the current reporting period. | |
| In August 2018, the Securities and Exchange Commission issued Final Rule Release No. 33-10532, Disclosure Update and Simplification, which in part amends certain financial statement disclosure requirements of Regulation S-X that have become redundant, duplicative, overlapping, outdated, or superseded, in light of other Commission disclosure requirements, U.S. Generally Accepted Accounting Principles, or changes in the information environment. The amendments are intended to facilitate the disclosure of information to investors and simplify compliance without significantly altering the total mix of information provided to investors. The amendments to Rule 6-04.17 of Regulation S-X (balance sheet) were amended to require presentation of the total, rather than the components of net assets, of distributable earnings on the balance sheet. Consistent with U.S. GAAP, funds will be required to disclose total distributable earnings. The amendments to Rule 6-09 of Regulation S-X (statement of changes in net assets) omit the requirement to separately state the sources of distributions paid as well as omit the requirement to parenthetically state the book basis amount of undistributed net investment income. Instead, consistent with U.S. GAAP, funds will be required to disclose the total amount of distributions paid, except that any tax return of capital must be separately disclosed. The requirements of the Final Rule Release are effective November 5, 2018 and the Funds’ Statement of Assets and Liabilities and the Statement of Changes in Net Assets for the current reporting period have been modified accordingly. |
NOTE 3 – SECURITIES VALUATION
The Fund has adopted authoritative fair value accounting standards which establish an authoritative definition of fair value and set out a hierarchy for measuring fair value. These standards require additional disclosures about the various inputs and valuation techniques used to develop the measurements of fair value, a discussion of changes in
17
Marmont Redwood International Equity Fund
| NOTES TO FINANCIAL STATEMENTS (Continued) |
| at October 31, 2018 |
valuation techniques and related inputs during the period, and expanded disclosure of valuation levels for major security types. These inputs are summarized in the three broad levels listed below:
| Level 1 – | Unadjusted, quoted prices in active markets for identical assets or liabilities that the Fund has the ability to access at the date of measurement. | |
| Level 2 – | Other significant observable inputs (including, but not limited to, quoted prices in active markets for similar instruments, quoted prices in markets that are not active for identical or similar instruments, and model-derived valuations in which all significant inputs and significant value drivers are observable in active markets, such as interest rates, prepayment speeds, credit risk curves, default rates, and similar data). | |
| Level 3 – | Significant unobservable inputs for the asset or liability, to the extent relevant observable inputs are not available, representing the Fund’s own assumptions about the assumptions a market participant would use in valuing the asset or liability, and would be based on the best information available. |
Following is a description of the valuation techniques applied to the Fund’s major categories of assets and liabilities measured at fair value on a recurring basis.
Equity Securities: Equity securities, including common stocks, preferred stocks, foreign-issued common stocks, exchange-traded funds, closed-end mutual funds and real estate investment trusts (REITs), that are primarily traded on a national securities exchange shall be valued at the last sale price on the exchange on which they are primarily traded on the day of valuation or, if there has been no sale on such day, at the mean between the bid and asked prices. Securities primarily traded in the NASDAQ Global Market System for which market quotations are readily available shall be valued using the NASDAQ Official Closing Price (“NOCP”). If the NOCP is not available, such securities shall be valued at the last sale price on the day of valuation, or if there has been no sale on such day, at the mean between the bid and asked prices. Over-the-counter securities that are not traded on a listed exchange are valued at the last sale price in the over-the-counter market. Over-the-counter securities which are not traded in the NASDAQ Global Market System shall be valued at the mean between the bid and asked prices. To the extent these securities are actively traded and valuation adjustments are not applied, they are categorized in Level 1 of the fair value hierarchy. Securities traded on foreign exchanges generally are not valued at the same time the Fund calculates its net asset value (“NAV”) because most foreign markets close well before such time. The earlier close of most foreign markets gives rise to the possibility that significant events, including broad market moves, may have occurred in the interim. In certain circumstances, it may be determined that a security needs to be fair valued because it appears that the value of the security might have been materially affected by an event (a “Significant Event”) occurring after the close of the market in which the security is principally traded, but before the time the Fund calculates its NAV. A Significant Event may relate to a single issuer or to an entire market
18
Marmont Redwood International Equity Fund
| NOTES TO FINANCIAL STATEMENTS (Continued) |
| at October 31, 2018 |
sector, or even occurrences not tied directly to the securities markets, such as natural disasters, armed conflicts, or significant government actions.
Registered Investment Companies: Investments in registered investment companies (e.g., mutual funds) are generally priced at the ending NAV provided by the applicable registered investment company’s service agent and will be classified in Level 1 of the fair value hierarchy.
Short-Term Debt Securities: Debt securities, including short-term debt instruments having a maturity of less than 60 days, are valued at the evaluated mean price supplied by an approved pricing service. Pricing services may use various valuation methodologies including matrix pricing and other analytical pricing models as well as market transactions and dealer quotations. In the absence of prices from a pricing service, the securities will be priced in accordance with the procedures adopted by the Board. Short-term securities are generally classified in Level 1 or Level 2 of the fair market hierarchy depending on the inputs used and market activity levels for specific securities.
The Board has delegated day-to-day valuation issues to a Valuation Committee of the Trust which, as of October 31, 2018, was comprised of officers of the Trust as well as an interested trustee of the Trust. The function of the Valuation Committee is to value securities where current and reliable market quotations are not readily available, or the closing price does not represent fair value, by following procedures approved by the Board. These procedures consider many factors, including the type of security, size of holding, trading volume, news events and significant events such as those described previously. All actions taken by the Valuation Committee are subsequently reviewed and ratified by the Board.
Depending on the relative significance of the valuation inputs, fair valued securities may be classified in either level 2 or level 3 of the fair value hierarchy.
The fair valuation of foreign securities may be determined with the assistance of a pricing service using correlations between the movement of prices of such securities and indices of domestic securities and other appropriate indicators, such as closing market prices of relevant American Depositary Receipts or futures contracts. The Fund uses ICE Data Services (“ICE”) as a third party fair valuation vendor. ICE provides a fair value for foreign securities in the Fund based on certain factors and methodologies applied by ICE in the event that there is a movement in the U.S. markets that exceeds a specific threshold established by the Valuation Committee. The effect of using fair value pricing is that the Fund’s NAV will reflect the affected portfolio securities’ values as determined by the Board or its designee instead of being determined by the market. Using a fair value pricing methodology to price a foreign security may result in a value that is different from the foreign security’s most recent closing price and from the prices used by other investment companies to calculate their NAVs and are generally classified in Level 2 of the fair valuation hierarchy. Because the Fund may invest in foreign securities, the value of the Fund’s portfolio securities may change on days when you will not be able to purchase or redeem your shares.
19
Marmont Redwood International Equity Fund
| NOTES TO FINANCIAL STATEMENTS (Continued) |
| at October 31, 2018 |
The inputs or methodology used for valuing securities are not an indication of the risk associated with investing in those securities. The following is a summary of the fair valuation hierarchy of the Fund’s securities as of October 31, 2018:
| Common Stocks | Level 1 | Level 2 | Level 3 | Total | ||||||||||||
| Communication Services | $ | 448,466 | $ | 366,214 | $ | — | $ | 814,680 | ||||||||
| Consumer Discretionary | — | 1,483,471 | — | 1,483,471 | ||||||||||||
| Consumer Staples | — | 1,011,147 | — | 1,011,147 | ||||||||||||
| Energy | 228,331 | 675,573 | — | 903,904 | ||||||||||||
| Financials | 395,203 | 988,509 | — | 1,383,712 | ||||||||||||
| Health Care | 616,283 | 1,386,676 | — | 2,002,959 | ||||||||||||
| Industrials | — | 1,621,849 | — | 1,621,849 | ||||||||||||
| Information Technology | — | 1,142,948 | — | 1,142,948 | ||||||||||||
| Materials | — | 1,089,147 | — | 1,089,147 | ||||||||||||
| Total Common Stocks | 1,688,283 | 9,765,534 | — | 11,453,817 | ||||||||||||
| Short-Term Investments | 542,439 | — | — | 542,439 | ||||||||||||
| Total Investments in Securities | $ | 2,230,722 | $ | 9,765,534 | $ | — | $ | 11,996,256 | ||||||||
Refer to the Fund’s schedule of investments for a detailed break-out of securities by industry classification.
NOTE 4 – INVESTMENT ADVISORY FEE AND OTHER TRANSACTIONS WITH AFFILIATES
For the fiscal period ended October 31, 2018, the Advisor provided the Fund with investment management services under an Investment Advisory Agreement. The Advisor furnishes all investment advice, office space, and facilities, and provides most of the personnel needed by the Fund. For the fiscal period ended October 31, 2018, the Fund incurred $19,910 in advisory fees. The Advisor has hired Redwood Investments, LLC as a sub-advisor to the Fund. The Advisor pays the Sub-Advisor fee for the Fund from its own assets and these fees are not an additional expense of the Fund.
The Fund is responsible for its own operating expenses. The Advisor has contractually agreed to waive its management fees and/or absorb expenses of the Fund to ensure that the total annual operating expenses [excluding front-end or contingent deferred loads, Rule 12b-1 plan fees, shareholder servicing plan fees, taxes, leverage, interest, brokerage commissions and other transactional expenses, expenses in connection with a merger or reorganization, dividends or interest on short positions, acquired fund fees and expenses or extraordinary expenses (collectively, “Excludable Expenses”)] do not exceed the following amounts of the average daily net assets for each class of shares:
Marmont Redwood International Equity Fund
| Institutional Shares | 1.00% | ||
| Retail Shares | 1.25% |
20
Marmont Redwood International Equity Fund
| NOTES TO FINANCIAL STATEMENTS (Continued) |
| at October 31, 2018 |
For the fiscal period ended October 31, 2018, the Advisor reduced its fees and absorbed Fund expenses in the amount of $198,676 for the Fund. The waivers and reimbursements will remain in effect through February 14, 2021 unless terminated sooner by, or with the consent of, the Board.
The Advisor may request recoupment of previously waived fees and paid expenses in any subsequent month in the three-year period from the date of the management fee reduction and expense payment if the aggregate amount actually paid by the Fund toward the operating expenses for such fiscal year (taking into account the reimbursement) will not cause the Fund to exceed the lesser of: (1) the expense limitation in place at the time of the management fee reduction and expense payment; or (2) the expense limitation in place at the time of the reimbursement. Any such reimbursement is also contingent upon Board of Trustees review and approval at the time the reimbursement is made. Such reimbursement may not be paid prior to the Fund’s payment of current ordinary operating expenses. Cumulative expenses subject to recapture pursuant to the aforementioned conditions expire as follows:
10/31/2021 | Total | ||
| $198,676 | $198,676 |
U.S. Bancorp Fund Services, LLC, doing business as U.S. Bank Global Fund Services, LLC (“Fund Services” or the “Administrator”) acts as the Fund’s Administrator under an Administration Agreement. The Administrator prepares various federal and state regulatory filings, reports and returns for the Fund; prepares reports and materials to be supplied to the Trustees; monitors the activities of the Fund’s custodian, transfer agent and accountants; coordinates the preparation and payment of the Fund’s expenses and reviews the Fund’s expense accruals. Fund Services also serves as the fund accountant and transfer agent to the Fund. Vigilant Compliance, LLC serves as the Chief Compliance Officer to the Fund. U.S. Bank N.A., an affiliate of Fund Services, serves as the Fund’s custodian. For the fiscal period ended October 31, 2018, the Fund incurred the following expenses for administration, fund accounting, transfer agency, custody and Chief Compliance Officer fees:
| Administration & fund accounting | $68,506 | |||
| Custody | $24,864 | |||
Transfer agency(a) | $19,046 | |||
| Chief Compliance Officer | $11,584 |
(a) | Does not include out-of-pocket expenses. |
21
Marmont Redwood International Equity Fund
| NOTES TO FINANCIAL STATEMENTS (Continued) |
| at October 31, 2018 |
At October 31, 2018, the Fund had payables due to Fund Services for administration, fund accounting, transfer agency and Chief Compliance Officer fees and to U.S. Bank N.A. for custody fees in the following amounts:
| Administration & fund accounting | $27,396 | |||
| Custody | $ 5,813 | |||
Transfer agency(a) | $ 8,038 | |||
| Chief Compliance Officer | $ 2,737 |
(a) | Does not include out-of-pocket expenses. |
Quasar Distributors, LLC (the “Distributor”) acts as the Fund’s principal underwriter in a continuous public offering of the Fund’s shares. The Distributor is an affiliate of the Administrator. A Trustee of the Trust is deemed to be an interested person of the Trust due to his former position with the Distributor.
Certain officers of the Fund are employees of the Administrator and are not paid any fees by the Fund for serving in such capacities.
NOTE 5 – DISTRIBUTION AGREEMENT AND PLAN
The Fund has adopted a Distribution Plan pursuant to Rule 12b-1 (the “Plan”). The Plan permits the Fund to pay for distribution and related expenses at an annual rate of up to 0.25% of the average daily net assets of the Fund’s Retail Shares. The expenses covered by the Plan may include costs in connection with the promotion and distribution of shares and the provision of personal services to shareholders, including, but not necessarily limited to, advertising, compensation to underwriters, dealers and selling personnel, the printing and mailing of prospectuses to other than current Fund shareholders, and the printing and mailing of sales literature. Payments made pursuant to the Plan will represent compensation for distribution and service activities, not reimbursements for specific expenses incurred. For the period ended October 31, 2018, the Marmont Redwood International Equity Fund incurred distribution expenses on its Retail Shares of $230.
NOTE 6 – SECURITIES TRANSACTIONS
For the fiscal period ended October 31, 2018, the cost of purchases and the proceeds from sales of securities, excluding short-term securities, were as follows:
Purchases | Sales | ||
| International Equity Fund | $14,151,143 | $1,440,073 |
There were no purchases or sales of long-term U.S. Government securities.
22
Marmont Redwood International Equity Fund
| NOTES TO FINANCIAL STATEMENTS (Continued) |
| at October 31, 2018 |
NOTE 7 – INCOME TAXES AND DISTRIBUTIONS TO SHAREHOLDERS
As of October 31, 2018, the Fund’s most recent fiscal period, the components of accumulated earnings/(losses) on a tax basis were as follows:
Cost of investments(a) | $ | 13,068,111 | |||
| Gross unrealized appreciation | 73,502 | ||||
| Gross unrealized depreciation | (1,145,357 | ) | |||
| Net unrealized depreciation | (1,071,855 | ) | |||
| Undistributed ordinary income | — | ||||
| Undistributed long-term capital gain | — | ||||
| Total distributable earnings | — | ||||
| Other accumulated gains/(losses) | (185,393 | ) | |||
| Total accumulated earnings/(losses) | $ | (1,257,248 | ) |
(a) | The difference between the book basis and tax basis net unrealized depreciation and cost is attributable primarily to wash sales. |
As of October 31, 2018, the Fund’s most recent fiscal period, the Fund had short-term tax basis capital losses with no expiration date of $185,366.
NOTE 8 – PRINCIPAL RISKS
Below are summaries of some, but not all, of the principal risks of investing in the Fund, each of which could adversely affect the Fund’s NAV, market price, yield, and total return. Further information about investment risks is available in the Fund’s prospectus and Statement of Additional Information.
Equity Market Risk: Equity securities are susceptible to general stock market fluctuations due to economic, market, political and issuer-specific considerations and to potential volatile increases and decreases in value as market confidence in and perceptions of their issuers change.
Foreign Securities and Currency Risk: Foreign securities are subject to risks relating to political, social and economic developments abroad and differences between U.S. and foreign regulatory requirements and market practices. Those risks are increased for investments in emerging markets. Securities that are denominated in foreign currencies are subject to further risk that the value of the foreign currency will fall in relation to the U.S. dollar and/or will be affected by volatile currency markets or actions of U.S. and foreign governments or central banks. Income earned on foreign securities may be subject to foreign withholding taxes.
Management Risk: The ability of the Fund to meet its investment objective is directly related to the Advisor’s and Sub-Advisor’s management of the Fund. The value of your investment in the Fund may vary with the effectiveness of the Advisor’s research, analysis
23
Marmont Redwood International Equity Fund
| NOTES TO FINANCIAL STATEMENTS (Continued) |
| at October 31, 2018 |
and asset allocation among portfolio securities. If the investment strategies do not produce the expected results, the value of your investment could be diminished or even lost entirely.
New Fund Risk: There can be no assurance that the Fund will grow to or maintain an economically viable size, in which case the Board may determine to liquidate the Fund. Liquidation of the Fund can be initiated without shareholder approval by the Board if it determines that liquidation is in the best interest of shareholders. As a result, the timing of the Fund’s liquidation may not be favorable.
Emerging and Frontier Markets Risk: Countries in emerging markets are generally more volatile and can have relatively unstable governments, social and legal systems that do not protect shareholders, economies based on only a few industries, and securities markets that trade a small number of issues. Frontier market countries generally have smaller economies and even less developed capital markets than emerging markets. As a result, the risks of investing in emerging markets are magnified in frontier markets, and include potential for extreme price volatility and illiquidity; government ownership or control of parts of private sector and of certain companies; trade barriers, exchange controls, managed adjustments in relative currency values and other protectionist measures; and relatively new and unsettled securities laws.
Large Capitalization Risk: Larger, more established companies may be unable to respond quickly to new competitive challenges such as changes in technology and consumer tastes. Larger companies also may not be able to attain the high growth rates of successful smaller companies.
Medium and Small Capitalization Risk: Investing in medium and small capitalization companies may involve special risks because those companies may have narrower product lines, more limited financial resources, fewer experienced managers, dependence on a few key employees, and a more limited trading market for their stocks, as compared with larger companies. Securities of medium and smaller capitalization issuers may be subject to greater price volatility and may decline more significantly in market downturns than securities of larger companies.
NOTE 9 – GUARANTEES AND INDEMNIFICATIONS
In the normal course of business, the Fund enters into contracts that contain a variety of representations and warranties and which provide general indemnifications. The Fund’s maximum exposure under these arrangements is unknown, as this would involve future claims that may be made against the Fund that have not yet occurred. However, based on experience, the Fund expects the risk of loss to be remote.
24
Marmont Redwood International Equity Fund
| REPORT OF INDEPENDENT REGISTERED PUBLIC ACCOUNTING FIRM |
To the Board of Trustees of Manager Directed Portfolios
and the Shareholders of Marmont Redwood International Equity Fund
Opinion on the Financial Statements
We have audited the accompanying statement of assets and liabilities of Marmont Redwood International Equity Fund, a series of shares of beneficial interest in Manager Directed Portfolios (the “Fund”), including the schedule of investments, as of October 31, 2018, and the related statements of operations and changes in net assets for the period February 14, 2018 (commencement of operations) through October 31, 2018, and the financial highlights from commencement of operations (February 14, 2018 for Institutional Shares and September 17, 2018 for Retail Shares) to October 31, 2018, and the related notes (collectively referred to as the “financial statements”). In our opinion, the financial statements present fairly, in all material respects, the financial position of the Fund as of October 31, 2018, and the results of its operations, the changes in its net assets and its financial highlights for the periods presented above, in conformity with accounting principles generally accepted in the United States of America.
Basis for Opinion
These financial statements are the responsibility of the Fund’s management. Our responsibility is to express an opinion on the Fund’s financial statements based on our audit. We are a public accounting firm registered with the Public Company Accounting Oversight Board (United States) (“PCAOB”) and are required to be independent with respect to the Fund in accordance with the U.S. federal securities law and the applicable rules and regulations of the Securities and Exchange Commission and the PCAOB.
We conducted our audit in accordance with the standards of the PCAOB. Those standards require that we plan and perform the audit to obtain reasonable assurance about whether the financial statements are free of material misstatement, whether due to error or fraud. The Fund is not required to have, nor were we engaged to perform, an audit of its internal control over financial reporting. As part of our audit we are required to obtain an understanding of internal control over financial reporting but not for the purpose of expressing an opinion on the effectiveness of the Fund’s internal control over financial reporting. Accordingly, we express no such opinion.
Our audit included performing procedures to assess the risk of material misstatement of the financial statements, whether due to error or fraud, and performing procedures that respond to those risks. Such procedures include examining, on a test basis, evidence regarding the amounts and disclosures in the financial statements. Our procedures included confirmation of securities owned as of October 31, 2018 by correspondence with the custodian. Our audit also included evaluating the accounting principles used and significant estimates made by management, as well as evaluating the overall presentation of the financial statements. We believe that our audit provides a reasonable basis for our opinion.

BBD, LLP
We have served as the auditor of one or more of the Funds in the Manager Directed Portfolios since 2007.
Philadelphia, Pennsylvania
December 26, 2018
25
Marmont Redwood International Equity Fund
| EXPENSE EXAMPLE |
| October 31, 2018 (Unaudited) |
As a shareholder of the Fund, you incur two types of costs: (1) transaction costs including sales charges (loads) and redemption fees, if applicable; and (2) ongoing costs, including management fees; distribution and/or service (12b-1 fees); and other Fund expenses. This Example is intended to help you understand your ongoing costs (in dollars) of investing in the Fund and to compare these costs with the ongoing costs of investing in other mutual funds.
The Example is based on an investment of $1,000 invested at the beginning of the period indicated and held for the entire period from May 1, 2018 to October 31, 2018 for the Institutional Shares, and from September 17, 2018 to October 31, 2018 for the Retail Shares.
Actual Expenses
The information in the table under the heading “Actual” provides information about actual account values and actual expenses. You may use the information in these columns together with the amount you invested, to estimate the expenses that you paid over the period. Simply divide your account value by $1,000 (for example, an $8,600 account value divided by $1,000 = 8.6), then multiply the result by the number in the row entitled “Expenses Paid During Period” to estimate the expenses you paid on your account during this period. There are some account fees that are charged to certain types of accounts, such as Individual Retirement Accounts (generally, a $15 fee is charged to the account annually) that would increase the amount of expenses paid on your account. The example below does not include portfolio trading commissions and related expenses and other extraordinary expenses as determined under generally accepted accounting principles.
Hypothetical Example for Comparison Purposes
The information in the table under the heading “Hypothetical (5% return before expenses)” provides information about hypothetical account values and hypothetical expenses based on the Fund’s actual expense ratio and assumed rate of return of 5% per year before expenses, which is not the Fund’s actual return. The hypothetical account values and expenses may not be used to estimate the actual ending account balance or expenses you paid for the period. You may use this information to compare the ongoing costs of investing in the Fund and other funds. To do so, compare this 5% hypothetical example with the 5% hypothetical examples that appear in the shareholder reports of the other funds. As noted above, there are some account fees that are charged to certain types of accounts that would increase the amount of expense paid on your account.
Please note that the expenses shown in the table are meant to highlight your ongoing costs only and do not reflect any transaction costs, such as sales charges (loads), redemption fees, or exchange fees. Therefore, the information under the heading “Hypothetical (5% return before expenses)” is useful in comparing ongoing costs only, and will not help you determine the relative total costs of owning different funds. In addition, if these transactional costs were included, your costs would have been higher.
26
Marmont Redwood International Equity Fund
| EXPENSE EXAMPLE (Continued) |
| October 31, 2018 (Unaudited) |
| Beginning | Ending | Expenses Paid | |
| Account Value | Account Value | During Period(1) | |
5/1/18 | 10/31/18 | 5/1/18 – 10/31/18 | |
| Actual | |||
| Institutional Shares | $1,000.00 | $ 915.00 | $4.83 |
| Hypothetical (5% return | |||
| before expenses) | |||
| Institutional Shares | $1,000.00 | $1,020.16 | $5.09 |
(1) | Expenses are equal to the Institutional Shares’ annualized expense ratio of 1.00% multiplied by the average account value over the period, multiplied by 184/365 (to reflect the period). |
| Beginning | Ending | Expenses Paid | |
| Account Value | Account Value | During Period | |
9/17/18(1) | 10/31/18 | 9/17/18 – 10/31/18 | |
| Actual | |||
| Retail Shares | $1,000.00 | $ 886.60 | $1.42(2) |
| Hypothetical (5% return | |||
| before expenses) | |||
| Retail Shares | $1,000.00 | $1,018.90 | $6.36(3) |
(1) | Inception date of the Fund. |
(2) | Expenses are equal to the Retail Shares’ annualized expense ratio of 1.25% multiplied by the average account value over the period, multiplied by 44/365 (to reflect the period). |
(3) | Expenses are equal to the Retail Shares’ annualized expense ratio of 1.25% multiplied by the average account value over the period, multiplied by 184/365 (to reflect the period). |
27
Marmont Redwood International Equity Fund
| NOTICE TO SHAREHOLDERS |
| at October 31, 2018 (Unaudited) |
How to Obtain a Copy of the Fund’s Proxy Voting Policies
A description of the policies and procedures that the Fund uses to determine how to vote proxies relating to portfolio securities is available without charge, upon request, by calling 1-833-MAR-MONT or on the U.S. Securities and Exchange Commission’s (“SEC”) website at http://www.sec.gov.
How to Obtain a Copy of the Fund’s Proxy Voting Records for the most recent 12-Month Period Ended June 30
Information regarding how the Fund voted proxies relating to portfolio securities during the most recent 12-month period ended June 30 is available no later than August 31 without charge, upon request, by 1-833-MAR-MONT. Furthermore, you can obtain the Fund’s proxy voting records on the SEC’s website at http://www.sec.gov.
Quarterly Filings on Form N-Q
The Fund files its complete schedule of portfolio holdings with the SEC for the first and third quarters of each fiscal year on Form N-Q. The Fund’s Form N-Q is available on the SEC’s website at http://www.sec.gov. Information included in the Fund’s Form N-Q is also available, upon request, by calling 1-833-MAR-MONT.
Householding
In an effort to decrease costs, the Fund intends to reduce the number of duplicate prospectuses and annual and semi-annual reports you receive by sending only one copy of each to those addresses shared by two or more accounts and to shareholders the Transfer Agent reasonably believes are from the same family or household. Once implemented, if you would like to discontinue householding for your accounts, please call toll-free at 1-833-MAR-MONT to request individual copies of these documents. Once the Transfer Agent receives notice to stop householding, the Transfer Agent will begin sending individual copies thirty days after receiving your request. This policy does not apply to account statements.
28
Marmont Redwood International Equity Fund
| TRUSTEES AND OFFICERS |
| (Unaudited) |
The business and affairs of the Trust are managed under the oversight of the Board, subject to the laws of the State of Delaware and the Trust’s Agreement and Declaration of Trust. The Board is currently comprised of three trustees who are not interested persons of the Trust within the meaning of the 1940 Act (the “Independent Trustees”) and one interested person of the Trust (the “Interested Trustee”). The Trustees are responsible for deciding matters of overall policy and overseeing the actions of the Trust’s service providers. The officers of the Trust conduct and supervise the Trust’s daily business operations.
| Number of | ||||
| Funds | Other | |||
| Position(s) Held | in Fund | Directorships | ||
| Name, | with the Trust | Complex | Held by Trustee | |
| Year of Birth | and Length of | Principal Occupation(s) | Overseen by | During the Past |
and Address(1) | Time Served(3) | During the Past Five Years | Trustee | Five Years |
| INTERESTED TRUSTEE | ||||
| James R. | Trustee and | Distribution consultant since | 8 | None |
Schoenike(2) | Chairman since | 2018; President and CEO, | ||
| (Born 1959) | July 2016 | Board of Managers, Quasar | ||
| Distributors, LLC | ||||
| (2013 – 2018). | ||||
| INDEPENDENT TRUSTEES | ||||
| Gaylord B. Lyman | Trustee and Audit | Senior Portfolio Manager, | 8 | None |
| (Born 1962) | Committee | Affinity Investment Advisors, | ||
| Chairman, since | LLC, since 2017; Managing | |||
| April 2015 | Director of Kohala Capital | |||
| Partners, LLC (2011 – 2016). | ||||
| Scott Craven Jones | Trustee since | Managing Director, Carne Global | 8 | Director, |
| (Born 1962) | July 2016 and | Financial Services (US) LLC, | Guestlogix Inc. | |
| Lead Independent | since 2013. | (a provider of | ||
| Trustee since | ancillary-focused | |||
| May 2017 | technology to the | |||
| travel industry) | ||||
| (2015 – 2016); | ||||
| Trustee, XAI | ||||
| Octagon Floating | ||||
| Rate & Alternative | ||||
| Income Term | ||||
| Trust, since 2017. |
29
Marmont Redwood International Equity Fund
| TRUSTEES AND OFFICERS (Continued) |
| (Unaudited) |
| Number of | ||||
| Funds | Other | |||
| Position(s) Held | in Fund | Directorships | ||
| Name, | with the Trust | Complex | Held by Trustee | |
| Year of Birth | and Length of | Principal Occupation(s) | Overseen by | During the Past |
and Address(1) | Time Served(3) | During the Past Five Years | Trustee | Five Years |
| Lawrence T. | Trustee since | Senior Vice President and Chief | 8 | None |
| Greenberg | July 2016 | Legal Officer, The Motley Fool | ||
| (Born 1963) | Holdings, Inc., since 1996; | |||
| General Counsel, Motley Fool | ||||
| Asset Management, LLC, | ||||
| since 2008; Manager, Motley | ||||
| Fool Wealth Management, LLC, | ||||
| since 2013; Adjunct Professor, | ||||
| Washington College of Law, | ||||
| American University, since 2006. |
| (1) | The address of each Trustee as it relates to the Trust’s business is c/o U.S. Bancorp Fund Services LLC, 615 East Michigan Street, Milwaukee, WI 53202. |
| (2) | Mr. Schoenike is an Interested Trustee by virtue of the fact that he was recently President of Quasar Distributors, LLC, the Fund’s distributor (the “Distributor”). |
| (3) | Each Trustee serves during the continued lifetime of the Trust until he dies, resigns, is declared bankrupt or incompetent by a court of competent jurisdiction, or is removed. |
30
Marmont Redwood International Equity Fund
| TRUSTEES AND OFFICERS (Continued) |
| (Unaudited) |
As of the date of this report, no Independent Trustee nor any of his immediate family members (i.e., spouse or dependent children) serves as an officer or director or is an employee of the Advisor, Sub-Advisor or Distributor, or any of their respective affiliates, nor is such person an officer, director or employee of any company controlled by or under common control with such entities.
| Name, | Position(s) Held with | |
| Year of Birth | Trust and Length | |
and Address(1) | of Time Served(3) | Principal Occupation(s) During Past Five Years |
| OFFICERS | ||
Douglas J. Neilson(1) | President and Principal | Vice President, Compliance and Administration, |
| (Born 1975) | Executive Officer, | USBFS, since 2001 |
| since July 1, 2016 | ||
Matthew J. McVoy(1) | Treasurer and Principal | Assistant Vice President, Compliance and |
| (Born 1980) | Financial Officer, | Administration, USBFS, since 2005 |
| since July 1, 2016 | ||
Nathan R. Bentley, CPA(1) | Assistant Treasurer, | Officer, Compliance and Administration, USBFS, |
| (Born 1983) | since July 1, 2016 | since 2012 |
Gerard Scarpati(2) | Chief Compliance | Compliance Director, Vigilant, since 2010 |
| (Born 1955) | Officer and | |
| Anti-Money Laundering | ||
| Compliance Officer, | ||
| since July 1, 2016 | ||
Rachel A. Spearo(1) | Secretary, since | Vice President, Compliance and Administration, |
| (Born 1979) | October 31, 2016 | USBFS, since 2004 |
| (1) | The mailing address of this officer is: 615 East Michigan Street, Milwaukee, Wisconsin 53202. |
| (2) | The mailing address of this officer is: 223 Wilmington West Chester Pike, Suite 216, Chadds Ford, Pennsylvania 19317. |
| (3) | Each officer is elected annually and serves until his or her successor has been duly elected and qualified. |
The Statement of Additional Information includes additional information about the Fund’s Trustees and Officers and is available, without charge, upon request by calling 1-833-MAR-MONT.
31
Marmont Redwood International Equity Fund
| NOTICE OF PRIVACY POLICY & PRACTICES |
Protecting the privacy of Fund shareholders is important to us. The following is a description of the practices and policies through which we protect the privacy and security of your non-public personal information.
What Information We Collect
We collect and maintain information about you so that we can open and maintain your account in the Fund and provide various services to you. We collect non-public personal information about you from the following sources:
| • | information we receive about you on applications or other forms; | |
| • | information you give us orally; and | |
| • | information about your transactions with us or others. |
The types of non-public personal information we collect and share can include:
| • | social security number; | |
| • | account balances; | |
| • | account transactions; | |
| • | transaction history; | |
| • | wire transfer instructions; and | |
| • | checking account information. |
What Information We Disclose
We do not disclose any non-public personal information about shareholders or former shareholders of the Fund without the shareholder’s authorization, except as permitted by law or in response to inquiries from governmental authorities. We may share information with affiliated parties and unaffiliated third parties with whom we have contracts for servicing the Fund. We will provide unaffiliated third parties with only the information necessary to carry out their assigned responsibility.
How We Protect Your Information
All shareholder records will be disposed of in accordance with applicable law. We maintain physical, electronic and procedural safeguards to protect your non-public personal information and require third parties to treat your non-public personal information with the same high degree of confidentiality.
In the event that you hold shares of the Fund through a financial intermediary, including, but not limited to, a broker-dealer, bank or trust company, the privacy policy of your financial intermediary would govern how your non-public personal information would be shared with unaffiliated third parties.
If you have any questions or concerns regarding this notice or our Privacy Policy, please contact us at 1-833-MAR-MONT.
32
(This Page Intentionally Left Blank.)
Investment Advisor
Marmont Partners LLC
925 West Lancaster Avenue, Suite 220
Bryn Mawr, PA 19010
Investment Sub-Advisor
Redwood Investments, LLC
One Gateway Center, Suite 802
Newton, MA 02458
Distributor
Quasar Distributors, LLC
777 East Wisconsin Avenue, 6th Floor
Milwaukee, WI 53202
Transfer Agent
U.S. Bancorp Fund Services, LLC
615 East Michigan Street
Milwaukee, WI 53202
(833) MAR-MONT
Custodian
U.S. Bank National Association
Custody Operations
1555 North River Center Drive, Suite 302
Milwaukee, WI 53212
Independent Registered Public Accounting Firm
BBD, LLP
1835 Market Street, 3rd floor
Philadelphia, PA 19103
Legal Counsel
Godfrey & Kahn S.C.
833 East Michigan Street, Suite 1800
Milwaukee, WI 53202
This report is intended for shareholders of the Fund and may not be used as sales literature unless preceded or accompanied by a current prospectus.
Past performance results shown in this report should not be considered a representation of future performance. Share price and returns will fluctuate so that shares, when redeemed, may be worth more or less than their original cost. Statements and other information herein are dated and are subject to change.
Item 2. Code of Ethics.
The registrant has adopted a code of ethics that applies to the registrant’s principal executive officer and principal financial officer. The registrant has not made any substantive amendments to its code of ethics during the period covered by this report. The registrant has not granted any waivers from any provisions of the code of ethics during the period covered by this report.
A copy of the registrant’s Code of Ethics is filed herewith.
Item 3. Audit Committee Financial Experts.
The registrant’s Board of Trustees has determined that there are at least two audit committee financial experts serving on its audit committee. Messrs. Gaylord B. Lyman and Scott C. Jones are the “audit committee financial experts” and are considered to be “independent” as each term is defined in Item 3 of Form N‑CSR.
Item 4. Principal Accountant Fees and Services.
The registrant has engaged its principal accountant to perform audit services, audit-related services, tax services and other services during the past two fiscal years. “Audit services” refer to performing an audit of the registrant's annual financial statements or services that are normally provided by the accountant in connection with statutory and regulatory filings or engagements for those fiscal years. “Audit-related services” refer to the assurance and related services by the principal accountant that are reasonably related to the performance of the audit. “Tax services” refer to professional services rendered by the principal accountant for tax compliance, tax advice, and tax planning. There were no “other services” provided by the principal accountant. The following table details the aggregate fees billed or expected to be billed for each of the last two fiscal years for audit fees, audit-related fees, tax fees and other fees by the principal accountant.
| FYE 10/31/2018 | FYE 10/31/2017 | |
| Audit Fees | $10,500 | N/A |
| Audit-Related Fees | N/A | N/A |
| Tax Fees | $3,000 | N/A |
| All Other Fees | N/A | N/A |
Pursuant to its charter, the Trust’s Audit Committee must review and approve in advance the engagement of the independent accountants, including each audit and non-audit service permitted by appropriate rules or regulations provided to the Trust and each non-audit service provided to the Trust’s investment advisers and any entity controlling, controlled by or under common control with the investment advisers that provides ongoing services to the Trust relating to the operations and financial reporting of the Trust. The Committee may delegate the authority to grant such pre-approval to one or more Committee members who are independent Trustees within the meaning of Section 10A(i) of the Securities Exchange Act of 1934, as amended, provided that the decision of such member(s) is presented to the full Committee at its next scheduled meeting. The Committee may approve each audit and non-audit service on a case-by-case basis, and/or adopt pre-approval policies and procedures that are detailed as to a particular service, provided that the Committee is informed of each service in a timely manner and the policies and procedures do not include delegation of the Committee’s responsibilities under the Securities Exchange Act of 1934 to management. The foregoing pre-approval requirement with respect to the provision of non-audit services to the Trust may be waived if (i) the aggregate amount of all such non-audit services provided to the Trust constitutes not more than 5 percent of the total amount of revenues paid by the Trust to its independent accountants during the fiscal year in which the non-audit services are provided; (ii) such services were not recognized by the Trust at the time of the engagement to be non-audit services; and (iii) such services are promptly brought to the attention of the Committee and approved prior to the completion of the audit by the Committee or by one or more members of the Committee to whom authority to grant such approvals has been delegated by the Committee.
The percentage of fees billed by BBD, LLP applicable to non-audit services pursuant to waiver of pre-approval requirement were as follows:
| FYE 10/31/2018 | FYE 10/31/2017 | |
| Audit-Related Fees | 0% | N/A |
| Tax Fees | 0% | N/A |
| All Other Fees | 0% | N/A |
All of the principal accountant’s hours spent on auditing the registrant’s financial statements were attributed to work performed by full‑time permanent employees of the principal accountant.
The following table indicates the non-audit fees billed or expected to be billed by the registrant’s accountant for services to the registrant and to the registrant’s investment adviser (and any other controlling entity, etc.—not sub-adviser) for the last two years. The audit committee of the Board of Trustees has considered whether the provision of non-audit services that were rendered to the registrant's investment adviser is compatible with maintaining the principal accountant's independence and has concluded that the provision of such non-audit services by the accountant has not compromised the accountant’s independence.
| Non-Audit Related Fees | FYE 10/31/2018 | FYE 10/31/2017 |
| Registrant | N/A | N/A |
| Registrant’s Investment Adviser | N/A | N/A |
Item 5. Audit Committee of Listed Registrants.
(a) Not applicable to registrants who are not listed issuers (as defined in Rule 10A-3 under the Securities Exchange Act of 1934).
(b) Not Applicable.
Item 6. Investments.
| (a) | Schedule of Investments is included as part of the report to shareholders filed under Item 1 of this Form. |
(b) | Not Applicable. |
Item 7. Disclosure of Proxy Voting Policies and Procedures for Closed-End Management Investment Companies.
Not applicable to open-end investment companies.
Item 8. Portfolio Managers of Closed-End Management Investment Companies.
Not applicable to open-end investment companies.
Item 9. Purchases of Equity Securities by Closed‑End Management Investment Company and Affiliated Purchasers.
Not applicable to open-end investment companies.
Item 10. Submission of Matters to a Vote of Security Holders.
There have been no material changes to the procedures by which shareholders may recommend nominees to the Registrant’s Board of Trustees.
Item 11. Controls and Procedures.
| (a) | The Registrant’s President/Principal Executive Officer and Treasurer/Principal Financial Officer have reviewed the Registrant's disclosure controls and procedures (as defined in Rule 30a-3(c) under the Investment Company Act of 1940, as amended, (the “Act”)) as of a date within 90 days of the filing of this report, as required by Rule 30a-3(b) under the Act and Rules 13a-15(b) or 15d‑15(b) under the Securities Exchange Act of 1934. Based on their review, such officers have concluded that the disclosure controls and procedures are effective in ensuring that information required to be disclosed in this report is appropriately recorded, processed, summarized and reported and made known to them by others within the Registrant and by the Registrant’s service provider. |
| (b) | There were no changes in the Registrant's internal control over financial reporting (as defined in Rule 30a-3(d) under the Act) that occurred during the fourth fiscal quarter of the period covered by this report that has materially affected, or is reasonably likely to materially affect, the Registrant's internal control over financial reporting. |
Item 12. Disclosure of Securities Lending Activities for Closed-End Management Investment Companies.
Not applicable to open-end investment companies.
Item 13. Exhibits.
| (a) | (1) Any code of ethics or amendment thereto, that is subject to the disclosure required by Item 2, to the extent that the registrant intends to satisfy Item 2 requirements through filing an exhibit. Filed herewith. |
(2) A separate certification for each principal executive and principal financial officer pursuant to Section 302 of the Sarbanes-Oxley Act of 2002. Filed herewith.
(3) Any written solicitation to purchase securities under Rule 23c‑1 under the Act sent or given during the period covered by the report by or on behalf of the registrant to 10 or more persons. Not applicable to open-end investment companies.
(4) Change in the registrant’s independent public accountant. There was no change in the registrant’s independent public accountant for the period covered by this report.
| (b) | Certifications pursuant to Section 906 of the Sarbanes‑Oxley Act of 2002. Furnished herewith. |
SIGNATURES
Pursuant to the requirements of the Securities Exchange Act of 1934 and the Investment Company Act of 1940, as amended, the registrant has duly caused this report to be signed on its behalf by the undersigned, thereunto duly authorized.
(Registrant) Manager Directed Portfolios
By (Signature and Title)* /s/Douglas J. Neilson
Douglas J. Neilson, President/
Principal Executive Officer
Date 1/3/2019
Pursuant to the requirements of the Securities Exchange Act of 1934 and the Investment Company Act of 1940, as amended, this report has been signed below by the following persons on behalf of the registrant and in the capacities and on the dates indicated.
By (Signature and Title)* /s/Douglas J. Neilson
Douglas J. Neilson, President/
Principal Executive Officer
Date 1/3/2019
By (Signature and Title)* /s/Matthew J. McVoy
Matthew J. McVoy, Treasurer/
Principal Financial Officer
Date 1/3/2019
* Print the name and title of each signing officer under his or her signature.