Mar Vista Strategic Growth Fund
Semi-Annual Report
April 30, 2023
Table of Contents
| Sector Allocation of Portfolio Assets | | 3 |
| Schedule of Investments | | 4 |
| Statement of Assets and Liabilities | | 8 |
| Statement of Operations | | 9 |
| Statements of Changes in Net Assets | | 10 |
| Financial Highlights | | 12 |
| Notes to the Financial Statements | | 15 |
| Expense Example | | 28 |
| Statement Regarding Liquidity Risk Management Program | | 30 |
| Notice to Shareholders | | 31 |
| Privacy Notice | | 32 |
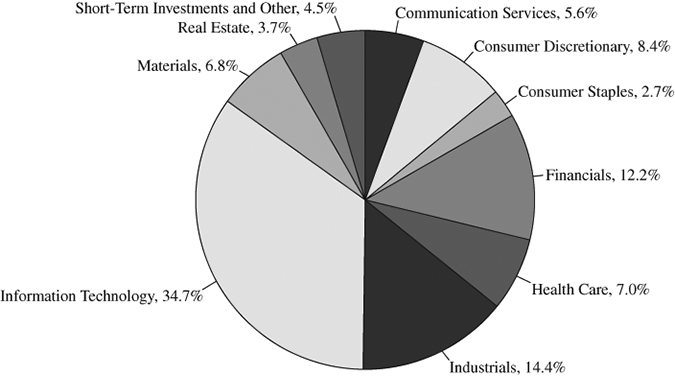
| SECTOR ALLOCATION OF PORTFOLIO ASSETS |
| at April 30, 2023 (Unaudited) |
| SCHEDULE OF INVESTMENTS |
| at April 30, 2023 (Unaudited) |
| COMMON STOCKS – 91.8% | | Shares | | | Value | |
| COMMUNICATION SERVICES – 5.6% | | | | | | |
| | | | | | | |
| Entertainment – 2.6% | | | | | | |
| The Walt Disney Co, (a) | | | 16,160 | | | $ | 1,656,400 | |
| | | | | | | | | |
| Interactive Media & Services – 3.0% | | | | | | | | |
| Alphabet, Inc. (a) | | | 18,323 | | | | 1,982,915 | |
| TOTAL COMMUNICATION SERVICES | | | | | | | 3,639,315 | |
| | | | | | | | | |
| CONSUMER DISCRETIONARY – 8.4% | | | | | | | | |
| | | | | | | | | |
| Hotels, Restaurants & Leisure – 1.5% | | | | | | | | |
| Starbucks Corp. | | | 8,408 | | | | 960,950 | |
| | | | | | | | | |
| Internet & Direct Marketing Retail – 4.4% | | | | | | | | |
| Amazon.com, Inc. (a) | | | 27,270 | | | | 2,875,622 | |
| | | | | | | | | |
| Textiles, Apparel & Luxury Goods – 2.5% | | | | | | | | |
| NIKE, Inc. | | | 12,864 | | | | 1,630,126 | |
| TOTAL CONSUMER DISCRETIONARY | | | | | | | 5,466,698 | |
| | | | | | | | | |
| CONSUMER STAPLES – 2.7% | | | | | | | | |
| | | | | | | | | |
| Beverages – 2.7% | | | | | | | | |
| PepsiCo, Inc. | | | 9,266 | | | | 1,768,787 | |
| TOTAL CONSUMER STAPLES | | | | | | | 1,768,787 | |
| | | | | | | | | |
| FINANCIALS – 12.2% | | | | | | | | |
| | | | | | | | | |
| Capital Markets – 3.7% | | | | | | | | |
| Moody’s Corp. | | | 7,592 | | | | 2,377,207 | |
| | | | | | | | | |
| Diversified Financial Services – 3.8% | | | | | | | | |
| Berkshire Hathaway, Inc. (a) | | | 7,421 | | | | 2,438,170 | |
| | | | | | | | | |
| Insurance – 4.7% | | | | | | | | |
| Markel Corp. (a)(c) | | | 2,240 | | | | 3,065,507 | |
| TOTAL FINANCIALS | | | | | | | 7,880,884 | |
The accompanying notes are an integral part of these financial statements.
| SCHEDULE OF INVESTMENTS (Continued) |
| at April 30, 2023 (Unaudited) |
| COMMON STOCKS – 91.8% (Continued) | | Shares | | | Value | |
| HEALTHCARE – 7.0% | | | | | | |
| | | | | | | |
| Life Sciences Tools & Services – 3.4% | | | | | | |
| Mettler-Toledo International, Inc. (a)(c) | | | 1,476 | | | $ | 2,201,454 | |
| | | | | | | | | |
| Pharmaceuticals – 3.6% | | | | | | | | |
| Johnson & Johnson | | | 14,128 | | | | 2,312,754 | |
| TOTAL HEALTHCARE | | | | | | | 4,514,208 | |
| | | | | | | | | |
| INDUSTRIALS – 14.4% | | | | | | | | |
| | | | | | | | | |
| Aerospace & Defense – 5.1% | | | | | | | | |
| TransDigm Group, Inc. | | | 4,369 | | | | 3,342,285 | |
| | | | | | | | | |
| Air Freight & Logistics – 4.2% | | | | | | | | |
| GXO Logistics, Inc. (a) | | | 51,302 | | | | 2,725,675 | |
| | | | | | | | | |
| Industrial Conglomerates – 2.8% | | | | | | | | |
| Honeywell International, Inc. | | | 9,064 | | | | 1,811,350 | |
| | | | | | | | | |
| Machinery – 2.3% | | | | | | | | |
| Fortive Corp. | | | 23,383 | | | | 1,475,233 | |
| TOTAL INDUSTRIALS | | | | | | | 9,354,543 | |
| | | | | | | | | |
| INFORMATION TECHNOLOGY – 34.7% | | | | | | | | |
| | | | | | | | | |
| Electronic Equipment, | | | | | | | | |
| Instruments & Components – 2.5% | | | | | | | | |
| Amphenol Corp. | | | 21,444 | | | | 1,618,379 | |
| | | | | | | | | |
| IT Services – 3.5% | | | | | | | | |
| Visa, Inc. (c) | | | 9,951 | | | | 2,315,896 | |
| | | | | | | | | |
| Semiconductors & Semiconductor Equipment – 3.4% | | | | | | | | |
| Microchip Technology, Inc. | | | 30,073 | | | | 2,195,028 | |
The accompanying notes are an integral part of these financial statements.
| SCHEDULE OF INVESTMENTS (Continued) |
| at April 30, 2023 (Unaudited) |
| COMMON STOCKS – 91.8% (Continued) | | Shares | | | Value | |
| Software – 20.8% | | | | | | |
| Adobe, Inc. (a) | | | 6,801 | | | $ | 2,567,786 | |
| Intuit, Inc. | | | 3,006 | | | | 1,334,514 | |
| Microsoft Corp. | | | 11,595 | | | | 3,562,680 | |
| Oracle Corp. | | | 10,788 | | | | 1,021,839 | |
| Roper Technologies, Inc. | | | 3,255 | | | | 1,480,309 | |
| Salesforce, Inc. (a) | | | 7,487 | | | | 1,485,196 | |
| SAP SE – ADR | | | 15,120 | | | | 2,045,282 | |
| | | | | | | | 13,497,606 | |
| Technology Hardware, Storage & Peripherals – 4.5% | | | | | | | | |
| Apple, Inc. | | | 17,135 | | | | 2,907,467 | |
| TOTAL INFORMATION TECHNOLOGY | | | | | | | 22,534,376 | |
| | | | | | | | | |
| MATERIALS – 6.8% | | | | | | | | |
| | | | | | | | | |
| Chemicals – 6.8% | | | | | | | | |
| Air Products and Chemicals, Inc. | | | 8,502 | | | | 2,502,649 | |
| Linde PLC – ADR | | | 5,207 | | | | 1,923,726 | |
| TOTAL MATERIALS | | | | | | | 4,426,375 | |
| TOTAL COMMON STOCKS | | | | | | | | |
| (Cost $30,765,666) | | | | | | | 59,585,185 | |
| | | | | | | | | |
| REITS – 3.7% | | | | | | | | |
| | | | | | | | | |
| Real Estate – 3.7% | | | | | | | | |
| American Tower Corp. | | | 11,663 | | | | 2,383,801 | |
| TOTAL REAL ESTATE | | | | | | | 2,383,801 | |
| TOTAL REITS | | | | | | | | |
| (Cost $1,978,519) | | | | | | | 2,383,801 | |
The accompanying notes are an integral part of these financial statements.
| SCHEDULE OF INVESTMENTS (Continued) |
| at April 30, 2023 (Unaudited) |
| SHORT-TERM INVESTMENTS – 4.6% | | Shares | | | Value | |
| MONEY MARKET FUNDS – 4.6% | | | | | | |
| First American Government Obligations Fund – | | | | | | |
| Class V, 4.76% (b) | | | 3,017,282 | | | $ | 3,017,282 | |
| TOTAL SHORT-TERM INVESTMENTS | | | | | | | | |
| (Cost $3,017,282) | | | | | | | 3,017,282 | |
| | | | | | | | | |
| INVESTMENTS PURCHASED | | | | | | | | |
| WITH CASH PROCEEDS FROM | | | | | | | | |
| SECURITIES LENDING – 7.7% | | | | | | | | |
| Mount Vernon Liquid Assets Portfolio, 4.96% (b) | | | 5,027,708 | | | | 5,027,708 | |
| TOTAL INVESTMENTS PURCHASED WITH | | | | | | | | |
| CASH PROCEEDS FROM SECURITIES LENDING | | | | | | | | |
| (Cost $5,027,708) | | | | | | | 5,027,708 | |
| TOTAL INVESTMENTS | | | | | | | | |
| (Cost $40,789,175) – 107.8% | | | | | | | 70,013,976 | |
| Liabilities In Excess of Other Assets – (7.8)% | | | | | | | (5,084,685 | ) |
| TOTAL NET ASSETS – 100.0% | | | | | | $ | 64,929,291 | |
Percentages are stated as a percent of net assets.
ADR – American Depositary Receipt
PLC – Public Limited Company
| (a) | Non-income producing security. |
| (b) | The rate shown represents the fund’s 7-day yield as of April 30, 2023. |
| (c) | This security or a portion of this security was out on loan at April 30, 2023. As of April 30, 2023, the total value of loaned securities was $5,049,874 or 7.8% of net assets. The remaining contractual maturity of all the securities lending transactions, is overnight and continuous. |
Percentages represent market value as a percentage of net assets.
The Global Industry Classification Standard (GICS®) was developed by and/or is the exclusive property of MSCI, Inc. and Standard & Poor’s Financial Services LLC (“S&P”). GICS is a service mark of MSCI and S&P and has been licensed for use by U.S. Bank Global Fund Services.
The accompanying notes are an integral part of these financial statements.
| STATEMENT OF ASSETS AND LIABILITIES |
| at April 30, 2023 (Unaudited) |
| Assets: | | | |
| Investments, at value (cost of $40,789,175)* | | $ | 70,013,976 | |
| Receivables: | | | | |
| Fund shares sold | | | 27,917 | |
| Dividends and interest | | | 40,168 | |
| Securities Lending | | | 717 | |
| Prepaid expenses | | | 34,919 | |
| Total assets | | | 70,117,697 | |
| Liabilities: | | | | |
| Payables: | | | | |
| Upon return of securities loaned | | | 5,027,708 | |
| Fund shares redeemed | | | 91,764 | |
| Administration and fund accounting fees | | | 12,043 | |
| Advisory fees | | | 11,020 | |
| Transfer agent fees and expenses | | | 6,105 | |
| Other accrued expenses | | | 39,766 | |
| Total liabilities | | | 5,188,406 | |
| Net assets | | $ | 64,929,291 | |
| Net assets consist of: | | | | |
| Paid in capital | | $ | 33,254,455 | |
| Total accumulated earnings | | | 31,674,836 | |
| Net assets | | $ | 64,929,291 | |
| Institutional Shares: | | | | |
| Net assets applicable to outstanding Institutional Shares | | $ | 60,479,291 | |
| Shares issued (Unlimited number of | | | | |
| beneficial interest authorized, $0.01 par value) | | | 2,716,947 | |
| Net asset value, offering price and redemption price per share | | $ | 22.26 | |
| Investor Shares: | | | | |
| Net assets applicable to outstanding Investor Shares | | $ | 1,322,079 | |
| Shares issued (Unlimited number of | | | | |
| beneficial interest authorized, $0.01 par value) | | | 61,207 | |
| Net asset value, offering price and redemption price per share | | $ | 21.60 | |
| Retirement | | | | |
| Net assets applicable to outstanding Retirement | | $ | 3,127,921 | |
| Shares issued (Unlimited number of | | | | |
| beneficial interest authorized, $0.01 par value) | | | 140,229 | |
| Net asset value, offering price and redemption price per share | | $ | 22.31 | |
| * | Includes securities on loan of $5,049,874 |
The accompanying notes are an integral part of these financial statements.
| STATEMENT OF OPERATIONS |
| For the Six Months Ended April 30, 2023 (Unaudited) |
| Investment income: | | | |
| Dividends | | $ | 292,853 | |
| Interest | | | 56,176 | |
| Securities Lending | | | 6,786 | |
| Total investment income | | | 355,815 | |
| | | | | |
| Expenses: | | | | |
| Investment advisory fees (Note 4) | | | 194,267 | |
| Transfer agent fees and expenses | | | 33,999 | |
| Federal and state registration fees | | | 26,245 | |
| Administration and fund accounting fees (Note 4) | | | 20,172 | |
| Distribution fees (Note 5) | | | | |
| Distribution fees – Investor Shares | | | 1,407 | |
| Service fees (Note 6) | | | | |
| Service fees – Investor Shares | | | 563 | |
| Service fees – Institutional Shares | | | 30,193 | |
| Trustees’ fees and expenses | | | 6,712 | |
| Other | | | 50,710 | |
| Total expenses before reimbursement from advisor | | | 364,268 | |
| Expense reimbursement from advisor (Note 4) | | | (133,657 | ) |
| Net expenses | | | 230,611 | |
| Net investment income | | | 125,204 | |
| Realized and unrealized gain on investments: | | | | |
| Net realized gain on transactions from: | | | | |
| Investments | | | 2,458,429 | |
| Net change in unrealized appreciation on: | | | | |
| Investments | | | 3,980,053 | |
| Net realized and unrealized gain on investments | | | 6,438,482 | |
| Net increase in net assets resulting from operations | | $ | 6,563,686 | |
The accompanying notes are an integral part of these financial statements.
| STATEMENTS OF CHANGES IN NET ASSETS |
| |
| | | Six Months Ended | | | | |
| | | April 30, 2023 | | | Year Ended | |
| | | (Unaudited) | | | October 31, 2022 | |
| Operations: | | | | | | |
| Net investment income | | $ | 125,204 | | | $ | 274,386 | |
| Net realized gain on investments | | | 2,458,429 | | | | 11,895,790 | |
| Net change in unrealized appreciation | | | | | | | | |
| (depreciation) on investments | | | 3,980,053 | | | | (35,177,291 | ) |
| Net increase (decrease) in net assets | | | | | | | | |
| resulting from operations | | | 6,563,686 | | | | (23,007,115 | ) |
| Distributions to Shareholders From: | | | | | | | | |
| Net investment income | | | | | | | | |
| Institutional Shares | | | (269,390 | ) | | | (9,180,172 | ) |
| Retirement Shares | | | (17,132 | ) | | | (640,082 | ) |
| Investor Shares | | | (3,054 | ) | | | (77,585 | ) |
| Administrative Shares | | | — | | | | (4,209 | ) |
| Net realized gains | | | | | | | | |
| Institutional Shares | | | (8,253,293 | ) | | | — | |
| Retirement Shares | | | (504,796 | ) | | | — | |
| Investor Shares | | | (103,986 | ) | | | — | |
| Total distributions | | | (9,151,651 | ) | | | (9,902,048 | ) |
| Capital Share Transactions: | | | | | | | | |
| Proceeds from shares sold | | | | | | | | |
| Investor Shares | | | 563,680 | | | | 351,228 | |
| Institutional Shares | | | 6,087,037 | | | | 9,836,952 | |
| Retirement Shares | | | 38,745 | | | | 236,153 | |
Administrative Shares1 | | | — | | | | 101 | |
| Proceeds from shares issued to holders | | | | | | | | |
| in reinvestment of dividends | | | | | | | | |
| Investor Shares | | | 107,040 | | | | 77,585 | |
| Institutional Shares | | | 6,040,584 | | | | 8,716,733 | |
| Retirement Shares | | | 521,928 | | | | 640,082 | |
Administrative Shares1 | | | — | | | | 4,209 | |
| Cost of shares redeemed | | | | | | | | |
| Investor Shares | | | (150,877 | ) | | | (225,258 | ) |
| Institutional Shares | | | (11,838,364 | ) | | | (37,989,177 | ) |
| Retirement Shares | | | (801,524 | ) | | | (2,858,587 | ) |
Administrative Shares1 | | | — | | | | (39,855 | ) |
| Net increase (decrease) in net assets | | | | | | | | |
| from capital share transactions | | | 568,249 | | | | (21,249,832 | ) |
| Total decrease in net assets | | | (2,019,716 | ) | | | (54,158,995 | ) |
1 | Administrative Shares were exchanged for Institutional Shares on July 18, 2022. |
The accompanying notes are an integral part of these financial statements.
| STATEMENTS OF CHANGES IN NET ASSETS (Continued) |
| |
| | | Six Months Ended | | | | |
| | | April 30, 2023 | | | Year Ended | |
| | | (Unaudited) | | | October 31, 2022 | |
| Net Assets: | | | | | | |
| Beginning of period | | | 66,949,007 | | | | 121,108,000 | |
| End of period | | $ | 64,929,291 | | | $ | 66,949,007 | |
| | | | | | | | | |
| Changes in Shares Outstanding: | | | | | | | | |
| Shares sold | | | | | | | | |
| Investor Shares | | | 27,696 | | | | 13,020 | |
| Institutional Shares | | | 281,671 | | | | 370,488 | |
| Retirement Shares | | | 1,767 | | | | 8,574 | |
Administrative Shares1 | | | — | | | | 4 | |
| Proceeds from shares issued to | | | | | | | | |
| holders in reinvestment of dividends | | | | | | | | |
| Investor Shares | | | 5,280 | | | | 2,684 | |
| Institutional Shares | | | 289,577 | | | | 295,082 | |
| Retirement Shares | | | 24,973 | | | | 21,646 | |
Administrative Shares1 | | | — | | | | 143 | |
| Shares redeemed | | | | | | | | |
| Investor Shares | | | (6,618 | ) | | | (8,455 | ) |
| Institutional Shares | | | (520,075 | ) | | | (1,377,309 | ) |
| Retirement Shares | | | (37,975 | ) | | | (110,678 | ) |
Administrative Shares1 | | | — | | | | (1,700 | ) |
| Net increase (decrease) in shares outstanding | | | 66,296 | | | | (786,501 | ) |
1 | Administrative Shares were exchanged for Institutional Shares on July 18, 2022. |
The accompanying notes are an integral part of these financial statements.
For a capital share outstanding throughout the period
| Institutional Shares | | Six Months | | | | | | | | | | | | | | | | |
| | | Ended | | | | | | | | | | | | | | | | |
| | | April 30, | | | | | | | | | | | | | | | | |
| | | 2023 | | | Year Ended October 31, | |
| | | (Unaudited) | | | 20224 | | | 2021 | | | 2020 | | | 2019 | | | 2018 | |
| Net Asset Value – | | | | | | | | | | | | | | | | | | |
| Beginning of Period | | $ | 23.48 | | | $ | 33.29 | | | $ | 24.64 | | | $ | 22.28 | | | $ | 19.63 | | | $ | 18.85 | |
| Income from | | | | | | | | | | | | | | | | | | | | | | | | |
| Investment Operations: | | | | | | | | | | | | | | | | | | | | | | | | |
Net investment income/(loss)1 | | | (0.04 | ) | | | 0.09 | | | | 0.03 | | | | 0.08 | | | | 0.11 | | | | 0.06 | |
| Net realized and unrealized | | | | | | | | | | | | | | | | | | | | | | | | |
| gain (loss) on investments | | | 2.27 | | | | (7.16 | ) | | | 9.51 | | | | 2.68 | | | | 3.08 | | | | 1.11 | |
| Total from | | | | | | | | | | | | | | | | | | | | | | | | |
| investment operations | | | 2.23 | | | | (7.07 | ) | | | 9.54 | | | | 2.76 | | | | 3.19 | | | | 1.17 | |
| | | | | | | | | | | | | | | | | | | | | | | | | |
| Less Distributions: | | | | | | | | | | | | | | | | | | | | | | | | |
| Dividends from | | | | | | | | | | | | | | | | | | | | | | | | |
| net investment income | | | (0.11 | ) | | | (0.03 | ) | | | (0.10 | ) | | | (0.09 | ) | | | (0.06 | ) | | | (0.04 | ) |
| Distributions from | | | | | | | | | | | | | | | | | | | | | | | | |
| net realized gains | | | (3.34 | ) | | | (2.71 | ) | | | (0.79 | ) | | | (0.31 | ) | | | (0.48 | ) | | | (0.35 | ) |
| Total distributions | | | (3.45 | ) | | | (2.74 | ) | | | (0.89 | ) | | | (0.40 | ) | | | (0.54 | ) | | | (0.39 | ) |
| Net Asset Value – | | | | | | | | | | | | | | | | | | | | | | | | |
| End of Period | | $ | 22.26 | | | $ | 23.48 | | | $ | 33.29 | | | $ | 24.64 | | | $ | 22.28 | | | $ | 19.63 | |
| | | | | | | | | | | | | | | | | | | | | | | | | |
| Total Return | | 10.49 | %^ | | | (22.92 | )% | | | 39.56 | % | | | 12.54 | % | | | 16.91 | % | | | 6.26 | % |
| | | | | | | | | | | | | | | | | | | | | | | | | |
| Ratios and Supplemental Data: | | | | | | | | | | | | | | | | | | | | | | | | |
| Net assets, end of | | | | | | | | | | | | | | | | | | | | | | | | |
| period (thousands) | | $ | 60,479 | | | $ | 62,589 | | | $ | 112,425 | | | $ | 100,895 | | | $ | 106,463 | | | $ | 66,197 | |
| Ratio of operating expenses | | | | | | | | | | | | | | | | | | | | | | | | |
| to average net assets: | | | | | | | | | | | | | | | | | | | | | | | | |
| Before reimbursements | | | 1.13 | %+ | | | 0.90 | % | | | 0.80 | % | | | 0.80 | % | | | 0.79 | % | | | 0.84 | % |
| After reimbursements | | | 0.71 | %+ | | | 0.71 | % | | | 0.71 | % | | | 0.71 | % | | | 0.71 | % | | | 0.70 | % |
| Ratio of net investment income | | | | | | | | | | | | | | | | | | | | | | | | |
| to average net assets: | | | | | | | | | | | | | | | | | | | | | | | | |
| Before reimbursements | | | (0.03 | )%+ | | | 0.13 | % | | | N/A | 3 | | | N/A | 3 | | | N/A | 3 | | | N/A | 3 |
| After reimbursements | | | 0.39 | %+ | | | 0.32 | % | | | 0.11 | % | | | 0.35 | % | | | 0.51 | % | | | 0.28 | % |
Portfolio turnover rate2 | | 8 | %^ | | | 26 | % | | | 9 | % | | | 22 | % | | | 26 | % | | | 15 | % |
+ | Annualized |
| ^ | Not Annualized |
1 | The net investment income per share was calculated using the average shares outstanding method. |
2 | Portfolio turnover was calculated on the basis of the Fund as a whole. The rate presented represents portfolio turnover for the entire fiscal year. |
3 | Figures were not reported during prior year. |
4 | The fund transitioned from the Harbor Strategic Growth Fund to the Mar Vista Strategic Growth Fund on July 22, 2022. On July 18, 2022, outstanding Administrative Shares were transferred into Institutional Shares. |
The accompanying notes are an integral part of these financial statements.
| FINANCIAL HIGHLIGHTS (Continued) |
| |
For a capital share outstanding throughout the period
| Investor Share Class | | Six Months | | | | | | | | | | | | | | | | |
| | | Ended | | | | | | | | | | | | | | | | |
| | | April 30, | | | | | | | | | | | | | | | | |
| | | 2023 | | | Year Ended October 31, | |
| | | (Unaudited) | | | 20224 | | | 2021 | | | 2020 | | | 2019 | | | 2018 | |
| Net Asset Value – | | | | | | | | | | | | | | | | | | |
| Beginning of Period | | $ | 22.91 | | | $ | 32.62 | | | $ | 24.17 | | | $ | 21.87 | | | $ | 19.54 | | | $ | 18.81 | |
| Income from | | | | | | | | | | | | | | | | | | | | | | | | |
| Investment Operations: | | | | | | | | | | | | | | | | | | | | | | | | |
Net investment income/(loss)1 | | | 0.00 | 5 | | | 0.00 | 5 | | | (0.08 | ) | | | (0.01 | ) | | | 0.03 | | | | (0.02 | ) |
| Net realized and unrealized | | | | | | | | | | | | | | | | | | | | | | | | |
| gain (loss) on investments | | | 2.13 | | | | (7.00 | ) | | | 9.34 | | | | 2.63 | | | | 2.79 | | | | 1.10 | |
| Total from | | | | | | | | | | | | | | | | | | | | | | | | |
| investment operations | | | 2.13 | | | | (7.00 | ) | | | 9.26 | | | | 2.62 | | | | 2.82 | | | | 1.08 | |
| | | | | | | | | | | | | | | | | | | | | | | | | |
| Less Distributions: | | | | | | | | | | | | | | | | | | | | | | | | |
| Dividends from net | | | | | | | | | | | | | | | | | | | | | | | | |
| investment income | | | (0.10 | ) | | | — | | | | (0.02 | ) | | | (0.01 | ) | | | (0.01 | ) | | | — | |
| Distributions from | | | | | | | | | | | | | | | | | | | | | | | | |
| net realized gains | | | (3.34 | ) | | | (2.71 | ) | | | (0.79 | ) | | | (0.31 | ) | | | (0.48 | ) | | | (0.35 | ) |
| Total distributions | | | (3.44 | ) | | | (2.71 | ) | | | (0.81 | ) | | | (0.32 | ) | | | (0.49 | ) | | | (0.35 | ) |
| Net Asset Value – | | | | | | | | | | | | | | | | | | | | | | | | |
| End of Period | | $ | 21.60 | | | $ | 22.91 | | | $ | 32.62 | | | $ | 24.17 | | | $ | 21.87 | | | $ | 19.54 | |
| | | | | | | | | | | | | | | | | | | | | | | | | |
| Total Return | | 10.29 | %^ | | | (23.18 | )% | | | 39.06 | % | | | 12.12 | % | | | 14.99 | % | | | 5.80 | % |
| | | | | | | | | | | | | | | | | | | | | | | | | |
| Ratios and Supplemental Data: | | | | | | | | | | | | | | | | | | | | | | | | |
| Net assets, end of | | | | | | | | | | | | | | | | | | | | | | | | |
| period (thousands) | | $ | 1,322 | | | $ | 798 | | | $ | 900 | | | $ | 503 | | | $ | 417 | | | $ | 322 | |
| Ratio of operating expenses | | | | | | | | | | | | | | | | | | | | | | | | |
| to average net assets: | | | | | | | | | | | | | | | | | | | | | | | | |
| Before reimbursements | | | 1.36 | %+ | | | 1.25 | % | | | 1.16 | % | | | 1.17 | % | | | 1.16 | % | | | 1.21 | % |
| After reimbursements | | | 1.07 | %+ | | | 1.07 | % | | | 1.07 | % | | | 1.08 | % | | | 1.08 | % | | | 1.07 | % |
| Ratio of net investment income | | | | | | | | | | | | | | | | | | | | | | | | |
| to average net assets: | | | | | | | | | | | | | | | | | | | | | | | | |
| Before reimbursements | | | (0.28 | )%+ | | | (0.19 | )% | | | N/A | 3 | | | N/A | 3 | | | N/A | 3 | | | N/A | 3 |
| After reimbursements | | | 0.01 | %+ | | | (0.01 | )% | | | (0.27 | )% | | | (0.04 | )% | | | 0.14 | % | | | (0.11 | )% |
Portfolio turnover rate2 | | 8 | %^ | | | 26 | % | | | 9 | % | | | 22 | % | | | 26 | % | | | 15 | % |
+ | Annualized |
| ^ | Not Annualized |
1 | The net investment income per share was calculated using the average shares outstanding method. |
2 | Portfolio turnover was calculated on the basis of the Fund as a whole. The rate presented represents portfolio turnover for the entire fiscal year. |
3 | Figures were not reported on the Prior reports. |
4 | The fund transitioned from the Harbor Strategic Growth Fund to the Mar Vista Strategic Growth Fund on July 22, 2022. |
5 | Amount is less than $0.005. |
The accompanying notes are an integral part of these financial statements.
| FINANCIAL HIGHLIGHTS (Continued) |
| |
For a capital share outstanding throughout the period
| Retirement Share Class | | Six Months | | | | | | | | | | | | | | | | |
| | | Ended | | | | | | | | | | | | | | | | |
| | | April 30, | | | | | | | | | | | | | | | | |
| | | 2023 | | | Year Ended October 31, | |
| | | (Unaudited) | | | 20224 | | | 2021 | | | 2020 | | | 2019 | | | 2018 | |
| Net Asset Value – | | | | | | | | | | | | | | | | | | |
| Beginning of Period | | $ | 23.51 | | | $ | 33.33 | | | $ | 24.67 | | | $ | 22.31 | | | $ | 19.65 | | | $ | 18.86 | |
| Income from | | | | | | | | | | | | | | | | | | | | | | | | |
| Investment Operations: | | | | | | | | | | | | | | | | | | | | | | | | |
Net investment income/(loss)1 | | | (0.05 | ) | | | 0.10 | | | | 0.05 | | | | 0.09 | | | | 0.12 | | | | 0.07 | |
| Net realized and unrealized | | | | | | | | | | | | | | | | | | | | | | | | |
| gain (loss) on investments | | | 2.30 | | | | (7.15 | ) | | | 9.52 | | | | 2.69 | | | | 3.10 | | | | 1.11 | |
| Total from | | | | | | | | | | | | | | | | | | | | | | | | |
| investment operations | | | 2.25 | | | | (7.05 | ) | | | 9.57 | | | | 2.78 | | | | 3.22 | | | | 1.18 | |
| | | | | | | | | | | | | | | | | | | | | | | | | |
| Less Distributions: | | | | | | | | | | | | | | | | | | | | | | | | |
| Dividends from net | | | | | | | | | | | | | | | | | | | | | | | | |
| investment income | | | (0.11 | ) | | | (0.06 | ) | | | (0.12 | ) | | | (0.11 | ) | | | (0.08 | ) | | | (0.04 | ) |
| Distributions from | | | | | | | | | | | | | | | | | | | | | | | | |
| net realized gains | | | (3.34 | ) | | | (2.71 | ) | | | (0.79 | ) | | | (0.31 | ) | | | (0.48 | ) | | | (0.35 | ) |
| Total distributions | | | (3.45 | ) | | | (2.77 | ) | | | (0.91 | ) | | | (0.42 | ) | | | (0.56 | ) | | | (0.39 | ) |
| Net Asset Value – | | | | | | | | | | | | | | | | | | | | | | | | |
| End of Period | | $ | 22.31 | | | $ | 23.51 | | | $ | 33.33 | | | $ | 24.67 | | | $ | 22.31 | | | $ | 19.65 | |
| | | | | | | | | | | | | | | | | | | | | | | | | |
| Total Return | | 10.59 | %^ | | | (22.86 | )% | | | 39.66 | % | | | 12.60 | % | | | 17.04 | % | | | 6.34 | % |
| | | | | | | | | | | | | | | | | | | | | | | | | |
| Ratios and Supplemental Data: | | | | | | | | | | | | | | | | | | | | | | | | |
| Net assets, end of | | | | | | | | | | | | | | | | | | | | | | | | |
| period (thousands) | | $ | 3,128 | | | $ | 3,562 | | | $ | 7,731 | | | $ | 6,488 | | | $ | 5,152 | | | $ | 3,584 | |
| Ratio of operating expenses | | | | | | | | | | | | | | | | | | | | | | | | |
| to average net assets: | | | | | | | | | | | | | | | | | | | | | | | | |
| Before reimbursements | | | 1.03 | %+ | | | 0.80 | % | | | 0.72 | % | | | 0.72 | % | | | 0.71 | % | | | 0.76 | % |
| After reimbursements | | | 0.63 | %+ | | | 0.63 | % | | | 0.63 | % | | | 0.63 | % | | | 0.63 | % | | | 0.62 | % |
| Ratio of net investment income | | | | | | | | | | | | | | | | | | | | | | | | |
| to average net assets: | | | | | | | | | | | | | | | | | | | | | | | | |
| Before reimbursements | | | 0.06 | %+ | | | 0.20 | % | | | N/A | 3 | | | N/A | 3 | | | N/A | 3 | | | N/A | 3 |
| After reimbursements | | | 0.46 | %+ | | | 0.37 | % | | | 0.18 | % | | | 0.40 | % | | | 0.60 | % | | | 0.33 | % |
Portfolio turnover rate2 | | 8 | %^ | | | 26 | % | | | 9 | % | | | 22 | % | | | 26 | % | | | 15 | % |
+ | Annualized |
| ^ | Not Annualized |
1 | The net investment income per share was calculated using the average shares outstanding method. |
2 | Portfolio turnover was calculated on the basis of the Fund as a whole. The rate presented represents portfolio turnover for the entire fiscal year. |
3 | Figures were not reported on the Prior reports. |
4 | The fund transitioned from the Harbor Strategic Growth Fund to the Mar Vista Strategic Growth Fund on July 22, 2022. |
The accompanying notes are an integral part of these financial statements.
| NOTES TO FINANCIAL STATEMENTS |
| April 30, 2023 (Unaudited) |
NOTE 1 – ORGANIZATION
The Mar Vista Strategic Growth Fund (formerly, the Harbor Strategic Growth Fund) (the “Strategic Growth Fund” or the “Fund”) is a series of Manager Directed Portfolios (formerly, The Roxbury Funds) (the “Trust”). The Trust is registered under the Investment Company Act of 1940, as amended (the “1940 Act”), and was organized as a Delaware statutory trust on April 4, 2006. The Fund is an open-end investment management company and is a diversified series of the Trust. The investment objective of the Fund is long-term growth of capital. The fund offers 3 classes of shares to investors: the Institutional, Investor, and Retirement classes. The Administrative class was collapsed into the Institutional class prior to conversion and shares were issued based upon the Institutional Shares’ net asset value per share. Each class of shares differs principally in its respective distribution or shareholder servicing expenses. Each class of shares has identical rights to earnings, assets and voting privileges, except for class-specific expenses and exclusive rights to vote on matters affecting only individual classes.
The Harbor Strategic Growth Fund (or the “Predecessor Fund”) is the successor to interest and has the same investment objective that was included as a series of another investment company, Harbor Funds, and that was advised by Harbor Capital and Sub-Advised by Mar Vista Investment Partners. On July 1, 2022, the shareholders of the Predecessor Fund approved the tax-free reorganization of the Predecessor Fund with and into the Mar Vista Strategic Growth Fund, and effective as of the close of business on July 22, 2022, the assets and liabilities of the Predecessor Fund were transferred to the Trust in exchange for shares of the Mar Vista Strategic Growth Fund. For financial reporting purposes, assets received and shares issued by Mar Vista were recorded at fair value; however, the cost basis of the investments received from the Predecessor Fund was carried forward to align ongoing reporting of Mar Vista’s realized and unrealized gains and losses with amounts distributable to shareholders for tax purposes. Costs incurred by the Mar Vista Strategic Growth Fund, in connection with the reorganization were paid by the Adviser. The fiscal year end of the Predecessor Fund was October 31, which remained the same. Operations prior to July 22, 2022 were that of the Predecessor Fund. The net assets were $73,590,993, including $26,342,178 of net unrealized appreciation, $56,484 of undistributed net investment income, and $13,509,548 of undistributed net realized gain and shares outstanding were 3,021,636, all of which were transferred into the Trust at NAV at the close of business on July 22, 2022.
NOTE 2 – SIGNIFICANT ACCOUNTING POLICIES
The following is a summary of significant accounting policies consistently followed by the Fund. These policies are in conformity with U.S. generally accepted accounting principles (“GAAP”). The Fund is an investment company and accordingly follows the investment company accounting and reporting guidance of the Financial Accounting Standards Board (FASB) Accounting Standard Codification Topic 946 “Financial Services – Investment Companies” including FASB Accounting Standard Update ASU 2013-08.
| NOTES TO FINANCIAL STATEMENTS (Continued) |
| April 30, 2023 (Unaudited) |
| | A. | Security Valuation: All investments in securities are recorded at their estimated fair value, as described in Note 3. |
| | | |
| | B. | Federal Income Taxes: It is the Fund’s policy to continue to comply with the requirements of Subchapter M of the Internal Revenue Code applicable to regulated investment companies and to distribute substantially all of its taxable income to its shareholders. Therefore, no federal income or excise tax provisions are required. |
| | | |
| | | The Fund recognizes the tax benefits of uncertain tax positions only where the position is “more likely than not” to be sustained assuming examination by tax authorities. Management has analyzed the Fund’s tax positions, and has concluded that no liability for unrecognized tax benefits should be recorded related to uncertain tax positions to be taken or expected to be taken on a tax return. The tax returns for the Fund for the prior three fiscal years are open for examination. The Fund identifies its major tax jurisdictions as U.S. Federal and the state of Delaware. |
| | | |
| | C. | Securities Transactions, Income and Distributions: Securities transactions are accounted for on the trade date. Realized gains and losses on securities sold are determined on the basis of identified cost. Interest income is recorded on an accrual basis. Dividend income and distributions to shareholders are recorded on the ex-dividend date. Withholding taxes on foreign dividends have been provided for in accordance with the Fund’s understanding of the applicable country’s tax rules and rates. |
| | | |
| | | The Fund distributes substantially all of its net investment income, if any, and net realized capital gains, if any, annually. Distributions from net realized gains for book purposes may include short-term capital gains. All short-term capital gains are included in ordinary income for tax purposes. The amount of dividends and distributions to shareholders from net investment income and net realized capital gains is determined in accordance with federal income tax regulations, which differ from GAAP. To the extent these book/tax differences are permanent, such amounts are reclassified within the capital accounts based on their federal tax treatment. |
| | | |
| | | Investment income, expenses (other than those specific to the class of shares), and realized and unrealized gains and losses on investments are allocated to the separate classes of the Fund’s shares based upon their relative net assets on the date income is earned or expensed and realized and unrealized gains and losses are incurred. |
| | | |
| | | The Fund is charged for those expenses that are directly attributable to it, such as investment advisory, custody and transfer agent fees. Expenses that are not attributable to the Fund are typically allocated among the funds in the Trust proportionately based on allocation methods approved by the Board of Trustees (the “Board”). Common expenses of the Trust are typically allocated among the funds in the Trust based on a fund’s respective net assets, or by other equitable means. |
| NOTES TO FINANCIAL STATEMENTS (Continued) |
| April 30, 2023 (Unaudited) |
| | D. | Use of Estimates: The preparation of financial statements in conformity with GAAP requires management to make estimates and assumptions that affect the reported amounts of assets and liabilities at the date of the financial statements and the reported amounts of increases and decreases in net assets during the reporting period. Actual results could differ from those estimates. |
| | | |
| | E. | Reclassification of Capital Accounts: GAAP requires that certain components of net assets relating to permanent differences be reclassified between financial and tax reporting. These reclassifications have no effect on net assets or net asset value per share. |
| | | |
| | F. | Events Subsequent to the Fiscal Year End: In preparing the financial statements as of April 30, 2023, management considered the impact of subsequent events for potential recognition or disclosure in the financial statements and concluded that no additional disclosures are necessary. |
NOTE 3 – SECURITIES VALUATION
The Fund has adopted authoritative fair value accounting standards which establish an authoritative definition of fair value and set out a hierarchy for measuring fair value. These standards require additional disclosures about the various inputs and valuation techniques used to develop the measurements of fair value, a discussion of changes in valuation techniques and related inputs during the period, and expanded disclosure of valuation levels for major security types. These inputs are summarized in the three broad levels listed below:
| | Level 1 – | Unadjusted quoted prices in active markets for identical assets or liabilities that the Fund has the ability to access. |
| | | |
| | Level 2 – | Observable inputs other than quoted prices included in Level 1 that are observable for the asset or liability, either directly or indirectly. These inputs may include quoted prices for the identical instrument on an inactive market, prices for similar instruments, interest rates, prepayment speeds, credit risk, yield curves, default rates and similar data. |
| | | |
| | Level 3 – | Unobservable inputs for the asset or liability, to the extent relevant observable inputs are not available, representing the Fund’s own assumptions about the assumptions a market participant would use in valuing the asset or liability, and would be based on the best information available. |
Following is a description of the valuation techniques applied to the Fund’s major categories of assets and liabilities measured at fair value on a recurring basis.
Equity Securities: Equity securities, including common stocks, preferred stocks, foreign-issued common stocks, exchange-traded funds, closed-end mutual funds and real estate investment trusts (REITs), that are primarily traded on a national securities exchange shall be valued at the last sale price on the exchange on which they are primarily traded on the day of valuation or, if there has been no sale on such day, at the
| NOTES TO FINANCIAL STATEMENTS (Continued) |
| April 30, 2023 (Unaudited) |
mean between the bid and asked prices. Securities primarily traded in the NASDAQ Global Market System for which market quotations are readily available shall be valued using the NASDAQ Official Closing Price (“NOCP”). If the NOCP is not available, such securities shall be valued at the last sale price on the day of valuation, or if there has been no sale on such day, at the mean between the bid and asked prices. Over-the-counter securities that are not traded on a listed exchange are valued at the last sale price in the over-the-counter market. Over-the-counter securities which are not traded in the NASDAQ Global Market System shall be valued at the mean between the bid and asked prices. To the extent these securities are actively traded and valuation adjustments are not applied, they are categorized in Level 1 of the fair value hierarchy.
Registered Investment Companies: Investments in registered investment companies (e.g., mutual funds) are generally priced at the ending NAV provided by the applicable registered investment company’s service agent and will be classified in Level 1 of the fair value hierarchy.
Short-Term Debt Securities: Debt securities, including short-term debt instruments having a maturity of less than 60 days, are valued at the evaluated mean price supplied by an approved pricing service. Pricing services may use various valuation methodologies including matrix pricing and other analytical pricing models as well as market transactions and dealer quotations. In the absence of prices from a pricing service, the securities will be priced in accordance with the procedures adopted by the Board. Short-term securities are generally classified in Level 1 or Level 2 of the fair market hierarchy depending on the inputs used and market activity levels for specific securities.
In the absence of prices from a pricing service or in the event that market quotations are not readily available, fair value will be determined under the Fund’s valuation procedures adopted pursuant to Rule 2a-5. Pursuant to those procedures, the Board has appointed the Advisor as the Fund’s valuation designee (the “Valuation Designee”) to perform all fair valuations of the Fund’s portfolio investments, subject to the Board’s oversight. As the Valuation Designee, the Advisor has established procedures for its fair valuation of the Fund’s portfolio investments. These procedures address, among other things, determining when market quotations are not readily available or reliable and the methodologies to be used for determining the fair value of investments, as well as the use and oversight of third-party pricing services for fair valuation.
Depending on the relative significance of the valuation inputs, fair valued securities may be classified in either Level 2 or Level 3 of the fair value hierarchy.
| NOTES TO FINANCIAL STATEMENTS (Continued) |
| April 30, 2023 (Unaudited) |
The inputs or methodology used for valuing securities are not an indication of the risk associated with investing in those securities. The following is a summary of the fair valuation hierarchy of the Small-Cap Growth Fund’s securities as of April 30, 2023:
| | | Level 1 | | | Level 2 | | | Level 3 | | | Total | |
| Common Stocks | | | | | | | | | | | | |
| Communication Services | | $ | 3,639,315 | | | $ | — | | | $ | — | | | $ | 3,639,315 | |
| Consumer Discretionary | | | 5,466,698 | | | | — | | | | — | | | | 5,466,698 | |
| Consumer Staples | | | 1,768,787 | | | | — | | | | — | | | | 1,768,787 | |
| Financials | | | 7,880,884 | | | | — | | | | — | | | | 7,880,884 | |
| Healthcare | | | 4,514,208 | | | | — | | | | — | | | | 4,514,208 | |
| Industrials | | | 9,354,543 | | | | — | | | | — | | | | 9,354,543 | |
| Information Technology | | | 22,534,376 | | | | — | | | | — | | | | 22,534,376 | |
| Materials | | | 4,426,375 | | | | — | | | | — | | | | 4,426,375 | |
| Total Common Stocks | | | 59,585,185 | | | | — | | | | — | | | | 59,585,185 | |
| REITs | | | 2,383,801 | | | | — | | | | — | | | | 2,383,801 | |
| Short-Term Investments | | | 3,017,282 | | | | — | | | | — | | | | 3,017,282 | |
| Investments Purchased | | | | | | | | | | | | | | | | |
| with Cash Proceeds | | | | | | | | | | | | | | | | |
| from Securities Lending | | | 5,027,708 | | | | — | | | | — | | | | 5,027,708 | |
| Total Investments in Securities | | $ | 70,013,976 | | | $ | — | | | $ | — | | | $ | 70,013,976 | |
NOTE 4 – INVESTMENT ADVISORY FEE AND OTHER TRANSACTIONS WITH AFFILIATES
For the six months ended April 30, 2023, Mar Vista Investment Partners, (the “Advisor”) provided the Fund with investment management services under an Investment Advisory Agreement. The Advisor furnishes all investment advice, office space, and facilities, and provides most of the personnel needed by the Fund. As compensation for its services, the Advisor is entitled to a monthly fee at an annual rate of 0.60% of the average daily net assets of the Fund. For the six months ended April 30, 2023, the Strategic Growth Fund incurred $194,267 in advisory fees. Advisory fees payable at April 30, 2023 for the Strategic Growth Fund were $11,020.
The Fund is responsible for its own operating expenses. The Advisor has contractually agreed to waive a portion of its fees and reimburse certain expenses for the Fund to ensure that the total annual fund operating expenses [excluding front-end or contingent deferred loads, Rule 12b-1 plan fees, shareholder servicing plan fees, taxes, leverage, interest, brokerage commissions and other transactional expenses, expenses in connection with a merger or reorganization, dividends or interest on short positions, acquired fund fees and expenses or extraordinary expenses (collectively, “Excludable Expenses”)] do not exceed the following amounts of the average daily net assets for each class of shares:
| NOTES TO FINANCIAL STATEMENTS (Continued) |
| April 30, 2023 (Unaudited) |
| | Investor Shares | 1.07% | |
| | Institutional Shares | 0.71% | |
| | Retirement Shares | 0.63% | |
For the six months ended April 30, 2023, the Advisor reduced its fees in the amount of $133,657 for the Fund. The waivers and reimbursements will be recoupable through July 25, 2024 unless terminated sooner by mutual agreement of the Board and the Advisor.
The Advisor may request recoupment of previously waived fees and paid expenses in any subsequent month dating back to July 25, 2022, for the Mar Vista Strategic Growth Fund, if the aggregate amount actually paid by the Fund toward the operating expenses for such fiscal year (taking into account the reimbursement) will not cause the Fund to exceed the lesser of: (1) the expense limitation in place at the time of the management fee reduction and expense payment; or (2) the expense limitation in place at the time of the reimbursement. Any such reimbursement is also contingent upon Board of Trustees review and approval at the time the reimbursement is made. Such reimbursement may not be paid prior to the Funds’ payment of current ordinary operating expenses. Cumulative expenses subject to recapture pursuant to the aforementioned conditions expire as follows:
| | | | Amount | | Expiration | |
| | Mar Vista Strategic Growth Fund | | $ | 92,451 | | 10/31/2025 | |
| | | | | 133,657 | | 4/30/2026 | |
U.S. Bancorp Fund Services, LLC, doing business as U.S. Bank Global Fund Services, LLC (“Fund Services” or the “Administrator”) acts as the Fund’s Administrator under an Administration Agreement. The Administrator prepares various federal and state regulatory filings, reports and returns for the Fund; prepares reports and materials to be supplied to the Trustees; monitors the activities of the Fund’s custodian, transfer agent and accountants; coordinates the preparation and payment of the Fund’s expenses and reviews the Fund’s expense accruals. Fund Services also serves as the fund accountant transfer agent, and Chief Compliance Officer to the Fund. For the six months ended April 30, 2023, the Fund incurred the following expenses for administration, fund accounting, transfer agency, custody and compliance fees:
| | Administration & fund accounting | $20,172 | |
| | Custody | $ 4,092 | |
| | Transfer agency | $30,999 | |
| | Compliance | $ 6,066 | |
At April 30, 2023, the Fund had payables due to Fund Services for administration, fund accounting and transfer agency fees and to U.S. Bank N.A. for custody fees in the following amounts:
| | Administration & fund accounting | $12,043 | |
| | Custody | $ 633 | |
| | Transfer agency | $ 6,105 | |
| | Compliance | $ 4,265 | |
| NOTES TO FINANCIAL STATEMENTS (Continued) |
| April 30, 2023 (Unaudited) |
Quasar Distributors, LLC (the “Distributor”) acts as the Fund’s principal underwriter in a continuous public offering of the Fund’s shares.
Certain officers of the Fund are employees of the Administrator and are not paid any fees by the Fund for serving in such capacities.
NOTE 5 – DISTRIBUTION AGREEMENT AND PLAN
The Fund has adopted a Distribution Plan pursuant to Rule 12b-1 (the “Plan”). The Plan permits the Fund to pay for distribution and related expenses at an annual rate of up to 0.25% of the average daily net assets of the Fund’s Investor Shares and Administrative Shares. The expenses covered by the Plan may include costs in connection with the promotion and distribution of shares and the provision of personal services to shareholders, including, but not necessarily limited to, advertising, compensation to underwriters, dealers and selling personnel, the printing and mailing of prospectuses to other than current Fund shareholders, and the printing and mailing of sales literature. Payments made pursuant to the Plan will represent compensation for distribution and service activities, not reimbursements for specific expenses incurred. For the six months ended April 30, 2023, the Strategic Growth Fund incurred distribution expenses of $1,407 on its Investor Shares.
NOTE 6 – SHAREHOLDER SERVICING FEE
The Fund has adopted a shareholder servicing plan (the “Plan”) on behalf of the Investor and Institutional Share classes on May 17th, 2022 with an effective date of July 22, 2022. Under the Plan, the Investor and Institutional Share Classes are authorized to pay an annual shareholder servicing fee of up to 0.10% of each class’s average daily net assets. This fee is used to finance certain activities related to servicing and maintaining shareholder accounts. Payments made under the Plan may not be used to pay for any services in connection with the distribution and sale of the Investor and Institutional Shares.
Payments to the Advisor under the Plan may reimburse the Advisor for payments it makes to selected brokers, dealers and administrators which have entered into service agreements with the Advisor for services provided to Investor and Institutional Class shareholders of the Fund. The services provided by such intermediaries are primarily designed to assist Investor and Institutional Class shareholders of the Fund and include the furnishing of office space and equipment, telephone facilities, personnel, and assistance to the Fund in servicing such shareholders. Services provided by such intermediaries also include the provision of support services to the Fund and include establishing and maintaining shareholders’ accounts and record processing, purchase and redemption transactions, answering routine client inquiries regarding the Fund, and providing such other personal services to shareholders as the Fund may reasonably request. For the six months ended April 30, 2023, the Fund incurred, under the Agreement, shareholder servicing fees as follows:
| | Investor Shares | $ 563 | |
| | Institutional Shares | $30,193 | |
| NOTES TO FINANCIAL STATEMENTS (Continued) |
| April 30, 2023 (Unaudited) |
NOTE 7 – SECURITIES TRANSACTIONS
For the six months ended April 30, 2023, the cost of purchases and the proceeds from sales of securities, excluding short-term securities, were as follows:
| | | | Purchases | | | Sales | |
| | Strategic Growth Fund | | $ | 4,823,066 | | | $ | 15,237,275 | |
There were no purchases or sales of long-term U.S. Government securities.
NOTE 8 – INCOME TAXES AND DISTRIBUTIONS TO SHAREHOLDERS
As of October 31, 2022, the components of accumulated earnings/(losses) on a tax basis were as follows:
| | | | Strategic | |
| | | | Growth Fund | |
| | Cost of investments(a) | | $ | 42,535,627 | |
| | Gross unrealized appreciation | | | 26,119,282 | |
| | Gross unrealized depreciation | | | (918,170 | ) |
| | Net unrealized appreciation | | | 25,201,112 | |
| | Undistributed ordinary income | | | 204,077 | |
| | Undistributed long-term capital gain | | | 8,862,058 | |
| | Total distributable earnings | | | 9,066,135 | |
| | Other accumulated gains/(losses) | | | (4,446 | ) |
| | Total accumulated earnings/(losses) | | $ | 34,262,801 | |
| | (a) | The difference between the book basis and tax basis net unrealized appreciation and cost is attributable primarily to wash sales. |
As of October 31, 2022, the Strategic Growth Fund had no short-term or long-term tax basis capital losses to offset future capital gains.
The tax character of distributions paid during the period ended October 31, 2022, and the year ended October 31, 2021 was as follows:
| | | | Year Ended | | | Year Ended | |
| | | | October 31, 2022 | | | October 31, 2021 | |
| | Strategic Growth Fund | | | | | | |
| | Ordinary income | | $ | 522,628 | | | $ | 439,000 | |
| | Long-term capital gains | | | 9,379,420 | | | | 3,413,000 | |
| | | | $ | 9,902,048 | | | $ | 3,852,000 | |
At October 31, 2022 the fund had no deferred tax basis post October losses.
| NOTES TO FINANCIAL STATEMENTS (Continued) |
| April 30, 2023 (Unaudited) |
For the fiscal year ended October 31, 2022, the effect of permanent “book/tax” reclassifications resulted in increases and decreases to components of the Funds’ net assets as follows:
| | | | Total Accumulated | | | Paid-In | |
| | | | Earnings/Loss | | | Capital | |
| | Strategic Growth Fund | | $ | (3,044,562 | ) | | $ | 3,044,562 | |
NOTE 9 – SECURITIES LENDING
The Fund participates in securities lending arrangements whereby it lends certain of its portfolio securities to brokers, dealers and financial institutions (not with individuals) in order to receive additional income and increase the rate of return of its portfolio. U.S. Bank, N.A. serves as the Fund’s securities lending agent.
U.S. Bank, N.A. oversees the securities lending process, which includes the screening, selection and ongoing review of borrowers, monitoring the availability of securities, negotiating rebates, daily marking to market of loans, monitoring and maintaining cash collateral levels, processing securities movements and reinvesting cash collateral as directed by the Adviser.
The Fund may lend securities pursuant to agreements that require the loans to be secured by collateral consisting of cash, securities of the U.S. Government or it agencies, or any combination of cash and such securities. At that time of loans, the collateral value should at least be equal to 102% of domestic securities and 105% of foreign securities. The value of loaned securities will then be marked-to-market daily and the collateral will be continuously secured by collateral equal to 100% of the market value of the loaned securities. Such loans will not be made if, as a result, the aggregate amount of all outstanding securities loans for the Fund exceeds one-third of the value of the Fund’s total assets taken at fair market value. The Fund will earn interest on the investment of the cash collateral in U.S. Government securities, short-term money market instruments or such other approved vehicle. However, the Fund will normally pay lending fees to such broker-dealers and related expenses from the interest earned on invested collateral. There may be risks of delay in receiving additional collateral or risks of delay in recovery of the securities and even loss of rights in the collateral should the borrower of the securities fail financially. However, loans are made only to borrowers deemed by the adviser to be of good standing and when, in the judgment of the adviser, the consideration that can be earned currently from such securities loans justifies the attendant risk. Either party, upon reasonable notice to the other party, may terminate the loan.
As of April 30, 2023, the Fund had loaned securities that were collateralized by cash. The cash collateral received was invested in securities as listed in the Fund’s Schedule of Investments.
| NOTES TO FINANCIAL STATEMENTS (Continued) |
| April 30, 2023 (Unaudited) |
The following table presents the securities out on loan for the Fund, and the collateral delivered related to those securities, as of the end of the reporting period.
Securities Lending Transactions
| | | | Investments | | |
| | | | Purchased with | Collateral | |
| | Overnight and | Asset Class | Proceeds from | Pledged from | Net |
| | Continuous | out on Loan | Securities Lending | Counterparty^ | Exposure |
| | Mar Vista Strategic | | | | |
| | Growth Fund | Common Stock | $5,027,708 | $5,027,708 | $ — |
| | ^ | As of the end of the reporting period, the value of the collateral pledged from the counterparty exceeded the value of the securities out on loan. Refer to the Fund’s Schedule of Investments for details on the securities out on loan. |
NOTE 10 – PRINCIPAL RISKS
The following is a list of certain risks that may apply to your investment in the Fund. Further information about investment risks is available in the Fund’s Statement of Additional Information.
General Market Risk; Recent Market Events: The value of the Fund’s shares will fluctuate based on the performance of the Fund’s investments and other factors affecting the securities markets generally. Certain investments selected for the Fund’s portfolio may be worth less than the price originally paid for them, or less than they were worth at an earlier time. The value of the Fund’s investments may go up or down, sometimes dramatically and unpredictably, based on current market conditions, such as real or perceived adverse political or economic conditions, inflation, changes in interest rates, lack of liquidity in the fixed income markets or adverse investor sentiment.
U.S. and international markets have experienced volatility in recent months and years due to a number of economic, political and global macro factors, including the impact of the coronavirus (COVID-19) global pandemic, which has resulted in a public health crisis, business interruptions, growth concerns in the U.S. and overseas, layoffs, rising unemployment claims, changed travel and social behaviors and reduced consumer spending. The effects of COVID-19 may lead to a substantial economic downturn or recession in the U.S. and global economies, the recovery from which is uncertain and may last for an extended period of time.
Small-Cap Company Risk: Companies in which the Fund invests may be more vulnerable than larger companies to adverse business or economic developments. Small-cap companies may also have limited product lines, markets, or financial resources, may be dependent on relatively small or inexperienced management groups, and may operate in industries characterized by rapid technological obsolescence. Securities of such companies may be less liquid, more volatile and more difficult to value than securities of larger companies and therefore may involve greater risk than investing in large companies.
| NOTES TO FINANCIAL STATEMENTS (Continued) |
| April 30, 2023 (Unaudited) |
Growth-Style Investing Risk: An investment in a growth-oriented fund may be more volatile than the rest of the U.S. market as a whole. If the investment adviser’s assessment of a company’s prospects for earnings growth or how other investors will value the company’s earnings growth is incorrect, the stock may fail to reach the value that the adviser has placed on it. Growth stock prices tend to fluctuate more dramatically than the overall stock market.
Foreign Security Risk: Foreign investments involve risks relating to political, economic, regulatory, or social instability, military action or unrest, or diplomatic developments and may be affected by actions of foreign governments adverse to the interest of U.S. investors.
IPO Risk: The Fund may purchase securities of companies engaged in initial public offerings (“IPOs”). The price of securities purchased in IPOs can be very volatile. The Fund’s investments in IPO shares may include the securities of “unseasoned” companies (companies with less than three years of continuous operations), which present risks considerably greater than common stocks of more established companies. These companies may be involved in new and evolving businesses and may be vulnerable to competition and changes in technology, markets and economic conditions. They may be more dependent on key managers and third parties and may have limited product lines. The effect of IPO investments on a Fund’s performance depends on a variety of factors, including the number of IPOs the Fund invests in relative to the size of the Fund, and whether and to what extent a security purchased in an IPO appreciates or depreciates in value. When the Fund’s asset base is small, a significant portion of the Fund’s performance could be attributable to investments in IPOs because such investments would have a magnified impact on the Fund. As the Fund’s asset grow, the effect of the Fund’s investments in IPOs on the Fund’s performance probably will decline, which could reduce the Fund’s performance.
Liquidity Risk: Certain securities may be difficult or impossible to sell at the time and the price that the seller would like. While the markets in securities of small companies have grown rapidly in recent years, such securities may trade less frequently and in smaller volumes than more widely held securities. The values of these securities may fluctuate more sharply than those of other securities, and the Fund may experience some difficulty in establishing or closing out positions in these securities at prevailing market prices. There may be less publicly available information about the issuers of these securities or less market interest in such securities than in the case of larger companies, and it may take a longer period of time for the prices of such securities to reflect the full value of their issuers’ underlying earnings potential or assets.
Mutual Fund and ETF Trading Risk: The Fund may invest in other mutual funds that are either open-end or closed-end investment companies as well as Exchange Traded Funds (“ETFs”). ETFs are investment companies that are bought and sold on a national securities exchange. Unlike mutual funds, ETFs do not necessarily trade at the net asset
| NOTES TO FINANCIAL STATEMENTS (Continued) |
| April 30, 2023 (Unaudited) |
values of their underlying securities, which means an ETF could potentially trade above or below the value of the underlying portfolios. Additionally, because ETFs trade like stocks on exchanges, they are subject to trading and commission costs unlike mutual funds. Also, both mutual funds and ETFs have management fees that are part of its costs, and the Fund will indirectly bear their proportionate share of the costs.
NOTE 11 – GUARANTEES AND INDEMNIFICATIONS
In the normal course of business, the Fund enters into contracts that contain a variety of representations and warranties and which provide general indemnifications. The Fund’s maximum exposure under these arrangements is unknown, as this would involve future claims that may be made against the Fund that have not yet occurred. However, based on experience, the Fund expects the risk of loss to be remote.
NOTE 12 – CONTROL OWNERSHIP
The beneficial ownership, either directly or indirectly, of more than 25% of the voting securities of a fund creates a presumption of control of the fund, under Section 2(a)(9) of the 1940 Act. As of April 30, 2023, Pershing LLC held 28% of the outstanding shares of the Fund. The Fund has no knowledge as to whether all or any portion of the shares owned of record by Pershing LLC are also beneficially owned.
NOTE 13 – CHANGE IN INDEPENDENT REGISTERED PUBLIC ACCOUNTING FIRM
Effective March 6, 2023, BBD LLP (“BBD”) ceased to serve as the independent registered public accounting firm of the Mar Vista Strategic Growth Fund, a series of Manager Directed Portfolios Trust. The Audit Committee of the Board of Directors approved the replacement of BBD as a result of Cohen & Company, Ltd.’s (“Cohen”) acquisition of BBD’s investment management group.
The report of BBD on the financial statements of the Mar Vista Strategic Growth Fund as of and for the fiscal year ended 2022 did not contain an adverse opinion or a disclaimer of opinion, and was not qualified or modified as to uncertainties, audit scope or accounting principles. During the fiscal year ended 2022, and during the subsequent interim period through February 18, 2023: (i) there were no disagreements between the registrant and BBD on any matter of accounting principles or practices, financial statement disclosure, or auditing scope or procedure, which disagreements, if not resolved to the satisfaction of BBD, would have caused it to make reference to the subject matter of the disagreements in its report on the financial statements of the Mar Vista Strategic Growth Fund for such years or interim period; and (ii) there were no “reportable events,” as defined in Item 304(a)(1)(v) of Regulation S-K under the Securities Exchange Act of 1934, as amended.
The registrant requested that BBD furnish it with a letter addressed to the U.S. Securities and Exchange Commission stating that it agrees with the above statements.
| NOTES TO FINANCIAL STATEMENTS (Continued) |
| April 30, 2023 (Unaudited) |
On February 18, 2023, the Audit Committee of the Board of Directors also recommended and approved the appointment of Cohen as the Fund’s independent registered public accounting firm for the fund’s October 31, 2023 fiscal year.
During the fiscal year ended October 31, 2022, and during the subsequent interim period through February 18, 2023, neither the registrant, nor anyone acting on its behalf, consulted with Cohen on behalf of the Mar Vista Strategic Growth Fund regarding the application of accounting principles to a specified transaction (either completed or proposed), the type of audit opinion that might be rendered on the Mar Vista Strategic Growth Fund’s financial statements, or any matter that was either: (i) the subject of a “disagreement,” as defined in Item 304(a)(1)(iv) of Regulation S-K and the instructions thereto; or (ii) “reportable events,” as defined in Item 304(a)(1)(v) of Regulation S-K.
| EXPENSE EXAMPLE |
| April 30, 2023 (Unaudited) |
As a shareholder of the Fund, you incur two types of costs: (1) transaction costs including sales charges (loads) and redemption fees, if applicable; and (2) ongoing costs, including management fees; distribution and/or service (12b-1 fees); and other Fund expenses. This Example is intended to help you understand your ongoing costs (in dollars) of investing in the Fund and to compare these costs with the ongoing costs of investing in other mutual funds.
The Example is based on an investment of $1,000 invested at the beginning of the period indicated and held for the entire period from November 1, 2022, to April 30, 2023, for the Institutional, Investor, and Retirement Shares.
Actual Expenses
The information in the table under the heading “Actual” provides information about actual account values and actual expenses. You may use the information in these columns together with the amount you invested, to estimate the expenses that you paid over the period. Simply divide your account value by $1,000 (for example, an $8,600 account value divided by $1,000 = 8.6), then multiply the result by the number in the row entitled “Expenses Paid During Period” to estimate the expenses you paid on your account during this period. There are some account fees that are charged to certain types of accounts, such as Individual Retirement Accounts (generally, a $15 fee is charged to the account annually) that would increase the amount of expenses paid on your account. The example below does not include portfolio trading commissions and related expenses and other extraordinary expenses as determined under generally accepted accounting principles.
Hypothetical Example for Comparison Purposes
The information in the table under the heading “Hypothetical (5% return before expenses)” provides information about hypothetical account values and hypothetical expenses based on the Fund’s actual expense ratio and assumed rate of return of 5% per year before expenses, which is not the Fund’s actual return. The hypothetical account values and expenses may not be used to estimate the actual ending account balance or expenses you paid for the period. You may use this information to compare the ongoing costs of investing in the Fund and other funds. To do so, compare this 5% hypothetical example with the 5% hypothetical examples that appear in the shareholder reports of the other funds. As noted above, there are some account fees that are charged to certain types of accounts that would increase the amount of expense paid on your account.
Please note that the expenses shown in the table are meant to highlight your ongoing costs only and do not reflect any transaction costs, such as sales charges (loads), redemption fees, or exchange fees. Therefore, the information under the heading “Hypothetical (5% return before expenses)” is useful in comparing ongoing costs only, and will not help you determine the relative total costs of owning different funds. In addition, if these transactional costs were included, your costs would have been higher.
| EXPENSE EXAMPLE (Continued) |
| April 30, 2023 (Unaudited) |
| | Beginning | Ending | Expenses Paid |
| | Account Value | Account Value | During Period(1) |
| | 11/1/22 | 4/30/2023 | 11/1/22 – 4/30/2023 |
| Actual | | | |
| Institutional Shares | $1,000.00 | $1,104.90 | $3.71 |
| Investor Shares | $1,000.00 | $1,102.90 | $5.58 |
| Retirement Shares | $1,000.00 | $1,105.90 | $3.29 |
| | | | |
| Hypothetical (5% return | | | |
| before expenses) | | | |
| Institutional Shares | $1,000.00 | $1,021.27 | $3.56 |
| Investor Shares | $1,000.00 | $1,019.49 | $5.36 |
| Retirement Shares | $1,000.00 | $1,021.67 | $3.16 |
(1) | Expenses are equal to the Institutional, Investor, and Retirement Shares’ annualized expense ratios of 0.71%, 1.07% and 0.63%, respectively, multiplied by the average account value over the period, multiplied by 181/365 (to reflect the period). |
| NOTICE TO SHAREHOLDERS |
| at April 30, 2023 (Unaudited) |
How to Obtain a Copy of the Fund’s Proxy Voting Policies
A description of the policies and procedures that the Fund uses to determine how to vote proxies relating to portfolio securities is available without charge, upon request, by calling 1-833-627-6668 or on the U.S. Securities and Exchange Commission’s (“SEC”) website at http://www.sec.gov.
How to Obtain a Copy of the Fund’s Proxy Voting Records for the most recent 12-Month Period Ended June 30
Information regarding how the Fund voted proxies relating to portfolio securities during the most recent 12-month period ended June 30 is available no later than August 31 without charge, upon request, by 1-833-627-6668. Furthermore, you can obtain the Fund’s proxy voting records on the SEC’s website at http://www.sec.gov.
Quarterly Filings on Form N-PORT
The Fund files its complete schedule of portfolio holdings with the SEC for the first and third quarters of each fiscal year on Part F of Form N-PORT. The Fund’s Part F of Form N-PORT is available on the SEC’s website at http://www.sec.gov. Information included in the Fund’s Part F of Form N-PORT is also available, upon request, by calling 1-833-627-6668.
Qualified Dividend Income/Dividends Received Deduction
For the fiscal year ended October 31, 2022 certain dividends paid by the Funds may be subject to a maximum tax rate of 15%, as provided for by the Jobs and Growth Tax Relief Reconciliation Act of 2003. The percentage of dividends declared from ordinary income designated as qualified dividend income was as follows:
| | Mar Vista Strategic Growth Fund | 0.00% | |
For corporate shareholders, the percent of ordinary income distributions qualifying for the corporate dividends received deduction for the fiscal year ended October 31, 2022 was as follows:
| | Mar Vista Strategic Growth Fund | 0.00% | |
| NOTICE OF PRIVACY POLICY & PRACTICES |
| |
Protecting the privacy of Fund shareholders is important to us. The following is a description of the practices and policies through which we protect the privacy and security of your non-public personal information.
We collect non-public personal information about you from the following sources:
• information we receive about you on applications or other forms;
• information you give us orally; and
• information about your transactions with us or others.
The types of non-public personal information we collect and share can include:
• social security number;
• account balances;
• account transactions;
• transaction history;
• wire transfer instructions; and
• checking account information.
What Information We Disclose
We do not disclose any non-public personal information about our shareholders or former shareholders without the shareholder’s authorization, except as permitted by law or in response to inquiries from governmental authorities. We may share information with affiliated parties and unaffiliated third parties with whom we have contracts for servicing the Fund. We will provide unaffiliated third parties with only the information necessary to carry out their assigned responsibility.
How We Protect Your Information
All shareholder records will be disposed of in accordance with applicable law. We maintain physical, electronic and procedural safeguards to protect your non-public personal information and require third parties to treat your non-public personal information with the same high degree of confidentiality.
In the event that you hold shares of the Fund through a financial intermediary, including, but not limited to, a broker-dealer, bank or trust company, the privacy policy of your financial intermediary would govern how your non-public personal information would be shared with unaffiliated third parties.
If you have any questions or concerns regarding this notice or our Privacy Policy, please contact us at 1-888-893-4491.
Investment Advisor
Mar Vista Investment Partners LLC
6001 Shady Oak Road, Suite 200
Minnetonka, MN 55343
Distributor
Quasar Distributors, LLC
111 East Kilbourn Avenue, Suite 2200
Milwaukee, WI 53202
Transfer Agent
U.S. Bancorp Fund Services, LLC
615 East Michigan Street
Milwaukee, WI 53202
(833) 627-6668
Custodian
U.S. Bank National Association
Custody Operations
1555 North River Center Drive, Suite 302
Milwaukee, WI 53212
Independent Registered Public Accounting Firm
Cohen & Company, Ltd.
1835 Market Street, Suite 310
Philadelphia, PA 19103
Legal Counsel
Godfrey & Kahn S.C.
833 East Michigan Street, Suite 1800
Milwaukee, WI 53202
This report is intended for shareholders of the Fund and may not be used as sales literature unless preceded or accompanied by a current prospectus.
Past performance results shown in this report should not be considered a representation of future performance. Share price and returns will fluctuate so that shares, when redeemed, may be worth more or less than their original cost. Statements and other information herein are dated and are subject to change.
Item 2. Code of Ethics.
Not applicable for semi-annual reports.
Item 3. Audit Committee Financial Experts.
Not applicable for semi-annual reports.
Item 4. Principal Accountant Fees and Services.
Not applicable for semi-annual reports.
Item 5. Audit Committee of Listed Registrants.
(a) Not applicable to registrants who are not listed issuers (as defined in Rule 10A-3 under the Securities Exchange Act of 1934).
(b) Not Applicable.
Item 6. Investments.
| (a) | Schedule of Investments is included as part of the report to shareholders filed under Item 1 of this Form. |
Item 7. Disclosure of Proxy Voting Policies and Procedures for Closed-End Management Investment Companies.
Not applicable to open-end investment companies.
Item 8. Portfolio Managers of Closed-End Management Investment Companies.
Not applicable to open-end investment companies.
Item 9. Purchases of Equity Securities by Closed‑End Management Investment Company and Affiliated Purchasers.
Not applicable to open-end investment companies.
Item 10. Submission of Matters to a Vote of Security Holders.
There have been no material changes to the procedures by which shareholders may recommend nominees to the Registrant’s Board of Trustees.
Item 11. Controls and Procedures.
| (a) | The Registrant’s President/Principal Executive Officer and Treasurer/Principal Financial Officer have reviewed the Registrant's disclosure controls and procedures (as defined in Rule 30a-3(c) under the Investment Company Act of 1940 (the “Act”)) as of a date within 90 days of the filing of this report, as required by Rule 30a-3(b) under the Act and Rules 13a-15(b) or 15d-15(b) under the Securities Exchange Act of 1934. Based on their review, such officers have concluded that the disclosure controls and procedures are effective in ensuring that information required to be disclosed in this report is appropriately recorded, processed, summarized, and reported and made known to them by others within the Registrant and by the Registrant’s service provider. |
| (b) | There were no changes in the Registrant's internal control over financial reporting (as defined in Rule 30a-3(d) under the Act) that occurred during the second fiscal quarter of the period covered by this report that has materially affected, or is reasonably likely to materially affect, the Registrant's internal control over financial reporting. |
Item 12. Disclosure of Securities Lending Activities for Closed-End Management Investment Companies.
Not applicable to open-end investment companies.
Item 13. Exhibits.
| (a) | (1) Any code of ethics or amendment thereto, that is subject to the disclosure required by Item 2, to the extent that the registrant intends to satisfy Item 2 requirements through filing an exhibit. Not applicable. |
(3) Any written solicitation to purchase securities under Rule 23c‑1 under the Act sent or given during the period covered by the report by or on behalf of the registrant to 10 or more persons. Not applicable to open-end investment companies.
SIGNATURES
Pursuant to the requirements of the Securities Exchange Act of 1934 and the Investment Company Act of 1940, as amended, the registrant has duly caused this report to be signed on its behalf by the undersigned, thereunto duly authorized.
(Registrant) Manager Directed Portfolios
By (Signature and Title)* /s/Scott M. Ostrowski
Scott M. Ostrowski, President/
Principal Executive Officer
Date 07/03/2023
Pursuant to the requirements of the Securities Exchange Act of 1934 and the Investment Company Act of 1940, as amended, this report has been signed below by the following persons on behalf of the registrant and in the capacities and on the dates indicated.
By (Signature and Title)* /s/Scott M. Ostrowski
Scott M. Ostrowski, President/
Principal Executive Officer
Date 07/03/2023
By (Signature and Title)* /s/Ryan Frank
Ryan Frank,Treasurer/Principal Financial Officer
Date 07/03/2023
* Print the name and title of each signing officer under his or her signature.