UNITED STATES
SECURITIES AND EXCHANGE COMMISSION
Washington, D.C. 20549
FORM 10-K
(Mark One) | |
| |
x | ANNUAL REPORT PURSUANT TO SECTION 13 OR 15(d) OF THE SECURITIES EXCHANGE ACT OF 1934 |
|
|
| For the fiscal year ended December 31, 2006 |
| |
OR | |
| |
o | TRANSITION REPORT PURSUANT TO SECTION 13 OR 15(d) OF THE SECURITIES EXCHANGE ACT OF 1934 |
|
|
| For the transition period from to |
Commission File Number: 001-32971
FOX CHASE BANCORP, INC.
(Exact name of registrant as specified in its charter)
United States |
| 33-1145559 |
(State or other jurisdiction of |
| (I.R.S. Employer Identification No.) |
incorporation or organization) |
|
|
|
|
|
4390 Davisville Road, Hatboro, Pennsylvania |
| 19040 |
(Address of principal executive offices) |
| (Zip Code) |
Registrant’s telephone number, including area code: (215) 682-7400
Securities registered pursuant to Section 12(b) of the Act:
Title of each class |
| Name of each exchange on which registered |
| |
| Common Stock, par value $0.01 per share |
| Nasdaq Stock Market, LLC |
|
Securities registered pursuant to Section 12(g) of the Act: None
Indicate by check mark if the registrant is a well-known seasoned issuer, as defined in Rule 405 of the Securities Act. Yes o No x
Indicate by check mark if the registrant is not required to file reports pursuant to Section 13 or Section 15(d) of the Act. Yes o No x
Indicate by check mark whether the registrant (1) has filed all reports required to be filed by Section 13 or 15(d) of the Securities Exchange Act of 1934 during the preceding 12 months (or for such shorter period that the registrant was required to file such reports), and (2) has been subject to such filing requirements for the past 90 days. Yes x No o
Indicate by check mark if disclosure of delinquent filers pursuant to Item 405 of Regulation S-K is not contained herein, and will not be contained, to the best of the registrant’s knowledge, in definitive proxy or information statements incorporated by reference in Part III of this Form 10-K or any amendment to this Form 10-K. x
Indicate by check mark whether the registrant is a large accelerated filer, an accelerated filer, or a non-accelerated filer. See definition of “accelerated filer and large accelerated filer” in Rule 12b-2 of the Exchange Act.
(Check one): Large Accelerated Filer o Accelerated Filer o Non-accelerated Filer x
Indicate by check mark whether the registrant is a shell company (as defined by Rule 12b-2 of the Exchange Act). Yes o No x
The aggregate market value of the voting and non-voting common equity held by nonaffiliates as of June 30, 2006 was approximately $0.
The number of shares outstanding of the registrant’s common stock as of March 28, 2007 was 14,679,750.
DOCUMENTS INCORPORATED BY REFERENCE
Portions of the Proxy Statement for the 2007 Annual Meeting of Stockholders are incorporated by reference in Part III of this Form 10-K.
INDEX
This annual report contains forward-looking statements that are based on assumptions and may describe future plans, strategies and expectations of Fox Chase Bancorp, Inc. These forward-looking statements are generally identified by use of the words “believe,” “expect,” “intend,” “anticipate,” “estimate,” “project” or similar expressions. Fox Chase Bancorp, Inc.’s ability to predict results or the actual effect of future plans or strategies is inherently uncertain. Factors which could have a material adverse effect on the operations of Fox Chase Bancorp, Inc. and its subsidiary include, but are not limited to, changes in interest rates, national and regional economic conditions, legislative and regulatory changes, monetary and fiscal policies of the U.S. government, including policies of the U.S. Treasury and the Federal Reserve Board, the quality and composition of the loan or investment portfolios, demand for loan products, deposit flows, competition, demand for financial services in Fox Chase Bancorp, Inc.’s market area, changes in real estate market values in Fox Chase Bancorp, Inc.’s market area, changes in relevant accounting principles and guidelines and inability of third party service providers to perform. Additional factors that may affect our results are discussed in Item 1A to this annual report titled “Risk Factors” below.
These risks and uncertainties should be considered in evaluating forward-looking statements and undue reliance should not be placed on such statements. Except as required by applicable law or regulation, Fox Chase Bancorp, Inc. does not undertake, and specifically disclaims any obligation, to release publicly the result of any revisions that may be made to any forward-looking statements to reflect events or circumstances after the date of the statements or to reflect the occurrence of anticipated or unanticipated events.
Unless the context indicates otherwise, all references in this annual report to “Company,” “we,” “us” and “our” refer to Fox Chase Bancorp, Inc. and its subsidiaries.
Fox Chase Bancorp, Inc. was organized on September 29, 2006 under the laws of the United States to be a holding company for Fox Chase Bank (the “Bank”), a stock savings bank also organized under the laws of the United States. On September 29, 2006, the Company completed its initial public offering in which it sold 6,395,835 shares, or 43.57%, of its outstanding common stock to the public, including 575,446 shares purchased by the Fox Chase Bank Employee Stock Ownership Plan (the “ESOP”). An additional 8,148,915 shares, or 55.51% of the Company’s outstanding stock, were issued to Fox Chase MHC, the Company’s federal chartered holding company. Additionally, the Company contributed $150,000 in cash and issued 135,000 shares, or 0.92%, of its outstanding common stock, to the Fox Chase Bank Charitable Foundation.
Fox Chase Bancorp’s business activities are the ownership of Fox Chase Bank’s capital stock and the management of the offering proceeds it retained. Fox Chase Bancorp does not own or lease any property. Instead, it uses the premises, equipment and other property of Fox Chase Bank. Accordingly, the information set forth in this annual report, including the Consolidated Financial Statements and related financial data, relates primarily to Fox Chase Bank. Fox Chase Bancorp is subject to the regulation of the Office of Thrift Supervision.
Fox Chase Bank was originally chartered in 1867 as a Pennsylvania building and loan association under the name Fox Chase Building Association No. 2. In 1910, Fox Chase Bank converted to a federal charter. On September 29, 2006, Fox Chase Bank converted from the mutual to the mutual holding company form of organization. Fox Chase Bank operates as a community-oriented financial institution offering traditional financial services to consumers and businesses in its market areas. Fox Chase Bank attracts deposits from the general public and uses those funds to originate one- to four-family real estate, multi-family and commercial real estate, construction, commercial and consumer loans, which, with the exception of long-term fixed-rate one- to four-family real estate loans, Fox Chase Bank primarily holds for investment. Fox Chase Bank also maintains an investment portfolio. Fox Chase Bank is regulated by the Office of Thrift Supervision and its deposits are insured under the Deposit Insurance Fund administered by the Federal Deposit Insurance Corporation. Fox Chase Bank is also a member of the Federal Home Loan Bank of Pittsburgh.
1
Fox Chase Bank’s website address is www.foxchasebank.com. Information on our website should not be considered a part of this Report.
We are headquartered in Hatboro, Pennsylvania, which is approximately fifteen miles north of Center City, Philadelphia. We maintain two offices in Montgomery County, Pennsylvania, one office in Philadelphia County, Pennsylvania and three offices in Bucks County, Pennsylvania. All six of those branch offices are in the Philadelphia-Camden-Wilmington metropolitan statistical area. In 2000, we also opened two offices in the southern New Jersey shore area, one in Atlantic County and one in Cape May County. In March 2006, we opened a branch office in Marmora, New Jersey in Cape May County. In May 2006, we opened a loan production office with depository capabilities in Exton, Pennsylvania in Chester County and in July 2006, we opened a loan production office with depository capabilities in Media, Pennsylvania in Delaware County.
Philadelphia Market Area. The economy of our Philadelphia market area is predominated by the service sector. According to published statistics, the population of the three-county area served by our branches totaled 2.9 million. The economy in the Philadelphia market area has grown in recent years due to the presence of a highly-educated workforce and the diversity of the local economy as traditional employers in the manufacturing and financial services industry have been bolstered by growth in the life sciences and health care industries as well as the information technology and communication sectors. The median household and per capita income in Bucks and Montgomery counties significantly exceeds the comparable figures for Pennsylvania as a whole, while the median household and per capita income in Philadelphia county trailed the comparable figures for Pennsylvania.
New Jersey Market Area. The economy of Atlantic County is dominated by the service sector, of which the gaming industry in nearby Atlantic City is the primary employer. The economy of Cape May County is primarily geared toward tourism. According to published statistics, Atlantic County’s population in 2005 was approximately 271,000 persons and Cape May County’s population was approximately 113,000. The economy in Atlantic County has been strong in recent years as new and expanding casinos in Atlantic City along with new retail centers and entertainment venues have led to job growth and an increase in housing development. Cape May County has also benefited from the growth in and around Atlantic City, as many residents commute into that area for employment. Although the economy in this market area has been strong in recent years, median household and per capita income in Atlantic and Cape May Counties are lower than the comparable figures for New Jersey as a whole. In addition, median household income in Atlantic County was below the national average in 2005. We attribute this to several factors. First, there has been an influx of retirees with limited incomes but moderate to substantial wealth. Additionally, since this market is located outside of a major metropolitan area, average income levels are negatively affected by the small portion of high-paying, white collar jobs. In this market area, lower paying service jobs provide a relatively large portion of overall employment.
Competition
We face significant competition for the attraction of deposits and origination of loans. Our most direct competition for deposits has historically come from the several financial institutions operating in our market areas and, to a lesser extent, from other financial service companies such as brokerage firms, credit unions and insurance companies. We also face competition for investors’ funds from money market funds, mutual funds and other corporate and government securities. At June 30, 2006, which is the most recent date for which data is available from the Federal Deposit Insurance Corporation, we held approximately 0.22% of the deposits in Philadelphia-Camden-Wilmington metropolitan statistical area, which was the 40th largest market share out of the 158 financial institutions with offices in that metropolitan statistical area. In addition, banks such as Bank of America, Wachovia Bank, Sovereign Bank, Citizens Bank of PA and Commerce Bank also operate in our market areas. These institutions are significantly larger than us and, therefore, have significantly greater resources.
Our competition for loans comes primarily from financial institutions in our market areas, and, to a lesser extent, from other financial service providers such as mortgage companies and mortgage brokers. Competition for loans also comes from the increasing number of non-depository financial service companies entering the mortgage and commercial lending markets such as insurance companies, securities companies and specialty finance companies.
2
We expect competition to increase in the future as a result of legislative, regulatory and technological changes and the continuing trend of consolidation in the financial services industry. Technological advances, for example, have lowered the barriers to market entry, allowed banks and other lenders to expand their geographic reach by providing services over the Internet and made it possible for non-depository institutions to offer products and services that traditionally have been provided by banks. Changes in federal law permit affiliation among banks, securities firms and insurance companies, which promotes a competitive environment in the financial services industry. Competition for deposits and the origination of loans could limit our future growth.
Lending Activities
General. Except for the sale of longer-term, one- to four-family residential real estate loans (generally greater than fifteen years), which we sell in the secondary market, we originate loans primarily for investment purposes. The largest segments of our loan portfolio are one- to four-family residential real estate loans and home equity loans and lines of credit. Historically, we originated very little multi-family and commercial real estate loans, construction loans or commercial loans. However, in 2003, then-current management determined to emphasize multi-family and commercial real estate lending and construction lending, primarily in the southern New Jersey shore area where it had opened branch offices. However, due to a lack of expertise in these types of lending and a relative unfamiliarity with the market area, the proper documentation on these types of loans was not received and many of these loans were criticized or classified in accordance with regulatory guidelines. In 2005, new management ceased originating these loans and made significant efforts to reduce these loans made by former management from the portfolio. We have hired senior management and lenders with significant commercial lending experience and adopted new commercial credit policies. Thus, we plan to emphasize originating multi-family and commercial loans to individuals and businesses located in our primary market areas.
One- to Four-Family Residential Real Estate Loans. The largest segment of our loan portfolio is comprised of mortgage loans to enable borrowers to purchase or refinance existing homes most of which serve as the primary residence of the owner. We offer fixed-rate and adjustable-rate loans with terms up to 30 years. Borrower demand for adjustable-rate loans versus fixed-rate loans is a function of the level of interest rates, the expectations of changes in the level of interest rates, and the difference between the interest rates and loan fees offered for fixed-rate mortgage loans and the initial period interest rates and loan fees for adjustable-rate loans. The relative amount of fixed-rate mortgage loans and adjustable-rate mortgage loans that can be originated at any time is largely determined by the demand for each in a competitive environment. The loan fees, interest rates and other provisions of mortgage loans are determined by us on the basis of our own pricing criteria and competitive market conditions. Most of our loan originations result from relationships with existing or past customers, members of our local community and referrals from realtors, attorneys and builders.
While one- to four-family residential real estate loans are normally originated with up to 30-year terms, such loans typically remain outstanding for substantially shorter periods because borrowers often prepay their loans in full upon sale of the property pledged as security or upon refinancing the original loan. Therefore, average loan maturity is a function of, among other factors, the level of purchase and sale activity in the real estate market, prevailing interest rates and the interest rates payable on outstanding loans. Additionally, our current practice is generally to (1) sell to the secondary market newly originated longer-term fixed-rate one- to four-family residential real estate loans, and (2) to hold in our portfolio shorter-term fixed-rate loans and adjustable-rate loans. Generally, loans are sold to Freddie Mac with servicing retained or to other third parties, without recourse with servicing released. Occasionally, we have purchased loans and purchased participation interests in loans originated by other institutions to supplement our origination efforts.
Interest rates and payments on our adjustable-rate mortgage loans generally adjust annually after an initial fixed period of one, three or five years. Interest rates and payments on these adjustable-rate loans generally are based on the one-year constant maturity Treasury index. The maximum amount by which the interest rate may be increased is generally two percentage points per adjustment period with a lifetime interest rate cap of six percentage points over the initial interest rate of the loan.
We generally do not make conventional loans with loan-to-value ratios exceeding 95% at the time the loan is originated. At December 31, 2006, $3.8 million, or 1.3%, of our residential loans, had a loan-to-value ratio exceeding 90% of the loan. Private mortgage insurance is generally required for all loans with loan-to-value ratios in excess of 80%. We require all properties securing mortgage loans to be appraised by a Board-approved
3
independent appraiser. We generally require title insurance on all first mortgage loans. Borrowers must obtain hazard insurance, and flood insurance for loans on properties located in a flood zone, before closing the loan.
In an effort to provide financing for low- and moderate-income and first-time buyers, we offer a special home buyers program. We offer residential mortgage loans through this program to qualified individuals and originate the loans using reduced interest rates, fees and loan conditions.
Multi-Family and Commercial Real Estate Loans. We offer fixed-rate and adjustable-rate mortgage loans secured by multi-family and commercial real estate to individuals and small businesses in our primary market areas. Our multi-family and commercial real estate loans are generally secured by condominiums, apartment buildings and mixed-use properties with residential units, as well as retail space. We intend to increase this segment of our loan portfolio.
These loans are typically repaid or the term extended before maturity, in which case a new rate is negotiated to meet market conditions and an extension of the loan is executed for a new term with a new amortization schedule. We originate multi-family and commercial real estate loans with terms up to 20 years. Interest rates and payments on our adjustable-rate loans generally are based on the prime interest rate, although our policies permit interest rates to be based on the Constant Maturity Treasury Index, LIBOR or the federal funds rate. Loans are secured by first mortgages that generally do not exceed 80% of the property’s appraised value. We require all properties securing multi-family and commercial real estate loans to be appraised by a Board-approved independent licensed appraiser. Multi-family and commercial real estate loans also are generally supported by personal guarantees.
At December 31, 2006, the largest outstanding multi-family or commercial real estate loan had an outstanding balance of $6.0 million and is secured by a hotel in the southern New Jersey shore area. This loan was performing according to its original terms at December 31, 2006.
Construction Loans. We originate fixed-rate and adjustable-rate loans to individuals and, to a lesser extent, builders to finance the construction of residential dwellings. However, we had no outstanding residential construction loans at December 31, 2006. We also make construction loans for commercial development projects, including apartment buildings, restaurants, shopping centers and owner-occupied properties used for businesses. Our construction loans generally provide for the payment of interest only during the construction phase, which is usually six to twelve months for residential properties and eighteen months for commercial properties. At the end of the construction phase, the loan generally converts to a permanent mortgage loan. Loans generally can be made with a maximum loan-to-value ratio of 80% on residential construction and 65% on commercial construction at the time the loan is originated. Before making a commitment to fund a construction loan, we require an appraisal of the property by an independent licensed appraiser. We also will require an inspection of the property before disbursement of funds during the term of the construction loan.
We also originate loans secured by undeveloped land and developed land. The terms and rates of our land loans are the same as our multi-family and commercial real estate loans. Loans secured by undeveloped land or improved lots generally involve greater risks than residential mortgage lending because land loans are more difficult to evaluate. If the estimate of value proves to be inaccurate, in the event of default and foreclosure, we may be confronted with a property the value of which is insufficient to assure full repayment. Loan amounts generally do not exceed 65% (50% for undeveloped land) of the lesser of the appraised value or the purchase price.
At December 31, 2006, our largest outstanding commercial construction loan was for $4.9 million, of which $2.3 million was outstanding. This loan is secured by land and improvements in Chester County, Pennsylvania. This loan was performing in accordance with its terms at December 31, 2006.
Commercial Loans. We also offer commercial business loans to professionals, sole proprietorships and small businesses in our market area. The maximum amount of our commercial loans is limited by our in-house-loans-to one borrower limit. We intend to grow this segment of our loan portfolio.
We offer secured commercial term loans, which have a maturity of greater than one year and the payment of which is dependent on future earnings. The term for repayment of the loan will normally be limited to the lesser of the expected useful life of the asset being financed or a fixed amount of time, generally less than seven years. We also offer revolving lines of credit secured by business assets other than real estate, such as business equipment,
4
inventory and accounts receivable, letters of credit and demand loans. We originate these loans on both a fixed-rate and adjustable-rate basis with terms up to 20 years. Adjustable-rate loans are based on the prime rate, although our policies permit interest rates to be based on the Constant Maturity Treasury Index, LIBOR or the federal funds rate and adjust either monthly or annually. Where the borrower is a corporation, partnership or other entity, we generally require significant equity holders to be co-borrowers and in cases where they are not co-borrowers, we generally require personal guarantees from significant equity holders.
We also originate commercial lines of credit to finance the working capital needs of businesses to be repaid by seasonal cash flows or to provide a period of time during which the business can borrow funds for planned equipment purchases. Commercial lines of credit can be fixed-rate or adjustable-rate loans. Commercial lines of credit secured by commercial real estate generally have a term of less than seven years.
When making commercial business loans, we consider the financial statements and/or tax returns of the borrower, the borrower’s payment history of both corporate and personal debt, the debt service capabilities of the borrower, the projected cash flows of the business, the viability of the industry in which the customer operates, the value of the collateral and our assessment of management’s ability. Commercial business loans are generally secured by a variety of collateral, primarily accounts receivable, inventory and equipment, and are generally supported by personal guarantees. Depending on the collateral used to secure the loans, commercial loans are made in amounts of up to 80% of the value of the collateral securing the loan (90% for established borrowers pledging new equipment). We generally do not make unsecured commercial loans.
Consumer Loans. We offer a variety of consumer loans, including home equity loans and lines of credit, loans secured by certificate of deposits (share loans), automobile loans and unsecured overdraft lines of credit.
The procedures for underwriting consumer loans include an assessment of the applicant’s payment history on other debts and ability to meet existing obligations and payments on the proposed loan. Although the applicant’s creditworthiness is a primary consideration, the underwriting process also includes a comparison of the value of the collateral, if any, to the proposed loan amount.
We generally offer fixed-rate home equity loans with a maximum combined loan-to-value ratio of 90% and adjustable-rate lines of credit with a maximum combined loan-to-value ratio of 80%. Home equity lines of credit have adjustable-rates of interest that are based on the prime interest rate. Home equity lines of credit generally require that only interest be paid on a monthly basis and have terms up to 20 years. Interest rates on these loans typically adjust monthly. We offer fixed-rate and adjustable-rate home equity loans. Home equity loans have terms that range from one to 15 years. We hold a first mortgage position on most of the homes that secure our home equity loans and home equity lines of credit.
We also provide a consumer loan product under which we will originate a fixed-rate or adjustable-rate loan on an owner-occupied one- to four-family residence, with a loan-to-value ratio of 80% of the secured property. We will then originate a home equity loan with a loan-to-value ratio of either 10% or 15% of the secured property. The remaining 10% or 5% must be paid in cash by the borrower. This product, sometimes referred to as combination financing or a piggyback loan, eliminates the need for private mortgage insurance. However, to obtain this product, the borrower must meet our underwriting criteria with respect to the one- to four-family residential real estate loan and home equity loan.
We offer loans secured by new and used automobiles. These loans have fixed interest rates and generally have terms up to six years. We will generally offer automobile loans with a maximum loan-to-value ratio of 90% of the purchase price of the vehicle.
We also offer unsecured overdraft lines of credit to our retail customers for overdraft protection. These lines range between $500 and $7,500 and the rate and amounts are offered to customers in relation to their individual credit score. At December 31, 2006 we had 62 such loans totaling $22,000.
We offer consumer loans secured by certificates of deposit held at Fox Chase Bank with fixed interest rates and terms up to five years. We will offer such loans up to 90% of the principal balance of the certificate of deposit. For more information on our loan commitments, see Item 7, “Management’s Discussion and Analysis of Financial Condition and Results of Operations—Risk Management—Liquidity Management.”
5
Adjustable-Rate Loans. While we anticipate that adjustable-rate loans will better offset the adverse effects of an increase in interest rates as compared to fixed-rate mortgages, the increased mortgage payments required of adjustable-rate loan borrowers in a rising interest rate environment could cause an increase in delinquencies and defaults. The marketability of the underlying property also may be adversely affected in a high interest rate environment. In addition, although adjustable-rate mortgage loans help make our loan portfolio more responsive to changes in interest rates, the extent of this interest sensitivity is limited by the annual and lifetime interest rate adjustment limits.
Multi-Family and Commercial Real Estate Loans. Loans secured by multi-family and commercial real estate generally have larger balances and involve a greater degree of risk than one- to four-family residential mortgage loans. Of primary concern in multi-family and commercial real estate lending is the borrower’s creditworthiness and the feasibility and cash flow potential of the project. Payments on loans secured by income properties often depend on successful operation and management of the properties. As a result, repayment of such loans may be subject to a greater extent than residential real estate loans to adverse conditions in the real estate market or the economy. To monitor cash flows on income properties, we generally require borrowers and loan guarantors to provide annual financial statements and/or tax returns. In reaching a decision on whether to make a multi-family and commercial real estate loan, we consider the net operating income of the property, the borrower’s expertise, credit history and profitability and the value of the underlying property. We have generally required that the properties securing these real estate loans have debt service coverage ratios (the ratio of earnings before debt service to debt service) of at least 1.20x. Environmental surveys and inspections are obtained when circumstances suggest the possibility of the presence of hazardous materials. Further, in connection with our ongoing monitoring of the loan, we will review the property at least two times each year.
Construction Loans. Construction financing is generally considered to involve a higher degree of risk of loss than long-term financing on improved, occupied real estate. Risk of loss on a construction loan depends largely upon the accuracy of the initial estimate of the property’s value at completion of construction and the estimated cost (including interest) of construction. During the construction phase, a number of factors could result in delays and cost overruns. If the estimate of construction costs proves to be inaccurate, we may be required to advance funds beyond the amount originally committed to permit completion of the building. If the estimate of value proves to be inaccurate, we may be confronted, at or before the maturity of the loan, with a building having a value which is insufficient to assure full repayment. If we are forced to foreclose on a building before or at completion due to a default, there can be no assurance that we will be able to recover all of the unpaid balance of, and accrued interest on, the loan as well as related foreclosure and holding costs.
Commercial Loans. Unlike residential mortgage loans, which generally are made on the basis of the borrower’s ability to make repayment from his or her employment or other income, and which are secured by real property the value of which tends to be more easily ascertainable, commercial loans are of higher risk and typically are made on the basis of the borrower’s ability to make repayment from the cash flow of the borrower’s business. As a result, the availability of funds for the repayment of commercial loans may depend substantially on the success of the business itself. Further, any collateral securing such loans may depreciate over time, may be difficult to appraise and may fluctuate in value.
Consumer Loans. Consumer loans may entail greater risk than do residential mortgage loans, particularly in the case of consumer loans that are unsecured or secured by assets that depreciate rapidly. In such cases, repossessed collateral for a defaulted consumer loan may not provide an adequate source of repayment for the outstanding loan and the remaining deficiency often does not warrant further substantial collection efforts against the borrower. In addition, consumer loan collections depend on the borrower’s continuing financial stability, and therefore are more likely to be adversely affected by job loss, divorce, illness or personal bankruptcy. Furthermore, the application of various federal and state laws, including bankruptcy and insolvency laws, may limit the amount that can be recovered on such loans.
Loan Originations, Sales and Participations. Loan originations come from a number of sources. The primary source of loan originations are existing customers, walk-in traffic, advertising and referrals from customers. We advertise in newspapers that are widely circulated throughout our market area. Accordingly, when our rates are competitive, we attract loans throughout our market areas.
6
Before 2006, we originated loans for our portfolio. Beginning in 2006, we began selling in the secondary market almost all newly originated conforming longer-term fixed-rate one- to four-family residential real estate loans and holding in our portfolio shorter-term fixed-rate loans and adjustable-rate loans. Our decision to sell loans is based on prevailing market interest rate conditions and interest rate risk management. Generally, loans are sold to Freddie Mac with servicing retained or to other third parties without recourse, servicing released.
At December 31, 2006, we were a participating lender on three loans totaling $8.4 million, which are secured by commercial real estate, lease payments and the assets of the businesses. These loans were being serviced by the lead lender. We also had one loan totaling $10.0 million, $4.0 million of which was sold, servicing released to another lender in 2006. This loan is secured by a hotel property in the southern New Jersey shore area and is performing in accordance with the terms of the loan agreement. We expect in the future that we will continue to sell participation interests to local financial institutions, primarily on construction and commercial real estate loans that approach or exceed our lending limits or loans that are outside of our immediate market areas. We also expect to continue to purchase participation interests, primarily in commercial and industrial loans, construction loans and commercial real estate loans. On these participation interests, we would perform our own underwriting analysis before purchasing such loans and therefore believe there would be no greater risk of default on these obligations. However, in a purchased participation loan, we would not service the loan and thus are subject to the policies and practices of the lead lender with regard to monitoring delinquencies, pursuing collections and instituting foreclosure proceedings. In assessing whether to participate, we would require review of all of the documentation relating to any loan in which we participate, including any annual financial statements provided by a borrower. Additionally, we would require periodic updates on the loan from the lead lender.
We have not historically purchased any whole loans. However, we would entertain doing so if a loan was presented to us that met our underwriting criteria and fit within our interest rate strategy.
Loan Approval Procedures and Authority. Our lending activities follow written, non-discriminatory, underwriting standards and loan origination procedures established by our board of directors and management. The board has granted authority to approve residential and consumer loans up to $300,000 to the Assistant Manager of the Consumer Lending Department and up to $450,000 to the Vice President of Residential Mortgage and the Vice President of Consumer Lending. Loans in excess of these amounts up to $3.0 million require the approval by the Officers Loan Committee, consisting of the President and Chief Executive Officer, the Chief Financial Officer, the Chief Credit Officer and the Chief Lending Officer and other experienced lenders and officers as appointed by the Board from time to time.
The Board has granted authority to approve commercial loans to certain employees up to prescribed limits, depending on the officer’s experience and tenure. The Board also granted loan approval authority to the Officers Loan Committee, consisting of the President and Chief Executive Officer, the Chief Financial Officer, the Chief Credit Officer and the Chief Lending Officer and other experienced lenders and officers as appointed by the Board from time to time. Commercial loans in excess of $4.5 million require the approval of the Executive Committee of the Board of Directors.
Loans to One Borrower. The maximum amount that we may lend to one borrower and the borrower’s related entities generally is limited, by regulation, to 15% of our stated capital and reserves. At December 31, 2006, our general regulatory limit on loans to one borrower was $14.5 million. At that date, our largest lending relationship was a $6.0 million loan secured by a hotel in the southern New Jersey shore area. This loan was performing according to its terms at December 31, 2006. At December 31, 2006, our second largest lending relationship consisted of three loans to one borrower totaling $4.3 million. All three of the loans were secured by commercial real estate, two in the Philadelphia metropolitan area and one in the southern New Jersey shore area. All three loans were performing according to their terms on December 31, 2006.
Loan Commitments. We issue commitments for fixed- and adjustable-rate mortgage loans conditioned upon the occurrence of certain events. Commitments to originate mortgage loans are legally binding agreements to lend to our customers. Generally, our mortgage loan commitments expire after 30 days.
7
The Board of Directors reviews and approves our investment policy annually. The Risk Management Committee of the Board of Directors is responsible for establishing policies for conducting investment activities, including the establishment of risk limits. The Risk Management Committee of the Board of Directors reviews investment transactions on a monthly basis and monitors the composition and performance of the investment portfolio on a quarterly basis. The Board has directed the Chief Financial Officer to implement the investment policy.
The investment portfolio is primarily viewed as a source of liquidity. The investment portfolio management policy is designed to:
1. absorb funds when loan demand and deposit outflows are low and infuse funds into loans when loan demand is high and to fund deposit outflows;
2. generate a favorable return on investments;
3. provide income consistent with our liquidity and safety requirements, while providing a suitable balance of quality and diversification to our balance sheet;
4. have collateral available for pledging requirements; and
5. provide a medium for the implementation of certain interest rate risk management measures
intended to establish and maintain an appropriate balance between the sensitivity to changes in interest rates.
We have authority to invest in various types of liquid assets, including U.S. Treasury obligations, securities of various federal agencies and municipal governments, mortgage and asset-backed securities, corporate debt instruments, trust preferred securities and certificates of deposit of federally insured institutions. Within certain regulatory limits, we also may invest a percentage of our capital in mutual funds. We also are required to maintain an investment in Federal Home Loan Bank of Pittsburgh stock. While we have the authority under applicable law to invest in derivative securities, our investment policy does not presently permit this investment. We had no investments in derivative securities at December 31, 2006.
At December 31, 2006, our investment portfolio totaled $228.4 million and consisted primarily of mortgage-backed securities issued by Fannie Mae, Freddie Mac and Ginnie Mae, securities of municipal governments and corporate debt securities. Corporate debt securities, such as bonds, notes and commercial paper, are obligations of a company to pay holders a fixed amount, with interest, over a predetermined period of time. Such investments tend to carry a higher rate of interest compared to other fixed income instruments, like certificates of deposit and U.S. Treasury securities, which offsets the additional risk of these investments, which are not backed by any government or agency guarantee. Also, corporate debt securities are available with different maturity dates, issuers and rates of interest, which allows us flexibility in structuring our portfolio. At December 31, 2006, we held $1.7 million in private issued mortgage-backed securities. Private issued mortgage-backed securities are “whole loan collateralized mortgage securities” that are formed from jumbo mortgages that have all the same characteristics of conforming mortgages, except for their size, issued by agency guarantors. To make up for the lack of an agency guarantor, whole loans are structured with subordinated tranches designed to achieve a triple A rating by a major rating service. The investor pays a lower price for the security but receives a higher yield.
Deposit Activities and Other Sources of Funds
General. Deposits and loan repayments are the major sources of our funds for lending and other investment purposes. Loan repayments are a relatively stable source of funds, while deposit inflows and outflows and loan prepayments are significantly influenced by general interest rates and money market conditions.
Deposit Accounts. Substantially all of our depositors are residents of the Commonwealth of Pennsylvania and the State of New Jersey. We attract deposits in our market area through advertising and through the offering a broad selection of deposit instruments, including noninterest-bearing demand accounts (such as checking accounts), interest-bearing accounts (such as NOW and money market accounts), regular savings accounts and certificates of
8
deposit. At December 31, 2006, we did not utilize brokered deposits. However, our liquidity policy provides for the use of brokered deposits as an alternative source of funds. Deposit account terms vary according to the minimum balance required, the time periods the funds must remain on deposit and the interest rate, among other factors. In determining the terms of our deposit accounts, we consider the rates offered by our competition, our liquidity needs, profitability to us, matching deposit and loan products and customer preferences and concerns. We generally review our deposit mix and pricing weekly. Historically, our strategy was to offer competitive rates and to be the market leader for rates on certain deposit products. Our current strategy is to offer competitive rates and to be in the middle to upper end of the market for rates on a variety of deposit products.
We also offer a variety of deposit accounts designed for the businesses operating in our market area. Our business banking deposit products include a commercial checking account and a checking account specifically designed for small businesses. Additionally, we offer sweep accounts and money market accounts for businesses. We are seeking to increase our commercial deposits through the offering of these products.
Borrowings. In recent years, we have not relied upon advances from the Federal Home Loan Bank of Pittsburgh to supplement our supply of lendable funds or to meet deposit withdrawal requirements. The $30.0 million of Federal Home Loan Bank advances outstanding at December 31, 2006 were borrowed in 2001. We may rely more heavily on wholesale funding in addition to retail funds to leverage the balance sheet and accelerate growth. However, due to the potential volatility of wholesale funding, we have developed ratios and limits to measure our exposure to wholesale funding.
The Federal Home Loan Bank functions as a central reserve bank providing credit for its member financial institutions. As a member, we are required to own capital stock in the Federal Home Loan Bank and are authorized to apply for advances on the security of such stock and certain of our whole first mortgage loans and other assets (principally securities which are obligations of, or guaranteed by, the United States), provided certain standards related to creditworthiness have been met. Advances are made under several different programs, each having its own interest rate and range of maturities. Depending on the program, limitations on the amount of advances are based either on a fixed percentage of an institution’s net worth or on the Federal Home Loan Bank’s assessment of the institution’s creditworthiness.
Personnel
As of December 31, 2006, we had 131 full-time employees and 20 part-time employees. We believe our relationship with our employees is good.
Subsidiaries
Fox Chase Bank’s only active subsidiary is Fox Chase Financial, Inc., which was formed in February 1999. As a Delaware-chartered corporation investment company, Fox Chase Financial’s purpose is to manage and hold investment securities.
General
Fox Chase Bancorp, as a federally chartered corporation, is subject to reporting to and regulation by the Office of Thrift Supervision. Fox Chase Bancorp also is subject to the rules and regulations of the Securities and Exchange Commission under the federal securities laws. Fox Chase Bank is subject to extensive regulation, examination and supervision by the Office of Thrift Supervision, as its primary federal regulator, and the Federal Deposit Insurance Corporation, as its deposits insurer. Fox Chase Bank is a member of the Federal Home Loan Bank System and its deposit accounts are insured up to applicable limits by the Deposit Insurance Fund managed by the Federal Deposit Insurance Corporation. Fox Chase Bank must file reports with the Office of Thrift Supervision and the Federal Deposit Insurance Corporation concerning its activities and financial condition in addition to obtaining regulatory approvals prior to entering into certain transactions such as mergers with, or acquisitions of, other financial institutions. The Office of Thrift Supervision and/or the Federal Deposit Insurance Corporation conduct periodic examinations to test Fox Chase Bank’s safety and soundness and compliance with various regulatory requirements. This regulation and supervision establishes a comprehensive framework of activities in which an institution can engage and is intended primarily for the protection of the insurance fund and depositors. As
9
a federal mutual holding company, Fox Chase MHC is also required by federal law to report to, and otherwise comply with the rules and regulations of, the Office of Thrift Supervision. The regulatory structure also gives the regulatory authorities extensive discretion in connection with their supervisory and enforcement activities and examination policies, including policies with respect to the classification of assets and the establishment of adequate loan loss reserves for regulatory purposes. Any change in such policies, whether by the Office of Thrift Supervision, the Federal Deposit Insurance Corporation or Congress, could have a material adverse impact on Fox Chase Bancorp, Fox Chase MHC and Fox Chase Bank and their operations.
Certain of the regulatory requirements that are applicable to Fox Chase Bank, Fox Chase Bancorp and Fox Chase MHC are described below or elsewhere in this document. The description of statutory provisions and regulations applicable to savings institutions and their holding companies set forth below and elsewhere in this document does not purport to be a complete description of such statutes and regulations and their effects on Fox Chase Bank, Fox Chase Bancorp and Fox Chase MHC and is qualified in its entirety by reference to the actual statutes and regulations.
Regulation of Federal Savings Associations
Business Activities. Federal law and regulations govern the activities of federal savings banks, such as Fox Chase Bank. These laws and regulations delineate the nature and extent of the activities in which federal savings banks may engage. In particular, certain lending authority for federal savings banks, e.g., commercial, non-residential real property loans and consumer loans, is limited to a specified percentage of the institution’s capital or assets.
Capital Requirements. The Office of Thrift Supervision’s capital regulations require federal savings institutions to meet three minimum capital standards: a 1.5% tangible capital to total assets ratio, a 4% leverage ratio (3% for institutions receiving the highest rating on the CAMELS examination rating system) and an 8% risk-based capital ratio. In addition, the prompt corrective action standards discussed below also establish, in effect, a minimum 2% tangible capital standard, a 4% leverage ratio (3% for institutions receiving the highest rating on the CAMELS system) and, together with the risk-based capital standard itself, a 4% Tier 1 risk-based capital standard. The Office of Thrift Supervision regulations also require that, in meeting the tangible, leverage and risk-based capital standards, institutions must generally deduct investments in and loans to subsidiaries engaged in activities that are not permissible for a national bank.
The risk-based capital standard requires federal savings institutions to maintain Tier 1 (core) and total capital (which is defined as core capital and supplementary capital) to risk-weighted assets of at least 4% and 8%, respectively. In determining the amount of risk-weighted assets, all assets, including certain off-balance sheet assets, recourse obligations, residual interests and direct credit substitutes, are multiplied by a risk-weight factor of 0% to 100%, assigned by the Office of Thrift Supervision capital regulation based on the risks believed inherent in the type of asset. Core (Tier 1) capital is generally defined as common stockholders’ equity (including retained earnings), certain noncumulative perpetual preferred stock and related surplus and minority interests in equity accounts of consolidated subsidiaries less intangibles other than certain mortgage servicing rights and credit card relationships. The components of supplementary (Tier 2) capital currently include cumulative preferred stock, long-term perpetual preferred stock, mandatory convertible securities, subordinated debt and intermediate preferred stock, the allowance for loan and lease losses limited to a maximum of 1.25% of risk-weighted assets and up to 45% of unrealized gains on available-for-sale equity securities with readily determinable fair market values. Overall, the amount of supplementary capital included as part of total capital cannot exceed 100% of core capital.
The Office of Thrift Supervision also has authority to establish individual minimum capital requirements in appropriate cases upon a determination that an institution’s capital level is or may become inadequate in light of the particular circumstances. At December 31, 2006, Fox Chase Bank met each of these capital requirements.
Prompt Corrective Regulatory Action. The Office of Thrift Supervision is required to take certain supervisory actions against undercapitalized institutions, the severity of which depends upon the institution’s degree of undercapitalization. Generally, a savings institution that has a ratio of total capital to risk weighted assets of less than 8%, a ratio of Tier 1 (core) capital to risk-weighted assets of less than 4% or a ratio of core capital to total assets of less than 4% (3% or less for institutions with the highest examination rating) is considered to be “undercapitalized.” A savings institution that has a total risk-based capital ratio less than 6%, a Tier 1 capital ratio of less than 3% or a leverage ratio that is less than 3% is considered to be “significantly undercapitalized” and a
10
savings institution that has a tangible capital to assets ratio equal to or less than 2% is deemed to be “critically undercapitalized.” Subject to a narrow exception, the Office of Thrift Supervision is required to appoint a receiver or conservator within specified time frames for an institution that is “critically undercapitalized.” The regulation also provides that a capital restoration plan must be filed with the Office of Thrift Supervision within 45 days of the date a savings institution is deemed to have received notice that it is “undercapitalized,” “significantly undercapitalized” or “critically undercapitalized.” Compliance with the plan must be guaranteed by any parent holding company in an amount of up to the lessor of 5% of the savings institution’s total assets when it was deemed to be undercapitalized or the amount necessary to achieve compliance with applicable capital regulations. In addition, numerous mandatory supervisory actions become immediately applicable to an undercapitalized institution, including, but not limited to, increased monitoring by regulators and restrictions on growth, capital distributions and expansion. The Office of Thrift Supervision could also take any one of a number of discretionary supervisory actions, including the issuance of a capital directive and the replacement of senior executive officers and directors. “Significantly undercapitalized” and “critically undercapitalized” institutions are subject to more extensive mandatory regulatory actions.
Loans to One Borrower. Federal law provides that savings institutions are generally subject to the limits on loans to one borrower applicable to national banks. Subject to certain exceptions, savings institution may not make a loan or extend credit to a single or related group of borrowers in excess of 15% of its unimpaired capital and surplus. An additional amount may be lent, equal to 10% of unimpaired capital and surplus, if secured by specified readily-marketable collateral.
Standards for Safety and Soundness. The federal banking agencies have adopted Interagency Guidelines prescribing Standards for Safety and Soundness. The guidelines set forth the safety and soundness standards that the federal banking agencies use to identify and address problems at insured depository institutions before capital becomes impaired. If the Office of Thrift Supervision determines that a savings institution fails to meet any standard prescribed by the guidelines, the Office of Thrift Supervision may require the institution to submit an acceptable plan to achieve compliance with the standard.
Limitation on Capital Distributions. Office of Thrift Supervision regulations impose limitations upon all capital distributions by a savings institution, including cash dividends, payments to repurchase its shares and payments to stockholders of another institution in a cash-out merger. Under the regulations, an application to and the prior approval of the Office of Thrift Supervision is required before any capital distribution if the institution does not meet the criteria for “expedited treatment” of applications under Office of Thrift Supervision regulations (i.e., generally, examination and Community Reinvestment Act ratings in the two top categories), the total capital distributions for the calendar year exceed net income for that year plus the amount of retained net income for the preceding two years, the institution would be undercapitalized following the distribution or the distribution would otherwise be contrary to a statute, regulation or agreement with the Office of Thrift Supervision. If an application is not required, the institution must still provide prior notice to the Office of Thrift Supervision of the capital distribution if, like Fox Chase Bank, it is a subsidiary of a holding company. If Fox Chase Bank’s capital were ever to fall below its regulatory requirements or the Office of Thrift Supervision notified it that it was in need of increased supervision, Fox Chase Bank’s ability to make capital distributions could be restricted. In addition, the Office of Thrift Supervision could prohibit a proposed capital distribution by any institution, which would otherwise be permitted by the regulation, if the Office of Thrift Supervision determines that such distribution would constitute an unsafe or unsound practice.
Qualified Thrift Lender Test. Federal law requires savings institutions to meet a qualified thrift lender test. Under the test, a savings institution is required to either qualify as a “domestic building and loan association” under the Internal Revenue Code or maintain at least 65% of its “portfolio assets” (total assets less: (i) specified liquid assets up to 20% of total assets; (ii) intangibles, including goodwill; and (iii) the value of property used to conduct business) in certain “qualified thrift investments” (primarily residential mortgages and related investments, including certain mortgage-backed securities) in at least 9 months out of each 12-month period. Legislation has expanded the extent to which education loans, credit card loans and small business loans may be considered “qualified thrift investments.”
A savings institution that fails the qualified thrift lender test is subject to certain operating restrictions and may be required to convert to a bank charter. As of December 31, 2006, Fox Chase Bank maintained 81.5% of its portfolio assets in qualified thrift investments and, therefore, met the qualified thrift lender test.
11
Transactions with Related Parties. Fox Chase Bank’s authority to engage in transactions with “affiliates” (e.g., any entity that controls or is under common control with an institution, including Fox Chase MHC and Fox Chase Bancorp and its non-savings institution subsidiaries) is limited by federal law. The aggregate amount of covered transactions with any individual affiliate is limited to 10% of the capital and surplus of the savings institution. The aggregate amount of covered transactions with all affiliates is limited to 20% of the savings institution’s capital and surplus. Certain transactions with affiliates are required to be secured by collateral in an amount and of a type specified in federal law. The purchase of low quality assets from affiliates is generally prohibited. Transactions with affiliates must be on terms and under circumstances that are at least as favorable to the institution as those prevailing at the time for comparable transactions with non-affiliated companies. In addition, savings institutions are prohibited from lending to any affiliate that is engaged in activities that are not permissible for bank holding companies and no savings institution may purchase the securities of any affiliate other than a subsidiary.
The Sarbanes-Oxley Act of 2002 generally prohibits loans by Fox Chase Bancorp to its executive officers and directors. However, the Sarbanes-Oxley Act contains a specific exemption from such prohibition for loans by Fox Chase Bank to its executive officers and directors in compliance with federal banking laws. Under such laws, Fox Chase Bank’s authority to extend credit to executive officers, directors and 10% shareholders (“insiders”), as well as entities such persons control, is limited. The law limits both the individual and aggregate amount of loans Fox Chase Bank may make to insiders based, in part, on Fox Chase Bank’s capital position and requires certain board approval procedures to be followed. Such loans are required to be made on terms substantially the same as those offered to unaffiliated individuals and not involve more than the normal risk of repayment. There is an exception for loans made pursuant to a benefit or compensation program that is widely available to all employees of the institution and does not give preference to insiders over other employees.
Enforcement. The Office of Thrift Supervision has primary enforcement responsibility over federal savings institutions and has the authority to bring actions against the institution and all institution-affiliated parties, including stockholders, and any attorneys, appraisers and accountants who knowingly or recklessly participate in wrongful action likely to have an adverse effect on an insured institution. Formal enforcement action may range from the issuance of a capital directive or cease and desist order to removal of officers and/or directors to institution of receivership, conservatorship or termination of deposit insurance. Civil penalties cover a wide range of violations and can amount to $25,000 per day, or even $1 million per day in especially egregious cases. The Federal Deposit Insurance Corporation has authority to recommend to the Director of the Office of Thrift Supervision that enforcement action be taken with respect to a particular savings institution. If action is not taken by the Director, the Federal Deposit Insurance Corporation has authority to take such action under certain circumstances. Federal law also establishes criminal penalties for certain violations.
Assessments. Federal savings banks are required to pay assessments to the Office of Thrift Supervision to fund the agency’s operations. The general assessments, paid on a semi-annual basis, are based upon the savings institution’s (including consolidated subsidiaries) total assets, condition and complexity of portfolio. The Office of Thrift Supervision assessments paid by Fox Chase Bank for the year ended December 31, 2006 totaled $212,000.
Insurance of Deposit Accounts. Fox Chase Bank’s deposits are insured up to applicable limits by the Deposit Insurance Fund of the Federal Deposit Insurance Corporation. The Deposit Insurance Fund is the successor to the Bank Insurance Fund and the Savings Association Insurance Fund, which were merged in 2006. The Federal Deposit Insurance Corporation recently amended its risk-based assessment system for 2007 to implement authority granted by the Federal Deposit Insurance Reform Act of 2005 (the “Reform Act”). Under the revised system, insured institutions are assigned to one of four risk categories based on supervisory evaluations, regulatory capital levels and certain other factors. An institution’s assessment rate depends upon the category to which it is assigned. Risk category I, which contains the least risky depository institutions, is expected to include more than 90% of all institutions. Unlike the other categories, Risk Category I contains further risk differentiation based on the Federal Deposit Insurance Corporation’s analysis of financial ratios, examination component ratings and other information. Assessment rates are determined by the Federal Deposit Insurance Corporation and currently range from five to seven basis points for the healthiest institutions (Risk Category I) to 43 basis points of assessable deposits for the riskiest (Risk Category IV). The Federal Deposit Insurance Corporation may adjust rates uniformly from one quarter to the next, except that no single adjustment can exceed three basis points.
The Reform Act also provided for a one-time credit for eligible institutions based on their assessment base as of December 31, 1996. Subject to certain limitations with respect to institutions that are exhibiting weaknesses,
12
credits can be used to offset assessments until exhausted. Fox Chase Bank’s one-time credit is expected to approximate $588,000. The Reform Act also provided for the possibility that the Federal Deposit Insurance Corporation may pay dividends to insured institutions once the Deposit Insurance Fund reserve ratio equals or exceeds 1.35% of estimated insured deposits.
In addition to the assessment for deposit insurance, institutions are required to make payments on bonds issued in the late 1980s by the Financing Corporation to recapitalize a predecessor deposit insurance fund. This payment is established quarterly and during the calendar year ended December 31, 2006 averaged 1.28 basis points of assessable deposits.
The Reform Act provided the Federal Deposit Insurance Corporation with authority to adjust the Deposit Insurance Fund ratio to insured deposits within a range of 1.15% and 1.50%, in contrast to the prior statutorily fixed ratio of 1.25%. The ratio, which is viewed by the Federal Deposit Insurance Corporation as the level that the fund should achieve, was established by the agency at 1.25% for 2007.
The Federal Deposit Insurance Corporation has authority to increase insurance assessments. A significant increase in insurance premiums would likely have an adverse effect on our operating expenses and results of operations. Management cannot predict what insurance assessment rates will be in the future.
Insurance of deposits may be terminated by the Federal Deposit Insurance Corporation upon a finding that the institution has engaged in unsafe or unsound practices, is in an unsafe or unsound condition to continue operations or has violated any applicable law, regulation, rule, order or condition imposed by the Federal Deposit Insurance Corporation or the Office of Thrift Supervision. The management of Fox Chase Bank does not know of any practice, condition or violation that might lead to termination of deposit insurance.
Federal Home Loan Bank System. Fox Chase Bank is a member of the Federal Home Loan Bank System, which consists of 12 regional Federal Home Loan Banks. The Federal Home Loan Bank provides a central credit facility primarily for member institutions. Fox Chase Bank, as a member of the Federal Home Loan Bank of Pittsburgh, is required to acquire and hold shares of capital stock in that Federal Home Loan Bank. Fox Chase Bank was in compliance with this requirement with an investment in Federal Home Loan Bank stock at December 31, 2006 of $4.4 million.
The Federal Home Loan Banks were required to provide funds for the resolution of insolvent thrifts in the late 1980s and are required to contribute funds for affordable housing programs. These requirements could reduce the amount of dividends that the Federal Home Loan Banks pay to their members and could also result in the Federal Home Loan Banks imposing a higher rate of interest on advances to their members. If dividends were reduced, or interest on future Federal Home Loan Bank advances increased, our net interest income would likely also be reduced.
Federal Reserve System. The Federal Reserve Board regulations require savings institutions to maintain noninterest earning reserves against their transaction accounts (primarily Negotiable Order of Withdrawal (NOW) and regular checking accounts). The regulations generally provide that reserves be maintained against aggregate transaction accounts as follows: a 3% reserve ratio is assessed on net transaction accounts up to and including $45.8 million; a 10% reserve ratio is applied above $45.8 million. The first $8.5 million of otherwise reservable balances are exempted from the reserve requirements. The amounts are adjusted annually. Fox Chase Bank complies with the foregoing requirements.
General. Fox Chase Bancorp and Fox Chase MHC are savings and loan holding companies within the meaning of federal law. As such, they are registered with the Office of Thrift Supervision and are subject to Office of Thrift Supervision regulations, examinations, supervision, reporting requirements. In addition, the Office of Thrift Supervision has enforcement authority over Fox Chase Bancorp and Fox Chase MHC and their non-savings institution subsidiaries. Among other things, this authority permits the Office of Thrift Supervision to restrict or prohibit activities that are determined to be a serious risk to Fox Chase Bank.
Activities Restrictions Applicable to Mutual Holding Companies. Pursuant to federal law and Office of Thrift Supervision regulations, a mutual holding company, such as Fox Chase MHC, may engage in the following
13
activities: (i) investing in the stock of a savings association; (ii) acquiring a mutual association through the merger of such association into a savings association subsidiary of such holding company or an interim savings association subsidiary of such holding company; (iii) merging with or acquiring another holding company, one of whose subsidiaries is a savings association; (iv) investing in a corporation, the capital stock of which is available for purchase by a savings association under federal law or under the law of any state where the subsidiary savings association or associations share their home offices; (v) furnishing or performing management services for a savings association subsidiary of such company; (vi) holding, managing or liquidating assets owned or acquired from a savings subsidiary of such company; (vii) holding or managing properties used or occupied by a savings association subsidiary of such company properties used or occupied by a savings association subsidiary of such company; (viii) acting as trustee under deeds of trust; (ix) any other activity (A) that the Federal Reserve Board, by regulation, has determined to be permissible for bank holding companies under Section 4(c) of the Bank Holding Company Act, unless the Office of Thrift Supervision, by regulation, prohibits or limits any such activity for savings and loan holding companies or (B) in which multiple savings and loan holding companies were authorized (by regulation) to directly engage on March 5, 1987; and (x) purchasing, holding, or disposing of stock acquired in connection with a qualified stock issuance if the purchase of such stock by such savings and loan holding company is approved by the Office of Thrift Supervision.
The Gramm-Leach Bliley Act of 1999 was designed to modernize the regulation of the financial services industry by expanding the ability of bank holding companies to affiliate with other types of financial services companies such as insurance companies and investment banking companies. The legislation also expanded the activities permitted for mutual savings and loan holding companies to also include any activity permitted a “financial holding company” under the legislation, including a broad array of insurance and securities activities.
Federal law prohibits a savings and loan holding company, including a federal mutual holding company, from, directly or indirectly or through one or more subsidiaries, acquiring more than 5% of the voting stock of another savings institution, or holding company thereof, without prior written approval of the Office of Thrift Supervision. Federal law also prohibits a savings and loan holding company from acquiring or retaining, with certain exceptions, more than 5% of a non-subsidiary holding company or savings association. A savings and loan holding company is also prohibited from acquiring more than 5% of a company engaged in activities other than those authorized by federal law; or acquiring or retaining control of a depository institution that is not insured by the Federal Deposit Insurance Corporation. In evaluating applications by holding companies to acquire savings institutions, the Office of Thrift Supervision must consider the financial and managerial resources and future prospects of the company and institution involved, the effect of the acquisition on the risk to the insurance funds, the convenience and needs of the community and competitive factors.
The Office of Thrift Supervision is prohibited from approving any acquisition that would result in a multiple savings and loan holding company controlling savings institutions in more than one state, except: (i) the approval of interstate supervisory acquisitions by savings and loan holding companies, and (ii) the acquisition of a savings association in another state if the laws of the state of the target savings institution specifically permit such acquisitions. The states vary in the extent to which they permit interstate savings and loan holding company acquisitions.
If the savings institution subsidiary of a savings and loan holding company fails to meet the qualified thrift lender test set forth in federal law, the holding company must register with the Federal Reserve Board as a bank holding company within one year of the savings institution’s failure to so qualify.
Although savings and loan holding companies are not currently subject to regulatory capital requirements or specific restrictions on the payment of dividends or other capital distributions, federal regulations do prescribe such restrictions on subsidiary savings institutions. Fox Chase Bank must notify the Office of Thrift Supervision 30 days before declaring any dividend. In addition, the financial impact of a holding company on its subsidiary institution is a matter that is evaluated by the Office of Thrift Supervision and the agency has authority to order cessation of activities or divestiture of subsidiaries deemed to pose a threat to the safety and soundness of the institution.
Stock Holding Company Subsidiary Regulation. The Office of Thrift Supervision has adopted regulations governing the two-tier mutual holding company form of organization and subsidiary stock holding companies that are controlled by mutual holding companies. Fox Chase Bancorp is the stock holding company subsidiary of Fox Chase MHC. Fox Chase Bancorp is permitted to engage in activities that are permitted for Fox Chase MHC subject
14
to the same restrictions and conditions. Finally, the Office of Thrift Supervision regulations maintain that the stock holding company subsidiary must be federally chartered for supervisory reasons.
Waivers of Dividends by Fox Chase MHC. Office of Thrift Supervision regulations require Fox Chase MHC to notify the Office of Thrift Supervision if it proposes to waive receipt of dividends from Fox Chase Bancorp. The Office of Thrift Supervision reviews dividend waiver notices on a case-by-case basis, and, in general, does not object to any such waiver if: (i) the waiver would not be detrimental to the safe and sound operation of the savings institution; and (ii) the mutual holding company’s board of directors determines that such waiver is consistent with such directors’ fiduciary duties to the mutual holding company’s members.
Conversion of Fox Chase MHC to Stock Form. Office of Thrift Supervision regulations permit Fox Chase MHC to convert from the mutual form of organization to the capital stock form of organization. There can be no assurance when, if ever, a conversion transaction will occur, and the Board of Directors has no current intention or plan to undertake a conversion transaction. In a conversion transaction, a new holding company would be formed as the successor to Fox Chase Bancorp, Fox Chase MHC’s corporate existence would end, and certain depositors of Fox Chase Bank would receive the right to subscribe for additional shares of the new holding company. In a conversion transaction, each share of common stock held by stockholders other than Fox Chase MHC would be automatically converted into a number of shares of common stock of the new holding company based on an exchange ratio determined at the time of conversion that ensures that stockholders other than Fox Chase MHC own the same percentage of common stock in the new holding company as they owned in Fox Chase Bancorp immediately before conversion. The total number of shares held by stockholders other than Fox Chase MHC after a conversion transaction would be increased by any purchases by such stockholders in the stock offering conducted as part of the conversion transaction.
Acquisition of Control. Under the federal Change in Bank Control Act, a notice must be submitted to the Office of Thrift Supervision if any person (including a company), or group acting in concert, seeks to acquire “control” of a savings and loan holding company or savings institution. Under certain circumstances, a change in control may occur, and prior notice is required, upon the acquisition of 10% or more of the outstanding voting stock of the savings and loan holding company or savings institutions unless the Office of Thrift Supervision has found that the acquisition will not result in a change in control of the company. Under the Change in Bank Control Act, the Office of Thrift Supervision has 60 days from the filing of a complete notice to act, taking into consideration certain factors, including the financial and managerial resources of the acquirer and the anti-trust effects of the acquisition. Any company that so acquires control would then be subject to regulation as a savings and loan holding company.
EXECUTIVE OFFICERS OF THE REGISTRANT
The Board of Directors annually elects the executive officers of Fox Chase MHC, Fox Chase Bancorp and Fox Chase Bank, who serve at the Board’s discretion. Our executive officers are:
Name |
| Position |
|
|
|
Thomas M. Petro |
| President and Chief Executive Officer of Fox Chase |
|
|
|
Jerry D. Holbrook |
| Chief Financial Officer and Secretary of Fox Chase |
|
|
|
Keiron G. Lynch |
| Executive Vice President and Chief Administrative |
|
|
|
David C. Kowalek |
| Executive Vice President and Chief Credit Officer of |
15
|
| |
James V. Schermerhorn |
| Executive Vice President and Chief Lending Officer
|
|
|
|
Richard J. Fuchs |
| Executive Vice President of Retail Banking of Fox Chase Bank |
Below is information regarding our executive officers who are not also directors. Unless otherwise stated, each executive officer has held his or her current position for at least the last five years. Ages presented are as of December 31, 2006.
Jerry D. Holbrook, CMA, has served as Executive Vice President and Chief Financial Officer since 2005. From 2003 to 2005, Mr. Holbrook was Executive Vice President, Chief Financial Officer and Corporate Secretary for Northeast Pennsylvania Financial Corp. and its principal subsidiary First Federal Bank, a public thrift institution. Previously, Mr. Holbrook served as Chief Financial Officer for E-Duction, Inc., a financial services start-up. Previously, he was Senior Vice President of Finance at First USA Bank (now part of J.P. Morgan Chase) where he managed the asset/liability management committee and was responsible for securitization planning and debt issuances for a $70 billion credit card portfolio. He began his banking career with WSFS Financial Corp. where he served as Senior Vice President and Controller. Mr. Holbrook holds a B.S. in Accounting from the University of Kentucky. Age 51.
Keiron G. Lynch, CTP, has served as Executive Vice President and Chief Administrative Officer since 2005. From 1999 to 2005, Mr. Lynch was Vice President of Global Visa Commerce Product Development for Visa International. Previously, he was Director of Delivery for The Source2 Group, LLC, a joint venture between Mellon Bank and MCI Systemhouse that provided outsourced accounts payable and accounts receivables services to companies nationwide. Mr. Lynch held a number of leadership positions with Mellon Bank over 17 years culminating as Vice President and Director of New Product Development for Mellon Bank’s Global Cash Management division. Mr. Lynch holds a B.A. in Economics from Duke University. Age 50.
David C. Kowalek has served as Executive Vice President and Chief Credit Officer since 2005. From 2004 to 2005, Mr. Kowalek was Senior Vice President and Chief Credit Officer for First Federal Bank, a public thrift institution. From 1987 to 2004, Mr. Kowalek held various credit and lending leadership positions with Wachovia Bank and predecessor financial institutions culminating as Senior Loan Officer responsible for a multi-state region in the mid-Atlantic area. He began his career at Chase Manhattan Bank. Mr. Kowalek holds an MBA from Adelphi University and a B.S. in Economics and Mathematics from Wilkes University. Age 53.
James V. Schermerhorn has served as Executive Vice President and Chief Lending Officer since 2005. From 2004 to 2005, Mr. Schermerhorn was Managing Director of Penn Mezzanine Fund in King of Prussia, Pennsylvania. From 2003 to 2004, he was Regional Vice President for Patriot Bank. Previously he was Executive Vice President and Chief Lending Officer for Republic First Bank. Mr. Schermerhorn held a number of leadership positions with Mellon Bank over 29 years including Managing Director of National Business Banking and Regional Middle Market Lending Manager for Mellon East. He began his career with Girard Bank. Mr. Schermerhorn holds a B.A. in Economics and Accounting from Muhlenberg College and is a graduate of the Stonier Graduate School of Banking. Age 63.
Richard J. Fuchs has served as Executive Vice President of Retail Banking since April 2006. Mr. Fuchs joined Fox Chase Bank after 30 years with The Bryn Mawr Trust Company in Bryn Mawr, Pennsylvania where he was the Senior Vice President of the Community Banking Division and from 2000 to 2005 also served as the President and CEO of The Bryn Mawr Brokerage Company. Mr. Fuchs attended Villanova University where he majored in Civil Engineering and is a graduate of the Stonier Graduate School of Banking. Age 57.
Our relatively high level of nonperforming assets and classified assets expose us to increased lending risks. Further, our allowance for loan losses may prove to be insufficient to absorb losses in our loan portfolio.
Historically, we originated very few multi-family and commercial real estate loans, construction loans or commercial loans. However, in 2003, then-current management determined to emphasize multi-family and
16
commercial real estate lending and construction lending, primarily in the southern New Jersey shore area where it had opened branch offices. However, due to a lack of expertise in these types of lending and a relative unfamiliarity with the market area, these loans were not properly underwritten, including receiving inadequate documentation, and, as a result, many of these loans were criticized or classified in accordance with regulatory guidelines. This type of lending and the absence of adequate underwriting, credit and collection policies and internal controls contributed to the issuance by the Office of Thrift Supervision of a Cease and Desist Order in June 2005.
Following the issuance of the Cease and Desist Order in June 2005, as required by the Order, our senior management was replaced as were all but one of our existing directors. The new management team and board launched initiatives to collect loans at the New Jersey shore area, gather sufficient borrower information to properly document existing loans when possible, assign proper risk grades to loans following newly implemented credit risk assessment policies, establish and maintain well documented estimates for the allowance for loan losses, and establish appropriate underwriting, credit administration, and prudent credit risk management policies and procedures. As a result of these actions and continued favorable economic conditions at the New Jersey shore area, classified assets were significantly reduced and the OTS rescinded the Order on June 28, 2006.
At December 31, 2006, our nonperforming assets totaled $3.2 million, representing 0.43% of total assets. In addition, loans that we have classified as either special mention, substandard, doubtful or loss totaled $9.0 million, representing 2.5% of total loans. If these loans do not perform according to their terms and the collateral is insufficient to pay any remaining loan balance, we may experience loan losses, which could have a material effect on our operating results. Like all financial institutions, we maintain an allowance for loan losses to provide for loans in our portfolio that may not be repaid in their entirety. We believe that our allowance for loan losses is maintained at a level representing management’s best estimate of known and interest losses in the portfolio based upon management’s evaluation of the portfolio’s collectibility as of the corresponding balance sheet date.
However, our allowance for loan losses may not be sufficient to cover actual loan losses, and future provisions for loan losses could materially adversely affect our operating results.
At December 31, 2006, our allowance for loan losses totaled $2.9 million, which represented 0.82% total loans, 91.44% of nonperforming loans and 32.81% of classified assets. Our regulators, as an integral part of their examination process, periodically review our allowance for loan losses and may require us to increase our allowance for loan losses by recognizing additional provisions for loan losses charged to expense, or to decrease our allowance for loan losses by recognizing loan charge-offs, net of recoveries. Any such additional provisions for loan losses or charge-offs, as required by these regulatory agencies, could have a material adverse effect on our financial condition and results of operations.
Our recent emphasis on multi-family and commercial real estate and commercial lending may expose us to increased lending risks.
At December 31, 2006, $52.9 million, or 14.7%, of our loan portfolio consisted of multi-family and commercial real estate and commercial loans. We have recently begun to emphasize these types of lending and have hired a highly experienced team of nineteen commercial lending and credit and risk management professionals to accelerate this initiative. These types of loans generally expose a lender to greater risk of non-payment and loss than one- to four-family residential mortgage loans because repayment of the loans often depends on the successful operation of the property and the income stream of the borrowers. Such loans typically involve larger loan balances to single borrowers or groups of related borrowers compared to one- to four-family residential mortgage loans. In addition, since such loans generally entail greater credit risk than one- to four-family residential mortgage loans, we may need to increase our allowance for loan losses in the future to account for the likely increase in probable incurred credit losses associated with the growth of such loans. Also, many of our multi-family and commercial real estate and land borrowers have more than one loan outstanding with us. Consequently, an adverse development with respect to one loan or one credit relationship can expose us to a significantly greater risk of loss compared to an adverse development with respect to a one- to four-family residential mortgage loan.
Moreover, we only recently began our initiative to originate commercial business loans. At December 31, 2006, we had 33 commercial loans totaling $11.2 million in our portfolio. Accordingly, our commercial loan portfolio is unseasoned and our limited experience in originating these types of loans does not provide us with a significant payment history pattern with which to judge future collectibility. These loans will also not have been subjected to unfavorable economic conditions. As a result, it may be difficult to predict the future performance of this part of our loan portfolio. These loans may have delinquency or charge-off levels above our historical
17
experience, which could adversely affect our future performance. Further, commercial loans generally have larger balances and involve a greater risk than one- to four-family residential mortgage loans. Accordingly, if we make any errors in judgment in the collectibility of our commercial loans, any resulting charge-offs may be larger on a per loan basis than those incurred with our residential mortgage loan or consumer loan portfolios.
Our business strategy, which includes asset growth, was only recently initiated and has not yet had the time to be proven successful. Further, if we fail to grow or fail to manage our growth effectively, our financial condition and results of operations could be negatively affected.
In June 2005, as required by the Cease and Desist Order issued by the Office of Thrift Supervision, we adopted a new three-year business strategy. Our strategy involves asset and liability growth, specifically in originating commercial loans and attracting favorably priced deposits, while maintaining asset quality. Achieving our growth targets requires us to attract customers that currently bank at other financial institutions in our market, thereby increasing our share of the market. Our ability to successfully grow will also depend on a variety of factors, including the market penetration of the new commercial lenders that we hired, continued favorable market conditions, the continued availability of desirable business opportunities and the competitive responses from other financial institutions in our market areas. While we believe we have the management resources and internal systems in place to successfully manage our future growth, there can be no assurance growth opportunities will be available or that we will be successful in implementing our business strategies. Further, it will take time to implement our business strategy, especially for our commercial lenders to originate enough loans and business deposits to generate the revenue needed to offset the associated expenses, including salaries and the occupancy expense related to the new loan production offices. We expect that it may take a significant period of time before we can achieve the intended results of our new business strategy. During the period while the business plan is being implemented, our operating results may be negatively impacted. Further, there can be no assurance that our new strategic plan, even if successfully implemented, will ultimately produce positive results.
Our decrease in deposits may cause us to rely more heavily on more expensive wholesale funding sources, which would increase our expenses and adversely affect our operating margins and profitability.
Historically, we attempted to be the market leader in rates on longer-term money market accounts and certificates of deposit. However, in 2005, the new management, in connection with the planned reductions in the balance sheet, offered less-than-market rates as it attempted to allow the longer-term money market accounts and certificates of deposit to run-off, thereby shortening the duration of its liabilities. While deposit rates were raised to be competitive in the market in November 2005, deposits have continued to decrease. Deposits were $596.5 million at December 31, 2006 compared to $682.3 million at December 31, 2005. While we believe that branch expansion and our emphasis on building transaction accounts will increase deposits, there can be no guarantee if and when this will occur. Further, the considerable competition for deposits in our market will also make it more difficult for us to obtain reasonably priced deposits.
If we are not able to increase deposits, we will have to rely more heavily on wholesale sources to fund our asset growth than we have in the past, which are generally more expensive than retail sources of funding. If we are required to rely more heavily on more expensive funding sources to support future growth, our revenues may not increase proportionately to cover our costs. In this case, our operating margins and profitability would be adversely affected.
Rising interest rates may reduce our earnings and asset value.
Interest rates have recently been at historically low levels. However, since June 30, 2004, the Federal Reserve Board has increased its target for the federal funds rate seventeen times, from 1.0% to 5.25%. While these short-term market interest rates (which we use as a guide to price our deposits) have increased, longer-term market interest rates (which we use as a guide to price our longer-term loans) have not. This “flattening” of the market yield curve has had a negative impact on our interest rate spread and net interest margin, and if short-term interest rates continue to rise, and if rates on our deposits continue to reprice upwards faster than the rates on our long-term loans and investments, we would continue to experience compression of our interest rate spread and net interest margin, which would have a negative effect on our profitability.
Changes in interest rates also affect the value of our interest-earning assets, and in particular our securities portfolio. Generally, the value of fixed-rate securities fluctuates inversely with changes in interest rates. Unrealized
18
gains and losses on securities available for sale are reported as a separate component of equity, net of tax. Decreases in the fair value of securities available for sale resulting from increases in interest rates could have an adverse effect on stockholders’ equity.
If we do not achieve profitability on our new branches and loan production offices, the new offices may reduce our earnings.
We opened our Marmora, New Jersey branch office and two new loan production offices (with deposit authority) in the Philadelphia metropolitan area in 2006. Additionally, we have plans to open an additional branch office on land we own in Absecon, New Jersey by 2008. Numerous factors contribute to the performance of a new branch or loan production facility, such as our ability to select a suitable location, competition, our ability to hire and retain qualified personnel, and the effectiveness of our marketing strategy. It takes time for a new branch to generate significant deposits and loan volume to offset expenses, some of which, like salaries and occupancy expense, are relatively fixed costs. Additionally, there can be no assurance that any of these new offices will ever become profitable. During the period of time before a branch office or loan production facility can become profitable, operating an office will negatively impact our net income.
We operate in a highly regulated environment and we may be adversely affected by changes in laws and regulations.
Fox Chase MHC, Fox Chase Bancorp and Fox Chase Bank are subject to extensive regulation, supervision and examination by the Office of Thrift Supervision and Fox Chase Bank is also subject to regulation and supervision by the Federal Deposit Insurance Corporation, as insurer of its deposits. Such regulation and supervision governs the activities in which an institution and its holding company may engage, and are intended primarily for the protection of the insurance fund and the depositors and borrowers of Fox Chase Bank rather than for holders of Fox Chase Bancorp common stock. Regulatory authorities have extensive discretion in their supervisory and enforcement activities, including the imposition of restrictions on our operations, the classification of our assets and determination of the level of our allowance for loan losses. Any change in such regulation and oversight, whether in the form of regulatory policy, regulations, legislation or supervisory action, may have a material impact on our operations.
A downturn in the local economy or a decline in real estate values could reduce our profits.
Nearly all of our loans are secured by real estate or made to businesses in the Philadelphia metropolitan area or in Atlantic or Cape May Counties, New Jersey. As a result of this concentration, a downturn in the local economies could cause significant increases in nonperforming loans, which would reduce our profits. In recent years there has been a significant increase in real estate values in our market areas. As a result of rising home prices, our loans have been well collateralized. A decline in real estate values could cause some of our mortgage loans to become inadequately collateralized, which would expose us to a greater risk of loss.
Strong competition within our market areas could reduce our profits.
We face intense competition in making loans, attracting deposits and attracting and retaining key employees and relationship managers. In particular, several financial institutions have recently opened new offices or branches and numerous de novo financial institutions have recently been formed in the Philadelphia-Camden-Wilmington metropolitan statistical area. This competition has made it more difficult for us to make new loans and at times has forced us to offer higher deposit rates. It has also made it more difficult and costly to attract and hire employees with the level of expertise we require to implement our strategic plan. Price competition for loans and deposits might result in us earning less on our loans and paying more on our deposits, which would reduce net interest income. Also, additional compensation expense increases noninterest expense, reducing net income. Competition also makes it more difficult to grow loans and deposits. As of June 30, 2006, the most recent date for which information is available, we held 0.22% of the deposits in Philadelphia-Camden-Wilmington metropolitan statistical area. Some of the institutions with which we compete have substantially greater resources and lending limits than we have and may offer services that we do not provide. We expect competition to increase in the future as a result of legislative, regulatory and technological changes and the continuing trend of consolidation in the financial services industry. Our profitability depends upon our continued ability to compete successfully in our market areas.
19
Our low return on equity may negatively affect our stock price.
Net income divided by average equity, known as “return on equity,” is a ratio many investors use to compare the performance of a financial institution to its peers. Our return on equity was reduced due to the large amount of capital that we raised in our 2006 stock offering and to expenses we will incur in pursuing our growth strategies, the costs of being a public company and added expenses associated with our employee stock ownership plan and planned equity incentive plan. Until we can increase our net interest income and noninterest income, we expect our return on equity to be below the median return on equity of 5.60% for the trailing twelve months for all publicly traded thrifts, which may negatively affect the value of our common stock. For the twelve months ended December 31, 2006, our return on equity was 4.59%.
Expenses from operating as a public company and from new stock-based benefit plans will continue to adversely affect our profitability.
Our noninterest expenses are impacted as a result of the financial, accounting, legal and various other additional expenses usually associated with operating as a public company. We also recognize additional annual employee compensation and benefit expenses stemming from the shares that are purchased or granted to employees and executives under the employee stock ownership plan and other new benefit plans. These additional expenses adversely affect our profitability. We recognize expenses for our employee stock ownership plan when shares are committed to be released to participants’ accounts and will recognize expenses for restricted stock awards and stock options over the vesting period of awards made to recipients.
Issuance of shares for benefit programs may dilute your ownership interest.
We intend to adopt an equity incentive plan. If stockholders approve the new equity incentive plan, we intend to issue shares to our officers and directors through this plan. If the restricted stock awards under the equity incentive plan are funded from authorized but unissued stock, your ownership interest in the shares issued to persons other than Fox Chase MHC could be diluted by up to approximately 4.2%. If the shares issued upon the exercise of stock options under the equity incentive plan are issued from authorized but unissued stock, your ownership interest in the shares issued to persons other than Fox Chase MHC could be diluted by up to approximately 9.9%.
Fox Chase MHC’s majority control of our common stock will enable it to exercise voting control over most matters put to a vote of stockholders and will prevent stockholders from forcing a sale or a second-step conversion transaction you may find advantageous.
Fox Chase MHC owns a majority of Fox Chase Bancorp’s common stock and, through its board of directors, is able to exercise voting control over most matters put to a vote of stockholders. The same directors and officers who will manage Fox Chase Bancorp and Fox Chase Bank will also manage Fox Chase MHC. As a federally chartered mutual holding company, the board of directors of Fox Chase MHC must ensure that the interests of depositors of Fox Chase Bank are represented and considered in matters put to a vote of stockholders of Fox Chase Bancorp. However, you should be aware that the votes cast by Fox Chase MHC may not be in your personal best interests as a stockholder. For example, Fox Chase MHC may exercise its voting control to defeat a stockholder nominee for election to the board of directors of Fox Chase Bancorp. Moreover, Fox Chase MHC’s ability to elect the board of directors of Fox Chase Bancorp restricts the ability of the minority stockholders of Fox Chase Bancorp to effect a change of control of management. In addition, stockholders will not be able to force a merger or second-step conversion transaction without the consent of Fox Chase MHC as such transactions also require the approval of at least two-thirds of all outstanding voting stock, which can only be achieved if Fox Chase MHC voted to approve such transactions. Some stockholders may desire a sale or merger transaction, since stockholders typically receive a premium for their shares, or a second-step conversion transaction, since fully converted institutions tend to trade at higher multiples than mutual holding companies. Stockholders could, however, prevent a second step conversion or the implementation of equity incentive plans as current Office of Thrift Supervision regulations and policies require the approval of such matters by the stockholders other than Fox Chase MHC.
20
Office of Thrift Supervision policy on remutualization transactions could prohibit acquisition of Fox Chase Bancorp, which may adversely affect our stock price.
Current Office of Thrift Supervision regulations permit a mutual holding company to be acquired by a mutual institution in a remutualization transaction. The possibility of a remutualization transaction has recently resulted in a degree of takeover speculation for mutual holding companies that is reflected in the per share price of mutual holding companies’ common stock. However, the Office of Thrift Supervision has issued a policy statement indicating that it views remutualization transactions as raising significant issues concerning disparate treatment of minority stockholders and mutual members of the target entity and raising issues concerning the effect on the mutual members of the acquiring entity. Under certain circumstances, the Office of Thrift Supervision intends to give these issues special scrutiny and reject applications providing for the remutualization of a mutual holding company unless the applicant can clearly demonstrate that the Office of Thrift Supervision’s concerns are not warranted in the particular case. Should the Office of Thrift Supervision prohibit or otherwise restrict these transactions in the future, our per share stock price may be adversely affected.
ITEM 1B. UNRESOLVED STAFF COMMENTS
None.
21
We conduct our business through our main office and branch offices. The following table sets forth certain information relating to these facilities as of December 31, 2006.
Location |
| Year |
| Owned/ |
| Date of Lease |
| Net Book Value |
| |
|
|
|
|
|
|
|
| (In thousands) |
| |
Main Office: |
|
|
|
|
|
|
|
|
| |
4390 Davisville Road Hatboro, Pennsylvania |
| 1996 |
| Owned |
| — |
| $ | 2,259 |
|
|
|
|
|
|
|
|
|
|
| |
Branch Offices: |
|
|
|
|
|
|
|
|
| |
401 Rhawn Street Philadelphia, Pennsylvania |
| 1956 |
| Owned |
| — |
| 587 |
| |
|
|
|
|
|
|
|
|
|
| |
815 Bustleton Pike Richboro, Pennsylvania |
| 1985 |
| Owned |
| — |
| 537 |
| |
|
|
|
|
|
|
|
|
|
| |
1 Fitzwatertown Road Willow Grove, Pennsylvania |
| 1995 |
| Owned |
| — |
| 405 |
| |
|
|
|
|
|
|
|
|
|
| |
1041 York Road Warminster, Pennsylvania |
| 2000 |
| Owned |
| — |
| 863 |
| |
|
|
|
|
|
|
|
|
|
| |
921 West Avenue Ocean City, New Jersey |
| 2000 |
| Owned |
| — |
| 506 |
| |
|
|
|
|
|
|
|
|
|
| |
6059 Black Horse Pike Egg Harbor Township, New Jersey |
| 2000 |
| Owned |
| — |
| 899 |
| |
|
|
|
|
|
|
|
|
|
| |
5871 Lower York Road Lahaska, Pennsylvania |
| 2004 |
| Owned |
| — |
| 1,488 |
| |
|
|
|
|
|
|
|
|
|
| |
8 U.S. Route 9 South Marmora, New Jersey |
| 2006 |
| Owned |
| — |
| 1,658 |
| |
|
|
|
|
|
|
|
|
|
| |
67 Dowlin Forge Road Exton, Pennsylvania |
| 2006 |
| Leased |
| 2007 | (1) | — |
| |
|
|
|
|
|
|
|
|
|
| |
210 West State Street Media, Pennsylvania |
| 2006 |
| Leased |
| 2008 | (2) | 36 |
| |
|
|
|
|
|
|
|
|
|
| |
Administrative Offices: |
|
|
|
|
|
|
|
|
| |
|
|
|
|
|
|
|
|
|
| |
1225 Industrial Boulevard (3) Southampton, Pennsylvania |
| — |
| Owned |
| — |
| 736 |
| |
|
|
|
|
|
|
|
|
|
| |
Other Properties: |
|
|
|
|
|
|
|
|
| |
|
|
|
|
|
|
|
|
|
| |
811 Bustleton Pike (4) Richboro, Pennsylvania |
| — |
| Owned |
| — |
| 50 |
| |
|
|
|
|
|
|
|
|
|
| |
Absecon, New Jersey (5) |
| — |
| Owned |
| — |
| 2,008 |
| |
|
|
|
|
|
|
|
|
|
| |
Pleasantville, New Jersey (6) |
| — |
| Owned |
| — |
| 547 |
| |
|
|
|
|
|
|
|
|
|
| |
(1) We have an option to renew this lease for three additional one-year periods.
(2) We have an option to renew this lease for two additional one-year periods.
(3)�� This property houses administrative, operational and information technology personnel. We have entered into an agreement to sell this property and expect to close in May 2007.
(4) This property, which includes a one- to four-family residence and adjacent parking lot, has been leased to a tenant under a lease that is automatically renewed monthly until 60 days notice is given by tenant or landlord.
(5) This property is undeveloped land we hold upon which we expect to develop a future branch by 2008.
(6) This property is undeveloped land we hold upon which we expect to develop a future branch, although we have no current plans or arrangements to do so.
22
Periodically, there have been various claims and lawsuits against us, such as claims to enforce liens, condemnation proceedings on properties in which we hold security interests, claims involving the making and servicing of real property loans and other issues incident to our business. We are not a party to any pending legal proceedings that we believe would have a material adverse effect on our financial condition, results of operations or cash flows.
On April 28, 2006, Gregory S. Cipa, the former President and Chief Executive Officer of Fox Chase Bank, filed a complaint against Fox Chase Bank in the Civil Division of the Court of Common Pleas of Bucks County, Pennsylvania. In May 2006, Fox Chase Bank moved the case to federal court, answered the complaint and filed a counterclaim. In November 2006, Mr. Cipa amended his complaint, and now alleges Fox Chase Bank breached its contract with him and violated its state statutory obligations by failing to pay Mr. Cipa certain employment benefits which he claims to have earned while serving as the President and Chief Executive Officer of Fox Chase Bank. Mr. Cipa seeks monetary damages in excess of $900,000 and the payment of litigation costs. The parties completed discovery and filed motions for summary judgment that have not yet been ruled upon. Fox Chase Bank believes this action is without merit and intends to vigorously pursue its defenses.
ITEM 4. SUBMISSION OF MATTERS TO A VOTE OF SECURITY HOLDERS
None.
PART II
ITEM 5. MARKET FOR REGISTRANT’S COMMON EQUITY, RELATED STOCKHOLDER MATTERS AND ISSUER PURCHASES OF EQUITY SECURITIES
Market for Common Equity and Related Stockholder Matters
The Company’s common stock is listed on the Nasdaq Stock Market (“Nasdaq”) under the trading symbol “FXCB.” The following table sets forth the high and low sales prices of Fox Chase Bancorp’s common stock from October 2, 2006, the first day of trading of the common stock, through December 31, 2006, as reported by Nasdaq. The Company has not paid any dividends to its stockholders to date. See Item 1, “Business—Regulation and Supervision—Regulation of Federal Savings Associations— Limitation on Capital Distributions” and note 11 in the notes to the consolidated financial statements for more information relating to restrictions on dividends. As of March 20, 2007, the Company had approximately 1,116 holders of record of common stock.
2006: |
| High |
| Low |
|
|
|
|
|
|
|
First Quarter |
| N/A |
| N/A |
|
Second Quarter |
| N/A |
| N/A |
|
Third Quarter |
| N/A |
| N/A |
|
Fourth Quarter |
| $13.85 |
| $12.75 |
|
23
Stock Performance Graph
The following graph compares the cumulative total return of the Company common stock with the cumulative total return of the SNL Mid-Atlantic Thrift Index and the Index for the Nasdaq Stock Market (U.S. Companies, all SIC). The graph assumes that $100 was invested on October 2, 2006, the first day of trading of the common stock. Cumulative total return assumes reinvestment of all dividends.
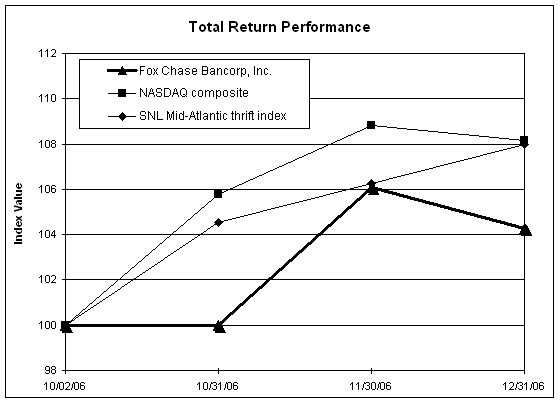
|
| Period Ending |
| ||||||
Index |
| 10/02/06 |
| 10/31/06 |
| 11/30/06 |
| 12/31/06 |
|
Fox Chase Bancorp, Inc. |
| 100.00 |
| 100.00 |
| 106.10 |
| 104.25 |
|
NASDAQ composite |
| 100.00 |
| 105.79 |
| 108.82 |
| 108.15 |
|
SNL Mid-Atlantic thrift index |
| 100.00 |
| 104.55 |
| 106.27 |
| 107.97 |
|
Purchases of Equity Securities
Fox Chase Bancorp did not repurchase any shares of its common stock during the quarter ended December 31, 2006.
24
ITEM 6. SELECTED FINANCIAL DATA
|
| At December 31, |
| |||||||||||||
|
| 2006 |
| 2005 |
| 2004 |
| 2003 |
| 2002 |
| |||||
|
| (In thousands) |
| |||||||||||||
Financial Condition Data: |
|
|
|
|
|
|
|
|
|
|
| |||||
Total assets |
| $ | 756,985 |
| $ | 781,291 |
| $ | 899,805 |
| $ | 821,118 |
| $ | 788,917 |
|
Cash and cash equivalents |
| 134,441 |
| 46,086 |
| 43,722 |
| 32,022 |
| 46,129 |
| |||||
Interest-earning time deposits |
| — |
| 600 |
| 3,174 |
| 4,392 |
| 2,800 |
| |||||
Securities available-for-sale |
| 228,432 |
| 329,504 |
| 330,199 |
| 335,388 |
| 310,118 |
| |||||
Loans receivable, net |
| 355,617 |
| 366,393 |
| 482,606 |
| 414,438 |
| 410,139 |
| |||||
Loans held for sale |
| 1,194 |
| 357 |
| — |
| — |
| — |
| |||||
Deposits |
| 596,534 |
| 682,307 |
| 805,250 |
| 723,838 |
| 695,010 |
| |||||
Federal Home Loan Bank advances |
| 30,000 |
| 30,000 |
| 30,000 |
| 30,000 |
| 30,000 |
| |||||
Total stockholders’ equity |
| 125,645 |
| 63,521 |
| 59,190 |
| 62,331 |
| 58,760 |
| |||||
|
|
|
|
|
|
|
|
|
|
|
| |||||
|
| For the Year Ended December 31, |
| ||||||||
|
| 2006 |
| 2005 |
| 2004 |
| 2003 |
| 2002 |
|
|
| (In thousands) |
| ||||||||
Operating Data: |
|
|
|
|
|
|
|
|
|
|
|
Interest income |
| $37,177 |
| $37,601 |
| $37,566 |
| $35,533 |
| $39,607 |
|
Interest expense |
| 20,459 |
| 20,697 |
| 19,693 |
| 20,662 |
| 23,031 |
|
Net interest income |
| 16,718 |
| 16,904 |
| 17,873 |
| 14,871 |
| 16,576 |
|
Provision (credit) for loan losses |
| (5,394 | ) | (6,025 | ) | 12,282 |
| 30 |
| 1,107 |
|
Net interest income after provision (credit) for loan losses |
| 22,112 |
| 22,929 |
| 5,591 |
| 14,841 |
| 15,469 |
|
Noninterest income |
| 2,073 |
| 1,214 |
| 2,279 |
| 3,405 |
| 1,149 |
|
Noninterest expenses |
| 19,867 |
| 15,208 |
| 11,353 |
| 10,958 |
| 10,013 |
|
Income (loss) before income taxes |
| 4,318 |
| 8,935 |
| (3,483 | ) | 7,288 |
| 6,605 |
|
Income tax provision (benefit) |
| 684 |
| 2,975 |
| (1,595 | ) | 2,497 |
| 2,405 |
|
Net income (loss) (1)(2) |
| $3,634 |
| $5,960 |
| $(1,888 | ) | $4,791 |
| $4,200 |
|
Earnings per share (1)(2) |
| $0.14 |
| — |
| — |
| — |
| — |
|
25
|
| At or for the Years Ended December 31, |
| ||||||||
|
| 2006 |
| 2005 |
| 2004 |
| 2003 |
| 2002 |
|
Performance Ratios: |
|
|
|
|
|
|
|
|
|
|
|
Return on average assets |
| 0.49 | % | 0.71 | % | (0.21 | )% | 0.59 | % | 0.59 | % |
Return on average equity |
| 4.59 |
| 9.50 |
| (2.82 | ) | 7.64 |
| 7.45 |
|
Interest rate spread (3) |
| 2.02 |
| 1.78 |
| 1.92 |
| 1.61 |
| 2.19 |
|
Net interest margin (4) |
| 2.33 |
| 2.05 |
| 2.11 |
| 1.87 |
| 2.40 |
|
Noninterest expense to average assets |
| 2.66 |
| 1.80 |
| 1.29 |
| 1.34 |
| 1.40 |
|
Efficiency ratio (2)(5) |
| 105.63 |
| 83.94 |
| 56.34 |
| 59.96 |
| 56.49 |
|
Average interest-earning assets to |
| 113.46 |
| 109.08 |
| 107.69 |
| 109.68 |
| 106.30 |
|
Average equity to average assets |
| 10.58 |
| 7.44 |
| 7.59 |
| 7.67 |
| 7.91 |
|
|
|
|
|
|
|
|
|
|
|
|
|
Capital Ratios (6): |
|
|
|
|
|
|
|
|
|
|
|
Tier 1 capital (to adjusted assets) |
| 12.49 |
| 8.40 |
| 6.66 |
| 7.54 |
| 7.24 |
|
Tier 1 capital (to risk-weighted assets) |
| 26.79 |
| 17.76 |
| 12.92 |
| 15.76 |
| 14.59 |
|
Total risk-based capital (to risk-weighted |
| 27.62 |
| 19.02 |
| 14.17 |
| 16.29 |
| 15.13 |
|
|
|
|
|
|
|
|
|
|
|
|
|
Asset Quality Ratios: |
|
|
|
|
|
|
|
|
|
|
|
Nonperforming loans as a percent |
| 0.90 |
| 1.36 |
| 0.29 |
| 0.32 |
| 0.32 |
|
Allowance for loan losses as a percent of total loans |
| 0.82 |
| 2.22 |
| 2.89 |
| 0.50 |
| 0.50 |
|
Allowance for loan losses as a percent |
| 91.44 |
| 163.90 |
| 997.99 |
| 159.29 |
| 158.45 |
|
Net charge-offs (recoveries) to average |
| — |
| — |
| — |
| — |
| — |
|
|
|
|
|
|
|
|
|
|
|
|
|
Other Data: |
|
|
|
|
|
|
|
|
|
|
|
Number of: |
|
|
|
|
|
|
|
|
|
|
|
Deposit accounts |
| 55,957 |
| 61,349 |
| 66,800 |
| 65,796 |
| 66,554 |
|
Offices |
| 11 |
| 8 |
| 8 |
| 7 |
| 7 |
|
(1) On September 29, 2006, Fox Chase Bancorp, Inc. completed its initial public offering of common stock. Earnings per share information for 2006 is only for the period September 29, 2006 through December 31, 2006 due to the Bank’s reorganization into a mutual holding company form and the issuance of stock in an initial public offering.
(2) Net income and the efficiency ratio for 2006 reflect a one time charge of $1.5 million for the contribution to the Fox Chase Bank Charitable Foundation.
(3) Represents the difference between the weighted average yield on average interest-earning assets and the weighted average cost of interest-bearing liabilities.
(4) Represents net interest income as a percent of average interest-earning assets.
(5) Represents noninterest expense divided by the sum of net interest income and noninterest income, excluding gains or losses on the sale of securities.
(6) Ratios are for Fox Chase Bank.
26
ITEM 7. MANAGEMENT’S DISCUSSION AND ANALYSIS OF FINANCIAL CONDITION AND RESULTS OF OPERATION
Overview
The following describes various components that affect our results of operations.
Income. Our primary source of pre-tax income is net interest income. Net interest income is the difference between interest income, which is the income that we earn on our loans and securities, and interest expense, which is the interest that we pay on our deposits and Federal Home Loan Bank borrowings. To a much lesser extent, we also recognize pre-tax income from service charge income, mostly from service charges on deposit accounts and loans, from the increase in cash surrender value of our bank-owned life insurance and from the sale of loans and securities.
Provision for Loan Losses. The allowance for loan losses is maintained at a level representing management’s best estimate of known and inherent losses in the loan portfolio, based upon management’s evaluation of the portfolio’s collectibility. The allowance is established through the provision for loan losses, which is charged against income. Charge-offs, if any, are charged to the allowance. Subsequent recoveries, if any, are credited to the allowance. Management estimates the allowance balance required using past loan loss experience, information about specific borrower situations, and estimated collateral values, current economic conditions and other relevant factors. Allocation of the allowance may be made for specific loans, but the entire allowance is available for any loan that, in management’s judgment, should be charged off.
Expenses. The noninterest expenses we incur in operating our business consist of salaries, benefits and other compensation expenses, occupancy and equipment expenses, data processing costs, professional fees, marketing expenses, Federal Deposit Insurance Corporation premiums and various other miscellaneous expenses.
Salaries, benefits and other compensation consist primarily of salaries and wages paid to our employees, payroll taxes and expenses for health insurance, retirement plans, director and committee fees and other employee benefits, including the employee stock ownership plan. We will also recognize additional annual employee compensation expenses stemming from the adoption of a new stock-based benefit plan; however, we cannot determine the actual amount of these new stock-related compensation and benefit expenses until the plan is adopted and implemented.
Occupancy expenses, which are the fixed and variable costs of buildings and equipment, consist primarily of depreciation charges, maintenance, real estate taxes and costs of utilities. Depreciation of premises is computed using the straight-line method based on the useful lives of the related assets, which range from ten to 39 years for buildings and premises. Leasehold improvements are amortized over the useful life of the asset or the term of the lease.
Furniture and equipment expenses, which are fixed and variable costs of equipment, consist primarily of depreciation charges, furniture and equipment expenses and maintenance. Depreciation of equipment is computed using the straight-line method based on the useful lives of the related assets, which range from three to seven years for furniture, fixtures and equipment.
Data processing costs include fees paid to our third-party data processing service and ATM expense.
Professional fees include fees paid to our independent auditors, our attorneys and to other professionals that we used to assist us with our interest rate risk management and reviews of our loan portfolio and costs associated with being a public company.
Marketing expenses include expenses for advertisements, promotions and premium items and public relations expenses.
Federal Deposit Insurance Corporation premiums are payments we make to the Federal Deposit Insurance Corporation for insurance of our deposit accounts.
Other expenses include expenses for supplies, telephone and postage, contributions and donations, regulatory assessments, insurance premiums and other fees and expenses.
27
Operating Strategy
Operating Strategy from 2003 to 2005. Historically, we originated primarily one- to four-family residential real estate loans, which were generally funded by higher-priced term maturity deposits. In 2003, then-current management determined to emphasize multi-family and commercial real estate lending and construction lending, primarily in the southern New Jersey shore area where it had opened branch offices. This initiative led to a significant increase in loans from $414.4 million at December 31, 2003 to $482.6 million at December 31, 2004. Also, we continued to offer higher rates on our deposits to fund the loan growth. As a result, deposits increased from $723.8 million at December 31, 2003 to $805.3 million at December 31, 2004. However, when these loans were originated, they were not properly underwritten, as adequate documentation and an appraisal that met regulatory guidelines establishing the value of the real estate collateral was not always obtained. Also, loan settlements were not typically attended by anyone representing us. As a result, there were instances where the requirements of the loan commitment, including additional required collateral, were not obtained. Further, construction loan disbursements were made without adequate controls. Additionally, the former management of Fox Chase Bank failed to adopt a risk rating system and update its allowance for loan losses policy to account for the new types of loans that were being originated. Further, management failed to properly review and classify the new types of loans. This type of lending and the absence of adequate underwriting, credit and collection policies and internal controls contributed to the issuance by the Office of Thrift Supervision of a Cease and Desist Order, which we consented to on June 6, 2005. Additionally, it caused criticized and classified assets to increase from $775,000 at December 31, 2003 to $90.7 million at December 31, 2004. While Fox Chase Bank did not incur any losses on these loans during the same period, it did record a $12.3 million provision for loan losses in 2004, which contributed to a net loss of $1.9 million in 2004.
Operating Strategy During Pendency of Cease and Desist Order. On June 6, 2005, we consented to the issuance of an Order to Cease and Desist by the Office of Thrift Supervision. The Cease and Desist Order cited the following violations of Office of Thrift Supervision laws and regulations:
· | failure to maintain adequate real estate lending policies, as these policies did not provide prudent underwriting standards or administration procedures; | |
| · | originating loans in excess of the institution’s regulatory required lending limits; |
| · | failure to adequately evaluate and classify its assets on a regular basis and failure to establish an adequate valuation allowance on classified assets; |
| · | failure to file accurate regulatory reports, including Office of Thrift Supervision Thrift Financial Reports and Suspicious Activity Reports; |
| · | failure to adhere to the requirements of Regulation O, the regulation that governs extensions of credit to insiders of the institution; |
| · | failure to adhere to Office of Thrift Supervision guidelines on establishing the value of the collateral on which loans were originated; and |
| · | failure to provide the required certification on the Office of Thrift Supervision Thrift Financial Reports by officers and directors. |
As part of this order, the Office of Thrift Supervision ordered us to discontinue a number of practices, and specifically ordered us to take certain actions. We were ordered to:
· | discontinue originating the following types of loans: | |||
| · | real estate acquisition, development and/or construction loans, except for residential construction mortgage loans (1) on owner-occupied one-to four-family residences; (2) with loan-to-value ratios that do not exceed 80% of the value of the collateral; and (3) in which we have received a firm commitment to finance the project once completed; | ||
| · | mortgage or consumer loans, except for (1) owner-occupied mortgage loans on which we have a first lien; and (2) prudently underwritten, well-secured consumer loans, in each case only to borrowers that can demonstrate a high level of creditworthiness | ||
| · | restrict our asset growth to an amount not to exceed net interest credited on deposit liabilities; | ||
| · | hire a new chief executive officer; | ||
| · | improve our board’s oversight over lending and risk exposure, including assessing our capital position and exposure to higher-risk loans; | ||
28
| · | develop a new business plan with the goal to transition our operations into activities that (1) entail less risk; (2) provide more stable and sustainable sources of core income; and (3) are supported by capital level commensurate with the risks of our operations and composition of our balance sheet; |
| · | improve our loan underwriting and appraisal policies, loans-to-one borrower compliance and internal asset review procedures; |
| · | enhance our credit administration, board management and governance; |
| · | provide the Office of Thrift Supervision with quarterly progress reports; and |
| · | review and analyze our loan portfolio and, as appropriate, review our allowance for loan losses. |
Following the issuance of the Cease and Desist Order, our senior management was replaced as were all but one of our existing directors. The new management team and board launched initiatives to collect loans at the New Jersey shore area, gather sufficient borrower information to properly document existing loans when possible, assign proper risk grades to loans following newly implemented credit risk assessment policies, establish and maintain well documented estimates for the allowance for loan losses, and establish appropriate underwriting, credit administration, and prudent credit risk management policies and procedures. As a result of these actions and continued favorable economic conditions at the New Jersey shore area, criticized and classified assets were reduced from $90.7 million at December 31, 2004 to $3.2 million at December 31, 2006. As a result of these actions and the reduction in criticized and classified assets, the need for allowance for loan losses was reduced, which resulted in the $6.0 million and $5.4 million credit to the provision for loan losses during 2005 and 2006, respectively.
Additionally, initiatives were undertaken to strengthen the system of internal controls, improve policies and procedures and upgrade the quality and experience of management in all areas of the Company. Also, to comply with the Order, we improved our Board’s oversight over lending and risk exposure, developed a new business plan, improved our loan underwriting and appraisal policies, loans-to-one borrower compliance and internal asset review procedures, enhanced our credit administration and Board management and governance. In addition, we reviewed and analyzed our loan portfolio and, as appropriate, reviewed our allowance for loan losses. As a result of these efforts, effective June 28, 2006, the Order to Cease and Desist was terminated.
As a result of the Cease and Desist Order and the prohibition on growing our asset size and specifically from originating various types of loans and from the loan sales of one to- four-family residential loans, which was done to manage interest rate risk, our loan portfolio and asset size decreased. As a result, our funding needs decreased, so we offered less-than-market rates on our longer-term money market accounts and certificates of deposit to shorten the duration of our liabilities and decrease our deposits.
Current Operating Strategy. New management and board reassessed our strategic direction and our opportunities for profitability. The determination was made to capitalize on our 140-year tradition of strong personalized customer service, which we believe distinguishes us from the large regional banks that operate in our market area. At the same time, the decision was made to differentiate ourselves from the small community banks in our market place by leveraging the strong commercial and business expertise of our new management team and focusing on the businesses in our market area. Further, we believe that our capital, which was significantly increased through the stock offering, allows us to make loans of a size not permitted by the de novo financial institutions in our market area, who are restrained by smaller capital levels and smaller loans to one borrower limits. Thus, as discussed in more detail below, we intend to continue to expand our product offerings, diversify our lending operations and expand our footprint and market presence in the metropolitan Philadelphia area and in the southern New Jersey shore area in an attempt to increase assets, while maintaining sound asset quality and enhancing profitability.
Historically, we attempted to be the market leader in rates on longer-term money market accounts and certificates of deposit. However, in 2005, the new management, in connection with the planned reductions in the levels of assets, offered less-than-market rates as it attempted to allow the longer-term money market accounts and certificates of deposit to run-off, thereby shortening the duration of their liabilities. While deposit rates were raised to be competitive in the market in late 2005 and throughout 2006, deposits have continued to decrease. Deposits were $596.5 million at December 31, 2006 compared to $682.3 million at December 31, 2005. We believe that branch expansion and our emphasis on building transaction accounts, both more fully described below, will increase deposits. However, the considerable competition for deposits in our market will also make it more difficult for us to obtain reasonably priced deposits. To the extent that our retail funding sources do not provide for adequate funding, we will rely more heavily on wholesale funding in addition to retail funds to leverage the balance sheet and accelerate growth.
29
Our mission is to become the leading relationship-based business and consumer bank in our market areas by delivering financial products and services tailored to our clients’ needs. We plan to continue our strategy of:
· | pursuing opportunities to increase commercial lending in our primary market area; | |
|
|
|
| · | building profitable business and consumer relationships with an emphasis on growing transaction deposit accounts and deposit balances; |
|
|
|
| · | increasing income by expanding our product offerings and continuing to emphasize customer service; and |
|
|
|
| · | expanding our footprint and market presence through opening additional branch and loan production offices. |
Pursuing opportunities to increase commercial lending in our primary market area
At December 31, 2006, $52.9 million, or 14.7%, of our loan portfolio consisted of multi-family and commercial real estate loans and commercial business loans. We intend to emphasize these types of lending and in 2006 hired a highly experienced team of nineteen commercial lending and commercial credit and risk management professionals to accelerate this initiative. We may hire additional commercial lenders and cash management professionals in the future to increase this type of lending. Loans secured by multi-family and commercial real estate and business assets are generally larger and involve a greater degree of risk than one-to four-family residential mortgage loans. Consequently, multi-family and commercial real estate and commercial business loans typically have higher yields, which increase our net interest margin and net interest spread. In addition, these loans are beneficial for interest rate risk management because they typically have shorter terms and adjustable interest rates. There are many multi-family and commercial real estate properties and commercial businesses located in our market area, and with the additional capital raised in the offering we may pursue the larger lending relationships associated with these opportunities, while continuing to originate any such loans in accordance with what we believe are our conservative underwriting guidelines.
Commercial lending generally exposes a lender to greater risk of non-payment and loss than one- to four-family residential mortgage loans. To mitigate against the potential for this loss, in the past year, we have added significant commercial credit expertise through the hiring of our chief credit officer, chief administrative officer, chief lending officer and a credit risk manager. Additionally, we have created and revamped where necessary, our commercial lending credit-related policies and procedures. For a discussion of the risks related to our commercial loan portfolio, see Item 1, “Business—Loan Underwriting Risks.”
Building profitable business and consumer relationships with an emphasis on growing transaction deposit accounts and deposit balances
We believe a solid banking relationship is best expressed in the form of the primary transaction account. For consumers this is the household checking account from which they pay their bills. For businesses it is one or more operating accounts and related cash management services. The primary transaction account is distinguished from other financial services in that it has no maturity or payoff. It is the link between client and bank that anchors the banker-client relationship. We intend to focus our resources on growing profitable business and consumer relationships built upon the primary transaction account. This is becoming increasing difficult. More competitors recognize the inherent relationship-value of the primary consumer and business transaction account and more automated payment links in the form of direct debits and direct deposits make it increasingly inconvenient to switch from one bank to another. Yet there remain opportunities to deliver what clients care about most in the form of exceptional service and convenience.
There are many factors that affect the profitability of client relationships, some of which are beyond our control. We use a number of business disciplines to promote profitable relationships that include who we target to become clients, how we price our products and services, how we underwrite and administer loans, how we identify, measure, monitor and manage risk, how we deploy our capital and how we manage and control costs. These measures combine to promote profitable relationships.
30
Increasing income by expanding our product offerings and continuing to emphasize customer service
We are striving to become a full-service financial services company offering our customers a broad range of loan and deposit products. On the lending side, we have recently developed commercial loan products, including unsecured lines of credit, letters of credit, commercial mortgage loans, revolving credit facilities and commercial construction loans. On the deposit side, we expanded our deposit products and services, including offering on-line bill payment, a suite of cash management products and custodial services.
While a full array of products and services is essential, we recognize that our clients do not necessarily buy banking products or services, but rather they buy a wide number of satisfactions that are attained through the effective use of our products and services. Our products and services are merely a vehicle to the attainment of client satisfaction. For example, a business client does not so much buy a commercial loan as buys the satisfaction of growing their company that is enabled by the working capital that comes from the loan. Our commitment to delivering what our clients care about most is our link between our products and services and client satisfaction.
Expanding our footprint and market presence through opening additional branch and loan production offices
In March 2006, we opened a new office in Marmora, New Jersey, in May 2006, we opened a loan production office (with deposit authority) in Exton, Pennsylvania and in July 2006, we opened a loan production office (with deposit authority) in Media, Pennsylvania. Additionally, we expect to build a branch office by 2008 on land we own in Absecon, New Jersey. We also will consider expansion in and around our current market area in future years, whether through de novo branching or acquisition. However, we have not entered into any binding commitments regarding our expansion plans. The new branches have been and are expected to continue to be, funded by cash generated by our business. Consequently, we do not expect to borrow funds for these expansion projects.
Critical Accounting Policies
We consider accounting policies involving significant judgments and assumptions by management that have, or could have, a material impact on the carrying value of certain assets or on income to be critical accounting policies. We consider the following to be our critical accounting policies: allowance for loan losses, deferred income taxes, mortgage servicing rights, and other-than-temporary impairment of securities.
Allowance for Loan Losses. The allowance for loan losses is maintained at a level representing management’s best estimate of known and inherent losses in the loan portfolio, based on management’s evaluation of the portfolio’s collectibility. The allowance is established through the provision for loan losses, which is charged against income. Determining the amount of the allowance for loan losses necessarily involves a high degree of judgment. Among the material estimates required to establish the allowance are: loss exposure at default; the amount and timing of future cash flows on impacted loans; value of collateral; and determination of loss factors to be applied to the various elements of the portfolio. All of these estimates are susceptible to significant change. Management reviews the level of the allowance on a quarterly basis and establishes the provision for loan losses based upon an evaluation of the portfolio, past loss experience, current economic conditions and other relevant factors related to the collectibility of the loan portfolio. Although we believe that we use the best information available to establish the allowance for loan losses, future adjustments to the allowance may be necessary if economic conditions differ substantially from the assumptions used in making the evaluation. In addition, the Office of Thrift Supervision, as an integral part of its examination process, periodically reviews our allowance for loan losses. Such agency may require us to recognize adjustments to the allowance based on its judgments about information available to it at the time of its examination. A large loss could deplete the allowance and require increased provisions to replenish the allowance, which would negatively affect earnings. For additional discussion, see “—Risk Management—Analysis and Determination of the Allowance for Loan Losses” below and note 1 of the notes to the consolidated financial statements included in this annual report.
Deferred Income Taxes. We use the asset and liability method of accounting for income taxes as prescribed in Statement of Financial Accounting Standards No. 109, “Accounting for Income Taxes.” Under this method, deferred tax assets and liabilities are recognized for the future tax consequences attributable to differences between the financial statement carrying amounts of existing assets and liabilities and their respective tax bases. If current available information raises doubt as to the realization of the deferred tax assets, a valuation allowance is
31
established. Deferred tax assets and liabilities are measured using enacted tax rates expected to apply to taxable income in the years in which those temporary differences are expected to be recovered or settled. We exercise significant judgment in evaluating the amount and timing of recognition of the resulting tax liabilities and assets. These judgments require us to make projections of future taxable income. The judgments and estimates we make in determining our deferred tax assets, which are inherently subjective, are reviewed on a continual basis as regulatory and business factors change. Any reduction in estimated future taxable income may require us to record a valuation allowance against our deferred tax assets. A valuation allowance would result in additional income tax expense in the period, which would negatively affect earnings.
Mortgage Servicing Rights. Mortgage servicing rights associated with loans originated and sold, where servicing is retained, are capitalized and included in other intangible assets in the consolidated balance sheet. The value of the capitalized servicing rights represents the present value of the future servicing fees arising from the right to service loans in the portfolio. Critical accounting policies for mortgage servicing rights relate to the initial valuation and subsequent impairment tests. The methodology used to determine the valuation of mortgage servicing rights requires the development and use of a number of estimates, including anticipated principal amortization and prepayments of that principal balance. Events that may significantly affect the estimates used are changes in interest rates, mortgage loan prepayment speeds and the payment performance of the underlying loans. The carrying value of the mortgage servicing rights is periodically reviewed for impairment based on a disaggregated impairment test based on fair value. Impairment, if any, is recognized through a valuation allowance and is recorded as amortization of intangible assets.
Other-Than-Temporary Impairment of Securities. Statement of Financial Accounting Standards No. 115, “Accounting for Certain Investments in Debt and Equity Securities,” and FASB Staff Position FAS 115-1and 124-1 “The Meaning of Other Than Temporary Impairment and Its Application to Certain Investments,” require companies to perform periodic reviews of individual securities in their investment portfolios to determine whether a decline in the value of a security is other than temporary. A review of other-than-temporary impairment requires companies to make certain judgments regarding the nature of the decline, its effect on the financial statements and the probability, extent and timing of a valuation recovery and the company’s intent and ability to hold the security. Pursuant to these requirements, we assess valuation declines to determine the extent to which such changes are attributable to (1) fundamental factors specific to the issuer, such as financial condition, business prospects or other factors, or (2) market-related factors, such as interest rates or equity market declines. If the decline in the market value of a security is determined to be other than temporary, we reduce the book value of such security to its current market value, recognizing the decline as a realized loss on the income statement.
Balance Sheet Analysis
Loans. Our primary lending activity is the origination of one- to four-family residential loans. We also originate multi-family and commercial real estate loans, construction loans and consumer loans. While we have not historically originated commercial loans, we have begun to emphasize this type of lending.
The largest segment of our loan portfolio is one- to four-family residential loans. At December 31, 2006, these loans totaled $209.5 million, or 58.3% of total loans, compared to $228.5 million, or 60.9% of total loans, at December 31, 2005. At December 31, 2004, these loans totaled $250.0 million, or 50.1% of total loans. The size of our one- to four-family residential loan portfolio has decreased over the past year as we sold $20.9 million in longer-term fixed-rate one- to four-family residential real estate loans in the secondary market, in an effort to manage interest rate risk.
Multi-family and commercial real estate loans and commercial business loans totaled $52.9 million and represented 14.7 % of total loans at December 31, 2006 compared to $33.1 million, or 8.8% of total loans at December 31, 2005. These loans totaled $85.8 million, or 17.2% of total loans, at December 31, 2004. The increase in 2006 reflects the hiring of a new team of commercial lenders and the opening of new offices in 2006. In 2003, our former management commenced a loan program in the southern New Jersey shore area where it had recently opened branch offices, which included loans on multi-family housing units, condominiums and seasonal businesses such as restaurants and bars. However, due to a lack of expertise in this type of lending, a relative unfamiliarity with the market area and inadequate underwriting (including inadequate documentation), many of the loans were criticized or classified, See “—Risk Management—Analysis of Nonperforming and Classified Assets.” In 2005, new management ceased originating these loans and made significant efforts to reduce this segment of the loan portfolio through increased collection efforts, including adding personnel and implementing more comprehensive procedures
32
and policies, and attempting, when possible, to have the loans refinanced with other financial institutions, which resulted in the decrease in this portfolio. With the addition of the new commercial lending team in 2006, the Bank expects to continue to increase the commercial loan portfolio in the future.
Construction loans totaled $11.6 million, or 3.2% of total loans, at December 31, 2006 compared to $31.0 million, or 8.3% of total loans, at December 31, 2005. These loans totaled $92.2 million, or 18.5% of total loans, at December 31, 2004. In 2003, former management commenced an acquisition, development and construction loan program in the southern New Jersey shore area where it had recently opened new branch offices. However, due to a lack of expertise in this type of lending and a relative unfamiliarity with the market area, the proper documentation on these types of loans was not received and many of the loans were criticized or classified. In 2005, new management, pursuant to the requirements of the Cease and Desist Order instituted by the Office of Thrift Supervision, ceased originating these loans and many of the construction projects on which these loans were originated have been completed. Through collection efforts, we have been able to reduce these loans by approximately $19.4 million in 2006.
Consumer loans totaled $85.1 million, or 23.7% of total loans, at December 31, 2006 compared to $82.7 million, or 22.0% of total loans, at December 31, 2005. These loans totaled $70.6 million, or 14.2% of total loans, at December 31, 2004. Growth in the consumer loan portfolio was primarily attributable to promotion of our fixed-rate home equity loan, offset by reductions in our variable-rate home equity line of credit product, both of which are driven by the current interest rate environment.
33
The following table sets forth the composition of our loan portfolio at the dates indicated.
|
| At December 31, |
| |||||||||||||||||||||||
|
| 2006 |
| 2005 |
| 2004 |
| 2003 |
| 2002 |
| |||||||||||||||
|
| Amount |
| Percent |
| Amount |
| Percent |
| Amount |
| Percent |
| Amount |
| Percent |
| Amount |
| Percent |
| |||||
|
| (Dollars in thousands) |
| |||||||||||||||||||||||
Real estate loans: |
|
|
|
|
|
|
|
|
|
|
|
|
|
|
|
|
|
|
|
|
| |||||
One-to four-family |
| $ | 209,463 |
| 58.3 | % | $ | 228,476 |
| 60.9 | % | $ | 250,015 |
| 50.1 | % | $ | 262,753 |
| 62.7 | % | $ | 350,651 |
| 84.3 | % |
Multi-family and commercial |
| 41,720 |
| 11.6 |
| 32,923 |
| 8.8 |
| 85,585 |
| 17.2 |
| 57,495 |
| 13.7 |
| 16,173 |
| 3.9 |
| |||||
Construction |
| 11,568 |
| 3.2 |
| 31,015 |
| 8.3 |
| 92,210 |
| 18.5 |
| 46,850 |
| 11.2 |
| — |
| — |
| |||||
Total real estate loans |
| 262,751 |
| 73.1 |
| 292,414 |
| 78.0 |
| 427,810 |
| 85.8 |
| 367,098 |
| 87.6 |
| 366,824 |
| 88.2 |
| |||||
Consumer loans: |
|
|
|
|
|
|
|
|
|
|
|
|
|
|
|
|
|
|
|
|
| |||||
Home equity loans |
| 73,456 |
| 20.5 |
| 65,003 |
| 17.3 |
| 49,154 |
| 9.9 |
| 36,065 |
| 8.6 |
| 34,585 |
| 8.4 |
| |||||
Automobile |
| 1,030 |
| 0.3 |
| 1,280 |
| 0.3 |
| 1,872 |
| 0.4 |
| 1,439 |
| 0.4 |
| 2,589 |
| 0.6 |
| |||||
Home equity lines of credit |
| 10,468 |
| 2.9 |
| 16,269 |
| 4.3 |
| 18,249 |
| 3.6 |
| 13,947 |
| 3.3 |
| 11,314 |
| 2.7 |
| |||||
Other |
| 148 |
| 0.1 |
| 188 |
| 0.1 |
| 1,305 |
| 0.3 |
| 438 |
| 0.1 |
| 465 |
| 0.1 |
| |||||
Total consumer loans |
| 85,102 |
| 23.8 |
| 82,740 |
| 22.0 |
| 70,580 |
| 14.2 |
| 51,889 |
| 12.4 |
| 48,953 |
| 11.8 |
| |||||
Commercial |
| 11,155 |
| 3.1 |
| 175 |
| — |
| 175 |
| — |
| 175 |
| — |
| 115 |
| — |
| |||||
Total loans |
| 359,008 |
| 100.0 | % | 375,329 |
| 100.0 | % | 498,565 |
| 100.0 | % | 419,162 |
| 100.0 | % | 415,892 |
| 100.0 | % | |||||
Less: |
|
|
|
|
|
|
|
|
|
|
|
|
|
|
|
|
|
|
|
|
| |||||
Deferred loan origination fees and discounts |
| (442 | ) |
|
| (587 | ) |
|
| (1,568 | ) |
|
| (2,615 | ) |
|
| (3,671 | ) |
|
| |||||
Allowance for loan losses |
| (2,949 | ) |
|
| (8,349 | ) |
|
| (14,391 | ) |
|
| (2,109 | ) |
|
| (2,082 | ) |
|
| |||||
Total loans, net |
| $ | 355,617 |
|
|
| $ | 366,393 |
|
|
| $ | 482,606 |
|
|
| $ | 414,438 |
|
|
| $ | 410,139 |
|
|
|
34
Loan Maturity
The following tables set forth certain information at December 31, 2006 regarding scheduled contractual maturities during the periods indicated. The tables do not include any estimate of prepayments which significantly shorten the average life of all loans and may cause our actual repayment experience to differ from that shown below. Demand loans having no stated schedule of repayments and no stated maturity are reported as due in one year or less. The amounts shown below exclude deferred loan fees.
|
| At December 31, 2006 |
| ||||||||||||||||
|
| One- to |
| Multi-family |
| Construction |
| Consumer |
| Commercial |
| Total |
| ||||||
|
| (In thousands) |
| ||||||||||||||||
Amounts due in: |
|
|
|
|
|
|
|
|
|
|
|
|
| ||||||
One year or less |
| $ | 100 |
| $ | 1,549 |
| $ | 7,415 |
| $ | 697 |
| $ | 2,830 |
| $ | 12,591 |
|
More than one year to two years |
| 708 |
| 1,808 |
| 4,153 |
| 2,934 |
| 2,387 |
| 11,990 |
| ||||||
More than two years to three years |
| 729 |
| — |
| — |
| 2,790 |
| 645 |
| 4,164 |
| ||||||
More than three years to five years |
| 1,107 |
| 11,997 |
| — |
| 12,275 |
| 1,319 |
| 26,698 |
| ||||||
More than five years to ten years |
| 15,999 |
| 2,803 |
| — |
| 18,701 |
| 3,974 |
| 41,477 |
| ||||||
More than ten years to fifteen years |
| 83,608 |
| 5,608 |
| — |
| 37,262 |
| — |
| 126,478 |
| ||||||
More than fifteen years |
| 107,212 |
| 17,955 |
| — |
| 10,443 |
| — |
| 135,610 |
| ||||||
Total |
| $ | 209,463 |
| $ | 41,720 |
| $ | 11,568 |
| $ | 85,102 |
| $ | 11,155 |
| $ | 359,008 |
|
The following table sets forth the dollar amount of all scheduled maturities of loans at December 31, 2006 that are due after December 31, 2007 and have either fixed interest rates or adjustable interest rates. The amounts shown below exclude unearned interest on consumer loans and deferred loan fees.
| Fixed Rates |
| Floating or |
| Total |
| ||||
|
| (In thousands) |
| |||||||
Real estate loans: |
|
|
|
|
|
|
| |||
One- to four-family |
| $ | 186,381 |
| $ | 22,982 |
| $ | 209,363 |
|
Multi-family and commercial |
| 34,549 |
| 5,622 |
| 40,171 |
| |||
Construction |
| — |
| 4,153 |
| 4,153 |
| |||
Consumer loans |
| 73,962 |
| 10,443 |
| 84,405 |
| |||
Commercial loans |
| 4,922 |
| 3,403 |
| 8,325 |
| |||
Total |
| $ | 299,814 |
| $ | 46,603 |
| $ | 346,417 |
|
35
Securities. Our securities portfolio consists primarily of callable U.S. government agency bonds and U.S. government agency mortgage-backed securities. Securities decreased $101.0 million or 30.7%, in the year ended December 31, 2006 primarily as a result of maturities, calls and principal repayments of $145.5 million and the sale of a $17.2 million investment in a mutual fund, offset by purchases of $60.3 million. The purchases consisted of government agency bonds, mortgage-related securities and municipal bonds with an average duration of 3.25 years. We recorded a $394,000 loss on the mutual fund during 2005 upon our determination that the mutual fund was other-than-temporarily impaired. We recorded an additional loss of $17,000 on the date of sale in March 2006. In 2005 and 2004, our securities decreased $695,000 and $5.0 million, respectively, primarily due to decreases in corporate debt securities and mutual funds, offset by increases in obligations of U.S. government agencies and mortgage-related securities. The reduction in corporate debt securities reflected the sale of lower-yielding adjustable-rate perpetual preferred stock of Freddie Mac in an effort to reposition the securities portfolio towards higher-yielding investments.
The following table sets forth the amortized cost and fair values of our securities portfolio at the dates indicated. All of our securities were available-for-sale at the dates indicated.
|
| At December 31, |
| ||||||||||||||||
|
| 2006 |
| 2005 |
| 2004 |
| ||||||||||||
|
| Amortized |
| Fair |
| Amortized |
| Fair |
| Amortized |
| Fair |
| ||||||
|
| (In thousands) |
| ||||||||||||||||
Obligations of U.S. government agencies |
| $ | 42,344 |
| $ | 41,878 |
| $ | 99,602 |
| $ | 98,308 |
| $ | 90,318 |
| $ | 89,252 |
|
State and political subdivisions |
| 24,126 |
| 24,219 |
| 18,863 |
| 18,808 |
| 18,493 |
| 18,571 |
| ||||||
Mortgage-related securities |
| 159,369 |
| 158,320 |
| 189,698 |
| 187,721 |
| 185,263 |
| 185,178 |
| ||||||
Corporate debt securities |
| 4,017 |
| 4,015 |
| 7,926 |
| 7,603 |
| 15,398 |
| 15,559 |
| ||||||
Mutual funds |
| — |
| — |
| 17,064 |
| 17,064 |
| 21,879 |
| 21,639 |
| ||||||
Total |
| $ | 229,856 |
| $ | 228,432 |
| $ | 333,153 |
| $ | 329,504 |
| $ | 331,351 |
| $ | 330,199 |
|
At December 31, 2006, we had no investments in a single company or entity (other than U.S. Government-sponsored entity securities) that had an aggregate book value in excess of 10% of our equity at December 31, 2006.
36
The following table sets forth the stated maturities and weighted average yields of investment securities at December 31, 2006. Weighted average yields on tax-exempt securities are not presented on a tax equivalent basis, as the amount would be immaterial. Certain mortgage-backed securities have adjustable interest rates and will reprice annually within the various maturity ranges. These repricing schedules are not reflected in the table below.
|
| One Year or Less |
| More than One Year |
| More than Five Years |
| More than Ten Years |
| Total |
| |||||||||||||||
|
| Carrying |
| Weighted |
| Carrying |
| Weighted |
| Carrying |
| Weighted |
| Carrying |
| Weighted |
| Carrying |
| Weighted |
| |||||
|
| (Dollars in thousands) |
| |||||||||||||||||||||||
Obligations of U.S. government agencies |
| $ | 17,065 |
| 3.50 | % | $ | 15,279 |
| 4.97 | % | $ | 10,000 |
| 3.93 | % | $ | — |
| — | % | $ | 42,344 |
| 4.13 | % |
State and political subdivisions |
| — |
| — |
| — |
| — |
| 9,479 |
| 5.54 |
| 14,647 |
| 6.14 |
| 24,126 |
| 5.91 |
| |||||
Mortgage-related securities |
| 715 |
| 4.07 |
| 35,694 |
| 3.99 |
| 13,200 |
| 4.55 |
| 109,760 |
| 5.22 |
| 159,369 |
| 4.89 |
| |||||
Corporate debt securities |
| 4,017 |
| 4.57 |
| — |
| — |
| — |
| — |
| — |
| — |
| 4,017 |
| 4.57 |
| |||||
Total |
| $ | 21,797 |
|
|
| $ | 50,973 |
|
|
| $ | 32,679 |
|
|
| $ | 124,407 |
|
|
| $ | 229,856 |
|
|
|
37
Deposits. Our primary source of funds is our deposit accounts, which are comprised of noninterest-bearing accounts, interest-bearing NOW accounts, money market accounts, savings accounts and certificates of deposit. These deposits are provided primarily by individuals and business within our market areas. Deposits decreased $85.8 million, or 12.6%, for the year ended December 31, 2006 primarily as a result of decreases in NOW accounts, certificates of deposit and savings accounts due to the high level of competition and the nature of the single-relationship we have with our depositors. Additionally, the decrease in NOW accounts was also attributable to the decrease in construction loans. We require that our construction loan borrowers maintain a compensating balance, in the form of a NOW account, with us. As these loans were paid off or refinanced at other institutions the borrowers withdrew their compensating balance. During 2005, our deposits decreased by $122.9 million, or 15.3%, primarily as a result of decreased money market accounts and certificates of deposit primarily due to lower rates of interest offered. The decrease in money market accounts and increase in NOW accounts reflected the addition of check writing features to certain money market accounts in 2005 thereby causing $98.9 million of such accounts to be reclassified as NOW accounts. Deposits increased in 2004 by $81.4 million, or 11.2%. This increase was primarily the result of higher interest rates offered. Traditionally, we attempted to be the market leader in rates on longer-term money market accounts and certificates of deposit. However, in 2005, the new management, in connection with planned reductions in the balance sheet, offered rates that lagged the market as it attempted to allow the longer-term money market accounts and certificates of deposit to run-off, thereby shortening the duration of its liabilities. Deposit rates were increased to be more compettitve beginning in November 2005.
The following table sets forth the balances of our deposit products at the dates indicated.
| At December 31, |
| ||||||||
|
| 2006 |
| 2005 |
| 2004 |
| |||
|
| (In thousands) |
| |||||||
|
|
|
|
|
|
|
| |||
Noninterest-bearing demand accounts |
| $ | 41,429 |
| $ | 37,876 |
| $ | 29,119 |
|
NOW accounts |
| 50,717 |
| 87,072 |
| 44,118 |
| |||
Money market accounts |
| 29,770 |
| 27,975 |
| 132,803 |
| |||
Savings accounts |
| 64,338 |
| 80,098 |
| 92,427 |
| |||
Certificates of deposit |
| 410,280 |
| 449,286 |
| 506,783 |
| |||
Total |
| $ | 596,534 |
| $ | 682,307 |
| $ | 805,250 |
|
The following table indicates the amount of jumbo certificates of deposit by time remaining until maturity as December 31, 2006. Jumbo certificates of deposit require minimum deposits of $100,000. We did not have any brokered deposits as of December 31, 2006.
Maturity Period |
| Certificates |
| |
|
| (In thousands) |
| |
Three months or less |
| $ | 9,299 |
|
Over three through six months |
| 8,523 |
| |
Over six through twelve months |
| 15,354 |
| |
Over twelve months |
| 40,769 |
| |
Total |
| $ | 73,945 |
|
38
The following table sets forth the time deposits classified by rates at the dates indicated.
| Year Ended December 31, |
| ||||||||
|
| 2006 |
| 2005 |
| 2004 |
| |||
|
| (In thousands) |
| |||||||
|
|
|
|
|
|
|
| |||
0.00 — 1.00% |
| $ | — |
| $ | — |
| $ | — |
|
1.01 — 2.00% |
| — |
| 77 |
| 96,618 |
| |||
2.01 — 3.00% |
| 8,028 |
| 144,197 |
| 164,696 |
| |||
3.01 — 4.00% |
| 160,416 |
| 210,739 |
| 143,561 |
| |||
4.01 — 5.00% |
| 176,206 |
| 57,573 |
| 57,193 |
| |||
5.01 — 6.00% |
| 45,852 |
| 16,332 |
| 17,300 |
| |||
6.01 — greater |
| 19,778 |
| 20,368 |
| 27,415 |
| |||
Total |
| $ | 410,280 |
| $ | 449,286 |
| $ | 506,783 |
|
The following table sets forth the amount and maturities of time deposits classified by rates at December 31, 2006.
|
| Amount Due |
|
|
|
|
| |||||||||||
|
| Less Than |
| More Than |
| More Than |
| More Than |
| Total |
| Percent of |
| |||||
|
| (Dollars in thousands) |
| |||||||||||||||
0.00 — 1.00% |
| $ | — |
| $ | — |
| $ | — |
| $ | — |
| $ | — |
| — | % |
1.01 — 2.00% |
| — |
| — |
| — |
| — |
| — |
| — |
| |||||
2.01 — 3.00% |
| 7,930 |
| 15 |
| — |
| 83 |
| 8,028 |
| 2.0 |
| |||||
3.01 — 4.00% |
| 97,777 |
| 34,844 |
| 17,882 |
| 9,913 |
| 160,416 |
| 39.1 |
| |||||
4.01 — 5.00% |
| 105,840 |
| 25,026 |
| 30,713 |
| 14,627 |
| 176,206 |
| 42.9 |
| |||||
5.01 — 6.00% |
| 9,300 |
| 6,383 |
| 10,101 |
| 20,068 |
| 45,852 |
| 11.2 |
| |||||
6.01 — greater |
| 2,888 |
| 808 |
| 5,251 |
| 10,831 |
| 19,778 |
| 4.8 |
| |||||
Total |
| $ | 223,735 |
| $ | 67,076 |
| $ | 63,947 |
| $ | 55,522 |
| $ | 410,280 |
| 100.0 | % |
The following table sets forth the time deposit activity for the periods indicated.
| Year Ended December 31, |
| ||||||||
|
| 2006 |
| 2005 |
| 2004 |
| |||
|
| (In thousands) |
| |||||||
|
|
|
|
|
|
|
| |||
Beginning balance |
| $ | 449,286 |
| $ | 506,783 |
| $ | 495,651 |
|
Decrease before interest credited |
| (55,740 | ) | (73,870 | ) | (4,109 | ) | |||
Interest credited |
| 16,734 |
| 16,373 |
| 15,241 |
| |||
Net increase (decrease) in time deposits |
| (39,006 | ) | (57,497 | ) | 11,132 |
| |||
Ending balance |
| $ | 410,280 |
| $ | 449,286 |
| $ | 506,783 |
|
39
Borrowings. We utilize borrowings from the Federal Home Loan Bank of Pittsburgh to supplement our supply of funds for loans and investments.
| Year Ended December 31, |
| ||||||||
|
| 2006 |
| 2005 |
| 2004 |
| |||
|
| (Dollars in thousands) |
| |||||||
|
|
|
|
|
|
|
| |||
Maximum amount of advances outstanding at any month end during the period |
| $ | 30,000 |
| $ | 30,000 |
| $ | 30,000 |
|
Average advances outstanding during the period |
| 30,000 |
| 30,000 |
| 30,000 |
| |||
Weighted average interest rate during the period |
| 4.88 | % | 4.88 | % | 4.88 | % | |||
Balance outstanding at end of period |
| $ | 30,000 |
| $ | 30,000 |
| $ | 30,000 |
|
Weighted average interest rate at end of period |
| 4.88 | % | 4.88 | % | 4.88 | % | |||
Results of Operations for the Years Ended December 31, 2006, 2005 and 2004
Overview.
| Years Ended December 31, |
| ||||||||
|
| 2006 |
| 2005 |
| 2004 |
| |||
|
| (Dollars in thousands) |
| |||||||
|
|
|
|
|
|
|
| |||
Net income (loss) |
| $ | 3,634 |
| $ | 5,960 |
| $ | (1,888 | ) |
Return on average assets |
| 0.49 | % | 0.71 | % | (0.21 | )% | |||
Return on average equity |
| 4.59 |
| 9.50 |
| (2.82 | ) | |||
Average equity to average assets |
| 10.58 |
| 7.44 |
| 7.59 |
| |||
2006 vs. 2005. Net income decreased $2.3 million for 2006 compared to 2005 primarily due to a $1.8 million increase in salaries, benefits and other compensation as well as a $1.5 million contribution to the Fox Chase Charitable Foundation, offset by an increase in noninterest income and decrease in income tax expense.
2005 vs. 2004. Net income increased $7.8 million for 2005 compared to 2004 primarily due to a $6.0 million credit to the allowance for loan losses in 2005 compared to a provision for loan losses of $12.3 million in 2004, offset by a decrease in net interest income and noninterest income and increases in noninterest expenses.
Net Interest Income.
2006 vs. 2005. Net interest income decreased by $186,000, or 1.1%, to $16.7 million in 2006. Total interest income decreased $424,000, or 1.1%, to $37.2 million for 2006, due to a decrease of $4.0 million in interest and fees on loans, offset by a $2.4 million increase in interest income on mortgage-related securities and a $1.2 million increase in other interest income. The increase in other interest income was primarily the result of the proceeds from the Company’s stock offering being invested in short-term overnight deposits. Interest income on loans decreased $4.0 million, or 15.5%, to $21.7 million between the periods due to a decrease of $95.7 million in the average outstanding balance of loans, offset by a 40 basis point increase in the average yield due primarily to higher market interest rates. Interest and dividend income on securities and overnight investments increased $3.6 million, or 29.9% to $12.9 million between the periods primarily due to a 128 basis point increase in the yield on mortgage-related securities and the investment of the proceeds from the Bank’s conversion to a public entity.
Total interest expense decreased $238,000, or 1.1%, to $20.5 million for 2006, due primarily to a $117.2 million decrease in the average balance of deposits which resulted in a reduction of interest expense of $2.7 million, offset by an increase in the average rate paid on deposits of 49 basis points, resulting in a $2.5 million increase in interest expense.
2005 vs. 2004. Net interest income decreased by $969,000, or 5.4%, to $16.9 million in 2005. Total interest income increased $35,000, or 0.1%, to $37.6 million for 2005, as increases in interest and dividends on securities were offset by a decrease in interest income on loans. Interest income on loans decreased 6.1% to $25.7
40
million between the periods due to an decrease in average balances and a 15 basis point decrease in the average yield. Interest and dividend income on securities increased 6.8% to $10.3 million between the periods due to an increase in average yield as proceeds from maturing or sold securities were reinvested into securities with a higher yield. Securities also increased due to an increase in the average balances.
Total interest expense increased $1.0 million or 5.1% to $20.7 million for 2005, due primarily to a 27 basis point increase in average deposit costs, which was partially offset by a $39.1 million decrease in average balances. The decrease in average balances was caused by a $20.8 million decrease in the average balance of certificates of deposit, a $9.7 million decrease in NOW and money market deposit accounts and an $8.6 million decrease in the average balance of savings accounts. Due to the lending restrictions imposed on us by the Office of Thrift Supervision in 2005, we had reduced liquidity needs and allowed these deposits to run-off.
41
Average Balances and Yields. The following table presents information regarding average balances of assets and liabilities, the total dollar amounts of interest income and dividends from average interest-earning assets, the total dollar amounts of interest expense on average interest-bearing liabilities, and the resulting annualized average yields and costs. The yields and costs for the periods indicated are derived by dividing income or expense by the average balances of assets or liabilities, respectively, for the periods presented. For purposes of this table, average balances have been calculated using month-end balances, and nonaccrual loans are included in average balances only. Management does not believe that the use of month-end balances instead of daily average balances has caused any material differences in the information presented. Loan fees are included in interest income on loans and are insignificant. Yields are not presented on a tax-equivalent basis. Any adjustments necessary to present yields on a tax-equivalent basis are insignificant.
|
| Years Ended December 31, |
| ||||||||||||||||||||||
|
| 2006 |
| 2005 |
| 2004 |
| ||||||||||||||||||
|
| Average |
| Interest |
| Yield/ |
| Average |
| Interest |
| Yield/ |
| Average |
| Interest |
| Yield/ |
| ||||||
|
| (Dollars in thousands) |
| ||||||||||||||||||||||
|
|
|
|
|
|
|
|
|
|
|
|
|
|
|
|
|
|
|
| ||||||
Assets: |
|
|
|
|
|
|
|
|
|
|
|
|
|
|
|
|
|
|
| ||||||
Interest-earning assets: |
|
|
|
|
|
|
|
|
|
|
|
|
|
|
|
|
|
|
| ||||||
Interest-earning demand deposits |
| $ | 49,182 |
| $ | 2,573 |
| 5.23 | % | $ | 43,973 |
| $ | 1,549 |
| 3.53 | % | $ | 38,507 |
| $ | 511 |
| 1.33 | % |
Mortgage-backed securities |
| 184,558 |
| 8,035 |
| 4.35 |
| 183,931 |
| 5,641 |
| 3.07 |
| 185,135 |
| 5,178 |
| 2.80 |
| ||||||
Taxable securities |
| 100,271 |
| 3,893 |
| 3.88 |
| 120,732 |
| 3,935 |
| 3.26 |
| 131,479 |
| 3,787 |
| 2.88 |
| ||||||
Nontaxable securities |
| 23,427 |
| 934 |
| 3.99 |
| 20,298 |
| 754 |
| 3.71 |
| 17,833 |
| 704 |
| 3.95 |
| ||||||
Loans |
| 359,964 |
| 21,742 |
| 6.04 |
| 455,711 |
| 25,722 |
| 5.64 |
| 472,763 |
| 27,386 |
| 5.79 |
| ||||||
Allowance for loan losses |
| (7,057 | ) | — |
| — |
| (13,849 | ) | — |
| — |
| (3,133 | ) | — |
| — |
| ||||||
Net loans |
| 352,907 |
| 21,742 |
| 6.04 |
| 441,862 |
| 25,722 |
| 5.64 |
| 469,630 |
| 27,386 |
| 5.79 |
| ||||||
Total interest-earning assets |
| 710,345 |
| 37,177 |
| 5.29 |
| 810,796 |
| 37,601 |
| 4.56 |
| 842,584 |
| 37,566 |
| 4.44 |
| ||||||
|
|
|
|
|
|
|
|
|
|
|
|
|
|
|
|
|
|
|
| ||||||
Noninterest-earning assets |
| 37,461 |
|
|
|
|
| 30,765 |
|
|
|
|
| 40,123 |
|
|
|
|
| ||||||
Total assets |
| $ | 747,806 |
|
|
|
|
| $ | 841,561 |
|
|
|
|
| $ | 882,707 |
|
|
|
|
| |||
|
|
|
|
|
|
|
|
|
|
|
|
|
|
|
|
|
|
|
| ||||||
Liabilities and equity: |
|
|
|
|
|
|
|
|
|
|
|
|
|
|
|
|
|
|
| ||||||
Interest-bearing liabilities: |
|
|
|
|
|
|
|
|
|
|
|
|
|
|
|
|
|
|
| ||||||
NOW and money market deposit accounts |
| $ | 90,129 |
| 1,683 |
| 1.87 |
| $ | 137,370 |
| 2,091 |
| 1.52 |
| $ | 147,070 |
| 2,059 |
| 1.40 |
| |||
Savings accounts |
| 75,212 |
| 557 |
| 0.74 |
| 88,501 |
| 748 |
| 0.85 |
| 97,103 |
| 904 |
| 0.93 |
| ||||||
Certificates of deposit |
| 430,736 |
| 16,734 |
| 3.88 |
| 487,401 |
| 16,373 |
| 3.36 |
| 508,235 |
| 15,241 |
| 3.00 |
| ||||||
Total interest-bearing deposits |
| 596,077 |
| 18,974 |
| 3.18 |
| 713,272 |
| 19,212 |
| 2.69 |
| 752,408 |
| 18,204 |
| 2.42 |
| ||||||
|
|
|
|
|
|
|
|
|
|
|
|
|
|
|
|
|
|
|
| ||||||
FHLB advances |
| 30,000 |
| 1,485 |
| 4.88 |
| 30,000 |
| 1,485 |
| 4.88 |
| 30,000 |
| 1,489 |
| 4.88 |
| ||||||
Total interest-bearing liabilities |
| 626,077 |
| 20,459 |
| 3.27 |
| 743,272 |
| 20,697 |
| 2.78 |
| 782,408 |
| 19,693 |
| 2.52 |
| ||||||
|
|
|
|
|
|
|
|
|
|
|
|
|
|
|
|
|
|
|
| ||||||
Noninterest-bearing deposits |
| 36,245 |
|
|
|
|
| 33,054 |
|
|
|
|
| 27,092 |
|
|
|
|
| ||||||
Other noninterest-bearing liabilities |
| 6,342 |
|
|
|
|
| 2,507 |
|
|
|
|
| 6,174 |
|
|
|
|
| ||||||
Total liabilities |
| 668,664 |
|
|
|
|
| 778,833 |
|
|
|
|
| 815,674 |
|
|
|
|
| ||||||
|
|
|
|
|
|
|
|
|
|
|
|
|
|
|
|
|
|
|
| ||||||
Retained earnings |
| 80,183 |
|
|
|
|
| 64,565 |
|
|
|
|
| 67,162 |
|
|
|
|
| ||||||
Accumulated comprehensive income |
| (1,041 | ) |
|
|
|
| (1,837 | ) |
|
|
|
| (129 | ) |
|
|
|
| ||||||
|
|
|
|
|
|
|
|
|
|
|
|
|
|
|
|
|
|
|
| ||||||
Total equity |
| $ | 79,142 |
|
|
|
|
| $ | 62,728 |
|
|
|
|
| $ | 67,033 |
|
|
|
|
| |||
|
|
|
|
|
|
|
|
|
|
|
|
|
|
|
|
|
|
|
| ||||||
Total liabilities and equity |
| $ | 747,806 |
|
|
|
|
| $ | 841,561 |
|
|
|
|
| $ | 882,707 |
|
|
|
|
| |||
|
|
|
|
|
|
|
|
|
|
|
|
|
|
|
|
|
|
|
| ||||||
Net interest income |
|
|
| $ | 16,718 |
|
|
|
|
| $ | 16,904 |
|
|
|
|
| $ | 17,873 |
|
|
| |||
Interest rate spread |
|
|
|
|
| 2.02 | % |
|
|
|
| 1.78 | % |
|
|
|
| 1.92 | % | ||||||
Net interest margin |
|
|
|
|
| 2.33 | % |
|
|
|
| 2.05 | % |
|
|
|
| 2.11 | % | ||||||
Average interest-earning assets to average interest-bearing liabilities |
|
|
|
|
| 113.46 | % |
|
|
|
| 109.08 | % |
|
|
|
| 107.69 | % | ||||||
42
Rate/Volume Analysis. The following table sets forth the effects of changing rates and volumes on our net interest income. The rate column shows the effects attributable to changes in rate (changes in rate multiplied by prior volume). The volume column shows the effects attributable to changes in volume (changes in volume multiplied by prior rate). The net column represents the sum of the prior columns. For purposes of this table, changes attributable to changes in both rate and volume that cannot be segregated have been allocated proportionally based on the changes due to rate and the changes due to volume.
|
| Year Ended |
| Year Ended |
| ||||||||||||||
|
| Increase (Decrease) |
|
|
| Increase (Decrease) |
|
|
| ||||||||||
|
| Volume |
| Rate |
| Net |
| Volume |
| Rate |
| Net |
| ||||||
|
|
|
|
|
|
|
|
|
|
|
|
|
| ||||||
Interest and dividend income: |
|
|
|
|
|
|
|
|
|
|
|
|
| ||||||
Interest-earning demand deposits |
| $ | 185 |
| $ | 839 |
| $ | 1,024 |
| $ | 72 |
| $ | 966 |
| $ | 1,038 |
|
Loans |
| (5,404 | ) | 1,424 |
| (3,980 | ) | (988 | ) | (676 | ) | (1,664 | ) | ||||||
Mortgage-backed securities |
| 19 |
| 2,375 |
| 2,394 |
| (34 | ) | 497 |
| 463 |
| ||||||
Taxable securities |
| (667 | ) | 625 |
| (42 | ) | (310 | ) | 458 |
| 148 |
| ||||||
Nontaxable securities |
| 116 |
| 64 |
| 180 |
| 97 |
| (47 | ) | 50 |
| ||||||
Total interest-earning assets |
| (5,751 | ) | 5,327 |
| (424 | ) | (1,163 | ) | 1,198 |
| 35 |
| ||||||
|
|
|
|
|
|
|
|
|
|
|
|
|
| ||||||
Interest expense: |
|
|
|
|
|
|
|
|
|
|
|
|
| ||||||
NOW and money market deposits |
| (719 | ) | 311 |
| (408 | ) | (136 | ) | 168 |
| 32 |
| ||||||
Savings accounts |
| (112 | ) | (78 | ) | (191 | ) | (80 | ) | (76 | ) | (156 | ) | ||||||
Certificates of deposit |
| (1,904 | ) | 2,264 |
| 361 |
| (625 | ) | 1,757 |
| 1,132 |
| ||||||
Total interest-bearing deposits |
| (2,735 | ) | 2,497 |
| (238 | ) | (841 | ) | 1,849 |
| 1,008 |
| ||||||
|
|
|
|
|
|
|
|
|
|
|
|
|
| ||||||
FHLB advances |
| — |
| — |
| — |
|
|
| (4 | ) | (4 | ) | ||||||
Total interest-bearing liabilities |
| (2,735 | ) | 2,497 |
| (238 | ) | (841 | ) | 1,845 |
| 1,004 |
| ||||||
|
|
|
|
|
|
|
|
|
|
|
|
|
| ||||||
Net change in interest income |
| $ | (3,016 | ) | $ | 2,830 |
| $ | (186 | ) | $ | (322 | ) | $ | (647 | ) | $ | (969 | ) |
Provision for Loan Losses.
2006 vs. 2005. We had a credit to the provision for loan losses of $5.4 million in 2006 compared to a credit of $6.0 million in 2005. The 2006 credit to the provision reflected: (1) continued reductions in the levels of criticized and classified loans from $34.7 million at December 31, 2005 to $5.0 million at December 31, 2006 due to the collection on one of the Bank’s significant nonperforming loans totaling $2.5 million; (2) the absence of charge-offs in 2006; and (3) a $16.3 million, or 4.3%, decrease in the size of the loan portfolio, including a $19.4 million, or 62.7%, decrease in the construction portfolio, which carries higher risk of default than one-to four family residential real estate loans.
2005 vs. 2004. We had a credit to the provision for loan losses of $6.0 million in 2005 compared to a provision of $12.3 million in 2004. The 2005 credit to the provision was substantially impacted by the new management team and board of directors who launched initiatives to collect loans at the New Jersey shore area, gather sufficient borrower information to properly document existing loans when possible, assign proper risk grades to loans following newly implemented credit risk assessment policies, establish and maintain well documented estimates for the allowance for loan losses, and establish appropriate underwriting, credit administration, and prudent credit risk management policies and procedures. Also, various high-risk construction loans in our New Jersey market area were rescinded or refinanced with other financial institutions. Additionally, certain borrowers were removed from classified status due to improvements in documentation on their loans or in the credit profile of the borrower. As a result of these actions and continued favorable economic conditions at the New Jersey shore area, criticized and classified assets were reduced from $90.7 million at December 31, 2004 to $40.9 million at December 31, 2005, thus reducing the need for allowance for loan losses, which resulted in the $6.0 million credit to
43
the provision for loan losses. The reduction in the allowance also reflected the absence of significant charge-offs in 2005 and a $123.2 million, or 24.7%, decrease in the size of the loan portfolio, including a $52.7 million, or 61.5%, decrease in the multi-family and commercial real estate portfolio and a $61.2 million, or 66.4%, decrease in the construction portfolio, both of which carry higher risk of default than one- to four-family residential real estate loans. Additionally, the credit to the provision for loan losses reflected the engagement of three independent loan consultants to separately assess the credit quality of the loan portfolio and the classification of assets and to assist with establishing proper risk-weighting of loans.
An analysis of the changes in the allowance for loan losses is presented under “—Risk Management—Analysis and Determination of the Allowance for Loan Losses.”
Noninterest Income. The following table shows the components of noninterest income for the years ended 2006, 2005 and 2004.
|
| Years Ended December 31, |
| % Change |
| % Change |
| |||||||
|
| 2006 |
| 2005 |
| 2004 |
| 2006/2005 |
| 2005/2004 |
| |||
|
| (In thousands) |
|
|
|
|
| |||||||
|
|
|
|
|
|
|
|
|
|
|
| |||
Service charges and other fee income |
| $ | 1,037 |
| $ | 775 |
| $ | 937 |
| 33.8 | % | (17.3 | )% |
Net gain (loss) on sale of: |
|
|
|
|
|
|
|
|
|
|
| |||
Loans |
| 199 |
| 567 |
| 279 |
| (64.9 | ) | 103.2 |
| |||
Assets acquired through foreclosure |
| 85 |
| 6 |
| 24 |
| 1,316.7 |
| (75.0 | ) | |||
Fixed assets |
| (59 | ) | (161 | ) | (4 | ) | (63.4 | ) | (3,925.0 | ) | |||
Mortgage-related securities |
| — |
| 108 |
| 28 |
| (100.0 | ) | 285.7 |
| |||
Securities (losses) gains and impairment losses, net |
| (17 | ) | (917 | ) | 141 |
| (98.2 | ) | (750.4 | ) | |||
Income on bank-owned life insurance |
| 427 |
| 448 |
| 447 |
| (4.7 | ) | 0.2 |
| |||
Other |
| 401 |
| 388 |
| 427 |
| 3.4 |
| (9.1 | ) | |||
Total |
| $ | 2,073 |
| $ | 1,214 |
| $ | 2,279 |
| 70.8 |
| (46.7 | ) |
2006 vs. 2005. Noninterest income increased primarily due to a $917,000 loss on sale and impairment of securities that was recorded in 2005 as discussed further below. Such losses in 2006 totalled only $17,000 in connection with the sale of mutual funds. Also, service charges and other fee income increased due to increased loan servicing fee income associated with the larger portfolio of loans serviced for others in 2006 compared to 2005. These increases were offset by decreases in the gain on the sale of mortgage-related securities and the gain on sale of loans. The decrease in the gain on the sale of loans was due to approximately $24.9 million loans being sold in the year ended December 31, 2006 compared to approximately $83.3 million loans being sold in 2005.
2005 vs. 2004. During 2005, noninterest income decreased due primarily to a decrease in service charges and losses on the sale of securities and impairment losses and fixed assets, offset by an increase in the gain on the sale of loans. Service charges and other fee income decreased due to the decrease in money market accounts and due to a change in the fee structure in connection with deposit account overdrafts. The loss on the sale of available-for-sale securities in 2005 reflected the sale of lower-yielding adjustable-rate perpetual preferred stock of Freddie Mac in an effort to reposition the securities portfolio towards higher-yielding investments. The increase in gain on the sale of loans in 2005 was due to approximately $83.8 million of loans being sold in 2005 compared to $45.7 million in 2004. The loss on the sale of fixed assets in 2005 was due to the sale, transfer and write-down of various assets, primarily older computer equipment. The impairment loss in 2005 was the result of the determination by management that an investment in a mutual fund was other-than-temporarily impaired. This mutual fund investment was sold in March 2006. An additional loss of $17,000 was recorded at the sale date.
44
Noninterest Expenses. The following table shows the components of noninterest expenses and the percentage changes for the years ended 2006, 2005 and 2004.
|
| Years Ended December 31, |
| % Change |
| % Change |
| |||||||
|
| 2006 |
| 2005 |
| 2004 |
| 2006/2005 |
| 2005/2004 |
| |||
|
| (In thousands) |
|
|
|
|
| |||||||
|
|
|
|
|
|
|
|
|
|
|
| |||
Salaries, benefits and other compensation |
| $ | 9,194 |
| $ | 7,442 |
| $ | 5,875 |
| 23.5 | % | 26.7 | % |
Occupancy expense |
| 1,567 |
| 1,740 |
| 1,499 |
| (9.9 | ) | 16.1 |
| |||
Furniture and equipment expense |
| 1,048 |
| 814 |
| 687 |
| 28.8 |
| 18.5 |
| |||
Data processing costs |
| 1,514 |
| 1,452 |
| 1,242 |
| 4.3 |
| 16.9 |
| |||
Professional fees |
| 1,853 |
| 1,127 |
| 419 |
| 64.4 |
| 169.0 |
| |||
Marketing expense |
| 621 |
| 373 |
| 407 |
| 66.5 |
| (8.4 | ) | |||
FDIC premiums |
| 796 |
| 765 |
| 115 |
| 4.1 |
| 565.2 |
| |||
Charitable Foundation Contribution Expense |
| 1,500 |
| — |
| — |
| — |
| — |
| |||
Other |
| 1,774 |
| 1,495 |
| 1,109 |
| 18.7 |
| 34.8 |
| |||
Total |
| $ | 19,867 |
| $ | 15,208 |
| $ | 11,353 |
| 30.6 |
| 34.0 |
|
2006 vs. 2005. In 2006, noninterest expense increased due to a $1.5 million contribution to the Fox Chase Charitable Foundation, which was established and funded in connection with the Bank’s mutual holding company reorganization. The increase was also due to increases in salaries, benefits and other compensation, furniture and equipment expense, professional fees, marketing expenses and other operating expenses. The increased salaries, benefits and other compensation reflected the hiring of nineteen commercial lending and commercial credit and risk management professionals since 2005 and the additional staff hired in connection with the opening of our Marmora branch office in March 2006. The Company also recorded compensation expense of $512,000 in the fourth quarter of 2006 related to the first year’s allocation from the recently implemented Fox Chase Bank Employee Stock Ownership Plan. Furniture and equipment expenses increased $234,000 due to an increase in depreciation related expense for certain assets whose depreciable lives were corrected in 2006, and to a lesser extent due to the opening of the new Marmora branch office and two new loan production offices. Professional fees increased $726,000 due to the hiring of consulting firms to assist with the implementation of internal policies and procedures related to the Sarbanes-Oxley Act as well as fees related to various strategic considerations the Company is considering. FDIC premiums are expected to be reduced to levels experienced in 2004 as a result of the lifting of our troubled designation status in June 2006. Other expenses for 2006 also includes an adjustment of $232,000 related to errors in prior periods in the procedures for closing and reconciling transactions in our automated teller machine system. Such errors were discovered in 2006 and an analysis of the materiality of this adjustment, along with the depreciation adjustment, was completed and management concluded that these items were not material to any of the historical periods presented herein.
2005 vs. 2004. In 2005, noninterest expenses increased due primarily to increases in salaries, benefits and other compensation, occupancy, furniture and equipment expense, data processing costs, professional fees and Federal Deposit Insurance Corporation premiums. The increase in salaries, benefits and other compensation was the result of the increase in the number of employees due to a new branch opening in December 2004 and additional staff hired to assist in the increased loan collection efforts and $375,000 related to the freezing of the pension plan, effective December 31, 2005. Salaries, benefits and other compensation reflected increases between 2005 and 2004 since the Bank was unable to defer loan origination costs in 2005 due to the regulatory prohibition on originating certain types of loans. In 2004, the Bank deferred approximately $1.1 million of such costs. Occupancy, furniture and equipment expense increased due to a new branch that opened in December 2004. Data processing costs increased due to the opening of the new branch and due to additional costs in connection with new technology implemented in 2005. Professional fees increased in 2005 due to additional legal fees to assist with compliance with the Cease and Desist Order instituted by the Office of Thrift Supervision in June 2005, and additional professionals that were hired to conduct loan reviews, monitor the credit quality of the loan portfolio and assist with interest rate risk management. The increased Federal Deposit Insurance Corporation premiums resulted from our designation by the Office of Thrift Supervision as a troubled institution for regulatory purposes in January 2005. However, due to the lifting of our troubled institution designation in June 2006, we anticipate that our Federal Deposit Insurance Corporation premiums will return to historic levels. Other expenses increased in 2005 due to our inability to defer loan expense in 2005 due to the regulatory prohibition on originating certain types of loans, to an increase in search
45
and recording fees of approximately $70,000 relating to criticized and classified loans and to increased assessments by the Office of Thrift Supervision due to our troubled institution designation.
Income Taxes.
2006 vs. 2005. Income tax expense for 2006 was $684,000 compared to $3.0 million for 2005. The decrease in 2006 was primarily due to a $4.6 million decrease in pre-tax net income. The effective tax rate for 2006 and 2005 was 15.8% and 33.3%, respectively. The effective tax rate in 2006 was lower than the statutory federal tax rate of 34.0% primarily due to the Company reversing a valuation allowance of $312,000 it had established in 2005 for possible non-realizable deferred tax asset benefits associated with certain capital loss carryforwards. The Bank entered into an agreement to sell one of its office facilities in the fourth quarter of 2006 that is projected to result in sufficient capital gain income to utilize such capital loss carryforwards.
2005 vs. 2004. Income tax expense for 2005 was $3.0 million compared to a benefit of $1.6 million for 2004. The increase in 2005 was primarily due to $8.9 million in pre-tax net income compared to a pre-tax loss of $3.5 million in 2004. The effective tax rate for 2005 and 2004 was 33.3% and (45.8%), respectively. The effective tax rate in 2005 was lower than the statutory federal tax rate of 34.0% due to the higher level of tax-exempt income as a percentage of pre-tax book income, net of additional income tax expense recognized in 2005 due to our inability to recognize tax benefits associated with capital losses recorded on the sale and write-down of certain investments during 2005.
Overview. Managing risk is an essential part of successfully managing a financial institution. Our most prominent risk exposures are credit risk, interest rate risk and market risk. Credit risk is the risk of not collecting the interest and/or the principal balance of a loan or investment when it is due. Interest rate risk is the potential reduction of net interest income as a result of changes in interest rates. Market risk arises from fluctuations in interest rates that may result in changes in the values of financial instruments, such as available-for-sale securities, that are accounted for on a mark-to-market basis. Other risks that we face are operational risks, liquidity risks and reputation risk. Operational risks include risks related to fraud, regulatory compliance, processing errors, technology and disaster recovery. Liquidity risk is the possible inability to fund obligations to depositors, lenders or borrowers due to unforeseen circumstances. Reputation risk is the risk that negative publicity or press, whether true or not, could cause a decline in our customer base or revenue.
Credit Risk Management. Our strategy for credit risk management focuses on having well-defined credit policies and uniform underwriting criteria and providing prompt attention to potential problem loans. Historically, this strategy also emphasizes the origination of one- to four-family mortgage loans, which typically have lower default rates than other types of loans and are secured by collateral that generally tends to appreciate in value.
When a borrower fails to make a required loan payment, we take a number of steps to attempt to have the borrower cure the delinquency and restore the loan to current status. When the loan becomes 15 days past due, a late notice is generated and sent to the borrower. A second notice is sent and phone calls are made ten days later. If payment is not received by the 30th day of delinquency, a further notification is sent to the borrower. If payment is not received by the 45th day of delinquency for a loan on a Pennsylvania property or the 60th day of delinquency for a loan on a New Jersey property, a notice is sent to the borrower advising them that they have a specified period of time to cure their default before legal action begins. If no successful workout can be achieved, after a loan becomes 90 days delinquent, we typically commence foreclosure or other legal proceedings. If a foreclosure action is instituted and the loan is not brought current, paid in full, or refinanced before the foreclosure sale, the real property securing the loan generally is sold at foreclosure. We also may consider loan workout arrangements with certain borrowers under certain circumstances.
Management reports to the Board of Directors or a committee of the Board monthly regarding the amount of loans delinquent more than 30 days, all loans in foreclosure and all foreclosed and repossessed property that we own.
46
Analysis of Nonperforming and Classified Assets. We consider repossessed assets and loans that are 90 days or more past due to be nonperforming assets. Loans are generally placed on nonaccrual status when they become 90 days delinquent at which time the accrual of interest ceases and the allowance for any uncollectible accrued interest is established and charged against operations. Typically, payments received on a nonaccrual loan are applied to the outstanding principal and interest as determined at the time of collection of the loan.
Real estate that we acquire as a result of foreclosure or by deed-in-lieu of foreclosure is classified as foreclosed assets until it is sold. When property is acquired, it is initially recorded at the lower of its cost or market value, less estimate selling expenses. Holding costs and declines in fair value after acquisition of the property result in charges against income.
The following table provides information with respect to our nonperforming assets at the dates indicated. We did not have any troubled debt restructurings at the dates presented.
|
| At December 31, |
| |||||||||||||
|
| 2006 |
| 2005 |
| 2004 |
| 2003 |
| 2002 |
| |||||
|
| (Dollars in thousands) |
| |||||||||||||
|
|
|
|
|
|
|
|
|
|
|
| |||||
Nonaccrual loans: |
|
|
|
|
|
|
|
|
|
|
| |||||
One- to four-family |
| $ | 284 |
| $ | 548 |
| $ | 1,442 |
| $ | 1,324 |
| $ | 1,314 |
|
Multi-family and commercial real estate |
| — |
| 2,972 |
| — |
| — |
| — |
| |||||
Total |
| 284 |
| 3,520 |
| 1,442 |
| 1,324 |
| 1,314 |
| |||||
|
|
|
|
|
|
|
|
|
|
|
| |||||
Accruing loans past due 90 days or more: |
|
|
|
|
|
|
|
|
|
|
| |||||
Multi-family and commercial real estate |
| 2,941 |
| 1,574 |
| — |
| — |
| — |
| |||||
Total |
| 2,941 |
| 1,574 |
| — |
| — |
| — |
| |||||
Total of nonaccrual loans and accruing loans 90 days or more past due |
| $ | 3,225 |
| $ | 5,094 |
| $ | 1,442 |
| $ | 1,324 |
| $ | 1,314 |
|
|
|
|
|
|
|
|
|
|
|
|
| |||||
Real estate owned |
| — |
| 107 |
| — |
| — |
| — |
| |||||
|
|
|
|
|
|
|
|
|
|
|
| |||||
Total nonperforming assets |
| $ | 3,225 |
| $ | 5,201 |
| $ | 1,442 |
| $ | 1,324 |
| $ | 1,314 |
|
|
|
|
|
|
|
|
|
|
|
|
| |||||
Total nonperforming loans and accruing loans past due 90 days or more to total loans |
| 0.90 | % | 1.36 | % | 0.29 | % | 0.32 | % | 0.32 | % | |||||
Total nonperforming loans to total assets |
| 0.43 |
| 0.65 |
| 0.16 |
| 0.16 |
| 0.17 |
| |||||
Total nonperforming assets to total assets |
| 0.43 |
| 0.67 |
| 0.16 |
| 0.16 |
| 0.17 |
| |||||
At December 31, 2006, accruing multi-family and commercial estate loans included one loan that was past its contractual maturity. This loan is secured by a beachfront undeveloped parcel of land in the southern New Jersey shore area. While the property is past maturity, the borrower has paid all interest due. The Bank is presently seeking to extend the term of this loan to provide adequate time for the borrower to sell the property.
Interest income that would have been recorded for the year ended December 31, 2006 had nonaccruing loans been current according to their original terms was $10,000, none of which was included in interest income for the year ended December 31, 2006.
Federal regulations require us to review and classify our assets on a regular basis. In addition, the Office of Thrift Supervision has the authority to identify problem assets and, if appropriate, require them to be classified. There are three classifications for problem assets: substandard, doubtful and loss. “Substandard assets” must have one or more defined weaknesses and are characterized by the distinct possibility that we will sustain some loss if the deficiencies are not corrected. “Doubtful assets” have the weaknesses of substandard assets with the additional characteristic that the weaknesses make collection or liquidation in full on the basis of currently existing facts, conditions and values questionable, and there is a high possibility of loss. An asset classified “loss” is considered uncollectible and of such little value that continuance as an asset of the institution is not warranted. The regulations also provide for a “special mention” category, described as assets which do not currently expose us to a sufficient
47
degree of risk to warrant classification but do possess credit deficiencies or potential weaknesses deserving our close attention. When we classify a loan as special mention, substandard or doubtful, we generally establish a specific allowance for loan losses for that loan. If we classify an asset as loss, we allocate an amount equal to 100% of the portion of the asset classified loss.
The following table shows the aggregate amounts of our criticized and classified assets at the dates indicated.
| At December 31, |
| ||||||||
|
| 2006 |
| 2005 |
| 2004 |
| |||
|
| (In thousands) |
| |||||||
|
|
|
|
|
|
|
| |||
Special mention assets |
| $ | 3,225 |
| $ | 19,529 |
| $ | 10,055 |
|
Substandard assets |
| 5,764 |
| 17,610 |
| 80,600 |
| |||
Doubtful assets |
| — |
| 3,720 |
| — |
| |||
Total classified assets |
| $ | 8,989 |
| $ | 40,859 |
| $ | 90,655 |
|
At December 31, 2006, substandard assets included two residential loans to the same borrower totaling $1.7 million and two sub-investment grade corporate bonds totaling $4.0 million which matured in January and February 2007. The substandard loans consisted of two residential loans, the larger of which is financing on a four-unit apartment that the borrower is seeking to convert to separate condominium units and sell. The borrower is current on all amounts due at December 31, 2006, but does not have sufficient liquidity to pay the loan if the units are not sold within a short timeframe. Special mention assets include one loan totaling $2.9 million which is secured by a beachfront undeveloped parcel of land in the southern New Jersey shore area. While the property is past maturity, the borrower has paid all interest due. The Bank is presently seeking to extend the term of this loan to provide adequate time for the borrower to sell the property. The collateral is sufficient to pay the loan upon liquidation.
The decreases in classified assets in 2006 and 2005 reflected increased collection efforts as well as the Bank requiring certain high-risk construction loans in our New Jersey market area to be rescinded or refinanced with other financial institutions. During 2006, the Bank collected all of its significant nonperforming commercial and construction loans by establishing workout strategies that allowed the borrowers sufficient time to resolve their business difficulties and/or sell the collateral and repay the Bank. The decrease in classified assets also included the maturity of $2.1 million of sub-investment grade corporate bonds during 2006. Additionally, certain borrowers were removed from classified status due to improvements in documentation on their loans or in the credit profile of the borrower.
Other than disclosed in the above tables, there are no other loans at December 31, 2006 that management has serious doubts about the ability of the borrowers to comply with the present loan repayment terms.
48
Delinquencies. The following table provides information about delinquencies in our loan portfolio at the dates indicated
|
| At December 31, |
| ||||||||||||||||
|
| 2006 |
| 2005 |
| 2004 |
| ||||||||||||
|
| 30-59 |
| 60-89 |
| 30-59 |
| 60-89 |
| 30-59 |
| 60-89 |
| ||||||
|
| (In thousands) |
| ||||||||||||||||
Residential real estate: |
|
|
|
|
|
|
|
|
|
|
|
|
| ||||||
One- to four-family |
| $ | 191 |
| $ | — |
| $ | — |
| $ | — |
| $ | — |
| $ | 280 |
|
Construction |
| — |
| — |
| — |
| 1,653 |
| — |
| 3,508 |
| ||||||
Consumer: |
|
|
|
|
|
|
|
|
|
|
|
|
| ||||||
Home equity loans and lines of credit |
| 23 |
| 24 |
| — |
| 21 |
| — |
| 350 |
| ||||||
Automobile |
| — |
| — |
| — |
| 2 |
| — |
| — |
| ||||||
Total |
| $ | 214 |
| $ | 24 |
| $ | — |
| $ | 1,676 |
| $ | — |
| $ | 4,138 |
|
Analysis and Determination of the Allowance for Loan Losses.
Historical Practice. Before 2003, we typically originated loans secured by residential real estate. In such periods, home equity loans and lines of credit were evaluated for loan losses in the same manner as one-to four-family loans because they were all collateralized by residential real estate. In 2003, then-current management determined to emphasize multi-family and commercial real estate lending and construction lending, primarily in the southern New Jersey shore area where it had recently opened new branch offices. However, when doing so, management failed to adopt a risk rating system and update its allowance for loan losses policy to account for the new types of loans that were being originated. Consequently, management failed to properly review and classify the new types of loans that were being originated. Management’s failure to implement and apply the risk rating documentation and, thus, its failure to adequately support its allowance for loan losses were deemed to be a material weakness in connection with the audit of our 2004 financial statements. Further, such weakness was cited by the regulators as one of the reasons leading to the issuance of the Cease and Desist Order in June 2005.
Current Practice. In 2005, new management reviewed the existing policy on allowance for loan losses and updated it to ensure compliance with U.S. generally accepted accounting principles and with all regulatory guidance. Additionally, three independent loan consultants were engaged to separately review the loan portfolio and the classification of assets and to assist with establishing proper risk-weighting of loans. A description of the revised procedures for determining the allowance for loan losses is contained below.
The allowance for loan losses is maintained at a level representing management’s best estimate of known and inherent losses in the loan portfolio, based upon management’s evaluation of the portfolio’s collectibility. We evaluate the need to establish allowances against losses on loans on a quarterly basis. When changes in the allowance are necessary, an adjustment is made. The adjustments to the allowance are made by management and presented to the Audit Committee of the Board of Directors.
Our methodology for assessing the appropriateness of the allowance for loan losses consists of a specific allowance on identified problem loans and a general valuation allowance on the remainder of the loan portfolio. Although we determine the amount of each element of the allowance separately, the entire allowance for loan losses is available for the losses on entire portfolio.
Specific Allowance Required for Identified Problem Loans. We establish an allowance on certain identified problem loans, including all classified loans, based on such factors as: (1) the strength of the customer’s personal or business cash flows and personal guarantees; (2) the availability of other sources of repayment; (3) the amount due or past due; (4) the type and value of collateral; (5) the strength of our collateral position; (6) the estimated cost to sell the collateral; and (7) the borrower’s effort to cure the delinquency.
49
General Valuation Allowance on the Remainder of the Loan Portfolio. We establish a general allowance for loans that are not delinquent to recognize the inherent losses associated with lending activities. This general valuation allowance is determined by segregating the loans by loan category and assigning percentages to each category. The percentages are adjusted for significant factors that, in management’s judgment, affect the collectibility of the portfolio as of the evaluation date. These significant factors may include changes in existing general economic and business conditions affecting our lending areas and the national economy, loss experience in particular segments of the portfolio, specific reserve and classified asset trends, delinquency trends and risk rating trends. These loss factors are subject to ongoing evaluation to ensure their relevance in the current economic environment.
As a result of our systematic analysis of the allowance for loan losses, the loss factors we presently use to determine the reserve level were updated in 2006 based on various risk factors such as delinquency trends and economic trends in our market area and nationally. As a result of the increased loan-to-value ratios in the one- to four-family residential real estate loan and home equity loan portfolios and the value of real estate in our New Jersey and Philadelphia market areas, we increased the allowance percentage on one- to four-family residential loans, commercial lines of credit and construction lines of credit.
We also identify loans that may need to be charged off as a loss by reviewing all delinquent loans, classified loans and other loans that management may have concerns about collectibility. For individually reviewed loans, the borrower’s inability to make payments under the terms of the loan or a shortfall in collateral value would result in our allocating a portion of the allowance to the loan that was impaired.
At December 31, 2006, our allowance for loan losses represented 0.82% of total loans and 91.4% of nonperforming loans. At December 31, 2006, the allowance for loan losses was $2.9 million, all of which was a general valuation allowance for the loan portfolio. The allowance for loan losses at December 31, 2006 represents application of loan loss policies, which comply with U.S. generally accepted accounting principles and all regulatory guidance. Additionally, the amount of the allowance for loan losses at December 31, 2006 reflects the separate review of the loan portfolio, the classification of assets and assistance with establishing proper risk-weighting of loans by independent loan review consultant during 2006. The allowance for loan losses is impacted by a number of factors including the levels of non-performing loans, changing economic conditions in our market areas and the levels of loans outstanding. As these factors change, management will increase or decrease the allowance for loan losses as required to maintain adequate levels of reserves for losses inherent in its loan portfolio.
At December 31, 2005, our allowance for loan losses represented 2.2% of total loans and 163.9% of nonperforming loans. The allowance for loan losses decreased $6.0 million to $8.3 million at December 31, 2005 from $14.4 million at December 31, 2004 due to a credit to the provision for loan losses of $6.0 million.
50
The following table sets forth the breakdown of the allowance for loan losses by loan category at the dates indicated. The attribution in the table of all of the allowance for loan losses to one-to four-family real estate loans before 2005 reflects former management’s: (1) decision to evaluate loan losses for home equity loans and lines of credit in the same manner as one-to four-family loans because they were all collateralized by residential real estate; and (2) failure to adopt a risk rating system and update its allowance for loan losses analysis to account for the increase in multi-family and commercial real estate and construction loans that were originated in 2003 and 2004. See “—Analysis and Determination of the Allowance for Loan Losses—Historical Practice.”
|
| At December 31, |
| |||||||||||||||||||||||
|
| 2006 |
| 2005 |
| 2004 |
| 2003 |
| 2002 |
| |||||||||||||||
|
| Amount |
| % of |
| Amount |
| % of |
| Amount |
| % of |
| Amount |
| % of |
| Amount |
| % of |
| |||||
|
| (Dollars in Thousands) |
| |||||||||||||||||||||||
Real estate loans: |
|
|
|
|
|
|
|
|
|
|
|
|
|
|
|
|
|
|
|
|
| |||||
One- to four-family |
| $ | 798 |
| 58.3 | % | $ | 607 |
| 60.9 | % | $ | 14,391 |
| 50.1 | % | $ | 2,109 |
| 62.7 | % | $ | 2,082 |
| 84.3 | % |
Multi-family and |
| 784 |
| 11.6 |
| 2,544 |
| 8.8 |
| — |
| 17.2 |
| — |
| 13.7 |
| — |
| 3.9 |
| |||||
Construction |
| 318 |
| 3.2 |
| 4,640 |
| 8.3 |
| — |
| 18.5 |
| — |
| 11.2 |
| — |
| — |
| |||||
Consumer loans: |
|
|
|
|
|
|
|
|
|
|
|
|
|
|
|
|
|
|
|
|
| |||||
Home equity loans |
| 257 |
| 20.5 |
| 316 |
| 17.3 |
| — |
| 9.9 |
| — |
| 8.6 |
| — |
| 8.4 |
| |||||
Automobile |
| 37 |
| 0.3 |
| 46 |
| 0.3 |
| — |
| 0.4 |
| — |
| 0.4 |
| — |
| 0.6 |
| |||||
Line of credit |
| 38 |
| 2.9 |
| — |
| 4.3 |
| — |
| 3.6 |
| — |
| 3.3 |
| — |
| 2.7 |
| |||||
Other |
| 3 |
| 0.1 |
| — |
| 0.1 |
| — |
| 0.3 |
| — |
| 0.1 |
| — |
| 0.1 |
| |||||
Commercial |
| 446 |
| 3.1 |
| 18 |
| — |
| — |
| — |
| — |
| — |
| — |
| — |
| |||||
Unallocated |
| 268 |
| — |
| 178 |
| — |
| — |
| — |
| — |
| — |
| — |
| — |
| |||||
|
|
|
|
|
|
|
|
|
|
|
|
|
|
|
|
|
|
|
|
|
| |||||
Total allowance for |
| $ | 2,949 |
| 100.0 | % | $ | 8,349 |
| 100.0 | % | $ | 14,391 |
| 100.0 | % | $ | 2,109 |
| 100.0 | % | $ | 2,082 |
| 100.0 | % |
51
Although we believe that we use the best information available to establish the allowance for loan losses, future adjustments to the allowance for loan losses may be necessary and our results of operations could be adversely affected if circumstances differ substantially from the assumptions used in making the determinations. Furthermore, while we believe we have established our allowance for loan losses in conformity with U.S. generally accepted accounting principles, there can be no assurance that the Office of Thrift Supervision, in reviewing our loan portfolio, will not request us to increase our allowance for loan losses. The Office of Thrift Supervision may require us to increase our allowance for loan losses based on judgments different from ours. In addition, because future events affecting borrowers and collateral cannot be predicted with certainty, there can be no assurance that increases will not be necessary should the quality of any loans deteriorate as a result of the factors discussed above. Any material increase in the allowance for loan losses may adversely affect our financial condition and results of operations.
Analysis of Loan Loss Experience. The following table sets forth an analysis of the allowance for loan losses for the periods indicated.
|
| Year Ended December 31, |
| |||||||||||||
|
| 2006 |
| 2005 |
| 2004 |
| 2003 |
| 2002 |
| |||||
|
| (Dollars in thousands) |
| |||||||||||||
|
|
|
|
|
|
|
|
|
|
|
| |||||
Allowance at beginning of period |
| $ | 8,349 |
| $ | 14,391 |
| $ | 2,109 |
| $ | 2,082 |
| $ | 975 |
|
Charge-offs: |
|
|
|
|
|
|
|
|
|
|
| |||||
One- to four-family |
| — |
| — |
| — |
| — |
| — |
| |||||
Consumer |
| 8 |
| 17 |
| — |
| 3 |
| — |
| |||||
Total charge-offs |
| 8 |
| 17 |
| — |
| 3 |
| — |
| |||||
|
|
|
|
|
|
|
|
|
|
|
| |||||
Recoveries |
| 2 |
| — |
| — |
| — |
| — |
| |||||
Net charge offs |
| 6 |
| 17 |
| — |
| 3 |
| — |
| |||||
Provision (credit) for loan losses |
| (5,394 | ) | (6,025 | ) | 12,282 |
| 30 |
| 1,107 |
| |||||
Allowance at end of period |
| $ | 2,949 |
| $ | 8,349 |
| $ | 14,391 |
| $ | 2,109 |
| $ | 2,082 |
|
|
|
|
|
|
|
|
|
|
|
|
| |||||
Allowance for loan losses to nonperforming loans and troubled debt restructurings |
| 91.44 | % | 163.90 | % | 997.99 | % | 159.29 | % | 158.45 | % | |||||
Allowance for loan losses to total loans at the end of the period |
| 0.82 |
| 2.22 |
| 2.89 |
| 0.50 |
| 0.50 |
| |||||
Net charge-offs (recoveries) to average loans outstanding during the period |
| — |
| — |
| — |
| — |
| — |
| |||||
Interest Rate Risk Management. We manage the interest rate sensitivity of our interest-bearing liabilities and interest-earning assets in an effort to minimize the adverse effects of changes in the interest rate environment. Deposit accounts typically react more quickly to changes in market interest rates than mortgage loans because of the shorter maturities of deposits. As a result, sharp increases in interest rates may adversely affect our earnings while decreases in interest rates may beneficially affect our earnings. To reduce the potential volatility of our earnings, we have sought to improve the match between asset and liability maturities and rates, while maintaining an acceptable interest rate spread. Our strategy for managing interest rate risk involves: generally selling in the secondary market longer-term fixed-rate one- to four-family residential real estate loans; emphasizing the origination of shorter-term adjustable-rate loans, which we maintain in our portfolio, and investing in securities with that have adjustable-rates or shorter terms. We currently do not participate in hedging programs, interest rate swaps or other activities involving the use of derivative financial instruments.
We have a Risk Management Committee, which together with an Asset/Liability Management Committee, communicates, coordinates and controls all aspects involving asset/liability management. The committee establishes and monitors the volume, maturities, pricing and mix of assets and funding sources with the objective of managing assets and funding sources to provide results that are consistent with liquidity, growth, risk limits and profitability goals.
Our goal is to manage asset and liability positions to moderate the effects of interest rate fluctuations on net interest income and net income.
52
Net Portfolio Value Analysis. We use a net portfolio value analyses prepared by the Office of Thrift Supervision and an internally prepared model to review our level of interest rate risk. Such analyses measure interest rate risk by computing changes in net portfolio value of our cash flows from assets, liabilities and off-balance sheet items in the event of a range of assumed changes in market interest rates. Net portfolio value represents the market value of portfolio equity and is equal to the market value of assets minus the market value of liabilities, with adjustments made for off-balance sheet items. These analyses assess the risk of loss in market risk-sensitive instruments in the event of a sudden and sustained 100 to 300 basis point increase or 100 and 200 basis point decrease in market interest rates with no effect given to any steps that we might take to counter the effect of that interest rate movement. Because of the low level of market interest rates, these analyses are not performed for decreases of more than 200 basis points. The internal model differs from that prepared by the Office of Thrift Supervision as it assumes: (1) slower prepayments for fixed-rate one- to four-family loans; and (2) a longer duration for transaction accounts. Notwithstanding the different assumptions, the two models do not produce materially different results.
The following table, which is based on information that we provide to the Office of Thrift Supervision, presents the change in our net portfolio value at December 31, 2006 that would occur in the event of an immediate change in interest rates based on Office of Thrift Supervision assumptions, with no effect given to any steps that we might take to counteract that change.
|
| Net Portfolio Value |
| Net Portfolio Value as % of |
| ||||||||
Basis Point (“bp”) |
| Amount |
| Change |
| % Change |
| NPV Ratio |
| Change (bp) |
| ||
|
| (Dollars in thousands) |
|
|
|
|
|
|
| ||||
|
|
|
|
|
|
|
|
|
|
|
| ||
300 |
| $ | 83,936 |
| $ | (26,640 | ) | (24 | )% | 11.46 | % | (285 | ) |
200 |
| 94,313 |
| (16,263 | ) | (15 | ) | 12.64 |
| (168 | ) | ||
100 |
| 103,477 |
| (7,100 | ) | (6 | ) | 13.62 |
| (70 | ) | ||
0 |
| 110,577 |
|
|
|
|
| 14.32 |
|
|
| ||
(100) |
| 113,883 |
| 3,306 |
| 3 |
| 14.56 |
| 25 |
| ||
(200) |
| 113,420 |
| 2,843 |
| 3 |
| 14.39 |
| 7 |
| ||
The decrease in our net portfolio value shown in the preceding table that would occur upon an increase in prevailing market interest rates reflects: (1) that a substantial portion of our loan portfolio is fixed-rate residential loans and (2) the shorter duration of deposits, which reprice more frequently in response to changes in market interest rates. The increase in our net portfolio value that would occur upon a decrease in market rates of 100 basis points and the decrease in our net portfolio value that would occur upon a decrease in market rates of 200 basis points are due to our fixed-rate residential mortgage portfolio increasing at a slower rate between the 100 basis point and 200 basis point scenarios since such loans prepay faster as market interest rates decline.
The Office of Thrift Supervision uses various assumptions in assessing interest rate risk. These assumptions relate to interest rates, loan prepayment rates, deposit decay rates and the market values of certain assets under differing interest rate scenarios, among others. As with any method of measuring interest rate risk, certain shortcomings are inherent in the methods of analyses presented in the foregoing tables. For example, although certain assets and liabilities may have similar maturities or periods to repricing, they may react in different degrees to changes in market interest rates. Also, the interest rates on certain types of assets and liabilities may fluctuate in advance of changes in market interest rates, while interest rates on other types may lag behind changes in market rates. Additionally, certain assets, such as adjustable-rate mortgage loans, have features that restrict changes in interest rates on a short-term basis and over the life of the asset. Further, in the event of a change in interest rates, expected rates of prepayments on loans and early withdrawals from certificates could deviate significantly from those assumed in calculating the table. Prepayment rates can have a significant impact on interest income. Because of the large percentage of loans and mortgage-backed securities we hold, rising or falling interest rates have a significant impact on the prepayment speeds of our earning assets that in turn affect the rate sensitivity position. When interest rates rise, prepayments tend to slow. When interest rates fall, prepayments tend to rise. Our asset sensitivity would be reduced if prepayments slow and vice versa. While we believe these assumptions to be reasonable, there can be no assurance that assumed prepayment rates will approximate actual future mortgage-backed security and loan repayment activity.
53
Liquidity Management. Liquidity is the ability to meet current and future financial obligations of a short-term nature. Our primary sources of funds consist of deposit inflows, loan repayments and maturities and sales of securities. While maturities and scheduled amortization of loans and securities are predictable sources of funds, deposit flows and loan prepayments are greatly influenced by general interest rates, economic conditions and competition.
We regularly adjust our investments in liquid assets based upon our assessment of: (1) expected loan demands; (2) expected deposit flows; (3) yields available on interest-earning deposits and securities; and (4) the objectives of our asset/liability management policy. We use a variety of measures to assess our liquidity needs, which are provided to our Asset/Liability Management Committee on a regular basis. Our policy is to maintain net liquidity of at least 50% of our funding obligations over the next month. Additionally, our policy is to maintain an amount of cash and short-term marketable securities equal to at least 15% of net deposits and liabilities that will mature in one year or less.
Our most liquid assets are cash and cash equivalents. The levels of these assets depend on our operating, financing, lending and investing activities during any given period. Cash and cash equivalents totaled $134.4 million at December 31, 2006. Securities classified as available-for-sale, which provide additional sources of liquidity, totaled $228.4 million at December 31, 2006. In addition, at December 31, 2006, we had the ability to borrow a total of approximately $460.0 million from the Federal Home Loan Bank of Pittsburgh, of which we had $30.0 million outstanding.
At December 31, 2006, we had $69.4 million in loan commitments outstanding. At December 31, 2006, this consisted of $2.6 million of mortgage loan commitments, $25.2 million in home equity and consumer commitments and $41.5 million in commercial commitments. Certificates of deposit due within one year of December 31, 2006 totaled $223.7 million. This represented 54.5% of certificates of deposit at December 31, 2006. We believe the large percentage of certificates of deposit that mature within one year reflects customers’ hesitancy to invest their funds for long periods in the current low interest rate environment. If these maturing deposits do not remain with us, we will be required to seek other sources of funds, including other certificates of deposit and borrowings. Depending on market conditions, we may be required to pay higher rates on such deposits or other borrowings than we currently pay on the certificates of deposit due on or before December 31, 2007. We believe, however, based on past experience, that a significant portion of our certificates of deposit will remain with us. We have the ability to attract and retain deposits by adjusting the interest rates offered.
The following table presents certain of our contractual obligations as of December 31, 2006.
|
| Payments Due by Period |
| |||||||||||||
Contractual Obligations |
| Total |
| Less Than |
| One to |
| Three to Five |
| More Than |
| |||||
|
| (Dollars in thousands) |
| |||||||||||||
|
|
|
|
|
|
|
|
|
|
|
| |||||
Operating lease obligations (1) |
| $ | 158 |
| $ | 120 |
| $ | 38 |
| $ | — |
| $ | — |
|
FHLB advances |
| 36,922 |
| 1,487 |
| 2,979 |
| 32,456 |
| — |
| |||||
Other long-term obligations (2) |
| 4,995 |
| 1,754 |
| 3,238 |
| 3 |
| — |
| |||||
Total |
| $ | 42,075 |
| $ | 3,361 |
| $ | 6,255 |
| $ | 32,459 |
| $ | — |
|
1) Represents lease obligations for commercial loan production offices and equipment.
2) Represents obligations to the Company’s third party data processing providers and other vendors.
54
Our primary investing activities are the origination and sale of loans and the purchase and sale of securities. Our primary financing activities consist of activity in deposit accounts and in 2006 the issuance of common stock. Deposit flows are affected by the overall levels of interest rates, the interest rates and products offered by us and our local competitors and other factors. We generally manage the pricing of our deposits to be competitive and to increase core deposit relationships. Occasionally, we offer promotional rates on certain deposit products to attract deposits.
The following table presents our primary investing and financing activities during the periods indicated.
| Year Ended December 31, |
| |||||
|
| 2006 |
| 2005 |
| ||
|
| (In thousands) |
| ||||
Investing activities: |
|
|
|
|
| ||
Loan originations |
| $ | (125,303 | ) | $ | (149,960 | ) |
Other decreases in loans |
| 137,512 |
| 188,880 |
| ||
Loan sales |
| 4,000 |
| 83,784 |
| ||
Security purchases |
| (60,207 | ) | (109,868 | ) | ||
Security sales |
| 17,205 |
| 27,385 |
| ||
Security maturities, calls and principal repayments |
| 145,471 |
| 75,981 |
| ||
Financing activities: |
|
|
|
|
| ||
Decreases in deposits |
| (85,773 | ) | (122,943) |
| ||
Proceeds from stock issuance, net of conversion costs |
| 62,348 |
| — |
| ||
Capital Management. We have managed our capital to maintain strong protection for depositors and creditors. We are subject to various regulatory capital requirements administered by the Office of Thrift Supervision, including a risk-based capital measure. The risk-based capital guidelines include both a definition of capital and a framework for calculating risk-weighted assets by assigning balance sheet assets and off-balance sheet items to broad risk categories. At December 31, 2006, we exceeded all of our regulatory capital requirements. We are considered “well capitalized” under regulatory guidelines. See “Regulation and Supervision—Regulation of Federal Savings Associations—Capital Requirements,” and “—Regulatory Capital Compliance” and the notes to the consolidated financial statements included in this Report.
We also will manage our capital for maximum stockholder benefit. The capital from the offering significantly increased our liquidity and capital resources. Over time, the initial level of liquidity will be reduced as net proceeds from the stock offering are used for general corporate purposes, including the funding of lending activities. Our financial condition and results of operations have been enhanced by the capital from the offering, resulting in increased net interest-earning assets and net income. However, the large increase in equity resulting from the capital raised in the offering will, initially, have an adverse impact on our return on equity. In the future, we may use capital management tools such as cash dividends and common share repurchases. However, under Office of Thrift Supervision regulations, we will not be allowed to repurchase any shares during the first year following the offering, except to fund the restricted stock awards under the equity incentive plan, unless extraordinary circumstances exist and we receive regulatory approval.
Off-Balance Sheet Arrangements. In the normal course of operations, we engage in a variety of financial transactions that, in accordance with U.S. generally accepted accounting principles, are not recorded in our financial statements. These transactions involve, to varying degrees, elements of credit, interest rate and liquidity risk. Such transactions are used primarily to manage customers’ requests for funding and take the form of loan commitments, letters of credit and lines of credit. For information about our loan commitments and unused lines of credit, see note 10 of the notes to the consolidated financial statements. We currently have no plans to engage in hedging activities in the future.
For the years ended December 31, 2006 and 2005, we engaged in no off-balance sheet transactions reasonably likely to have a material effect on our financial condition, results of operations or cash flows.
55
Impact of Recent Accounting Pronouncements
On December 16, 2004, the Financial Accounting Standards Board (“FASB”) issued SFAS No. 123R, “Share-Based Payment,” which replaces SFAS No. 123, “Accounting for Stock-Based Compensation” and supersedes APB Opinion No. 25, “Accounting for Stock Issued to Employees.” This statement will require that all share-based payments to employees, including grants of employee stock options, be recognized as compensation costs in the financial statements based on their fair values. The effective date of this statement for the Company was January 1, 2006. We adopted this standard as required, in accounting for the Long-Term Incentive Plan discussed in Note 9, which includes unvested shares.
In December 2004, the FASB issued SFAS No. 153, “Exchanges of Non-Monetary Assets, an amendment of APB Opinion No. 29,” which eliminates the exception from fair value measurement for non-monetary exchanges of similar productive assets and replaces it with a general exception for exchanges of non-monetary assets that do not have commercial substance. The statement defines a non-monetary exchange with commercial substance as one in which the future cash flows of an entity are expected to change significantly as a result of the exchange. SFAS No. 153 is effective for fiscal years beginning after June 15, 2005. The Company adopted this statement and there was no effect on its results of operations or financial position.
In May 2005, the FASB issued SFAS No. 154, “Accounting Changes and Error Corrections,” which establishes, unless impracticable, retrospective application as the required method for reporting a change in accounting principle in the absence of explicit transition requirements specific to the newly adopted accounting principle. The statement provides guidance for determining whether retrospective application of a change in accounting principle is impracticable. The statement also addresses the reporting of a correction of an error by restating previously issued financial statements. SFAS No. 154 is effective for accounting changes and corrections of errors made in fiscal years beginning after December 15, 2005. The Company adopted this statement and there was no effect on its results of operations or financial position.
In March 2006, the FASB issued SFAS No. 156, “Accounting for Servicing of Financial Assets, an amendment of SFAS No. 140.” SFAS No. 156 amends SFAS No. 140 with respect to the accounting for separately recognized servicing assets and servicing liabilities by requiring an entity to recognize a servicing asset or liability each time it undertakes an obligation to service a financial asset by entering into a servicing contract; requires all separately recognized servicing assets and liabilities to be initially measured at fair value, if practical; and permits an entity to choose either of the following methods by which it will subsequently measure each class of separately recognized servicing assets and liabilities:
1. Amortization method - Amortize the servicing assets or liabilities in proportion to and over the period of estimated net servicing income or loss and assess servicing assets and liabilities for impairment or increase obligation based on the fair value at each reporting period.
2. Fair value measurement method - Measure servicing assets or liabilities at fair value at each reporting date and report changes in fair value in earnings in the period in which the change occurs.
SFAS No. 156 is effective for fiscal years beginning after September 15, 2006. Earlier adoption is permitted as of the beginning of an entity’s fiscal year, provided the entity has not yet issued its financial statements, including interim financial statements, for any period of that fiscal year. After analyzing the effects of the statement, the Company does not believe that the adoption of this statement will have a material impact on its results of operations or financial position.
In June 2006, FASB issued Financial Interpretation No. 48 (FIN 48), Accounting for Uncertainty in Income Taxes — an interpretation of SFAS Statement No. 109. FIN 48 provides guidance on financial statement recognition and measurement of a tax position taken or expected to be taken in a tax return. According to the Interpretation, a tax position is recognized if it is more likely than not that the tax position will be sustained upon examination, including resolution of any related appeals or litigation processes, based on the technical merits of the position. If the tax position meets more-likely-than-not recognition threshold, the position is measured to determine the amount of benefit to recognize and should be measured at the largest amount of benefit that is greater than 50% likely of being realized upon ultimate settlement. FIN 48 also provides guidance on derecognition, classification, interest and penalties, accounting in interim periods, disclosure and transition. The provisions of FIN 48 are effective for fiscal
56
years beginning after December 15, 2006. The Company does not expect this interpretation to have a material impact on the Company’s financial position and/or results of operations.
In September 2006, the Securities and Exchange Commission (the “SEC’) Staff issued Staff Accounting Bulletin No. 108 (the “SAB”) addressing how the effects of prior-year uncorrected financial statement misstatements should be considered in current-year financial statements. The SAB requires registrants to quantify misstatements using both balance-sheet and income-statement approaches and to evaluate whether either approach results in quantifying an error that is material in light of relative quantitative and qualitative factors. The SAB does not change the SEC staff’s previous guidance in SAB 99 on evaluating the materiality of misstatements.
SAB 108 addresses the mechanics of correcting misstatements that include the effects from prior years. Additionally, SAB 108 requires registrants to apply the new guidance for the first time that it identifies material errors in existence at the beginning of the first fiscal year ending after November 15, 2006 by correcting those errors through a one-time cumulative effect adjustment to beginning-of-year retained earnings. The Company adopted this statement and there was no effect on its results of operations or financial position.
In September 2006, the FASB issued SFAS No. 157, Fair Value Measurement. This statement defines fair value, establishes a framework for measuring fair value in generally accepted accounting principles and expands disclosures about fair value measurements. This statement applies under other accounting pronouncements that require or permit fair value measurements, the Board having previously concluded in those accounting pronouncements that fair value is the relevant measurement attribute. Accordingly, this statement does not require any new fair value measurements.
SFAS No. 157 is effective for fiscal years beginning after November 15, 2007. Earlier adoption is encouraged, provided that the reporting entity has not yet issued financial statements for that fiscal year, including financial statements for an interim period within that fiscal year. The Company is evaluating this statement and has not yet determined the impact on its results of operations or financial position, if any.
In September 2006, the FASB issued SFAS No. 158, “Employers’ Accounting for Defined Benefit Pension and Other Postretirement Plans.” This Statement improves financial reporting by requiring an employer to recognize the overfunded or underfunded status of a defined benefit postretirement plan as an asset or liability in its statement of financial position and to recognize changes in that funded status in the year in which the changes occur through comprehensive income. This Statement also improves the financial reporting by requiring an employer to measure the funded status of a plan as of the date of its year-end statement of financial position, with limited exceptions.
The required date of adoption of the recognition and disclosure provisions of this Statement for an employer that is an issuer of publicly traded equity, such as Fox Chase Bancorp, Inc., is as of the end of the fiscal year ended after December 15, 2006. Retrospective application of this Statement is not permitted. The Company adopted this statement in the last quarter of 2006.
The FASB has recently approved the Emerging Issues Task Force (“EITF”) Issue No. 06-4 “Accounting for Deferred Compensation and Postretirement Benefit Aspects of Endorsement Split-Dollar Life Insurance Arrangements.” In this issue, the EITF concluded that an endorsement split dollar life insurance policy does not effectively settle an employer’s obligation to provide the post retirement benefit that the policy was designed to provide. Therefore, some current expense recognition may need to be made for any endorsement split dollar plans with post retirement benefits.
This guidance applies to all post retirement endorsement split dollar arrangements. This will not impact split dollar plans that only provide pre-retirement death benefits.
The accrual for the liability would be calculated in one of two ways:
· the actuarial present value of the future death benefit or
· the cost of insurance of the policy during the postretirement period.
Compliance with this EITF must be applied to fiscal years beginning after December 15, 2007 (January 1, 2008 for calendar year entities). It can be made through a cumulative—effect adjustment to retained earnings in the year of adoption or as a
57
change in accounting principles through retrospective application to all prior periods. The Company has not determined if this Statement will have a material impact on its consolidated financial statements upon adoption.
In February 2007, the FASB issued SFAS No. 159, “The Fair Value Option for Financial Assets and Financial Liabilities—Including an Amendment of FASB Statement No. 115 (SFAS 159).” SFAS 159 permits entities to choose to measure many financial instruments and certain other items at fair value and amends SFAS 115 to, among other things, require certain disclosures for amounts for which the fair value option is applied. Additionally, this Statement provides that an entity may reclassify held-to-maturity and available-for-sale securities to the trading account when the fair value option is elected for such securities, without calling into question the intent to hold other securities to maturity in the future. This Statement is effective as of the beginning of an entity’s first fiscal year that begins after November 15, 2007. Early adoption is permitted as of the beginning of a fiscal year that begins on or before November 15, 2007, provided the entity also elects to apply the provisions of SFAS 157. The Company has not completed its assessment of SFAS No. 159 and the impact, if any, on its consolidated financial statements.
At its September 2006 meeting, the EITF reached a final consensus on Issue 06-05, “Accounting for Purchases of Life Insurance — Determining the Amount That Could be Realized in Accordance with FASB Technical Bulletin No. 85-4.” Issue 06-05 concludes that in determining the amount that could be realized under an insurance contract accounted for under FASB Technical Bulletin No. 85-4, “Accounting for Purchases of Life Insurance,” the policyholder should (1) consider any additional amounts included in the contractual terms of the policy; (2) assume the surrender value on a individual-life by individual-life policy basis; and (3) not discount the cash surrender value component of the amount that could be realized when contractual restrictions on the ability to surrender a policy exist. Issue 06-05 should be adopted through either (1) a change in accounting principle through a cumulative-effect adjustment to retained earnings as of the beginning of the year of adoption or (2) a change in accounting principle through retrospective application to all prior periods. Issue 06-05 is effective for fiscal years beginning after December 15, 2006. The application of Issue 06-05 is not expected to have a material effect on the Company’s financial position or results of operations.
Effect of Inflation and Changing Prices
The financial statements and related financial data presented in this prospectus have been prepared in accordance with U.S. generally accepted accounting principles, which require the measurement of financial position and operating results in terms of historical dollars without considering the change in the relative purchasing power of money over time due to inflation. The primary impact of inflation on our operations is reflected in increased operating costs. Unlike most industrial companies, virtually all the assets and liabilities of a financial institution are monetary in nature. As a result, interest rates generally have a more significant impact on a financial institution’s performance than do general levels of inflation. Interest rates do not necessarily move in the same direction or to the same extent as the prices of goods and services.
ITEM 7A. QUANTITATIVE AND QUALITATIVE DISCLOSURES ABOUT MARKET RISK
The information required by this item is incorporated herein by reference to Item 7, “Management’s Discussion and Analysis of Financial Condition and Results of Operation — Interest Rate Risk Management.”
ITEM 8. FINANCIAL STATEMENTS AND SUPPLEMENTARY DATA
Information required by this item is included herein beginning on page F-1.
ITEM 9. CHANGES IN AND DISAGREEMENTS WITH ACCOUNTANTS ON ACCOUNTING AND
There have been no changes in or disagreements with accountants on accounting or financial disclosure. For information regarding Fox Chase Bancorp’s change in accountants during fiscal 2005, the section captioned “Proposal 3 — Ratification of Independent Registered Public Accounting Firm” in Fox Chase Bancorp’s Proxy Statement for the 2007 Annual Meeting of Stockholders is incorporated by reference.
58
ITEM 9A. CONTROLS AND PROCEDURES
The Company’s management, including the Company’s principal executive officer and principal financial officer, have evaluated the effectiveness of the Company’s “disclosure controls and procedures,” as such term is defined in Rule 13a-15(e) promulgated under the Securities Exchange Act of 1934, as amended (the “Exchange Act”). Based upon their evaluation, the principal executive officer and principal financial officer concluded that, as of the end of the period covered by this report, the Company’s disclosure controls and procedures were effective for the purpose of ensuring that the information required to be disclosed in the reports that the Company files or submits under the Exchange Act with the Securities and Exchange Commission (the “SEC”): (1) is recorded, processed, summarized and reported within the time periods specified in the SEC’s rules and forms, and (2) is accumulated and communicated to the Company’s management, including its principal executive and principal financial officers, as appropriate to allow timely decisions regarding required disclosure.
None.
PART III
ITEM 10. DIRECTORS, EXECUTIVE OFFICERS AND CORPORATE GOVERNANCE
Directors
For information relating to the directors of Fox Chase Bancorp, the section captioned “Proposal 1 — Election of Directors” in Fox Chase Bancorp’s Proxy Statement for the 2007 Annual Meeting of Stockholders is incorporated by reference.
Executive Officers
For information relating to officers of Fox Chase Bancorp, see Part I, Item 1, “Business — Executive Officers of the Registrant” to this Annual Report on Form 10-K.
Compliance with Section 16(a) of the Exchange Act
For information regarding compliance with Section 16(a) of the Exchange Act, the cover page to this Annual Report on Form 10-K and the section captioned “Section 16(a) Beneficial Ownership Compliance” in Fox Chase Bancorp’s Proxy Statement for the 2007 Annual Meeting of Stockholders are incorporated by reference.
Disclosure of Code of Ethics
For information concerning Fox Chase Bancorp’s code of ethics, the information contained under the section captioned “Corporate Governance—Code of Ethics and Business Conduct” in Fox Chase Bancorp’s Proxy Statement for the 2007 Annual Meeting of Stockholders is incorporated by reference. A copy of the code of ethics and business conduct is available to stockholders on the Governance Documents portion of the Investors Relations section on Fox Chase Bancorp’s website at www.foxchasebank.com.
Corporate Governance
For information regarding the audit committee and its composition and the audit committee financial expert, the section captioned “Corporate Governance — Committees of the Board of Directors — Audit Committee” in Fox Chase Bancorp’s Proxy Statement for the 2007 Annual Meeting of Stockholders is incorporated by reference.
59
ITEM 11. EXECUTIVE COMPENSATION
Executive Compensation
For information regarding executive compensation, the sections captioned “Compensation Disclosure and Analysis,” “Executive Compensation” and “Director Compensation” in Fox Chase Bancorp’s Proxy Statement for the 2007 Annual Meeting of Stockholders are incorporated by reference.
Corporate Governance
For information regarding the compensation committee report, the section captioned “Compensation Committee Report” in Fox Chase Bancorp’s Proxy Statement for the 2007 Annual Meeting of Stockholders is incorporated by reference.
ITEM 12. SECURITY OWNERSHIP OF CERTAIN BENEFICIAL OWNERS AND MANAGEMENT AND RELATED STOCKHOLDERS MATTERS
(a) Security Ownership of Certain Beneficial Owners Information required by this item is incorporated herein by reference to the section captioned “Stock Ownership” in Fox Chase Bancorp’s Proxy Statement for the 2007 Annual Meeting of Stockholders.
(b) Security Ownership of Management Information required by this item is incorporated herein by reference to the section captioned “Stock Ownership” in Fox Chase Bancorp’s Proxy Statement for the 2007 Annual Meeting of Stockholders.
(c) Changes in Control
Management of Fox Chase Bancorp knows of no arrangements, including any pledge by any person or securities of Fox Chase Bancorp, the operation of which may at a subsequent date result in a change in control of the registrant.
(d) Equity Compensation Plan Information
Information required by this item is incorporated herein by reference to the section captioned “Proposal 2 — Approval of the Fox Chase Bancorp, Inc. 2007 Equity Incentive Plan — Equity Compensation Plan Information” in Fox Chase Bancorp’s Proxy Statement for the 2007 Annual Meeting of Stockholders.
ITEM 13. CERTAIN RELATIONSHIPS, RELATED TRANSACTIONS AND DIRECTOR INDEPENDENCE
Certain Relationships and Related Transactions
For information regarding certain relationships and related transactions, the section captioned “Transactions with Management” in Fox Chase Bancorp’s Proxy Statement for the 2007 Annual Meeting of Stockholders is incorporated by reference.
Corporate Governance
For information regarding director independence, the section captioned “Proposal 1 — Election of Directors” in Fox Chase Bancorp’s Proxy Statement for the 2007 Annual Meeting of Stockholders is incorporated by reference.
60
ITEM 14. PRINCIPAL ACCOUNTANT FEES AND SERVICES
For information regarding the principal accountant fees and expenses the section captioned “Proposal 3 — Ratification of Independent Registered Public Accounting Firm” in Fox Chase Bancorp’s Proxy Statement for the 2007 Annual Meeting of Stockholders is incorporated by reference.
PART IV
ITEM 15. EXHIBITS AND FINANCIAL STATEMENT SCHEDULES
(1) The financial statements required in response to this item are incorporated by reference from Item 8 of this Report.
(2) All financial statement schedules are omitted because they are not required or applicable, or the required information is shown in the consolidated financial statements or the notes thereto.
(3) Exhibits
No. |
| Description |
|
|
|
3.1 |
| Charter of Fox Chase Bancorp, Inc. (1) |
3.2 |
| Bylaws of Fox Chase Bancorp, Inc. (1) |
4.1 |
| Stock Certificate of Fox Chase Bancorp, Inc. (1) |
10.1 |
| *Form of Fox Chase Bank Employee Stock Ownership Plan and Trust Agreement (1) |
10.2 |
| *Fox Chase Bank 401(k) Profit-Sharing Plan and Trust (1) |
10.3 |
| *Employment Agreement between Thomas M. Petro, Fox Chase Bancorp, Inc. and Fox Chase Bank (2) |
10.4 |
| *Employment Agreement between Jerry D. Holbrook, Fox Chase Bancorp, Inc. and Fox Chase Bank (2) |
10.5 |
| *Employment Agreement between Keiron G. Lynch, Fox Chase Bancorp, Inc. and Fox Chase Bank (2) |
10.6 |
| *Employment Agreement between David C. Kowalek, Fox Chase Bancorp, Inc. and Fox Chase Bank (2) |
10.7 |
| *Employment Agreement between James V. Schermerhorn, Fox Chase Bancorp, Inc. and Fox Chase Bank (2) |
10.8 |
| *Change of Control Agreement between Richard J. Fuchs, Fox Chase Bancorp, Inc. and Fox Chase Bank (2) |
10.9 |
| *Fox Chase Bank Executive Long-Term Incentive Plan (1) |
10.10 |
| *Fox Chase Bank Employee Severance Compensation Plan, as amended and restated (1) |
21.0 |
| List of Subsidiaries |
23.1 |
| Consent of KPMG LLP |
23.2 |
| Consent of Beard Miller Company LLP |
31.1 |
| Rule 13a-14(a)/15d-14(a) Certification of Chief Executive Officer |
31.2 |
| Rule 13a-14(a)/15d-14(a) Certification of Chief Financial Officer |
32.0 |
| Section 1350 Certification of Chief Executive Officer and Chief Financial |
|
| Officer |
* Management contract or compensatory plan, contract or arrangement.
(1) Incorporated by reference in this document to the exhibits to the Company’s Registration Statement on Form S-1 (File No. 333-134160), as amended, initially filed with the Securities and Exchange Commission on May 16, 2006.
(2) Incorporated by reference in this document to the Company’s Quarterly Report on Form 10-Q for the quarter ended September 30, 2006 (File No. 001-32971).
61
Index to Consolidated Financial Statements of Fox Chase Bancorp, Inc.
***
62
FOX CHASE BANCORP, INC.
REPORT OF INDEPENDENT REGISTERED PUBLIC ACCOUNTING FIRM
The Board of Directors
Fox Chase Bancorp, Inc.:
We have audited the accompanying consolidated statements of condition of Fox Chase Bancorp, Inc. and subsidiary (the “Company”) as of December 31, 2006 and 2005, and the related consolidated statements of operations, changes in stockholders’ equity, and cash flows for the years then ended. These consolidated financial statements are the responsibility of the Company’s management. Our responsibility is to express an opinion on these consolidated financial statements based on our audits.
We conducted our audits in accordance with the standards of the Public Company Accounting Oversight Board (United States). Those standards require that we plan and perform the audit to obtain reasonable assurance about whether the financial statements are free of material misstatement. An audit includes examining, on a test basis, evidence supporting the amounts and disclosures in the financial statements. An audit also includes assessing the accounting principles used and significant estimates made by management, as well as evaluating the overall financial statement presentation. We believe that our audits provide a reasonable basis for our opinion.
In our opinion, the consolidated financial statements referred to above present fairly, in all material respects, the financial position of Fox Chase Bancorp, Inc. and subsidiary as of December 31, 2006 and 2005, and the results of their operations and their cash flows for the years then ended, in conformity with U.S. generally accepted accounting principles.
As discussed in Note 1 to the consolidated financial statements, the Company adopted Statement of Financial Accounting Standards No. 158, “Employers’ Accounting for Defined Benefit Pensions and Other Post Retirement Plans,” effective December 31, 2006.
/s/ KPMG LLP |
|
Philadelphia, Pennsylvania | |
March 28, 2007 | |
F-1
FOX CHASE BANCORP, INC.

REPORT OF INDEPENDENT REGISTERED PUBLIC ACCOUNTING FIRM
To the Board of Directors
Fox Chase Bancorp, Inc.
Hatboro, Pennsylvania
We have audited the accompanying consolidated statements of operations, changes in stockholders’ equity, and cash flows of Fox Chase Bancorp, Inc. and its wholly-owned subsidiary for the year ended December 31, 2004. These consolidated financial statements are the responsibility of the Company’s management. Our responsibility is to express an opinion on these consolidated financial statements based on our audit.
We conducted our audit in accordance with the standards of the Public Company Accounting Oversight Board (United States). Those standards require that we plan and perform the audit to obtain reasonable assurance about whether the consolidated financial statements are free of material misstatement. The Company is not required to have, nor were we engaged to perform, an audit of its internal control over financial reporting. Our audit included consideration of internal control over financial reporting as a basis for designing audit procedures that are appropriate in the circumstances, but not for the purpose of expressing an opinion on the effectiveness of the Company’s internal control over financial reporting. Accordingly, we express no such opinion. An audit also includes examining, on a test basis, evidence supporting the amounts and disclosures in the consolidated financial statements, assessing the accounting principles used and significant estimates made by management, as well as evaluating the overall financial statement presentation. We believe that our audit provides a reasonable basis for our opinion.
In our opinion, the 2004 consolidated financial statements referred to above present fairly, in all material respects, the results of operations and cash flows of Fox Chase Bancorp, Inc. and its wholly-owned subsidiary for the year ended December 31, 2004, in conformity with accounting principles generally accepted in the United States of America.
/s/ Beard Miller Company LLP |
| |
| ||
| ||
Beard Miller Company LLP | ||
Harrisburg, Pennsylvania | ||
August 25, 2005 | ||
F-2
FOX CHASE BANCORP, INC.
CONSOLIDATED STATEMENTS OF CONDITION (IN THOUSANDS, EXCEPT SHARE DATA)
|
| December 31, |
| ||||||||||
|
| 2006 |
| 2005 |
| ||||||||
ASSETS |
|
|
|
|
| ||||||||
|
|
|
|
|
| ||||||||
Cash and due from banks |
| $ | 3,295 |
| $ | 3,761 |
| ||||||
Interest-earning demand deposits in other banks |
| 131,146 |
| 42,325 |
| ||||||||
Total cash and cash equivalents |
| 134,441 |
| 46,086 |
| ||||||||
Interest-earning time deposits in other banks |
| — |
| 600 |
| ||||||||
Investment securities available-for-sale |
| 70,112 |
| 141,783 |
| ||||||||
Mortgage related securities available-for-sale |
| 158,320 |
| 187,721 |
| ||||||||
Loans held for sale |
| 1,194 |
| 357 |
| ||||||||
Loans, net of allowance for loan losses of $2,949 at December 31, |
| 355,617 |
| 366,393 |
| ||||||||
Federal Home Loan Bank stock, at cost |
| 4,422 |
| 4,146 |
| ||||||||
Assets acquired through foreclosure |
| — |
| 107 |
| ||||||||
Bank-owned life insurance |
| 11,324 |
| 10,897 |
| ||||||||
Premises and equipment |
| 14,287 |
| 14,153 |
| ||||||||
Accrued interest and dividends receivable |
| 3,397 |
| 3,301 |
| ||||||||
Mortgage servicing rights |
| 1,177 |
| 1,168 |
| ||||||||
Deferred tax asset, net |
| 1,087 |
| 2,811 |
| ||||||||
Other assets |
| 1,607 |
| 1,768 |
| ||||||||
|
|
|
|
|
| ||||||||
Total Assets |
| $ | 756,985 |
| $ | 781,291 |
| ||||||
|
|
|
|
|
| ||||||||
|
|
|
|
| |||||||||
|
|
|
|
|
| ||||||||
LIABILITIES |
|
|
|
|
| ||||||||
Deposits |
| $ | 596,534 |
| $ | 682,307 |
| ||||||
Federal Home Loan Bank advances |
| 30,000 |
| 30,000 |
| ||||||||
Advances from borrowers for taxes and insurance |
| 2,262 |
| 2,503 |
| ||||||||
Accrued interest payable |
| 298 |
| 268 |
| ||||||||
Accrued expenses and other liabilities |
| 2,246 |
| 2,692 |
| ||||||||
|
|
|
|
|
| ||||||||
Total Liabilities |
| 631,340 |
| 717,770 |
| ||||||||
|
|
|
|
|
| ||||||||
STOCKHOLDERS’ EQUITY |
|
|
|
|
| ||||||||
|
|
|
|
|
| ||||||||
Preferred stock ($.01 par value; 1,000,000 shares authorized, none |
| — |
| — |
| ||||||||
Common stock ($.01 par value; 35,000,000 shares authorized, |
| 147 |
| — |
| ||||||||
Additional paid-in capital |
| 62,365 |
| — |
| ||||||||
Unearned common stock held by employee stock ownership plan |
| (5,371 | ) | — |
| ||||||||
Retained earnings |
| 69,545 |
| 65,911 |
| ||||||||
Accumulated other comprehensive loss, net |
| (1,041 | ) | (2,390 | ) | ||||||||
|
|
|
|
|
| ||||||||
Total Stockholders’ Equity |
| 125,645 |
| 63,521 |
| ||||||||
|
|
|
|
|
| ||||||||
Total Liabilities and Stockholders’ Equity |
| $ | 756,985 |
| $ | 781,291 |
| ||||||
The accompanying notes are an integral part of these consolidated financial statements.
F-3
Fox Chase Bancorp, Inc.
CONSOLIDATED STATEMENTS OF OPERATIONS (IN THOUSANDS, EXCEPT PER SHARE DATA)
|
| Years Ended December 31, |
| |||||||
|
| 2006 |
| 2005 |
| 2004 |
| |||
INTEREST INCOME |
|
|
|
|
|
|
| |||
Interest and fees on loans |
| $ | 21,742 |
| $ | 25,722 |
| $ | 27,386 |
|
Interest on mortgage related securities |
| 8,035 |
| 5,641 |
| 5,178 |
| |||
Interest on investment securities available-for-sale: |
|
|
|
|
|
|
| |||
Taxable |
| 3,523 |
| 3,061 |
| 3,093 |
| |||
Nontaxable |
| 934 |
| 754 |
| 704 |
| |||
Dividend income |
| 370 |
| 874 |
| 694 |
| |||
Other interest income |
| 2,573 |
| 1,549 |
| 511 |
| |||
Total Interest Income |
| 37,177 |
| 37,601 |
| 37,566 |
| |||
INTEREST EXPENSE |
|
|
|
|
|
|
| |||
Deposits |
| 18,974 |
| 19,212 |
| 18,204 |
| |||
Federal Home Loan Bank advances |
| 1,485 |
| 1,485 |
| 1,489 |
| |||
Total Interest Expense |
| 20,459 |
| 20,697 |
| 19,693 |
| |||
Net Interest Income |
| 16,718 |
| 16,904 |
| 17,873 |
| |||
Provision (credit) for loan losses |
| (5,394 | ) | (6,025 | ) | 12,282 |
| |||
Net Interest Income after Provision (Credit) for Loan Losses |
| 22,112 |
| 22,929 |
| 5,591 |
| |||
NONINTEREST INCOME |
|
|
|
|
|
|
| |||
Service charges and other fee income |
| 1,037 |
| 775 |
| 937 |
| |||
Net gain (loss) on sale of: |
|
|
|
|
|
|
| |||
Loans |
| 199 |
| 567 |
| 279 |
| |||
Assets acquired through foreclosure |
| 85 |
| 6 |
| 24 |
| |||
Fixed assets |
| (59 | ) | (161 | ) | (4 | ) | |||
Securities |
| (17 | ) | (809 | ) | 169 |
| |||
Income on bank-owned life insurance |
| 427 |
| 448 |
| 447 |
| |||
Other |
| 401 |
| 388 |
| 427 |
| |||
Total Noninterest Income |
| 2,073 |
| 1,214 |
| 2,279 |
| |||
NONINTEREST EXPENSE |
|
|
|
|
|
|
| |||
Salaries, benefits and other compensation |
| 9,194 |
| 7,442 |
| 5,875 |
| |||
Occupancy expense |
| 1,567 |
| 1,740 |
| 1,499 |
| |||
Furniture and equipment expense |
| 1,048 |
| 814 |
| 687 |
| |||
Data processing costs |
| 1,514 |
| 1,452 |
| 1,242 |
| |||
Professional fees |
| 1,853 |
| 1,127 |
| 419 |
| |||
Marketing expense |
| 621 |
| 373 |
| 407 |
| |||
FDIC premiums |
| 796 |
| 765 |
| 115 |
| |||
Contribution to charitable foundation |
| 1,500 |
| — |
| — |
| |||
Other |
| 1,774 |
| 1,495 |
| 1,109 |
| |||
Total Noninterest Expense |
| 19,867 |
| 15,208 |
| 11,353 |
| |||
Income (Loss) Before Income Taxes |
| 4,318 |
| 8,935 |
| (3,483 | ) | |||
Income tax provision (benefit) |
| 684 |
| 2,975 |
| (1,595 | ) | |||
Net Income (Loss) |
| $ | 3,634 |
| $ | 5,960 |
| $ | (1,888 | ) |
Earnings per share (1): |
|
|
|
|
|
|
| |||
Basic |
| $ | 0.14 |
| — |
| — |
| ||
Diluted |
| $ | 0.14 |
| — |
| — |
| ||
(1) Due to the timing of the Bank’s reorganization into the mutual holding company form and the completion of the Company’s initial public offering on September 29, 2006, earnings per share information for the year ended December 31, 2006 is only for the period September 29, 2006 through December 31, 2006.
The accompanying notes are an integral part of these consolidated financial statements.
F-4
FOX CHASE BANCORP, INC.
CONSOLIDATED STATEMENTS OF CHANGES IN STOCKHOLDERS’ EQUITY
For the Years Ended December 31, 2006, 2005 and 2004
|
|
|
|
|
| Unearned |
|
|
| Accumulated |
|
|
| ||||||
|
|
|
|
|
| Common |
|
|
| Other |
|
|
| ||||||
|
|
|
| Additional |
| Stock held |
|
|
| Comprehensive |
|
|
| ||||||
|
| Common |
| Paid in |
| by |
| Retained |
| Income/ |
| Total |
| ||||||
|
| Stock |
| Capital |
| ESOP |
| Earnings |
| (Loss) |
| Equity |
| ||||||
BALANCE - DECEMBER 31, 2003 |
| $ | — |
| $ | — |
| $ | — |
| $ | 61,839 |
| $ | 492 |
| $ | 62,331 |
|
Net loss |
| — |
| — |
| — |
| (1,888 | ) | — |
| (1,888 | ) | ||||||
Net change in unrealized losses on securities available-for-sale, net of taxes |
| — |
| — |
| — |
| — |
| (1,253 | ) | (1,253 | ) | ||||||
BALANCE - DECEMBER 31, 2004 |
| $ | — |
| — |
| — |
| $ | 59,951 |
| (761 | ) | $ | 59,190 |
| |||
Net income |
| — |
| — |
| — |
| 5,960 |
| — |
| 5,960 |
| ||||||
Net change in unrealized losses on securities available-for-sale, net of taxes |
| — |
| — |
| — |
| — |
| (1,629 | ) | (1,629 | ) | ||||||
BALANCE - DECEMBER 31, 2005 |
| $ | — |
| $ | — |
| $ | — |
| $ | 65,911 |
| $ | (2,390 | ) | $ | 63,521 |
|
Sale of 6,395,835 shares of common stock in initial public offering, issuance of 8,148,915 to the mutual holding company and issuance of 135,000 to the charitable foundation |
| 147 |
| 62,201 |
| — |
| — |
| — |
| 62,348 |
| ||||||
Common stock acquired by ESOP |
| — |
| — |
| (5,755 | ) | — |
| — |
| (5,755 | ) | ||||||
Unallocated ESOP shares committed to employees |
| — |
| 128 |
| 384 |
| — |
| — |
| 512 |
| ||||||
Shares allocated in long-term incentive plan |
| — |
| 36 |
| — |
| — |
| — |
| 36 |
| ||||||
Adjustment to initially apply SFAS No. 158, net of tax |
| — |
| — |
| — |
| — |
| (98 | ) | (98 | ) | ||||||
Net income |
| — |
| — |
| — |
| 3,634 |
| — |
| 3,634 |
| ||||||
Net change in unrealized losses on securities available-for-sale, net of taxes |
| — |
| — |
| — |
| — |
| 1,447 |
| 1,447 |
| ||||||
BALANCE - DECEMBER 31, 2006 |
| $ | 147 |
| $ | 62,365 |
| $ | (5,371 | ) | $ | 69,545 |
| $ | (1,041 | ) | $ | 125,645 |
|
The accompanying notes are an integral part of these consolidated financial statements.
F-5
FOX CHASE BANCORP, INC.
CONSOLIDATED STATEMENTS OF CASH FLOWS (IN THOUSANDS)
|
| Year Ended December 31, |
| |||||||
|
| 2006 |
| 2005 |
| 2004 |
| |||
CASH FLOWS FROM OPERATING ACTIVITIES |
|
|
|
|
|
|
| |||
Net income (loss) |
| $ | 3,634 |
| $ | 5,960 |
| $ | (1,888 | ) |
Adjustments to reconcile net income (loss) to net cash provided by operating activities: |
|
|
|
|
|
|
| |||
Provision (credit) for loan losses |
| (5,394 | ) | (6,025 | ) | 12,282 |
| |||
Depreciation |
| 1,229 |
| 1,193 |
| 1,046 |
| |||
Net amortization of securities premiums and discounts |
| 809 |
| 1,895 |
| 2,032 |
| |||
Provision for deferred income taxes |
| 997 |
| 2,025 |
| (4,020 | ) | |||
Shares committed to be released to the ESOP |
| 512 |
| — |
| — |
| |||
Shares earned in the long-term incentive plan |
| 36 |
| — |
| — |
| |||
Origination of loans held for sale |
| (21,774 | ) | (357 | ) | — |
| |||
Proceeds from sale of loans held for sale |
| 20,914 |
| — |
| — |
| |||
Net realized losses (gains) on sales of assets acquired through foreclosure and fixed assets |
| (26 | ) | 155 |
| (20 | ) | |||
Net realized gain on sales of mortgage related securities |
| — |
| (108 | ) | (28 | ) | |||
Net loss (gain) on sale and impairment of securities |
| 17 |
| 917 |
| (141 | ) | |||
Net gain on sales of loans and loans held for sale |
| (199 | ) | (567 | ) | (279 | ) | |||
Earnings on investment in bank-owned life insurance |
| (427 | ) | (448 | ) | (447 | ) | |||
Increase in mortgage servicing rights |
| (9 | ) | (531 | ) | (418 | ) | |||
(Increase) decrease in accrued interest and dividends receivable and other assets |
| 250 |
| (991 | ) | 1,828 |
| |||
Increase (decrease) in accrued interest payable, accrued expenses and other liabilities |
| (565 | ) | 3,555 |
| 1,328 |
| |||
Net Cash Provided by Operating Activities |
| 4 |
| 6,673 |
| 11,275 |
| |||
|
|
|
|
|
|
|
| |||
CASH FLOWS FROM INVESTING ACTIVITIES |
|
|
|
|
|
|
| |||
Net maturities of interest-earning time deposits in other banks |
| 600 |
| 2,574 |
| 1,218 |
| |||
Investment securities available for sale securities: |
|
|
|
|
|
|
| |||
Purchases |
| (28,418 | ) | (17,231 | ) | (67,946 | ) | |||
Proceeds from sales |
| 17,205 |
| 17,409 |
| 14,778 |
| |||
Proceeds from maturities, calls and principal repayments |
| 84,075 |
| 1,063 |
| 64,819 |
| |||
Mortgage related securities - AFS: |
|
|
|
|
|
|
| |||
Purchases |
| (31,789 | ) | (92,637 | ) | (89,784 | ) | |||
Proceeds from sale |
| — |
| 9,976 |
| 2,658 |
| |||
Proceeds from maturities, calls and principal repayments |
| 61,396 |
| 74,918 |
| 76,715 |
| |||
Net (increase) decrease in loans |
| 12,209 |
| 38,920 |
| (125,842 | ) | |||
Proceeds from sales of loans |
| 4,000 |
| 83,784 |
| 45,671 |
| |||
Net (increase) decrease in Federal Home Loan Bank stock |
| (276 | ) | 1,355 |
| (559 | ) | |||
Purchases of premises and equipment |
| (1,422 | ) | (904 | ) | (2,605 | ) | |||
Proceeds from sales of assets acquired through foreclosure |
| 192 |
| — |
| 107 |
| |||
Net Cash Provided (Used) by Investing Activities |
| 117,772 |
| 119,227 |
| (80,770 | ) | |||
|
|
|
|
|
|
|
| |||
CASH FLOWS FROM FINANCING ACTIVITIES |
|
|
|
|
|
|
| |||
Net increase (decrease) in deposits |
| (85,773 | ) | (122,943 | ) | 81,412 |
| |||
Decrease in advances from borrowers for taxes and insurance |
| (241 | ) | (593 | ) | (217 | ) | |||
Proceeds from stock issuance, net of conversion costs |
| 62,348 |
| — |
| — |
| |||
Acquisition of stock acquired for ESOP plan |
| (5,755 | ) | — |
| — |
| |||
Net Cash (Used) Provided by Financing Activities |
| (29,421 | ) | (123,536 | ) | 81,195 |
| |||
|
|
|
|
|
|
|
| |||
Net Increase in Cash and Cash Equivalents |
| 88,355 |
| 2,364 |
| 11,700 |
| |||
|
|
|
|
|
|
|
| |||
CASH AND CASH EQUIVALENTS — BEGINNING |
| 46,086 |
| 43,722 |
| 32,022 |
| |||
|
|
|
|
|
|
|
| |||
CASH AND CASH EQUIVALENTS — ENDING |
| $ | 134,441 |
| $ | 46,086 |
| $ | 43,722 |
|
SUPPLEMENTAL DISCLOSURE OF CASH FLOW INFORMATION |
|
|
|
|
|
|
| |||
Interest paid |
| $ | 20,363 |
| $ | 20,737 |
| $ | 19,617 |
|
Income taxes paid |
| $ | 487 |
| $ | 1,441 |
| $ | 1,242 |
|
Transfers of loans to assets acquired through foreclosure |
| $ | — |
| $ | 107 |
| — |
| |
The accompanying notes are an integral part of these consolidated financial statements.
F-6
FOX CHASE BANCORP, INC.
NOTES TO CONSOLIDATED FINANCIAL STATEMENTS
NOTE 1 - SUMMARY OF SIGNIFICANT ACCOUNTING POLICIES
Business
Fox Chase Bancorp, Inc. (the “Company”) was organized on September 29, 2006 under the laws of the United States for the purpose of being a holding company for Fox Chase Bank (the “Bank”), a stock savings bank also organized under the laws of the United States. On September 29, 2006, the Company completed its initial public offering in which it sold 6,395,835 shares, or 43.57%, of its outstanding common stock to the public, including 575,446 shares purchased by the Fox Chase Bank Employee Stock Ownership Plan (the “ESOP”). An additional 8,148,915 shares, or 55.51% of the Company’s outstanding stock, were issued to Fox Chase MHC, the Company’s federally chartered holding company. Net proceeds of the offering totaled $56.6 million. Additionally, the Company contributed $150,000 in cash and issued 135,000 shares, or 0.92% of its outstanding common stock, to the Fox Chase Bank Charitable Foundation.
The Company’s primary business has been that of holding the common stock of the Bank and a loan to the ESOP. Fox Chase Bancorp, Inc. is authorized to pursue other business activities permissible by laws and regulations for other savings and loan holding companies.
The Company provides a wide variety of financial products and services to individuals and businesses through its eleven branches in Philadelphia, Richboro, Willow Grove, Warminster, Lahaska, Hatboro, Media and Exton, Pennsylvania, and Ocean City, Marmora and Egg Harbor Township, New Jersey. The operations of the Company are managed as a single business segment. The Company competes with other financial institutions and other companies that provide financial services.
The Company and Bank are subject to regulations of certain federal banking agencies. These regulations can and do change significantly from period to period. The Company and Bank also undergo periodic examinations by regulatory agencies which may subject it to further changes with respect to asset valuations, amounts of required loss allowances and operating restrictions resulting from the regulators’ judgments based on information available to them at the time of their examinations.
Principles of Consolidation and Presentation
The consolidated financial statements include the accounts of the Company and its wholly owned subsidiary, the Bank (collectively referred to as the “Company”). The Bank’s operations include the accounts of its wholly owned subsidiary, Fox Chase Financial, Inc. Fox Chase Financial, Inc. is a Delaware chartered investment holding company and its sole purpose is to manage and hold investment securities. The consolidated financial statements include the Company beginning on September 29, 2006. The consolidated financial statements and related notes include only the activity and balances of the Bank and its subsidiary through September 29, 2006. The financial statements do not include the transactions and balances of Fox Chase MHC. All material inter-company transactions and balances have been eliminated in consolidation. Prior period amounts are reclassified, when necessary, to conform with the current year’s presentation.
The Company follows accounting principles and reporting practices which are in compliance with U.S. generally accepted accounting principles (“GAAP”). The preparation of the financial statements in conformity with GAAP requires management to make estimates and assumptions that affect the reported amounts of assets and liabilities and disclosure of contingent assets and liabilities at the date of the financial statements and the reported amounts of revenues and expenses during the reporting period. Actual results could differ from those estimates. Material estimates that are particularly
F-7
susceptible to significant change in the near term relate to the determination of the allowance for loan losses, the valuation and losses, the valuation and realizability of deferred tax assets, the evaluation of mortgage servicing rights and the evaluation of other than temporary impairment of investments.
Risk and Uncertainties
In the normal course of its business, the Company encounters two significant types of risk: economic and regulatory. There are three main components of economic risk: interest rate risk, credit risk and market risk. The Company is subject to interest rate risk to the degree that its interest-bearing liabilities mature or reprice at different speeds, or on a different basis from its interest-earning assets. The Company’s primary credit risk is the risk of defaults in the Company’s loan portfolio that result from borrowers inability or unwillingness to make contractually required payments. The Company’s lending activities are concentrated in Southeastern Pennsylvania and Southern New Jersey. The ability of the Company’s borrowers to repay amounts owed is dependent on several factors, including the economic conditions in the borrowers’ geographic regions and the borrowers’ financial conditions. Market risk reflects changes in the value of the collateral underlying loans, the valuation of real estate held by the Company, and the valuation of loans held for sale, securities, mortgage servicing assets and other investments.
Cash and Cash Equivalents
For purposes of reporting cash flows, cash and cash equivalents include cash and due from banks and interest-earning demand deposits in other banks. At times, such balances exceed the FDIC limits.
Interest-Earning Time Deposits in Other Banks
The Company maintains interest-earning time deposits at various financial institutions generally having maturities greater than 90 days. At times, such balances exceed the FDIC limits. Management periodically assesses the financial condition of these institutions and believes the potential credit risk is minimal.
Investment Securities
The Company accounts for their investment securities in accordance with SFAS No. 115, “Accounting for Certain Investments in Debt and Equity Securities.” This standard requires, among other things, that debt and equity securities are classified into three categories and accounted for as follows:
· Debt securities with the positive intention to hold to maturity are classified as “held-to-maturity” and reported at amortized cost.
· Debt and equity securities purchased with the intention of selling them in the near future are classified as “trading securities” and are reported at fair value, with unrealized gains and losses included in earnings.
· Debt and equity securities not classified in either of the above categories are classified as “available-for-sale securities” and reported at fair value, with unrealized gains and losses excluded from earnings and reported, net of tax, as increases or decreases in other comprehensive income, a separate component of stockholders’ equity. Securities classified as available-for-sale are those securities that the Company intends to hold for an indefinite period of time but not necessarily to maturity. Any decision to sell a security classified as
F-8
available-for-sale would be based on various factors, including significant movement in interest rates, changes in maturity mix of the Company’s assets and liabilities, liquidity needs, regulatory capital considerations and other similar factors.
Management determines the appropriate classification of debt securities at the time of purchase and re-evaluates such designation as of each balance sheet date.
Purchase premiums and discounts are recognized in interest income using the interest method over the terms of the securities. Declines in the fair value of available-for-sale securities below their cost that are deemed to be other than temporary are reflected in earnings as realized losses. In estimating other-than-temporary impairment losses, management considers (1) the length of time and the extent to which the fair value has been less than cost, (2) the financial condition and near-term prospects of the issuer and (3) the intent and ability of the Company to retain its investment in the issuer for a period of time sufficient to allow for any anticipated recovery in fair value. Gains and losses on the sale of securities are recorded on the trade date and are determined using the specific identification method.
Because of the volatility of the financial markets in which securities are traded, there is the risk that any future fair value could be significantly less than that recorded or disclosed in the accompanying financial statements. Federal law requires a member institution of the Federal Home Loan Bank System to hold stock of its district Federal Home Loan Bank according to a predetermined formula. This stock is carried at cost.
Loans Held for Sale
The Company originates mortgage loans held for investment and held for sale. At origination, the mortgage loan is identified as either held for sale or for investment. Mortgage loans originated and intended for sale in the secondary market are carried at the lower of aggregate cost or estimated fair value. Net unrealized losses are recognized by charges to operations. Cash receipts and cash payments resulting from acquisitions and sales of loans are classified as operating cash flows if those loans are acquired specifically for resale and are carried at fair value or the lower of cost or fair value. Cash receipts resulting from sales of loans that were not specifically acquired for resale are classified as investing cash inflows regardless of a change in the purpose for holding those loans.
Mortgage Servicing Rights
Upon the sale of a residential mortgage loan where the Company retains servicing rights, a mortgage servicing right is recorded. Existing GAAP applicable to the periods presented herein requires that mortgage servicing rights on these loans be amortized into income over the estimated life of the loans sold using the interest method. Such assets are subject to a disaggregated impairment test at the end of each reporting period, based on the predominant risk characteristics of the underlying loans.
Loans, Loan Origination Fees and Uncollected Interest
Loans are recorded at cost, net of unearned discounts, deferred fees and allowances. Discounts or premiums on purchased loans are amortized using the interest method over the remaining contractual life of the portfolio, adjusted for actual prepayments. Loan origination fees and certain direct origination costs are deferred and amortized using the interest method over the contractual life as an
F-9
adjustment to yield on the loans. Interest income is accrued on the unpaid principal balance. From time-to-time, the Company sells certain loans for liquidity purposes or to manage interest rate risk.
The accrual of interest is generally discontinued when the contractual payment of principal or interest has become 90 days past due or management has serious doubts about further collectibility of principal or interest, even though the loan is currently performing. A loan may remain on accrual status if it is in the process of collection and is either guaranteed or well secured. When a loan is placed on nonaccrual status, unpaid interest income is reversed. Interest received on nonaccrual loans generally is either applied against principal or reported as interest income, according to management’s judgment as to the ultimate collectibility of principal. Generally, loans are restored to accrual status when the obligation is brought current, has performed in accordance with the contractual terms for a reasonable period of time and the ultimate collectibility of the total contractual principal and interest is no longer in doubt.
Allowance for Loan Losses
The allowance for loan losses is established through provisions for loan losses charged against income. Loans deemed to be uncollectible are charged against the allowance for loan losses, and subsequent recoveries, if any, are credited to the allowance.
The allowance for loan losses is maintained at a level representing management’s best estimate of known and inherent losses in the portfolio, based upon management’s evaluation of the portfolio’s collectibility. Management’s evaluation is based upon an analysis of the loan portfolio, past loss experience, current economic conditions and other relevant factors. While management uses the best information available to make its evaluations, such evaluations are highly subjective, and future adjustments to the allowance may be necessary if conditions differ substantially from the assumptions used in making the evaluations. In addition, various regulatory agencies periodically review the Company’s allowance for loan losses. Such agencies may require the Company to recognize additions to the allowance, based on their judgments at the time of their examination.
Loans are deemed impaired when, based on current information and events, it is probable that the Company will be unable to collect all proceeds due according to the contractual terms of the loan agreement. Factors considered by management in determining impairment include payment status, collateral value and the probability of collecting scheduled principal and interest payments when due. For purposes of applying measurement criteria for impaired loans, the Company excludes large groups of smaller homogenous loans, primarily consisting of residential real estate and consumer loans, as well as commercial loans with balances of less than $100,000.
Impairment is measured on a loan by loan basis for commercial loans by either the present value of expected future cash flows discounted at the loan’s effective interest rate, the loan’s obtainable market price or the fair value of the collateral if the loan is collateral dependent.
Assets Acquired Through Foreclosure
Real estate and other repossessed collateral acquired through a foreclosure or by a deed-in-lieu of foreclosure are classified as assets acquired through foreclosure. Assets acquired through foreclosure are carried at the lower of cost or fair value, net of estimated selling costs. Costs related to the development or improvement of a foreclosed property are capitalized; holding costs are charged to expense as incurred.
F-10
Bank-Owned Life Insurance
The Company has invested in bank owned life insurance (“BOLI”). BOLI involves the purchasing of life insurance by the Company on a chosen group of employees and directors. The Company is the owner and beneficiary of the policies. This life insurance investment is carried at the cash surrender value of the underlying policies. Income from the increase in cash surrender value of the policies is included in other income in the consolidated statements of operations.
Premises and Equipment
Premises and equipment are carried at cost less accumulated depreciation. Depreciation is computed on the straight-line method over the assets’ estimated useful lives (generally 10-39 years for buildings and 3-7 years for furniture and equipment). When assets are retired, or otherwise disposed of, the cost and related accumulated depreciation are removed from the accounts. The cost of maintenance and repairs is charged to expense when incurred and renewals and betterments are capitalized. Leasehold improvements are depreciated using the straight-line method over the shorter of the useful life of the improvement or the remaining life of the lease.
Transfers of Financial Assets
Transfers of financial assets are accounted for as sales, when control over the assets has been surrendered. Control over transferred assets is deemed to be surrendered when (1) the assets have been isolated from the Company, (2) the transferee obtains the right (free of conditions that constrain it from taking advantage of that right) to pledge or exchange the transferred assets and (3) the Company does not maintain effective control over the transferred assets through an agreement to repurchase them before maturity.
Income Taxes
The Company accounts for income taxes under the asset/liability method. Deferred tax assets are recognized for deductible temporary differences and deferred tax liabilities are recognized for taxable temporary differences. Temporary differences are the differences between the reported amounts of assets and liabilities and their tax bases. Deferred tax assets are reduced by a valuation allowance when, in the opinion of management, it is more likely than not that some portion of the deferred tax assets will not be realized. Deferred tax assets and liabilities are adjusted for the effects of changes in tax laws and rates on the date of enactment. The Company and its subsidiaries file a consolidated federal income tax return and individual state and local income tax returns.
Marketing and Advertising
The Company expenses marketing and advertising costs as incurred.
Off-Balance Sheet Financial Instruments
In the ordinary course of business, the Company has entered into off-balance sheet financial instruments consisting of commitments to extend credit. Such financial instruments are recorded in the balance sheet when they are funded. The Company uses the same credit policies in making commitments and conditional obligations as it does for on-balance sheet instruments.
F-11
Pension Plan
SFAS No. 158, “Employers’ Accounting for Defined Benefit Pension and Other Postretirement Plans,” became effective as of December 31, 2006, and requires recognition of an asset or liability in the statement of condition reflecting the funded status of the Pension Plan with current year changes in the funded status recognized in accumulated other comprehensive income (loss), net. SFAS No. 158 did not change the existing criteria for measurement of periodic benefit costs, plan assets or benefit obligations.
The following table summarizes the incremental effects of the initial adoption of SFAS No. 158 on our Statement of Condition at December 31, 2006 (dollars in thousands).
| Before |
|
|
| After |
| ||||
|
| Application of |
| SFAS No. 158 |
| Application |
| |||
|
| SFAS No. 158 |
| Adjustments |
| of SFAS No.158 |
| |||
Other assets |
| $ | 1,668 |
| $ | (61 | ) | $ | 1,607 |
|
Total assets |
| 756,996 |
| (11 | ) | 756,985 |
| |||
Deferred tax asset |
| 1,037 |
| 50 |
| 1,087 |
| |||
Accrued expenses and other liabilities |
| 2,159 |
| 87 |
| 2,246 |
| |||
Total liabilities |
| 631,253 |
| 87 |
| 631,340 |
| |||
Accumulated other comprehensive loss |
| (943 | ) | (98 | ) | (1,041 | ) | |||
Total stockholders’ equity |
| 125,743 |
| (98 | ) | 125,645 |
| |||
Total liabilities and stockholders’ equity |
| 756,996 |
| (11 | ) | 756,985 |
| |||
See Note 9 for further details on the Bank’s pension plan.
Employee Stock Ownership Plan
The employee stock ownership plan (“ESOP”) is accounted for in accordance with the provisions of Statement of Position No. 93-6, “Employer Accounting for Employee Stock Ownership Plans.” The funds borrowed by the ESOP from the Company to purchase the Company’s common stock are being repaid from the Bank’s contributions over a period of 15 years. The Company’s common stock not yet allocated to participants is recorded as a reduction of stockholder’s equity at cost. The Company’s loan to the ESOP and the ESOP’s note payable are not reflected in the consolidated statement of condition.
Compensation expense for the ESOP is based on the market price of the Company’s stock and is recognized as shares are committed to be released to participants. The note receivable and related interest income are included in the parent company financial statements presented in Note 18.
Per Share Information
The Company follows the provisions of SFAS No. 128, “Earnings Per Share.” Basic earnings per share exclude dilution and is computed by dividing income available to common stockholders by the weighted-average common shares outstanding during the period. Diluted earnings per share takes into account the potential dilution that could occur if securities or other contracts to issue common stock were exercised and converted into common stock. Earnings per share were not calculated in
F-12
2004 and 2005 since the Company did not complete its initial public offering until September 29, 2006.
Earnings per share (“EPS”), basic and diluted, were $0.14 for the year ended December 31, 2006. Due to timing of the Bank’s reorganization into a mutual holding company form and the completion of the Company’s initial public offering on September 29, 2006, earnings per share information for the year ended December 31, 2006 is only for the period from September 29, 2006 through December 31, 2006.
The following table presents the reconciliation of the numerators and denominators of the basic and diluted EPS computations.
| Year Ended |
| ||
|
| December 31, |
| |
|
| 2006 |
| |
Net income for the period from September 29, 2006 to December 31, 2006 |
| $ | 2,015,000 |
|
|
|
|
| |
Weighted-average common shares outstanding |
| 14,679,750 |
| |
Average common stock acquired by stock benefit plans: |
|
|
| |
Unvested shares — long-term incentive plan |
| (36,381 | ) | |
ESOP shares unallocated, net |
| (562,522 | ) | |
|
|
|
| |
Weighted-average common shares used to calculate basic earnings per share |
| 14,080,847 |
| |
|
|
|
| |
Dilutive effect of shares in long-term incentive plan |
| 36,381 |
| |
|
|
|
| |
Weighted-average common shares used to calculate diluted earnings per share |
| 14,117,228 |
| |
|
|
|
| |
Earnings per share-basic |
| $ | 0.14 |
|
Earnings per share-diluted |
| $ | 0.14 |
|
F-13
NOTE 2 — ADJUSTMENTS OF ACCOUNTING ERRORS
During 2006, management identified and corrected certain accounting errors that occurred in prior years. Management evaluated the quantitative and qualitative impact of the corrections, individually and in the aggregate, on previously reported periods, the current years results of operations and on earnings trends. Based upon this evaluation, management concluded that such errors are not material to the Company’s consolidated financial statements taken as a whole. The adjustments, amounting to $313,000 ($207,000 after tax), increased expenses by $337,000 and increased other income by $24,000 in 2006. Additionally, the Company reduced its tax contingency reserve and expense by $105,000 in 2006 after reevaluating the Company’s tax position.
NOTE 3 - INVESTMENT AND MORTGAGE RELATED SECURITIES
The amortized cost and fair value of securities available-for-sale as of December 31, 2006 and 2005 are summarized as follows:
|
| December 31, 2006 |
| ||||||||||
|
| Amortized |
| Gross |
| Gross |
| Fair |
| ||||
|
| (In Thousands) |
| ||||||||||
Obligations of U.S. government agencies |
| $ | 42,344 |
| $ | 4 |
| $ | (470 | ) | $ | 41,878 |
|
State and political subdivisions |
| 24,126 |
| 141 |
| (48 | ) | 24,219 |
| ||||
Corporate debt securities |
| 4,017 |
| — |
| (2 | ) | 4,015 |
| ||||
|
| 70,487 |
| 145 |
| (520 | ) | 70,112 |
| ||||
|
|
|
|
|
|
|
|
|
| ||||
Mortgage related securities |
| 159,369 |
| 299 |
| (1,348 | ) | 158,320 |
| ||||
|
|
|
|
|
|
|
|
|
| ||||
Total securities |
| $ | 229,856 |
| $ | 444 |
| $ | (1,868 | ) | $ | 228,432 |
|
|
| December 31, 2005 |
| ||||||||||
|
| Amortized |
| Gross |
| Gross |
| Fair |
| ||||
|
| (In Thousands) |
| ||||||||||
Obligations of U.S. government agencies |
| $ | 99,602 |
| $ | 30 |
| $ | (1,324 | ) | $ | 98,308 |
|
State and political subdivisions |
| 18,863 |
| 116 |
| (171 | ) | 18,808 |
| ||||
Corporate debt securities |
| 7,926 |
| — |
| (323 | ) | 7,603 |
| ||||
Mutual funds |
| 17,064 |
| — |
| — |
| 17,064 |
| ||||
|
| 143,455 |
| 146 |
| (1,818 | ) | 141,783 |
| ||||
|
|
|
|
|
|
|
|
|
| ||||
Mortgage related securities |
| 189,698 |
| 311 |
| (2,288 | ) | 187,721 |
| ||||
|
|
|
|
|
|
|
|
|
| ||||
Total securities |
| $ | 333,153 |
| $ | 457 |
| $ | (4,106 | ) | $ | 329,504 |
|
F-14
The following tables show gross unrealized losses and fair value of securities, aggregated by security category and length of time that individual securities have been in a continuous unrealized loss position, at December 31, 2006 and 2005:
|
| December 31, 2006 |
| ||||||||||||||||
|
| Less than 12 Months |
| 12 Months or More |
| Total |
| ||||||||||||
|
| Fair |
| Unrealized |
| Fair |
| Unrealized |
| Fair |
| Unrealized |
| ||||||
|
| (In Thousands) |
| ||||||||||||||||
Obligations of U.S. government agencies |
| $ | 9,265 |
| $ | (19 | ) | $ | 29,614 |
| $ | (451 | ) | $ | 38,879 |
| $ | (470 | ) |
State and political subdivisions |
| 2,632 |
| (8 | ) | 2,708 |
| (40 | ) | 5,340 |
| (48 | ) | ||||||
Corporate debt securities |
| — |
| — |
| 4,015 |
| (2 | ) | 4,015 |
| (2 | ) | ||||||
Mortgage related securities |
| 52,588 |
| (249 | ) | 69,023 |
| (1,099 | ) | 121,611 |
| (1,348 | ) | ||||||
|
|
|
|
|
|
|
|
|
|
|
|
|
| ||||||
Total securities |
| $ | 64,485 |
| $ | (276 | ) | $ | 105,360 |
| $ | (1,592 | ) | $ | 169,845 |
| $ | (1,868 | ) |
|
| December 31, 2005 |
| ||||||||||||||||
|
| Less than 12 Months |
| 12 Months or More |
| Total |
| ||||||||||||
|
| Fair |
| Unrealized |
| Fair |
| Unrealized |
| Fair |
| Unrealized |
| ||||||
|
| (In Thousands) |
| ||||||||||||||||
Obligations of U.S. government agencies |
| $ | 21,712 |
| $ | (289 | ) | $ | 65,330 |
| $ | (1,035 | ) | $ | 87,042 |
| $ | (1,324 | ) |
State and political subdivisions |
| 7,619 |
| (78 | ) | 2,993 |
| (93 | ) | 10,612 |
| (171 | ) | ||||||
Corporate debt securities |
| 1,943 |
| (91 | ) | 5,660 |
| (232 | ) | 7,603 |
| (323 | ) | ||||||
Mortgage related securities |
| 87,071 |
| (858 | ) | 56,462 |
| (1,430 | ) | 143,533 |
| (2,288 | ) | ||||||
|
|
|
|
|
|
|
|
|
|
|
|
|
| ||||||
Total securities |
| $ | 118,345 |
| $ | (1,316 | ) | $ | 130,445 |
| $ | (2,790 | ) | $ | 248,790 |
| $ | (4,106 | ) |
F-15
Management does not believe that any individual unrealized loss, other than the Company’s loss on mutual funds in 2005 as described below, represents an other-than-temporary impairment at December 31, 2006 and 2005. The temporary impairment on all other investments is directly related to changes in market interest rates. As of December 31, 2005, the Company recorded a loss of $394,000 relating to a mutual fund that the Company determined was other-than-temporarily impaired. In general, as interest rates rise, the fair value of fixed-rate securities will decrease and, as interest rates fall, the fair value of fixed-rate securities will increase. Of the 197 securities with a temporary impairment at December 31, 2006, 195 have a credit rating of AAA and the remaining 2 are corporate bonds that all have a final maturity of less than 12 months. The severity of the impairment as a percent of total investment position is nominal and the duration of the impairment to date is short. The impairments are deemed temporary based on the direct relationship of the decline in fair value to movements in interest rates, as well as the relatively short duration of the investments and their high credit quality, and the Company’s ability and intent to hold these investments to recovery. Securities that have been impaired greater than twelve months include primarily mortgage-related securities. The decline in the fair value of these securities was deemed temporary due to positive factors supporting the recoverability of these investments and the Company’s ability and intent to hold these investments to recovery. Positive factors considered include timely principal payments and the financial health of the issuer.
Additionally, the Company had one private issue mortgage related security as of December 31, 2006. This security has a credit rating of AAA and its balance was $1.7 million and $2.4 million at December 31, 2006 and 2005, respectively.
The amortized cost and estimated fair value of investment securities available-for-sale at December 31, 2006 and December 31, 2005 by contractual maturity are as follows:
|
| December 31, 2006 |
| ||||
|
| Amortized |
| Fair |
| ||
|
| (In Thousands) |
| ||||
Due in one year or less |
| $ | 21,082 |
| $ | 20,949 |
|
Due after one year through five years |
| 15,279 |
| 15,215 |
| ||
Due after five years through ten years |
| 19,479 |
| 19,198 |
| ||
Due after ten years |
| 14,647 |
| 14,750 |
| ||
|
| 70,487 |
| 70,112 |
| ||
Gross gains of $0, $226,000 and $179,000 and gross losses of $17,000, $641,000 and $10,000 were realized on sales of securities during the years ended December 31, 2006, 2005 and 2004, respectively.
Securities with a carrying value of $4,864,000 and $4,819,000 at December 31, 2006 and 2005 respectively, were pledged to secure public deposits and for other purposes as required or permitted by law.
F-16
NOTE 4 - LOANS
The composition of net loans at December 31, 2006 and 2005 is provided below (in thousands).
| December 31, |
| |||||
|
| 2006 |
| 2005 |
| ||
Real estate loans: |
|
|
|
|
| ||
One-to-four family |
| $ | 209,463 |
| $ | 228,476 |
|
Multi-family and commercial |
| 41,720 |
| 32,923 |
| ||
Construction |
| 11,568 |
| 31,015 |
| ||
|
|
|
|
|
| ||
|
| 262,751 |
| 292,414 |
| ||
|
|
|
|
|
| ||
Consumer loans: |
|
|
|
|
| ||
Home equity |
| 73,456 |
| 65,003 |
| ||
Automobile |
| 1,030 |
| 1,280 |
| ||
Lines of credit |
| 10,468 |
| 16,269 |
| ||
Other |
| 148 |
| 188 |
| ||
|
|
|
|
|
| ||
|
| 85,102 |
| 82,740 |
| ||
|
|
|
|
|
| ||
Commercial loans |
| 11,155 |
| 175 |
| ||
|
|
|
|
|
| ||
Total loans |
| 359,008 |
| 375,329 |
| ||
|
|
|
|
|
| ||
Unearned loan origination fees, net |
| (442 | ) | (587 | ) | ||
Allowance for loan losses |
| (2,949 | ) | (8,349 | ) | ||
|
|
|
|
|
| ||
Net loans |
| $ | 355,617 |
| $ | 366,393 |
|
The Company had approximately $18.7 million and $52.7 million of commercial mortgage and construction loans concentrated in the Southern New Jersey shore area at December 31, 2006 and 2005, respectively. Other than the construction loans in Southern New Jersey, a majority of the Company’s loans are in the geographic areas near the Company’s branches in Southeastern Pennsylvania and New Jersey.
The Company reclassified $3,000 and $6,000 of deposit accounts that were overdrawn to other consumer loans as of December 31, 2006 and 2005, respectively.
F-17
The following table presents changes in the allowance for loan losses (in thousands):
| Years Ended December 31, |
| ||||||||
|
| 2006 |
| 2005 |
| 2004 |
| |||
|
|
|
|
|
|
|
| |||
Balance, beginning |
| $ | 8,349 |
| $ | 14,391 |
| $ | 2,109 |
|
Provision (credit) for loan losses |
| (5,394 | ) | (6,025 | ) | 12,282 |
| |||
Loans charged off |
| (8 | ) | (17 | ) | — |
| |||
Recoveries |
| 2 |
| — |
| — |
| |||
|
|
|
|
|
|
|
| |||
Balance, ending |
| $ | 2,949 |
| $ | 8,349 |
| $ | 14,391 |
|
The recorded investment in impaired loans, not requiring an allowance for loan losses was $0 at December 31, 2006 and 2005. The recorded investment in impaired loans requiring an allowance for loan losses was $0 at December 31, 2006 and $3,720,000 at December 31, 2005. The related allowance for loan losses associated with these loans was $0 at December 31, 2006 and $1,860,000 at December 31, 2005. For the years ended December 31, 2006, 2005 and 2004, the average recorded investment in these impaired loans was $2,548,000, $4,479,000 and $21,482,000, respectively. The interest income recognized, representing cash collected, on these impaired loans was $631,000, $142,000 and $1,102,000 for the years ended December 31, 2006, 2005 and 2004, respectively. Loans on which the accrual of interest has been discontinued amounted to $284,000 at December 31, 2006 and $3,520,000 at December 31, 2005. There was one loan totaling $2,941,000 past due 90 days or more and still accruing interest at December 31, 2006 and no loans at December 31, 2005. There were no loans classified as troubled debt restructurings as of December 31, 2006 and 2005.
F-18
NOTE 5 — MORTGAGE SERVICING ACTIVITY
Loans serviced for others are not included in the accompanying consolidated statements of condition. The unpaid principal balances of these loans were $130,294,000 at December 31, 2006, $136,584,000 at December 31, 2005, and $67,568,000 at December 31, 2004.
The following summarizes mortgage-servicing rights for the years ended December 31, 2006, 2005 and 2004 (in thousands):
| Years Ended December 31, |
| ||||||||
|
| 2006 |
| 2005 |
| 2004 |
| |||
|
|
|
|
|
|
|
| |||
Balance, beginning |
| $ | 1,168 |
| $ | 637 |
| $ | 219 |
|
Mortgage servicing rights capitalized |
| 178 |
| 643 |
| 488 |
| |||
Mortgage servicing rights amortized |
| (169 | ) | (112 | ) | (70 | ) | |||
|
|
|
|
|
|
|
| |||
Balance, ending |
| $ | 1,177 |
| $ | 1,168 |
| $ | 637 |
|
The estimated amortization expense of amortizing mortgage servicing rights for each of the five succeeding fiscal years after December 31, 2006 is as follows (in thousands):
2007 |
| $ | (192 | ) |
2008 |
| (169 | ) | |
2009 |
| (144 | ) | |
2010 |
| (121 | ) | |
2011 |
| (102 | ) | |
Thereafter |
| (449 | ) | |
Total |
| $ | (1,177 | ) |
For the periods ended December 31, 2006 and 2005, the fair value of the mortgage servicing rights (“MSRs”) is $1,623,000 and $1,291,000, respectively. The fair value of the MSRs for these periods was determined using a third-party valuation model that calculates the present value of estimated future servicing income. The model incorporates assumptions that market participants use in estimating future net servicing income, including estimates of prepayment speeds and discount rates. Mortgage loan prepayment speed is the annual rate at which borrowers are forecasted to repay their mortgage loan principal and is based on historical experience. The discount rate used to determine the present value of future net servicing income - another key assumption in the model - is the required rate of return the market would expect for an asset with similar risk. Both assumptions can, and generally will, change quarterly valuations as market conditions and interest rates change.
F-19
NOTE 6 - PREMISES AND EQUIPMENT
The components of premises and equipment at December 31, 2006 and 2005 are as follows (in thousands):
| December 31, |
| |||||
|
| 2006 |
| 2005 |
| ||
Land |
| $ | 3,373 |
| $ | 2,960 |
|
Buildings |
| 12,123 |
| 10,691 |
| ||
Furniture, fixtures and equipment |
| 4,849 |
| 4,240 |
| ||
Construction in progress |
| 2,530 |
| 3,845 |
| ||
|
| 22,875 |
| 21,736 |
| ||
Less: accumulated depreciation |
| (8,588 | ) | (7,583 | ) | ||
Net |
| $ | 14,287 |
| $ | 14,153 |
|
Construction in progress at December 31, 2006 includes investments in several properties in New Jersey that the Company intends to develop into future branches. In 2006, the Company entered into an agreement to sell one of its building and certain equipment, which have a net book value of $736,000 at December 31, 2006. The Company expects to consummate this transaction in May 2007.
The Company leases office locations in Exton, Pennsylvania and Media, Pennsylvania and a small amount of office equipment under operating leases. The following rental expenses were included in the Company’s financial statements (in thousands):
| 2006 |
| 2005 |
| 2004 |
| ||||
Office rent |
| $ | 96 |
| $ | — |
| $ | — |
|
Equipment lease |
| 12 |
| — |
| — |
| |||
|
| $ | 108 |
| $ | — |
| $ | — |
|
The following table shows the minimum future rental payments under non-cancelable leases for property and equipment (in thousands):
2007 |
| $ | 120 |
|
2008 |
| 33 |
| |
2009 |
| 5 |
| |
2010 |
| — |
| |
2011 |
| — |
| |
F-20
NOTE 7 - DEPOSITS
Deposits and their respective weighted average interest rate at December 31, 2006 and 2005 consist of the following (dollars in thousands):
| December 31, |
| |||||||||
|
| 2006 |
| 2005 |
| ||||||
|
| Weighted |
| Amount |
| Weighted |
| Amount |
| ||
|
|
|
|
|
|
|
|
|
| ||
Non-interest bearing demand accounts |
| — | % | $ | 41,429 |
| — | % | $ | 37,876 |
|
NOW accounts |
| 1.80 |
| 50,717 |
| 1.64 |
| 87,072 |
| ||
Money market accounts |
| 3.92 |
| 29,770 |
| 0.90 |
| 27,975 |
| ||
Savings and club accounts |
| 0.74 |
| 64,338 |
| 0.72 |
| 80,098 |
| ||
Certificates of deposit |
| 4.43 |
| 410,280 |
| 3.67 |
| 449,286 |
| ||
|
| 3.47 | % | $ | 596,534 |
| 2.75 | % | $ | 682,307 |
|
The scheduled maturities of certificates of deposit for periods subsequent to December 31, 2006 and December 31, 2005 are as follows (in thousands):
| December 31, |
| ||
|
| 2006 |
| |
|
|
|
| |
2007 |
| $ | 223,735 |
|
2008 |
| 67,076 |
| |
2009 |
| 63,947 |
| |
2010 |
| 19,524 |
| |
2011 |
| 20,929 |
| |
Thereafter |
| 15,069 |
| |
|
|
|
| |
|
| $ | 410,280 |
|
A summary of interest expense on deposits for the years ended December 31, 2006, 2005 and 2004 is as follows (in thousands):
| 2006 |
| 2005 |
| 2004 |
| ||||
NOW accounts |
| $ | 1,104 |
| $ | 1,826 |
| $ | 316 |
|
Money market accounts |
| 579 |
| 265 |
| 1,743 |
| |||
Savings and club accounts |
| 557 |
| 748 |
| 904 |
| |||
Certificates of deposit |
| 16,734 |
| 16,373 |
| 15,241 |
| |||
|
| $ | 18,974 |
| $ | 19,212 |
| $ | 18,204 |
|
F-21
The aggregate amount of certificates of deposit with a minimum denomination of $100,000 was $73,945,000 and $69,349,000 at December 31, 2006 and 2005, respectively. Deposits in excess of $100,000 are not insured by the Federal Deposit Insurance Corporation.
NOTE 8 — FEDERAL HOME LOAN BANK ADVANCES
Pursuant to collateral agreements with the FHLB, advances are secured by qualifying first mortgage loans, qualifying fixed-income securities, FHLB stock and an interest-bearing demand deposit account with the FHLB. As of December 31, 2006, the Bank has $34,500,000 in qualifying collateral pledged against its advances.
Maturity Date |
| Interest Rate |
| Strike Rate |
| Amount |
| |
|
|
|
|
|
| (in thousands) |
| |
August 2011 |
| 4.89 | % | 7.50 | % | $ | 20,000 |
|
August 2011 |
| 4.87 | % | 7.50 | % | 10,000 |
| |
|
|
|
|
|
| $ | 30,000 |
|
If the Comparative Rate Index (three-month LIBOR) is greater than or equal to the Strike Rate 15 calendar days prior to the 1st Possible Conversion Date or any subsequent Possible Conversion Date, the FHLB will notify the Bank 10 calendar days prior to conversion to an adjustable-rate Advance equal to three-month LIBOR (5.36% at December 31, 2006) plus .2175% on a quarterly basis. The Bank has the option to repay these advances at each of the option dates without penalty. Accordingly, the contractual maturities above may differ from actual maturities.
The Bank has a maximum borrowing capacity with the Federal Home Loan Bank of approximately $460.4 million at September 30, 2006, the latest date available.
NOTE 9 — EMPLOYEE BENEFITS
Defined Benefit Plan
The Bank has a qualified non-contributory defined benefit retirement plan covering substantially all employees meeting certain eligibility requirements. The assets of the Bank’s defined benefit plan are held by a trustee and invested in mutual funds and cash equivalents. For the years ended December 31, 2006 and 2005, the composition of the funds was 33.0% and 96.1%, respectively in mutual funds and 67.0% and 3.9%, respectively in cash. Certain cash equivalents are held in deposit accounts at the Bank. The investment strategy of the Plan is to maintain an adequate return while meeting the liquidity needs of the Plan. The benefits are based on each employee’s years of service and the average of the highest three or five consecutive annual salaries. An employee becomes fully vested upon completion of five years of qualifying service. It has been the Bank’s policy to fund the maximum amount that can be deducted for federal income tax purposes each year. The Bank amended the plan and froze the benefits for current participants in the plan as of January 1, 2006. As a result of this amendment, the Bank recognized a curtailment loss of $375,000 effective December 31, 2005, which was included in salaries, benefits and other compensation on the Consolidated Statements of Operations for the year ended December 31, 2005. In October 2006, the Bank resolved to settle the obligations to the plan participants in 2007 by terminating the plan, after obtaining required approvals. As of December 31, 2006, the Bank has accrued liabilities sufficient to settle the estimated unfunded obligation.
F-22
Effective December 31, 2006, the Bank adopted SFAS Statement No. 158, “Employers’ Accounting for Defined Benefit Pensions and Other Post Retirement Plans.” See Note 1 for the incremental effects of the initial adoption of SFAS Statement No. 158 on our statement of condition at December 31, 2006.
The following tables provide a roll forward of the changes in benefit obligations and plan assets for the most recent two years:
| 2006 |
| 2005 |
| |||
Change in benefit obligation: |
| (In Thousands) |
| ||||
|
|
|
|
|
| ||
Net benefit obligation at beginning of year |
| $ | 2,195 |
| $ | 2,187 |
|
Service cost |
| — |
| 300 |
| ||
Interest cost |
| 121 |
| 131 |
| ||
Plan amendment |
| — |
| (297 | ) | ||
Actuarial loss |
| 197 |
| 91 |
| ||
Benefits paid |
| (124 | ) | (217 | ) | ||
Net benefit obligation at end of year |
| $ | 2,389 |
| $ | 2,195 |
|
| 2006 |
| 2005 |
| |||
Change in plan assets: |
| (In Thousands) |
| ||||
|
|
|
|
|
| ||
Fair value of plan assets at beginning of year |
| $ | 1,934 |
| $ | 1,764 |
|
Actual return on plan assets |
| 204 |
| 110 |
| ||
Employer contributions |
| 288 |
| 277 |
| ||
Benefits paid |
| (124 | ) | (217 | ) | ||
Fair value of plan assets at end of year |
| $ | 2,302 |
| $ | 1,934 |
|
The fair value of plan assets included deposits held at the Bank of $395,000 and $386,000 at December 31, 2006 and 2005, respectively.
The following table provides a reconciliation of benefit obligations, plan assets and funded status of the plans:
| 2006 |
| 2005 |
| |||
|
| (In Thousands) |
| ||||
Fair value of plan assets end of year |
| $ | 2,302 |
| $ | 1,934 |
|
Net benefit obligation at end of year |
| 2,389 |
| 2,195 |
| ||
|
|
|
|
|
| ||
Funded Status (plan assets less plan obligations) |
| $ | (87 | ) | $ | (261 | ) |
Net amount recognized in the statement of condition |
| $ | (87 | ) | $ | (261 | ) |
Amounts recognized in stockholders’ equity |
|
|
|
|
| ||
Net actuarial loss |
| $ | (148 | ) | — |
| |
Deferred tax asset |
| 50 |
| — |
| ||
Amount recognized in accumulated other comprehensive loss |
| $ | (98 | ) | — |
| |
F-23
The following is a summary of significant actuarial assumptions (weighted average basis) at December 31, 2006, 2005 and 2004:
| 2006 |
| 2005 |
| 2004 |
| |
Discount rate |
| 5.00 | % | 5.50 | % | 6.00 | % |
Expected long-term rate of return on plan assets |
| 5.25 |
| 8.00 |
| 8.00 |
|
Rate of compensation increase |
| — |
| 5.00 |
| 5.00 |
|
The Bank determined the long-term rate of return on plan assets based on current and expected asset allocations as well as historical returns and current market conditions. The discount rate assumptions were based on the short-term plan cash outflows expected to occur when the plan terminates in 2007.
The following table sets forth the components of the defined benefit plan costs for the years presented:
| 2006 |
| 2005 |
| 2004 |
| ||||
|
| (In Thousands) |
| |||||||
Service cost |
| $ | — |
| $ | 300 |
| $ | 295 |
|
Interest cost |
| 121 |
| 131 |
| 137 |
| |||
Return on plan assets |
| (204 | ) | (110 | ) | (198 | ) | |||
Amortization of unrecognized net actuarial gain |
| 49 |
| 3 |
| 119 |
| |||
Curtailment loss |
| — |
| 375 |
| — |
| |||
Net periodic benefit costs (income) reported in salaries, benefits and other compensation expense |
| $ | (34 | ) | $ | 699 |
| $ | 353 |
|
401(k) Plan
The Bank also has a 401(k) retirement plan covering substantially all employees meeting certain eligibility requirements. Employees may contribute an elective deferral percentage of their salary to the Plan each year, subject to limitations which are set by law. The Bank matches a portion of the employees’ contribution and also may make discretionary contributions, based on the Bank’s performance. The Bank provides a matching contribution equivalent of 33% of the first 6% of the contribution made by an employee. The Bank’s matching contribution rate changed as of January 1, 2006 from 25% to 33%. The Bank’s contributions to the plan on behalf of its employees resulted in an expenditure of $94,000, $27,000 and $23,000 for the years ended December 31, 2006, 2005 and 2004, respectively.
Employee Stock Ownership Plan
The ESOP is a tax-qualified plan designed to invest primarily in the Company’s common stock that provides employees meeting certain eligibility requirements with the opportunity to receive a funded retirement benefit, based primarily on the value of the Company’s common stock. The ESOP purchased 575,446 shares of the Company’s common stock at a price of $10.00 per share with the proceeds of a loan from the Company to the ESOP. The outstanding loan principal balance at December 31, 2006 was $5,232,000. Shares of the Company’s common stock pledged as collateral for the loan are released from the pledge for allocation to Plan participants as loan payments are made. The Bank releases shares
F-24
annually based upon the ratio that the current principal and interest payment bears to the current and remaining scheduled future principal and interest payments. Dividends declared on common stock held by the ESOP and not allocated to the account of a participant can be used to repay the loan.
At December 31, 2006, shares allocated and committed to be released were 38,363. ESOP shares that were unallocated totaled 537,083 and had a fair market value of $7,251,000. ESOP compensation expense for the year ended December 31, 2006 was $512,000 representing the fair market value of shares allocated or committed to be released during the year.
Long-Term Incentive Plan
The Bank maintains the Fox Chase Bank Executive Long-Term Incentive Plan to retain and attract key officers who contribute to the financial and business success of the Bank. On an annual basis, the Board of Directors considers granting a long—term incentive award for the Chief Executive Officer of the Bank and the Chief Executive Officer recommends the incentive award amounts for each eligible employee. Substantially all of the awards vest over a five-year period with 60% of the award vesting on the third anniversary of the plan year to which the award was granted, 80% on the fourth anniversary and 100% on the fifth anniversary, unless otherwise determined by the Board of Directors on date of grant. All plan assets are invested in Company common stock. The Incentive Plan became effective January 1, 2006. During 2006, the Bank recorded compensation expenses of $144,000 for the Incentive Plan. Remaining unvested compensation, which is invested in Company common stock, is $471,000 at December 31, 2006. Such amounts will be ratably recognized as compensation expense over the remaining vesting periods.
NOTE 10 — INCOME TAXES
The components of income tax expense (benefit) for the years ended December 31, 2006, 2005 and 2004 are as follows (in thousands):
| December 31, |
| ||||||||
|
| 2006 |
| 2005 |
| 2004 |
| |||
Federal: |
|
|
|
|
|
|
| |||
Current |
| $ | (313 | ) | $ | 950 |
| $ | 2,420 |
|
Deferred |
| 997 |
| 2,025 |
| (4,020 | ) | |||
|
|
|
|
|
|
|
| |||
|
| 684 |
| 2,975 |
| (1,600 | ) | |||
|
|
|
|
|
|
|
| |||
State, current |
| — |
| — |
| 5 |
| |||
|
|
|
|
|
|
|
| |||
|
| $ | 684 |
| $ | 2,975 |
| $ | (1,595 | ) |
F-25
The provision (benefit) for income taxes differs from the statutory rate of 34% due to the following (in thousands):
| December 31, |
| ||||||||
|
| 2006 |
| 2005 |
| 2004 |
| |||
|
|
|
|
|
|
|
| |||
Federal income tax at statutory rate of 34% |
| $ | 1,468 |
| $ | 3,038 |
| $ | (1,184 | ) |
Tax exempt interest, net |
| (272 | ) | (222 | ) | (206 | ) | |||
Bank-owned life insurance |
| (145 | ) | (152 | ) | (152 | ) | |||
ESOP compensation expense |
| 44 |
| — |
| — |
| |||
Other, net |
| (99 | ) | (1 | ) | (53 | ) | |||
Increase (decrease) in valuation allowance |
| (312 | ) | 312 |
| — |
| |||
|
|
|
|
|
|
|
| |||
Total provision (benefit) |
| $ | 684 |
| $ | 2,975 |
| $ | (1,595 | ) |
|
|
|
|
|
|
|
| |||
Effective tax rate |
| 15.84 | % | 33.30 | % | 45.79 | % | |||
The net deferred tax asset consisted of the following components as of December 31, 2006 and 2005 (in thousands):
|
| December 31, |
| ||||
|
| 2006 |
| 2005 |
| ||
Deferred tax assets: |
|
|
|
|
| ||
Allowance for loan losses |
| $ | 1,003 |
| $ | 2,839 |
|
Loan origination fees |
| 88 |
| 87 |
| ||
Nonaccrual interest |
| 7 |
| 68 |
| ||
Unrealized losses on securities available-for-sale |
| 482 |
| 1,259 |
| ||
Unrealized loss from impaired securities |
| — |
| 134 |
| ||
Accrued compensation |
| 81 |
| — |
| ||
Organizational costs |
| 3 |
| — |
| ||
Unfunded pension obligation — SFAS No. 158 |
| 50 |
| — |
| ||
Charitable contribution carryover |
| 535 |
| — |
| ||
Capital loss carryover |
| 318 |
| 178 |
| ||
|
|
|
|
|
| ||
|
| 2,567 |
| 4,565 |
| ||
|
|
|
|
|
| ||
Valuation allowance |
| — |
| (312 | ) | ||
|
| 2,567 |
| 4,253 |
| ||
Deferred tax liabilities: |
|
|
|
|
| ||
Prepaid expense deduction |
| 197 |
| 98 |
| ||
Mortgage servicing rights |
| 400 |
| 397 |
| ||
Loan origination costs |
| 148 |
| 148 |
| ||
Depreciation of premises and equipment |
| 735 |
| 799 |
| ||
|
|
|
|
|
| ||
|
| 1,480 |
| 1,442 |
| ||
|
|
|
|
|
| ||
Net Deferred Tax Asset |
| $ | 1,087 |
| $ | 2,811 |
|
F-26
Based on the Company’s history of prior earnings and its expectation of future taxable income, management anticipates that it is more likely than not that the above net deferred tax assets will be realized.
Retained earnings include $5,986,000 at December 31, 2006, 2005 and 2004, for which no provision for federal income tax has been made. This amount represents deductions for bad debt reserves for tax purposes, which were only allowed to savings institutions that met certain definitional tests prescribed by the Internal Revenue Code of 1986, as amended. The Small Business Job Protection Act of 1996 eliminated the special bad debt deduction granted solely to thrifts. Under the terms of the Act, there would be no recapture of the pre-1988 (base year) reserves. However, these pre-1988 reserves would be subject to recapture under the rules of the Internal Revenue Code if the Company pays a cash dividend in excess of earnings and profits, or liquidates. The Act also provides for the recapture of deductions arising from “applicable excess reserve” defined as the total amount of reserve over the base year reserve. The Company’s total reserve exceeds the base year reserve and deferred taxes have been provided for this excess.
As of December 31, 2006 and 2005, the Company has approximately $935,000 and $524,000 of capital loss carryforwards for Federal income tax purposes, respectively, as well as unrealized losses on certain capital asset securities of $0 and $394,000, resulting in a deferred tax asset of $318,000 and $312,000, respectively. The Company had established a valuation allowance for the $312,000 at December 31, 2005. The Bank entered into an agreement to sell one of its office facilities in the fourth quarter of 2006 that is projected to result in sufficient capital gain income to utilize such capital loss carryforwards. As a result of the expected sale, the Company fully reversed the valuation allowance in 2006.
Capital losses can be carried back three years and forward five years before they expire. The Company’s unused capital losses will expire after December 31, 2010, if not utilized. In addition, the Company has a charitable contribution carryover of $1,572,000 as of December 31, 2006. Such carryover will expire on December 31, 2011, if not utilized.
NOTE 11 — COMMITMENTS AND CONTINGENCIES
Lending Operations
The Company is a party to financial instruments with off-balance sheet risk in the normal course of business to meet the financing needs of its customers. These financial instruments include commitments to extend credit. Those instruments involve, to varying degrees, elements of credit risk in excess of the amount recognized in the balance sheets.
The Company’s exposure to credit loss in the event of nonperformance by the other party to the financial instrument for commitments to extend credit is represented by the contractual amount of those instruments. The Company uses the same credit policies in making commitments and conditional obligations as it does for on-balance sheet instruments.
F-27
A summary of the Company’s financial instrument commitments at December 31, 2006 and 2005 is as follows (in thousands):
| December 31, |
| |||||
|
| 2006 |
| 2005 |
| ||
|
|
|
|
|
| ||
Commitments to grant loans |
| $ | 40,134 |
| $ | 2,245 |
|
Unfunded commitments under lines of credit |
| 29,232 |
| 24,826 |
| ||
Standby letters of credit |
| 112 |
| — |
| ||
|
|
|
|
|
| ||
|
| $ | 69,478 |
| $ | 27,071 |
|
Commitments to extend credit are agreements to lend to a customer as long as there is no violation of any condition established in the contract. Since many of the commitments are expected to expire without being drawn upon, the total commitment amounts do not necessarily represent future cash requirements. Commitments generally have fixed expiration dates or other termination clauses and may require payment of a fee. The Company evaluates each customer’s credit worthiness on a case-by-case basis. The amount of collateral obtained, if deemed necessary by the Company upon extension of credit, is based on management’s credit evaluation. Collateral held varies, but includes principally residential or commercial real estate. Fixed rate commitments to grant loans were $4,346,000 and $2,245,000 as of December 31, 2006 and December 31, 2005, respectively. The interest rates on these fixed rate loans ranged from 5.875% to 7.85% as of December 31, 2006 and 5.375% to 6.25% as of December 31, 2005. In addition, at December 31, 2006 the Company had undisbursed loans in process of $10,348,000.
Legal Proceedings
The Company is commonly subject to various pending and threatened legal actions which involve claims for monetary relief. Based upon information presently available to the Company, it is the Company’s opinion that any legal and financial responsibility arising from such claims will not have a material adverse effect on the Company’s results of operations.
On April 28, 2006, Gregory S. Cipa, the former President and Chief Executive Officer of Fox Chase Bank, filed a complaint against Fox Chase Bank in the Civil Division of the Court of Common Pleas of Bucks County, Pennsylvania. In May 2006, Fox Chase Bank moved the case to federal court, answered the complaint and filed a counterclaim. In November 2006, Mr. Cipa amended his complaint, and now alleges Fox Chase Bank breached its contract with him and violated its state statutory obligations by failing to pay Mr. Cipa certain employment benefits which he claims to have earned while serving as the President and Chief Executive Officer of Fox Chase Bank. Mr. Cipa seeks monetary damages in excess of $900,000 and the payment of litigation costs. The parties completed discovery and filed motions for summary judgment that have not yet been ruled upon. Fox Chase Bank believes this action is without merit and intends to vigorously pursue its defenses.
F-28
Data Processing
The Company has entered into contracts with third-party providers to manage the Company’s network operations, data processing and other related services. The projected amount of the Company’s future minimum payments contractually due after December 31, 2006 is as follows (in thousands):
2007 |
| $ | 1,742 |
|
2008 |
| 1,711 |
| |
2009 |
| 1,527 |
| |
2010 |
| 3 |
| |
2011 |
| — |
| |
NOTE 12 - REGULATORY CAPITAL
The Bank is subject to various regulatory capital requirements administered by federal banking agencies. Failure to meet minimum capital requirements can initiate certain mandatory and possibly additional discretionary actions by regulators that, if undertaken, could have a direct material effect on the Bank’s consolidated financial statements. Under capital adequacy guidelines and the regulatory framework for prompt corrective action, the Bank must meet specific capital guidelines that involve quantitative measures of the Bank’s assets, liabilities and certain off-balance sheet items as calculated under regulatory accounting practices. The Bank’s capital amounts and classification are also subject to qualitative judgments by the regulators about components, risk weightings and other factors.
Quantitative measures established by regulation to ensure capital adequacy require the Bank to maintain minimum amounts and ratios (set forth below) of total and Tier 1 capital (as defined in the regulations) to risk-weighted assets, and of Tier 1 capital to total assets, as defined. Management believes, as of December 31, 2006, that the Bank meets all capital adequacy requirements to which it was subject.
F-29
As of December 31, 2006, the Bank is categorized as well capitalized under the regulatory framework for prompt corrective action. There are no conditions or events since that notification that management believes have changed the Bank’s category.
The Bank’s actual capital amounts and ratios at December 31, 2006 and 2005 and the minimum amounts and ratios required for capital adequacy purposes and to be well capitalized under the prompt corrective action provisions are as follows:
|
| Actual |
| For Capital Adequacy |
| To be Well Capitalized |
| |||||||||
|
| Amount |
| Ratio |
| Amount |
| Ratio |
| Amount |
| Ratio |
| |||
|
| (Dollars in Thousands) |
| |||||||||||||
December 31, 2006 |
|
|
|
|
|
|
|
|
|
|
|
|
| |||
Total risk-based capital (to risk- weighted assets) |
| $ | 97,701 |
| 27.62 | % | $ | ³28,297 |
| ³8.0 | % | $ | ³35,371 |
| ³10.0 | % |
Tier 1 capital (to risk-weighted assets) |
| 94,751 |
| 26.79 |
| ³14,148 |
| ³4.0 |
| ³21,222 |
| ³ 6.0 |
| |||
Tier 1 capital (to adjusted assets) |
| 94,751 |
| 12.49 |
| ³30,343 |
| ³4.0 |
| ³37,929 |
| ³ 5.0 |
| |||
|
|
|
|
|
|
|
|
|
|
|
|
|
| |||
December 31, 2005: |
|
|
|
|
|
|
|
|
|
|
|
|
| |||
Total risk-based capital (to risk- weighted assets) |
| $ | 70,595 |
| 19.02 | % | $ | ³29,688 |
| ³8.0 | % | $ | ³37,109 |
| ³10.0 | % |
Tier 1 capital (to risk-weighted assets) |
| 65,911 |
| 17.76 |
| ³14,844 |
| ³4.0 |
| ³22,266 |
| ³ 6.0 |
| |||
Tier 1 capital (to adjusted assets) |
| 65,911 |
| 8.40 |
| ³31,382 |
| ³4.0 |
| ³39,228 |
| ³ 5.0 |
| |||
The Company’s ability to pay dividends is limited by statutory and regulatory requirements. The Company may not declare nor pay dividends on its stock if such declaration and payment would violate statutory or regulatory requirements.
During 2005, the Bank’s primary regulator the Office of Thrift Supervision (the “OTS”) issued a Cease and Desist Order (the “Order”) instructing the Bank to discontinue the origination of certain types of loans until further notice, among other restrictions. On June 28, 2006, the OTS terminated the Order, and also noted that the Bank is no longer deemed to be in a “troubled condition.”
NOTE 13 - - FAIR VALUE OF FINANCIAL INSTRUMENTS
Management uses its best judgment in estimating the fair value of the Company’s financial instruments; however, there are inherent weaknesses in any estimation technique. Therefore, for substantially all financial instruments, the fair value estimates herein are not necessarily indicative of the amounts the Company could have realized in a sales transaction on the dates indicated. The estimated fair value amounts have been measured as of their respective year ends, and have not been reevaluated or updated for purposes of these consolidated financial statements subsequent to those respective dates. As such, the estimated fair values of these financial instruments subsequent to the respective reporting dates may be different than the amounts reported at each year-end.
F-30
The following information should not be interpreted as an estimate of the fair value of the entire Company since a fair value calculation is only provided for a limited portion of the Company’s assets and liabilities. Due to a wide range of valuation techniques and the degree of subjectivity used in making the estimates, comparisons between the Company’s disclosures and those of other companies may not be meaningful. The following methods and assumptions were used to estimate the fair values of the Company’s financial instruments at December 31, 2006 and 2005:
Cash and Cash Equivalents
The carrying amounts of cash and cash equivalents approximate their fair value.
Interest Earning Time Deposits in Other Banks
The carrying amount of interest bearing time deposits in other banks maturing within ninety days approximates their fair values. Fair values of other interest bearing time deposits are estimated using discounted cash flow analyses based on current rates for similar types of time deposits.
Securities — Available-for-Sale
Fair values for investments securities and mortgage-related securities available-for-sale are based on quoted market prices, where available. If quoted market prices are not available, fair values are based on quoted market prices of comparable securities.
Loans Held for Sale
The fair values of mortgage loans originated and intended for sale in the secondary market are based on current quoted market prices.
Loans Receivable
For variable-rate loans that reprice frequently and that entail no significant changes in credit risk, fair values are based on carrying values. The fair value of fixed rate and other loans are estimated using discounted cash flow analyses at interest rates currently offered for loans with similar terms to borrowers of similar credit quality.
Federal Home Loan Bank Stock
The fair value of the Federal Home Loan Bank stock is the carrying amount.
Mortgage Servicing Rights
The fair value of mortgage servicing rights is based on third party estimates of value when available or the present value of expected future cash flows when not available.
Accrued Interest and Dividends Receivable and Accrued Interest Payable
The carrying amount of accrued interest and dividends receivable and accrued interest payable approximates fair value.
Deposit Liabilities
Fair values for demand deposits (including NOW accounts), savings and club accounts and money market deposits are, by definition, equal to the amount payable on demand at the reporting date. Fair values of
F-31
fixed-maturity certificates of deposit are estimated using a discounted cash flow calculation that applies interest rates currently being offered on similar instruments with similar maturities.
Federal Home Loan Bank Advances
Fair value of Federal Home Loan Bank advances is estimated using discounted cash flow analyses, based on rates currently available to the Bank for advances with similar terms and remaining maturities.
Off-Balance Sheet Financial Instruments
Fair value of commitments to extend credit are estimated using the fees currently charged to enter into similar agreements, taking into account market interest rates, the remaining terms and present credit worthiness of the counterparties.
The estimated fair values of the Company’s financial instruments at December 31, 2006 and 2005 were as follows (in thousands):
|
| December 31 |
| ||||||||||
|
| 2006 |
| 2005 |
| ||||||||
|
| Carrying |
| Estimated |
| Carrying |
| Estimated |
| ||||
|
|
|
|
|
|
|
|
|
| ||||
Financial assets: |
|
|
|
|
|
|
|
|
| ||||
Cash and cash equivalents |
| $ | 134,441 |
| $ | 134,441 |
| $ | 46,086 |
| $ | 46,086 |
|
Interest earning time deposits |
| — |
| — |
| 600 |
| 600 |
| ||||
Investment securities available-for- sale |
| 70,112 |
| 70,112 |
| 141,783 |
| 141,783 |
| ||||
Mortgage related securities |
| 158,320 |
| 158,320 |
| 187,721 |
| 187,721 |
| ||||
Loans receivable, net |
| 355,617 |
| 350,430 |
| 366,393 |
| 360,337 |
| ||||
Loans held for sale |
| 1,194 |
| 1,194 |
| 357 |
| 357 |
| ||||
Mortgage servicing rights |
| 1,177 |
| 1,623 |
| 1,168 |
| 1, 291 |
| ||||
Federal Home Loan Bank stock |
| 4,422 |
| 4,422 |
| 4,146 |
| 4,146 |
| ||||
Accrued interest and dividends receivable |
| 3,397 |
| 3,397 |
| 3,301 |
| 3,301 |
| ||||
|
|
|
|
|
|
|
|
|
| ||||
Financial liabilities: |
|
|
|
|
|
|
|
|
| ||||
Savings and club accounts |
| 64,338 |
| 64,338 |
| 80,098 |
| 80,098 |
| ||||
Demand, NOW and money market deposits |
| 121,916 |
| 121,916 |
| 152,923 |
| 152,923 |
| ||||
Certificates of deposit |
| 410,280 |
| 410,942 |
| 449,286 |
| 444,208 |
| ||||
Federal Home Loan Bank advances |
| 30,000 |
| 29,933 |
| 30,000 |
| 30,321 |
| ||||
Accrued interest payable |
| 298 |
| 298 |
| 268 |
| 268 |
| ||||
|
|
|
|
|
|
|
|
|
| ||||
Off-balance sheet instruments |
| — |
| 521 |
| — |
| 203 |
| ||||
F-32
NOTE 14 - COMPREHENSIVE INCOME (LOSS)
Comprehensive income (loss) for the years ended December 31, 2006, 2005 and 2004 is as follows (in thousands):
| Years Ended December 31, |
| ||||||||
|
| 2006 |
| 2005 |
| 2004 |
| |||
|
|
|
|
|
|
|
| |||
Net income (loss) |
| $ | 3,634 |
| $ | 5,960 |
| $ | (1,888 | ) |
|
|
|
|
|
|
|
| |||
Other comprehensive income (loss): |
|
|
|
|
|
|
| |||
Unrealized holding gains (losses) arising during the period, net of taxes (2006 —$777, 2005- $(1,114), 2004 — $(587)) |
| 1,447 |
| (2,163 | ) | (1,140 | ) | |||
|
|
|
|
|
|
|
| |||
Reclassification adjustment for gains (losses) included in net income (loss), net of taxes (2006 - $0, 2005 - $(275), 2004 - $56) |
| — |
| (534 | ) | 113 |
| |||
|
|
|
|
|
|
|
| |||
Other comprehensive income (loss) |
| 1,447 |
| (1,629 | ) | (1,253 | ) | |||
|
|
|
|
|
|
|
| |||
Comprehensive income (loss) |
| $ | 5,081 |
| $ | 4,331 |
| $ | (3,141 | ) |
NOTE 15 — RELATED PARTY TRANSACTIONS
The Company may from time to time enter into transactions with its directors, officers and employees. Such transactions are made in the ordinary course of business on substantially the same terms and conditions, including interest rates and collateral, as those prevailing at the same time for comparable transactions with other customers, and do not, in the opinion of management, involve more than the normal credit risk or present other unfavorable features.
An analysis of the activity of loans to directors and executive officers as of December 31, 2006 and 2005 is as follows (in thousands):
| December 31, |
| |||||
|
| 2006 |
| 2005 |
| ||
|
|
|
|
|
| ||
Beginning balance |
| $ | 5,277 |
| $ | 6,475 |
|
New loans and line of credit advances |
| — |
| — |
| ||
Repayments |
| — |
| (587 | ) | ||
Change in directors and executive officers |
| (5,277 | ) | (611 | ) | ||
|
|
|
|
|
| ||
Ending balance |
| $ | — |
| $ | 5,277 |
|
As of December 31, 2006, the Company had $569,000 in outstanding deposits with related parties, none of which were overdrawn throughout the year.
F-33
NOTE 16 - IMPACT OF RECENT ACCOUNTING PRONOUNCEMENTS
On December 16, 2004, the Financial Accounting Standards Board (“FASB”) issued SFAS No. 123R, “Share-Based Payment,” which replaces SFAS No. 123, “Accounting for Stock-Based Compensation” and supersedes APB Opinion No. 25, “Accounting for Stock Issued to Employees.” This statement will require that all share-based payments to employees, including grants of employee stock options, be recognized as compensation costs in the financial statements based on their fair values. The effective date of this statement for the Company was January 1, 2006. We adopted this standard as required, in accounting for the Long-Term Incentive Plan discussed in Note 9, which includes unvested shares.
In December 2004, the FASB issued SFAS No. 153, “Exchanges of Non-Monetary Assets, an amendment of APB Opinion No. 29,” which eliminates the exception from fair value measurement for non-monetary exchanges of similar productive assets and replaces it with a general exception for exchanges of non-monetary assets that do not have commercial substance. The statement defines a non-monetary exchange with commercial substance as one in which the future cash flows of an entity are expected to change significantly as a result of the exchange. SFAS No. 153 is effective for fiscal years beginning after June 15, 2005. The Company adopted this statement and there was no effect on its results of operations or financial position.
In May 2005, the FASB issued SFAS No. 154, “Accounting Changes and Error Corrections,” which establishes, unless impracticable, retrospective application as the required method for reporting a change in accounting principle in the absence of explicit transition requirements specific to the newly adopted accounting principle. The statement provides guidance for determining whether retrospective application of a change in accounting principle is impracticable. The statement also addresses the reporting of a correction of an error by restating previously issued financial statements. SFAS No. 154 is effective for accounting changes and corrections of errors made in fiscal years beginning after December 15, 2005. The Company adopted this statement and there was no effect on its results of operations or financial position.
In March 2006, the FASB issued SFAS No. 156, “Accounting for Servicing of Financial Assets, an amendment of SFAS No. 140.” SFAS No. 156 amends SFAS No. 140 with respect to the accounting for separately recognized servicing assets and servicing liabilities by requiring an entity to recognize a servicing asset or liability each time it undertakes an obligation to service a financial asset by entering into a servicing contract; requires all separately recognized servicing assets and liabilities to be initially measured at fair value, if practical; and permits an entity to choose either of the following methods by which it will subsequently measure each class of separately recognized servicing assets and liabilities:
1. Amortization method - Amortize the servicing assets or liabilities in proportion to and over the period of estimated net servicing income or loss and assess servicing assets and liabilities for impairment or increase obligation based on the fair value at each reporting period.
2. Fair value measurement method - Measure servicing assets or liabilities at fair value at each reporting date and report changes in fair value in earnings in the period in which the change occurs.
SFAS No. 156 is effective for fiscal years beginning after September 15, 2006. Earlier adoption is permitted as of the beginning of an entity’s fiscal year, provided the entity has not yet issued its financial statements, including interim financial statements, for any period of that fiscal year. After analyzing the
F-34
effects of the statement, the Company does not believe that the adoption of this statement will have a material impact on its results of operations or financial position.
In June 2006, FASB issued Financial Interpretation No. 48 (FIN 48), Accounting for Uncertainty in Income Taxes — an interpretation of SFAS Statement No. 109. FIN 48 provides guidance on financial statement recognition and measurement of a tax position taken or expected to be taken in a tax return. According to the Interpretation, a tax position is recognized if it is more likely than not that the tax position will be sustained upon examination, including resolution of any related appeals or litigation processes, based on the technical merits of the position. If the tax position meets more-likely-than-not recognition threshold, the position is measured to determine the amount of benefit to recognize and should be measured at the largest amount of benefit that is greater than 50% likely of being realized upon ultimate settlement. FIN 48 also provides guidance on derecognition, classification, interest and penalties, accounting in interim periods, disclosure and transition. The provisions of FIN 48 are effective for fiscal years beginning after December 15, 2006. The Company does not expect this interpretation to have a material impact on the Company’s financial position and/or results of operations.
In September 2006, the Securities and Exchange Commission (the “SEC’) Staff issued Staff Accounting Bulletin No. 108 (the “SAB”) addressing how the effects of prior-year uncorrected financial statement misstatements should be considered in current-year financial statements. The SAB requires registrants to quantify misstatements using both balance-sheet and income-statement approaches and to evaluate whether either approach results in quantifying an error that is material in light of relative quantitative and qualitative factors. The SAB does not change the SEC staff’s previous guidance in SAB 99 on evaluating the materiality of misstatements.
SAB 108 addresses the mechanics of correcting misstatements that include the effects from prior years. Additionally, SAB 108 requires registrants to apply the new guidance for the first time that it identifies material errors in existence at the beginning of the first fiscal year ending after November 15, 2006 by correcting those errors through a one-time cumulative effect adjustment to beginning-of-year retained earnings. The Company adopted this statement and there was no effect on its results of operations or financial position.
In September 2006, the FASB issued SFAS No. 157, Fair Value Measurement. This statement defines fair value, establishes a framework for measuring fair value in generally accepted accounting principles and expands disclosures about fair value measurements. This statement applies under other accounting pronouncements that require or permit fair value measurements, the Board having previously concluded in those accounting pronouncements that fair value is the relevant measurement attribute. Accordingly, this statement does not require any new fair value measurements.
SFAS No. 157 is effective for fiscal years beginning after November 15, 2007. Earlier adoption is encouraged, provided that the reporting entity has not yet issued financial statements for that fiscal year, including financial statements for an interim period within that fiscal year. The Company is evaluating this statement and has not yet determined the impact on its results of operations or financial position, if any.
In September 2006, the FASB issued SFAS No. 158, “Employers’ Accounting for Defined Benefit Pension and Other Postretirement Plans.” This Statement improves financial reporting by requiring an employer to recognize the overfunded or underfunded status of a defined benefit postretirement plan as an asset or liability in its statement of financial position and to recognize changes in that funded status in the year in which the changes occur through comprehensive income. This Statement also improves the financial reporting by requiring an employer to measure the funded status of a plan as of the date of its
F-35
year-end statement of financial position, with limited exceptions.
The required date of adoption of the recognition and disclosure provisions of this Statement for an employer that is an issuer of publicly traded equity, such as Fox Chase Bancorp, Inc., is as of the end of the fiscal year ended after December 15, 2006. Retrospective application of this Statement is not permitted. The Company adopted this statement in the last quarter of 2006.
The FASB has recently approved the Emerging Issues Task Force (“EITF”) Issue No. 06-4, ��Accounting for Deferred Compensation and Postretirement Benefit Aspects of Endorsement Split-Dollar Life Insurance Arrangements.” In this issue, the EITF concluded that an endorsement split dollar life insurance policy does not effectively settle an employer’s obligation to provide the post retirement benefit that the policy was designed to provide. Therefore, some current expense recognition may need to be made for any endorsement split dollar plans with post retirement benefits.
This guidance applies to all post retirement endorsement split dollar arrangements. This will not impact split dollar plans that only provide pre-retirement death benefits.
The accrual for the liability would be calculated in one of two ways:
· the actuarial present value of the future death benefit or
· the cost of insurance of the policy during the postretirement period.
Compliance with this EITF must be applied to fiscal years beginning after December 15, 2007 (January 1, 2008 for calendar year entities). It can be made through a cumulative—effect adjustment to retained earnings in the year of adoption or as a change in accounting principles through retrospective application to all prior periods. The Company has not determined if this Statement will have a material impact on its consolidated financial statements upon adoption.
In February 2007, the FASB issued SFAS No. 159, “The Fair Value Option for Financial Assets and Financial Liabilities—Including an Amendment of FASB Statement No. 115 (SFAS 159).” SFAS 159 permits entities to choose to measure many financial instruments and certain other items at fair value and amends SFAS 115 to, among other things, require certain disclosures for amounts for which the fair value option is applied. Additionally, this Statement provides that an entity may reclassify held-to-maturity and available-for-sale securities to the trading account when the fair value option is elected for such securities, without calling into question the intent to hold other securities to maturity in the future. This Statement is effective as of the beginning of an entity’s first fiscal year that begins after November 15, 2007. Early adoption is permitted as of the beginning of a fiscal year that begins on or before November 15, 2007, provided the entity also elects to apply the provisions of SFAS 157. The Company has not completed its assessment of SFAS No. 159 and the impact, if any, on its consolidated financial statements.
At its September 2006 meeting, the EITF reached a final consensus on Issue 06-05, “Accounting for Purchases of Life Insurance — Determining the Amount That Could be Realized in Accordance with FASB Technical Bulletin No. 85-4.” Issue 06-05 concludes that in determining the amount that could be realized under an insurance contract accounted for under FASB Technical Bulletin No. 85-4, “Accounting for Purchases of Life Insurance,” the policyholder should (1) consider any additional amounts included in the contractual terms of the policy; and (2) assume the surrender value on a individual-life by individual-life policy basis. Issue 06-05 should be adopted through either (1) a change
F-36
in accounting principle through a cumulative-effect adjustment to retained earnings as of the beginning of the year of adoption or (2) a change in accounting principle through retrospective application to all prior periods. Issue 06-05 is effective for fiscal years beginning after December 15, 2006. The application of Issue 06-05 is not expected to have a material effect on the Company’s financial position or results of operations.
NOTE 17 — SUBSEQUENT EVENTS
In January 2007, the Company entered into a long term operating lease for office space in an office building located in Blue Bell, Pennsylvania. This lease term begins May 1, 2007 and the Company expects certain operational departments to occupy the space.
Minimum annual rental payments due under this lease are as follows (in thousands):
2007 |
| $ | 172 |
|
2008 |
| 421 |
| |
2009 |
| 434 |
| |
2010 |
| 447 |
| |
2011 |
| 460 |
| |
2012 |
| 275 |
| |
F-37
NOTE 18 — PARENT COMPANY ONLY FINANCIAL STATEMENTS
The following condensed financial statements for Fox Chase Bancorp, Inc. (parent company only) reflect the investment in its wholly owned subsidiary, Fox Chase Bank, using the equity method of accounting. Due to the timing of the Bank’s reorganization into the mutual holding company form and the completion of the Company’s initial public offering on September 29, 2006, there are no prior year operations for Fox Chase Bancorp, Inc.
CONDENSED BALANCE SHEET
|
| December 31, |
| |
|
| (in thousands) |
| |
ASSETS |
|
|
| |
Cash and due from banks |
| $ | 32 |
|
Interest-bearing deposits with banks |
| 26,283 |
| |
Total cash and cash equivalents |
| 26,315 |
| |
Investment in subsidiary |
| 34,652 |
| |
Deferred tax asset |
| 510 |
| |
ESOP loan |
| 5,232 |
| |
|
|
|
| |
Total Assets |
| $ | 66,709 |
|
|
|
|
| |
LIABILITIES AND STOCKHOLDERS’ EQUITY |
|
|
| |
Due to subsidiary |
| 152 |
| |
Other liabilities |
| 68 |
| |
Total Liabilities |
| 220 |
| |
|
|
|
| |
Stockholders’ Equity |
| 66,489 |
| |
|
|
|
| |
Total Liability and Stockholders’ Equity |
| $ | 66,709 |
|
F-38
CONDENSED STATEMENT OF OPERATIONS
| For the |
| ||
|
| Year Ended |
| |
|
| December 31, |
| |
|
| 2006 |
| |
|
| (in thousands) |
| |
INCOME |
|
|
| |
Interest on deposits with banks |
| $ | 105 |
|
Interest on ESOP loan |
| 121 |
| |
Total Income |
| 226 |
| |
|
|
|
| |
EXPENSES |
|
|
| |
Contribution to charitable foundation |
| 1,500 |
| |
Other expenses |
| 273 |
| |
Total Expenses |
| 1,773 |
| |
|
|
|
| |
Loss before income tax benefit and equity in undistributed net earnings of subsidiary |
| (1,547 | ) | |
Income tax benefit |
| (529 | ) | |
Loss before equity in undistributed net earnings of subsidiary |
| (1,018 | ) | |
|
|
|
| |
Equity in undistributed net earnings of subsidiary |
| 4,652 |
| |
|
|
|
| |
Net Income |
| $ | 3,634 |
|
F-39
CONDENSED STATEMENT OF CASH FLOWS
CASH FLOWS FROM OPERATING ACTIVITIES |
|
|
| |
Net income |
| $ | 3,634 |
|
Adjustments to reconcile net income to net cash provided by operating activities: |
|
|
| |
Equity in undistributed earnings of subsidiary |
| (4,652 | ) | |
Contribution to charitable foundation |
| 1,349 |
| |
Deferred income taxes |
| (510 | ) | |
Increase in other liabilities |
| 220 |
| |
Net Cash Provided by Operating Activities |
| 41 |
| |
|
|
|
| |
CASH FLOWS FROM INVESTING ACTIVITIES |
|
|
| |
|
|
|
| |
Issuance of ESOP loan |
| (5,755 | ) | |
Loan payment received on ESOP loan |
| 523 |
| |
Capital contribution to subsidiary |
| (30,000 | ) | |
Net Cash Provided in Investing Activities |
| (35,232 | ) | |
|
|
|
| |
CASH FLOWS FROM FINANCING ACTIVITIES |
|
|
| |
|
|
|
| |
Common stock issued in conversion |
| 147 |
| |
Proceeds from stock offering, net |
| 61,359 |
| |
Net Cash Provided by Financing Activities |
| $ | 61,506 |
|
|
|
|
| |
Net Increase in Cash and Cash Equivalents |
| 26,315 |
| |
|
|
|
| |
Cash and Cash Equivalents - Beginning |
| — |
| |
|
|
|
| |
Cash and Cash Equivalents - Ending |
| $ | 26,315 |
|
F-40
NOTE 19 — QUARTERLY FINANCIAL DATA (UNAUDITED)
The following represents summarized quarterly financial data of Fox Chase Bancorp, Inc, which, in the opinion of management, reflects all adjustments (comprising only normal recurring accruals) necessary for a fair presentation.
Three Months Ended |
| 12/31/06 |
| 9/30/06 |
| 6/30/06 |
| 3/31/06 |
| 12/31/05 |
| 9/30/05 |
| 6/30/05 |
| 3/31/05 |
| ||||||||
|
| (in thousands, except per share data) |
| ||||||||||||||||||||||
Interest income |
| $ | 10,181 |
| $ | 9,106 |
| $ | 9,007 |
| $ | 8,883 |
| $ | 8,829 |
| $ | 8,808 |
| $ | 9,775 |
| $ | 10,189 |
|
Interest expense |
| 5,321 |
| 5,228 |
| 5,059 |
| 4,851 |
| 5,069 |
| 5,230 |
| 5,180 |
| 5,218 |
| ||||||||
Net interest income |
| 4,860 |
| 3,878 |
| 3,948 |
| 4,032 |
| 3,760 |
| 3,578 |
| 4,595 |
| 4,971 |
| ||||||||
Credit for loan losses |
| (2,233 | ) | (2,778 | ) | (383 | ) | — |
| (4,000 | ) | (2,000 | ) | (25 | ) | — |
| ||||||||
Net interest income after credit for loan losses |
| 7,093 |
| 6,656 |
| 4,331 |
| 4,032 |
| 7,760 |
| 5,578 |
| 4,620 |
| 4,971 |
| ||||||||
Noninterest income |
| 621 |
| 436 |
| 588 |
| 428 |
| (303 | ) | 445 |
| 628 |
| 444 |
| ||||||||
Noninterest expense |
| 5,289 |
| 5,706 |
| 4,686 |
| 4,186 |
| 4,111 |
| 4,257 |
| 3,052 |
| 3,788 |
| ||||||||
Income before taxes |
| 2,425 |
| 1,386 |
| 233 |
| 274 |
| 3,346 |
| 1,766 |
| 2,196 |
| 1,627 |
| ||||||||
Income tax provision (benefit) |
| 410 |
| 365 |
| (97 | ) | 6 |
| 1,373 |
| 502 |
| 640 |
| 460 |
| ||||||||
Net income |
| $ | 2,015 |
| $ | 1,021 |
| $ | 330 |
| $ | 268 |
| $ | 1,973 |
| $ | 1,264 |
| $ | 1,556 |
| $ | 1,167 |
|
|
|
|
|
|
|
|
|
|
|
|
|
|
|
|
|
|
| ||||||||
Per Common Share Data (1) |
|
|
|
|
|
|
|
|
|
|
|
|
|
|
|
|
| ||||||||
Weighted average common shares — diluted |
| 14,117,509 |
| — |
| — |
| — |
| — |
| — |
| — |
| — |
| ||||||||
Weighted average common shares — basic |
| 14,080,564 |
| — |
| — |
| — |
| — |
| — |
| — |
| — |
| ||||||||
Net income per share — diluted |
| $ | 0.14 |
| — |
| — |
| — |
| — |
| — |
| — |
| — |
| |||||||
Net income per share — basic |
| $ | 0.14 |
| — |
| — |
| — |
| — |
| — |
| — |
| — |
| |||||||
(1)Due to the timing of the Bank’s reorganization into the mutual holding company form and the completion of the Company’s initial public offering on September 29, 2006, earnings per share for the periods shown other than the three months ended December 31, 2006 are not considered meaningful or are not applicable.
F-41
Pursuant to the requirements of Section 13 or 15(d) of the Securities Exchange Act of 1934, the registrant has duly caused this report to be signed on its behalf by the undersigned, thereunto duly authorized.
. |
| FOX CHASE BANCORP, INC | |
|
|
| |
Date: March 28, 2007 |
| By: | /s/ Thomas M. Petro |
|
|
| Thomas M. Petro |
|
|
| President and Chief Executive Officer |
Pursuant to the requirements of the Securities Exchange Act of 1934, this report has been signed below by the following persons on behalf of the registrant and in the capacities and on the dates indicated.
Name |
| Title |
| Date |
|
|
|
|
|
/s/ Thomas M. Petro |
| President, Chief Executive Officer |
| March 28, 2007 |
Thomas M. Petro |
| and Director |
|
|
|
| (principal executive officer) |
|
|
|
|
|
|
|
/s/ Jerry D. Holbrook |
| Chief Financial Officer and |
| March 28, 2007 |
Jerry D. Holbrook |
| Secretary |
|
|
|
| (principal accounting and |
|
|
|
| financial officer) |
|
|
|
|
|
|
|
/s/ Roger H. Ballou |
| Director |
| March 28, 2007 |
Roger H. Ballou |
|
|
|
|
|
|
|
|
|
/s/ Richard E. Bauer |
| Director |
| March 28, 2007 |
Richard E. Bauer |
|
|
|
|
|
|
|
|
|
/s/ Todd S. Benning |
| Director |
| March 28, 2007 |
Todd S. Benning |
|
|
|
|
|
|
|
|
|
/s/ Richard M. Eisenstaedt |
| Director |
| March 28, 2007 |
Richard M. Eisenstaedt |
|
|
|
|
|
|
|
|
|
/s/ Laura M. Mercuri |
| Director |
| March 28, 2007 |
Laura M. Mercuri |
|
|
|
|
|
|
|
|
|
/s/ Anthony A. Nichols, Sr. |
| Director |
| March 28, 2007 |
Anthony A. Nichols, Sr. |
|
|
|
|
|
|
|
|
|
/s/ Peter A. Sears |
| Director |
| March 28, 2007 |
Peter A. Sears |
|
|
|
|