Exhibit 99.1
Table of Contents
Fox Chase Bancorp, Inc.
Hatboro, Pennsylvania
TABLE OF CONTENTS | I | |
INTRODUCTION | 1 | |
1. OVERVIEW AND FINANCIAL ANALYSIS | 4 | |
GENERAL OVERVIEW | 4 | |
HISTORYAND OVERVIEW | 5 | |
STRATEGIC DIRECTION | 6 | |
BALANCE SHEET TRENDS | 7 | |
LOAN PORTFOLIO | 9 | |
INVESTMENTS | 12 | |
INVESTMENTSAND MORTGAGE-BACKED SECURITIES | 13 | |
ASSET QUALITY | 14 | |
FUNDING COMPOSITION | 17 | |
ASSET/LIABILITY MANAGEMENT | 19 | |
NET WORTHAND CAPITAL | 20 | |
PROFITABILITY TRENDS | 21 | |
LEGAL PROCEEDINGS | 27 | |
SUBSIDIARIES | 27 | |
ORDERTO CEASEAND DESIST | 28 | |
2. MARKET AREA ANALYSIS | 30 | |
3. COMPARISONS WITH PUBLICLY TRADED THRIFTS | 33 | |
INTRODUCTION | 33 | |
SELECTION CRITERIA | 33 | |
BASISFOR COMPARISON | 35 | |
OVERVIEWOFTHE COMPARABLES | 35 | |
4. MARKET VALUE DETERMINATION | 38 | |
MARKET VALUE ADJUSTMENTS | 38 | |
FINANCIAL CONDITION | 39 | |
BALANCE SHEET GROWTH | 43 | |
EARNINGS QUALITY, PREDICTABILITYAND GROWTH | 44 | |
MARKETAREA | 49 | |
CASH DIVIDENDS | 52 | |
LIQUIDITYOFTHE ISSUE | 54 | |
RECENT REGULATORY MATTERS | 55 | |
5. OTHER FACTORS | 56 | |
MANAGEMENT | 56 | |
ORDERTO CEASEAND DESIST | 57 | |
SUBSCRIPTION INTEREST | 58 | |
VALUATION ADJUSTMENTS | 60 | |
6. VALUATION | 61 | |
DISCUSSIONOF WEIGHT GIVENTO VALUATION MULTIPLES | 61 | |
FULL OFFERING VALUEIN RELATIONTO COMPARABLES | 63 | |
COMPARISONTO RECENT MHC CONVERSIONS | 66 | |
VALUATION CONCLUSION | 67 | |
List of Figures
Fox Chase Bancorp, Inc.
Hatboro, Pennsylvania
FIGURE 1 – CURRENT FACILITIES LIST | 4 | |
FIGURE 2 - ASSET AND RETAINED EARNINGS CHART | 7 | |
FIGURE 3 - KEY BALANCE SHEET DATA | 8 | |
FIGURE 4 - KEY RATIOS | 8 | |
FIGURE 5 - NET LOANS RECEIVABLE CHART | 9 | |
FIGURE 6 - LOAN MIX AS OF MARCH 31, 2006 | 10 | |
FIGURE 7 - LOAN MIX AT MARCH 31, 2006 | 11 | |
FIGURE 8 - SECURITIES CHART | 12 | |
FIGURE 9 - INVESTMENT MIX | 13 | |
FIGURE 10 - ASSET QUALITY CHART | 14 | |
FIGURE 11 - NONPERFORMING LOANS | 15 | |
FIGURE 12 - ALLOWANCE FOR POSSIBLE LOAN AND LEASE LOSSES CHART | 16 | |
FIGURE 13 - DEPOSIT AND BORROWING TREND CHART | 17 | |
FIGURE 14 - DEPOSIT MIX | 18 | |
FIGURE 15 – INTEREST RATE RISK | 19 | |
FIGURE 16 - CAPITAL ANALYSIS | 20 | |
FIGURE 17 - NET INCOME CHART | 21 | |
FIGURE 18 – CORE NET INCOME CALCULATION | 22 | |
FIGURE 19 - AVERAGE YIELDS AND COSTS | 23 | |
FIGURE 20 - SPREAD AND MARGIN CHART | 24 | |
FIGURE 21 - INCOME STATEMENT TRENDS | 25 | |
FIGURE 22 - PROFITABILITY TREND CHART | 26 | |
FIGURE 23 – DEPOSIT AND DEMOGRAPHIC DATA FOR BUCKS COUNTY | 30 | |
FIGURE 24 – DEPOSIT AND DEMOGRAPHIC DATA FOR MONTGOMERY COUNTY | 31 | |
FIGURE 25 – DEPOSIT AND DEMOGRAPHIC DATA FOR PHILADELPHIA COUNTY | 31 | |
FIGURE 26 – DEPOSIT AND DEMOGRAPHIC DATA FOR CAPE MAY COUNTY | 32 | |
FIGURE 27 – DEPOSIT AND DEMOGRAPHIC DATA FOR ATLANTIC COUNTY | 32 | |
FIGURE 28 - COMPARABLE GROUP | 34 | |
FIGURE 29 - KEY FINANCIAL INDICATORS | 37 | |
FIGURE 30 - KEY BALANCE SHEET DATA | 39 | |
FIGURE 31 - CAPITAL DATA | 40 | |
FIGURE 32 - ASSET QUALITY TABLE | 41 | |
FIGURE 33 - BALANCE SHEET GROWTH DATA | 43 | |
FIGURE 34 - NET INCOME CHART | 45 | |
FIGURE 35 - PROFITABILITY DATA | 46 | |
FIGURE 36 - INCOME STATEMENT DATA | 47 | |
FIGURE 37 – MARKET AREA DATA | 50 | |
FIGURE 38 - DIVIDEND DATA | 52 | |
FIGURE 39 - MARKET CAPITALIZATION DATA | 54 | |
FIGURE 40 - MHC REORGANIZATIONS (SINCE 1/1/03) PRO FORMA DATA | 58 | |
FIGURE 41 - MHC REORGANIZATIONS PRICE APPRECIATION | 59 | |
FIGURE 42 - VALUE RANGE - FULL OFFERING | 63 | |
FIGURE 43 –AS IF FULLY CONVERTED OFFERING PRICING MULTIPLES | 64 | |
FIGURE 44 - COMPARABLEAS IF FULLY CONVERTED PRICING MULTIPLES TO THE BANK’S PRO FORMA MIDPOINT | 64 | |
FIGURE 45 - COMPARABLEAS IF FULLY CONVERTED PRICING MULTIPLES TO THE BANK’S PRO FORMA SUPER MAXIMUM | 64 | |
FIGURE 46 - VALUE RANGE MHC OFFERING DATA | 65 | |
FIGURE 47 - COMPARABLEGAAP PRICING MULTIPLES TO THE BANK’S PRO FORMA MIDPOINT | 65 | |
FIGURE 48 - COMPARABLEGAAP PRICING MULTIPLES TO THE BANK’S PRO FORMA SUPER MAXIMUM | 65 | |
FIGURE 49 – COMPARISON TO FILED AND PENDING MHC OFFERINGS | 66 |
List of Exhibits
Fox Chase Bancorp, Inc.
Hatboro, Pennsylvania
Exhibit | ||
1. | Profile of FinPro, Inc. and the Author of the Appraisal | |
2. | Consolidated Statements of Condition | |
3. | Consolidated Statements of Operations | |
4. | Consolidated Statements of Changes in Retained Equity | |
5. | Consolidated Statements of Cash Flows | |
6. | Reconciliation of the Trailing Twelve Month Net Income | |
7. | Comparable Group Selection Screens | |
8. | Selected Financial Data | |
9. | Industry Fully Converted Pricing Multiples | |
10. | MHC Conversions 2005 to Date | |
11. | Full Offering No Foundation Appraisal Pro Forma March 31, 2006 – 12 Months | |
12. | Full Offering With Foundation Appraisal Pro Forma March 31, 2006 – 12 Months | |
13. | MHC Appraisal Pro Forma March 31, 2006 – 12 Months | |
14. | MHC Stub Period Offering Circular Pro Forma March 31, 2006 – 3 Months | |
15. | MHC Fiscal Year Offering Circular Pro Forma December 31, 2005 – 12 Months | |
| Conversion Valuation Appraisal Report | Page: 1 |
Introduction
Fox Chase Bancorp, Inc. (the “Mid-tier”), is offering for sale shares of its common stock in connection with the reorganization of Fox Chase Bank (the “Bank”) into the mutual holding company form of ownership. The shares being offered represent 43.6% of the shares of common stock of the Mid-tier that will be outstanding following the reorganization. The Mid-tier also intends to contribute 135,000 of the shares of the Mid-tier that will be outstanding following the reorganization, and $150,000 in cash to a charitable foundation established by the Fox Chase Bank. After the stock offering, over 50.0% of the Mid-tier outstanding shares of common stock will be owned by Fox Chase, MHC (the “MHC”), the proposed mutual holding company parent. The Mid-tier is the proposed holding company for the Bank. This report represents FinPro, Inc.’s (“FinPro”) independent appraisal of the estimated pro forma market value of the common stock (the “Common Stock”) of Fox Chase Bancorp, Inc. (hereafter referred to on a consolidated basis as the “Bank”).
In compiling the pro formas, FinPro relied upon the assumptions provided by the Bank and its agents. The pro forma assumptions are as follows:
| • | 43.57% of the total shares will be sold to the depositors and public, |
| • | 135,000 shares will be contributed to a charitable foundation, |
| • | cash equal to $150,000 will be contributed to a charitable foundation, |
| • | the stock will be issued at $10.00 per share, |
| • | the conversion expenses will be $1.9 million at the midpoint, |
| • | there will be an ESOP equal to 3.92% of the total shares outstanding funded internally, amortized over 15 years straight-line, |
| • | there will be an MRP equal to 1.96% of the total shares outstanding, amortized over 5 years straight-line, |
| • | there will be a Stock Option Plan equal to 10% of the total shares outstanding, expensed at $4.20 per option over 5 years straight-line, |
| • | the tax rate is assumed at 34.00%, and |
| • | the net proceeds will be invested at the one-year treasury rate of 4.82%, pre-tax. |
It is our understanding that the Bank will offer its stock in a subscription and community offering to Eligible Account Holders, to the Employee Plans and to Supplemental Eligible Account Holders of the Bank. This appraisal has been prepared in accordance with Regulation 563b.7 and the “Guidelines for Appraisal Reports for the Valuation of Savings and Loan Associations Converting from Mutual to Stock Form of Organization” of the Office of Thrift Supervision (“OTS”) which have been adopted in practice by the Federal Deposit Insurance Corporation (“FDIC”), including the most recent revisions as of October 21, 1994, and applicable regulatory interpretations thereof.
| Conversion Valuation Appraisal Report | Page: 2 |
In the course of preparing our report, we reviewed the Bank’s audited financials for the years ended December 31, 2004 and December 31, 2005 and the unaudited financials for the three months ended March 31, 2006. We also reviewed the registration statement on Form S-1 as filed with the Securities and Exchange Commission (“SEC”). We have conducted due diligence analysis of the Bank and held due diligence related discussions with the Bank’s Management and Board, Sandler O’Neill & Partners L.P. (the Bank’s underwriter), and Muldoon Murphy and Aggugia LLP (the Bank’s special counsel). The valuation parameters set forth in the appraisal were predicated on these discussions but all conclusions related to the valuation were reached and made independent of such discussions.
Where appropriate, we considered information based upon other publicly available sources, which we believe to be reliable; however, we cannot guarantee the accuracy or completeness of such information. We visited the Bank’s primary market area and reviewed the market area’s economic condition. We also reviewed the competitive environment in which the Bank operates and its relative strengths and weaknesses. We compared the Bank’s performance with selected publicly traded thrift institutions. We reviewed conditions in the securities markets in general and in the market for savings institutions in particular. Our analysis included a review of the estimated effects of the Conversion of the Bank on the operations and expected financial performance as they related to the Bank’s estimated pro forma value.
In preparing our valuation, we relied upon and assumed the accuracy and completeness of financial and other information provided to us by the Bank and its independent accountants. We did not independently verify the financial statements and other information provided by the Bank and its independent accountants, nor did we independently value any of the Bank’s assets or liabilities. This estimated valuation considers the Bank only as a going concern and should not be considered as an indication of its liquidation value.
Our valuation is not intended, and must not be construed, to be a recommendation of any kind as the advisability of purchasing shares of Common Stock in the stock issuance. Moreover, because such valuation is necessarily based upon estimates and projections of a number of matters, all of which are subject to change from time to time, no assurance can be given that persons who purchase shares of Common Stock in the stock issuance will thereafter be able to sell such shares at prices related to the foregoing valuation of the pro forma market value thereof. FinPro is not a seller of securities within the meaning of any federal or state securities laws. Any report prepared by FinPro shall not be used as an offer or solicitation with respect to the purchase or sale of any securities.
| Conversion Valuation Appraisal Report | Page: 3 |
The estimated valuation herein will be updated as appropriate. These updates will consider, among other factors, any developments or changes in the Bank’s financial condition, operating performance, management policies and procedures and current conditions in the securities market for thrift institution common stock. Should any such developments or changes, in our opinion, be material to the estimated pro forma market value of the Bank, appropriate adjustments to the estimated pro forma market value will be made. The reasons for any such adjustments will be explained at that time.
| Conversion Valuation Appraisal Report | Page: 4 |
1. Overview and Financial Analysis
GENERAL OVERVIEW
As of March 31, 2006, the Bank had $754.1 million in total assets, $655.9 million in deposits, $358.4 million in net loans and $63.3 million in equity. The following table shows the Bank’s facilities as of March 31, 2006.
FIGURE 1 – CURRENT FACILITIES LIST
Location : | Year Opened | Owned/ Leased | Net Book Value as of 03/31/06 | Date of Lease Expiration | |||||
Main Office: | |||||||||
4390 Davisville Road | |||||||||
Hatboro, Pennsylvania | 1996 | Owned | $ | 2,222 | N/A | ||||
Branch Offices: | |||||||||
401 Rhawn Street | |||||||||
Philadelphia, Pennsylvania | 1956 | Owned | 610 | N/A | |||||
815 Bustleton Pike | |||||||||
Richboro, Pennsylvania | 1985 | Owned | 553 | N/A | |||||
1 Fitzwatertown Road | |||||||||
Willow Grove, Pennsylvania | 1995 | Owned | 409 | N/A | |||||
1041 York Road | |||||||||
Warminster, Pennsylvania | 2000 | Owned | 904 | N/A | |||||
921 West Avenue | |||||||||
Ocean City, New Jersey | 2000 | Owned | 524 | N/A | |||||
6059 Black Horse Pike | |||||||||
Egg Harbor Township, New Jersey | 2000 | Owned | 923 | N/A | |||||
5871 Lower York Road | |||||||||
Lahaska, Pennsylvania | 2004 | Owned | 1,518 | N/A | |||||
8 U.S. Route 9 South | |||||||||
Marmora, New Jersey | 2006 | Owned | 1,606 | N/A | |||||
Administrative Offices: | |||||||||
1225 Industrial Boulevard | |||||||||
Southampton, Pennsylvania | N/A | Owned | 754 | N/A | |||||
Other Properties: | |||||||||
811 Bustleton Pike | |||||||||
Richboro, Pennsylvania | N/A | Owned | 52 | N/A | |||||
Absecon, New Jersey | N/A | Owned | 2,008 | N/A | |||||
Pleasantville, New Jersey | N/A | Owned | 489 | N/A | |||||
67 Dowlin Forge Road | |||||||||
Exton, Pennsylvania | N/A | Leased | N/A | 2007 | |||||
Source: Offering Prospectus
| Conversion Valuation Appraisal Report | Page: 5 |
HISTORYAND OVERVIEW
Fox Chase Bank is a community-oriented financial institution dedicated to serving the financial service needs of consumers and businesses within its market area. Fox Chase Bank is subject to extensive regulation, examination and supervision by the Office of Thrift Supervision, its primary federal regulator, and the Federal Deposit Insurance Corporation, its deposit insurer. The Bank attracts deposits from the general public and has historically used such funds to originate one-to four-family residential real estate loans, construction and land development loans and consumer loans.
Recently, the Bank has begun to emphasize the origination of multifamily and commercial real estate loans, commercial business loans and construction loans in the Philadelphia metropolitan area and greater Delaware Valley, while eliminating the origination of higher risk acquisition, development and construction loans in the southern New Jersey shore area. At March 31, 2006, the Bank operated out of its main office in Hatboro, Pennsylvania and eight branch offices in Bucks, Montgomery and Philadelphia Counties, Pennsylvania and Atlantic and Cape May Counties, New Jersey. At March 31, 2006, the Bank had total assets of $754.1 million, deposits of $655.9 million and total equity of $63.3 million.
| Conversion Valuation Appraisal Report | Page: 6 |
STRATEGIC DIRECTION
The Bank’s mission is to become the leading relationship-based business and consumer bank in its market area by delivering financial products and services tailored to its clients’ needs. After the reorganization, the Bank plans to continue its strategy of:
| • | adhering to the directives of the Cease and Desist Order issued by the Office of Thrift Supervision; |
| • | pursuing opportunities to increase commercial lending in its primary market area; |
| • | building profitable business and consumer relationships with an emphasis on growing transaction deposit accounts and deposit balances; |
| • | increasing income by expanding our product offerings and continuing to offer exceptional customer service; and |
| • | expanding the Bank’s footprint and market presence through opening additional branch and loan production offices. |
| Conversion Valuation Appraisal Report | Page: 7 |
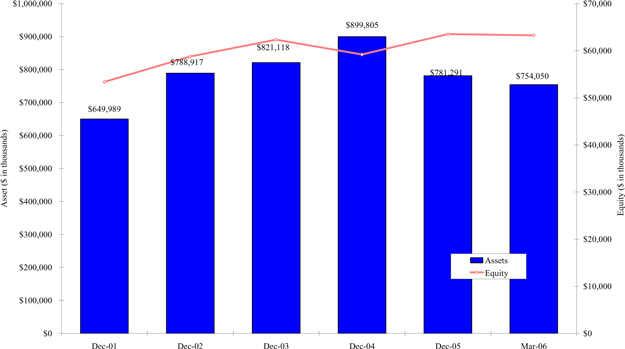
BALANCE SHEET TRENDS
The Bank’s balance sheet decreased by $27.2 million, or 3.5%, from $781.3 million at December 31, 2005 to $754.1 million at March 31, 2006.
Equity has decreased $250 thousand from $63.5 million at December 31, 2005 to $63.3 million at March 31, 2006. The equity to assets ratio was 8.39% at March 31, 2006.
FIGURE 2 - ASSETAND RETAINED EARNINGS CHART
Source: Offering Prospectus
| Conversion Valuation Appraisal Report | Page: 8 |
The following tables set forth certain information concerning the financial position of the Bank at the dates indicated.
FIGURE 3 - KEY BALANCE SHEET DATA
At March 31, 2006 | At December 31, | |||||||||||||||||
Financial Condition Data: | 2005 | 2004 | 2003 | 2002 | 2001 | |||||||||||||
| $ in thousands | ||||||||||||||||||
Total assets | $ | 754,050 | $ | 781,291 | $ | 899,805 | $ | 821,118 | $ | 788,917 | $ | 649,989 | ||||||
Cash and cash equivalents | 27,254 | 46,086 | 43,722 | 32,022 | 46,129 | 40,775 | ||||||||||||
Interest-earning time deposits | 600 | 600 | 3,174 | 4,392 | 2,800 | 3,444 | ||||||||||||
Securities available-for-sale | 329,060 | 329,504 | 330,199 | 335,388 | 310,118 | 194,216 | ||||||||||||
Securities held-to-maturity | — | — | — | — | — | 2,008 | ||||||||||||
Loans receivable net | 355,729 | 366,393 | 482,606 | 414,438 | 410,139 | 388,507 | ||||||||||||
Loans held for sale | 2,704 | 357 | — | — | — | — | ||||||||||||
Deposits | 655,892 | 682,307 | 805,250 | 723,838 | 695,010 | 561,179 | ||||||||||||
Advances from Federal Home Loan Bank | 30,000 | 30,000 | 30,000 | 30,000 | 30,000 | 30,000 | ||||||||||||
Total equity | 63,271 | 63,521 | 59,190 | 62,331 | 58,760 | 53,388 | ||||||||||||
Source: Offering Prospectus
FIGURE 4 - KEY RATIOS
| At or for the three months Ended March 31, | At or for the Years Ended December 31, | ||||||||||||||||||||
Selected Financial Ratios and Other Data: | 2006 | 2005 | 2005 | 2004 | 2003 | 2002 | 2001 | ||||||||||||||
Performance Ratios: | |||||||||||||||||||||
Return on average assets | 0.14 | % | 0.53 | % | 0.70 | % | -0.21 | % | 0.59 | % | 0.59 | % | 0.33 | % | |||||||
Return on average equity | 1.68 | 8.04 | 9.51 | (2.82 | ) | 7.64 | 7.45 | 3.71 | |||||||||||||
Interest rate spread | 1.86 | 2.09 | 1.78 | 1.92 | 1.61 | 2.19 | 1.95 | ||||||||||||||
Net interest margin | 2.21 | 2.32 | 2.05 | 2.11 | 1.87 | 2.40 | 2.25 | ||||||||||||||
Noninterest expense to average assets | 2.23 | 1.73 | 1.80 | 1.29 | 1.34 | 1.40 | 1.53 | ||||||||||||||
Efficiency ratio | 93.86 | 69.95 | 83.94 | 56.34 | 59.96 | 56.49 | 72.80 | ||||||||||||||
Average interest-earning assets to average interest-bearing liabilities | 93.86 | 106.30 | 109.08 | 107.69 | 109.68 | 106.30 | 106.63 | ||||||||||||||
Average equity to average assets | 8.39 | 6.36 | 7.43 | 7.59 | 7.67 | 7.91 | 8.78 | ||||||||||||||
Capital Ratios: | |||||||||||||||||||||
Tangible capital | 8.72 | 6.88 | 8.40 | 6.66 | 7.54 | 7.24 | 8.14 | ||||||||||||||
Core capital | 18.79 | 13.64 | 17.76 | 12.92 | 15.76 | 14.59 | 12.63 | ||||||||||||||
Total risk-based capital | 20.06 | 14.92 | 19.02 | 14.17 | 16.29 | 15.13 | 12.86 | ||||||||||||||
Asset Quality Ratios: | |||||||||||||||||||||
Allowance for loan losses as a percent of total loans | 2.29 | 2.90 | 2.22 | 2.89 | 0.50 | 0.50 | 0.25 | ||||||||||||||
Allowance for loan losses as a percent of non-performing loans | 186.82 | 3,451.08 | 163.90 | 997.99 | 159.29 | 158.45 | 197.37 | ||||||||||||||
Net charge-offs to average outstanding loans during the period | — | — | — | — | — | — | — | ||||||||||||||
Non-performing loans as a percent of total loans | 1.26 | 0.08 | 1.39 | 0.30 | 0.32 | 0.32 | 0.13 | ||||||||||||||
Other Data: | |||||||||||||||||||||
Number of: | |||||||||||||||||||||
Deposit Accounts | 59,643 | 65,876 | 61,349 | 66,800 | 65,796 | 66,554 | 61,981 | ||||||||||||||
Offices | 9 | 8 | 8 | 8 | 7 | 7 | 7 | ||||||||||||||
Source: Offering Prospectus
| Conversion Valuation Appraisal Report | Page: 9 |
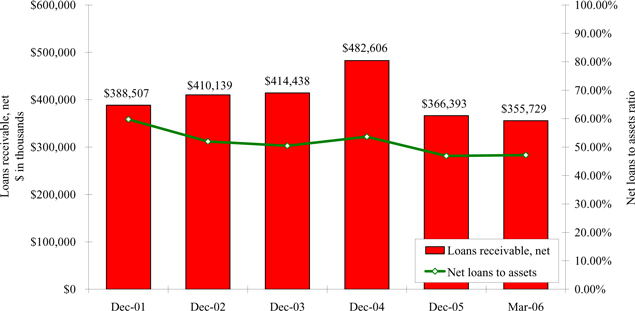
LOAN PORTFOLIO
The Bank’s loan portfolio has decreased by $10.7 million from December 31, 2005 to March 31, 2006, and as a percent of assets, the loan portfolio has increased from 46.90% to 47.18%, respectively.
FIGURE 5 - NET LOANS RECEIVABLE CHART
Source: Offering Prospectus
| Conversion Valuation Appraisal Report | Page: 10 |
The loan portfolio has grown rapidly. The mix has shifted from 1-4 family loans to multi-family and commercial real estate and home equity loans.
FIGURE 6 - LOAN MIXASOF MARCH 31, 2006
| At March 31, | At December 31, | |||||||||||||||||||||||||||||||||||||||||
| 2006 | 2005 | 2004 | 2003 | 2002 | 2001 | |||||||||||||||||||||||||||||||||||||
| Amount | Percent | Amount | Percent | Amount | Percent | Amount | Percent | Amount | Percent | Amount | Percent | |||||||||||||||||||||||||||||||
| (Dollars in thousand) | ||||||||||||||||||||||||||||||||||||||||||
Types of loan: | ||||||||||||||||||||||||||||||||||||||||||
Real estate loans: | ||||||||||||||||||||||||||||||||||||||||||
Single-family 1-4 units | $ | 225,164 | 61.8 | % | $ | 228,476 | 60.87 | % | $ | 250,015 | 50.15 | % | $ | 262,753 | 62.69 | % | $ | 350,651 | 84.31 | % | $ | 353,343 | 89.64 | % | ||||||||||||||||||
Multi-family 5 and commercial | 34,681 | 9.5 | % | 32,923 | 8.77 | % | 85,585 | 17.17 | % | 57,495 | 13.72 | % | 16,173 | 3.89 | % | 5,276 | 1.34 | % | ||||||||||||||||||||||||
Real estate construction | 22,466 | 6.2 | % | 31,015 | 8.26 | % | 92,210 | 18.50 | % | 46,850 | 11.18 | % | — | 0.00 | % | — | 0.00 | % | ||||||||||||||||||||||||
Total real estate | 282,311 | 77.5 | % | 292,414 | 77.90 | % | 427,810 | 85.82 | % | 367,098 | 87.59 | % | 366,824 | 88.20 | % | 358,619 | 90.98 | % | ||||||||||||||||||||||||
Consumer loans: | ||||||||||||||||||||||||||||||||||||||||||
Lines of credit | 13,465 | 3.67 | % | 16,269 | 4.33 | % | 18,249 | 3.66 | % | 13,947 | 3.33 | % | 11,314 | 2.72 | % | 3,177 | 0.81 | % | ||||||||||||||||||||||||
Automobile loans | 1,157 | 0.31 | % | 1,280 | 0.34 | % | 1,872 | 0.38 | % | 1,439 | 0.34 | % | 2,589 | 0.62 | % | 3,936 | 1.00 | % | ||||||||||||||||||||||||
Home equity loans | 67,357 | 18.34 | % | 65,003 | 17.32 | % | 49,154 | 9.86 | % | 36,065 | 8.60 | % | 34,585 | 8.32 | % | 27,967 | 7.10 | % | ||||||||||||||||||||||||
Other | 172 | 0.05 | % | 188 | 0.05 | % | 1,305 | 0.26 | % | 438 | 0.10 | % | 465 | 0.11 | % | 363 | 0.09 | % | ||||||||||||||||||||||||
Total consumer loans | 82,151 | 22.37 | % | 82,740 | 22.04 | % | 70,580 | 14.16 | % | 51,889 | 12.37 | % | 48,953 | 11.77 | % | 35,443 | 9.00 | % | ||||||||||||||||||||||||
Commercial business | 175 | 0.00 | % | 175 | 0.05 | % | 175 | 0.04 | % | 175 | 0.04 | % | 115 | 0.03 | % | 115 | 0.03 | % | ||||||||||||||||||||||||
Total gross loans | 364,637 | 100.0 | % | 375,329 | 99.99 | % | 498,565 | 100.02 | % | 419,162 | 100.00 | % | 415,892 | 100.00 | % | 394,177 | 100.01 | % | ||||||||||||||||||||||||
Less: | ||||||||||||||||||||||||||||||||||||||||||
Deferred loan fees, net | (559 | ) | (587 | ) | (1,568 | ) | (2,615 | ) | (3,671 | ) | (4,695 | ) | ||||||||||||||||||||||||||||||
Allowance for loan losses | (8,349 | ) | (8,349 | ) | (14,391 | ) | (2,109 | ) | (2,082 | ) | (975 | ) | ||||||||||||||||||||||||||||||
Total loans, net | $ | 355,729 | $ | 366,393 | $ | 482,606 | $ | 414,438 | $ | 410,139 | $ | 388,507 | ||||||||||||||||||||||||||||||
Source: Offering Prospectus
| Conversion Valuation Appraisal Report | Page: 11 |
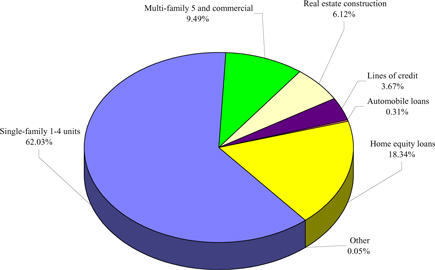
Over half of the loan mix is 1-4 family residential. The remainder of the mix is diverse with the largest piece being home equity loans.
FIGURE 7 - LOAN MIXAT MARCH 31, 2006
Source: Offering Prospectus
| Conversion Valuation Appraisal Report | Page: 12 |
INVESTMENTS
The investment portfolio decreased slightly between December 31, 2005 and March 31, 2006.
FIGURE 8 - SECURITIES CHART

Note: Securities designated AFS were shown at market value and securities designated HTM were shown at amortized cost.
Source: Offering Prospectus
| Conversion Valuation Appraisal Report | Page: 13 |
INVESTMENTSAND MORTGAGE-BACKED SECURITIES
The following table provides the Bank’s investment portfolio.
FIGURE 9 - INVESTMENT MIX
| At March 31, | At December 31, | |||||||||||||||||||||||
| 2006 | 2005 | 2004 | 2003 | |||||||||||||||||||||
| Amortized Cost | Fair Value | Amortized Cost | Fair Value | Amortized Cost | Fair Value | Amortized Cost | Fair Value | |||||||||||||||||
| (In thousands) | ||||||||||||||||||||||||
Securities available-for-sale: | ||||||||||||||||||||||||
Obligations of U.S. government agencies | $ | 101,305 | $ | 99,972 | $ | 99,602 | $ | 98,308 | $ | 90,318 | $ | 89,252 | $ | 84,989 | $ | 84,847 | ||||||||
State and political subdivisions | 23,083 | 22,870 | 18,863 | 18,808 | 18,493 | 18,571 | 17,361 | 17,513 | ||||||||||||||||
Mortgage-backed securities | 201,232 | 198,475 | 189,698 | 187,721 | 185,263 | 185,178 | 176,414 | 176,474 | ||||||||||||||||
Corporate debt securities | 7,890 | 7,743 | 7,926 | 7,603 | 15,398 | 15,559 | 34,338 | 35,102 | ||||||||||||||||
Mutual Funds | — | — | 17,064 | 17,064 | 21,879 | 21,639 | 21,366 | 21,277 | ||||||||||||||||
Total securities available-for-sale | $ | 333,510 | $ | 329,060 | $ | 333,153 | $ | 329,504 | $ | 331,351 | $ | 330,199 | $ | 334,468 | $ | 335,213 | ||||||||
Total securities | $ | 333,510 | $ | 329,060 | $ | 333,153 | $ | 329,504 | $ | 331,351 | $ | 330,199 | $ | 334,468 | $ | 335,213 | ||||||||
Source: Offering Prospectus
| Conversion Valuation Appraisal Report | Page: 14 |
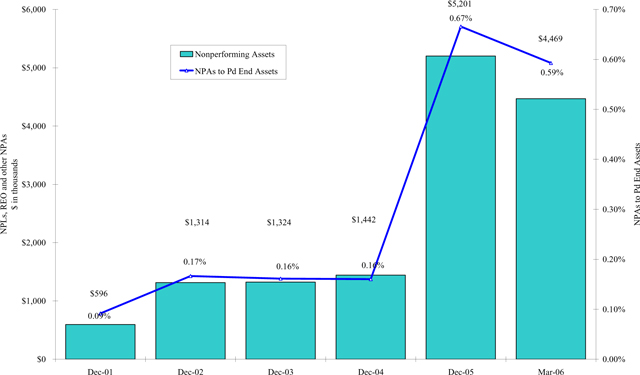
ASSET QUALITY
The Bank’s level of nonperforming assets decreased in 2006. At March 31, 2006, nonperforming assets were $4.5 million, or 0.59% of total assets.
FIGURE 10 - ASSET QUALITY CHART
Source: Offering Prospectus
| Conversion Valuation Appraisal Report | Page: 15 |
At March 31, 2006, the Bank’s nonperforming loans to total loan ratio was 1.26% and the nonperforming assets to total assets ratio was 0.59%.
FIGURE 11 - NONPERFORMING LOANS
At March 31, 2006 | At December 31, | |||||||||||||||||||||||
| 2005 | 2004 | 2003 | 2002 | 2001 | ||||||||||||||||||||
| (Dollars in thousands) | ||||||||||||||||||||||||
Non-accrual loans: | ||||||||||||||||||||||||
Residential real estate: | ||||||||||||||||||||||||
1-4 family | 548 | 548 | 1,442 | 1,324 | 1,314 | 494 | ||||||||||||||||||
Multi-family and commercial real estate | 2,972 | 2,972 | — | — | — | — | ||||||||||||||||||
Total non-accrual loans | 3,520 | 3,520 | 1,442 | 1,324 | 1,314 | 494 | ||||||||||||||||||
Accruing loans which are contractually past due 90 days or more - multi-family and commercial real estate | 949 | 1,574 | — | — | — | — | ||||||||||||||||||
Total | 949 | 1,574 | — | — | — | — | ||||||||||||||||||
Total non-accrual and 90 days or more past due loans | 4,469 | 5,094 | 1,442 | 1,324 | 1,314 | 494 | ||||||||||||||||||
Real estate owned | — | 107 | — | — | — | 102 | ||||||||||||||||||
Total nonperforming assets | $ | 4,469 | $ | 5,201 | $ | 1,442 | $ | 1,324 | $ | 1,314 | $ | 596 | ||||||||||||
Non-accrual and 90 days or more past due loans as a percentage of total loans, net | 1.26 | % | 1.39 | % | 0.30 | % | 0.32 | % | 0.32 | % | 0.13 | % | ||||||||||||
Non-accrual and 90 days or more past due loans as a percentage of total assets | 0.59 | % | 0.65 | % | 0.16 | % | 0.16 | % | 0.17 | % | 0.08 | % | ||||||||||||
Non-performing assets as a percentage of total assets | 0.59 | % | 0.67 | % | 0.16 | % | 0.16 | % | 0.17 | % | 0.09 | % | ||||||||||||
Source: Offering Prospectus
| Conversion Valuation Appraisal Report | Page: 16 |
The ALLL decreased $6.0 million from December 31, 2005 to March 31, 2006. The Bank’s ALLL to loans ratio increased slightly from 2.22% at December 31, 2005 to 2.29% at March 31, 2006.
FIGURE 12 - ALLOWANCEFOR POSSIBLE LOANAND LEASE LOSSES CHART

Source: Offering Prospectus
| Conversion Valuation Appraisal Report | Page: 17 |
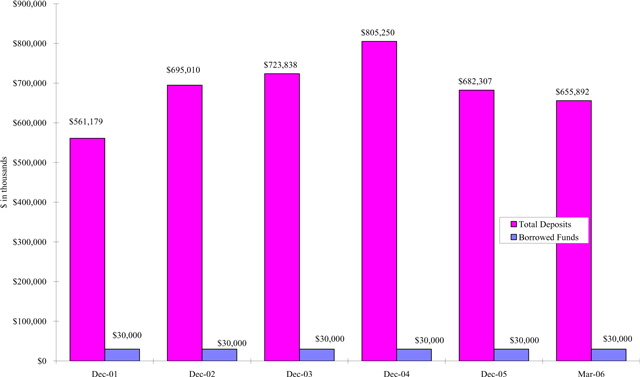
FUNDING COMPOSITION
Deposits have decreased $26.4 million from December 31, 2005 to March 31, 2006. Borrowings have remained constant since December 31, 2001.
FIGURE 13 - DEPOSITAND BORROWING TREND CHART
Source: Offering Prospectus
| Conversion Valuation Appraisal Report | Page: 18 |
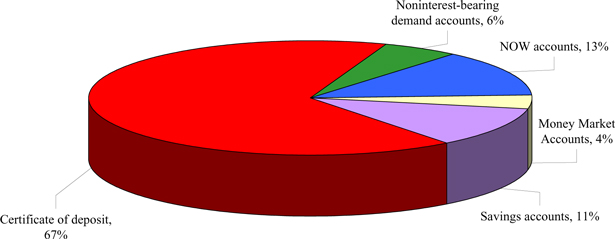
The following chart illustrates the Bank’s deposit mix as of March 31, 2006. The largest portion of the deposit mix is certificates of deposit.
FIGURE 14 - DEPOSIT MIX
Source: Offering Prospectus
| Conversion Valuation Appraisal Report | Page: 19 |
ASSET/LIABILITY MANAGEMENT
The following chart provides the net portfolio value sensitivity in various interest rate shock scenarios.
FIGURE 15 – INTEREST RATE RISK
| Net Portfolio Value as % of | ||||||||||||||
| Estimated Net Portfolio Value | Present Value of Assets | |||||||||||||
Change in Interest Rates | $ Amount | $ Change | % Change | NPV Ratio | BP Change | |||||||||
| (Dollars in thousands) | ||||||||||||||
(basis points) | ||||||||||||||
+300bp | 52,483 | (27,168 | ) | -34.00 | % | 7.03 | % | (299 | ) | |||||
+200bp | 62,422 | (17,229 | ) | -22.00 | % | 8.18 | % | (184 | ) | |||||
+100bp | 71,849 | (7,802 | ) | -10.00 | % | 9.22 | % | (80 | ) | |||||
0bp | 79,651 | — | 0.00 | % | 10.02 | % | — | |||||||
-100bp | 81,956 | 2,305 | 3.00 | % | 10.17 | % | 15 | |||||||
-200bp | 76,637 | (3,014 | ) | -4.00 | % | 9.47 | % | (55 | ) | |||||
Source: Offering Prospectus
| Conversion Valuation Appraisal Report | Page: 20 |
NET WORTHAND CAPITAL
At March 31, 2006 the Bank had capital in excess of the minimum requirements for all capital ratios.
FIGURE 16 - CAPITALANALYSIS
Bank Level Regulatory Capital Position | At March 31, 2006 | |||||
| Amount ($000’s) | Percentage of Assets | |||||
GAAP Capital | $ | 63,271 | 8.39 | % | ||
Tier 1 (Core) Capital (to Average Assets) | ||||||
Capital Level | $ | 66,180 | 8.72 | % | ||
Requirement | 11,384 | 1.50 | % | |||
Excess | $ | 54,796 | 7.22 | % | ||
Tier 1 (Core) Capital (to Risk-Weighted Assets) | ||||||
Capital Level | $ | 66,180 | 8.72 | % | ||
Requirement | 30,358 | 4.00 | % | |||
Excess | $ | 35,822 | 4.72 | % | ||
Total Capital (to Risk-Weighted Assets) | ||||||
Capital Level | $ | 70,631 | 9.31 | % | ||
Requirement | 60,716 | 8.00 | % | |||
Excess | $ | 9,915 | 1.31 | % | ||
Source: Offering Prospectus
| Conversion Valuation Appraisal Report | Page: 21 |
PROFITABILITY TRENDS
The Bank’s annual net income increased between the twelve months ended December 31, 2001 and the twelve months ended December 31, 2003. The increase during this time period was primarily a function of rising net interest income and noninterest income. Noninterest expense and income tax expense also increased to a lesser extent.
The Bank posted a $1.9 million net loss during the twelve months ended December 31, 2004. The loss was primarily a function of a $12.3 million posting of provision expense. The Bank posted a $6.0 million profit for the twelve months ended December 31, 2005. During the twelve months ended December 31, 2005, the Bank recaptured $6.0 million in provision expense. The change in net income/(loss) between the 2004 and 2005 fiscal years was primarily attributable to the $18.3 million change in provision expense. Additionally, between the twelve months ended December 31, 2004 and the twelve months ended December 31, 2005, net interest income declined $969 thousand, noninterest income declined $1.0 million, noninterest expense rose $3.9 million and provision for income tax expense rose $4.6 million.
For the three months ended March 31, 2006 compared to three months ended March 31, 2005, net income declined $899 thousand or 77.04%. The decline was primarily attributable to a decline in net interest income of $989 thousand and an increase in noninterest expense of $398 thousand. These factors were partially offset by a $454 thousand decline in provision for income tax expense.
FIGURE 17 - NET INCOME CHART

Source: Offering Prospectus
| Conversion Valuation Appraisal Report | Page: 22 |
There are numerous factors impacting the Bank’s profitability over the past year. The following table provides FinPro’s calculation of the Bank’s core net income for the twelve months ended December 31, 2005 and for the three months and the twelve months ended March 31, 2006.
FIGURE 18 – CORE NET INCOME CALCULATION
Unaudited | For the Twelve Months Ended December 31, 2005 | For the Three Months Ended March 31, 2006 | For the Twelve Months Ended March 31, 2006 | |||||||||
| ($000’s) | ($000’s) | |||||||||||
Net Income as Reported | $ | 5,960 | $ | 268 | $ | 5,061 | ||||||
Pre-Tax Adjustments: | ||||||||||||
Recapture of excess ALLL | (6,025 | ) | — | (6,025 | ) | |||||||
Gain on sale of foreclosed assets | (6 | ) | (85 | ) | (85 | ) | ||||||
Loss on sale of fixed assets | 161 | — | 161 | |||||||||
Gain on sale of MBS | (108 | ) | — | (108 | ) | |||||||
Loss/impairment on sale of fixed assets | 917 | 17 | 993 | |||||||||
Total Adjustments | (5,061 | ) | (68 | ) | (5,064 | ) | ||||||
Tax Impact (34%) | (1,721 | ) | (23 | ) | (1,722 | ) | ||||||
After-Tax Adjustments | (3,340 | ) | (45 | ) | (3,342 | ) | ||||||
Core Net Income | $ | 2,620 | $ | 223 | $ | 1,719 | ||||||
Core ROAA | 0.31 | % | 0.12 | % | 0.21 | % | ||||||
Core ROAE | 4.18 | % | 0.47 | % | 2.66 | % | ||||||
Source: Offering Prospectus and discussions with Bank Management
| Conversion Valuation Appraisal Report | Page: 23 |
The net interest spread and margin decreased between the three months ended March 31, 2006 and the three months ended March 31, 2005. The decrease is attributable to a higher cost of interest bearing liabilities, which was partially offset by a higher yield on earning assets.
FIGURE 19 - AVERAGE YIELDSAND COSTS
| Three Months Ended March 31, | ||||||||||||||||||||
| 2006 | 2005 | |||||||||||||||||||
| Average Balance | Interest | Yield/ Cost | Average Balance | Interest | Yield/ Cost | |||||||||||||||
Interest-earning assets: | ||||||||||||||||||||
Interest-earning demand deposits | $ | 21,781 | $ | 263 | 4.83 | % | $ | 28,293 | $ | 182 | 2.51 | % | ||||||||
Mortgage-backed securities | 193,958 | 1,886 | 3.89 | % | 183,011 | 1,434 | 3.13 | % | ||||||||||||
Taxable securities | 124,472 | 1,103 | 3.54 | % | 130,357 | 1,056 | 3.24 | % | ||||||||||||
Nontaxable securities | 21,346 | 206 | 3.86 | % | 18,493 | 189 | 4.09 | % | ||||||||||||
Loans | 369,771 | 5,424 | 5.87 | % | 495,208 | 7,326 | 5.92 | % | ||||||||||||
Allowance for loan losses | (8,349 | ) | — | — | (12,724 | ) | — | — | ||||||||||||
Net loans | 361,422 | — | 5.87 | % | 482,484 | — | 5.89 | % | ||||||||||||
Total interest-earning assets | $ | 722,979 | $ | 8,883 | 4.86 | % | $ | 842,638 | $ | 10,189 | 4.76 | % | ||||||||
Noninterest-earning assets | 38,783 | 43,159 | ||||||||||||||||||
Total assets | $ | 761,762 | 8,883 | $ | 885,797 | 10,189 | ||||||||||||||
Interest-bearing liabilities: | ||||||||||||||||||||
NOW and money market deposit accounts | $ | 108,924 | $ | 381 | 1.42 | % | $ | 167,884 | $ | 618 | 1.49 | % | ||||||||
Savings accounts | 77,094 | 134 | 0.70 | % | 90,321 | 204 | 0.92 | % | ||||||||||||
Certificates of deposit | 440,144 | 3,970 | 3.66 | % | 504,472 | 4,030 | 3.24 | % | ||||||||||||
Total interest-bearing deposits | 626,162 | 4,485 | 2.90 | % | 762,677 | 4,852 | 2.58 | % | ||||||||||||
FHLB advances | 30,000 | 366 | 4.88 | % | 30,000 | 366 | 4.88 | % | ||||||||||||
Total interest-bearing liabilities | 656,162 | 4,851 | 3.00 | % | 792,677 | 5,218 | 2.67 | % | ||||||||||||
Noninterest-bearing liabilities | 33,379 | — | 31,475 | — | ||||||||||||||||
Other non-interest bearing liabilities | 8,329 | — | 5,270 | |||||||||||||||||
Total liabilities | 697,870 | 829,422 | 5,218 | |||||||||||||||||
Retained earnings | 66,188 | 57,748 | ||||||||||||||||||
Accumulated comprehensive income | (2,296 | ) | (1,373 | ) | ||||||||||||||||
Total equity | 63,892 | 56,375 | ||||||||||||||||||
Total liabilities and equity | $ | 761,762 | $ | 885,797 | ||||||||||||||||
Net interest income before provision for loan losses | $ | 4,032 | $ | 4,971 | ||||||||||||||||
Interest rate spread | 1.86 | % | 2.09 | % | ||||||||||||||||
Net interest margin | 2.21 | % | 2.32 | % | ||||||||||||||||
Ratio of average interest-earning assets to average | ||||||||||||||||||||
Interest-bearing liabilities | 110.18 | % | 106.30 | % | ||||||||||||||||
Source: Offering Prospectus
| Conversion Valuation Appraisal Report | Page: 24 |
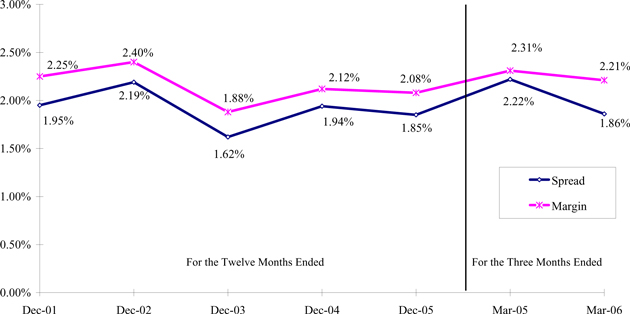
Net interest margin increased 15 basis points between the twelve month period ended December 31, 2001 and the twelve month period ended December 31, 2002, only to decrease 53 basis points for the twelve months ended December 31, 2003. Net margin increased 24 basis points between the twelve months ended December 31, 2003 and the twelve months ended December 31, 2004, but decreased 4 basis points between the twelve months ended December 31, 2004 and the twelve months ended December 31, 2005.
The net interest spread and margin both decreased between the three months ended March 31, 2005, and the three months ended March 31, 2006.
FIGURE 20 - SPREADAND MARGIN CHART
Source: Offering Prospectus
| Conversion Valuation Appraisal Report | Page: 25 |
The Bank’s annual net income increased between the twelve months ended December 31, 2001 and the twelve months ended December 31, 2003. The increase during this time period was primarily a function of rising net interest income and noninterest income. Noninterest expense and income tax expense also increased to a lesser extent.
The Bank posted a $1.9 million net loss during the twelve months ended December 31, 2004. The loss was primarily a function of a $12.3 million posting of provision expense. The Bank posted a $6.0 million profit for the twelve months ended December 31, 2005. During the twelve months ended December 31, 2005, the Bank recaptured $6.0 million in provision expense. The change in net income/(loss) between the 2004 and 2005 fiscal years was primarily attributable to the $18.3 million change in provision expense. Additionally, between the twelve months ended December 31, 2004 and the twelve months ended December 31, 2005, net interest income declined $969 thousand, noninterest income declined $1.0 million, noninterest expense rose $3.9 million and provision for income tax expense rose $4.6 million.
For the three months ended March 31, 2006 compared to three months ended March 31, 2005, net income declined $899 thousand or 77.04%. The decline was primarily attributable to a decline in net interest income of $989 thousand and an increase in noninterest expense of $398 thousand. These factors were partially offset by a $454 thousand decline in provision for income tax expense.
FIGURE 21 - INCOME STATEMENT TRENDS
| For the Three Months Ended March 31, | For the Years Ended December 31, | |||||||||||||||||||||||
| 2006 | 2005 | 2005 | 2004 | 2003 | 2002 | 2001 | ||||||||||||||||||
| $ in thousands | ||||||||||||||||||||||||
Selected Operating Data: | ||||||||||||||||||||||||
Interest income | $ | 8,883 | $ | 10,189 | $ | 37,601 | $ | 37,566 | $ | 35,533 | $ | 39,607 | $ | 39,014 | ||||||||||
Interest expense | 4,851 | 5,218 | 20,697 | 19,693 | 20,662 | 23,031 | 25,905 | |||||||||||||||||
Net interest income | 4,032 | 4,971 | 16,904 | 17,873 | 14,871 | 16,576 | 13,109 | |||||||||||||||||
Provision for loan losses | — | — | (6,025 | ) | 12,282 | 30 | 1,107 | 456 | ||||||||||||||||
Net interest income after provision for loan losses | 4,032 | 4,971 | 22,929 | 5,591 | 14,841 | 15,469 | 12,653 | |||||||||||||||||
Other income | 428 | 444 | 1,214 | 2,279 | 3,405 | 1,149 | (335 | ) | ||||||||||||||||
Other expense | 4,186 | 3,788 | 15,208 | 11,353 | 10,958 | 10,013 | 9,300 | |||||||||||||||||
Income (loss) before income taxes | 274 | 1,627 | 8,935 | (3,483 | ) | 7,288 | 6,605 | 3,018 | ||||||||||||||||
Provision (benefit) for income taxes | 6 | 460 | 2,975 | (1,595 | ) | 2,497 | 2,405 | 1,043 | ||||||||||||||||
Net earnings | $ | 268 | $ | 1,167 | $ | 5,960 | $ | (1,888 | ) | $ | 4,791 | $ | 4,200 | $ | 1,975 | |||||||||
Source: Offering Prospectus
| Conversion Valuation Appraisal Report | Page: 26 |
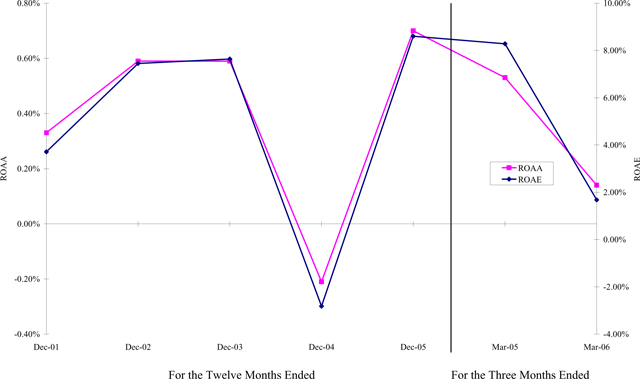
Between the fiscal years ended 2001 through 2005 ROAA and ROAE fluctuated. The fiscal year ended December 31, 2004 was adversely affected by a $12.3 million posting of provision expense. The fiscal year ended December 31, 2005 was positively affected by a $6.0 million recovery of provision expense.
The Bank’s core ROAA and ROAE for the three month period ended March 31, 2006 were 0.12% and 0.47%, respectively. These core profitability ratios represent a decrease from the ROAA and ROAE for the three month period ended March 31, 2006.
FIGURE 22 - PROFITABILITY TRENDCHART
Source: Offering Prospectus
| Conversion Valuation Appraisal Report | Page: 27 |
LEGAL PROCEEDINGS
On April 28, 2006, Gregory S. Cipa, the former President and Chief Executive Officer of Fox Chase Bank, filed a complaint against Fox Chase Bank in the Civil Division of the Court of Common Pleas of Bucks County, Pennsylvania. In the complaint, Mr. Cipa seeks payments of amounts he states he is owed under various compensation arrangements he claims were in place with Fox Chase Bank. Mr. Cipa seeks monetary damages the amount of which is unspecified but is stated to be in excess of $50,000 to be determined at trial and the payment of attorneys’ fees and litigation costs. Fox Chase Bank intends to vigorously defend this action.
SUBSIDIARIES
Fox Chase Bank’s only active subsidiary is Fox Chase Financial, Inc., which was formed in February 1999 to hold investment securities. As a Delaware-chartered corporation, the securities held by Fox Chase Financial are exempt from Pennsylvania income tax under current law. Income savings to Fox Chase Bank from the use of Fox Chase Financial was approximately $19,000 and $630,000 for the three months ended March 31, 2006 and the year ended December 31, 2005, respectively.
| Conversion Valuation Appraisal Report | Page: 28 |
ORDERTO CEASEAND DESIST
On June 6, 2005, the Bank consented to the issuance of an Order to Cease and Desist by the Office of Thrift Supervision. As part of this order, the Office of Thrift Supervision ordered the Bank to discontinue a number of practices, and specifically ordered the Bank to take certain actions. The Bank was ordered to discontinue making certain loans and to restrict the Bank’s asset growth. The mandated actions related generally to hiring a new chief executive officer, improving the board’s oversight over lending and risk exposure, developing a new business plan, improving loan underwriting and appraisal policies, loans-to-one borrower compliance and internal asset review procedures, enhancing credit administration, board management and governance and providing the Office of Thrift Supervision with quarterly progress reports. In addition, the Bank was required to review and analyze their loan portfolio and, as appropriate, review the allowance for loan losses.
Since the issuance of the Order to Cease and Desist, management believes that the Bank has complied with all directives contained in the Order, including (1) hiring new senior management; (2) appointing six new non-employee directors to the board; (3) adopting detailed and more stringent lending and interest rate risk policies, specifically with regard to policies and procedures for the determination of the allowance for loan losses; and (4) developing a new three year strategic plan, which requires the Bank to improve its capital position and earnings capability, which contemplates this mutual holding company reorganization and stock offering. The Bank still subject to the terms of the Order to Cease and Desist. However, on October 12, 2005, the restrictions on asset growth contained in the Order were lifted. On February 10, 2006, the Office of Thrift Supervision terminated the lending restrictions contained in the Order. On March 16, 2006, the restrictions on entering into third party contracts outside of the ordinary course of business without the prior written approval of the Office of Thrift Supervision was lifted. There can be no assurance as to when the Order to Cease and Desist will be terminated.
| Conversion Valuation Appraisal Report | Page: 29 |
The Order to Cease and Desist did not remove the Bank’s designation as a “troubled institution” as imposed by the Office of Thrift Supervision in January 2005. Such designation requires Fox Chase to pay increased assessment fees to the Office of Thrift Supervision and increases the deposit insurance premiums paid to the Federal Deposit Insurance Corporation. Further, such designation generally requires their regulators to undertake additional procedures when considering applications the Bank submits, such as for the establishment of new branches, for acquisitions or for certain dividend payments, which may result in a delay in the processing of the Bank’s applications. If the Bank fails to comply with the Order to Cease and Desist in a manner satisfactory to the Office of Thrift Supervision, it can take additional, and possibly more severe, enforcement action against management and the Board of Directors, including assessing civil monetary penalties and initiating injunctive actions. Moreover, they can impose restrictions on the Bank’s operations, which would negatively affect the Bank’s ability to implement its operating strategy and negatively affect its profitability.
| Conversion Valuation Appraisal Report | Page: 30 |
2. Market Area Analysis
The following tables provide deposit and demographic data for the Counties of Bucks, Montgomery, Philadelphia, Cape May and Atlantic.
FIGURE 23 – DEPOSITAND DEMOGRAPHIC DATAFOR BUCKS COUNTY
| Market: Bucks, PA | Deposit Data as of 6/30/2005 | |||||||||||
Deposits Summary
(Deposit data in $000)
| 6/2001 | 6/2002 | 6/2003 | 6/2004 | 6/2005 | CAGR(%) | |||||||
Bank Deposits | 5,700,874 | 6,359,368 | 7,410,394 | 8,041,391 | 8,573,364 | 10.74 | ||||||
Thrift Deposits | 1,484,807 | 1,636,240 | 1,836,495 | 1,660,732 | 1,838,161 | 5.48 | ||||||
Savings Bank Deposits | 581,172 | 632,184 | 686,760 | 751,197 | 695,344 | 4.59 | ||||||
Credit Union Deposits | 731,311 | 781,651 | 830,638 | 849,450 | 855,194 | 3.99 | ||||||
Total Deposits | 7,766,853 | 8,627,792 | 9,933,649 | 10,453,320 | 11,106,869 | 9.35 | ||||||
Weighted Deposits | 7,766,853 | 8,627,792 | 9,933,649 | 10,453,320 | 11,106,869 | 9.35 |
Weighted deposits are calculated based on the branch types selected in your filter and deposit weightings set under preferences.
Demographic Data
| Base 2000 | Current 2005 | Projected 2010 | % Change 2000-2005 | % Change 2005-2010 | ||||||
Total Population: | 597,635 | 622,564 | 646,658 | 4.17 | 3.87 | |||||
0-14 Age Group (%): | 21 | 20 | 20 | -0.03 | -0.48 | |||||
15-34 Age Group (%): | 24 | 23 | 23 | -0.51 | 3.24 | |||||
35-54 Age Group (%): | 33 | 33 | 32 | 2.90 | 1.32 | |||||
55+ Age Group (%): | 22 | 24 | 26 | 15.45 | 11.66 | |||||
Total Households: | 218,725 | 232,115 | 243,352 | 6.12 | 4.84 | |||||
$0-24K Households (%): | 16 | 12 | 9 | -22.34 | -22.94 | |||||
$25-50K Households (%): | 25 | 19 | 14 | -16.65 | -22.26 | |||||
$50K+ Households (%): | 60 | 69 | 77 | 23.12 | 17.11 | |||||
Average Household Income: | 73,983 | 92,990 | 117,909 | 25.69 | 26.80 | |||||
Median Household Income: | 59,726 | 73,522 | 89,443 | 23.10 | 21.65 | |||||
Per Capita Income: | 27,430 | 34,847 | 44,560 | 27.04 | 27.87 | |||||
Source: ESRI | ||||||||||
Source: SNL Securities
| Conversion Valuation Appraisal Report | Page: 31 |
FIGURE 24 – DEPOSITAND DEMOGRAPHIC DATAFOR MONTGOMERY COUNTY
| Market: Montgomery, PA | Deposit Data as of 6/30/2005 | |||||||||||
Deposits Summary
(Deposit data in $000)
| 6/2001 | 6/2002 | 6/2003 | 6/2004 | 6/2005 | CAGR(%) | |||||||
Bank Deposits | 10,208,934 | 10,716,936 | 12,702,898 | 14,194,530 | 15,604,708 | 11.19 | ||||||
Thrift Deposits | 2,606,875 | 2,831,424 | 2,191,595 | 1,621,835 | 1,893,091 | -7.69 | ||||||
Savings Bank Deposits | 503,544 | 549,603 | 807,135 | 939,719 | 327,149 | -10.22 | ||||||
Credit Union Deposits | 579,158 | 656,651 | 752,187 | 774,042 | 806,172 | 8.62 | ||||||
Total Deposits | 13,319,353 | 14,097,963 | 15,701,628 | 16,756,084 | 17,824,948 | 7.56 | ||||||
Weighted Deposits | 13,319,353 | 14,097,963 | 15,701,628 | 16,756,084 | 17,824,948 | 7.56 |
Weighted deposits are calculated based on the branch types selected in your filter and deposit weightings set under preferences.
Demographic Data
| Base 2000 | Current 2005 | Projected 2010 | % Change 2000-2005 | % Change 2005-2010 | ||||||
Total Population: | 750,097 | 775,046 | 798,024 | 3.33 | 2.96 | |||||
0-14 Age Group (%): | 20 | 20 | 19 | 0.59 | -1.40 | |||||
15-34 Age Group (%): | 24 | 23 | 23 | -1.67 | 1.89 | |||||
35-54 Age Group (%): | 31 | 31 | 31 | 2.90 | 1.83 | |||||
55+ Age Group (%): | 24 | 26 | 27 | 11.27 | 8.62 | |||||
Total Households: | 286,098 | 300,017 | 310,675 | 4.87 | 3.55 | |||||
$0-24K Households (%): | 16 | 12 | 8 | -23.96 | -24.95 | |||||
$25-50K Households (%): | 24 | 19 | 14 | -17.22 | -25.00 | |||||
$50K+ Households (%): | 60 | 69 | 78 | 21.32 | 16.13 | |||||
Average Household Income: | 79,813 | 101,694 | 131,989 | 27.42 | 29.79 | |||||
Median Household Income: | 60,868 | 75,725 | 94,128 | 24.41 | 24.30 | |||||
Per Capita Income: | 30,898 | 39,711 | 51,754 | 28.52 | 30.33 | |||||
Source: ESRI | ||||||||||
Source: SNL Securities
FIGURE 25 – DEPOSITAND DEMOGRAPHIC DATAFOR PHILADELPHIA COUNTY
| Market: Philadelphia, PA | Deposit Data as of 6/30/2005 | |||||||||||
Deposits Summary
(Deposit data in $000)
| 6/2001 | 6/2002 | 6/2003 | 6/2004 | 6/2005 | CAGR(%) | |||||||
Bank Deposits | 21,882,516 | 22,157,254 | 24,377,204 | 25,006,160 | 28,713,152 | 7.03 | ||||||
Thrift Deposits | 2,764,766 | 2,994,754 | 2,932,116 | 3,314,220 | 6,115,874 | 21.96 | ||||||
Savings Bank Deposits | 1,023,395 | 1,061,130 | 1,085,059 | 1,059,172 | 534,612 | -14.98 | ||||||
Credit Union Deposits | 2,379,344 | 2,804,525 | 3,153,087 | 3,425,056 | 3,613,036 | 11.01 | ||||||
Total Deposits | 25,670,677 | 26,213,138 | 28,394,379 | 29,379,552 | 35,363,638 | 8.34 | ||||||
Weighted Deposits | 25,670,677 | 26,213,138 | 28,394,379 | 29,379,552 | 35,363,638 | 8.34 |
Weighted deposits are calculated based on the branch types selected in your filter and deposit weightings set under preferences.
Demographic Data
Base 2000 | Current 2005 | Projected 2010 | % Change 2000-2005 | % Change 2005-2010 | ||||||
Total Population: | 1,517,550 | 1,484,645 | 1,461,195 | -2.17 | -1.58 | |||||
0-14 Age Group (%): | 21 | 20 | 19 | -6.07 | -7.64 | |||||
15-34 Age Group (%): | 30 | 30 | 30 | -2.71 | -2.02 | |||||
35-54 Age Group (%): | 27 | 27 | 27 | 0.02 | -3.35 | |||||
55+ Age Group (%): | 22 | 23 | 25 | -0.32 | 6.55 | |||||
Total Households: | 590,071 | 584,809 | 579,302 | -0.89 | -0.94 | |||||
$0-24K Households (%): | 42 | 35 | 31 | -16.13 | -14.55 | |||||
$25-50K Households (%): | 29 | 28 | 24 | -5.40 | -13.32 | |||||
$50K+ Households (%): | 29 | 37 | 45 | 25.42 | 21.47 | |||||
Average Household Income: | 41,525 | 50,876 | 63,333 | 22.52 | 24.49 | |||||
Median Household Income: | 30,781 | 36,853 | 44,292 | 19.73 | 20.19 | |||||
Per Capita Income: | 16,509 | 20,499 | 25,623 | 24.17 | 25.00 | |||||
Source: ESRI | ||||||||||
Source: SNL Securities
| Conversion Valuation Appraisal Report | Page: 32 |
FIGURE 26 – DEPOSITAND DEMOGRAPHIC DATAFOR CAPE MAY COUNTY
| Market: Cape May, NJ | Deposit Data as of 6/30/2005 | |||||||||
Deposits Summary
(Deposit data in $000)
| 6/2001 | 6/2002 | 6/2003 | 6/2004 | 6/2005 | CAGR(%) | |||||||
Bank Deposits | 940,511 | 915,628 | 928,792 | 994,708 | 1,053,717 | 2.88 | ||||||
Thrift Deposits | 443,231 | 552,289 | 667,483 | 703,756 | 743,771 | 13.82 | ||||||
Savings Bank Deposits | 506,498 | 568,658 | 612,841 | 648,706 | 688,286 | 7.97 | ||||||
Credit Union Deposits | 621 | 661 | 0 | 0 | 0 | -100.00 | ||||||
Total Deposits | 1,890,240 | 2,036,575 | 2,209,116 | 2,347,170 | 2,485,774 | 7.09 | ||||||
Weighted Deposits | 1,890,240 | 2,036,575 | 2,209,116 | 2,347,170 | 2,485,774 | 7.09 |
Weighted deposits are calculated based on the branch types selected in your filter and deposit weightings set under preferences.
Demographic Data
| Base 2000 | Current 2005 | Projected 2010 | % Change 2000-2005 | % Change 2005-2010 | ||||||
Total Population: | 102,326 | 112,796 | 126,200 | 10.23 | 11.88 | |||||
0-14 Age Group (%): | 18 | 17 | 15 | -1.13 | 3.10 | |||||
15-34 Age Group (%): | 21 | 21 | 22 | 13.04 | 14.92 | |||||
35-54 Age Group (%): | 29 | 28 | 27 | 6.54 | 6.09 | |||||
55+ Age Group (%): | 32 | 34 | 36 | 18.43 | 19.08 | |||||
Total Households: | 42,148 | 47,109 | 53,165 | 11.77 | 12.86 | |||||
$0-24K Households (%): | 29 | 25 | 22 | -2.35 | -1.58 | |||||
$25-50K Households (%): | 30 | 28 | 25 | 4.02 | 2.99 | |||||
$50K+ Households (%): | 41 | 47 | 53 | 27.25 | 26.40 | |||||
Average Household Income: | 57,755 | 67,949 | 80,698 | 17.65 | 18.76 | |||||
Median Household Income: | 41,660 | 46,862 | 52,822 | 12.49 | 12.72 | |||||
Per Capita Income: | 24,172 | 28,750 | 34,362 | 18.94 | 19.52 | |||||
Source: ESRI | ||||||||||
Source: SNL Securities
FIGURE 27 – DEPOSITAND DEMOGRAPHIC DATAFOR ATLANTIC COUNTY
| Market: Atlantic, NJ | Deposit Data as of 6/30/2005 | |||||||||
Deposits Summary
(Deposit data in $000)
| 6/2001 | 6/2002 | 6/2003 | 6/2004 | 6/2005 | CAGR(%) | |||||||
Bank Deposits | 2,338,281 | 2,760,609 | 2,978,706 | 3,205,546 | 4,100,508 | 15.08 | ||||||
Thrift Deposits | 147,672 | 206,779 | 271,872 | 357,678 | 375,969 | 26.32 | ||||||
Savings Bank Deposits | 289,470 | 109,585 | 121,204 | 123,573 | 128,009 | -18.45 | ||||||
Credit Union Deposits | 100,600 | 120,245 | 133,116 | 137,860 | 135,717 | 7.77 | ||||||
Total Deposits | 2,775,423 | 3,076,973 | 3,371,782 | 3,686,797 | 4,604,486 | 13.49 | ||||||
Weighted Deposits | 2,775,423 | 3,076,973 | 3,371,782 | 3,686,797 | 4,604,486 | 13.49 |
Weighted deposits are calculated based on the branch types selected in your filter and deposit weightings set under preferences.
Demographic Data
| Base 2000 | Current 2005 | Projected 2010 | % Change 2000-2005 | % Change 2005-2010 | ||||||
Total Population: | 252,552 | 270,524 | 290,677 | 7.12 | 7.45 | |||||
0-14 Age Group (%): | 21 | 20 | 19 | 2.20 | 0.10 | |||||
15-34 Age Group (%): | 25 | 25 | 26 | 5.72 | 11.55 | |||||
35-54 Age Group (%): | 31 | 30 | 29 | 6.12 | 3.14 | |||||
55+ Age Group (%): | 23 | 24 | 26 | 14.67 | 14.82 | |||||
Total Households: | 95,024 | 102,009 | 109,710 | 7.35 | 7.55 | |||||
$0-24K Households (%): | 26 | 23 | 21 | -5.41 | -5.04 | |||||
$25-50K Households (%): | 30 | 28 | 26 | -1.29 | -0.16 | |||||
$50K+ Households (%): | 44 | 49 | 54 | 21.05 | 17.85 | |||||
Average Household Income: | 54,678 | 63,129 | 72,323 | 15.46 | 14.56 | |||||
Median Household Income: | 43,991 | 49,020 | 53,594 | 11.43 | 9.33 | |||||
Per Capita Income: | 21,034 | 24,188 | 27,691 | 14.99 | 14.48 | |||||
Source: ESRI | ||||||||||
Source: SNL Securities
| Conversion Valuation Appraisal Report | Page: 33 |
3. Comparisons with Publicly Traded Thrifts
INTRODUCTION
This section presents an analysis of the Bank’s operations against a selected group (“Comparable Group”) of publicly traded Mutual Holding Companies (“MHCs”). The Comparable Group was selected based upon similarity of characteristics to the Bank. The Comparable Group multiples provide the basis for the valuation of the Bank.
Factors that influence the Bank’s value such as balance sheet structure and size, profitability, income and expense trends, capital levels, credit risk, and recent operating results can be measured against the Comparable Group. The Comparable Group’s current market pricing, coupled with the appropriate aggregate adjustment for differences between the Bank and the Comparable Group, will then be utilized as the basis for the pro forma valuation of the Bank’s to-be-issued common stock.
SELECTION CRITERIA
The goal of the selection criteria process is to find those institutions with characteristics that most closely match those of the Bank. In an ideal world, all of the Comparable Group would contain the exact characteristics of the Bank. However, none of the Comparables selected will be exact clones of the Bank.
Based upon our experience, FinPro has determined that MHCs trade at materially different levels relative to fully converted thrifts due to the unique ownership structure. The primary differences between MHCs and fully converted institutions are that MHCs contain a minority interest and have the potential for a second step. In addition, MHCs have the potential for a remutualization transaction. Due to these differences, MHC trading multiples are substantially different from fully converted trading multiples. FinPro concluded that the appropriate Comparable Group should be comprised of liquidly traded MHCs.
| Conversion Valuation Appraisal Report | Page: 34 |
As of the date of this appraisal, there are a total of 66 MHCs nationally. There are 37 traded on the NYSE, NASDAQ or AMEX. FinPro limited the Comparable Group to institutions whose common stock is listed on a major exchange, since these companies tend to trade regularly. FinPro believes that thrifts that trade over-the-counter or as pink sheets are inappropriate for the Comparable Group, due to irregular trading activity and wide bid/ask spreads, which may skew the trading value and make trading multiples less reliable as an indicator of value.
To begin the screening process, FinPro eliminated the 12 MHCs located outside of the Northeast Region.
FinPro excluded institutions that have recently converted, as the earnings of newly converted institutions do not reflect a full year’s benefit from the reinvestment of proceeds, and thus the price/earnings multiples and return on equity measures for these institutions tend to be skewed upward and downward, respectively. As such, the 8 institutions that converted after March 31, 2005 were eliminated.
Of the remaining 17, FinPro then eliminated 3 of the institutions with assets in excess of $2.0 billion as these entities have greater financial and managerial resources and a broader branch network and 3 of the institutions with assets less than $350 million as they have less financial and managerial resources and a smaller branch network.
This results in a total of 11 Comparables. FinPro review the recent performance and news releases of these 11 companies and determined that all 11 were acceptable Comparables.
FIGURE 28 - COMPARABLE GROUP
Ticker | Short Name | Exchange | City | State | Number of Offices | IPO Date | ||||||
| Comparable Thrift Data | ||||||||||||
| ABBC | Abington Community Bancorp, Inc. (MHC) | NASDAQ | Jenkintown | PA | 13 | 12/17/2004 | ||||||
| BCSB | BCSB Bankcorp, Inc. (MHC) | NASDAQ | Baltimore | MD | 18 | 07/08/1998 | ||||||
| CSBK | Clifton Savings Bancorp, Inc. (MHC) | NASDAQ | Clifton | NJ | 10 | 03/04/2004 | ||||||
| ALLB | Greater Delaware Valley Savings Bank (MHC) | NASDAQ | Broomall | PA | 9 | 03/03/1995 | ||||||
| NVSL | Naugatuck Valley Financial Corp. (MHC) | NASDAQ | Naugatuck | CT | 6 | 10/01/2004 | ||||||
| OSHC | Ocean Shore Holding Company (MHC) | NASDAQ | Ocean City | NJ | 7 | 12/22/2004 | ||||||
| ONFC | Oneida Financial Corp. (MHC) | NASDAQ | Oneida | NY | 10 | 12/30/1998 | ||||||
| PBIP | Prudential Bancorp, Inc. of Pennsylvania (MHC) | NASDAQ | Philadelphia | PA | 6 | 03/30/2005 | ||||||
| PSBH | PSB Holdings, Inc. (MHC) | NASDAQ | Putnam | CT | 6 | 10/05/2004 | ||||||
| SIFI | SI Financial Group Inc. (MHC) | NASDAQ | Willimantic | CT | 17 | 10/01/2004 | ||||||
| WFD | Westfield Financial Inc. (MHC) | AMEX | Westfield | MA | 10 | 12/28/2001 | ||||||
| Fox Chase Bank | Hatboro | PA | 9 | |||||||||
| Conversion Valuation Appraisal Report | Page: 35 |
BASISFOR COMPARISON
MHCs have different percentages of minority ownership. In order to adjust for this factor, all of the Comparables’ pricing multiples are represented as if the MHC undertook a second step, based upon standardized assumptions. These multiples will be referred to as “fully converted” pricing multiples.
OVERVIEWOFTHE COMPARABLES
The members of the Comparable Group were reviewed against the Bank to ensure comparability based upon the following criteria:
| 1. | Asset size |
| 2. | Profitability |
| 3. | Capital Level |
| 4. | Balance Sheet Mix |
| 5. | Operating Strategy |
| 6. | Date of conversion |
1. Asset Size The Comparable Group should have a similar asset size to the Bank. The Comparable Group ranged in size from $366.2 million to $855.4 million in total assets with a median of $556.8 million. The Bank’s asset size was $754.1 million as of March 31, 2006. On a pro forma basis, the Bank’s assets are projected to be $794.3 million at the midpoint of the estimated value range.
2. Profitability The Comparable Group had a median ROAA of 0.60% and a median ROAE of 4.31% for the last twelve months. The Comparable Group profitability measures had a dispersion about the mean for the ROAA measure ranging from a low of 0.05% to a high of 0.88%, while the ROAE measure ranged from a low of 0.93% to a high of 7.18%. The Bank had a core ROAA of 0.21% and a core ROAE of 2.66% for the twelve months ended March 31, 2006. On a pro forma basis, the Bank’s core ROAA and core ROAE are 0.25% and 1.84%, respectively.
| Conversion Valuation Appraisal Report | Page: 36 |
3. Capital Level The Comparable Group had a median equity to assets ratio of 12.76% with a high of 23.75% and a low of 5.01%. At March 31, 2006, the Bank had an equity to assets ratio of 8.39%. On a pro forma basis, at the midpoint, the Bank would have an equity to assets ratio of 13.03%.
4. Balance Sheet Mix At March 31, 2006, the Bank had a net loan to asset ratio of 47.18%. The median loan to asset ratio for the Comparables was 56.51%, ranging from a low of 41.76% to a high of 75.09%. On the liability side, the Bank’s deposit to asset ratio was 86.98% at March 31, 2006 while the Comparable median was 73.61%, ranging from 59.97% to 77.69%. The Bank’s borrowing to asset ratio of 3.98% is below the Comparable median of 13.75%.
5. Operating Strategy An institution’s operating characteristics are important because they determine future performance. Operational strategy also affects expected rates of return and investor’s general perception of the quality, risk and attractiveness of a given company. Specific operating characteristics include profitability, balance sheet growth, asset quality, capitalization and non-financial factors such as management strategies and lines of business.
6. Date of Conversion Recent conversions, those completed on or after March 31, 2005, were excluded since the earnings of a newly converted institution do not reflect the reinvestment of conversion proceeds. Additionally, new issues tend to trade at a discount to the market averages.
| Conversion Valuation Appraisal Report | Page: 37 |
The following table represents key financial indicators for the Bank and the Comparable Group.
FIGURE 29 - KEY FINANCIAL INDICATORS
The Bank at or for the Twelve Months Ended 3/31/06 | Comparable Group Median Last Twelve Months | ||||
Balance Sheet Data | |||||
Gross Loans to Deposits | 55.51 | 76.24 | |||
Total Net Loans to Assets | 47.18 | 56.51 | |||
Securities to Assets | 43.64 | 39.81 | |||
Deposits to Assets | 86.98 | 73.61 | |||
Borrowed Funds to Assets | 3.98 | 13.75 | |||
Balance Sheet Growth | |||||
Asset Growth Rate | (14.30 | ) | 4.77 | ||
Loan Growth Rate | (26.30 | ) | 16.10 | ||
Deposit Growth Rate | (17.10 | ) | 3.77 | ||
Capital | |||||
Equity to Assets | 8.39 | 12.76 | |||
Tangible Equity to Tangible Assets | 8.39 | 11.46 | |||
Intangible Assets to Equity | — | — | |||
Regulatory Core Capital to Assets | 8.72 | 9.93 | |||
Equity + Reserves to Assets | 9.50 | 13.24 | |||
Asset Quality | |||||
Non-Performing Loans to Loans | 1.26 | 0.06 | |||
Reserves to Non-Performing Loans | 186.22 | 409.84 | |||
Non-Performing Assets to Assets | 0.59 | 0.09 | |||
Non-Performing Assets to Equity | 7.06 | 0.64 | |||
Reserves to Loans | 2.27 | 0.71 | |||
Reserves to Non-Performing Assets + 90 Days Del. | 186.82 | 360.34 | |||
Profitability | |||||
Return on Average Assets | 0.61 | 0.60 | |||
Return on Average Equity | 6.91 | 4.31 | |||
Income Statement | |||||
Yield on Average Earning Assets | 4.59 | 5.43 | |||
Cost of Average Interest Bearing Liabilities | 2.86 | 2.69 | |||
Net Interest Spread | 1.72 | 2.74 | |||
Net Interest Margin | 2.02 | 3.00 | |||
Noninterest Income to Average Assets | 0.15 | 0.42 | |||
Noninterest Expense to Average Assets | 1.93 | 2.31 | |||
Efficiency Ratio | 95.14 | 75.50 | |||
Overhead Ratio | 94.76 | 65.57 | |||
Source: The Bank’s Offering Circular, FinPro calculations and SNL Securities
| Conversion Valuation Appraisal Report | Page: 38 |
4. Market Value Determination
MARKET VALUE ADJUSTMENTS
The estimated pro forma market value of the Bank, along with certain adjustments to its value relative to market values for the Comparable Group are delineated in this section. The adjustments are made from potential investors’ viewpoint and are adjustments necessary when comparing the Bank to the Comparable Group. The adjustment factors are subjectively assessed using the appraiser’s knowledge and expertise and an aggregate adjustment is determined. Potential investors include depositors holding subscription rights and unrelated parties who may purchase stock in the community offering and who are assumed to be aware of all relevant and necessary facts as they pertain to the value of the Bank relative to other publicly traded thrift institutions and relative to alternative investment opportunities.
There are numerous criteria on which the market value adjustments are based. The major criteria utilized for purposes of this report include:
Adjustments Relative to the Comparable Group:
| • | Financial Condition |
| • | Balance Sheet Growth |
| • | Earnings Quality, Predictability and Growth |
| • | Market Area |
| • | Cash Dividends |
| • | Liquidity of the Issue |
| • | Recent Regulatory Matters |
Adjustments for Other Factors:
| • | Management |
| • | Subscription Interest |
To ascertain the market value of the Bank, the median trading multiple values for the Comparable Group are utilized as the starting point. The adjustment, up or down, to the Comparable Group median multiple values is made based on the comparison of the Bank to the Comparable Group.
| Conversion Valuation Appraisal Report | Page: 39 |
FINANCIAL CONDITION
The balance sheet strength of an institution is an important market value determinant, as the investment community considers such factors as cash liquidity, capitalization, asset composition, funding mix, intangible levels and interest rate risk in assessing the attractiveness of investing in the common stock of a thrift. The following figures summarize the key financial elements of the Bank measured against the Comparable Group.
FIGURE 30 - KEY BALANCE SHEET DATA
| Key Financial Data for the Most Recent Period End | |||||||||||||||||
Ticker | Short Name | Total Assets ($ 000) | Loans/ Deposits (%) | Loans/ Assets (%) | Securities/ Assets (%) | Deposits/ Assets (%) | Borrowings/ Assets (%) | ||||||||||
| Comparable Thrift Data | |||||||||||||||||
ABBC | Abington Community Bancorp, Inc. (MHC) | 855,442 | 103.60 | 62.13 | 29.68 | 59.97 | 25.34 | ||||||||||
BCSB | BCSB Bankcorp, Inc. (MHC) | 812,622 | 75.68 | 56.51 | 35.50 | 74.67 | 19.52 | ||||||||||
CSBK | Clifton Savings Bancorp, Inc. (MHC) | 837,427 | 69.89 | 47.88 | 48.18 | 68.50 | 7.01 | ||||||||||
ALLB | Greater Delaware Valley Savings Bank (MHC) | 389,035 | 76.24 | 58.34 | 31.66 | 76.53 | 13.50 | ||||||||||
NVSL | Naugatuck Valley Financial Corp. (MHC) | 366,153 | 103.93 | 72.42 | NA | 69.69 | 15.43 | ||||||||||
OSHC | Ocean Shore Holding Company (MHC) | 556,813 | 98.92 | 75.09 | NA | 75.91 | 12.12 | ||||||||||
ONFC | Oneida Financial Corp. (MHC) | 425,893 | 77.78 | 55.66 | NA | 71.57 | 14.89 | ||||||||||
PBIP | Prudential Bancorp, Inc. of Pennsylvania (MHC) | 447,283 | 55.22 | 41.76 | 52.85 | 75.64 | 3.09 | ||||||||||
PSBH | PSB Holdings, Inc. (MHC) | 429,749 | 63.84 | 43.06 | 49.84 | 67.44 | 20.24 | ||||||||||
SIFI | SI Financial Group Inc. (MHC) | 691,868 | 101.60 | 74.79 | 18.16 | 73.61 | 13.75 | ||||||||||
WFD | Westfield Financial Inc. (MHC) | 822,571 | 60.42 | 46.94 | 44.12 | 77.69 | 7.41 | ||||||||||
| Average | 603,169 | 80.65 | 57.69 | 38.75 | 71.93 | 13.85 | |||||||||||
| Median | 556,813 | 76.24 | 56.51 | 39.81 | 73.61 | 13.75 | |||||||||||
| Maximum | 855,442 | 103.93 | 75.09 | 52.85 | 77.69 | 25.34 | |||||||||||
| Minimum | 366,153 | 55.22 | 41.76 | 18.16 | 59.97 | 3.09 | |||||||||||
| Fox Chase Bank | 754,050 | 55.51 | 47.18 | 43.64 | 86.98 | 3.98 | |||||||||||
| Variance to the Comparable Median | 197,237 | (20.73 | ) | (9.33 | ) | 3.83 | 13.37 | (9.77 | ) | ||||||||
Sources: SNL and Offering Circular Data, FinPro Computations
Asset Size – The Bank, at $754.1 million, is larger than the Comparable Group median of $556.8 million. At the pro forma midpoint of the offering range, the Bank is expected to have assets of $794.3 million.
Asset Composition - The Bank’s net loans to assets ratio of 47.18% is below the Comparable Group median of 56.51%. The Bank has a higher level of securities as a percentage of assets.
Funding Mix – The Bank funds itself through deposits, 86.98% of assets and borrowings, 3.98% of assets. The Comparable Group has a deposits to assets ratio of 73.61% and a borrowing to asset ratio of 13.75%.
| Conversion Valuation Appraisal Report | Page: 40 |
Cash Liquidity - The cash liquidity of the Bank and the Comparable Group appear to be sufficient to meet funding requirements and regulatory guidelines.
Interest Rate Risk - The Bank’s interest rate risk position is illustrated on page 19. The Bank’s profile appears to be within acceptable regulatory parameters. No similar data is available for the Comparable Group.
FIGURE 31 - CAPITAL DATA
| Capital for the Most Recent Period End | ||||||||||||||||
Ticker | Short Name | Equity/ Assets (%) | Tangible Equity/ Tang Assets (%) | Intangible Assets/ Equity (%) | Core Capital/ Tangible Assets (%) | Equity + Reserves/ Assets (%) | ||||||||||
| Comparable Thrift Data | ||||||||||||||||
| ABBC | Abington Community Bancorp, Inc. (MHC) | 13.49 | 13.49 | — | 10.55 | 13.66 | ||||||||||
| BCSB | BCSB Bankcorp, Inc. (MHC) | 5.01 | 4.71 | 6.34 | 6.88 | 5.33 | ||||||||||
| CSBK | Clifton Savings Bancorp, Inc. (MHC) | 23.75 | 23.75 | — | 17.21 | 23.90 | ||||||||||
| ALLB | Greater Delaware Valley Savings Bank (MHC) | 8.77 | 8.77 | — | 9.02 | 9.46 | ||||||||||
| NVSL | Naugatuck Valley Financial Corp. (MHC) | 13.97 | 13.92 | 0.42 | NA | 14.50 | ||||||||||
| OSHC | Ocean Shore Holding Company (MHC) | 11.01 | 11.01 | — | NA | 11.34 | ||||||||||
| ONFC | Oneida Financial Corp. (MHC) | 12.76 | 9.58 | 27.57 | NA | 13.24 | ||||||||||
| PBIP | Prudential Bancorp, Inc. of Pennsylvania (MHC) | 20.48 | 20.48 | — | 20.44 | 20.60 | ||||||||||
| PSBH | PSB Holdings, Inc. (MHC) | 11.62 | 9.87 | 16.69 | NA | 11.96 | ||||||||||
| SIFI | SI Financial Group Inc. (MHC) | 11.57 | 11.46 | 1.02 | 9.31 | 12.10 | ||||||||||
| WFD | Westfield Financial Inc. (MHC) | 13.98 | 13.98 | — | NA | 14.65 | ||||||||||
| Average | 13.31 | 12.82 | 4.73 | 12.24 | 13.70 | |||||||||||
| Median | 12.76 | 11.46 | — | 9.93 | 13.24 | |||||||||||
| Maximum | 23.75 | 23.75 | 27.57 | 20.44 | 23.90 | |||||||||||
| Minimum | 5.01 | 4.71 | — | 6.88 | 5.33 | |||||||||||
| Fox Chase Bank | 8.39 | 8.39 | — | 8.72 | 9.50 | |||||||||||
| Variance to the Comparable Median | (4.37 | ) | (3.07 | ) | — | (1.21 | ) | (3.74 | ) | |||||||
Sources: SNL and Offering Circular Data, FinPro Computations
Capitalization - The Comparable Group’s median equity to assets ratio of 12.76% is above the Bank’s ratio of 8.39%. The Bank’s pro forma equity to assets ratio is projected to be 13.03% at the midpoint of the valuation range.
Intangible Levels - An important factor influencing market values is the level of intangibles that an institution carries on its books. Three of the Comparables have intangible assets. The Bank does not have any intangible assets.
| Conversion Valuation Appraisal Report | Page: 41 |
The asset quality of an institution is an important determinant of market value. The investment community considers levels of nonperforming loans, Real Estate Owned (“REO”) and levels of Allowance for Loan and Lease Losses (“ALLL”) in assessing the attractiveness of investing in the common stock of an institution.
FIGURE 32 - ASSET QUALITY TABLE
| Asset Quality for the Most Recent Period End | ||||||||||||||||
Ticker | Short Name | NPLs/ Loans (%) | Reserves/ NPLs (%) | NPAs/ Assets (%) | NPAs/ Equity (%) | Reserves/ Loans (%) | Reserves/ NPAs + 90 (%) | |||||||||
| Comparable Thrift Data | ||||||||||||||||
| ABBC | Abington Community Bancorp, Inc. (MHC) | 0.04 | 721.50 | 0.02 | 0.17 | 0.27 | 370.00 | |||||||||
| BCSB | BCSB Bankcorp, Inc. (MHC) | 0.14 | 409.84 | 0.09 | 1.84 | 0.57 | 350.67 | |||||||||
| CSBK | Clifton Savings Bancorp, Inc. (MHC) | 0.01 | NM | — | 0.02 | 0.31 | NM | |||||||||
| ALLB | Greater Delaware Valley Savings Bank (MHC) | 0.43 | 271.34 | 0.71 | 8.14 | 1.18 | 71.49 | |||||||||
| NVSL | Naugatuck Valley Financial Corp. (MHC) | NA | NA | 0.11 | 0.79 | 0.73 | 482.59 | |||||||||
| OSHC | Ocean Shore Holding Company (MHC) | 0.07 | 609.03 | 0.05 | 0.49 | 0.44 | 609.03 | |||||||||
| ONFC | Oneida Financial Corp. (MHC) | NA | NA | NA | NA | 0.87 | NA | |||||||||
| PBIP | Prudential Bancorp, Inc. of Pennsylvania (MHC) | — | NM | 0.08 | 0.39 | 0.30 | 79.71 | |||||||||
| PSBH | PSB Holdings, Inc. (MHC) | 0.04 | NM | 0.02 | 0.14 | 0.80 | NM | |||||||||
| SIFI | SI Financial Group Inc. (MHC) | 0.06 | NM | 0.09 | 0.80 | 0.71 | 574.49 | |||||||||
| WFD | Westfield Financial Inc. (MHC) | 0.54 | 266.59 | 0.25 | 1.80 | 1.43 | 266.59 | |||||||||
| Average | 0.15 | 455.66 | 0.14 | 1.46 | 0.69 | 350.57 | ||||||||||
| Median | 0.06 | 409.84 | 0.09 | 0.64 | 0.71 | 360.34 | ||||||||||
| Maximum | 0.54 | 721.50 | 0.71 | 8.14 | 1.43 | 609.03 | ||||||||||
| Minimum | — | 266.59 | — | 0.02 | 0.27 | 71.49 | ||||||||||
| Fox Chase Bank | 1.26 | 186.82 | 0.59 | 7.06 | 2.27 | 186.82 | ||||||||||
| Variance to the Comparable Median | 1.20 | (172.65 | ) | 0.51 | 6.42 | 1.56 | (173.51 | ) | ||||||||
Sources: SNL and Offering Circular Data, FinPro Computations
The Bank’s level of nonperforming loans (“NPL”) to total loans, at 1.26%, is above the Comparable Group median at 0.06%. The Bank had a nonperforming assets to assets ratio of 0.59%, which is above the Comparable median of 0.09%. The Bank’s reserve level, 2.27% is total loans, is above the Comparable median of 0.71% of loans. The Bank’s level of reserves to NPLs is below that of the Comparable Group, due to the Bank’s higher level of NPLs.
| Conversion Valuation Appraisal Report | Page: 42 |
Positive | Neutral | Negative | ||
| Lower Borrowings to Assets | Lower Loans to Assets | |||
| Higher Deposits to Assets | Lower Capital | |||
| Higher ALLL to Loans | Higher NPLs | |||
| Higher Pro forma Tangible Capital | Higher NPAs | |||
| Lower ALLL to NPLs | ||||
The Bank’s asset mix is not as strong as the Comparable Group’s mix. The Bank has a higher level of deposits and lower level of borrowings as a percentage of assets relative to the Comparable Group. The Bank has lower capital levels, but at the midpoint of the range will have higher tangible capital levels after the reorganization. The Bank has a higher level of NPLs and NPAs, but also has a higher level of reserves as a percentage of loans relative to the Comparable levels. The Bank’s ALLL to NPLs ratio is below the Comparable Group median. Taken collectively, moderate downward adjustment is warranted for financial condition.
| Conversion Valuation Appraisal Report | Page: 43 |
BALANCE SHEET GROWTH
The Bank’s assets, loans and deposits have decreased, while the Comparable Group experienced growth. A portion of the decline in balance sheet size is attributable to the restrictions of the Order to Cease and Desist.
FIGURE 33 - BALANCE SHEET GROWTH DATA
| Growth | |||||||||||
Ticker | Short Name | Asset Growth LTM (%) | Loan Growth LTM (%) | Deposit Growth LTM (%) | |||||||
| Comparable Thrift Data | |||||||||||
| ABBC | Abington Community Bancorp, Inc. (MHC) | 14.34 | 27.54 | 21.57 | |||||||
| BCSB | BCSB Bankcorp, Inc. (MHC) | 4.77 | 16.10 | 3.58 | |||||||
| CSBK | Clifton Savings Bancorp, Inc. (MHC) | 0.68 | 19.37 | 3.95 | |||||||
| ALLB | Greater Delaware Valley Savings Bank (MHC) | 1.81 | 6.90 | 3.77 | |||||||
| NVSL | Naugatuck Valley Financial Corp. (MHC) | 29.32 | 24.81 | 31.18 | |||||||
| OSHC | Ocean Shore Holding Company (MHC) | 4.66 | 19.94 | 1.54 | |||||||
| ONFC | Oneida Financial Corp. (MHC) | 0.82 | 9.99 | 0.42 | |||||||
| PBIP | Prudential Bancorp, Inc. of Pennsylvania (MHC) | 10.44 | 20.70 | (2.79 | ) | ||||||
| PSBH | PSB Holdings, Inc. (MHC) | 29.56 | 15.83 | 27.28 | |||||||
| SIFI | SI Financial Group Inc. (MHC) | 10.76 | 14.69 | 11.26 | |||||||
| WFD | Westfield Financial Inc. (MHC) | 2.86 | 2.31 | 3.76 | |||||||
| Average | 10.00 | 16.20 | 9.59 | ||||||||
| Median | 4.77 | 16.10 | 3.77 | ||||||||
| Maximum | 29.56 | 27.54 | 31.18 | ||||||||
| Minimum | 0.68 | 2.31 | (2.79 | ) | |||||||
| Fox Chase Bank | (14.30 | ) | (26.30 | ) | (17.10 | ) | |||||
| Variance to the Comparable Median | (19.07 | ) | (42.40 | ) | (20.87 | ) | |||||
Sources: SNL and Offering Circular Data, FinPro Computations
Positive | Neutral | Negative | ||
| Lower Asset Growth | ||||
| Lower Loan Growth | ||||
| Lower Deposit Growth | ||||
A strong downward adjustment is warranted.
| Conversion Valuation Appraisal Report | Page: 44 |
EARNINGS QUALITY, PREDICTABILITYAND GROWTH
The earnings quality, predictability and growth are critical components in the establishment of market values for thrifts. Thrift earnings are primarily a function of:
| • | net interest income |
| • | loan loss provision |
| • | non-interest income |
| • | non-interest expense |
The quality and predictability of earnings is dependent on both internal and external factors. Some internal factors include the mix of the balance sheet, the interest rate sensitivity of the balance sheet, the asset quality, and the infrastructure in place to deliver the assets and liabilities to the public. External factors include the competitive market for both assets and liabilities, the global interest rate scenario, local economic factors and regulatory issues.
Investors are focusing on earnings sustainability as interest rate volatility has caused a wide variation in income levels. With the intense competition for both assets and deposits, banks cannot easily replace lost spread and margin with balance sheet growth.
Each of these factors can influence the earnings of an institution, and each of these factors is volatile. Investors prefer stability and consistency. As such, solid, consistent earnings are preferred to high but risky earnings. Investors also prefer earnings to be diversified and not entirely dependent on interest income.
| Conversion Valuation Appraisal Report | Page: 45 |
The Bank’s annual net income increased between the twelve months ended December 31, 2001 and the twelve months ended December 31, 2003. The increase during this time period was primarily a function of rising net interest income and noninterest income. Noninterest expense and income tax expense also increased to a lesser extent.
The Bank posted a $1.9 million net loss during the twelve months ended December 31, 2004. The loss was primarily a function of a $12.3 million posting of provision expense. The Bank posted a $6.0 million profit for the twelve months ended December 31, 2005. During the twelve months ended December 31, 2005, the Bank recaptured $6.0 million in provision expense. The change in net income/(loss) between the 2004 and 2005 fiscal years was primarily attributable to the $18.3 million change in provision expense. Additionally, between the twelve months ended December 31, 2004 and the twelve months ended December 31, 2005, net interest income declined $969 thousand, noninterest income declined $1.0 million, noninterest expense rose $3.9 million and provision for income tax expense rose $4.6 million.
For the three months ended March 31, 2006 compared to three months ended March 31, 2005, net income declined $899 thousand or 77.04%. The decline was primarily attributable to a decline in net interest income of $989 thousand and an increase in noninterest expense of $398 thousand. These factors were partially offset by a $454 thousand decline in provision for income tax expense.
FIGURE 34 - NET INCOME CHART
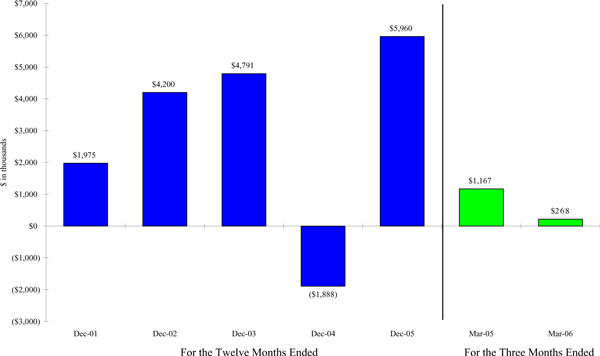
Source: Offering Prospectus
| Conversion Valuation Appraisal Report | Page: 46 |
The Bank’s ROAA is at the Comparable Group median, and ROAE is above the Comparable Group median. However, the Bank’s core ROAA and ROAE of 0.21% and 2.66%, respectively, are below the Comparable levels. The Bank’s higher capitalization following the offering is expected to reduce return on equity for the near term.On a pro forma basis, the Bank’s core ROAA and core ROAE are 0.25% and 1.84%, respectively.
FIGURE 35 - PROFITABILITY DATA
| LTM Profitability | ||||||
Ticker | Short Name | Return on Avg Assets (%) | Return on Avg Equity (%) | |||
| Comparable Thrift Data | ||||||
| ABBC | Abington Community Bancorp, Inc. (MHC) | 0.80 | 5.61 | |||
| BCSB | BCSB Bankcorp, Inc. (MHC) | 0.05 | 0.93 | |||
| CSBK | Clifton Savings Bancorp, Inc. (MHC) | 0.51 | 2.14 | |||
| ALLB | Greater Delaware Valley Savings Bank (MHC) | 0.30 | 3.39 | |||
| NVSL | Naugatuck Valley Financial Corp. (MHC) | 0.60 | 3.80 | |||
| OSHC | Ocean Shore Holding Company (MHC) | 0.55 | 4.98 | |||
| ONFC | Oneida Financial Corp. (MHC) | 0.88 | 7.18 | |||
| PBIP | Prudential Bancorp, Inc. of Pennsylvania (MHC) | 0.86 | 4.78 | |||
| PSBH | PSB Holdings, Inc. (MHC) | 0.61 | 4.31 | |||
| SIFI | SI Financial Group Inc. (MHC) | 0.52 | 4.19 | |||
| WFD | Westfield Financial Inc. (MHC) | 0.74 | 5.14 | |||
| Average | 0.58 | 4.22 | ||||
| Median | 0.60 | 4.31 | ||||
| Maximum | 0.88 | 7.18 | ||||
| Minimum | 0.05 | 0.93 | ||||
| Fox Chase Bank | 0.61 | 7.91 | ||||
| Variance to the Comparable Median | 0.00 | 2.64 | ||||
Sources: SNL and Offering Circular Data, FinPro Computations
| Conversion Valuation Appraisal Report | Page: 47 |
FIGURE 36 - INCOME STATEMENT DATA
| LTM Income Statement | |||||||||||||||||||||||
Ticker | Short Name | Yield on Ave Earn Assets (%) | Cost of Funds (%) | Net Interest Spread (%) | Net Interest Margin (%) | Noninterest Income/ Avg Assets (%) | Noninterest Expense/ Avg Assets (%) | Efficiency Ratio (%) | Overhead Ratio (%) | ||||||||||||||
| Comparable Thrift Data | |||||||||||||||||||||||
| ABBC | Abington Community Bancorp, Inc. (MHC) | 5.43 | NA | NA | 2.77 | 0.36 | 1.85 | 62.15 | 56.92 | ||||||||||||||
| BCSB | BCSB Bankcorp, Inc. (MHC) | NA | NA | NA | 2.08 | 0.19 | 2.17 | 98.93 | 98.83 | ||||||||||||||
| CSBK | Clifton Savings Bancorp, Inc. (MHC) | 4.24 | NA | NA | 2.25 | 0.03 | 1.37 | 61.96 | 61.40 | ||||||||||||||
| ALLB | Greater Delaware Valley Savings Bank (MHC) | 5.43 | 2.69 | 2.74 | 3.00 | 0.34 | 2.83 | 88.23 | 86.82 | ||||||||||||||
| NVSL | Naugatuck Valley Financial Corp. (MHC) | NA | NA | NA | 3.70 | 0.48 | 3.14 | 80.71 | 77.97 | ||||||||||||||
| OSHC | Ocean Shore Holding Company (MHC) | 5.42 | 2.69 | 2.73 | 3.06 | 0.42 | 2.26 | 70.04 | 65.57 | ||||||||||||||
| ONFC | Oneida Financial Corp. (MHC) | 5.58 | NA | NA | 3.46 | 2.78 | 4.61 | 78.84 | 59.46 | ||||||||||||||
| PBIP | Prudential Bancorp, Inc. of Pennsylvania (MHC) | 5.10 | NA | NA | 2.84 | 0.13 | 1.59 | 54.83 | 52.71 | ||||||||||||||
| PSBH | PSB Holdings, Inc. (MHC) | NA | NA | NA | 2.94 | 0.50 | 2.49 | 75.50 | 71.12 | ||||||||||||||
| SIFI | SI Financial Group Inc. (MHC) | 5.54 | 2.35 | 3.19 | 3.56 | 0.95 | 3.47 | 80.15 | 74.52 | ||||||||||||||
| WFD | Westfield Financial Inc. (MHC) | 5.05 | NA | NA | 3.10 | 0.43 | 2.31 | 69.09 | 64.56 | ||||||||||||||
| Average | 5.22 | 2.58 | 2.89 | 2.98 | 0.60 | 2.55 | 74.58 | 69.99 | |||||||||||||||
| Median | 5.43 | 2.69 | 2.74 | 3.00 | 0.42 | 2.31 | 75.50 | 65.57 | |||||||||||||||
| Maximum | 5.58 | 2.69 | 3.19 | 3.70 | 2.78 | 4.61 | 98.93 | 98.83 | |||||||||||||||
| Minimum | 4.24 | 2.35 | 2.73 | 2.08 | 0.03 | 1.37 | 54.83 | 52.71 | |||||||||||||||
| Fox Chase Bank | 4.59 | 2.86 | 1.72 | 2.02 | 0.15 | 1.93 | 95.14 | 94.76 | |||||||||||||||
| Variance to the Comparable Median | (0.60 | ) | 0.17 | (0.78 | ) | (0.95 | ) | (0.27 | ) | (0.41 | ) | 19.64 | 29.19 | ||||||||||
Sources: SNL and Offering Circular Data, FinPro Computations
Note: The data for cost of funds and spread are not meaningful due to the lack of Comparable Data.
The Bank has a 98 basis point disadvantage in net margin. Additionally, the Bank has a 27 basis point disadvantage in noninterest income. These differences are partially offset by a 39 basis point advantage in noninterest expense.
The Bank’s efficiency ratio of 95.14% is above the Comparable median of 75.50%.
On a forward looking basis, after the conversion the Bank’s operating expenses are expected to rise as a result of the stock benefit plans and additional costs of being a public company. At the same time, the Bank will have additional capital to deploy and leverage.
| Conversion Valuation Appraisal Report | Page: 48 |
Positive | Neutral | Negative | ||
Lower Noninterest Expense | Lower core ROAA | |||
| Lower core ROAE | ||||
| Lower Pro Forma ROAE | ||||
| Lower Net Margin | ||||
| Lower Noninterest Income | ||||
The Bank is less profitable than the Comparables on a core ROAA and core ROAE basis. The Bank’s earnings composition is weaker than the Comparable Group as the Bank has a lower net margin and lower noninterest income. However, the Bank has a lower noninterest expense. The Bank’s historical earnings have been inconsistent. Taken collectively, a strong downward adjustment is warranted for this factor.
| Conversion Valuation Appraisal Report | Page: 49 |
MARKETAREA
The market area that an institution serves has a significant impact on value, as future success is interrelated with the economic, demographic and competitive aspects of the market. The location of an institution will have an impact on the trading value of an institution, as many analysts compare the pricing of institutions relative to a state or regional multiples in investor presentations.
The following figure compares the demographic and competitive data for the counties serviced by the Bank, to the county data of the Comparable Group members.
| Conversion Valuation Appraisal Report | Page: 50 |
FIGURE 37 – MARKET AREA DATA
County | Bank’s Deps in the County | Bank’s Deposit | Number Branches | Total Population (actual) | Population | Population | Median HH Income ($) | HH Income | Unemp. Rate (%) | |||||||||||||||||
Institution Name | Change 2000-2005 (%) | Change 2005-2010 (%) | Change 2000-2005 (%) | Change 2005-2010 (%) | ||||||||||||||||||||||
Abington Community Bancorp, Inc. (MHC) | Montgomery | 457,581 | 2.57 | 354 | 775,046 | 2,189 | 3.33 | 2.96 | 75,725 | 24.41 | 24.30 | 3.30 | ||||||||||||||
Abington Community Bancorp, Inc. (MHC) | Bucks | 20,902 | 0.19 | 247 | 622,564 | 2,521 | 4.17 | 3.87 | 73,522 | 23.10 | 21.65 | 3.60 | ||||||||||||||
Deposit Weighted Market Data | 2.47 | 2,204 | 3.37 | 3.00 | 75,629 | 24.35 | 24.18 | 3.31 | ||||||||||||||||||
BCSB Bankcorp, Inc. (MHC) | Baltimore | 460,404 | 3.42 | 285 | 789,038 | 2,769 | 4.61 | 4.98 | 57,839 | 14.07 | 15.19 | 3.70 | ||||||||||||||
BCSB Bankcorp, Inc. (MHC) | Harford | 104,475 | 4.31 | 82 | 239,907 | 2,926 | 9.75 | 9.60 | 64,564 | 13.18 | 14.19 | 3.40 | ||||||||||||||
BCSB Bankcorp, Inc. (MHC) | Howard | 27,948 | 0.82 | 74 | 271,796 | 3,673 | 9.67 | 9.01 | 86,586 | 16.72 | 18.86 | 2.50 | ||||||||||||||
BCSB Bankcorp, Inc. (MHC) | Baltimore (City) | 10,181 | 0.07 | 129 | 629,541 | 4,880 | (3.32 | ) | (2.29 | ) | 33,614 | 11.76 | 11.55 | 6.30 | ||||||||||||
Deposit Weighted Market Data | 3.40 | 2,873 | 5.60 | 5.84 | 59,927 | 14.00 | 15.13 | 3.64 | ||||||||||||||||||
First Bancorp of Indiana, Inc. | Vanderburgh | 191,278 | 5.62 | 57 | 172,943 | 3,034 | 0.59 | 0.95 | 41,299 | 12.19 | 11.67 | 4.90 | ||||||||||||||
First Bancorp of Indiana, Inc. | Warrick | 5,471 | 1.13 | 14 | 55,643 | 3,975 | 6.22 | 5.46 | 54,076 | 10.87 | 12.72 | 4.40 | ||||||||||||||
Deposit Weighted Market Data | 5.50 | 3,060 | 0.75 | 1.08 | 41,654 | 12.15 | 11.70 | 4.89 | ||||||||||||||||||
Clifton Savings Bancorp, Inc. (MHC) | Passaic | 459,537 | 5.14 | 150 | 505,860 | 3,372 | 3.44 | 3.57 | 55,643 | 13.07 | 13.37 | 5.40 | ||||||||||||||
Clifton Savings Bancorp, Inc. (MHC) | Bergen | 111,373 | 0.34 | 484 | 902,287 | 1,864 | 2.06 | 1.93 | 76,516 | 17.87 | 16.20 | 3.60 | ||||||||||||||
Deposit Weighted Market Data | 4.20 | 3,078 | 3.17 | 3.25 | 59,715 | 14.01 | 13.92 | 5.05 | ||||||||||||||||||
Greater Delaware Valley Savings Bank (MHC) | Delaware | 281,429 | 3.36 | 177 | 564,067 | 3,187 | 2.40 | 3.06 | 62,297 | 24.34 | 23.15 | 3.90 | ||||||||||||||
Greater Delaware Valley Savings Bank (MHC) | Chester | 13,687 | 0.18 | 185 | 471,098 | 2,546 | 8.67 | 8.17 | 81,043 | 25.00 | 27.48 | 3.00 | ||||||||||||||
Deposit Weighted Market Data | 3.21 | 3,157 | 2.69 | 3.30 | 63,166 | 24.37 | 23.35 | 3.86 | ||||||||||||||||||
Naugatuck Valley Financial Corp. (MHC) | New Haven | 199,851 | 1.20 | 268 | 845,412 | 3,155 | 2.60 | 2.95 | 56,802 | 16.32 | 15.83 | 4.70 | ||||||||||||||
Naugatuck Valley Financial Corp. (MHC) | Fairfield | 21,612 | 0.10 | 339 | 910,228 | 2,685 | 3.13 | 3.36 | 80,439 | 23.99 | 26.23 | 3.80 | ||||||||||||||
Deposit Weighted Market Data | 1.09 | 3,109 | 2.65 | 2.99 | 59,109 | 17.07 | 16.84 | 4.61 | ||||||||||||||||||
Ocean Shore Holding Company (MHC) | Cape May | 235,487 | 9.47 | 58 | 112,796 | 1,945 | 10.23 | 11.88 | 46,862 | 12.49 | 12.72 | 8.40 | ||||||||||||||
Ocean Shore Holding Company (MHC) | Atlantic | 197,989 | 4.30 | 82 | 270,524 | 3,299 | 7.12 | 7.45 | 49,020 | 11.43 | 9.33 | 5.60 | ||||||||||||||
Deposit Weighted Market Data | 7.11 | 2,563 | 8.81 | 9.86 | 47,848 | 12.01 | 11.17 | 7.12 | ||||||||||||||||||
Oneida Financial Corp. (MHC) | Madison | 301,480 | 40.84 | 21 | 70,473 | 3,356 | 1.49 | 0.56 | 45,756 | 13.87 | 13.11 | 5.10 | ||||||||||||||
Oneida Financial Corp. (MHC) | Oneida | 20,542 | 0.55 | 68 | 236,373 | 3,476 | 0.38 | 1.37 | 40,924 | 13.98 | 13.19 | 4.60 | ||||||||||||||
Oneida Financial Corp. (MHC) | Onondaga | 4,946 | 0.07 | 146 | 465,053 | 3,185 | 1.47 | 2.25 | 47,339 | 15.81 | 15.36 | 4.40 | ||||||||||||||
Deposit Weighted Market Data | 37.69 | 3,361 | 1.42 | 0.64 | 45,476 | 13.91 | 13.15 | 5.06 | ||||||||||||||||||
Prudential Bancorp, Inc. of Pennsylvania (MHC) | Philadelphia | 334,009 | 0.94 | 335 | 1,484,645 | 4,432 | (2.17 | ) | (1.58 | ) | 36,853 | 19.73 | 20.19 | 6.00 | ||||||||||||
Prudential Bancorp, Inc. of Pennsylvania (MHC) | Delaware | 23,248 | 0.28 | 177 | 564,067 | 3,187 | 2.40 | 3.06 | 62,297 | 24.34 | 23.15 | 3.90 | ||||||||||||||
Deposit Weighted Market Data | 0.90 | 4,351 | (1.87 | ) | (1.28 | ) | 38,509 | 20.03 | 20.38 | 5.86 | ||||||||||||||||
PSB Holdings, Inc. (MHC) | Windham | 245,778 | 18.41 | 36 | 113,626 | 3,156 | 4.16 | 4.55 | 50,762 | 12.52 | 11.53 | 5.00 | ||||||||||||||
PSB Holdings, Inc. (MHC) | New London | 63,947 | 1.62 | 87 | 267,790 | 3,078 | 3.36 | 3.66 | 57,903 | 14.30 | 13.56 | 4.10 | ||||||||||||||
Deposit Weighted Market Data | 14.94 | 3,140 | 3.99 | 4.37 | 52,236 | 12.89 | 11.95 | 4.81 | ||||||||||||||||||
SI Financial Group Inc. (MHC) | Windham | 244,114 | 18.28 | 36 | 113,626 | 3,156 | 4.16 | 4.55 | 50,762 | 12.52 | 11.53 | 5.00 | ||||||||||||||
SI Financial Group Inc. (MHC) | New London | 114,226 | 2.90 | 87 | 267,790 | 3,078 | 3.36 | 3.66 | 57,903 | 14.30 | 13.56 | 4.10 | ||||||||||||||
SI Financial Group Inc. (MHC) | Tolland | 89,396 | 4.80 | 40 | 146,009 | 3,650 | 7.07 | 5.80 | 68,651 | 16.29 | 14.58 | 3.60 | ||||||||||||||
SI Financial Group Inc. (MHC) | Hartford | 39,972 | 0.17 | 270 | 875,250 | 3,242 | 2.11 | 2.45 | 59,492 | 17.16 | 15.60 | 4.70 | ||||||||||||||
Deposit Weighted Market Data | 10.72 | 3,235 | 4.34 | 4.40 | 56,429 | 14.01 | 12.90 | 4.51 | ||||||||||||||||||
Westfield Financial Inc. (MHC) | Hampden | 618,311 | 8.42 | 143 | 462,529 | 3,234 | 1.38 | 1.97 | 47,505 | 19.60 | 19.22 | 5.50 | ||||||||||||||
| 7.92 | 3,235 | 1.42 | 2.00 | 48,233 | 19.45 | 19.00 | ||||||||||||||||||||
Comparable Median | 4.85 | 3,124 | 2.93 | 3.12 | 54,333 | 14.01 | 14.52 | 4.81 | ||||||||||||||||||
Fox Chase Bank | Atlantic | 57,700 | 1.25 | 82 | 270,524 | 3,299 | 7.12 | 7.45 | 49,020 | 11.43 | 9.33 | 5.60 | ||||||||||||||
Fox Chase Bank | Cape May | 33,295 | 1.34 | 58 | 112,796 | 1,945 | 10.23 | 11.88 | 46,862 | 12.49 | 12.72 | 8.40 | ||||||||||||||
Fox Chase Bank | Philadelphia | 357,489 | 1.01 | 335 | 1,484,625 | 4,432 | (2.17 | ) | (1.58 | ) | 36,853 | 19.73 | 20.19 | 6.00 | ||||||||||||
Fox Chase Bank | Bucks | 177,943 | 1.60 | 247 | 622,564 | 2,521 | 4.17 | 3.87 | 73,522 | 23.10 | 21.65 | 3.60 | ||||||||||||||
Fox Chase Bank | Montgomery | 129,963 | 0.73 | 354 | 775,046 | 2,189 | 3.33 | 2.96 | 75,725 | 24.41 | 24.30 | 3.30 | ||||||||||||||
Deposit Weighted Market Data | 1.13 | 3,401 | 1.52 | 1.76 | 53,527 | 20.38 | 20.08 | 5.05 | ||||||||||||||||||
State of Pennsylvania | 12,480,851 | 1.63 | 1.71 | 48,534 | 21.01 | 20.86 | 4.40 | |||||||||||||||||||
State of New Jersey | 8,768,091 | 4.20 | 4.18 | 63,135 | 14.62 | 14.29 | 4.40 | |||||||||||||||||||
National Average | 298,727,898 | 1,628 | 6.15 | 6.26 | 49,747 | 17.98 | 17.36 | 4.90 | ||||||||||||||||||
Sources: SNL Securities
| Conversion Valuation Appraisal Report | Page: 51 |
Positive | Neutral | Negative | ||
Higher Population Per Branch | Lower Population Growth | |||
Higher Income Growth | Higher Unemployment | |||
| Lower Income | ||||
The Bank’s market area has grown and is projected to continue to grow at a slower rate than the Comparable Group’s markets. Unemployment levels are higher in the Bank’s markets. Household income levels are lower in the Bank’s markets, but are projected to grow at a rate faster than the Comparables. The Bank’s market area has a higher ratio of population to branches than the Comparable Group. Based upon these factors, a slight downward adjustment is warranted for market area.
| Conversion Valuation Appraisal Report | Page: 52 |
CASH DIVIDENDS
The last few years have seen yet another shift away from dividend policies concurrent with conversion. Recent issues have been fully or oversubscribing without the need for the additional enticement of dividends. After the conversion is another issue, however. Pressures on ROAE and on internal rate of returns to investors prompted the industry toward cash dividends. This trend is exacerbated by the lack of growth potential. Typically, when institutions are in a growth mode, they issue stock dividends or do not declare a dividend. When growth is stunted, these institutions shift toward reducing equity levels and thus utilize cash dividends as a tool in managing equity. Recent tax code changes have made cash dividends more attractive to investors.
FIGURE 38 - DIVIDEND DATA
| Dividends | ||||||||
Ticker | Short Name | Current Dividend Yield (%) | LTM Dividend Ratio (%) | |||||
| Comparable Thrift Data | ||||||||
ABBC | Abington Community Bancorp, Inc. (MHC) | 1.47 | 47.62 | |||||
BCSB | BCSB Bankcorp, Inc. (MHC) | 4.00 | 714.29 | |||||
CSBK | Clifton Savings Bancorp, Inc. (MHC) | 1.89 | 153.85 | |||||
ALLB | Greater Delaware Valley Savings Bank (MHC) | 1.50 | 79.41 | |||||
NVSL | Naugatuck Valley Financial Corp. (MHC) | 1.89 | 69.23 | |||||
OSHC | Ocean Shore Holding Company (MHC) | — | — | |||||
ONFC | Oneida Financial Corp. (MHC) | 3.98 | 87.76 | |||||
PBIP | Prudential Bancorp, Inc. of Pennsylvania (MHC) | 1.23 | NA | |||||
PSBH | PSB Holdings, Inc. (MHC) | 2.15 | NA | |||||
SIFI | SI Financial Group Inc. (MHC) | 1.46 | 46.43 | |||||
WFD | Westfield Financial Inc. (MHC) | 2.56 | 161.29 | |||||
| Average | 2.01 | 151.10 | ||||||
| Median | 1.89 | 79.41 | ||||||
| Maximum | 4.00 | 714.29 | ||||||
| Minimum | — | — | ||||||
| Fox Chase Bank | — | — | ||||||
| Variance to the Comparable Median | (1.89 | ) | (79.41 | ) | ||||
Sources: SNL and Offering Circular Data, FinPro Computations
| Conversion Valuation Appraisal Report | Page: 53 |
All Comparable institutions with the exception of Ocean Shore Holding Company had declared cash dividends. The median dividend payout ratio for the Comparable Group was 79.41%, ranging from a high of 714.29% to a low of 0.00%. The Bank, on a pro forma basis at the mid point of the value range will have an equity to assets ratio of 13.03%. The Bank will have adequate capital and profits to pay cash dividends.
As such, no adjustment is warranted for this factor.
| Conversion Valuation Appraisal Report | Page: 54 |
LIQUIDITYOFTHE ISSUE
The Comparable Group is by definition composed only of companies that trade in the public markets with all of the Comparables trading on NASDAQ or AMEX. Typically, the number of shares outstanding and the market capitalization provides an indication of how much liquidity there will be in a given stock. The actual liquidity can be measured by volume traded over a given period of time.
FIGURE 39 - MARKET CAPITALIZATION DATA
| Market Data | ||||||||||||||
Ticker | Short Name | Market Value ($) | Stock Price ($) | Price High ($) | Price Low ($) | Book Value ($) | Tangible Book Value ($) | |||||||
| Comparable Thrift Data | ||||||||||||||
ABBC | Abington Community Bancorp, Inc. (MHC) | 213.10 | 13.60 | 13.68 | 13.20 | 7.36 | 7.36 | |||||||
BCSB | BCSB Bankcorp, Inc. (MHC) | 73.90 | 12.50 | 14.08 | 12.10 | 6.89 | 6.45 | |||||||
CSBK | Clifton Savings Bancorp, Inc. (MHC) | 321.60 | 10.57 | 10.73 | 10.20 | 6.54 | 6.54 | |||||||
ALLB | Greater Delaware Valley Savings Bank (MHC) | 82.60 | 24.00 | 25.59 | 24.00 | 9.92 | 9.92 | |||||||
NVSL | Naugatuck Valley Financial Corp. (MHC) | 80.60 | 10.60 | 10.90 | 10.25 | 6.73 | 6.70 | |||||||
OSHC | Ocean Shore Holding Company (MHC) | 109.10 | 12.45 | 12.50 | 11.40 | 7.00 | 7.00 | |||||||
ONFC | Oneida Financial Corp. (MHC) | 85.30 | 11.07 | 11.98 | 10.31 | 7.12 | 5.16 | |||||||
PBIP | Prudential Bancorp, Inc. of Pennsylvania (MHC) | 162.50 | 13.00 | 14.00 | 12.00 | 7.33 | 7.33 | |||||||
PSBH | PSB Holdings, Inc. (MHC) | 75.30 | 11.17 | 11.31 | 10.41 | 7.41 | 6.17 | |||||||
SIFI | SI Financial Group Inc. (MHC) | 136.60 | 10.93 | 11.75 | 10.35 | 6.38 | 6.31 | |||||||
WFD | Westfield Financial Inc. (MHC) | 224.90 | 23.42 | 25.18 | 23.01 | 12.36 | 12.36 | |||||||
| Average | 142.32 | 13.94 | 14.70 | 13.38 | 7.73 | 7.39 | ||||||||
| Median | 109.10 | 12.45 | 12.50 | 11.40 | 7.12 | 6.70 | ||||||||
| Maximum | 321.60 | 24.00 | 25.59 | 24.00 | 12.36 | 12.36 | ||||||||
| Minimum | 73.90 | 10.57 | 10.73 | 10.20 | 6.38 | 5.16 | ||||||||
| Fox Chase Bank | 111.00 | NA | NA | NA | NA | NA | ||||||||
| Variance to the Comparable Median | 1.90 | NA | NA | NA | NA | NA | ||||||||
Sources: SNL and Offering Circular Data, FinPro Computations
The market capitalization values of the Comparable Group range from a low of $73.9 million to a high of $321.6 million with a median market capitalization of $109.1 million. The Bank expects to have $111.0 million of market capital at the midpoint on a pro forma basis. It is expected that the Bank will trade on NASDAQ along with ten of the eleven Comparables.
No adjustment for this factor appears warranted, due to the similar levels of pro forma market capitalization and expected liquidity, relative to the Comparables.
| Conversion Valuation Appraisal Report | Page: 55 |
RECENT REGULATORY MATTERS
Regulatory matters influence the market for thrift conversions. The Bank will operate in substantially the same regulatory environment as the Comparable Group. The only material difference is that the federally regulated Comparables have the ability to waive dividends to the MHC. This factor was addressed in the cash dividends section.
Taken collectively, no adjustment for this factor is warranted as both the Bank and the Comparables will operate in the same ownership structure and will be supervised in the same regulatory environment.
| Conversion Valuation Appraisal Report | Page: 56 |
5. Other Factors
MANAGEMENT
As a result of the Order to Cease and Desist, the Bank was required to hire a new CEO and appoint new directors. The current management team including CEO, CFO and lending personnel are new to the institution.
However, the current team has considerable banking experience and has held similar positions in other financial institutions. The current team has made considerable progress in addressing the items specified in the Order to Cease and Desist and has had many of the regulatory restrictions lifted.
The Bank’s organizational chart is reasonable for an institution of its size and complexity. The Board is active and oversees and advises on all key strategic and policy decisions and holds the management to high performance standards.
As such, no adjustment appears to be warranted for this factor.
| Conversion Valuation Appraisal Report | Page: 57 |
ORDERTO CEASEAND DESIST
The Bank is subject to the terms of the Order to Cease and Desist. However, the restrictions on asset growth and lending contained in the Order were lifted. Additionally, the restriction on entering into third party contracts outside of the ordinary course of business without the prior written approval of the Office of Thrift Supervision was lifted. There can be no assurance as to when the Order to Cease and Desist will be terminated.
The Order to Cease and Desist did not remove the Bank’s designation as a “troubled institution” as imposed by the Office of Thrift Supervision in January 2005. Such designation requires Fox Chase to pay increased assessment fees to the Office of Thrift Supervision and increases the deposit insurance premiums paid to the Federal Deposit Insurance Corporation. Further, such designation generally requires the regulators to undertake additional procedures when considering applications the Bank submits, such as for the establishment of new branches, for acquisitions or for certain dividend payments, which may result in a delay in the processing of the Bank’s applications. If the Bank fails to comply with the Order to Cease and Desist in a manner satisfactory to the Office of Thrift Supervision, it can take additional, and possibly more severe, enforcement action against management and the Board of Directors, including assessing civil monetary penalties and initiating injunctive actions. Moreover, they can impose restrictions on the Bank’s operations, which would negatively affect the Bank’s ability to implement its operating strategy and negatively affect the Bank’s profitability.
FinPro has reviewed and considered the progress evident in the Bank’s recent exam reports. The factors underlying the reasons for the Order to Cease and Desist have been adjusted for elsewhere in this appraisal. As such, the actual lifting of the Order to Cease and Desist does not in-and-of itself impact the appraisal.
As such, no adjustment is warranted for this factor.
| Conversion Valuation Appraisal Report | Page: 58 |
SUBSCRIPTION INTEREST
The pro forma price to fully converted book multiple of MHC conversions declined from 2005 to May 2, 2006.
FIGURE 40 - MHC REORGANIZATIONS (SINCE 1/1/03) PRO FORMA DATA
| Price to Pro Forma | ||||||||||||
Ticker | Short Name | IPO Date | IPO ($) | Percentage Retained By MHC (%) | Net Proceeds ($000) | Fully Converted (%) | ||||||
MFDB | Mutual Federal Bancorp Inc. (MHC) | 04/06/2006 | 10.0000 | 70.00 | 8,592 | 74.57 | ||||||
LSBK | Lake Shore Bancorp, Inc. (MHC) | 04/04/2006 | 10.0000 | 53.00 | 24,485 | 81.29 | ||||||
Q2’06 | Average | 77.93 | ||||||||||
| Median | 77.93 | |||||||||||
UCBA | United Community Bancorp (MHC) | 03/31/2006 | 10.0000 | 55.00 | 30,228 | 85.06 | ||||||
MGYR | Magyar Bancorp, Inc. (MHC) | 01/24/2006 | 10.0000 | 54.03 | 22,059 | 82.27 | ||||||
GVFF | Greenville Federal Financial Corporation (MHC) | 01/05/2006 | 10.0000 | 55.00 | 8,114 | 69.72 | ||||||
Q1’06 | Average | 79.02 | ||||||||||
| Median | 82.27 | |||||||||||
2006 YTD | Average | 78.58 | ||||||||||
| Median | 81.29 | |||||||||||
EQFC | Equitable Financial Corp. (MHC) | 11/08/2005 | 10.0000 | 55.00 | 11,460 | 79.39 | ||||||
ISBC | Investors Bancorp, Inc. (MHC) | 10/12/2005 | 10.0000 | 54.27 | 444,954 | 85.40 | ||||||
WAUW | Wauwatosa Holdings, Inc. (MHC) | 10/05/2005 | 10.0000 | 68.35 | 85,953 | 82.52 | ||||||
Q4’05 | Average | 82.44 | ||||||||||
| Median | 82.52 | |||||||||||
OTTW | Ottawa Savings Bancorp, Inc. (MHC) | 07/15/2005 | 10.0000 | 55.00 | 7,728 | 74.92 | ||||||
UBNK | United Financial Bancorp, Inc. (MHC) | 07/13/2005 | 10.0000 | 53.40 | 61,624 | 84.38 | ||||||
Q3’05 | Average | 79.65 | ||||||||||
| Median | 79.65 | |||||||||||
COBK | Colonial Bankshares, Inc. (MHC) | 06/30/2005 | 10.0000 | 54.00 | 17,426 | 82.47 | ||||||
HBOS | Heritage Financial Group (MHC) | 06/30/2005 | 10.0000 | 70.00 | 25,908 | 84.17 | ||||||
NPEN | North Penn Bancorp, Inc. (MHC) | 06/02/2005 | 10.0000 | 53.92 | 5,061 | 73.70 | ||||||
RCKB | Rockville Financial, Inc. (MHC) | 05/23/2005 | 10.0000 | 55.00 | 71,069 | 85.05 | ||||||
FFCO | FedFirst Financial Corp. (MHC) | 04/07/2005 | 10.0000 | 55.00 | 24,822 | 85.98 | ||||||
BFSB | Brooklyn Federal Bancorp, Inc. (MHC) | 04/06/2005 | 10.0000 | 70.00 | 32,794 | 89.55 | ||||||
Q2’05 | Average | 83.49 | ||||||||||
| Median | 84.61 | |||||||||||
PBIP | Prudential Bancorp, Inc. of Pennsylvania (MHC) | 03/30/2005 | 10.0000 | 55.00 | 48,241 | 86.87 | ||||||
KFFB | Kentucky First Federal Bancorp (MHC) | 03/03/2005 | 10.0000 | 55.00 | 14,309 | 96.36 | ||||||
KRNY | Kearny Financial Corp (MHC) | 02/24/2005 | 10.0000 | 70.00 | 183,196 | 80.04 | ||||||
HFBL | Home Federal Bancorp, Inc. of Louisiana (MHC) | 01/21/2005 | 10.0000 | 60.00 | 11,988 | 75.39 | ||||||
BVFL | BV Financial, Inc. (MHC) | 01/14/2005 | 10.0000 | 55.00 | 9,646 | 87.78 | ||||||
GTWN | Georgetown Bancorp, Inc. (MHC) | 01/06/2005 | 10.0000 | 55.00 | 10,347 | 88.45 | ||||||
Q1’05 | Average | 85.82 | ||||||||||
| Median | 87.33 | |||||||||||
2005 | Average | 83.67 | ||||||||||
| Median | 84.38 | |||||||||||
1/1/2002 | Average | 82.52 | ||||||||||
5/2/2006 | Median | 83.35 | ||||||||||
Source: SNL Securities
| Conversion Valuation Appraisal Report | Page: 59 |
The first day “pop” increased modestly between 2005 and 2006 year-to-date. Four of the MHC conversions that closed since January 1, 2005 are currently trading below their IPO price.
FIGURE 41 - MHC REORGANIZATIONS PRICE APPRECIATION
| Percent Change from IPO | |||||||||||||||
Ticker | Short Name | IPO Date | After 1 Day (%) | After 1 Week (%) | After 1 Month | After 3 Months | To Date (%) | ||||||||
MFDB | Mutual Federal Bancorp Inc. (MHC) | 04/06/2006 | 11.30 | 10.00 | NA | NA | 13.00 | ||||||||
LSBK | Lake Shore Bancorp, Inc. (MHC) | 04/04/2006 | 7.00 | 5.50 | NA | NA | 2.80 | ||||||||
Q2’06 | Average | 9.15 | 7.75 | NA | NA | 7.90 | |||||||||
| Median | 9.15 | 7.75 | NA | NA | 7.90 | ||||||||||
UCBA | United Community Bancorp (MHC) | 03/31/2006 | 8.00 | 8.40 | 5.50 | NA | 6.50 | ||||||||
MGYR | Magyar Bancorp, Inc. (MHC) | 01/24/2006 | 6.50 | 5.00 | 6.00 | 15.00 | 17.60 | ||||||||
GVFF | Greenville Federal Financial Corporation (MHC) | 01/05/2006 | NA | 2.50 | 0.00 | 1.00 | -1.50 | ||||||||
Q1’06 | Average | 7.25 | 5.30 | 3.83 | NA | 7.53 | |||||||||
| Median | 7.25 | 5.00 | 5.50 | NA | 6.50 | ||||||||||
2006 YTD | Average | 8.20 | 6.28 | 3.83 | 8.00 | 7.68 | |||||||||
| Median | 7.50 | 5.50 | 5.50 | 8.00 | 6.50 | ||||||||||
EQFC | Equitable Financial Corp. (MHC) | 11/08/2005 | NA | 0.00 | -5.00 | -7.50 | -7.50 | ||||||||
ISBC | Investors Bancorp, Inc. (MHC) | 10/12/2005 | 0.20 | 0.70 | 5.20 | 16.80 | 39.70 | ||||||||
WAUW | Wauwatosa Holdings, Inc. (MHC) | 10/05/2005 | 12.50 | 11.50 | 9.50 | 15.60 | 37.80 | ||||||||
Q4’05 | Average | 6.35 | 4.07 | 3.23 | NA | 23.33 | |||||||||
| Median | 6.35 | 0.70 | 5.20 | NA | 37.80 | ||||||||||
OTTW | Ottawa Savings Bancorp, Inc. (MHC) | 07/15/2005 | 10.00 | 5.00 | 7.00 | -2.50 | 19.50 | ||||||||
UBNK | United Financial Bancorp, Inc. (MHC) | 07/13/2005 | 17.50 | 15.70 | 17.00 | 13.70 | 19.70 | ||||||||
Q3’05 | Average | 13.75 | 10.35 | 12.00 | NA | 19.60 | |||||||||
| Median | 13.75 | 10.35 | 12.00 | NA | 19.60 | ||||||||||
COBK | Colonial Bankshares, Inc. (MHC) | 06/30/2005 | 6.00 | 6.90 | 7.50 | 5.70 | 17.70 | ||||||||
HBOS | Heritage Financial Group (MHC) | 06/30/2005 | 7.50 | 7.20 | 9.30 | 10.00 | 23.80 | ||||||||
NPEN | North Penn Bancorp, Inc. (MHC) | 06/02/2005 | 10.00 | 2.50 | 1.50 | 1.50 | 10.00 | ||||||||
RCKB | Rockville Financial, Inc. (MHC) | 05/23/2005 | 4.80 | 10.50 | 19.60 | 38.90 | 42.30 | ||||||||
FFCO | FedFirst Financial Corp. (MHC) | 04/07/2005 | -6.60 | -7.10 | -14.50 | -9.00 | 0.90 | ||||||||
BFSB | Brooklyn Federal Bancorp, Inc. (MHC) | 04/06/2005 | -0.50 | -0.10 | -5.00 | 7.90 | 20.50 | ||||||||
Q2’05 | Average | 3.53 | 3.32 | 3.07 | 9.17 | 19.20 | |||||||||
| Median | 5.40 | 4.70 | 4.50 | 6.80 | 19.10 | ||||||||||
PBIP | Prudential Bancorp, Inc. of Pennsylvania (MHC) | 03/30/2005 | -1.50 | -6.50 | -12.50 | 8.40 | 30.00 | ||||||||
KFFB | Kentucky First Federal Bancorp (MHC) | 03/03/2005 | 7.90 | 11.00 | 12.40 | 15.50 | 5.50 | ||||||||
KRNY | Kearny Financial Corp (MHC) | 02/24/2005 | 13.90 | 14.30 | 10.80 | 6.00 | 39.70 | ||||||||
HFBL | Home Federal Bancorp, Inc. of Louisiana (MHC) | 01/21/2005 | -1.00 | 0.00 | -0.80 | -6.00 | 2.20 | ||||||||
BVFL | BV Financial, Inc. (MHC) | 01/14/2005 | -6.50 | -4.00 | -1.50 | -8.60 | -5.50 | ||||||||
GTWN | Georgetown Bancorp, Inc. (MHC) | 01/06/2005 | 2.00 | 0.00 | 0.50 | -3.50 | -11.00 | ||||||||
Q1’05 | Average | 2.47 | 2.47 | 1.48 | 1.97 | 10.15 | |||||||||
| Median | 0.50 | — | (0.15 | ) | 1.25 | 3.85 | |||||||||
2005 | Average | 4.76 | 3.98 | 3.59 | 6.05 | 16.78 | |||||||||
| Median | 5.40 | 2.50 | 5.20 | 6.00 | 19.50 | ||||||||||
1/1/2002 | Average | 5.45 | 4.50 | 3.63 | 6.26 | 14.71 | |||||||||
5/2/2006 | Median | 6.75 | 5.00 | 5.35 | 6.00 | 15.30 | |||||||||
Source: SNL Securities
No adjustment is warranted as the vast majority of recent deals are trading near, but not below, their IPO price which would indicate that current pro forma pricing levels are appropriate.
| Conversion Valuation Appraisal Report | Page: 60 |
VALUATION ADJUSTMENTS
Relative to the Comparables the following adjustments need to be made to the Bank’s pro forma market value.
Valuation Factor | Valuation Adjustment | |
Financial Condition | Moderate Downward | |
Balance Sheet Growth | Strong Downward | |
Earnings Quality, Predictability and Growth | Strong Downward | |
Market Area | Slight Downward | |
Dividends | No Adjustment | |
Liquidity of the Issue | No Adjustment | |
Recent Regulatory Matters | No Adjustment | |
Additionally, the following adjustment should be made to the Bank’s market value.
Valuation Factor | Valuation Adjustment | |
| Management | No Adjustment | |
| Cease and Desist Order | No Adjustment | |
| Subscription Interest | No Adjustment | |
Taken collectively, FinPro is of the opinion that, a discount should be applied to the Bank’s market value.
| Conversion Valuation Appraisal Report | Page: 61 |
6. Valuation
In applying the accepted valuation methodology promulgated by the regulators, i.e., the pro forma market value approach, three key pricing multiples were considered. The four multiples include:
Price to core earnings (“P/E”)
Price to book value (“P/B”) / Price to tangible book value (“P/TB”)
Price to assets (“P/A”)
All of the approaches were calculated on a pro forma basis including the effects of the conversion proceeds. All of the assumptions utilized are presented in Exhibits 11 through 15.
DISCUSSIONOF WEIGHT GIVENTO VALUATION MULTIPLES
To ascertain the pro forma estimated market value of the Bank, the market multiples for the Comparable Group were utilized. As a secondary check, all Pennsylvania public thrifts, all publicly traded thrifts and the recent (2005 to date) and historical MHC conversions were assessed. The multiples for the Comparable Group, all publicly traded MHC, and Pennsylvania MHC thrifts are shown in Exhibit 9.
Price to Earnings – According to the Appraisal Guidelines: “When both the converting institution and the comparable companies are recording “normal” earnings. A P/E approach may be the simplest and most direct method of valuation. When earnings are low or negative, however, this approach may not be appropriate and the greater consideration should be given to the P/BV approach.” In this particular case, the Bank’s earnings are “normal”. As a basis for comparison, the price to core earnings was utilized for both the Bank and the Comparable Group to eliminate any nonrecurring items. As such, this approach was considered in this appraisal.
In the pro forma figures for the Bank, FinPro incorporated the impact of SFAS 123, which requires the expensing of stock options. In preparing the fully converted pro forma figures for the Comparable Group, FinPro also incorporated the impact of SFAS 123.
| Conversion Valuation Appraisal Report | Page: 62 |
Price to Book/Price to Tangible Book - According to the Appraisal Guidelines: “The P/BV approach works best when the converting institution and the Comparables have a normal amount of book value. The P/BV approach could seriously understate the value of an institution that has almost no book value but has an outstanding future earnings potential. For converting institutions with high net worth, the appraiser may have difficulty in arriving at a pro forma market value because of pressure placed on the P/E multiple as higher P/BV levels are required to reflect a similar P/BV ratio as the peer group average. The P/BV approach also suffers from the use of historical cost accounting data.”
Since thrift earnings in general have had a high degree of volatility over the past decade, the P/B is utilized frequently as the benchmark for market value. A better approach is the P/TB approach. In general, investors tend to price financial institutions on a tangible book basis, because it incorporates the P/B approach adjusted for intangibles. Initially following conversion, FinPro believes that thrifts often trade on a price to tangible book basis.
Price to Assets - According to the Appraisal Guidelines: “This approach remedies the problems of a small base that can occur with the P/BV approach, but the approach has many of the other limitations of the latter approach (the P/BV approach).” FinPro places little weight on this valuation approach due to the lack of consideration of asset and funding mixes and the resulting earnings impact.
| Conversion Valuation Appraisal Report | Page: 63 |
FULL OFFERING VALUEIN RELATIONTO COMPARABLES
Based upon the adjustments defined in the previous section, the Bank is pricing at the midpoint asif fully converted with a foundation is estimated to be $111,000,000. Based upon a range below and above the midpoint value, the relative values are $94,350,000 at the minimum and $127,650,000 at the maximum respectively. At the super maximum of the range, the offering value would be $146,797,500.
At the various levels of the estimated value range, the full offering would result in the following offering data:
FIGURE 42 - VALUE RANGE - FULL OFFERING
Conclusion | Total Shares Shares | Price Per Share | Total Value | |||||
Appraised Value - Midpoint | 11,100,000 | $ | 10.00 | $ | 111,000,000 | |||
Range: | ||||||||
- Minimum | 9,435,000 | 10.00 | 94,350,000 | |||||
- Maximum | 12,765,000 | 10.00 | 127,650,000 | |||||
- Super Maximum | 14,679,750 | 10.00 | 146,797,500 | |||||
Source: FinPro Inc. Pro forma Model
| Conversion Valuation Appraisal Report | Page: 64 |
FIGURE 43 –AS IF FULLY CONVERTED OFFERING PRICING MULTIPLES
| Bank | Comparables | State | National | ||||||||||||||||||||||
| Mean | Median | Mean | Median | Mean | Median | ||||||||||||||||||||
| Min | 34.48 | ||||||||||||||||||||||||
Price-Core Earnings Ratio P/E | Mid | 37.04 | 41.79 | 30.64 | 28.33 | 31.32 | 34.31 | 30.39 | |||||||||||||||||
| Max | 41.67 | ||||||||||||||||||||||||
| Smax | 43.48 | ||||||||||||||||||||||||
| Min | 66.36 | % | |||||||||||||||||||||||
Price-to-Book Ratio P/B | Mid | 70.82 | % | 93.23 | % | 91.72 | % | 98.31 | % | 98.27 | % | 94.57 | % | 91.97 | % | ||||||||||
| Max | 74.52 | % | |||||||||||||||||||||||
| Smax | 78.06 | % | |||||||||||||||||||||||
| Min | 66.36 | % | |||||||||||||||||||||||
Price-to-Tangible Book Ratio P/TB | Mid | 70.82 | % | 95.95 | % | 96.49 | % | 101.32 | % | 98.27 | % | 97.73 | % | 97.44 | % | ||||||||||
| Max | 74.52 | % | |||||||||||||||||||||||
| Smax | 78.06 | % | |||||||||||||||||||||||
| Min | 11.46 | % | |||||||||||||||||||||||
Price-to-Assets Ratio P/A | Mid | 13.23 | % | 20.67 | % | 18.54 | % | 26.69 | % | 22.27 | % | 24.19 | % | 22.13 | % | ||||||||||
| Max | 14.93 | % | |||||||||||||||||||||||
| Smax | 16.82 | % | |||||||||||||||||||||||
Source: FinPro Calculations
FIGURE 44 - COMPARABLEAS IF FULLY CONVERTED PRICING MULTIPLESTOTHE BANK’S PRO FORMA MIDPOINT
| Price Relative to | |||||||||||||||
| Earnings | Core Earnings | Book | Tangible Book | Assets | |||||||||||
The Bank (at midpoint) Full Conversion | 16.95 | 37.04 | 70.82 | % | 70.82 | % | 13.23 | % | |||||||
Comparable Group Median | 29.80 | 30.64 | 91.72 | % | 96.49 | % | 18.54 | % | |||||||
(Discount) Premium | -43.12 | % | 20.88 | % | -22.79 | % | -26.61 | % | -28.64 | % | |||||
Source: SNL data, FinPro Calculations
As Figure 44 demonstrates, at the midpoint of the estimated valuation range the Bank is priced at a premium of 20.88% on afully converted core earnings basis. On a price tofully converted tangible book basis, the Bank is priced at a 26.61% discount to the Comparable Group.
FIGURE 45 - COMPARABLEAS IF FULLY CONVERTED PRICING MULTIPLESTOTHE BANK’S PRO FORMA SUPER MAXIMUM
| Price Relative to | |||||||||||||||
| Earnings | Core Earnings | Book | Tangible Book | Assets | |||||||||||
The Bank (at the supermax) Full Conversion | 21.28 | 43.48 | 78.06 | % | 78.06 | % | 16.82 | % | |||||||
Comparable Group Median | 29.80 | 30.64 | 91.72 | % | 96.49 | % | 18.54 | % | |||||||
(Discount) Premium | -28.58 | % | 41.90 | % | -14.89 | % | -19.10 | % | -9.27 | % | |||||
Source: SNL data, FinPro Calculations
As Figure 45 demonstrates, at the super maximum of the estimated valuation range the Bank is priced at a premium of 41.90% on afully converted core earnings basis. On a price tofully converted tangible book basis, the Bank is priced at a 19.10% discount to the Comparable Group.
| Conversion Valuation Appraisal Report | Page: 65 |
The Bank pricing at the midpoint for a MHC conversion assuming an issuance of 43.57%, is $48,361,700. Based upon a range below and above the midpoint value, the relative values are $41,107,450 at the minimum and $55,615,960 at the maximum, respectively. At the super maximum of the range, the offering value would be $63,958,350.
FIGURE 46 - VALUE RANGE MHC OFFERING DATA
Conclusion | Total Shares | Price per Share | Total Value | |||||
Appraised Value - $94,350,000 at 44% | 4,110,745 | $ | 10 | $ | 41,107,450 | |||
Appraised Value - $111,000,000 at 44% | 4,836,170 | $ | 10 | $ | 48,361,700 | |||
Appraised Value - $127,650,000 at 44% | 5,561,596 | $ | 10 | $ | 55,615,960 | |||
Appraised Value - $146,797,500 at 44% | 6,395,835 | $ | 10 | $ | 63,958,350 | |||
Source: FinPro Inc. Pro forma Model
FIGURE 47 - COMPARABLEGAAP PRICING MULTIPLESTOTHE BANK’S PRO FORMA MIDPOINT
| Price Relative to | |||||||||||||||
| Earnings | Core Earnings | Book | Tangible Book | Assets | |||||||||||
The Bank (at midpoint) MHC | 20.00 | 52.63 | 107.18 | % | 107.18 | % | 13.97 | % | |||||||
Unadjusted MHC Trading Median | 39.40 | 39.40 | 176.70 | % | 177.70 | % | 21.45 | % | |||||||
(Discount) Premium | -49.24 | % | 33.58 | % | -39.34 | % | -39.68 | % | -34.87 | % | |||||
Source: SNL data, FinPro Calculations
As Figure 47 demonstrates, at the midpoint of the estimated valuation range the Bank is priced at a premium of 33.58% on aGAAP core earnings basis. On a price toGAAP tangible book basis, the Bank is priced at a 39.68% discount to the Comparable Group.
FIGURE 48 - COMPARABLEGAAP PRICING MULTIPLESTOTHE BANK’S PRO FORMA SUPER MAXIMUM
| Price Relative to | |||||||||||||||
| Earnings | Core Earnings | Book | Tangible Book | Assets | |||||||||||
The Bank (at the supermax) MHC | 25.64 | 66.67 | 125.79 | % | 125.79 | % | 18.18 | % | |||||||
Unadjusted MHC Trading Median | 39.40 | 39.40 | 176.70 | % | 177.70 | % | 21.45 | % | |||||||
(Discount) Premium | -34.92 | % | 69.21 | % | -28.81 | % | -29.21 | % | -15.24 | % | |||||
Source: SNL data, FinPro Calculations
As Figure 48 demonstrates, at the super maximum of the estimated valuation range the Bank is priced at a premium of 69.21% on aGAAP core earnings basis. On a price toGAAP tangible book basis, the Bank is priced at a 29.21% discount to the Comparable Group.
| Conversion Valuation Appraisal Report | Page: 66 |
COMPARISONTO RECENT MHC CONVERSIONS
As a secondary check, to verify and validate that the range created on a comparable basis is appropriate, FinPro compared the pricing of this deal relative to other MHC conversions.
FIGURE 49 – COMPARISONTO FILEDAND PENDING MHC OFFERINGS
Name | State | Super Maximum Appraisal Price to Full Converted Tangible Book | |||
Fox Chase Bancorp, Inc. | PA | 78.06 | % | ||
Applications Filed: | |||||
ViewPoint Financial Corp | TX | 79.77 | % | ||
Seneca-Cayuga Bancorp | NY | 79.06 | % | ||
Northeast Community Bancorp | NY | 85.76 | % | ||
Roma Financial Corp | NJ | 77.07 | % | ||
Source: 5/3/06 Conversion Watch
| Conversion Valuation Appraisal Report | Page: 67 |
VALUATION CONCLUSION
We believe that the discount on a tangible book basis is appropriate relative to the Comparable Group. This range was confirmed by our analysis of other filed and pending MHC offerings as secondary checks.
It is, therefore, FinPro’s opinion that as of May 2, 2006, the estimated pro forma market value of the Bank in a full offering was $111,000,000 at the midpoint of a range with a minimum of $94,350,000 to a maximum of $127,650,000 at 15% below and 15% above the midpoint of the range respectively. Assuming an adjusted maximum value of 15% above the maximum value, the adjusted maximum value or super maximum value in a full offering is $146,797,500. The shares issued to the foundation will be funded using authorized be unissued shares.
Using the pro forma market values for a full offering shown above, the amount of stock publicly offered as part of the MHC reorganization issuing 43.57% will equal 4,110,745 shares, 4,836,170 shares, 5,561,596 shares and 6,395,835 shares at the minimum, midpoint, maximum and super maximum, respectively. Additionally, the Bank will issue 135,000 shares and $150,000 in cash to the charitable foundation.
The document represents an initial valuation for the Bank. Due to the duration of time that passes between the time this document is compiled and the time the offering closes, numerous factors could lead FinPro to update or revise the appraised value of the Bank. Some factors that could lead FinPro to adjust the appraised value include: (1) changes in the Bank’s operations and financial condition; (2) changes in the market valuation or financial condition of the Comparable Group; (3) changes in the broader market; and (4) changes in the market for thrift conversions. Should there be material changes to any of these factors, FinPro will prepare an appraisal update to appropriately adjust the value of the Bank. At the time of closing, FinPro will prepare a final appraisal to determine if the valuation range is still appropriate and determine the exact valuation amount appropriate for the Bank.