Table of Contents
As filed with the Securities and Exchange Commission on October 25, 2007
Registration No. 333-144942
SECURITIES AND EXCHANGE COMMISSION
Washington, D.C. 20549
AMENDMENT NO. 2
TO
FORM S-1
REGISTRATION STATEMENT UNDER
THE SECURITIES ACT OF 1933
INTCOMEX, INC.
(Exact name of Registrant as specified in its charter)
| Delaware | 5045 | 65-0893400 | ||
| (State or other jurisdiction of incorporation or organization) | (Primary Standard Industrial Classification Code Number) | (I.R.S. Employer Identification Number) |
Intcomex, Inc. 3505 NW 107th Avenue
Miami, Florida 33178
(305) 477-6230
(Address including zip code, telephone number, including area code, of Registrant’s Principal Executive Offices)
Michael Shalom
Intcomex, Inc.
3505 NW 107th Avenue
Miami, Florida 33178
(305) 477-6230
(Name, address including zip code, telephone number, including area code, of agent for service)
Copies To:
Jeffrey D. Karpf, Esq. Cleary Gottlieb Steen & Hamilton LLP One Liberty Plaza New York, New York 10006 Telephone: (212) 225-2000 Telecopy: (212) 225-3999 | David Lefkowitz, Esq. Erika L. Weinberg, Esq. Weil, Gotshal & Manges LLP 767 Fifth Avenue New York, New York 10153 Telephone: (212) 310-8000 Telecopy: (212) 310-8007 |
Approximate date of commencement of proposed sale to the public:As soon as practicable after the effective date hereof.
If any of the securities being registered on this form are to be offered on a delayed or continuous basis pursuant to Rule 415 under the Securities Act, check the following box. ¨
If this form is filed to register additional securities for an offering pursuant to Rule 462(b) under the Securities Act, check the following box and list the Securities Act registration statement number of the earlier effective registration statement for the same offering. ¨
If this form is a post-effective amendment filed pursuant to Rule 462(c) under the Securities Act, check the following box and list the Securities Act registration statement number of the earlier effective registration statement for the same offering. ¨
If this form is a post-effective amendment filed pursuant to Rule 462(d) under the Securities Act, check the following box and list the Securities Act registration statement number of the earlier effective registration statement for the same offering. ¨
If delivery of the prospectus is expected to be made pursuant to Rule 434, check the following box. ¨
The Registrant hereby amends this Registration Statement on such date or dates as may be necessary to delay its effective date until the Registrant shall file a further amendment which specifically states that this Registration Statement shall thereafter become effective in accordance with Section 8(a) of the Securities Act of 1933 or until the Registration Statement shall become effective on such date as the Commission, acting pursuant to said Section 8(a), may determine.
Table of Contents
The information in this prospectus is not complete and may be changed. We may not sell these securities until the registration statement filed with the Securities and Exchange Commission is effective. This prospectus is not an offer to sell these securities and it is not soliciting an offer to buy these securities in any state where the offer or sale is not permitted.
SUBJECT TO COMPLETION, DATED OCTOBER 25, 2007.
P R O S P E C T U S

[LOGO]
Shares
Intcomex, Inc.
Common Stock
$ per share
We are selling shares of our common stock and the selling stockholder named in this prospectus is selling shares. We will not receive any proceeds from the sale of the shares by the selling stockholder. We and the selling stockholder have granted the underwriters an option to purchase up to additional shares of common stock to cover over-allotments.
This is the initial public offering of our common stock. We currently expect the initial public offering price to be between $ and $ per share. We have applied to have the common stock listed on the Nasdaq Global Market under the symbol “ICMX.”
An affiliate of Citigroup Global Markets Inc., one of the underwriters in this offering, is the selling stockholder in this offering. The selling stockholder currently owns approximately % of our common stock on a fully diluted basis and will own approximately % of our common stock upon the completion of this offering (assuming the underwriters’ over-allotment option is not exercised). As a result of the selling stockholder’s current ownership interest in us, this offering is being conducted in accordance with the applicable provisions of the National Association of Securities Dealers, Inc. Conduct Rules. These rules require, among other things, that the initial public offering price of the common stock be no higher than that recommended by a “qualified independent underwriter” (as such term is defined by the rules). UBS Securities LLC is assuming the responsibilities of acting as the qualified independent underwriter in this offering.
Investing in our common stock involves risks. See “Risk Factors” beginning on page 11.
Neither the Securities and Exchange Commission nor any state securities commission has approved or disapproved of these securities or determined if this prospectus is truthful or complete. Any representation to the contrary is a criminal offense.
| Per Share | Total | |||||
Public offering price | $ | $ | ||||
Underwriting discount | $ | $ | ||||
Proceeds to Intcomex, Inc. (before expenses) | $ | $ | ||||
Proceeds to the selling stockholder (before expenses) | $ | $ | ||||
The underwriters expect to deliver the shares to purchasers on or about , 2007.
| Citi | UBS Investment Bank |
Banc of America Securities LLC
Raymond James
Broadpoint.
, 2007
Table of Contents
You should rely only on the information contained in this prospectus. We have not authorized anyone to provide you with different information. We are not making an offer of these securities in any state where the offer is not permitted. You should not assume that the information contained in this prospectus is accurate as of any date other than the date on the front of this prospectus.
| Page | ||
| 1 | ||
| 11 | ||
| 25 | ||
| 26 | ||
| 27 | ||
| 28 | ||
| 30 | ||
| 31 | ||
Management’s Discussion and Analysis of Financial Condition | 33 | |
| 53 | ||
| 69 | ||
| 76 | ||
| 78 | ||
| 80 | ||
| 83 | ||
Certain United States Tax Consequences to Non-United States Holders | 87 | |
| 89 | ||
| 90 | ||
| 94 | ||
| 94 | ||
| 94 | ||
| 95 | ||
| 95 | ||
| F-1 | ||
Until , 2007 (25 days after the date of this prospectus), all dealers that buy, sell or trade our common stock, whether or not participating in this offering, may be required to deliver a prospectus. This is in addition to the dealers’ obligation to deliver a prospectus when acting as underwriters and with respect to their unsold allotments or subscriptions.
i
Table of Contents
This summary highlights selected information contained elsewhere in this prospectus. It does not contain all of the information that may be important to you. You should read the following summary together with the more detailed information regarding our company, the common stock offered and our audited and unaudited consolidated financial statements, including the notes to those statements, appearing elsewhere in this prospectus, before making an investment decision. Except as the context otherwise requires, all references in this prospectus to “Intcomex,” “we,” “us,” “our,” “our company” and similar terms refer to Intcomex, Inc. together with our consolidated subsidiaries and our predecessor companies.
Our Company
We believe we are the largest pure play value-added distributor of information technology, or IT, products focused solely on serving Latin America and the Caribbean. We distribute computer components, peripherals, software, computer systems, accessories, networking products and digital consumer electronics to more than 40,000 customers in 45 countries. We offer single source purchasing to our customers by providing an in-stock selection of more than 5,700 products from over 220 vendors, including many of the world’s leading IT product manufacturers.
Over the last 18 years, we have built an IT products distribution network in Latin America and the Caribbean that we believe is unmatched by any of our competitors in terms of the number of countries served through an in-country presence. We have achieved our regional market leadership position by offering our customers a wide and readily available product selection and excellent pre- and post-sale customer service, while providing our vendors with a multi-country distribution channel for their products. We believe our broad regional presence makes us more attractive to our vendors and customers, thereby enhancing our revenue growth and operating margins, and our geographic diversification reduces our operating risks.
We believe we have the broadest in-country presence of any distributor of IT products to Latin America and the Caribbean, in terms of the number of countries served through an in-country presence. From our headquarters and main distribution center in Miami, we support a network of in-country sales and distribution operations in 12 countries in Latin America and the Caribbean and a sales office in Brazil. As a result of our unique distribution platform, we have realized consistent organic revenue growth and strong operating margins. From 2001 to 2006, our revenue grew from $324.1 million to $889.8 million, representing a compound annual growth rate, or CAGR, of 22.4%, and our operating income grew from $11.2 million to $34.6 million, representing a CAGR of 25.2%. We believe these growth rates and our operating margins are higher than those of our public company competitors.
We serve the Latin American and Caribbean IT products markets using a dual distribution model:
| • | As a Miami-based wholesale aggregator, we sell primarily to: |
| - | third-party distributors, resellers and retailers of IT products based in countries in Latin America and the Caribbean where we do not have a local presence; |
| - | third-party distributors, resellers and retailers of IT products based in countries in Latin America and the Caribbean where we have a local presence but whose volumes are large enough to enable them to efficiently acquire products directly from U.S.-based wholesale aggregators; |
| - | other Miami-based exporters of IT products to Latin America and the Caribbean; and |
| - | our in-country operations. |
1
Table of Contents
For the six months ended June 30, 2007, revenue and operating income from our Miami operations (net of $148.7 million of revenue derived from sales to our in-country operations) were $146.6 million and $1.6 million, representing 29.4% and 12.3% of our consolidated revenue and operating income, respectively. For the year ended December 31, 2006, revenue and operating income from our Miami operations (net of $267.1 million of revenue derived from sales to our in-country operations) were $266.8 million and $13.0 million, representing 30.0% and 37.7% of our consolidated revenue and operating income, respectively.
| • | As an in-country distributor in 12 countries, we currently sell to over 40,000 local reseller and retailer customers, including value-added resellers (companies that sell, install and support IT products and personal computers, which we refer to as PCs), systems builders (companies that specialize in building complete computer systems by combining components from different vendors), smaller distributors and retailers. For the six months ended June 30, 2007, revenue and operating income from our in-country operations were $351.6 million and $11.5 million, representing 70.6% and 87.7% of our consolidated revenue and operating income, respectively. For the year ended December 31, 2006, revenue and operating income from our in-country operations were $623.0 million and $21.5 million, representing 70.0% and 62.3% of our consolidated revenue and operating income, respectively. |
Our Strengths
We have capitalized on our strengths to achieve a leadership position in the markets we serve. Our strengths include:
Pure play IT products distributor with leading positions in a large and growing market. We believe we are the largest pure play value-added distributor of IT products focused solely on Latin America and the Caribbean. We believe we hold the number one or number two market share position in each of the 12 countries in which we have an in-country distribution presence, except for Mexico and Colombia. According to IDC, spending on IT products (including hardware, packaged software and services) in Latin America and the Caribbean is projected to grow from $38.7 billion in 2006 to $60.4 billion in 2010, growing at an average of 11.8% per year. This is more than twice as fast as the expected growth rate in IT spending in the United States over the same period and nearly six times faster than the growth rate in IT spending in Latin America and the Caribbean from 2000 to 2006. Growth in these markets is expected to be driven primarily by increasing PC and Internet penetration rates as well as increasing demand for notebook computers. According to Pyramid Research, the Latin American and Caribbean PC penetration rate reached 14.8% in 2006 and is predicted to rise to 22.2% in 2010, which is still well below the U.S. and Canadian penetration rate of 83.0%. We expect that the higher growth in the market for PCs priced below $500 will drive a significant portion of this increase. We believe that we are well positioned in this market segment, which, according to Gartner, is expected to grow an average of 24.0% per year from 2006 to 2010. In addition, the rapid adoption of the Internet by Latin American and Caribbean consumers continues to fuel purchases of PCs. The number of Internet users is predicted by Pyramid Research to grow an average of 16.0% per year from 2006 to 2010, representing an increase in penetration rates from 15.7% to 27.0% over this period. Further, we expect to benefit from the accelerating growth in the notebook computers segment. Gartner expects notebook computer shipments to grow from 2.8 million units in 2006 to 11.5 million units in 2010, representing an average growth rate of 42.7% per year.
Unique business model creates industry-leading margins with significant barriers to entry. We operate both as a Miami-based wholesale aggregator and as an in-country distributor located in 12 countries throughout Latin America and the Caribbean. Our participation at two levels of the distribution chain (Miami and in-country), coupled with our extensive geographic footprint, creates a market presence that we believe is unmatched by any of our competitors and enables us to generate industry-leading margins among our public company competitors. Our dual distribution approach links a diversified set of vendors, primarily located in the
2
Table of Contents
United States and Asia, to a fragmented number of customers spread throughout Latin America and the Caribbean, and delivers value to both ends of the supply chain. To our vendors, we provide access to markets and customers that would be costly and inefficient for them to reach directly. To our customers, which are often small local resellers and retailers that lack the scale and access to buy directly from the United States and Asia, we provide broad and timely product availability, local staff, multi-vendor single source purchasing, technical support, customs management and local warranty service. Over the last 18 years, we have built a broad distribution infrastructure throughout our region and gained important business experience and relationships in each of our markets. We believe that the significant time and investment required to establish an efficient regional distribution infrastructure and the valuable services we provide to both our vendors and customers create significant barriers to entry in each of our markets.
Strong revenue growth and sustainable industry-leading profitability. From our founding in 1988 to the present, we have experienced consistent sales growth. From 2001 to 2006, we achieved a CAGR in revenue of 22.4%. During this period, we also maintained consistently strong operating profitability, with a CAGR in operating income of 25.2%. In 2006, we achieved an operating income margin of 3.9%, compared to the operating margins of 1.3% and 0.7% of our two largest competitors, Ingram Micro and Tech Data, respectively (excluding any goodwill impairment or restructuring charges). Our unique business model, our broad geographic footprint and our focus on higher-margin components, peripherals and software have been the main contributors to our strong margins. We believe these strong margins have helped us achieve what we believe to be an industry-leading return among our public company competitors on invested capital, or ROIC, which we define as net after-tax operating profit divided by average shareholders’ equity and net debt. We have consistently achieved an ROIC in the mid to high teens (17.2% in 2006). Our strong ROICs have also been driven by our focus on minimizing our cash conversion cycle with centralized purchasing, efficient managing of in-country inventory levels, establishing strict customer credit policies and carefully monitoring on-going inventory and demand.
Highly diverse business across multiple geographies and customers. We believe we have the broadest in-country presence of any distributor of IT products to Latin America and the Caribbean, in terms of the number of countries served through an in-country presence. We distribute products to more than 40,000 customers in 45 countries. The diversification of our geographic presence and customer base contributes to our consistent organic revenue growth and reduces our dependence on any single country or customer. We believe our diverse geographic presence will allow us to maintain a strong pace of organic growth in our target markets, driven by attractive market share expansion opportunities as well as strong underlying market growth characteristics. We can also use our deep knowledge of local markets to assess local market conditions and adjust our market focus as necessary. Moreover, the regional expertise we have gained in our multiple local markets can be applied and transferred when we expand our distribution platform into new geographies. In 2006, no country contributed more than 10% of our revenue, except Chile (16.7%), Mexico (11.9%) and Argentina (10.4%). We have also established a strong brand and a reputation for providing excellent customer service that we believe builds customer loyalty and leads to recurring revenue. In addition, we offer customers a one-stop shop for purchasing a broad selection of products, which enables us to maintain a large and diverse group of customers and attract and maintain new customers. In 2006, no single customer represented more than 2.0% of our revenue on a consolidated basis.
Strong vendor relationships and broad portfolio of products. We distribute and market more than 5,700 products from over 220 vendors, enabling us to offer a wide variety of products, satisfy customer requirements for product availability and meet end-user demand for multi-vendor and multi-product IT configurations. The large number of resellers and retailers in the region, their relatively small size, and their geographic fragmentation make it cost effective for vendors to rely on wholesale distributors like us that can deliver a broad regional distribution channel, rather than distributing directly to numerous fragmented resellers and retailers. We provide vendors with extensive regional coverage, larger order sizes, simplified logistics, lower distribution costs
3
Table of Contents
than if they dealt with each of our affiliates independently and with quality pre- and post-sale marketing and technical support. We also eliminate the need for our vendors to handle issues such as local duty and tax arrangements, customer credit analysis and management of numerous small accounts. Consequently, we have established long-standing relationships with most of the leading manufacturers of IT products in the United States and Asia, who we believe value our ability to provide reliable and efficient access to the numerous and growing markets across Latin America and the Caribbean. In 2006, no single vendor’s products generated more than 14.8% of our revenue.
Experienced management team with significant equity ownership. Each of our two co-founders has more than 18 years of industry experience in Latin America and the Caribbean. Our senior managers have an average tenure of over 9 years with us and each has had substantial experience working in the region. In addition, the turnover rate among our senior managers has been low. Prior to this offering, our senior managers beneficially owned approximately 48.6% of our capital stock on a fully diluted basis and will own approximately % of our capital stock following the offering. As a result of their substantial equity interest, we believe that our management has significant incentive to continue to increase our revenue and margins.
Our Strategy
We intend to achieve future growth and profitability through the following strategies:
| • | Grow and strengthen our diverse customer base by leveraging our large selection of products and our comprehensive offering of value-added services, including product training and support, credit and financing and reverse logistics (i.e., handling returns to manufacturers of defective or unwanted parts and products). |
| • | Enhance our margins by maintaining close control over our operating expenses and realizing increased economies of scale in product purchasing and working capital management. |
| • | Build upon our comprehensive in-stock selection of more than 5,700 IT products by expanding our existing product categories to include additional products or vendors and by adding new product categories or subcategories for which there is growing consumer demand. |
| • | Grow our business through extensions of our existing capabilities (including further product diversification and targeting of new markets), increasing our customer base (by distributing products directly to retailers, including small non-traditional retailers), and expanding our product offering of private label and our own branded products. |
| • | Target selective acquisitions that we believe will expand our business into new markets or improve our distribution capabilities, while growing revenues and enhancing margins. |
Citigroup Venture Capital International
In August 2004, Citigroup Venture Capital International, or CVC International, acquired a controlling interest in us through its investment vehicle Co-Investment LLC VII (Intcomex). CVC International is a unit of Citigroup Inc. engaged in private equity investments in emerging markets. CVC International, an affiliate of one of the underwriters, is the selling stockholder in this offering. Following this offering, CVC International will own approximately % of our common stock on a fully diluted basis (approximately % if the underwriters’ overallotment option is exercised in full).
Our Corporate History, Principal Office and Website
Anthony Shalom and Michael Shalom founded our company as a small software retailer in South Florida in 1988. We were reincorporated in Delaware on August 13, 2004 in connection with the investment by CVC
4
Table of Contents
International. Our principal executive offices are located at 3505 NW 107th Avenue, Miami, Florida 33178. Our telephone number is (305) 477-6230. Our website is located at www.intcomex.com. None of the information that appears on or that is linked to or from our website is incorporated by reference into or is otherwise made a part of this prospectus.
Selected Risk Factors
We face risks in operating our business, including risks that may prevent us from achieving our business objectives or that may hurt our business, financial condition and operating results. You should consider these risks before investing in our company.
Some of the important risks to our business and of this offering include the following:
| • | Highly competitive environment. The IT products distribution industry in Latin America and the Caribbean is highly competitive and very fragmented. In certain markets, we compete against large multinational public companies that are significantly better capitalized than we are and potentially have greater bargaining power with vendors than we do. In all of our in-country markets, we also compete against a substantial number of locally-based distributors, many of which have a lower cost structure than we do. We refer to Ingram Micro, Tech Data, Bell Microproducts and SYNNEX in this prospectus as our public company competitors. |
| • | Challenge of establishing and maintaining sufficient management and financial reporting systems and internal and disclosure controls and hiring, retaining and training sufficient accounting and finance personnel. We rely on a variety of management and financial reporting systems and internal and disclosure controls to enable management to capitalize on business opportunities, identify unfavorable developments and risks at an early stage and to prepare accurate and timely financial information for our investors. As our business has grown rapidly in recent years and expanded into new geographic markets, the challenge of establishing and maintaining sufficient systems and controls and hiring, retaining and training sufficient accounting and finance personnel has intensified. |
| • | Dependence on IT products market in Latin America and the Caribbean. Historically, the strength of our business has been driven in large part by the growth of the IT products market in Latin America and the Caribbean. If the IT products market does not grow as quickly and in the manner we expect for any reason, including as a result of economic, political, social or legal developments in Latin America and the Caribbean, we may not be able to grow our business as expected. |
| • | Fluctuations in foreign currency exchange rates. A significant portion of our revenues from in-country operations is invoiced in currencies other than the U.S. dollar, and a significant amount of our in-country operating expenses are denominated in currencies other than U.S. dollars. In markets where we invoice in local currency, the appreciation of a local currency will reduce our gross profit and gross margins in U.S. dollar terms. In markets where books and records are prepared in currencies other than the U.S. dollar, the appreciation of a local currency will increase our operating expenses and decrease our operating margins in U.S. dollar terms. Large and sustained devaluations of local currencies can make many of our products more expensive in local currencies. This could result in our customers having difficulty paying those invoices and, in turn, result in decreases in revenue. Moreover, such devaluations may adversely impact demand for our products because our customers may be unable to afford them. |
| • | Restrictions in our debt agreements. The revolving credit facility agreement between our wholly-owned subsidiary Software Brokers of America, Inc., or SBA, and Comerica Bank as well as the indenture governing our 11 ¾% Second Priority Senior Secured Notes due 2011, which we refer to as the 11 ¾% Notes, impose significant operating and financial restrictions on us and SBA. |
| • | Credit exposure from customers. We extend credit for a significant portion of sales to our customers. We are subject to the risk that our customers fail to pay or delay payment for the products they purchase |
5
Table of Contents
from us, resulting in longer payment cycles, increased collection costs, defaults exceeding our expectations and an adverse impact on the cost or availability of financing. |
| • | Dependence on a relatively small number of vendors. A significant portion of our revenue is derived from products manufactured by a relatively small number of vendors. Due to intense competition in the IT products distribution industry, our key vendors can choose to work with other distributors and, pursuant to standard terms in our vendor agreements, may terminate their relationships with us on short notice. |
| • | Receiving adequate trade credit. Our business is working capital intensive and our vendors historically have been an important source of funding our business growth through the provision of trade credit. We expect to continue to rely on trade credit from our vendors to provide a significant amount of our working capital. If our vendors fail to provide us with sufficient trade credit, including larger amounts of trade credit, in a timely manner as our business grows, we may have to rely on other sources of financing, which may not be readily available or, if available, may not be on terms acceptable or favorable to us. |
| • | Concentration of stock ownership. After this offering, our executive officers, directors and principal stockholders will continue to be able to exercise control over all matters requiring stockholder approval, including the election of directors, amendment of our amended and restated certificate of incorporation and approval of significant corporate transactions and will have significant control over our management and policies. Their interests may not be aligned with your interests as a holder of our common stock. |
For a more detailed discussion of the these and other significant risks associated with our business, our industry and investing in our common stock, you should read the section entitled “Risk Factors” beginning on page 11 of this prospectus.
6
Table of Contents
The Offering
Common stock offered by us | shares |
Common stock offered by the selling stockholder | shares |
Common stock to be outstanding immediately after this offering | shares |
Option to purchase additional shares of common stock | We and the selling stockholder have granted to the underwriters an option, exercisable for 30 days from the date of this prospectus, to purchase up to additional shares of common stock at the public offering price less the underwriting discount. The underwriters may exercise the option solely for the purpose of covering over-allotments, if any, in connection with this offering. To the extent the option is exercised, each underwriter must purchase a number of additional shares approximately proportionate to that underwriter’s initial purchase commitment. |
Use of proceeds | We intend to use $ million of our net proceeds from this offering to redeem or repurchase a portion of our 11 3/4% Notes. We intend to use the remainder of our net proceeds from this offering for general corporate purposes. |
We will not receive any proceeds from the sale of the shares by the selling stockholder. The selling stockholder will receive all of the proceeds from the sale of its shares in the offering. Citigroup Global Markets Inc. (“Citi”), one of the underwriters, is an affiliate of the selling stockholder, CVC International. Because the selling stockholder currently owns approximately % of our common stock on a fully diluted basis, this offering is being conducted in accordance with the applicable provisions of the National Association of Securities Dealers, Inc. Conduct Rules (the “NASD Rules”). The NASD Rules require, among other things, that the initial public offering price of the common stock be no higher than that recommended by a “qualified independent underwriter” (as such term is defined by the NASD Rules). UBS Securities LLC (“UBS”) is assuming the responsibilities of acting as the qualified independent underwriter in this offering. See “Risk Factors—Risks Relating to Our Common Stock and This Offering—Citigroup Global Markets Inc. may have a conflict of interest with respect to this offering” and “Underwriting.”
Dividends | We do not anticipate paying any cash dividends in the foreseeable future. |
Proposed Nasdaq Global Market symbol | “ICMX.” |
Risk factors | Investing in our shares involves a high degree of risk. See “Risk Factors” beginning on page 11 of this prospectus for a discussion of factors you should carefully consider before deciding to invest in our common stock. |
7
Table of Contents
Except as otherwise noted, all information in this prospectus:
| • | assumes that the underwriters do not exercise their option to purchase up to additional shares of common stock from us and the selling stockholder; |
| • | assumes the exchange by the holders of the 2,182 shares of our Class B non-voting common stock (which we issued in connection with the re-acquisition of Centel S.A. de C.V. (“Centel”), our Mexican subsidiary) for 2,182 shares of our voting common stock prior to or simultaneously with the completion of this offering; |
| • | assumes that the initial offering price is per share, the midpoint of the range set forth on the cover of this prospectus; |
| • | assumes our receipt of net proceeds of from the offering and the application of the proceeds as described under “Use of Proceeds;” |
| • | reflects a for one split of our common stock in the form of a stock dividend to our existing stockholders prior to or simultaneously with the completion of this offering; |
| • | excludes 1,540 shares of common stock issuable upon exercise of outstanding stock options granted prior to this offering to certain of our officers and directors with a weighted average exercise price of $1,077 per share, none of which were vested as of June 30, 2007; and |
| • | excludes restricted stock grants of 64 shares of common stock with a vesting period of one year for each third of such shares that we intend to grant to two independent directors at the initial public offering price. |
8
Table of Contents
Summary Historical Consolidated Financial and Other Data
The following table presents summary financial and other data as of and for the years ended December 31, 2004, 2005 and 2006 and the three months ended March 31, 2006 and 2007. We derived the statement of operations and other data set forth below for the years ended December 31, 2004, 2005 and 2006 and the balance sheet data as of December 31, 2005 and 2006 from our audited consolidated financial statements (together with the notes thereto) that are included elsewhere in this prospectus. We derived the balance sheet and other data as of December 31, 2004 from our audited consolidated financial statements with respect to such date that are not included in this prospectus. The statement of operations data for the six months ended June 30, 2007 and 2006 and the balance sheet data as of June 30, 2007 were derived from our unaudited condensed consolidated financial statements for these periods (together with the notes thereto) that are included elsewhere in this prospectus. They include all adjustments consisting of normal recurring adjustments that management considers necessary for a fair presentation of the financial position and results of operations for these periods. The results for any interim period are not necessarily indicative of the results that may be expected for the full year.
You should read the following summary information in conjunction with “Selected Financial Information and Other Data,” “Management’s Discussion and Analysis of Financial Condition and Results of Operations” and our audited and unaudited consolidated financial statements (together with the notes thereto) that are included elsewhere in this prospectus.
| Year Ended December 31, | Six Months Ended June 30, | |||||||||||||||||||
| 2004 | 2005(1) | 2006 | 2006 | 2007 | ||||||||||||||||
(audited) | (unaudited) | |||||||||||||||||||
| (in thousands, except per share data and number of shares) | ||||||||||||||||||||
Statement of Operations Data: | ||||||||||||||||||||
Revenue | $ | 554,345 | $ | 716,440 | $ | 889,779 | $ | 427,299 | $ | 498,147 | ||||||||||
Cost of revenue | 495,536 | 642,737 | 797,665 | 383,181 | 448,045 | |||||||||||||||
Gross profit | 58,809 | 73,703 | 92,114 | 44,118 | 50,102 | |||||||||||||||
Operating expenses | 33,815 | 43,343 | 57,537 | 27,318 | 36,931 | |||||||||||||||
Operating income | 24,994 | 30,360 | 34,577 | 16,800 | 13,171 | |||||||||||||||
Other (income) expense | ||||||||||||||||||||
Interest expense | 3,429 | 16,805 | 16,233 | 8,060 | 8,445 | |||||||||||||||
Interest income | (153 | ) | (456 | ) | (876 | ) | (500 | ) | (283 | ) | ||||||||||
Other (income) expense, net | (196 | ) | 600 | 164 | 4 | 27 | ||||||||||||||
Foreign exchange (gain) loss | (986 | ) | (1,407 | ) | 1,099 | 2,570 | (968 | ) | ||||||||||||
Total other (income) expense | 2,094 | 15,542 | 16,620 | 10,134 | 7,221 | |||||||||||||||
Income before taxes and minority interest | 22,900 | 14,818 | 17,957 | 6,666 | 5,950 | |||||||||||||||
Income tax provision | 6,417 | 2,755 | 4,894 | 2,169 | 1,897 | |||||||||||||||
Income before minority interest | 16,483 | 12,063 | 13,063 | 4,497 | 4,053 | |||||||||||||||
Minority interest(2) | 314 | — | — | — | — | |||||||||||||||
Net income | $ | 16,169 | $ | 12,063 | $ | 13,063 | $ | 4,497 | $ | 4,053 | ||||||||||
Net income per common share (basic and diluted) | $ | 277.48 | $ | 119.28 | $ | 127.84 | $ | 44.01 | $ | 39.66 | ||||||||||
Weighted average number of shares used in per share calculation (basic and diluted)(3) | 58,270 | 101,133 | 102,182 | 102,182 | 102,182 | |||||||||||||||
9
Table of Contents
| As of December 31, | As of June 30, | ||||||||||||
| 2004 | 2005(1) | 2006 | 2007 | ||||||||||
| (audited) | (unaudited) | ||||||||||||
| (in thousands) | |||||||||||||
Balance Sheet Data: | |||||||||||||
Cash and cash equivalents | $ | 6,902 | $ | 12,964 | $ | 20,482 | $ | 18,034 | (4) | ||||
Working capital(5) | 51,843 | 92,846 | 98,222 | 104,267 | |||||||||
Total assets | 172,522 | 248,311 | 292,575 | 344,449 | |||||||||
Long-term debt (including capital leases) | 60,274 | 119,628 | 120,209 | 120,703 | |||||||||
Total debt | 70,045 | 125,041 | 137,862 | 144,585 | |||||||||
Total shareholders’ equity | 30,189 | 25,567 | 38,337 | 45,633 | |||||||||
Other Data: | |||||||||||||
Cash dividends per common share(6) | $ | 0.00 | $ | 197.76 | $ | 0.00 | $ | 0.00 | |||||
| (1) | In 1990, we formed Centel. In September 2001, we exchanged with the management of Centel our interest in Centel for the Intcomex shares held by the management of Centel. We re-acquired all interests in Centel on June 23, 2005 and, as a result, the financial and other data for the year ended December 31, 2005 includes the financial information for Centel commencing on the date of its re-acquisition. |
| (2) | Represents minority shareholders’ interests in Intcomex Costa Rica Mayorista en Equipo de Computo, S.A., Intcomex Ecuador, S.A. and Intcomex Jamaica, Ltd. We acquired all of the outstanding common stock held by those minority shareholders on August 30, 2004 subsequent to the CVC International investment in our company. |
| (3) | In 2004, the weighted average number of shares used in per share calculations reflects the impact of the recapitalization of our company as of August 31, 2004 in connection with the CVC International investment in our company. In 2005, the weighted average number of shares used in per share calculations reflects the issuance of 2,182 shares of Class B non-voting common stock to the sellers of Centel in connection with our re-acquisition of Centel on June 23, 2005. |
| (4) | Includes $47 of certificates of deposit-restricted as of June 30, 2007. |
| (5) | Working capital is defined as current assets less current liabilities. |
(6) | In August 2005, we paid a one-time cash dividend of $20.0 million, or $197.76 per share, to all of our then existing stockholders. The dividend was paid out of proceeds of the offering of our 11 3/4% Notes that was completed in August 2005. The per common share amount is based on 102,182 shares outstanding as of August 25, 2005. |
10
Table of Contents
Any investment in our common stock involves a high degree of risk. You should carefully consider the material risks described below together with all of the other information included in this prospectus before making an investment decision. If any of the following risks actually occurs, our business, results of operations or financial condition would likely suffer. In such an event, the trading price of our common stock could decline and you could lose all or part of your investment.
Risks Relating to Our Business
We operate in a highly competitive environment and, as a result, we may not be able to compete effectively or maintain or increase our sales, market share or margins.
The IT products distribution industry in Latin America and the Caribbean is highly competitive. The factors on which IT distributors compete include:
| • | price; |
| • | availability and quality of products and services; |
| • | terms and conditions of sale; |
| • | availability of credit and credit terms; |
| • | timeliness of delivery; |
| • | flexibility in tailoring specific solutions to customers’ needs; |
| • | effectiveness of marketing and sales programs; |
| • | availability of technical and product information; and |
| • | availability and effectiveness of warranty programs. |
The IT products distribution industry in Latin America and the Caribbean is very fragmented. In certain markets, we compete against large multinational public companies (including Ingram Micro, Tech Data, SYNNEX and Bell Microproducts) that are significantly better capitalized than we are and potentially have greater bargaining power with vendors than we do. In addition, our main competitor in Mexico, Ingram Micro, has a significantly larger market share than we do in that country. In all of our in-country markets, we also compete against a substantial number of locally-based distributors, many of which have a lower cost structure than we do, in some cases because they operate in the gray market and the local “informal” economy. Due to intense competition in our industry, we may not be able to compete effectively against our existing competitors or against new entrants to the industry, or to maintain or increase our sales, market share or margins.
Our relatively high margins, together with improving regional economic conditions, may attract new competitors into our markets, which could result in the loss of our market share and may cause our results of operations to decline.
Historically, we have had relatively high margins as compared to our public company competitors. Our relatively high margins may attract new competition into our markets, including competition from companies employing alternate business models such as manufacturer direct sales. Improvements in economic conditions in countries in which we operate, including an increase in per capita income levels, will likely lead to an increase in demand for IT products in these countries, thereby making our business more attractive to our competitors. Loss of existing or future market share to new competitors and increased price competition could hurt our results of operations.
11
Table of Contents
Our management and financial reporting systems, internal and disclosure controls and finance and accounting personnel may not be sufficient to meet our management and reporting needs.
We rely on a variety of management and financial reporting systems and internal controls to provide management with accurate and timely information about our business and operations. This information is important to enable management to capitalize on business opportunities and identify unfavorable developments and risks at an early stage. We also rely on these management and financial reporting systems and internal and disclosure controls to enable us to prepare accurate and timely financial information for our investors.
The challenge of establishing and maintaining sufficient systems and controls and hiring, retaining and training sufficient accounting and finance personnel has intensified as our business has grown rapidly in recent years and expanded into new geographic markets. As a result, we have identified the need to expand our finance and accounting staff and enhance internal controls at both the corporate and in-country levels, and to enhance the training of in-country management personnel regarding internal controls and management reporting, to meet our current needs. This process is ongoing. For example, although we expect our new company-wide financial reporting system Sentai to enhance the control of daily operating functions by our senior management, Sentai has yet to be implemented in three out of 12 countries in which we have operations. In addition, although we have recently hired a corporate controller with responsibility for our SEC reporting as well as two controllers for our subsidiaries in Argentina and Guatemala, we are still seeking to add personnel to our finance and accounting staff. In addition, we are enhancing existing controls and instituting new controls at our consolidated and subsidiary operating levels.
Although we believe our current management and financial reporting systems, internal and disclosure controls and finance and accounting personnel are sufficient to enable us to effectively manage our business, identify unfavorable developments and risks at an early stage and produce financial information in an accurate and timely manner, we cannot be sure this will be the case. In addition, a control system, no matter how well designed and operated, can provide only reasonable, not absolute, assurance that its objectives are met. Its inherent limitations include the realities that judgments in decision-making can be faulty and failures can occur because of a simple mistake. Moreover, controls can be circumvented by the acts of an individual, collusion of two or a group of people or by management’s decision to override the existing controls. For example, although immaterial in amount, two employees of our Panama subsidiary colluded to commit check fraud which went undetected from mid-2002 to early 2006.
Deficiencies in our controls may have contributed to the circumstances that led to our recent settlements following a tax audit with the Uruguayan tax and customs authorities. These settlements resulted in a net pretax charge of $3.8 million to the company in the second quarter of 2007 as described under “Management’s Discussion and Analysis of Financial Condition and Results of Operations—Uruguay Tax Audit.” Moreover, a targeted review of various internal controls in our in-country operations related to certain key components of our financial statements initiated as a follow up to the Uruguay tax audit indicated various areas in which controls should be improved. We have implemented, or are implementing, control improvements to address these issues.
We believe that we will also need to continue to expand our finance and accounting staff and enhance internal controls at both the corporate and in-country levels, and to enhance the training of in-country management personnel regarding internal controls and management reporting, to meet our future needs as a result of our anticipated or future growth. We cannot be sure that we will be able to take all necessary actions in a timely manner in order to keep pace with our anticipated growth.
Our failure to establish and maintain sufficient management and financial reporting systems and internal and disclosure controls, to hire, retain and train sufficient accounting and finance personnel, and to enhance the training of in-country management personnel regarding internal controls and management reporting could impair our ability to prepare accurate and timely financial information, hinder our growth and have a material adverse effect on our current or future business, results of operations and financial condition.
12
Table of Contents
We are exposed to increased costs associated with complying with the Sarbanes-Oxley Act of 2002 and other corporate governance and disclosure standards. Compliance efforts could divert management time from revenue-generating activities to compliance activities and failures to comply could cause reputational harm, a decline of the trading price of our securities and additional costs to remedy shortcomings.
The Sarbanes-Oxley Act of 2002, or SOX, as well as rules implemented by the SEC and the Nasdaq Global Market, require us to adopt various corporate governance practices and implement various internal controls when we become a public company. Our efforts to comply with evolving laws, regulations and standards applicable to public companies have resulted in, and are likely to continue to result in, increased expenses and a diversion of management time from revenue-generating activities to compliance activities.
In particular, Section 404 of SOX requires our management to annually review and evaluate our internal controls over financial reporting and attest to the effectiveness of these controls beginning with our fiscal year ended December 31, 2007. Our independent registered public accounting firm is required by SOX to attest to managements’ assessment beginning with our fiscal year ended December 31, 2008. We are currently working towards ensuring that adequate resources and expertise, both internal and external, are put in place to meet this requirement. To date, our ongoing efforts to comply with Section 404 have required the commitment of significant financial and managerial resources. Though we are currently making efforts to become compliant with Section 404 requirements in a timely manner, we may be unable to achieve compliance by the required dates. In the event that our Chief Executive Officer, Chief Financial Officer or independent registered public accounting firm determines that our controls over financial reporting are not effective as required by Section 404 of SOX at any time in the future, investor perceptions of us and our reputation may be adversely affected, the trading price of our securities may decline and we may incur significant additional costs to remedy shortcomings in our internal controls.
If the IT products market in Latin America and the Caribbean does not grow as we expect, we may not be able to maintain or increase our present growth rate and our results of operations and financial condition could be affected.
Historically, the growth of our business has been driven in large part by the growth of the IT products market in Latin America and the Caribbean. In particular, we have benefited from rapid growth in PC and Internet penetration rates. We expect that our future growth will also depend in large part on further growth in the IT market including growth in PC and Internet penetration rates and increasing demand for notebook computers. If the IT products market does not grow as quickly and in the manner we expect for any reason, including as a result of economic, political, social or legal developments in Latin America and the Caribbean, we may not be able to maintain or grow our business as expected which could have an impact on our results of operations and financial condition.
Economic, political, social or legal developments in Latin America and the Caribbean could hurt our results of operations and financial condition.
Historically, sales to Latin America and the Caribbean have accounted for almost all of our consolidated revenues. As a result, our financial results are particularly sensitive to the performance of the economies of countries in Latin America and the Caribbean. If local, regional or worldwide developments adversely affect the economies of any of the countries in which we do business, our results of operations and financial condition could be hurt. Our results are also impacted by political and social developments in the countries in which we do business and changes in the laws and regulations affecting our business in those regions. Changes in local laws and regulations could, among other things, make it more difficult for us to sell our products in the affected countries, restrict or prevent our receipt of cash from our customers, result in longer payment cycles, impair our collection of accounts receivable and make it more difficult for us to repatriate capital and dividends from our foreign subsidiaries to the ultimate U.S. parent company.
The economic, political, social and legal risks we are subject to in Latin America and the Caribbean include but are not limited to:
| • | deteriorating economic, political or social conditions; |
13
Table of Contents
| • | additional tariffs, import and export controls or other trade barriers that restrict our ability to sell products into countries in Latin America and the Caribbean; |
| • | changes in local tax regimes, including the imposition of significantly increased withholding or other taxes or an increase in value added tax or sales tax on products we sell; |
| • | changes in laws and other regulatory requirements governing foreign capital transfers and the repatriation of capital and dividends; |
| • | increases in costs for complying with a variety of different local laws, trade customs and practices; |
| • | delays in shipping and delivering products to us or customers across borders for any reason, including more complex and time-consuming customs procedures; and |
| • | fluctuations of local currencies. |
Any adverse economic, political, social or legal developments in the countries in which we do business could harm our results of operations and financial condition.
Fluctuations in foreign currency exchange rates could reduce our gross profit and gross margins and increase our operating expenses in U.S. dollar terms.
We generally do not engage in foreign currency hedging arrangements because either we do not believe it is cost-effective or it is not available to us for certain foreign currencies. Consequently, foreign currency fluctuations may adversely affect our results of operations, including our gross margins and operating margins.
A significant portion of our revenues from in-country operations is invoiced in currencies other than the U.S. dollar, and a significant amount of our in-country operating expenses are denominated in currencies other than U.S. dollars. In markets where we invoice in local currency, including Argentina, Chile, Colombia, Costa Rica, Guatemala, Jamaica, Mexico, Peru and Uruguay, the appreciation of a local currency will reduce our gross profit and gross margins in U.S. dollar terms. In markets where our books and records are prepared in currencies other than the U.S. dollar, the appreciation of a local currency will increase our operating expenses and decrease our operating margins in U.S. dollar terms.
Large and sustained devaluations of local currencies, like those that occurred in Brazil in 2000 and Argentina in 2001, can make many of our products more expensive in local currencies. This could result in our customers having difficulty paying those invoices and, in turn, result in decreases in revenue. Moreover, such devaluations may adversely impact demand for our products because our customers may be unable to afford them.
For a more detailed discussion of the effect of foreign currency fluctuations on our results of operations, see “Management’s Discussion and Analysis of Financial Condition and Results of Operations—Quantitative and Qualitative Disclosures About Market Risks—Foreign exchange risk.”
We could experience difficulties in staffing and managing our foreign operations, which could result in reduced revenues and difficulties in realizing our growth strategy.
We have many sales and distribution centers in multiple countries, which requires us to attract managers of our business in each of those locations. In establishing and developing many of our in-country sales and distribution operations, we have relied in large part on the local market knowledge and entrepreneurial skills of a limited number of local managers in those markets. We have no employment agreements with any of our in-country managers. The loss of the services of any of these managers could adversely impact our results of operations in the market in which the manager is located. Further, it may prove difficult to find and attract new talent (including accounting and finance personnel) in our existing markets or any new markets we enter in Latin America and the Caribbean who possess the expertise required to successfully manage and operate our in-country sales and distribution operations. If we fail to recruit highly qualified candidates, we may experience greater difficulty realizing our growth strategy, which could hurt our results of operations.
14
Table of Contents
If we lose the services of our key executive officers, we may not succeed in implementing our business strategy.
We are currently managed by certain key executive officers, including both of our founders, Anthony Shalom and Michael Shalom. These individuals have extensive experience and knowledge of our industry and the many local markets in which we operate. They also have been integral in establishing and expanding some of our most significant customer relationships and building our unique distribution platform. The loss of the services of these key executive officers could adversely affect our ability to implement our business strategy, and new members of management may not be able to successfully replace them. With the exception of an employment agreement with our Chief Financial Officer, we have no employment agreements with any of our key executive officers.
We are dependent on a variety of IT and telecommunications systems and are subject to additional risks, as we are in the process of implementing a new company-wide reporting system, and any disruptions in our existing systems or delays in implementing our new system could adversely impact our ability to effectively manage our business and prepare accurate and timely financial information.
We are dependent on a variety of IT and telecommunications systems, including systems for managing our inventories, accounts receivable, accounts payable, order processing, shipping and accounting. In addition, our ability to price products appropriately and the success of our expansion plans depend to a significant degree upon our IT and telecommunications systems. We are in the process of installing Sentai, a new company-wide financial reporting system. Sentai is a scalable IT system that enables simultaneous decentralized decision-making by our employees involved in sales and purchasing while permitting control of daily operating functions by our senior management. We are also using the Sentai logistics and inventory management system in order to better adapt to higher shipping volumes. The system has been implemented in eight of our 12 in-country locations and in our Miami location. We expect to complete implementation in the remaining locations by year-end 2008. Our experience with this new platform is limited and each new installation requires the training of our local employees. In addition, new installations may require further modifications in order to handle the different accounting requirements in each of the countries in which it is installed. Any delay in installation or temporary or long-term failure of these systems, once installed, could adversely impact our ability to effectively manage our business and prepare accurate and timely financial information. Also, our failure to adapt and upgrade our systems to keep pace with our future development and expansion could hurt our results of operations.
Our substantial debt could limit the cash flow available for our operations, which could adversely affect our business.
We have now and will continue to have a substantial amount of debt, which requires significant interest and principal payments. As of June 30, 2007, we had $144.6 million of total debt outstanding (consisting of $119.4 million outstanding under our 11 3/4% Notes, net of discount, a portion of which we intend to redeem or repurchase with the proceeds from this offering, $19.6 million outstanding under the revolving credit facility of SBA, $5.1 million of outstanding debt of our foreign subsidiaries and $0.5 million of capital leases). Subject to the limits contained in the indenture governing our 11 3/4% Notes and our other debt instruments, we may be able to incur additional debt from time to time to finance working capital, capital expenditures, investments or acquisitions, or for other purposes. If we incur additional debt, the risks related to our high level of debt could intensify. Specifically, our high level of debt could have important consequences to the holders of our common stock, including the following:
| • | limiting our ability to obtain additional financing to fund future working capital, capital expenditures, acquisitions or other general corporate requirements; |
| • | requiring a substantial portion of our cash flows to be dedicated to debt service payments instead of other purposes; |
| • | increasing our vulnerability to general adverse economic and industry conditions; |
| • | limiting our flexibility in planning for and reacting to changes in the industry in which we compete; |
15
Table of Contents
| • | placing us at a disadvantage compared to other, less leveraged competitors; and |
| • | increasing our cost of borrowing. |
The indenture governing our 11 3/4% Notes and the credit agreement governing SBA’s revolving credit facility impose significant operating and financial restrictions on our company and our subsidiaries, which may prevent us from capitalizing on business opportunities.
The indenture governing our 11 3/4% Notes imposes significant operating and financial restrictions on us. These restrictions limit our ability (and the ability of our subsidiaries) to, among other things:
| • | incur additional indebtedness or enter into sale and leaseback obligations; |
| • | pay certain dividends or make certain distributions on our capital stock or repurchase our capital stock; |
| • | make certain investments or other restricted payments; |
| • | place restrictions on the ability of subsidiaries to pay dividends or make other payments to us; |
| • | engage in transactions with shareholders or affiliates; |
| • | sell certain assets or merge with or into other companies; |
| • | guarantee indebtedness; and |
| • | create liens. |
SBA’s revolving credit facility limits SBA’s ability, among other things, to:
| • | incur additional indebtedness; |
| • | make certain capital expenditures; |
• | guarantee obligations, other than SBA’s guarantee of our 11 3/4% Notes; |
• | create or allow liens on assets, other than liens securing our 11 3/4% Notes; |
| • | make investments, loans or advances; |
| • | pay dividends, make distributions and undertake stock and other equity interest buybacks; |
| • | make certain acquisitions; |
| • | engage in mergers, consolidations or sales of assets; |
| • | use proceeds of the revolving credit facility for certain purposes; |
| • | enter into certain lease obligations; |
| • | enter into transactions with affiliates on non-arms’ length terms; |
| • | sell or securitize receivables; |
| • | make certain payments on subordinated indebtedness; or |
| • | create or acquire subsidiaries. |
In addition, SBA’s revolving credit facility requires SBA to:
| • | maintain a tangible effective net worth (tested quarterly) of at least $37.0 million, which minimum level shall decline from the end of the third fiscal quarter of 2006 to the end of the third fiscal quarter of 2007 to $25.0 million and remain at $25.0 million thereafter; |
16
Table of Contents
| • | maintain a ratio of senior debt to tangible effective net worth (tested quarterly) of not more than 2.5 to 1.0; |
| • | maintain for the fiscal year ending December 31, 2007, net income of not less than $7.5 million; and |
| • | maintain as of the last day of each fiscal year, commencing with the fiscal year ending December 31, 2008, a fixed charge coverage ratio of not less than 1.0 to 1.0. |
As a result of these covenants and restrictions, we are limited in how we conduct our business and we may be unable to raise additional debt financing to compete effectively or to take advantage of new business opportunities. The terms of any future indebtedness we may incur could include more restrictive or additional covenants.
We may not be able to maintain compliance with our current debt covenants or any additional covenants in the future and our failure to do so could adversely impact our liquidity.
In 2006, SBA was in default under its revolving credit facility with Comerica Bank as a result of SBA’s repayment of a portion of the outstanding principal under our intercompany loan to SBA. SBA was prohibited from repaying any principal under the intercompany loan pursuant to a subordination agreement with the lender under the revolving credit facility. The lender granted a waiver of the default and amended the revolving credit facility and related subordination agreement to allow SBA to repay the principal under the intercompany loan ($22.6 million of which remains outstanding), which amounts we expect to use to pay interest and a portion of the sinking funds payments due under our 11 3/4% Notes. As of March 31, 2007, SBA was in default on its capital expenditure covenant under its revolving credit facility with Comerica Bank due to a delay in the relocation of our main warehouse and headquarters in Miami and a resulting delay in the timing of capital expenditures. On May 14, 2007, SBA requested and received a waiver from Comerica Bank on the covenant default and on May 15, 2007 an amendment to the revolving credit facility was signed increasing the facility to $27.5 million from $25.0 million and raising the 2007 capital expenditure limit to $2.5 million from $1.0 million.
We may not be able to maintain compliance with our current covenants or any additional covenants in the future and, if we fail to do so, we may not be able to obtain waivers from the lenders or amend any such covenants on acceptable terms or at all. If we fail to obtain such waivers or a replacement facility, we may not have resources sufficient at our parent company level or otherwise to meet our anticipated debt service requirements, capital expenditures and working capital needs.
Our and SBA’s failure to comply with the restrictive covenants described above could result in an event of default, which, if not cured or waived, could result in either of us having to repay our respective borrowings before their respective due dates. If we or SBA is forced to refinance these borrowings on less favorable terms, our results of operations or financial condition could be harmed. In addition, if we are in default under any of our existing or future debt facilities, we also will not be able to borrow additional amounts under those facilities to the extent they would otherwise be available and may not be able to repay our existing indebtedness.
We have significant credit exposure to our customers. If we are unable to effectively manage our accounts receivable, it could result in longer payment cycles, increased collection costs and defaults exceeding our expectations and adversely impact the cost or availability of our financing.
We extend credit for a significant portion of sales to our customers. We are subject to the risk that if our customers fail to pay or delay payment for the products they purchase from us, it could result in longer payment cycles, increased collection costs, defaults exceeding our expectations and an adverse impact on the cost or availability of financing. These risks may be exacerbated by a variety of factors, including adverse economic conditions, decreases in demand for our products and negative trends in the businesses of our customers.
17
Table of Contents
We have a number of credit facilities under which the amount we are able to borrow is based on the value and quality of our accounts receivable. The value and quality of our accounts receivable is affected by several factors, including:
| • | the collectibility of our accounts receivable; |
| • | general and regional industry and economic conditions; and |
| • | our and our customers’ financial condition and creditworthiness. |
Any reduction in our borrowing capacity under these credit facilities could adversely affect our ability to finance our working capital and other needs.
Although we obtain credit insurance against the failure to pay or delay in payment for our products by some of the customers of our Miami operations, our results of operations and liquidity could be hurt by a loss for which we do not have insurance or that is subject to an exclusion or that exceeds our applicable policy limits. In addition, increasing insurance premiums could adversely affect our results of operations. Moreover, failure to obtain credit insurance may have a negative impact on the amount of borrowing capacity available to our Miami-based operations under SBA’s revolving credit facility.
Our expansion into new markets may present additional risks, which may limit our success in those markets and could hurt our results of operations.
We currently have in-country sales and distribution operations in 12 Latin American and Caribbean countries and a sales office in Brazil. We expect to enter into new geographic markets both within the countries where we already conduct operations and in new countries where we have no prior operating or distribution experience. In new markets, we will face challenges such as customers’ lack of awareness of our brand, difficulties in hiring personnel and our unfamiliarity with local markets. New markets may also have different competitive conditions from our existing markets and may generate lower margins. Any failure on our part to recognize or effectively respond to these differences may limit the success of our operations in those markets, and could hurt our results of operations.
We depend on a relatively small number of vendors for products that make up a significant portion of our revenue and the loss of a relationship with any of our key vendors may hurt our results of operations.
A significant portion of our revenue is derived from products manufactured by a relatively small number of vendors. For the six months ended June 30, 2007 and the years ended December 31, 2006 and 2005, our top ten vendors manufactured products that accounted for 65.0%, 63.8% and 64.0% of our revenue, respectively, and the products of one top vendor accounted for 16.8% of our revenue in the six months ended June 30, 2007, the products of the same top vendor accounted for 14.8% of our revenue in 2006 and the products of a different top vendor accounted for 14.8% of our revenue in 2005. We expect that we will continue to obtain most of our products from a relatively small number of vendors and that the portion of our revenue that we obtain from such vendors may continue to increase in the future. Due to intense competition in the IT products distribution industry, our key vendors can choose to work with other distributors and, pursuant to standard terms in our vendor agreements, may terminate their relationships with us on short notice. The loss of a relationship with any of our key vendors may hurt our results of operations.
If we are unable to obtain sufficient trade credit from our vendors or other sources in a timely manner and on reasonable terms, our results of operations could be adversely affected and our growth inhibited.
Our business is working capital intensive and our vendors historically have been an important source of funding our business growth through the provision of trade credit. We expect to continue to rely on trade credit from our vendors to provide a significant amount of our working capital. If our vendors fail to provide us with sufficient trade credit, including larger amounts of trade credit, in a timely manner as our business grows, we
18
Table of Contents
may have to rely on other sources of financing, which may not be readily available or, if available, may not be on terms acceptable or favorable to us. If we are unable to obtain sufficient trade credit from our vendors or other sources in a timely manner, our results of operations could be adversely affected and our growth inhibited.
In addition, our ability to pay for products is largely dependent on our principal vendors providing us with payment terms that facilitate the efficient use of our capital. The payment terms we receive from our vendors are based on several factors, including (i) our recent operating results, financial position (including our level of indebtedness) and cash flows; (ii) our payment history with the vendor; (iii) the vendor’s credit granting policies (including any contractual restrictions to which it is subject), our creditworthiness (as determined by various entities) and general industry conditions; (iv) prevailing interest rates; and (v) the vendors’ ability to obtain credit insurance in respect of amounts that we owe. Adverse changes in any of these factors, many of which are not within our control, could increase the costs to us of financing our inventory and may limit or eliminate our ability to obtain vendor financing and hurt our results of operations and financial condition.
Our vendors generally can unilaterally change the terms of the sales agreements for future orders and if they adversely change the terms, our results of operations could be hurt.
The sales agreements provided by our vendors are generally at will agreements that have short terms. Generally, each vendor has the ability to unilaterally change the terms and conditions of its sales agreements for future orders, including by reducing the level of purchase discounts, rebates and marketing programs available to us. If we are unable to pass the impact of these changes through to our reseller and retailer customers (usually through increased prices), our results of operations could be hurt.
We are dependent on vendors to maintain adequate inventory levels and oversupplies may adversely affect our margins and product shortages may adversely affect our revenues and costs.
We depend on our vendors to maintain adequate inventory. Our inventory levels may vary from period to period, due primarily to the anticipated and actual sales levels and our purchasing levels. The IT industry occasionally experiences an oversupply of IT products, which vendors then sell on the market at reduced prices. The most recent example of such an oversupply that affected us was the excess supply of Intel processors at the end of 2005 and during the first half of 2006, which resulted in us selling Intel processors at prices below our cost. Although we continued buying and distributing Intel processors during that period to maintain our relationship with Intel, our margins were adversely affected despite rebates we received from Intel at the end of 2006. If similar oversupplies occur in the future, our results of operations could be adversely affected again.
The IT industry is also characterized by periods of severe product shortages due to vendors’ difficulties in projecting demand for certain products distributed by us. When such product shortages occur, we typically receive an allocation of products from the vendor. Our vendors may not be able to maintain an adequate supply of products to fulfill all of our customer orders on a timely basis and the costs of these products to us may increase. Any supply shortages or delays (some or all of which are beyond our control) could cause us to be unable to service customers on a timely basis. If the decline in sales or increased costs due to product shortages is not offset by higher margins, this could hurt our results of operations.
We are subject to the risk that our inventory values may decline, which could adversely affect our results of operations.
The IT products distribution industry is subject to rapid technological change, new and enhanced product specification requirements and evolving industry standards. These factors may cause a substantial decline in the value of our inventory or may render all or substantial portions of our inventory obsolete. Changes in customs or security procedures in the countries through which our inventory is shipped, as well as other logistical difficulties that slow the movement of our products to our customers, can also exacerbate the impact of these factors. While some of our vendors offer us limited protection against the decline in value of our inventory due to technological
19
Table of Contents
change or new product developments in the form of credit or partial refunds, these protective policies are largely subject to the discretion of our vendors and change from time to time. In addition, we distribute private label products for which price protection and rights of return are not customarily contractually available, and for which we bear increased risks. In any event, the protective terms of our vendor agreements may not adequately cover declines in our inventory value and these vendors may discontinue providing these terms at any time in the future. Any decline in the value of our inventory not offset by vendor credits or refunds could adversely affect our results of operations.
If our vendors fail to respond quickly to technological changes and innovations and our product offerings fail to satisfy consumers’ tastes or respond to changes in consumer preferences, our revenues may decline and our competitors may gain additional market share.
Our ability to stay competitive in the IT products distribution industry and increase our customer base depends on our ability to offer, on a continuous basis, a selection of appealing products that reflect our customers’ preferences. To be successful, our product offerings must be broad in scope, competitively priced, well-made, innovative and attractive to a wide range of consumers whose preferences may change regularly. This depends in large part on the ability of our key vendors to respond quickly to technological changes and innovations and to manufacture new products that meet the new and changing demands of our customers and requires on the part of vendors a continuous investment of resources to develop and manufacture new products. If our key vendors fail to respond on a timely basis to the rapid technological changes that have been characteristic of the IT products industry, fail to provide new products that are desired by consumers or otherwise fail to compete effectively against other IT products manufacturers, the products that we offer may be less desirable to consumers and we could suffer a significant decline in our revenue. The ability and willingness of our vendors to develop new products depends on factors beyond our control. If our product offerings fail to satisfy consumers’ tastes or respond to changes in consumer preferences, our revenues may decline and our competitors may gain additional market share.
Direct sourcing by our customers could result in our customers reducing their purchases from us, which would hurt our results of operations.
We occupy a position in the middle of the IT products distribution chain in Latin America and the Caribbean, between IT product vendors, on the one hand, and locally-based distributors, resellers and retailers, on the other. Further industry consolidation, increased competition, technological changes and other developments, including improvements in regional infrastructure, may cause our vendors to bypass us and sell directly to our customers. As a result, our distributor, reseller and retailer customers and our vendors may increase the level of direct business they do with each other, which could reduce their purchases from us and hurt our results of operations.
We may suffer from theft of inventory, which could result in losses and increases in security and insurance costs.
We store significant quantities of inventory at warehouses in Miami and throughout Latin America and the Caribbean. We and our third party shippers have experienced inventory theft at, or in transit to or from, certain facilities in several of our locations at various times in the past. In the future, we may be subject to significant inventory losses due to theft from our warehouses, hijacking of trucks carrying our inventory or other forms of theft. The implementation of security measures beyond those we already utilize, which include the establishment of alarm systems in our warehouses, GPS tracking systems on delivery vehicles and armed escorts for shipment of our products, in each case in certain of our locations, would increase our operating costs.
Any losses of inventory could exceed the limits of, or be subject to an exclusion from, coverage under our insurance policies. In addition, claims filed by us under our insurance policies could lead to increases in the insurance premiums payable by us or the termination of coverage under the relevant policy. As a result, losses of inventory, whether or not insured, could adversely affect our results of operations.
20
Table of Contents
We rely on third party shippers and carriers whose operations are outside our control, and any failure by them to deliver products to our customers in a timely manner may damage our reputation and could cause us to lose customers.
We rely on arrangements with third-party shippers and carriers such as independent shipping companies for timely delivery of our products to our in-country sales and distribution operations and third-party distributors, resellers and retailers. As a result, we are subject to carrier disruptions and increased costs due to factors that are beyond our control, including labor strikes, inclement weather and increased fuel costs. If the services of any of these third parties become unsatisfactory, we may experience delays in meeting our customers’ product demands and we may not be able to find a suitable replacement on a timely basis or on commercially reasonable terms. Any failure to deliver products to our customers in a timely manner may damage our reputation and could cause us to lose customers.
We may not realize the expected benefits from any future acquisitions, thereby adversely impacting our growth.
As part of our strategy, we may pursue acquisitions in the future. Our success in realizing the expected benefits from any business acquisitions depends on a number of factors, including retaining or hiring local management personnel to run our operations in new countries, successfully integrating the operations, IT systems, customers, vendors and partner relationships of the acquired companies and devoting sufficient capital and management attention to the newly acquired companies in light of other operational needs. Our efforts to implement our strategy could be affected by a number of factors beyond our control, such as increased competition and general economic conditions in the countries where the newly acquired companies operate. Any failure to effectively implement our strategy could adversely impact our growth.
We anticipate that we may need to raise additional financing to grow our business but it may not be available on terms acceptable to us, if at all.
We expect our operating expenditures and working capital needs will increase over the next several years as our sales volume increases and we expand our geographic presence and product portfolio. We currently believe that our cash on hand, anticipated cash provided by operations, available and anticipated trade credit and borrowings under SBA’s revolving credit facility and our in-country lines of credit, will provide sufficient resources to meet our anticipated debt service requirements, capital expenditures and working capital needs for the next 12 months. However, if our results of operations are not as favorable as we anticipate (including as a result of increased competition), our funding requirements are greater than we expect (including as a result of growth in our business) or our liquidity sources are not at anticipated levels (including levels of available trade credit), our resources may not be sufficient and we may have to raise additional capital to support our business. In addition, we may not be able to accurately predict future operating results or changes in our industry which may change these needs. In the event that such additional financing is necessary, we may seek to raise such funds through public or private equity or debt financing or other means. We may not be able to obtain additional financing when we need it, or we may not be able to raise financing on terms acceptable to us. In the event that adequate funds are not available in a timely manner, our business and results of operations may be harmed.
We are exposed to the risk of natural disasters, war and terrorism that could disrupt our business and result in increased operating costs and capital expenditures.
Our Miami headquarters, some of our sales and distribution centers and certain of our vendors and customers are located in areas prone to natural disasters such as floods, hurricanes, tornadoes or earthquakes. In addition, demand for our services is concentrated in major metropolitan areas. Adverse weather conditions, major electrical or telecommunications failures or other events in these major metropolitan areas may disrupt our business and may adversely affect our ability to distribute products. Our exposure to these risks may be heightened because we do not have a comprehensive disaster recovery system or disaster recovery plan. Our failure to have such a system or plan in place could hurt our results of operations and financial condition.
21
Table of Contents
We operate in multiple geographic markets, several of which may be susceptible to acts of war and terrorism. Security measures and customs inspection procedures have been implemented in a number of jurisdictions in response to the threat of terrorism. These procedures have made the import and export of goods, including to and from our Miami headquarters, more time-consuming and expensive. Such measures have added complexity to our logistical operations and may extend our inventory cycle. Our business may be harmed if our ability to distribute products is further impacted by any such events. In addition, more stringent processes for the issuance of visas and the admission of non-U.S. persons to the United States may make travel to our headquarters in Miami by representatives of some vendors and customers more difficult. These developments may also hurt our relationships with these vendors and customers.
The combination of the factors described above could diminish the attractiveness of Miami as a leading business center for Latin America and the Caribbean in general, and as the central hub for the Latin American and Caribbean IT products distribution industry in particular. In the event of the emergence of one or more other hubs serving Latin America and the Caribbean that are more favorable to IT distributors, competitors operating in those locations could have an advantage over us. The relocation of all or a part of our main warehouse and logistics center in Miami to any such new hubs could materially increase our operating costs or capital expenditures.
In addition, because of concerns arising from large damage awards and incidents of terrorism, it has become increasingly difficult for us to obtain adequate terrorism insurance coverage at reasonable premiums, which has increased our costs.
Risks Relating to Our Common Stock and This Offering
Concentration of ownership among our existing executive officers, directors and principal stockholders may prevent new investors from influencing significant corporate decisions.
Upon consummation of this offering, our executive officers, directors and principal stockholders will own, in the aggregate, approximately % of our outstanding common stock on a fully diluted basis. As a result, these stockholders will be able to exercise control over all matters requiring stockholder approval, including the election of directors, amendment of our amended and restated certificate of incorporation and approval of significant corporate transactions and will have significant control over our management and policies. The directors elected and appointed by these stockholders will be able to make decisions affecting our capital structure, including decisions to issue additional capital stock, implement stock repurchase programs and incur indebtedness. The interests of these stockholders may not be aligned with your interests as a holder of our common stock.
This control by our executive officers, directors and principal stockholders may have the effect of deterring hostile takeovers, delaying or preventing changes in control or changes in management, or limiting the ability of our other stockholders to approve transactions that they may deem to be in their best interests.
The interests of our principal stockholder may not be aligned with yours.
Upon the consummation of this offering, CVC International will remain a significant stockholder with % of our outstanding common stock on a fully diluted basis. As a significant stockholder, CVC International will be able to exert significant influence on major decisions requiring stockholder approval, including the election of our board of directors, the selection of our management team, the determination of our corporate and management policies and certain other decisions relating to fundamental corporate actions. CVC International’s interests may not be aligned with your interests as a holder of our common stock.
No public market for our common stock currently exists, and we cannot assure you that an active, liquid trading market will develop or be sustained following this offering.
Prior to this offering, there has been no public market for our common stock. An active, liquid trading market for our common stock may not develop or be sustained following this offering. As a result, you may not
22
Table of Contents
be able to sell your shares of our common stock quickly or at the market price. The initial public offering price of our common stock will be determined by negotiations between us, the selling stockholder and the underwriters based upon a number of factors and may not be indicative of prices that will prevail following the consummation of this offering. The market price of our common stock may decline below the initial public offering price, and you may not be able to resell your shares of our common stock at or above the initial offering price and may suffer a loss on your investment.
The price of our common stock may fluctuate significantly, and it may trade at prices below the initial public offering price.
The market price of our common stock after this offering is likely to fluctuate significantly from time to time in response to factors including:
| • | investors’ perceptions of our prospects and the prospects of the IT distribution industry; |
| • | investors’ perceptions of the geographic markets in which we operate; |
| • | differences between our actual financial and operating results and those expected by investors and analysts; |
| • | changes in analysts’ recommendations or projections; |
| �� | fluctuations in quarterly operating results; |
| • | announcements by us or our competitors of significant acquisitions, divestitures, strategic partnerships, joint ventures or capital commitments; |
| • | changes or trends in our industry; |
| • | changes in the economic performance or market valuations of other IT distribution companies in general; |
| • | changes in relationships with vendors; |
| • | potential litigation; |
| • | additions or departures of key personnel; |
| • | changes in general economic conditions; and |
| • | broad market fluctuations. |
These factors may adversely affect the market price of our common stock, in many cases regardless of our actual operating performance. As a result, our common stock may trade at prices significantly below the initial public offering price.
Citigroup Global Markets Inc. may have a conflict of interest with respect to this offering.
Prior to the completion of this offering, CVC International, an affiliate of Citi, owned more than 10% of our outstanding common stock and therefore Citi is presumed to have a “conflict of interest” with us under Rule 2720 of the NASD Rules. Citi may also have a conflict of interest with us because CVC International is receiving all of the proceeds from the sale of its shares in this offering. Accordingly, Citi’s interest may go beyond receiving customary underwriting discounts and commissions. In particular, there may be a conflict of interest between Citi’s own interests as underwriter (including in negotiating the initial public offering price) and the interests of its affiliate CVC International (including as recipient of part of the offering proceeds). Because of the conflict of interest under Rule 2720, this offering is being conducted in accordance with the applicable provisions of that rule. Rule 2720 requires that the initial public offering price of the common stock be no higher than that recommended by a “qualified independent underwriter” (as such term is defined by Rule 2720), that also participates in the preparation of the registration statement and prospectus and conducts due diligence. Accordingly, UBS is assuming the responsibilities of acting as the qualified independent underwriter in this
23
Table of Contents
offering. The initial public offering price of the common stock will be no higher than the price recommended by UBS. Although the qualified independent underwriter has participated in the preparation of the registration statement and prospectus, conducted due diligence and made a recommendation with respect to the initial offering price, we cannot assure you that this will adequately address any potential conflicts of interest related to Citi and CVC International. We have agreed to indemnify UBS for acting as qualified independent underwriter against certain liabilities, including liabilities under the Securities Act, and to contribute to payments that UBS may be required to make for these liabilities.
Future sales of our common stock, or the perception that such sales may occur, could cause our stock price to fall.
Upon consummation of this offering, we expect that shares of our common stock will be outstanding, assuming no exercise of outstanding options, and shares if the underwriters’ over-allotment option is exercised in full. All of the shares sold in this offering will be freely transferable without restriction or further registration under the Securities Act, except for any shares purchased by our affiliates. Of the remaining shares outstanding, following expiration of the 180-day lock-up agreement described below, shares may be sold at any time without restriction and shares will be restricted securities within the meaning of Rule 144 under the Securities Act, but will be freely transferable subject to the applicable volume, manner of sale, holding period and other limitations of Rule 144 or under other exemptions from registration. Sales of substantial amounts of our common stock in the public market after the consummation of this offering, or the perception that such sales may occur, could adversely affect the market price of our common stock and could materially impair our future ability to raise capital through offerings of our common stock. See “Shares Eligible for Future Sale” for a more detailed description of the restrictions on selling shares of our common stock after this offering.
We, our officers and directors, the selling stockholder and our other existing stockholders and option holders have agreed, subject to limited exceptions, that for a period of 180 days from the date of this Prospectus, each will not, without the prior written consent of Citi and UBS, dispose of or hedge any shares of our common stock or any securities convertible or exchangeable for our common stock. Citi and UBS in their sole discretion may release any of the securities subject to these lock-up agreements at any time without notice.
Purchasers in this offering will experience immediate and substantial dilution.
Prior investors have paid substantially less per share than the price in this offering. The initial public offering price is substantially higher than the net tangible book value per share of the outstanding common stock immediately after this offering. As a result, investors purchasing our common stock in this offering will incur immediate dilution of $ per share. For more information regarding effects of dilution, see the section entitled “Dilution” appearing elsewhere in this prospectus. The exercise of outstanding options and future equity issuances at prices below the initial public offering price would result in further dilution to purchasers in this offering.
We do not expect to pay any dividends for the foreseeable future.
We currently intend to retain future earnings to fund on-going operations and finance the growth and development of our business and, therefore, do not anticipate declaring or paying cash dividends on our common stock for the foreseeable future. Accordingly, investors must be prepared to rely on sales of their common stock after price appreciation to earn an investment return, and we cannot assure you that the price of our common stock will increase. Investors seeking cash dividends should not purchase our common stock. Any determination to pay dividends in the future will be made at the discretion of our board of directors and will depend on our results of operations, financial conditions, contractual restrictions, restrictions imposed by applicable law and other factors our board deems relevant.
24
Table of Contents
DISCLOSURE REGARDING FORWARD-LOOKING STATEMENTS
This prospectus contains forward-looking statements that are based on our current expectations, beliefs, estimates, forecasts, projections and management assumptions about our company, our future performance, our liquidity and the IT products distribution industry. Such forward-looking statements include statements regarding expected financial results and other planned events, including but not limited to, anticipated liquidity and liquidity needs, indebtedness and capital expenditures. Words such as “anticipate,” “assume,” “believe,” “estimate,” “expect,” “intend,” “plan,” “seek,” “project,” “target,” “goal” and variations of such words and similar expressions are intended to identify such forward-looking statements. These forward-looking statements involve a number of risks and uncertainties that could cause actual results to differ materially from those suggested by the forward-looking statements. Forward-looking statements should, therefore, be considered in light of various factors, including those set forth in this prospectus under “Risk Factors,” “Management’s Discussion and Analysis of Financial Condition and Results of Operations—Overview” and elsewhere in this prospectus.
These risks and uncertainties include, but are not limited to, the following:
| • | an increase in competition in the markets in which we operate or plan to operate; |
| • | difficulties in maintaining and enhancing internal controls and management and financial reporting systems; |
| • | adverse changes in general, regional and country-specific economic and political conditions in Latin America and the Caribbean; |
| • | fluctuations of other currencies relative to the U.S. dollar; |
| • | difficulties in staffing and managing our foreign operations; |
| • | departures of our key executive officers; |
| • | increases in credit exposure to our customers; |
| • | adverse changes in our relationships with vendors and customers; or |
| • | declines in our inventory values. |
This list of factors that may affect future performance and the accuracy of forward-looking statements is illustrative but not exhaustive. In addition, new risks and uncertainties may arise from time to time. Accordingly, all forward-looking statements should be evaluated with an understanding of their inherent uncertainty. We caution you not to place undue reliance on these forward-looking statements, which speak only as of the date they were made. We do not undertake any obligation to publicly release any revisions to these forward-looking statements to reflect events or circumstances after the date of this prospectus.
25
Table of Contents
We estimate that our net proceeds from the sale of the shares of common stock offered by us will be approximately $ million, or approximately $ million if the underwriters exercise their over-allotment option in full, after deducting the underwriting discount and estimated offering expenses payable by us of approximately $ million. This assumes an initial public offering price of $ per share, which is the midpoint of the price range set forth on the front cover of this prospectus. We will not receive any proceeds from the sale of shares by the selling stockholder, including with respect to any sale of shares resulting from an exercise by the underwriters of their option to purchase additional shares from the selling stockholder. The selling stockholder will receive all of the proceeds from the sale of its shares in the offering. Citigroup Global Markets Inc., one of the underwriters, is an affiliate of the selling stockholder.
Because the selling stockholder, an affiliate of Citi, currently owns approximately __% of our common stock on a fully diluted basis, this offering is being conducted in accordance with the applicable provisions of the NASD Rules. These rules require, among other things, that the initial public offering price of the common stock be no higher than that recommended by a “qualified independent underwriter” (as such term is defined by the rules). UBS is assuming the responsibilities of acting as the qualified independent underwriter in this offering. See “Risk Factors—Risks Relating to Our Common Stock and This Offering—Citigroup Global Markets Inc. may have a conflict of interest with respect to this offering.” and “Underwriting.”
We intend to use $ million of our net proceeds from this offering to redeem or repurchase a portion of our 11 3/4% Notes, which mature on January 15, 2011. The indenture governing the 11 3/4% Notes provides that the 11 3/4% Notes may be redeemed at a price of 106% of their principal amount prior to January 15, 2008. We may repurchase 11 3/4% Notes in privately negotiated transactions at such prices as may be agreed by us and the selling noteholders (if any). We intend to use the remainder of our net proceeds from the offering for general corporate purposes. Pending application of the net proceeds as described above, we intend to invest the net proceeds in short-term investment grade securities.
26
Table of Contents
The following table sets forth our cash and cash equivalents and our capitalization as of June 30, 2007. Our capitalization is presented:
| • | on an actual basis and |
| • | on an as adjusted basis to give effect to: |
| - | the sale by us of shares of our common stock, assuming that the underwriters do not exercise their option to purchase up to additional shares of common stock from us and that the initial public offering price is $ per share, the midpoint of the range set forth on the cover of this prospectus; |
| - | the intended application of the net proceeds of this offering as described in “Use of Proceeds,” as if the offering and the application of net proceeds of this offering had occurred on June 30, 2007; |
| - | the exchange by the holders of the 2,182 shares of Class B non-voting common stock for 2,182 shares of our voting common stock prior to or simultaneously with the completion of this offering; |
| - | the for one split of our common stock in the form of a stock dividend to our existing stockholders prior to or simultaneously with the completion of this offering; |
| - | the grant to certain of our officers and directors in February 2007 of stock options to purchase a total of 1,540 shares of our common stock; and |
| - | the restricted stock grants of 64 shares of common stock with a vesting period of one year for each third of such shares to two independent directors at the initial public offering price at the closing of this offering. |
This presentation should be read in conjunction with “Use of Proceeds,” “Management’s Discussion and Analysis of Financial Condition and Results of Operations” and our audited and unaudited consolidated financial statements and related notes that are included elsewhere in this prospectus.
As of June 30, 2007 | ||||||
| Actual | As Adjusted | |||||
| (in thousands, except share data) | ||||||
Cash and cash equivalents | $ | 18,034 | $ | |||
Short-term debt | ||||||
Lines of credit | | 23,882 | ||||
Current maturities of long-term debt | | 5,481 | ||||
Long-term debt | ||||||
11 3/4 % Second Priority Senior Secured Notes(1) | | 114,383 | ||||
Capital leases and other | | 839 | ||||
Total debt | 144,585 | |||||
Stockholders’ equity | ||||||
Common stock, voting, $0.01 par value, 140,000 shares authorized, 100,000 issued and outstanding; shares authorized, issued and outstanding, as adjusted | 1 | |||||
Common stock, non-voting, $0.01 par value, 10,000 shares authorized, 2,182 issued and outstanding; shares authorized, issued and outstanding, as adjusted | — | |||||
Additional paid-in-capital | 20,680 | |||||
Retained earnings | | 24,770 | ||||
Accumulated other comprehensive (loss) income | | 182 | ||||
Total stockholders’ equity | 45,633 | |||||
Total capitalization(2) | $ | 190,218 | $ | |||
| (1) | Net of discount. |
| (2) | Total capitalization includes total debt plus total stockholders’ equity. |
27
Table of Contents
If you invest in our common stock, your ownership interest will be diluted to the extent of the difference between the initial public offering price per share and the pro forma net tangible book value per share immediately after this offering. Net tangible book value per share represents the amount of total tangible assets less total liabilities divided by the number of shares of our common stock outstanding. As of June 30, 2007, our net tangible book value was approximately $7,963,000, or $77.93 per share of common stock. Dilution in the pro forma net tangible book value per share represents the difference between the amount per share paid by purchasers of common stock in this offering and the pro forma net tangible book value per share of common stock immediately after the consummation of this offering.
After giving effect to the sale of the shares of common stock at an assumed initial public offering price of $ per share (the midpoint of the range set forth on the cover of this prospectus) in this offering and after deducting underwriting discounts and commissions and estimated offering expenses payable by us and giving effect to the intended use of proceeds, our pro forma net tangible book value as of would have been approximately $ million, or $ per share of common stock. This represents an immediate increase in net tangible book value of $ per share to our existing stockholders and an immediate dilution of $ per share to new investors purchasing shares of common stock in this offering at the assumed initial offering price. Sales of shares by the selling stockholder in this offering do not affect our net tangible book value.
The following table illustrates this dilution on a per share basis:
Assumed initial public offering price per share | $ | $ | ||||
Net tangible book value per share as of June 30, 2007 | ||||||
Increase in net tangible book value per share attributable to this offering | ||||||
Pro forma net tangible book value per share after this offering | ||||||
Dilution per share to new investors | $ | $ | ||||
A $1.00 increase (decrease) in the assumed initial public offering price of $ per share would increase (decrease) our net tangible book value by $ million, our pro forma net tangible book value per share after this offering by $ million and the dilution per share to new investors by $ , assuming the number of shares offered by us, as set forth on the cover page of this prospectus, remains the same and after deducting the estimated underwriting discounts and commissions and estimated offering expenses payable by us.
The following table summarizes, on a pro forma basis, as of the number of shares of our common stock purchased from us, the total consideration paid to us, and the average price per share paid to us by our existing stockholders and to be paid by new investors purchasing shares of our common stock in this offering. The table assumes an initial public offering price of $ per share, as specified above, and deducts underwriting discounts and commissions and estimated offering expenses payable by us:
| Shares Purchased | Total Consideration | Average Price Per Share | ||||||||||||
| Number | Percentage | Amount | Percentage | |||||||||||
Existing stockholders | % | $ | % | $ | ||||||||||
New investors | % | $ | % | $ | ||||||||||
Total | 100.0 | % | $ | 100.0 | % | $ | ||||||||
If the underwriters exercise their over-allotment option in full, the number of shares of common stock held by new investors will increase to approximately shares, or approximately % of the total number of shares of our common stock to be outstanding after this offering, our existing stockholders would own
28
Table of Contents
approximately % of the total number of shares of our common stock to be outstanding after this offering, the pro forma net tangible book value per share of common stock would be approximately $ and the dilution in pro forma net tangible book value per share of common stock to new investors would be $ .
The number of shares of common stock outstanding excludes 1,540 shares of common stock issuable upon exercise of outstanding stock options granted to certain of our officers and directors with a weighted average exercise price of $1,077 per share, none of which were vested as of June 30, 2007. If these outstanding options are exercised, new investors will experience further dilution. The number of shares of common stock outstanding also excludes restricted stock grants of 64 shares of common stock that we intend to grant to two independent directors at the initial public offering price at the closing of this offering.
29
Table of Contents
We currently intend to retain future earnings to fund ongoing operations and finance the growth and development of our business, and do not anticipate declaring or paying cash dividends on our common stock for the foreseeable future.
We paid a $20.0 million dividend to stockholders in August 2005, using a portion of the proceeds from our offering of the 11 3/4% Notes. We did not pay any cash dividends in the years ended December 31, 2006, 2004, 2003 and 2002.
Any determination to pay dividends in the future will be made at the discretion of our board of directors and will depend on our results of operations, financial condition, contractual restrictions, restrictions imposed by applicable law and other factors our board deems relevant. The terms of certain of our and SBA’s outstanding indebtedness substantially restrict the ability of either company to pay dividends. For more information about these restrictions, see “Description of Certain Indebtedness.” In addition, because we are a holding company, our ability to pay dividends depends on our receipt of cash dividends from our subsidiaries.
30
Table of Contents
SELECTED CONSOLIDATED FINANCIAL DATA
The following table presents selected financial and other data as of and for the years ended December 31, 2002, 2003, 2004, 2005 and 2006 and the three months ended March 31, 2006 and 2007. We derived the statement of operations and other data set forth below for the years ended December 31, 2004, 2005 and 2006, and the balance sheet data as of December 31, 2005 and 2006 from our audited consolidated financial statements (together with the notes thereto) that are included elsewhere in this prospectus. We derived the statement of operations and other data for the year ended December 31, 2003 and the balance sheet data as of December 31, 2003 and 2004 from our audited consolidated financial statements with respect to such date and period that are not included in this prospectus. The statement of operations data for the year ended December 31, 2002 and the balance sheet data as of December 31, 2002 are unaudited combined financial information and other data reflecting the combination of Intcomex Holdings, LLC, our direct subsidiary (which in turn is a direct or indirect parent of our operating subsidiaries), and a predecessor parent company of Intcomex Holdings, LLC, as more fully described in footnote 1 to the table below. The statement of operations data for the six months ended June 30, 2007 and 2006 and the balance sheet data as of June 30, 2007 were derived from our unaudited condensed consolidated financial statements for these periods (together with the notes thereto) that are included elsewhere in this prospectus. They include all adjustments consisting of normal recurring adjustments that management considers necessary for a fair presentation of the financial position and results of operations for these periods. The results for any interim period are not necessarily indicative of the results that may be expected for the full year.
You should read the following selected information in conjunction with “Management’s Discussion and Analysis of Financial Condition and Results of Operations” and our audited and unaudited consolidated financial statements (together with the notes thereto) that are included elsewhere in this prospectus.
| Year Ended December 31, | Six Months Ended June 30, | |||||||||||||||||||||||||||
| 2002(1) | 2003 | 2004 | 2005(2) | 2006 | 2006 | 2007 | ||||||||||||||||||||||
| (unaudited) | (audited) | (unaudited) | ||||||||||||||||||||||||||
(in thousands except per share data and number of shares) | ||||||||||||||||||||||||||||
Statement of Operations Data: | ||||||||||||||||||||||||||||
Revenue | $ | 333,442 | $ | 418,330 | $ | 554,345 | $ | 716,440 | $ | 889,779 | $ | 427,299 | $ | 498,147 | ||||||||||||||
Cost of revenue | 295,200 | 371,262 | 495,536 | 642,737 | 797,665 | 383,181 | 448,045 | |||||||||||||||||||||
Gross profit | 38,242 | 47,068 | 58,809 | 73,703 | 92,114 | 44,118 | 50,102 | |||||||||||||||||||||
Operating expenses | 23,054 | 26,259 | 33,815 | 43,343 | 57,537 | 27,318 | 36,931 | |||||||||||||||||||||
Operating income | 15,188 | 20,809 | 24,994 | 30,360 | 34,577 | 16,800 | 13,171 | |||||||||||||||||||||
Other (income) expense | ||||||||||||||||||||||||||||
Interest expense | 2,546 | 465 | 3,429 | 16,805 | 16,233 | 8,060 | 8,445 | |||||||||||||||||||||
Interest income | (930 | ) | (179 | ) | (153 | ) | (456 | ) | (876 | ) | (500 | ) | (283 | ) | ||||||||||||||
Other (income) expense, net | (967 | ) | 604 | (196 | ) | 600 | 164 | 4 | 27 | |||||||||||||||||||
Foreign exchange loss (gain) | 955 | (1,338 | ) | (986 | ) | (1,407 | ) | 1,099 | 2,570 | (968 | ) | |||||||||||||||||
Total other (income) expense | 1,604 | (448 | ) | 2,094 | 15,542 | 16,620 | 10,134 | 7,221 | ||||||||||||||||||||
Income before taxes and minority interest | 13,584 | 21,257 | 22,900 | 14,818 | 17,957 | 6,666 | 5,950 | |||||||||||||||||||||
Income tax provision | 3,465 | 5,844 | 6,417 | 2,755 | 4,894 | 2,169 | 1,897 | |||||||||||||||||||||
Income before minority interest | 10,119 | 15,413 | 16,483 | 12,063 | 13,063 | 4,497 | 4,053 | |||||||||||||||||||||
Minority interest(3) | 1,174 | 667 | 314 | — | — | — | — | |||||||||||||||||||||
Net income | $ | 8,945 | $ | 15,287 | $ | 16,169 | $ | 12,063 | $ | 13,063 | $ | 4,497 | $ | 4,053 | ||||||||||||||
Net income per common share (basic and diluted) | $ | 239.14 | $ | 408.69 | $ | 277.48 | $ | 119.28 | $ | 127.84 | $ | 44.01 | $ | 39.66 | ||||||||||||||
Weighted average number of shares used in per share calculation (basic and diluted)(4) | 37,405 | 37,405 | 58,270 | 101,133 | 102,182 | 102,182 | 102,182 | |||||||||||||||||||||
31
Table of Contents
| As of December 31, | As of June 30, | ||||||||||||||||||
| 2002(1) | 2003 | 2004 | 2005(2) | 2006 | 2007 | ||||||||||||||
| (unaudited) | (audited) | (unaudited) | |||||||||||||||||
| (in thousands) | |||||||||||||||||||
Balance Sheet Data: | |||||||||||||||||||
Cash and cash equivalents | $ | 6,294 | $ | 12,454 | $ | 6,902 | $ | 12,964 | $ | 20,482 | $ | 18,034 | (5) | ||||||
Working Capital(6) | 28,263 | 48,887 | 51,843 | 92,846 | 98,222 | 104,267 | |||||||||||||
Total assets | 114,132 | 136,596 | 172,522 | 248,311 | 292,575 | 344,449 | |||||||||||||
Long-term debt (including capital leases) | 4,626 | 799 | 60,274 | 119,628 | 120,209 | 120,703 | |||||||||||||
Total debt | 12,301 | 10,327 | 70,045 | 125,041 | 137,862 | 144,585 | |||||||||||||
Total shareholders’ equity | 54,000 | 69,292 | 30,189 | 25,567 | 38,337 | 45,633 | |||||||||||||
| Year Ended December 31, | Six Months Ended | ||||||||||||||||||
| 2002(1) | 2003 | 2004 | 2005(2) | 2006 | 2007 | ||||||||||||||
| (unaudited) | (audited) | (unaudited) | |||||||||||||||||
Other Data: | |||||||||||||||||||
Cash dividends per common share(7) | $ | 0.00 | $ | 0.00 | $ | 0.00 | $ | 197.76 | $ | 0.00 | $ | 0.00 | |||||||
| (1) | The combined financial information and other data as of December 31, 2002 is unaudited and reflects the combination of (i) Intcomex Holdings, LLC, one of our direct subsidiaries (which in turn is a direct or indirect parent of our operating subsidiaries) and (ii) Holdco Caribbean LDC, a Cayman Islands company that was our former parent company and which was liquidated at the time of CVC International’s investment in our company. The combined financial information and other data as of and for the year ended December 31, 2002 is derived from the audited financial statements of Intcomex Holdings, LLC (which financial statements were audited by BDO Seidman, LLP) and unaudited financial statements of Holdco Caribbean LDC, which are effectively predecessors of our company. |
| (2) | In 1990, we formed Centel. In September 2001, we exchanged with the management of Centel our interest in Centel for the Intcomex shares held by the management of Centel. We re-acquired all interests in Centel on June 23, 2005 and, as a result, the financial and other data for the year ended December 31, 2005 includes the financial information for Centel commencing on the date of its re-acquisition. |
| (3) | Represents minority shareholders’ interests in Intcomex Costa Rica Mayorista en Equipo de Computo, S.A., Intcomex Ecuador, S.A. and Intcomex Jamaica, Ltd. We acquired all of the outstanding common stock held by those minority shareholders on August 30, 2004 subsequent to the CVC International investment in our company. |
| (4) | In 2004, the weighted average number of shares used in per share calculations reflects the impact of recapitalization of our company as of August 31, 2004 in connection with the CVC International investment in our company. In 2005, the weighted average number of shares used in per share calculations reflects the issuance of 2,182 shares of Class B non-voting common stock to the sellers of Centel in connection with our re-acquisition of Centel on June 23, 2005. |
| (5) | Includes $47 of certificates of deposit-restricted as of June 30, 2007. |
| (6) | Working capital is defined as current assets less current liabilities. |
(7) | In August 2005, we paid a one-time cash dividend of $20.0 million, or $197.76 per share, to all of our then existing stockholders. The dividend was paid out of proceeds of the offering of our 11 3/4% Notes that was completed in August 2005. The per common share amount is based on 102,182 shares outstanding as of August 25, 2005. |
32
Table of Contents
MANAGEMENT’S DISCUSSION AND ANALYSIS OF
FINANCIAL CONDITION AND RESULTS OF OPERATIONS
You should read the following discussion and analysis of our financial condition and results of operations together with our consolidated financial statements (together with the notes thereto) and the other financial information that are included elsewhere in this prospectus. In addition, this discussion contains forward-looking statements regarding expected operating results, liquidity, capital requirements and other matters, each of which involves numerous risks and uncertainties including, but not limited to, those described in the “Forward Looking Statements” and “Risk Factors” sections of this prospectus. Our results may differ materially from those contained in any forward-looking statements.
Overview
We believe we are the largest pure play value-added distributor of IT products focused solely on serving Latin America and the Caribbean. We distribute computer components, peripherals, software, computer systems, accessories, networking products and digital consumer electronics to more than 40,000 customers in 45 countries. We offer single source purchasing to our customers by providing an in-stock selection of more than 5,700 products from over 220 vendors, including many of the world’s leading IT product manufacturers. From our headquarters and main distribution center in Miami, we support a network of in-country sales and distribution operations in 12 Latin American and Caribbean countries and a sales office in Brazil.
Factors Affecting Our Results of Operations
The following events and developments have in the past or are expected in the future to have a significant impact on our financial condition and results of operations:
| • | Impact of price competition and vendor terms and conditions on margin. Historically, our gross profit margins have been impacted by price competition, as well as changes to vendor terms and conditions, including, but not limited to, reductions in product rebates and incentives, our ability to return inventory to manufacturers, and time periods during which vendors provide price protection. We expect these competitive pricing pressures and modifications to vendor terms and conditions to continue into the foreseeable future. We continuously refine our pricing strategy, inventory management processes and systems and manufacturer programs to attempt to mitigate the adverse impact of these competitive pressures. |
| • | Macroeconomic trends and increased penetration of IT Products. Since 2003, the Latin American and Caribbean economies have benefited from relatively high levels of economic growth, which we believe have had a positive impact on overall demand for IT products. In particular, we have continued to benefit from rapid growth in PC penetration rates and Internet penetration rates. From 1996 to 2006, spending on IT products (including hardware, packaged software and services) in Latin America and the Caribbean grew an average of 5.9% per year, from $21.8 billion to $38.7 billion, and, according to IDC, is projected to grow an average of 11.8% per year from 2006 to 2010, to $60.4 billion. |
| • | Shift in revenue to in-country operations. One of our growth strategies is to expand the geographic presence of our in-country operations into areas in which we believe we can achieve higher gross margins than our Miami operations. Miami gross margins are generally lower than in-country gross margins because Miami is a more competitive market and Miami’s customers, who are primarily other Miami-based IT distributors or large IT distributors, resellers and retailers located in Latin America or the Caribbean, have larger average order quantities than customers of our in-country segment and as a result benefit from lower average prices. In-country revenue grew by an average of 27.9% annually between 2001 and 2006, compared to growth in Miami revenue of an average of 13.4% annually over the same period. In-country revenue accounted for 70.6% and 68.5% of consolidated revenue for the six months ended June 30, 2007 and 2006, respectively, and 70.0% and 65.6% of consolidated revenue for the years ended December 31, 2006 and 2005, respectively. This growth in our in-country operations reflects in part the growth in local market share achieved by four of our distribution centers (El |
33
Table of Contents
Salvador, Ecuador, Costa Rica and Jamaica) that were opened in 2000, the Argentina operation opened in September 2003 and our Colombia operation opened in January 2004. Our in-country presence was further expanded by our re-acquisition of Centel in Mexico in June 2005 discussed below. |
| • | Exposure to fluctuations in foreign currency. A significant portion of our revenues from in-country operations is invoiced in currencies other than the U.S. dollar and a significant amount of our in-country operating expenses are denominated in currencies other than U.S. dollars. In markets where we invoice in local currency, including Argentina, Chile, Colombia, Costa Rica, Guatemala, Jamaica, Mexico, Peru and Uruguay, the appreciation of a local currency will reduce our gross profit and gross margins in U.S. dollar terms. In markets where our books and records are prepared in currencies other than the U.S. dollar, the appreciation of a local currency will increase our operating expenses and decrease our operating margins in U.S. dollar terms. In our consolidated statement of operations, a Foreign exchange loss (Gain) of $1.1 million, $(1.4) million and $(1.0) million was included for the years ended December 31, 2006, 2005 and 2004, respectively. We generally do not engage in foreign currency hedging arrangements, and, consequently, foreign currency fluctuations may adversely affect our results of operations, including our gross margins and operating margins. |
| • | Trade Credit. All of our key vendors and many of our other vendors provide us with trade credit. Historically, trade credit has been an important source of liquidity to finance our growth. Although our overall available trade credit has increased significantly over time, from time to time the trade credit available from certain vendors has not kept pace with the growth of our business with them. When we purchase goods from these vendors, we need to increase our use of available cash or borrowings under our credit facility (in each case to the extent available) to pay the purchase price upon delivery of the products, which adversely affects our liquidity and can adversely affect results of our operations. |
• | Increased levels of indebtedness. In connection with the investment by CVC International in our company in August 2004 and our re-acquisition of Centel, we borrowed under our former senior secured credit facility with Wells Fargo Foothill and Morgan Stanley, which we refer to as our “former senior secured credit facility,” and issued subordinated seller notes to the sellers, which increased our leverage and our interest expense. In August 2005, we issued $120.0 million of 11 3/4% Notes and used the proceeds to repay the outstanding principal balances on our former senior secured credit facility and subordinated seller notes as well as to pay a $20.0 million dividend to our stockholders. For the six months ended June 30, 2007 and June 30, 2006, our interest expense was $8.4 million and $8.1 million, respectively. For the years ended December 31, 2006 and 2005, our interest expense was $16.2 million and $16.8 million, respectively. |
| • | Centel re-acquisition. On June 23, 2005, we re-acquired all of the outstanding shares of our former subsidiary Centel (which we originally sold in 2001) for $14.0 million in cash, $3.0 million in non-voting common shares and $2.8 million in subordinated seller notes, representing aggregate consideration of $19.8 million. We believe that Centel is the third largest distributor of IT products in Mexico. For the three months ended March 31, 2007 and March 31, 2006, Centel had revenues of $28.5 million and $26.6 million and net income of $1.1 million and $0.8 million, respectively. For the years ended December 31, 2006 and 2005, Centel had revenues of $104.2 million and $89.3 million and net income of $3.0 million and $3.6 million, respectively. |
Uruguay Tax Audit
We incurred a net pre-tax charge of $3.8 million, including legal and accounting fees, in operating expenses ($3.7 million after tax) in the second quarter of 2007 as a result of settlements with Uruguayan regulatory authorities described below.
On June 29, 2007, our Uruguayan subsidiary, T.G.M., S.A., reached a settlement agreement with the Uruguayan tax agency Dirección General Impositiva, or the DGI, following a tax audit for the period 2001 through 2005. During this tax audit, questions were raised by the DGI about the alleged failure of two local
34
Table of Contents
suppliers operating through several legal entities to pay value added and other taxes in connection with the sale of certain IT products to our Uruguayan subsidiary. Our Uruguayan subsidiary cooperated fully with the audit and, based on an internal investigation, we believe our Uruguayan subsidiary has at all times complied with its tax payment obligations and properly recorded, reported and paid all taxes. At the same time, due to the possibility of significant potential fines and related legal expenses, our Uruguayan subsidiary approached the DGI seeking a resolution, and after negotiation agreed to pay the amount of UYP 53.0 million, or approximately $2.2 million, and forfeit $0.5 million in previously recognized tax credits in connection with the settlement agreement. Our Uruguayan subsidiary has engaged in a parallel negotiation process with the Uruguayan customs authorities relating to the same time periods and facts, and entered into a similar settlement agreement with the customs authorities providing for the payment of UYP 26.2 million, or approximately $1.1 million. In connection with this $1.1 million payment, we received a credit from the customs authorities of approximately $0.3 million.
We believe that payment of the settlement amounts was the best course of action for both our Uruguayan subsidiary and us, in particular because Uruguayan tax law may in certain cases impose joint and several financial liability on us for acts committed by third parties, such as the two suppliers described above, that result in the loss of tax revenue. In addition, the settlement payments avoid the risk connected with, and the commitment of potentially significant financial and managerial resources to, potential regulatory claims.
In connection with our internal investigation overseen by our audit committee, we examined our third-party purchasing controls and implemented additional measures including centralized corporate oversight of all purchases by local operations from non-OEM third parties and enhanced IT systems to strengthen purchasing controls, in particular in the areas of treasury, accounting and purchasing. Following completion of our investigation, the general manager of our Uruguayan subsidiary resigned.
In order to indemnify our principal stockholder, CVC International, as required by the stock purchase agreement dated as of August 27, 2004, for the outflow of funds related to that portion of the settlement payments corresponding to the tax audit period from 2002 until August 31, 2004 (i.e., the closing date under the stock purchase agreement) and certain related legal, accounting and other expenses, Anthony Shalom and Michael Shalom, as well as the other sellers in the CVC International acquisition of control in our company, entered into an indemnity agreement dated as of June 29, 2007. The indemnity agreement provided for the payment by Anthony Shalom and Michael Shalom of approximately $3.0 million to us by August 14, 2007. To secure the payment obligation, the indemnity agreement required Anthony and Michael Shalom to arrange for a pledge of 11 3/4% Notes in the same principal amount as the indemnity payment owned by various individuals who sold shares to CVC International in connection with its acquisition of control in us in 2004 (all of whom are affiliated with but did not include Anthony and Michael Shalom) (the “Pledging Noteholders”). This pledge was executed as of June 29, 2007. Payment under the indemnity agreement was made prior to August 14, 2007.
As a result of a privately negotiated arms’ length transaction arranged by Anthony Shalom and Michael Shalom, on August 15, 2007, we repurchased $2.2 million of 11 3/4% Notes held by the Pledging Noteholders, at the same market price as $2.8 million of 11 3/4% Notes we purchased in the open market on the same day. We delivered to the trustee under the indenture governing the 11 3/4% Notes all $5.0 million aggregate principal amount of the 11 3/4% Notes purchased on August 15, 2007 for cancellation in satisfaction of our mandatory sinking fund redemption that we were required to make by August 15, 2007 under the indenture.
Results of Operations
We report our business in two segments based upon the geographic location of where we originate the sale. The segments are in-country and Miami. The in-country segment includes revenue from our in-country sales and distribution centers, which have been aggregated because they have similar economic characteristics. The Miami segment includes revenue from our Miami headquarters, including sales from Miami to our in-country sales and distribution centers and sales directly to resellers, retailers and distributors that are located in countries in which we have in-country sales and distribution operations or in which we do not have any in-country operations. Most of our vendor rebates, incentives and allowances are reflected in the results of our Miami segment. When we consolidate our results, we eliminate revenue and cost of revenue attributable to inter-segment sales, and the financial results of our Miami segment discussed below reflect these eliminations.
35
Table of Contents
Comparison of the six months ended June 30, 2007 versus the six months ended June 30, 2006
The following table sets forth line items of our consolidated statement of operations as well as the percentages of revenue for each of the six month periods ended June 30, 2006 and 2007:
| Six Months Ended June 30, 2006 | As a % of revenue | Six Months Ended June 30, 2007 | As a % of revenue | |||||||||
| (in thousands, except percentages) | ||||||||||||
Revenue | $ | 427,299 | 100.0 | % | $ | 498,147 | 100.0 | % | ||||
Cost of revenue | 383,181 | 89.7 | % | 448,045 | 90.0 | % | ||||||
Gross profit | 44,118 | 10.3 | % | 50,102 | 10.0 | % | ||||||
Selling, general and administrative | 26,045 | 6.1 | % | 30,627 | 6.1 | % | ||||||
Uruguay settlement charge | — | — | 3,827 | 0.7 | % | |||||||
Miami headquarters relocation | — | — | 800 | 0.2 | % | |||||||
Total selling, general and administrative | 26,045 | 6.1 | % | 35,254 | 7.1 | % | ||||||
Depreciation and amortization | 1,273 | 0.3 | % | 1,677 | 0.3 | % | ||||||
Operating income | 16,800 | 3.9 | % | 13,171 | 2.6 | % | ||||||
Income before taxes | 6,666 | 1.6 | % | 5,950 | 1.2 | % | ||||||
Income tax provision | 2,169 | 0.5 | % | 1,897 | 0.4 | % | ||||||
Net income | 4,497 | 1.1 | % | 4,053 | 0.8 | % | ||||||
Revenue. Revenue increased 16.6% to $498.1 million for the six months ended June 30, 2007, from $427.3 million for the six months ended June 30, 2006. This net increase was primarily driven by higher sales of notebook computers of $23.4 million, software of $14.2 million, systems of $11.0 million, monitors of $10.8 million and memory products of $10.7 million. We experienced a 31% growth in unit shipments across our core product lines for the six months ended June 30, 2007 compared to the six months ended June 30, 2006, which was partially offset by a 5% decline in average sales prices across these same core product lines. In-country revenue increased to $351.6 million for the six months ended June 30, 2007 from $292.5 million for the six months ended June 30, 2006, representing an increase of 20.2%. This revenue growth was driven mainly by the increased sales of notebooks and monitors primarily in Chile, Colombia, Mexico, Peru and Ecuador. Our in-country revenue accounted for 70.6% of total revenue for the six months ended June 30, 2007, compared to 68.5% of total revenue for the six months ended June 30, 2006. Miami revenue increased to $146.6 million for the six months ended June 30, 2007 (net of $148.7 million of revenue derived from sales to our in-country operations) from $134.8 million for the six months ended June 30, 2006 (net of $131.7 million of revenue derived from sales to our in-country operations), representing an increase of 8.8%. This increase was the result of increased sales volume of notebooks, monitors and software primarily in Chile, Colombia, Mexico and Panama.
Gross Profit. Gross profit increased to $50.1 million for the six months ended June 30, 2007 from $44.1 million for the six months ended June 30, 2006, representing an increase of 13.6%. The increase was primarily driven by the higher sales volume in our in-country operations. In-country gross profit increased to $33.6 million for the six months ended June 30, 2007 from $28.9 million for the six months ended June 30, 2006, an increase of 13.7%. The increase in in-country gross profit was primarily attributable to the growth in sales in Argentina, Chile, Colombia, Costa Rica and Ecuador, partially offset by margin erosion in Guatemala and Jamaica due to increased competition and less favorable product mix. Miami gross profit increased to $16.9 million for the six months ended June 30, 2007 from $15.5 million for the six months ended June 30, 2006, representing an increase of 9.1%. This increase in Miami’s gross profit was primarily driven by higher sales of memory products, hard disk drives and software, which are all higher margin products. As a percentage of revenue, gross margin decreased to 10.0% from 10.3% for the six months ended June 30, 2007 compared to the six months ended June 30, 2006 due to strengthening currencies relative to the U.S. dollar in certain countries and pricing pressures resulting from increased competition primarily in Chile.
Operating Expenses. Total operating expenses (which include selling, general and administrative expenses and depreciation and amortization) increased to $36.9 million for the six months ended June 30, 2007
36
Table of Contents
from $27.3 million for the six months ended June 30, 2006, representing an increase of 35.2%. The increase in total operating expenses was primarily driven by additional personnel and other expenses related to the growth in sales in our in-country operations in Argentina, El Salvador, Uruguay, Peru and Costa Rica plus the expenses related to the move of our headquarters facility in Miami, Florida partially offset by operating improvements in Chile, Colombia, Guatemala, Panama and Mexico. Additionally, on June 29, 2007, our Uruguayan subsidiary T.G.M., S.A., entered into a settlement agreement with the Uruguayan tax authority and incurred a net pre-tax charge of $3.8 million. Excluding the $3.8 million pre-tax charge related to the Uruguayan tax settlement and the Miami headquarters relocation expense, operating expenses increased $5.0 million for the six months ended June 30, 2007, compared to the six months ended June 30, 2006, representing an increase of 18.3%.
Operating Income. Operating income decreased to $13.2 million for the six months ended June 30, 2007 from $16.8 million for the six months ended June 30, 2006, representing a decrease of 21.6%. As a percentage of revenue, operating income decreased to 2.6% for the six months ended June 30, 2007 compared to 3.9% for the six months ended June 30, 2006. This decrease was due primarily to the increase in the operating expenses as a result of the $3.8 million pre-tax Uruguayan settlement charge.
Other Expense (Income). Other expense (which includes interest expense, interest income, other expense and foreign exchange loss) decreased to $7.2 million for the six months ended June 30, 2007 from $10.1 million for the six months ended June 30, 2006, representing a decrease of 28.7%. This decrease was driven by foreign exchange gains of $1.0 million for the six months ended June 30, 2007 compared to a $2.6 million foreign exchange loss for the six months ended June 30, 2006. The improvement in foreign exchange for the period was due to the appreciation of local currencies primarily in Chile and Colombia and was partially offset by higher interest expense due to increased borrowings under our revolving credit facility.
Income Tax Provision. The provision for income taxes decreased to $1.9 million for the six months ended June 30, 2007 from $2.2 million for the six months ended June 30, 2006, representing a decrease of 12.5%. The decrease was due mainly to an increased portion of our pretax earnings generated in 2007 from Chile and Mexico, which have lower income tax rates than the U.S., and the impact on earnings of the Uruguay on tax settlement.
Net Income. Net income decreased to $4.1 million for the six months ended June 30, 2007 from $4.5 million for the six months ended June 30, 2006, representing a decrease of 9.9%. The decline was driven by the $3.8 million net pre-tax charge related to the Uruguayan tax settlement partially offset by a decrease in Other Expense and the reduction in income taxes in 2007.
Comparison of the year ended December 31, 2006 versus the year ended December 31, 2005 and of the year ended December 31, 2005 versus the year ended December 31, 2004
The following table sets forth line items of our consolidated statement of operations as well as the percentages of revenue for each of the years in the three year period ended December 31, 2006.
| Year ended December 31, 2004 | As a % of revenue | Year ended December 31, 2005 | As a % of revenue | Year ended December 31, 2006, | As a % of revenue | |||||||||||||
| (in thousands, except percentages) | ||||||||||||||||||
Revenue | $ | 554,345 | 100.0 | % | $ | 716,440 | 100.0 | % | $ | 889,779 | 100.0 | % | ||||||
Cost of revenue | 495,536 | 89.4 | % | 642,737 | 89.7 | % | 797,665 | 89.6 | % | |||||||||
Gross profit | 58,809 | 10.6 | % | 73,703 | 10.3 | % | 92,114 | 10.4 | % | |||||||||
Selling, general and administrative expenses | 32,966 | 5.9 | % | 41,555 | 5.8 | % | 54,794 | 6.2 | % | |||||||||
Depreciation and amortization | 849 | 0.2 | % | 1,788 | 0.2 | % | 2,743 | 0.3 | % | |||||||||
Operating income | 24,994 | 4.5 | % | 30,360 | 4.2 | % | 34,577 | 3.9 | % | |||||||||
Income before provision for income taxes and minority interest | 22,900 | 4.1 | % | 14,818 | 2.1 | % | 17,957 | 2.0 | % | |||||||||
Income tax provision | 6,417 | 1.2 | % | 2,755 | 0.4 | % | 4,894 | 0.5 | % | |||||||||
Net income | 16,169 | 2.9 | % | 12,063 | 1.7 | % | 13,063 | 1.5 | % | |||||||||
37
Table of Contents
Revenue. For the year ended December 31, 2006, revenue increased to $889.8 million from $716.4 million for the year ended December 31, 2005, representing an increase of 24.2%. This increase was primarily driven by higher sales of notebook computers of $33.4 million, monitors of $29.3 million, memory products of $24.4 million and hard disk drives of $23.8 million plus $54.5 million of incremental revenue from the Centel acquisition. Growth in sales volume was driven by the increased penetration of PCs and internet usage throughout our markets. We experienced a 46% growth in unit shipments across our core product lines for the year ended December 31, 2006 compared to the year ended December 31, 2005 partially offset by a 10% decline in average sales prices across these same core product lines. Growth in sales volume was driven by the increased penetration of PCs and Internet usage throughout our markets. In-country revenue increased to $623.0 million for the year ended December 31, 2006 from $469.9 million for the year ended December 31, 2005, representing an increase of 32.6%. This revenue growth was driven mainly by increased sales of notebooks, monitors, memory and hard disk drives primarily in Chile, Costa Rica, Colombia and Peru plus $54.5 million of revenue from the re-acquisition of Centel. Our in-country revenue accounted for 70.0% of our total revenue for the year ended December 31, 2006, compared to 65.6% of total revenue for the year ended December 31, 2005. Miami revenue increased to $266.8 million for the year ended December 31, 2006 (net of $267.1 million of revenue derived from sales to our in-country operations) from $246.6 million for the year ended December 31, 2005 (net of $220.6 million of revenue derived from sales to our in-country operations), representing an increase of 8.2%. This increase was the result of increased sales volume of hard disk drive and memory products.
For the year ended December 31, 2005, revenue increased to $716.4 million from $554.3 million for the year ended December 31, 2004, representing an increase of 29.2%. The increase in revenue was due mainly to greater demand for central processing units, or CPUs, hard disk drives and monitors plus $49.7 million of incremental revenue from the Centel re-acquisition. In-country revenue increased to $469.9 million for the year ended December 31, 2005 from $353.5 million for the year ended December 31, 2004, representing an increase of 32.9%. This revenue growth was driven mainly by increased sales of CPUs, hard disk drives, notebook computers and monitors primarily in Argentina, Chile, Ecuador, Guatemala and Peru plus $49.7 million of additional revenue from the re-acquisition of Centel. Our in-country revenue accounted for 65.6% of total revenue for the year ended December 31, 2005, compared to 63.8% of total revenue for the year ended December 31, 2004. Miami revenue increased to $246.6 million for the year ended December 31, 2005 (net of $220.6 million of revenue derived from sales to our in-country operations) from $200.9 million for the year ended December 31, 2004 (net of $171.8 million of revenue derived from sales to our in-country operations), representing an increase of 22.7%. This increase was the result of increased sales volume of CPUs and hard disk drives.
Gross Profit. For the year ended December 31, 2006, gross profit increased to $92.1 million from $73.7 million for the year ended December 31, 2005, representing an increase of 25.0% primarily as a result of the increased sales volume in our in-country operations and the gross profit of $5.7 million from Centel. In-country gross profit increased to $59.6 million for the year ended December 31, 2006 from $45.0 million for the year ended December 31, 2005, representing an increase of 32.4%. This increase was primarily attributable to the growth in sales Chile, Colombia, Costa Rica, Guatemala and Peru and the $5.7 million in additional gross profit contributed by Centel. For the year ended December 31, 2006, Miami gross profit increased to $32.5 million from $28.7 million for the year ended December 31, 2005, representing an increase of 13.2%. The increase in Miami’s gross profit was primarily driven by the increased volume of hard disk drive and memory revenue. Gross margin increased slightly to 10.4% for the year ended December 31, 2006 from 10.3% for the same period in the prior year, due to the increased sales volume of higher margin monitor, memory and hard disk drive products.
For the year ended December 31, 2005, gross profit increased to $73.7 million from $58.8 million for the year ended December 31, 2004, representing an increase of 25.3%. This growth was due primarily to the increased sales volume of our in-country operations and the gross profit of $5.3 million contributed by Centel from the date of its re-acquisition. In-country gross profit increased to $45.0 million for the year ended December 31, 2005 from $36.8 million for the year ended December 31, 2004, representing an increase of
38
Table of Contents
22.3%. The increase in in-country gross profit was primarily attributable to the growth in sales in Argentina, Chile and Guatemala, improved margins in Costa Rica and Jamaica and the $5.3 million of gross profit contributed by Centel from the date of its re-acquisition. For the year ended December 31, 2005, Miami gross profit increased to $28.7 million from $22.0 million for the year ended December 31, 2004, representing an increase of 30.5%. The increase in Miami’s gross profit was largely the result of the increase in Miami revenues, the impact of which was partially offset by higher operating expenses and increased sales of lower margin products such as CPUs and hard disk drives. Gross margin declined slightly to 10.3% for the year ended December 31, 2005 from 10.6% for the year ended December 31, 2004, due to the increased volume of sales of lower-margin CPUs and memory and hard disk drive products.
Operating Expenses. For the year ended December 31, 2006, operating expenses were $57.5 million compared to $43.3 million for the year ended December 31, 2005, representing an increase of 32.8%. Operating expenses as a percentage of revenue increased slightly to 6.5% for the year ended December 31, 2006 compared to 6.0% for the year ended December 31, 2005. In-country operating expenses were $38.0 million for the year ended December 31, 2006 compared to $28.3 million for the year ended December 31, 2005, representing an increase of 34.2%. This increase reflects greater facilities and logistics expenses primarily related to the opening of additional distribution facilities (Rosario, Argentina; Chiriqui, Panama; Guayaquil, Ecuador; and Villahermosa, Mexico) in several second tier cities within our markets and an incremental $3.8 million related to the re-acquisition of Centel. For the year ended December 31, 2006 operating expenses in Miami were $19.5 million compared to $15.0 million for the year ended December 31, 2005, representing an increase of 30.0%. This increase was primarily related to higher expenses for Sarbanes-Oxley compliance efforts and higher salary and benefits expenses.
For the year ended December 31, 2005, operating expenses were $43.3 million compared to $33.8 million for the year ended December 31, 2005, representing an increase of 28.2%. Operating expenses as a percentage of revenue decreased slightly to 6.0% for the year ended December 31, 2005 compared to 6.1% for the year ended December 31, 2004. In-country operating expenses were $28.3 million for the year ended December 31, 2005 compared to $21.6 million for the year ended December 31, 2004, representing an increase of 31.1%. This increase reflects higher expenses in Ecuador and Argentina where we recently opened additional distribution facilities in second tier cities and $2.7 million related to Centel, which we re-acquired on June 23, 2005. For the year ended December 31, 2005 operating expenses in Miami were $15.0 million compared to $12.2 million for the year ended December 31, 2004, representing an increase of 23.0%. This increase was primarily related to increased warehouse, Finance and IT personnel costs.
Operating Income. For the year ended December 31, 2006, operating income increased to $34.5 million from $30.4 million for the year ended December 31, 2005, representing an increase of 13.9%. This increase was driven by the overall higher level of revenue and $1.4 million of operating income contributed by Centel, partially offset by the increase in operating expenses described above. In-country operating income increased to $21.5 million for the year ended December 31, 2006 from $16.7 million for the year ended December 31, 2005, representing an increase of 29.2%. This increase was driven by the overall growth in revenue partially offset by the increase in operating expenses described above. Miami operating income declined slightly to $13.0 million for the year ended December 31, 2006 from $13.7 million for the year ended December 31, 2005, representing a decrease of 5.0%. This decrease was driven by the growth in operating expenses that more than offset the incremental revenue growth.
For the year ended December 31, 2005, operating income increased to $30.4 million from $25.0 million for the year ended December 31, 2004, an increase of 21.5%. This increase was driven by the overall higher level of revenue coupled with continued strict management of operating expenses and $3.2 million of operating income contributed by Centel from the date of its re-acquisition. In-country operating income increased to $16.7 million for the year ended December 31, 2005 from $15.2 million for the year ended December 31, 2004, representing an increase of 9.5%. This increase was driven by the overall growth in revenue partially offset by the increase in operating expenses. Miami operating income increased to $13.7 million for the year ended December 31, 2005
39
Table of Contents
from $9.8 million for the year ended December 31, 2004, representing an increase of 40.0%. This increase was driven by the overall growth in revenue partially offset by the increase in operating expenses.
Other (Income) Expense. Other (income) expense increased to $16.6 million for the year ended December 31, 2006 from $15.5 million for the year ended December 31, 2005, an increase of 6.6%. This increase was primarily driven by a foreign exchange loss and higher interest expense in 2006 offset by the deferred loan cost write-offs in 2005. For the year ended December 31, 2006, we realized a foreign exchange loss of $1.1 million compared to a $1.4 million gain for the year ended December 31, 2005. The foreign exchange loss in 2006 was driven primarily by our operations in Chile, Costa Rica and Jamaica which experienced a devaluation of their local currencies relative to the U.S. dollar during the year ended December 31, 2006. Chile, Guatemala and Colombia were the main drivers of the foreign exchange gains during the year ended December 31, 2005.
Other (income) expense increased to $15.5 million expense for the year ended December 31, 2005 from $2.1 million for the year ended December 31, 2004. This increase was primarily driven by interest expense which increased to $16.8 million for the year ended December 31, 2005 from $3.4 million for the year ended December 31, 2004. The increase in interest expense was driven mainly by higher levels of long-term debt as a result of the restructuring we undertook in conjunction with the CVC International investment in August 2004 and the completed $120.0 million offering of our 11 3/4% Notes. In addition, interest expense increased in 2006 due to the one-time $3.5 million pre-payment penalty and the $2.3 million accelerated write-off of unamortized loan origination expenses related to the early termination of our former senior secured credit facility. For the year ended December 31, 2005, we realized a foreign exchange gain of $1.4 million compared to a $1.0 million gain for the year ended December 31, 2004. The foreign exchange gain was driven primarily by our operations in Chile, Guatemala and Colombia, which experienced an appreciation of their local currencies relative to the U.S. dollar during the year ended December 31, 2005. Partially offsetting the foreign exchange gains were foreign exchange losses in Costa Rica, Argentina, Jamaica and Peru which experienced slight devaluations of their local currencies relative to the U.S. dollar during 2005.
Income Tax Provision. The provision for income taxes increased to $4.9 million for the year ended December 31, 2006 from $2.8 million for the year ended December 31, 2005, a 77.6% increase due mainly to higher pre-tax profits from our in-country operations. Our operations in the United States generated a tax credit as the tax deduction for our 11 3/4% Notes more than offset the operating income from our Miami operations.
The provision for income taxes decreased to $2.8 million for the year ended December 31, 2005 from $6.4 million for the year ended December 31, 2004, a 57.1% decrease due mainly to lower pre-tax profits in the United States as a result of the increase in borrowing costs and the one-time charges related to the early termination of our former senior secured credit facility.
Net Income. Net income increased to $13.1 million for the year ended December 31, 2006 from $12.1 million for the year ended December 31, 2005, representing an increase of 8.3%. This increase was due to the growth in operating income, mainly from our in-country operations, partially offset by higher other expenses and higher income tax expense.
Our net income decreased to $12.1 million for the year ended December 31, 2005 from $16.2 million for the year ended December 31, 2004, representing a decrease of 25.3%. This decrease was due to the increase in interest expense and the one-time charges related to the early termination of our former senior secured credit facility, partially offset by a 21.5% increase in our operating income.
Quarterly Data
The following table sets forth certain unaudited quarterly historical financial data for each of the eight quarters in the two most recently completed fiscal years and the first two quarters of fiscal year 2007. This unaudited quarterly information has been prepared on the same basis as the annual information presented
40
Table of Contents
elsewhere herein and, in our opinion, includes all adjustments necessary for a fair statement of the selected quarterly information. This information should be read in conjunction with the audited and unaudited consolidated financial statements and notes thereto included elsewhere in this prospectus. The operating results for any quarter shown are not necessarily indicative of results for any future period.
| Fiscal Year 2005 | Fiscal Year 2006 | Fiscal Year 2007 | ||||||||||||||||||||||||||||
Three Months Ended | ||||||||||||||||||||||||||||||
| Mar. 31 | June 30 | Sept. 30 | Dec. 31 | Mar. 31 | June 30 | Sept. 30 | Dec. 31 | Mar. 31 | June 30 | |||||||||||||||||||||
| (in millions, except per share data) | ||||||||||||||||||||||||||||||
Revenue | $ | 149.8 | $ | 165.8 | $ | 198.4 | $ | 202.4 | $ | 213.6 | $ | 213.7 | $ | 227.3 | $ | 235.2 | $ | 243.8 | $ | 254.4 | ||||||||||
Gross profit | 16.5 | 17.5 | 19.9 | 19.8 | 22.9 | 21.2 | 23.6 | 24.4 | 24.7 | 25.4 | ||||||||||||||||||||
Operating income | 7.6 | 7.6 | 8.5 | 6.7 | 9.3 | 7.5 | 8.6 | 9.2 | 9.3 | 3.9 | ||||||||||||||||||||
Income before provision for income taxes | 4.8 | 5.5 | 1.4 | 3.1 | 4.7 | 2.0 | 5.6 | 5.7 | 4.8 | 1.1 | ||||||||||||||||||||
Net income | 3.0 | 4.0 | 2.0 | 3.1 | 3.2 | 1.3 | 4.3 | 4.3 | 3.5 | 0.6 | ||||||||||||||||||||
Diluted earnings per share | 28.9 | 40.1 | 20.0 | 30.4 | 31.5 | 12.5 | 41.9 | 41.9 | 34.1 | 5.6 | ||||||||||||||||||||
Liquidity and Capital Resources
Cash Flows
The IT products distribution business is working-capital intensive. Historically, we have financed our working capital needs through a combination of cash generated from operations, trade credit from our vendors, borrowings under revolving bank lines of credit (including issuance of letters of credit), asset-based financing arrangements that we have established in certain Latin American and Caribbean markets and the issuance of our 11 3/4% Notes.
Our working capital at June 30, 2007 was $104.3 million, compared to $98.2 million at December 31, 2006. This increase was primarily attributable to increased levels of accounts receivables and inventory driven by overall growth of our business, partially offset by higher levels of trade accounts payable. Our cash and cash equivalents at June 30, 2007 were $18.0 million, compared to $20.6 million as of December 31, 2006. This decrease was primarily attributable to repayment of lines of credit.
Our working capital at December 31, 2006 was $98.2 million, compared to $92.8 million at December 31, 2005, an increase of 5.8%. This increase is primarily attributable to our higher levels of trade accounts receivable and inventories as a result of the significant growth in our operations during the year ended December 31, 2006. Our cash and cash equivalents at December 31, 2006 were $20.5 million, compared to $13.0 million as of December 31, 2005.
Cash flows from operating activities. Our cash flows from operations resulted in a requirement of $6.0 million for the six month period ended June 30, 2007 compared to a generation of $4.8 million for the six month period ended June 30, 2006. This requirement was driven by higher working capital requirements due to an increase in trade accounts receivable and inventories resulting from growth in our business, partially offset by higher trade accounts payable.
Our cash flows from operations generated $0.1 million for the year ended December 31, 2006 compared to $10.7 million of cash used by operations for the year ended December 31, 2005. This improvement was primarily driven by the increase in trade accounts payable, lower note and other receivables and lower prepaid expenses.
Our cash flows from operations used $10.7 million for the year ended December 31, 2005 compared to $3.7 million for the year ended December 31, 2004. This increase in cash used was driven by the increase in working capital requirements, primarily the growth in prepaid expenses and other assets and lower payable days partially offset by accrued expenses. The decline in accounts payable days reflected our continued effort to
41
Table of Contents
accelerate payments to vendors to alleviate vendor credit concerns as a result of our increased leverage following the issuance of our 11 3/4% Notes.
Cash flows from investing activities. Our cash flows from investing for the six month period ended June 30, 2007 was a requirement of $3.4 million compared to a requirement of $1.7 million for the six month period ended June 30, 2006. This increase was driven primarily by capital expenditures associated with the opening of our new facilities in Miami and a warehouse facility in Lima, Peru.
Our cash flows from investing for the year ended December 31, 2006 was a requirement of $4.9 million compared to a requirement of $14.1 million for the year ended December 31, 2005. This improvement was due mainly to the absence of the $16.5 million cash payment related to the Centel re-acquisition in 2005, partially offset by $4.6 million of cash acquired with Centel at the close of the re-acquisition. Partially offsetting the improvement was an increase in capital expenditures to $4.8 million from $2.9 million due to the costs of continued implementation of the Company’s Sentai system and acquisition of additional warehouse space in Chile and Peru.
Our cash flows from investing for the year ended December 31, 2005 was a requirement of $14.1 million compared to a requirement of $3.3 million for the year ended December 31, 2004. This increase was due mainly to the $16.5 million cash payment related to the Centel re-acquisition, partially offset by the $4.6 million of cash acquired from Centel at the close of the re-acquisition.
Cash flows from financing activities. Our cash flows from financing were a generation of $6.7 million for the six months ended June 30, 2007, compared to a requirement of $3.6 million for the six months ended June 30, 2006. This change was driven primarily by increased borrowings under SBA’s revolving credit facility with Comerica Bank that became available as a result of increases in our inventory levels.
Our cash flows from financing generated $12.6 million for the year ended December 31, 2006 compared to $30.5 million for the year ended December 31, 2005. This decline was due to the absence in 2006 of the proceeds received in 2005 from the completion of the $120.0 million 11 3/4% Notes offering on August 25, 2005 net of the repayment of certain notes and a distribution to stockholders. This decline was partially offset by the increase short-term borrowings in 2006 by our Miami operations to meet seasonal inventory purchases.
Our cash flows from financing generated $30.5 million for the year ended December 31, 2005 compared to $1.5 million for the year ended December 31, 2004. This increase was due mainly to the completion on August 25, 2005 of the $120.0 million offering of our 11 3/4% Notes and the $15.0 million borrowing under our former senior secured credit facility to finance the cash portion of the Centel re-acquisition. Our former senior secured credit facility and all the outstanding subordinated seller notes issued in connection with the re-acquisition of Centel were repaid in full with the proceeds of the 11 3/4% Notes. In addition, our board of directors declared and approved the payment of a $20.0 million dividend to stockholders of record on August 25, 2005.
42
Table of Contents
Working Capital Management
The successful management of our working capital needs is a key driver of our growth and cash flow generation. The following table sets forth certain information about the largest components of our working capital: our trade accounts receivable, inventories and accounts payable.
| As of December 31, | As of | |||||||||||||||
| 2004 | 2005 | 2006 | 2007 | |||||||||||||
| (audited) | (unaudited) | |||||||||||||||
Balance sheet data: | ||||||||||||||||
Trade accounts receivable, net of allowance for doubtful accounts | $ | 59,059 | $ | 71,589 | $ | 89,290 | $ | 111,280 | ||||||||
Inventories | 54,128 | 77,038 | 94,410 | 116,728 | ||||||||||||
Accounts payable | 65,820 | 80,686 | 95,972 | 130,676 | ||||||||||||
| As of December 31, | As of | |||||||||||||||
| 2004 | 2005 | 2006 | 2007 | |||||||||||||
| (audited) | (unaudited) | |||||||||||||||
Other data: | ||||||||||||||||
Trade accounts receivable days(1) | 38.9 | 36.5 | 36.6 | 40.4 | ||||||||||||
Inventory days(2) | 39.9 | 43.9 | 43.2 | 47.1 | ||||||||||||
Accounts payable days(3) | (48.5 | ) | (45.8 | ) | (43.9 | ) | (52.8 | ) | ||||||||
Cash conversion cycle(4) | 30.3 | 34.6 | 35.9 | 34.7 | ||||||||||||
| (1) | Defined as our consolidated trade accounts receivable (net of allowance for doubtful accounts) as of the last day of the yeardivided by our consolidated revenue for such periodtimes 365 days. Our consolidated trade accounts receivable for our in-country operations include value added tax at a rate of between 5% and 27% (depending on the country). The exclusion of such value added tax would result in lower trade accounts receivable days. |
| (2) | Defined as our consolidated inventory as of the last day of the yeardivided by our consolidated cost of goods sold for such periodtimes 365 days. |
| (3) | Defined as our consolidated accounts payable as of the last day of the yeardivided by our consolidated cost of goods sold for such periodtimes 365 days. |
| (4) | Defined as our trade accounts receivable daysplus inventory daysless accounts payable days. |
Cash conversion cycle days. One measurement we use to monitor working capital is the concept of cash conversion cycle, which measures the number of days we take to convert inventory, net of payables, into cash. Our cash conversion cycle declined to 34.7 days at June 30, 2007 from 35.9 days at December 31, 2006. This improvement was primarily driven by an increase in the accounts payable days to 52.8 from 43.9 partially offset by higher inventory days and an increase in trade accounts receivable. Accounts payable days increased due to an expansion of the amount of credit extended by certain key vendors, while inventory days grew as a result of the increased volume of sea-container shipments from Asia. Trade accounts receivable increased due to the volume of business with retail clients that require 60-90 days credit terms. Comparing 2006 with 2005, our cash conversion cycle increased slightly to 35.9 days as of December 31, 2006 from 34.6 days as of December 31, 2005 due mainly to a decrease in our account payable days, driven by the continued efforts to manage vendor trade credit limits with accelerated payments, partially offset by a slight improvement in our inventory days.
Trade accounts receivable. We principally sell products to a large base of third-party distributors, resellers and retailers throughout Latin America and the Caribbean and to other Miami-based exporters of IT products to Latin America and the Caribbean. Credit risk on trade receivables is diversified over several geographic areas and a large number of customers. No one customer accounted for more than 1.9%, 2.0% and 2.9% of sales or more than 1.8%, 2.3% and 3.0% of gross receivables as of June 30, 2007, December 31, 2006 and 2005, respectively. We provide trade credit to our customers in the normal course of business. The collection
43
Table of Contents
of a substantial portion of our receivables is susceptible to changes in Latin America and Caribbean economies and political climates. We monitor our exposure for credit losses and maintain allowances for anticipated losses after giving consideration to delinquency data, historical loss experience, and economic conditions impacting our industry. The financial condition of our customers and the related allowance for doubtful accounts is continually reviewed by management.
Prior to extending credit, a customer’s financial history is analyzed and, if appropriate, forms of personal guarantees are obtained. Our Miami and Chile operations use credit insurance and make provisions for estimated credit losses. Our other in-country operations make provisions for estimated credit losses but generally do not use credit insurance. The Miami insurance contract is with EULER American Credit Indemnity Company. The current policy expires July 31, 2008. This credit insurance policy covers trade sales to non-affiliated buyers. The policy’s aggregate limit is $20 million with an aggregate deductible of $0.5 million. In addition, 10% or 20% buyer coinsurance provisions apply, as well as sub-limits in coverage on a per-buyer and on a per-country basis.
Our large customer base and our credit policies allow us to limit and diversify our exposure to credit risk on our trade accounts receivable.
Inventory. We seek to minimize our inventory levels and inventory obsolescence rates through frequent product shipments, close and ongoing monitoring of inventory levels and customer demand patterns, optimizing use of carriers and shippers and negotiating clauses in some vendor supply agreements protecting against loss of value of inventory in certain circumstances. The Miami distribution center ships products to each of our in-country operations approximately twice per week by air and once per week by sea. These frequent shipments result in efficient inventory management and increased inventory turnover. We do not have long-term contracts with logistics providers, except in Mexico and Chile. Where we do not have long-term contracts, we seek to obtain the best rates and fastest delivery times on a shipment-by-shipment basis. Our Miami operations also coordinate direct shipments to third-party customers and our in-country operations from vendors in Asia.
Accounts payable. We seek to maximize our accounts payable days through centralized purchasing and management of our vendor back-end rebates, promotions and incentives. This centralization of the purchasing function allows our in-country operations to focus their attention on more country-specific issues such as sales, local marketing, credit control and collections. The centralization of purchasing also allows our Miami operation to control the records and receipts of all vendor back-end rebates, promotions and incentives to ensure their collection and to adjust pricing of products according to such incentives.
Capital Expenditures and Investments
Capital expenditures increased to $4.0 million for the six month period ended June 30, 2007 compared to $1.7 million for the six month period ended June 30, 2006. This increase was primarily driven by capital expenditures related to our new warehouse facility in Miami and the additional warehouse facility in Lima, Peru.
Capital expenditures increased to $4.8 million for the year ended December 31, 2006 compared to $2.9 million for the year ended December 31, 2005. This increase was primarily related to upgrades made to our back office systems in Colombia, Costa Rica, Panama, El Salvador, Guatemala and Jamaica and our Miami operations where we continued to implement Sentai and upgrade the consolidation system and the purchase of additional warehouse space for $0.4 million in Lima, Peru and $0.5 million in Santiago, Chile.
Capital expenditures increased to $2.9 million for the period ended December 31, 2005 compared to $1.5 million for the year ended December 31, 2004. This increase was primarily related to our Miami operations where we continued to implement Sentai and upgrade the consolidation system.
On June 23, 2005, we invested $14.0 million in cash to re-acquire Centel. The remaining $5.8 million of the re-acquisition price was funded by the issuance to the sellers of $3.0 million in Class B non-voting common
44
Table of Contents
stock, in our company and $2.8 million in subordinated seller notes. In accordance with the purchase agreement, we withheld $1.0 million of the cash portion of the re-acquisition price pending final independent verification of working capital accounts. Following the completion of this verification, we paid the $1.0 million to the sellers on August 22, 2005. In addition, in accordance with the purchase agreement, we paid the sellers in respect of proceeds we received from a pre-negotiated sale of certain obsolete inventory to a third party, $1.6 million for obsolete inventory costs and $0.1 million for insurance costs related to pre-existing theft claims. Expenses associated with the re-acquisition were approximately $0.7 million and cash acquired in the re-acquisition was $4.6 million.
We anticipate that capital expenditures will remain at approximately $3.5 million per year over the next few years as we continue to implement Sentai and upgrade our facilities in connection with the growth in our business.
Capital Resources
We currently believe that our cash on hand, anticipated cash provided by operations, available and anticipated trade credit and borrowings under our existing credit facility and lines of credit, will provide sufficient resources to meet our anticipated debt service requirements, capital expenditures and working capital needs for the next 12 months. If our results of operations are not as favorable as we anticipate (including as a result of increased competition), our funding requirements are greater than we expect (including as a result of growth in our business), or our liquidity sources are not at anticipated levels (including levels of available trade credit), our resources may not be sufficient and we may have to raise additional capital to support our business. In addition, we may not be able to accurately predict future operating results or changes in our industry which may change these needs. We continually assess our capital needs and may seek additional financing as needed to fund working capital requirements, capital expenditures and potential acquisitions. We cannot assure you that we will be able to generate anticipated levels of cash from operations or to obtain additional debt or equity financing in a timely manner, if at all, or on terms that are acceptable to us. Our inability to generate sufficient cash or obtain financing could hurt our results of operations and financial condition and prevent us from growing our business as anticipated.
Many of our in-country operations also have limited credit facilities. These credit facilities fall into three categories: asset-based financing facilities, letter of credit and performance bond facilities, and unsecured revolving credit facilities and lines of credit. As of June 30, 2007, December 31, 2006 and December 31, 2005, the total amount available under these credit facilities was $9.0 million, $5.3 million and $6.2 million, respectively, and the outstanding balance on these in-country facilities totaled approximately $4.7 million on June 30, 2007 compared to $1.0 million on December 31, 2006 and $4.3 million on December 31, 2005. The decrease since December 2005 is primarily attributed to the repayment of outstanding balances by our subsidiaries in Chile and Peru, while the increase since December 2006 primarily reflects increased borrowing by our subsidiaries in Uruguay and Panama to meet increased local working capital requirements.
On August 25, 2005, we completed a $120.0 million offering of the 11 3/4% Notes. The notes are due January 15, 2011. The notes were sold at 99.057% of face value and carry a coupon rate of 11 3/4%. The proceeds of the offering were used to repay existing indebtedness, pay a dividend to our existing stockholders, and pay fees and expenses associated with the debt offering, with the remaining balance to be used for general corporate purposes. The notes are secured with 100.0% of the common shares of Intcomex Holdings, LLC and Intcomex Holdings SPC-1, LLC and 65.0% of the shares of IXLA Holdings, LTD plus a second priority lien on the assets of SBA.
Concurrent with the offering of the 11 3/4% Notes, SBA entered into a new $25.0 million three-year revolving credit facility with Comerica Bank. Borrowings against the facility bear interest at prime less 75 basis points and are secured on a first priority basis by all the assets of SBA (but excluding equity interests in SBA or our other direct and indirect subsidiaries). In 2006, SBA was in default under the credit facility as a result of SBA’s repayment of a
45
Table of Contents
portion of the outstanding principal under an intercompany loan with SBA. On November 2, 2006, Comerica granted a waiver and SBA and Comerica Bank amended the credit facility and a related subordination agreement to allow SBA to make certain payments on the intercompany loan from Intcomex, Inc., increase the minimum level of tangible effective net worth to $37.0 million (which minimum level shall decline from the third fiscal quarter of 2006 to the end of the third fiscal quarter of 2007 to $25.0 million and remain at $25.0 million thereafter) and extend the maturity date to August 25, 2009. As of June 30, 2007, $19.6 million was outstanding under the credit facility.
As of March 31, 2007, SBA was in default on its capital expenditure covenant under its revolving credit facility with Comerica Bank due to a delay in the relocation of our main warehouse and headquarters in Miami and a resulting delay in the timing of capital expenditures. On May 14, 2007, SBA requested and received a waiver from Comerica Bank on the covenant default and on May 15, 2007 entered into an amendment to the revolving credit facility agreement was signed increasing the facility to $27.5 million from $25.0 million and raising the 2007 capital expenditure limit to $2.5 million from $1.0 million.
As of August 17, 2007, SBA and Comerica Bank entered into a third amendment to the revolving credit facility. The amendment increased the maximum amount available for borrowing under the revolving credit facility from $27.5 million to $30.0 million, computed on the basis of a re-defined borrowing base formula linked to the value of SBA’s inventory and the accounts receivable of SBA and certain of its foreign affiliates. For the fiscal year ending December 31, 2007, SBA agreed to maintain net income of not less than $7.5 million. Starting in 2008, this net income covenant will be replaced by a covenant to maintain as of the last day of each fiscal year of SBA, commencing with the fiscal year ending December 31, 2008, a fixed charge coverage ratio of not less than 1.0 to 1.0. Further, the maturity of the revolving credit facility was extended to August 25, 2010, unless terminated earlier. We may terminate the revolving credit facility at any time without penalty upon at least three business days’ notice to Comerica Bank, provided such termination is accompanied by payment in full of all amounts borrowed. For more information about the terms of the revolving credit facility, see “Description of Certain Indebtedness—Revolving Credit Facility.”
As a result of a privately negotiated arms’ length transaction arranged by Anthony Shalom and Michael Shalom, on August 15, 2007, we repurchased $2.2 million of 11 3/4% Notes held by the sellers in the CVC International acquisition of control in us other than Anthony and Michael Shalom, all of whom are affiliated with Anthony and Michael Shalom, at the same market price as $2.8 million of 11 3/4% Notes we purchased in the open market on the same day. We delivered to the trustee under the indenture governing the 11 3/4% Notes all $5.0 million aggregate principal amount of the 11 3/4% Notes purchased on August 15, 2007 for cancellation in satisfaction of our mandatory sinking fund redemption that we were required to make by August 15, 2007 under the indenture.
Contractual Obligations
The following table summarizes certain of our contractual obligations at June 30, 2007 and the payments due on such obligations in the periods set forth below.
| Payments Due by Period (dollars in millions) | |||||||||||||||
Contractual Obligations | Total | Less Than 1 Year | 1-3 Years | 3-5 Years | After 5 Years | ||||||||||
Debt obligations(1) | $ | 120.7 | $ | 5.5 | $ | 11.3 | $ | 103.9 | $ | — | |||||
Interest on debt obligations(2) | 56.4 | 14.1 | 28.2 | 14.1 | — | ||||||||||
Operating lease obligations | 28.0 | 3.9 | 7.4 | 7.3 | 9.4 | ||||||||||
Total | $ | 205.1 | $ | 23.5 | $ | 46.9 | $ | 125.3 | $ | 9.4 | |||||
(1) | Includes the principal of our short and long term debt and payment of original issue discount of $1.0 million in connection with the issuance of our 11 3/4% Notes. |
| (2) | Interest is calculated assuming no early redemption or prepayments. |
46
Table of Contents
Critical Accounting Policies and Estimates
Our consolidated financial statements have been prepared in conformity with U.S. GAAP. The preparation of these financial statements requires us to make estimates and assumptions that affect the reported amounts of assets and liabilities, disclosure of material contingent assets and liabilities at the date of the financial statements, and reported amounts of revenue and expenses during the reporting period. On an ongoing basis, we review and evaluate our estimates and assumptions, including, but not limited to, those that relate to revenue recognition, accounts receivable and vendor programs; inventories; goodwill and other long-lived assets; and income taxes. Our estimates are based on our historical experience and a variety of other assumptions that we believe to be reasonable under the circumstances, the results of which form the basis for making our estimates about the carrying values of assets and liabilities that are not readily available from other sources. Although we believe our estimates, judgments and assumptions are appropriate and reasonable based upon available information, these assessments are subject to a wide range of factors; therefore, actual results could differ from these estimates.
We believe the following critical accounting policies are impacted by our judgment or by estimates used in the preparation of our consolidated financial statements.
Revenue recognition and accounts receivable
Revenue is recognized once the following criteria are met: we have persuasive evidence that an arrangement exists; delivery to our customer has occurred, which happens at the point of shipment (this includes the transfer of both title and risk of loss, provided that no significant obligations remain); the price is fixed and determinable; and collectibility is reasonably assured. We allow our customers to return product for exchange or credit subject to certain limitations. Actual losses on such returns are recorded in the period of the return. Our historical experience has shown the returns to be immaterial. Shipping and handling costs billed to customers are included in revenue and related costs are included in the cost of sales.
We provide allowances for doubtful accounts on our accounts receivable for estimated losses resulting from the inability of our customers to make required payments. Changes in the financial condition of our customers or other unanticipated events, which may affect their ability to make payments, could result in charges for additional allowances exceeding our expectations. These estimates require judgment and are influenced by the following considerations: the large number of customers and their dispersion across wide geographic areas; the fact that no single customer accounts for 1.9% or more of our revenue; a dedicated credit department at our Miami headquarters and at each of our in-country subsidiaries; aging of receivables, individually and in the aggregate; credit insurance coverage; and the value and adequacy of collateral received from our customers in certain circumstances. Uncollectible accounts are written-off annually against the allowance.
In accordance with Emerging Issues Task Force Issue 06-03:How Taxes Collected from Customers and Remitted to Governmental Authorities Should Be Presented in the Income Statement (That Is, Gross Versus NetPresentation), our revenues are reported net of any sales, gross receipts or value added taxes (“VAT”).
We extend a warranty for products to customers with the same terms as the OEM’s warranty to us. All product related warranty costs incurred by us are reimbursed by OEMs.
Vendor Programs
We receive funds from vendors for price protection, product rebates, marketing and promotions and competitive programs, which are recorded as adjustments to product costs or SG&A expenses according to the nature of the program. Some of these programs may extend over one or more quarterly reporting periods. We recognize rebates or other vendor incentives as earned based on sales of qualifying products or as services are provided in accordance with the terms of the related program. We provide reserves for receivables on vendor programs for estimated losses resulting from vendors’ inability to pay or rejections of claims by vendors. These reserves require judgment and are based upon account aging and management’s estimate of collectibility.
47
Table of Contents
Inventories
Our inventory levels are based on our projections of future demand and market conditions. Any unanticipated decline in demand or technological changes could cause us to have excess or obsolete inventories. On an ongoing basis, we review for estimated excess or obsolete inventories and make provisions for our inventories to reflect their estimated net realizable value based upon our forecasts of future demand and market conditions. These forecasts require judgment as to future demand and market conditions. If actual market conditions are less favorable than our forecasts, additional inventory obsolescence provisions may be required. Our estimates are influenced by the following considerations: the availability of protection from loss in value of inventory under certain vendor agreements, the extent of our right to return to vendors a percentage of our purchases, the aging of inventories, the variability of demand due to economic downturn and other factors, and the frequency of product improvements and technological changes. Rebates earned on products sold are recognized when the product is shipped to a third party customer and are recorded as a reduction to cost of sales in accordance with EITF 02-16 “Accounting by a Customer (Including a Reseller) for Certain Consideration Received from a Vendor.”
Goodwill and other long-lived assets
Our goodwill represents the excess of the purchase price over the fair value of the net assets of acquired businesses. We assess goodwill for impairment on an annual basis, or sooner if events indicate such a review is necessary. Potential impairment exists if the fair value of a reporting unit to which goodwill has been allocated is less than the carrying value of the reporting unit. The amount of the impairment to recognize, if any, is calculated as the amount by which the carrying value of the goodwill exceeds its implied value. Future changes in the estimates used to conduct the impairment review, including revenue projections, market values and changes in the discount rate used could cause the analysis to indicate that our goodwill is impaired in subsequent periods and result in a write-off of a portion or all of the goodwill. The discount rate used is based on our capital structure and, if required, an additional premium on the reporting unit based upon its geographic market and operating environment. The assumptions used in estimating revenue projections are consistent with internal planning.
In addition, we review other long-lived assets (principally property, plant and equipment) for impairment whenever events or changes in circumstances indicate that the carrying amount of an asset may not be recoverable. If the carrying amount of an asset exceeds the asset’s fair value, we measure and record an impairment loss for the excess. We assess an asset’s fair value by determining the expected future undiscounted cash flows of the asset. There are numerous uncertainties and inherent risks in conducting business, such as general economic conditions, actions of competitors, ability to manage growth, actions of regulatory authorities, pending investigations or litigation, customer demand and risk relating to international operations. Adverse effects from these or other risks may result in adjustments to the carrying value of our other long-lived assets.
Income taxes
As part of the process of preparing our consolidated financial statements, we calculate our income taxes in accordance with Statement of Financial Accounting Standards No. 109, “Accounting for Income Taxes.” This process involves calculating our actual current tax expense together with assessing any temporary differences resulting from the different treatment of certain items, such as the timing for recognizing revenues and expenses, for tax and financial reporting purposes. These differences may result in deferred tax assets and liabilities, which are included in our consolidated balance sheet. We are required to assess the likelihood that our deferred tax assets, which include temporary differences that are expected to be deductible in future years, will be recoverable from future taxable income or other tax planning strategies. If recovery is not likely, we must provide a valuation allowance based on our estimates of future taxable income in the various taxing jurisdictions, and the amount of deferred taxes that are ultimately realizable. The provision for tax liabilities involves evaluations and judgments of uncertainties in the interpretation of complex tax regulations by various taxing authorities.
In the event of a distribution of the earnings of certain international subsidiaries, we would be subject to withholding taxes payable on those distributions to the relevant foreign taxing authorities. Since we currently
48
Table of Contents
intend to reinvest undistributed earnings of these international subsidiaries indefinitely, we have made no provision for income taxes that might be payable upon the remittance of these earnings. We have also not determined the amount of tax liability associated with an unplanned distribution of these permanently reinvested earnings. In the event that in the future we consider that there is a reasonable likelihood of the distribution of the earnings of these international subsidiaries (for example, if we intend to use those distributions to meet our liquidity needs), we will be required to make a provision for the estimated resulting tax liability, which will be subject to the evaluations and judgments of uncertainties described above.
We conduct business globally and, as a result, we and our subsidiaries file income and other tax returns in U.S. federal, state and foreign jurisdictions. In the normal course of business, we are subject to examination by taxing authorities in the countries in which we operate. Currently, we are under on going tax examinations in several countries. While such examinations are subject to inherent uncertainties, we do not currently anticipate that any such examination would have a material adverse impact on our consolidated financial statements.
Commitments and Contingencies
We accrue for contingent obligations when the obligation is probable and the amount is reasonably estimable. As facts concerning contingencies become known, we reassess our position and make appropriate adjustments to the financial statements. Estimates that require judgment and are particularly sensitive to future changes include those related to taxes, legal matters, the imposition of international governmental monetary, fiscal or other controls, changes in the interpretation and enforcement of international laws (in particular related to items such as duty and taxation), and the impact of local economic conditions and practices, which are all subject to change as events evolve and as additional information becomes available.
As part of our normal course of business, we are involved in certain claims, regulatory and tax matters. In the opinion of our management, the final disposition of such matters will not have a material adverse impact on our results of operations and financial condition.
New Accounting Pronouncements
In February 2007, the Financial Accounting Standards Board, or FASB, issued Statement of Financial Accounting Standards No. 159, or SFAS 159, “The Fair Value Option for Financial Assets and Liabilities.” SFAS 159 permits companies to make an election to carry certain eligible financial assets and liabilities at fair value, even if fair value measurement has not historically been required for such assets and liabilities under U.S. GAAP. The pronouncement is effective for financial statements issued for fiscal years beginning after November 15, 2007. We are currently evaluating the effect SFAS 159 will have on our consolidated results of operations and financial condition.
In September 2006, FASB issued Statement of Financial Accounting Standards No. 157, or SFAS 157, Fair Value Measurements. SFAS 157 defines fair value, establishes a framework for measuring fair value in generally accepted accounting principles, and expands disclosures about fair value measurements. This pronouncement is effective for financial statements issued for fiscal years beginning after November 15, 2007. We are currently evaluating the effect SFAS 157 will have on our consolidated results of operations and financial condition.
In September 2006, the SEC staff issued Staff Accounting Bulletin No. 108, or SAB 108, “Considering the effects of Prior Year Misstatements when Quantifying Misstatements in Current Year Financial Statements.” Traditionally, there have been two widely-recognized methods for quantifying the effects of financial statement misstatements: the “roll-over” method and the “iron curtain” method. The roll-over method focuses primarily on the impact of a misstatement on the income statement, including the reversing effect of prior year misstatements. The iron-curtain method focuses primarily on the effect of correcting the period-end balance sheet with less emphasis on the reversing effects of prior year errors on the income statement. In SAB 108, the SEC staff established an approach that is commonly referred to as a “dual approach” because it now requires quantification
49
Table of Contents
of errors under both the iron curtain and the roll-over methods. For us, SAB 108 is effective for the fiscal year ended December 31, 2006. The adoption of SAB 108 did not have a material effect on our consolidated results of operations and financial condition.
In July 2006, the FASB issued Financial Interpretation No. 48, or FIN No. 48, “Accounting for Uncertainty in Income Taxes—An Interpretation of FASB Statement No. 109.” This interpretation prescribes a recognition threshold and measurement attribute for the financial statement recognition and measurement of a tax position taken or expected to be taken in a tax return. This interpretation also provides guidance on de-recognition, classification, interest and penalties, accounting in interim periods, disclosure and transition. FIN No. 48 is effective for the first quarter of fiscal years beginning after December 15, 2006 and we adopted it effective March 31, 2007. The impact of adopting FIN No. 48 with respect to the financial statements for the quarter ended March 31, 2007 did not have any effect on our consolidated results of operations, financial condition or prior year financial statements.
In March 2006, the FASB issued Statement of Financial Accounting Standards No. 156, or SFAS No. 156, “Accounting for Servicing Financial Assets—an amendment of FASB Statement No. 140.” SFAS 156 requires separate recognition of a servicing asset and a servicing liability each time an entity undertakes an obligation to service a financial asset by entering into a servicing contract. This statement also requires that servicing assets and liabilities be initially recorded at fair value and subsequently be adjusted to the fair value at the end of each reporting period. SFAS 156 is effective for an entity’s first fiscal year that begins after September 15, 2006. The adoption of SFAS 156 did not have a material impact on our consolidated results of operations and financial condition.
In February 2006, the FASB issued Statement of Financial Accounting Standards No. 155, or SFAS No. 155, “Accounting for Certain Hybrid Financial Instruments, an amendment of FASB Statements No. 133 and 140.” SFAS 155 improves financial reporting by eliminating the exemption from applying SFAS 133 to interest in securitized financial assets so that similar instruments are accounted for similarly regardless of the form of the instrument. SFAS 155 also improves financial reporting by allowing a preparer to elect fair value measurement at acquisition, at issuance, or when a previously recognized financial instrument is subject to a remeasurement event, on an instrument-by-instrument basis, in cases in which a derivative would otherwise be bifurcated. At the adoption of SFAS 155, any difference between the total carrying amount of the individual components of any existing hybrid financial instrument and the fair value of the combined hybrid financial instrument should be recognized as a cumulative-effect adjustment to our beginning retained earnings. SFAS 155 is effective for us for all financial instruments acquired or issued after January 1, 2007. The adoption of SFAS 155 did not have a material impact on our consolidated results of operations and financial condition.
In May 2005, the FASB issued Statement of Financial Accounting Standards No. 154, or SFAS No. 154, Accounting Changes and Error Corrections, which supersedes APB Opinion No. 20, Accounting Changes, and SFAS No. 3, Reporting Accounting Changes in Interim Financial Statements. SFAS 154 changes the requirements for the accounting for and reporting of changes in accounting principle. The statement requires the retroactive application to prior periods’ financial statements of changes in accounting principles, unless it is impracticable to determine either the period specific effects or the cumulative effect of the change. SFAS 154 does not change the guidance for reporting the correction of an error in previously issued financial statements or the change in an accounting estimate. SFAS 154 is effective for accounting changes and corrections of errors made in fiscal years beginning after December 15, 2005. The adoption of SFAS 154 did not have a material impact on our consolidated results of operations and financial condition.
In March 2005, the SEC issued Staff Accounting Bulletin No. 107, or SAB 107, “Share-Based Payment,” providing guidance on option valuation methods, the accounting for income tax effects of share-based payment arrangements upon adoption of SFAS 123R, and the disclosures in Management’s Discussion and Analysis of Financial Condition and Results of Operations subsequent to the adoption. The Company will provide SAB 107
50
Table of Contents
required disclosures upon adoption of SFAS 123R. We are currently evaluating SAB 107 and will be incorporating it as part of our adoption of SFAS 123R in 2007 as we incorporate a share-based payment program.
Quantitative and Qualitative Disclosures About Market Risks
Foreign exchange risk
Our principal market risk relates to foreign exchange rate sensitivity, which is the risk related to fluctuations of local currencies in our in-country markets, compared to the U.S. dollar. We generally do not engage in foreign currency hedging arrangements because either we do not believe it is cost-effective or it is not available to us for certain foreign currencies. Consequently, foreign currency fluctuations may adversely affect our results of operations, including our gross and operating margins.
A significant portion of our revenues from in-country operations is invoiced in currencies other than the U.S. dollar, even though prices for IT products in our in-country markets are based on U.S. dollar amounts. For the years ended December 31, 2006 and 2005, 40.7% and 34.9%, respectively, of our total revenue was invoiced in currencies other than the U.S. dollar. In addition, a significant majority of our cost of revenue is driven by the pricing of products in U.S. dollars. As a result, our gross profit and gross margins will be affected by fluctuations in foreign currency exchange rates. In addition, a significant amount of our in-country operating expenses are denominated in currencies other than the U.S. dollar. For the years ended December 31, 2006 and 2005, 57.9% and 54.4%, respectively, of our operating expenses were denominated in currencies other than the U.S. dollar. As a result, our operating expenses and operating margins will be affected by fluctuations in foreign currency exchange rates.
In most markets, including Argentina, Chile, Colombia, Costa Rica, Guatemala, Jamaica, Mexico, Peru and Uruguay, we invoice in local currency. Foreign currency fluctuations in these markets will impact our results of operations, both through foreign currency transactions and through the re-measurement of the financial statements into U.S. dollars. In the case of foreign currency transactions, inventory is initially recorded in the books and records of our in-country operations in the local currency at the exchange rate in effect on the date the inventory is received by our in-country operations. When a sale of this inventory is made by our in-country operations, it is invoiced and recorded in the books and records in the local currency based on the U.S. dollar price converted at the exchange rate in effect on the date of sale. As a result, the appreciation of a local currency in one of these markets between the time inventory is purchased and the time it is sold will reduce our gross profit in U.S. dollar terms, thereby reducing our gross margins. In these cases, the settlement of the initial payable owed to a vendor (including, in many cases, our Miami operations) results in a foreign exchange gain, which is included in Foreign exchange loss (Gain) in our consolidated statements of operations and which effectively offsets, in part, the reduction in gross profit. Conversely, the weakening of a local currency in one of these markets will have the opposite effect from those described above on our gross profit and gross margins.
The U.S. dollar is the functional currency in the preparation of our consolidated financial statements in all of our in-country operations, except in Mexico where the functional currency is the Mexican Peso. In most of our in-country operations, including Argentina, Chile, Colombia, Costa Rica, Guatemala, Jamaica, Mexico, Peru and Uruguay, our books and records are prepared in currencies other than the U.S. dollar. For these countries, re-measurement into the U.S. dollar is required for the preparation of our consolidated financial statements and will impact our results of operations. The re-measurement of our operating expenses is performed using an appropriately weighted-average exchange rate for the period. For periods where the local currency has appreciated relative to the U.S. dollar, the re-measurement increases the value of our operating expenses, thereby adversely impacting our operating margins. Conversely, the weakening of a local currency in one of these markets will have the opposite effect from those described above on operating expenses and operating margins. For example, we estimate that a one percent weakening or strengthening of the U.S. dollar against these local currencies would have increased or decreased our selling, general and administrative expenses by $333,000 and $236,000 for the years ended December 31, 2006 and 2005, respectively. The re-measurement of our monetary
51
Table of Contents
assets and liabilities is performed using exchange rates at the balance sheet date, with the changes being recognized in Foreign exchange loss (Gain) in our consolidated statements of operations.
In Ecuador, Panama and El Salvador, all of our transactions are conducted in U.S. dollars and all of our financial statements are prepared using the U.S. dollar, and therefore, foreign exchange fluctuations do not directly impact our results of operations.
We believe that our broad geographical scope reduces our exposure to the risk of significant and sustained currency fluctuations in any of our Latin American or Caribbean markets. In addition, a relatively small portion of the sales from our in-country operations in Argentina, Chile, Costa Rica, Peru and Uruguay can be invoiced, at the election of certain of our customers, in U.S. dollars, thereby reducing the overall impact of fluctuations in the foreign currency exchange rates in these countries. In addition, in Chile, we from time to time reduce our exposure to the risk of a currency devaluation by drawing on a Chilean peso-denominated line of credit to acquire U.S. dollars.
If there are large and sustained devaluations of local currencies, like those that occurred in Brazil in 2000 and Argentina in 2001, many of our products can become more expensive in local currencies. This could result in our customers having difficulty paying those invoices and, in turn, result in decreases in revenue. Moreover, such devaluations may adversely impact demand for our products because our customers may be unable to afford them. In these circumstances, we will usually offer a repayment plan for an affected customer, which in our experience has usually resulted in successful collection. In addition, substantially all of our Miami operations’ accounts receivable (other than accounts receivable owed by affiliates) are insured by Euler Hermes ACI up to an aggregate limit of $20.0 million with an aggregate deductible of $ 0.5 million. In addition, 10% or 20% buyer coinsurance provisions apply, as well as sub-limits in coverage on a per-buyer and on a per-country basis.
It is our policy not to enter into foreign currency transactions for speculative purposes.
Interest rate risk
We are also exposed to market risk related to interest rate sensitivity, which is the risk that future changes in interest rates may affect our net income or our net assets.
Given that a majority of our debt is a fixed rate obligation, we do not believe that we have a material exposure to interest rate fluctuations. For 2006, assuming our $25.0 million floating rate revolving credit facility with Comerica Bank was fully drawn for the entire year, a 1.0% (100 basis points) increase (or decrease) in the prime lending rate would result in $250,000 increase (or decrease) in our current expense for the year.
It is our policy not to enter into interest rate transactions for speculative purposes.
52
Table of Contents
Our Company
We believe we are the largest pure play value-added distributor of IT products focused solely on serving Latin America and the Caribbean. We distribute computer components, peripherals, software, computer systems, accessories, networking products and digital consumer electronics to more than 40,000 customers in 45 countries. We offer single source purchasing to our customers by providing an in-stock selection of more than 5,700 products from over 220 vendors, including many of the world’s leading IT product manufacturers.
We serve the Latin American and Caribbean IT products markets using a dual distribution model:
| • | As a Miami-based wholesale aggregator, we sell primarily to: |
| - | third-party distributors, resellers and retailers of IT products based in countries in Latin America and the Caribbean where we do not have a local presence; |
| - | third-party distributors, resellers and retailers of IT products based in countries in Latin America and the Caribbean where we have a local presence but whose volumes are large enough to enable them to efficiently acquire products directly from U.S.-based wholesale aggregators; |
| - | other Miami-based exporters of IT products to Latin America and the Caribbean; and |
| - | our in-country operations. |
| • | As an in-country distributor in 12 countries, we currently sell to over 40,000 local reseller and retailer customers, including value-added resellers (companies that sell, install and support IT products and PCs), systems builders (companies that specialize in building complete computer systems by combining components from different vendors), smaller distributors and retailers. |
Our History
Anthony Shalom and Michael Shalom founded our company as a small software retailer in South Florida in 1988. In 1989, we started exporting IT products from Miami to Latin America and moved our headquarters to the vicinity of the Port of Miami and the Miami International Airport in order to capitalize on the growing export trade of IT products to Latin America and the Caribbean. We established our first in-country sales and distribution operations in Mexico in 1990, and expanded our presence to include Panama and Chile in 1994; Peru, Guatemala and Uruguay in 1997; El Salvador, Ecuador, Costa Rica and Jamaica in 2000; Argentina in 2003; and Colombia in 2004. In 2001, we exchanged with the management of Centel our interest in Centel, our then-existing Mexican operations, for the Intcomex shares held by the management of Centel and we re-established our presence in Mexico by re-acquiring all interests in Centel in June 2005. Our growth into new markets has been largely organic, typically in partnership with talented local managers knowledgeable about the IT products distribution business in their country.
In August 2004, CVC International, a unit of Citigroup Inc. engaged in private equity investments in emerging markets, acquired 52.5% of our voting equity interests. As part of that transaction, we redeemed all of the equity interests in our company held by our former non-management stockholders and some of the equity interests in our company held by our management stockholders. Following this offering, CVC International will own % of our common stock on a fully diluted basis, or approximately % if the underwriters’ over-allotment option is exercised in full, and management will own % of our common stock on a fully diluted basis, or approximately % if the underwriters’ over-allotment option is exercised in full.
53
Table of Contents
Our Industry
IT products generally follow a three-tiered distribution system from the manufacturer to end-users in Latin America and the Caribbean:
| • | Wholesale aggregators, like our Miami-based operations, typically based in Miami, purchase IT products from vendors, and sell those products to other Miami-based exporters and in-country distributors. They typically maintain warehouses and sales forces in Miami and do not have substantial operations outside of Miami. For the six months ended June 30, 2007 and the year ended December 31, 2006, revenue from our Miami operations represented 29.4% and 30.0% of our consolidated revenue, respectively. |
| • | In-country distributors, like our in-country operations, typically purchase IT products from wholesale aggregators and sell them to local resellers and retailers. The in-country distributors typically have a limited geographic focus (generally limited to one country or cities within one country), a local sales force in direct contact with their customers and local warehousing. The in-country distributors’ limited size, capital and geographic reach often prevent them from establishing and maintaining direct relationships with vendors, which are located predominantly in the United States and Asia and which focus their relationships on IT distributors with broad geographic coverage or large order sizes. In most markets most in-country distributors lack sufficient size to benefit from significant economies of scale and are not sufficiently capitalized to offer their customers a full range of products and services. We have in-country sales and distribution operations in 12 countries in Latin America and the Caribbean and a sales office in Brazil. For the six months ended June 30, 2007 and the year ended December 31, 2006, revenue from our in-country operations represented 70.6% and 70.0% of our consolidated revenue, respectively. |
| • | Resellers typically acquire IT products from the in-country distributors and resell them to the end-user (typically individuals, small and medium businesses or governments). Resellers vary greatly in size and type, from one-person operations to large retailers. |
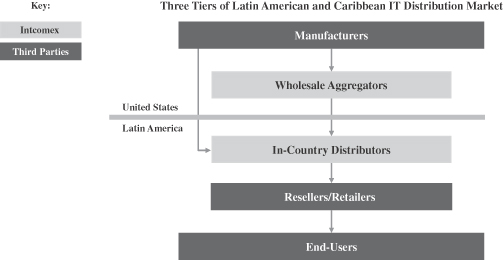
The distribution model for IT products in Latin America and the Caribbean is markedly different from that of more advanced markets where direct sales by IT vendors are common. In Latin America and the Caribbean, IT vendors rely extensively on wholesale distribution rather than direct sales. According to IDC, in 2006, IT distributors (including local dealers, local assemblers and resellers) sold 82% of PCs sold in Latin America and the Caribbean, while the remaining 18% of PCs were sold directly to end-users through the Internet and OEM direct sales. IT distributors sold 84% and 82% of PCs sold in Latin America and the Caribbean in 2004 and 2005, respectively, according to IDC.
54
Table of Contents
Latin America and the Caribbean are comprised of more than 40 countries, many unique with respect to their logistical infrastructure, regulatory and legal framework, trade barriers, taxation, currency and language. This fragmentation presents challenges to IT product manufacturers seeking to establish a regional distribution, sales, logistics and service network, because such a network would have to be created separately for each country, with limited economies of scale due to the small size of most markets and barriers to entry associated with cross-border complexities. We believe that our dual distribution model, as well as our extensive geographic presence in the region, is not only unique but also valuable to our vendors and customers and difficult to replicate.
The IT products distribution industry is driven by sales to end-users. From 1996 to 2006, spending on IT products (including hardware, packaged software and services) in Latin America and the Caribbean grew an average of 5.9% per year, from $21.8 billion to $38.7 billion, and, according to IDC, is projected to grow an average of 11.8% per year from 2006 to 2010, to $60.4 billion. While the Latin American and Caribbean population of approximately 561 million people is 88.1% larger than that of the United States, the market in 2006 for IT products in the region was only 8.8% of the market for IT products in the United States.
The growth in IT spending in Latin America and the Caribbean is attributed mainly to increasing PC penetration rates, rapidly increasing Internet penetration rates and increasing access to consumer credit.
Increasing PC penetration rates
According to Pyramid Research, from 2000 to 2006, the PC penetration rate of Latin America and the Caribbean increased from 5.1% to 14.8%. Over the same period, the number of PC users in this region increased an average of 22.3% per year. Despite this growth, the PC penetration rate of Latin America and the Caribbean is low when compared to the PC penetration rates of 83.0% in the United States and Canada and 57.3% in Western Europe in 2006. The low penetration rates of Latin America and the Caribbean provide substantial potential for growth. From 2006 to 2010, the number of PC users in Latin America and the Caribbean is expected to grow an average of 12.0% per year with penetration rates rising from 14.8% to 22.2% over this period.
PC Users and Penetration Rate in Latin America and the Caribbean
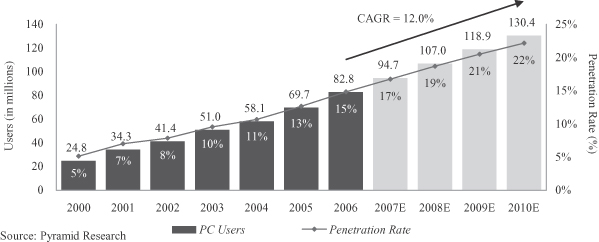
55
Table of Contents
Growth in PCs in Latin America and the Caribbean is expected to come from continuing growth in the desktop segment of the market as well as accelerating growth in the notebook computer segment. According to Gartner, desk-based PC shipments in Latin America (which, as defined by Gartner, includes the Caribbean) are projected to grow from 15.4 million units in 2006 to 23.8 million units in 2010, representing a growth rate of an average of 11.4% per year. Gartner expects notebook computer shipments to grow from 2.8 million units in 2006 to 11.5 million units in 2010, representing a growth rate of an average of 42.7% per year. By 2010, Gartner estimates that desk-based PCs and notebook computers will comprise 67% and 33% of total PC shipment volume, respectively.
The growth in PC users in Latin America and the Caribbean has been driven primarily by the decreasing cost of computers, the proliferation of unbranded, or “white-box,” PCs, the growing popularity of the Internet and rising per capita incomes. According to Gartner, the average selling price of a PC in Latin America and the Caribbean fell an average of 8.5% per year from 2000 to 2006 and has continued to decrease, expanding the market for PC buyers. Due to the lower per capita income levels in Latin America and the Caribbean as compared to the United States, Canada and Western Europe, many PC buyers in this region opt to purchase a white-box PC. White-box personal computers typically have lower retail selling prices but higher margins than branded computer systems. According to Gartner, in 2006 white-box personal computers comprised about 57.3% of the Latin American and Caribbean personal computer market. From 2006 to 2010, the unit shipments of PCs priced under $500 in Latin America and the Caribbean are expected to grow at an average annual growth rate of 24.0% per year. From 2003 to 2006, per capita GDP in Latin America and the Caribbean grew an average of 15.4% per year from $3,502 to $5,389, and, according to Global Insight, is expected to increase an average of 6.7% per year from $5,389 in 2006 to $6,977 in 2010.
Unit Shipments of PCs Priced Under $500 in Latin America and the Caribbean
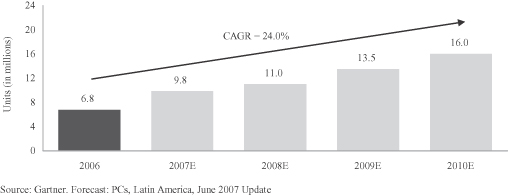
56
Table of Contents
Rapidly increasing Internet penetration rates
According to Pyramid Research, from 2000 to 2006, the Internet penetration rate in Latin America and the Caribbean grew from 4.1% to 15.7%. Over the same time period, the number of Internet users in this region grew an average of 28.2% per year from 19.8 million users to 87.7 million users. Despite this growth, the Internet penetration rate is low when compared to the Internet penetration rates of 69.4% in the United States and Canada and 52.4% in Western Europe in 2006. The low Internet penetration rate in Latin America and the Caribbean provides the potential for substantial growth, which would have a positive impact on the Latin American and Caribbean IT industry as a whole. From 2006 to 2010, the number of Internet users is expected to grow an average of 16.0% per year in Latin America and the Caribbean, increasing penetration rates from 15.7% to 27.0% over this period.
Internet Users and Penetration Rate in Latin America and the Caribbean

57
Table of Contents
Increased access to consumer credit
From 2001 to 2006, the number of financial card transactions in Latin America and the Caribbean grew from 8.8 billion to 26.7 billion, a compounded annual growth rate of 24.9%, according to Euromonitor International. Transactions from store cards play a significant role in the development of the financial cards market. Latin American consumers have limited access to bank accounts and utilize store cards as their primary method to access credit. With increased access to credit, consumers are able to purchase additional goods as stores are implementing initiatives such as installment plans with weekly payments. Growth from financial card transactions is expected to remain strong over the next three years. Euromonitor International forecasts the growth rate will be 8.9% annually from 2006 to 2009 due to improving economic conditions and the emergence of a sustainable working middle class in the region. Over the same period, the number of store card transactions in major Latin America economies such as Chile, Colombia and Mexico is also expected to grow greater than 10% annually. We believe that increased access to consumer credit will be a significant driver of growth in IT spending in Latin America.
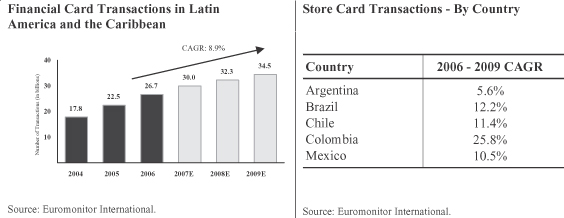
Our Strategy
We intend to achieve future growth and profitability through the following strategies:
Capitalize on our broad distribution platform to drive growth across markets. We expect to grow and strengthen our diverse customer base by leveraging our large selection of products and our comprehensive offering of value-added services, including product training and support, credit and financing, and reverse logistics. We primarily target small and medium size customers in highly fragmented markets where our broad distribution platform and economies of scale are difficult for potential competitors to replicate. We intend to expand our geographic presence by opening sales and distribution centers in new cities in countries where we already have in-country operations and by establishing new in-country sales and distribution operations in countries where we are not already present. Our focus on in-country operations is driven by our belief that we can achieve higher revenue growth and gross margins from our in-country operations, as compared to distributing solely from our Miami-based wholesale operations. When assessing a new market, we consider the local economic environment, local market conditions of the IT industry, the number of competitors, and the business model and methods of current market participants. We typically identify a talented local partner who has substantial prior experience within the industry as well as an in-depth knowledge of the local market. We believe these opportunities to expand within our current markets and to enter new markets will allow us to gain market share and accelerate our growth.
Focus on maximizing our operating leverage and scale efficiencies. As our revenues increase, we will seek to enhance our margins by maintaining control over our operating expenses and realizing increased economies of scale in product purchasing and working capital management. We constantly strive to reduce costs in our business through initiatives designed to streamline our business processes. We continually seek to
58
Table of Contents
optimize our accounts receivable, accounts payable and inventory days to manage our working capital needs. We are also enhancing our working capital management and financial control systems by installing Sentai, a scalable IT system that enables simultaneous decentralized decision-making by our employees involved in sales and purchasing while permitting control of daily operating functions by our senior management. The system has been implemented in eight of our 12 in-country locations and our Miami location. We expect to complete implementation of the Sentai system by year-end 2008.
Leverage our vendor relationships to increase our product portfolio. We have many long standing relationships with industry-leading IT product vendors. We continually build upon our comprehensive in-stock selection of more than 5,700 IT products by expanding our existing product categories to include additional products or vendors and by adding new product categories or subcategories. We target our expansion into product categories that are expected to grow rapidly such as enterprise-class products (including servers, storage and software), enterprise IP telephony products (including IP private branch exchange, or PBX, systems and IP telephones), gaming and “infotainment” products (including video game systems), and digital consumer electronics (including digital cameras and plasma displays). In addition, we believe an opportunity exists to broaden our product portfolio to distribute peripheral products such as inkjet cartridges, paper and DVDs, which are typically sold in conjunction with printers and other products. Our long standing vendor relationships allow us to quickly introduce new products and categories to our existing customer base and to add new customer segments to our business. We intend to continue to expand our product offering to satisfy the rapidly evolving IT product requirements of our customers.
Expand our growth opportunities. In addition to our current opportunities for achieving continued growth, we also intend to grow our business through extensions of our existing capabilities, including further product diversification and targeting of new markets. We intend to apply our knowledge of local markets and our strong relationships with U.S. and Asian manufacturers to the following:
| • | Expanding our retail presence across geographies. We plan to continue to expand our retailer customer base across the region. Currently, we distribute products to retailers in countries in which we have in-country operations. In Argentina, Chile and Costa Rica we have made significant progress in penetrating retailer accounts. In 2006, sales to retailers in Argentina, Chile and Costa Rica represented approximately 20% of the total revenues of each of our Argentinean, Chilean and Costa Rican subsidiaries.We believe the success of our emerging retail strategy in the region can be extended to other countries in which we do not currently have long standing retail relationships. For example, we recently launched an initiative targeting large retailers in Mexico such as Wal-mart, OfficeMax, Office Depot and Sanborns and plan to service this growing market with our current product portfolio. |
| • | Expanding our private label products. We believe our expertise in purchasing and distributing unbranded or “white-box” PC products from Asia can be applied to assembling private label computer products for new and existing customers. White-box PC products are assembled from standard, widely available components and do not bear the brand name of a major computer manufacturer or seller. The private label products we currently assemble include: the TecnoFriend brand for Riberio, Sound & Music for Spectra and Mirray for Hiroka. In total, we distribute private label products for 8 different retailers in 5 countries in Latin America and the Caribbean. We plan to continue to work with Asian manufacturers and retailers to expand our business in this market. |
| • | Expanding our own branded products. We intend to continue to offer and enhance the distribution of IT products under our own brand names: KLIP (enclosures and IT accessories), FORZA (power supplies), Blue Code (PC kits), Hurricane (operating PCs) and NEXXT Solutions (networking products). We believe our current own brand strategy to enhance our own named brands has strong growth potential that we believe will increase our growth and margins. |
| • | Expanding our customer base to small non-traditional retailers. We also believe a market opportunity exists to target numerous small non-traditional retailers in Latin America and the Caribbean that currently purchase IT-related products and consumables. We plan to use our existing distribution network and product portfolio to service these new customers. |
59
Table of Contents
Pursue selective acquisitions. As part of our growth strategy, we intend to selectively pursue the acquisition of companies that either complement or expand our existing business. As a result, we regularly evaluate potential acquisition opportunities, which may be material in size and scope. We intend to target selective acquisitions that we believe will expand our business into new markets or improve our distribution capabilities, while growing revenues and enhancing margins. For example, as a result of our re-acquisition of all interests in Centel in June 2005, we were able to expand our in-country presence in Mexico and grow our revenues from Mexico from $3.7 million for the year ended December 31, 2004 to $106.2 million for the year ended December 31, 2006.
Our Operations
Our Regional Presence
We believe we have the broadest geographical scope of any IT distributor in Latin America and the Caribbean, with sales and distribution centers in 13 countries — the United States, Chile, Argentina, Panama, Guatemala, Peru, Uruguay, El Salvador, Jamaica, Costa Rica, Ecuador, Mexico and Colombia — and a sales office in Brazil.
Revenue derived from sales to customers located in Latin America and the Caribbean accounted for almost all of our consolidated revenue for the six months ended June 30, 2007 and the year ended December 31, 2006. The following chart shows our revenue for the year ended December 31, 2006 by the customers’ country of origin.
2006 Percentage of Revenue by Customers’ Country of Origin
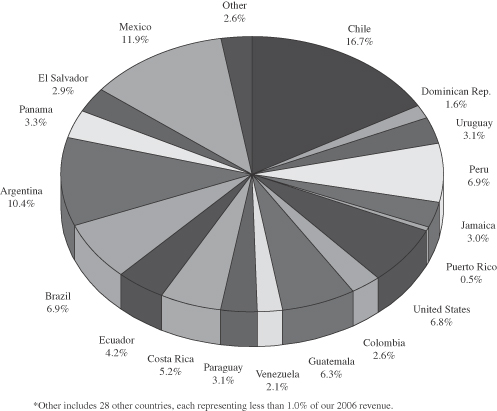
60
Table of Contents
Our Miami Operations
Our Miami operations serve as the headquarters for our entire company. Our Miami operations handle purchases from our vendors, and a majority of the products that we acquire from vendors pass through our Miami warehouse (with the exception of products sourced from Asia, which are usually shipped directly to our in-country operations). Miami supplies our 24 in-country sales and distribution centers and our sales office in Brazil and also sells products directly to third parties. Miami’s third-party customers include U.S., Latin American and Caribbean distributors, resellers and retailers, which in turn distribute or sell products throughout Latin America and the Caribbean.
Our Miami purchasing department handles most of our vendor relationships and contracts. Our Miami operations monitor our entire inventory pipeline on an ongoing basis and use information regarding the levels of inventory, in conjunction with input from the in-country managers regarding our customer demand patterns, to place orders with vendors. The centralization of our purchasing function allows the in-country operations to focus their attention on more country-specific issues such as sales, local marketing, credit control and collection. The centralization of purchasing also allows our Miami operations to maintain the records with regard to all vendor back-end rebates, promotions and incentives to ensure they are collected and to adjust pricing of products according to such incentives.
Our Miami distribution center ships products to each of our in-country sales and distribution operations twice a week by air and once a week by sea. These frequent shipments facilitate more efficient inventory management and increased inventory turnover. We do not have long-term contracts with logistics providers, except in Mexico and Chile. Where we do not have long-term contracts, we seek to obtain the best rates and fastest delivery times on a shipment-by-shipment basis. Our Miami operations also coordinate direct shipments to third-party customers and in-country operations from vendors in Asia.
A number of our sales and marketing staff are located at our Miami headquarters. See “—Customers, Sales and Marketing.” Other functions performed in our Miami headquarters include treasury and accounting, strategic planning, consolidated information systems development and maintenance and overall marketing strategy.
Our In-Country Operations
Each of our in-country sales and distribution operations has a focused sales force and, with the exception of our Brazil operations (which consist solely of a sales office), a substantial inventory. Our in-country operations sell to more than 40,000 customers in the aggregate.
Our in-country operations are critical to meeting the needs of local resellers and retailers which are often small, locally owned companies that lack the size and the knowledge to buy directly from the United States or Asia and to handle customs processing, including taxes and duties. By selling directly to resellers and retailers from locally-based operations, our in-country operations provide a competitive advantage over other multinational companies that export products into those markets. We believe that we offer our customers some of the shortest product delivery times in the industry by leveraging our capabilities as a Miami-based aggregator and as an in-country distributor. Our local presence also allows us to obtain timely and accurate information with respect to the needs of the customers in each market and the market’s growth potential.
Each of the following functions is the responsibility of the local in-country operations: sales, local marketing, extensions of credit (in compliance with our corporate credit policies), collections, inventory controls, local accounting and financial controls, shipping to customers (when needed) and providing local input (in addition to the data provided by the IT systems) to Miami for purchasing decisions.
Products
We aim to offer single source purchasing to our reseller and retailer customers so that they can purchase from us all of their IT product needs, and we believe that our wide selection of products is a key attraction for
61
Table of Contents
resellers and retailers that buy from us. The single source purchasing concept is especially important for assemblers of unbranded or “white-box” personal computers, which must source all the necessary components before they can commence assembly. White-box personal computers typically have lower retail selling prices but higher margins than branded computer systems. According to Gartner, in 2006 white-box personal computers comprised about 57.3% of the Latin American and Caribbean personal computer market. We do not focus on selling branded desktop PCs other than our own Hurricane operating PCs and Blue Code PC kits and PCs we assemble under our customers’ brands.
Our in-country product lines typically include between 1,500 and 2,500 products in stock. We believe, based on our management’s estimates, that many of our local competitors have product lines of no more than 200 to 300 products in stock. The table below presents the percentage of our revenue represented by each of our product categories in each of the last three years:
| Year ended December 31, | |||||||||
Category | 2004 | 2005 | 2006 | ||||||
Components | 55.2 | % | 56.5 | % | 51.0 | % | |||
Peripherals | 25.3 | % | 23.3 | % | 18.2 | % | |||
Software | 6.9 | % | 5.8 | % | 4.9 | % | |||
Computer systems | 6.5 | % | 7.5 | % | 10.5 | % | |||
Accessories | 3.2 | % | 4.8 | % | 10.4 | % | |||
Networking | 2.0 | % | 1.9 | % | 2.2 | % | |||
Other products | 0.9 | % | 0.2 | % | 2.8 | % | |||
Total | 100.0 | % | 100.0 | % | 100.0 | % | |||
Our product categories are:
| • | Components. This category consists of the components that are the basic building blocks of a PC and includes motherboards, processors, memory chips, internal hard drives, internal optical drives, cases and monitors. |
| • | Peripherals. This category consists of devices that are used in conjunction with computer systems and includes printers, power protection/backup devices, mice, scanners, external disk drives, multimedia peripherals, modems, projectors and digital cameras. |
| • | Software. This category includes operating system, security and anti-virus software. |
| • | Computer systems. This category consists of self-standing computer systems capable of functioning independently. In most of our operations, we assemble and sell PC and notebook computers under our own brands, under our customers’ brands and in unbranded cases. |
| • | Accessories. This category includes computer cables, connectors, computer and networking tools, media, media storage, keyboard and mouse accessories, speakers, computer furniture and networking accessories. |
| • | Networking. This category consists of hardware that enables two or more personal computers to communicate, and includes modems, routers, switches, hubs and wireless local area network access points, local area network (“LAN”) interface cards and wireless LAN interface cards. |
| • | Other products. This category includes digital consumer electronics and special order products. |
Our primary focus is on components, peripherals and accessories categories, as these tend to have higher margins than the other product categories. We believe that a focus on components, peripherals and accessories, together with the vendor protection policies described below under “—Vendors,” help us reduce the risks of inventory obsolescence. We believe that our inventory obsolescence rates, at 0.12%, 0.16% and 0.19% of
62
Table of Contents
revenue for the six months ended June 30, 2007 and the years ended December 31, 2006 and 2005, respectively, are very low by industry standards. One of our strategies is to maintain this core mix of product categories, and in particular to maintain high levels of sales in the components category, as more people in Latin America and the Caribbean become computer users.
Among our growth strategies is the expansion of our offerings in the following product categories or subcategories: enterprise-class networking products (including networking products, servers, storage and software), enterprise IP telephony products (including IP PBX systems and IP telephones), gaming and “infotainment” products (including video game systems), digital consumer electronics (including digital cameras and plasma displays) and products sold under our proprietary brands (for example, Hurricane). We plan to expand into these categories gradually as demand for these products grows among our customers and end user markets, our existing vendors start offering these products and we initiate relationships with new vendors offering these products.
Vendors
We have established direct relationships with many of the major global manufacturers of branded computer products, including Epson, Hewlett Packard, Intel, Kingston, Microsoft, Samsung, Seagate and Western Digital, as well as a host of generic component vendors from the United States and Asia. For the six months ended June 30, 2007, our top ten vendors manufactured products that accounted for 65.0% of our total revenue and the products of our top vendor accounted for 16.8% of our total revenue. For the year ended December 31, 2006, our top ten vendors manufactured products that accounted for 63.8% of our total revenue and the products of the same top vendor accounted for 14.8% of our total revenue. For the year ended December 31, 2005, our top ten vendors manufactured products that accounted for 64.0% of our total revenue and the products of a different top vendor accounted for 14.8% of our total revenue. We continue to believe in the strategic importance of diversifying our revenues among multiple vendors.
We have entered into written distribution agreements with many of our vendors, which typically provide for nonexclusive distribution rights for specific territories. We believe that it is not common in our industry for vendors to have exclusive relationships with distributors, and, because the market for IT products is subject to rapid change and reliant upon product innovation, we believe that our customers are better served by our ability to carry competing brands. The agreements are generally short term and subject to periodic renewal.
Our vendors typically extend us payment terms of between 30 and 60 days. Vendors of branded products often offer us back-end rebates, promotions and incentives.
Like other IT distributors, we are subject to the risk that the value of our inventory will be affected adversely by vendors’ price reductions or by technological changes affecting the usefulness or desirability of the products comprising our inventory. It is the policy of many vendors of IT products to offer distributors like us, who purchase directly from them, some protection from the loss in value of inventory due to technological change or a vendor’s price reductions. Under many of these agreements, there is only a limited, specified period of time in which the distributor may return products for credit or exchange products for other products or during which price protection credits may be claimed. To maximize our protection under vendor programs and reduce our inventory risk, we take various actions, including monitoring our inventory levels, soliciting frequent input from in-country managers about demand projections and controlling the timing of purchases.
Although we do not offer our own rebates or price protection to our customers, we provide some of the benefits of vendor-sponsored rebates. When we sell a product, we issue our customer a warranty for the product with the same terms as the vendor’s warranty to us. We track the unique serial numbers of all products passing through all of our distribution facilities. By tracking unique serial numbers, we are able to determine whether specific products presented by our customers or our in-country operations for service or repair under warranty do in fact benefit from warranties from us. This system allows us to limit the quantity of unauthorized returns of
63
Table of Contents
merchandise and to provide fast and high quality return-to-manufacturer authorization service across Latin America and the Caribbean. Our expenses incurred in administering the warranties issued to our customers were $1.1 million, $2.1 million and less than $1.0 million in 2006, 2005 and 2004, respectively.
Customers, Sales and Marketing
Customers
We currently sell to over 40,000 distributors, resellers and retailers. Although the end users of our products are mostly individuals and small and medium-sized businesses, we supply these end users through a well- established network of in-country distributors, value added resellers, system builders and retailers, as well as through U.S.-based distributors selling into these regions. We have always emphasized customer care and long-term customer development. We seek to build customer loyalty not only by having wide product selection and quick delivery times, but also by offering customs and duties payment management, marketing assistance, product training, new product exposure, technical support and local warranty service and by providing trade credit (when the customer is approved under our credit policies). We believe that the extension of payment terms to creditworthy customers is one of our key competitive advantages, as many of our local competitors do not have the financial resources to do so and as a result offer products only on a cash-and-carry basis.
For the six months ended June 30, 2007, no single customer accounted for more than 1.9% of our revenue on a consolidated basis and the top ten customers by volume of sales accounted for less than 10.2% of our consolidated revenue. For the year ended December 31, 2006, no single customer accounted for more than 2.0% of our revenue on a consolidated basis and the top ten customers by volume of sales accounted for less than 9.1% of our consolidated revenue. For the year ended December 31, 2005, no single customer accounted for more than 2.9% of our revenue on a consolidated basis and the top ten customers by volume of sales accounted for less than 11.2% of our consolidated revenue. Our strategy is not to rely on any single customer for a large percentage of sales, and to diversify sales in addition to maximizing sales from individual customers.
Sales
As of June 30, 2007, we had a sales force of 497 people in our in-country operations. Our Miami operations employed 36 people dedicated to serving third-party customers.
Each in-country sales force is managed by a general manager and, depending on the size of the operation, a sales manager. The general managers and the sales managers are responsible for customer relationships and development of new accounts. Our Chief Executive Officer and our Miami Commercial Director also spend a considerable amount of time visiting customers and our in-country operations to develop new customer accounts and solidify and improve existing relationships.
We use an incentive-based compensation structure for our sales force that varies from country to country. Generally, the compensation consists of a base salary and variable commission or bonus based on various sales and performance metrics. The commission is generally calculated as a percentage of collected gross profits and net customer additions.
Marketing
As of June 30, 2007, our marketing department consisted of five employees in Miami and 53 employees throughout Latin America and the Caribbean. The marketing department’s responsibilities include oversight of our corporate identity, preparation of marketing materials, creation and coordination of various types of media activity and development of marketing research studies and specialized reseller-focused events. In addition, the marketing department works with vendors to establish periodic marketing and sales programs to generate vendor brand awareness and product demand. In this regard, our marketing department acts as a liaison between our company and our vendors.
64
Table of Contents
The marketing department uses marketing and business development funds available from vendors of branded IT products for various activities, including the preparation of our annual product catalog and monthly pricing books, customer training, specialized events and trade shows. Our Miami operations administer a majority of the marketing funds and distribute them as needed to our in-country operations.
Some of our more notable marketing events are Connections (a semi-annual product and technology training event offered by vendors to the general managers and product managers of our in-country operations) and INTCOMEXPO (a private trade show in the countries in which we have in-country operations organized for the benefit of our customers, with 15 to 30 vendors present at each show).
Credit Risk Management
We extend payment terms, generally up to 30 days, to creditworthy customers of our Miami operations and of most of our in-country operations, although some higher-volume customers, such as large retailers, receive longer payment terms. In other in-country operations (most notably Mexico, where sales are primarily on a cash-and-carry basis), we establish our credit policies on a country-by-country basis depending mostly on local macroeconomic conditions, the nature of our customers and local market practices.
We have established standardized credit policies for our Miami and in-country operations. Our credit policies include credit analysis, credit database checks, vendor and bank relationship checks, and, where necessary, collateralization. In addition, substantially all of our Miami operations’ accounts receivable (other than accounts receivable owed by affiliates) are insured by Euler Hermes ACI up to an aggregate limit of $20.0 million. Under this insurance, 10% or 20% buyer coinsurance provisions apply, as well as sub-limits in coverage on a per-buyer and on a per-country basis.
We believe that our relatively low bad-debt expenses of 0.2%, 0.1%, 0.2% and 0.3% of net revenues for the six months ended June 30, 2007 and the years ended December 31, 2006, 2005 and 2004, respectively, are a result of our standardized credit policies, our close and proactive monitoring of accounts receivables and collections by our Miami and in-country operations and the diversification of our receivables over a large number of countries and customers. Most of our credit losses are with respect to customers of our Miami operations, where we serve larger customers who in some cases are afforded credit lines in excess of $100,000. In our in-country operations, where credit lines typically do not exceed $10,000, credit losses have been nominal.
Information Systems
In 2006, we completed integration of all of our local financial reporting systems into one common platform to generate our consolidated U.S. GAAP financial statements using consolidation and budgeting software developed by Business Objects Americas. This system will assist us in standardizing financial information across subsidiaries, more rapidly consolidating our results and increasing the availability of financial information on all of our in-country operations. In addition, we are in the process of installing Sentai, a new company-wide financial reporting system. Sentai is a scalable IT system that enables simultaneous decentralized decision-making by our employees included in sales and purchasing while permitting control of daily operating functions by our senior management. We are also using the Sentai logistics and inventory management system in order to better manage our increasing shipping volumes. The Sentai system has been implemented in eight of our 12 in-country locations and in our Miami location. We expect to complete implementation in the remaining locations by year-end 2008.
Competition
The IT products distribution industry in Latin America and the Caribbean is highly competitive. The factors on which we compete include:
| • | price; |
65
Table of Contents
| • | availability and quality of products and services; |
| • | terms and conditions of sale; |
| • | availability of credit and credit terms; |
| • | timeliness of delivery; |
| • | flexibility in tailoring specific solutions to customers’ needs; |
| • | effectiveness of marketing and sales programs; |
| • | availability of technical and product information; and |
| • | availability and effectiveness of warranty programs. |
The IT products distribution industry in Latin America and the Caribbean is very fragmented and contains several public multinational companies, such as Ingram Micro (in-country operations in Brazil, Chile, Mexico, Peru and Argentina), Tech Data (in-country operations in Brazil, Chile, Uruguay and Peru), Bell Microproducts (in-country operations in Argentina, Brazil, Chile and Mexico) and SYNNEX (in-country operations in Mexico), (we refer to these companies in this prospectus as our public company competitors), and a large number of local companies that operate in a single country, such as Grupo Deltron S.A. in Peru, Airoldi Computación in Argentina and Makro Computo in Colombia. We believe we have the broadest in-country presence in Latin America and the Caribbean in terms of the number of countries served through an in-country presence.
Our principal public company competitors are Ingram Micro and Tech Data, each of which operates local distribution centers in the limited number of markets listed above. In contrast, we are able to offer our vendors an in-country distribution channel to many Latin American and Caribbean markets. Additionally, while our product offering is more focused on components for white-box personal computers, Ingram Micro and Tech Data are focused on high-end branded equipment, including servers. While these competitors are larger and better capitalized than we are, and, in the case of the Mexican market, have a significantly larger market share than we do, we believe that our multi-country, components-focused business model is better suited to Latin America and the Caribbean.
Our relatively large size, on the other hand, provides us with certain advantages over smaller local distributors, who sometimes have a lower cost structure than we do, in part because we believe they may operate in the grey market or “informal” economy. We believe our advantages generally include more developed vendor relationships, broader product offerings, greater product availability and more extensive customer service (including credit and technical support).
Our participation at two levels of the distribution chain (Miami and in-country), coupled with our extensive geographic footprint, creates a market presence that we believe is unmatched by any of our competitors in terms of the number of countries served through an in-country presence and enables us to generate industry-leading margins among our public company competitors. Our dual distribution approach links a diversified set of vendors, primarily located in the United States and Asia, to a fragmented number of customers spread throughout Latin America and the Caribbean, and delivers value to both ends of the supply chain. To our vendors, we provide access to markets and customers that would be costly and inefficient for them to reach directly. To our customers, which are often small local resellers and retailers that lack the scale and access to buy directly from the United States and Asia, we provide broad and timely product availability, local staff, multi-vendor single source purchasing, technical support, customs management and local warranty service.
Trademarks and Domain Names
We have registered a number of trademarks and domain names for use in our business. We have registered trademarks such as “Intcomex,” “Blue Code,” “CENTEL,” “FORZA,” “Hurricane,” “KLIP,” “KLIP XTREME”
66
Table of Contents
and “NEXXT Solutions” in the United States and/or in various Latin American and Caribbean jurisdictions. We also have registered domain names, including intcomex.com, nexxtsolutions.com, intcomex.cl, intcomex.ec and intcomex.com.pe. We believe that our trademarks help us build name recognition in the region in which we operate.
Employees
As of June 30, 2007, we employed 1,547 people. Of these, 183 were in Miami, with the rest located in our in-country operations. We do not have any collective bargaining agreements with our employees, nor are they unionized, except for the employees of our in-country operations in Mexico. We believe that our relations with our employees are generally good.
In 2005, we entered into a contract with ADP Total Source, Inc. to provide certain professional employment services such as health insurance, other benefits and payroll services in respect of all Miami personnel. Pursuant to this contract, our Miami personnel, with certain exceptions, became employees of ADP. We lease the services of these employees from ADP, and reimburse ADP for the costs of compensation and benefits. For purposes of this prospectus, we consider employees of ADP covered by this contract to be employees of Intcomex.
Properties and Facilities
Our Miami headquarters is located in a 221,000 square foot facility, integrating executive-level management, warehousing, return-to-manufacturer authorization, purchasing, sales, marketing, credit, finance, technical support and customer service functions. Our Miami headquarters are located near the Port of Miami and Miami International Airport to facilitate access to the area’s air and container-cargo networks. The lease for this facility came into effect on December 19, 2006 and we moved into this facility on March 23, 2007.
In addition, we operate 24 sales and distribution centers in 12 countries in Latin America and the Caribbean and a sales office in Brazil. The distribution centers include office space for the in-country operations’ personnel as well as warehouse space. Some of these centers also include assembly lines for white-box personal computers that our value added reseller and retailer customers or we assemble locally. In total, our sales and distribution centers in Latin America and the Caribbean represent nearly 649,000 square feet of space (including 165,000 square feet of office and 484,000 square feet of warehouse space). We lease all of these centers except that we own a part of our sales and distribution center in Santiago, Chile and warehouse space in Lima, Peru. Further, we have an option to purchase a warehouse and office space in Mexico City, Mexico for $2.8 million, which expires on June 1, 2008.
67
Table of Contents
The table below sets forth the following information regarding our properties: their location, use, approximate size and whether we own or lease these properties:
Location | Use | Approximate gross square feet | Owned/leased | |||
Buenos Aires, Argentina | Office / Warehouse | 27,977 | Leased | |||
Rosario, Argentina | Office / Warehouse | 6,321 | Leased | |||
Santiago, Chile | Office / Warehouse | 69,688 | 69% owned, 31% leased | |||
Iquique, Chile | Office / Warehouse | 9,994 | Leased | |||
Bogota, Colombia | Office / Warehouse | 14,769 | Leased | |||
San Jose, Costa Rica | Office / Warehouse | 28,272 | Leased | |||
Quito, Ecuador | Office / Warehouse | 31,265 | Leased | |||
Guayaquil, Ecuador | Office / Warehouse | 9,481 | Leased | |||
San Salvador, El Salvador | Office / Warehouse | 11,244 | Leased | |||
Guatemala City, Guatemala | Office / Warehouse | 33,644 | Leased | |||
Kingston, Jamaica | Office / Warehouse | 16,968 | Leased | |||
Mexico City, Mexico | Office / Warehouse | 38,024 | Leased | |||
Puebla, Mexico | Office / Warehouse | 6,653 | Leased | |||
Veracruz, Mexico | Office / Warehouse | 3,027 | Leased | |||
Querétaro, Mexico | Office / Warehouse | 3,992 | Leased | |||
León, Mexico | Office / Warehouse | 4,790 | Leased | |||
Monterrey, Mexico | Office / Warehouse | 4,436 | Leased | |||
Villahermosa, Mexico | Office / Warehouse | 9,758 | Leased | |||
Tlalnepantla, Mexico | Warehouse | 107,385 | Leased | |||
Centro de Capacitacion, Mexico | Office / Warehouse | 6,653 | Leased | |||
Panama City, Panama | Office / Warehouse | 38,811 | Leased | |||
Chiriquí, Panama | Office / Warehouse | 6,465 | Leased | |||
Lima, Peru | Office / Warehouse | 17,509 | Owned | |||
Montevideo, Uruguay | Office / Warehouse | 23,009 | Leased | |||
Miami, United States | Office / Warehouse | 221,021 | Leased |
Legal Proceedings
We are, from time to time, the subject of legal proceedings arising in the ordinary course of business. We do not believe that any proceedings currently pending or threatened will have a material adverse effect on our business or results of operations.
For a description of the settlement agreements between our Uruguayan subsidiary and Uruguayan regulatory authorities whereby the risk connected with, and the commitment of potentially significant financial and managerial resources to, potential regulatory claims was avoided, see “Management’s Discussion and Analysis of Financial Condition and Results of Operations—Uruguay Tax Audit.”
68
Table of Contents
Executive Officers and Directors
The following table sets forth the name and age of each of our directors and executive officers:
Name | Age | Position | ||
Anthony Shalom | 57 | Chief Executive Officer, Director | ||
Michael Shalom | 36 | President, Director | ||
Enrique Bascur | 51 | Director | ||
Thomas A. Madden | 53 | Director | ||
Carol Miltner | 64 | Director | ||
Juan Pablo Pallordet | 33 | Director | ||
Andres Small | 27 | Director | ||
Russell Olson | 49 | Treasurer and Chief Financial Officer, Assistant Secretary |
Anthony Shalom has been Chief Executive Officer and a director of Intcomex, Inc. since 2004. Prior to the investment by CVC International in our company, Mr. Shalom was President of Intcomex Holdings, LLC (effectively our predecessor company), serving in that capacity since the founding of the company in 1988. Mr. Shalom is the father of Michael Shalom.
Michael Shalom has been President and a director of Intcomex, Inc. since 2004. Prior to the investment by CVC International in our company, Mr. Shalom was President of Intcomex Holdings, LLC, serving in that capacity from the founding of the company in 1988 through 1999 and from 2002 to 2004. Mr. Shalom served as CEO of IFX Corporation, a Latin American telecommunications service provider, from 1999 until 2004 and as Chairman of IFX Corporation from 1999 to present. Mr. Shalom is the son of Anthony Shalom.
Enrique Bascur has been a director of Intcomex, Inc. since 2005. Mr. Bascur is currently a Managing Director at CVC International, where he has worked since 1999, specializing in investments in Latin America. Prior to 1999, he was the Corporate Finance Head at Citigroup’s office in Santiago, Chile, where he also managed the local equity investment unit. Mr. Bascur serves on the boards of Sociedad Minera Sal de America S.A., a Chilean company with interests in the mining sector, Juegos Electrónicas S.A., a Chilean company in the entertainment business, Sundance Investment LLC, a company in the oil and gas business, Block 67 LLC, a subsidiary of Sundance Investment LLC engaged in the oil and gas business in Peru, Avantel S.A., a Colombian company in the telecommunications business and Citigroup International Finance Corporation, a wholly-owned subsidiary of Citigroup, Inc. Mr. Bascur holds a degree in Civil Engineering from Universidad Católica de Chile and an M.B.A. degree from the Wharton School of the University of Pennsylvania.
Thomas A. Madden has been a director of Intcomex, Inc. since December 2006. From 2001 until his retirement in 2005, Mr. Madden served as the executive vice president and chief financial officer of Ingram Micro. Prior to that, Mr. Madden was the senior vice president and chief financial officer of Arvinmeritor, Inc. from 1997 to 2001. Mr. Madden currently serves on the boards of Mindspeed Technologies, Inc., a company designing, developing and selling semiconductor networking solutions for communications applications, Champion Enterprises, Inc., a company building manufactured and modular homes, Freight Car America, Inc., manufacturer of railroad freight cars, and the City of Hope cancer institute. Mr. Madden holds a B.S. degree in Business Administration from Indiana University of Pennsylvania and an MBA degree from the University of Pittsburgh.
Carol Miltner has been a director of Intcomex, Inc. since December 2006. Ms. Miltner has been the chief executive officer of Positive Impact, Inc. from 2002 until present. From 2000 to 2002, she was the chief executive officer of the Global Technology Distribution Council. Ms. Miltner currently serves on the boards of SRS Laboratories, Inc., and Qlogic Corporation, a networking solutions company.
69
Table of Contents
Juan Pablo Pallordet has been a director of Intcomex, Inc. since 2004. Mr. Pallordet is currently a Vice President of CVC International, where he has worked since 1999, specializing in private equity investments and divestments related to oil and gas, food and beverage, technology and media assets. Mr. Pallordet is currently a board member of Sundance Investment, LLC, an oil and gas company in Peru, and Avantel, S.A., a wireless telecommunications company in Colombia. Mr. Pallordet holds an advanced degree in Industrial Engineering from Universidad de Buenos Aires.
Andres Small has been a director of Intcomex, Inc. since July 2007. Mr. Small is currently a private equity transactor at CVC International where he has worked since January 2005, focusing on emerging markets. Prior to joining CVC International, Mr. Small worked as an investment banking analyst at J.P. Morgan Chase’s Latin American Mergers & Acquisitions Advisory Group, completing several transactions in the consumer, construction, financial, paper & packaging and telecommunications industries. Mr. Small is currently a board member in Permolex International, L.P., a company producing bio-fuel products, and Sindicatum Carbon Capital Holdings Limited, a London-based company developing green house gas abatement projects. Mr. Small holds a B.A. degree in Economics and International Relations with honors from Stanford University.
Russell Olson has been Treasurer and Chief Financial Officer of Intcomex, Inc. since March 2005. Mr. Olson also serves as Assistant Secretary. Prior to joining our company, Mr. Olson served as Chief Financial Officer of ATX Technologies, Inc. in Irving, Texas in 2004. From 1985 to 2004, Mr. Olson served in a variety of capacities for Verizon Communications Inc., including business analysis, strategic planning and budgets, treasury, internal audit and financial planning. From 2002 to 2004, he served as Executive Vice President of Finance and Chief Financial Officer for Grupo Iusacell, S.A. de C.V., a Mexican wireless subsidiary of Verizon. Mr. Olson holds a Master’s Degree in Finance from Fairfield University and a B.S. in Business Administration from the University of Arizona.
Our Board of Directors
Board Size and Composition
The following describes our board of directors and board committees as they are expected to be in place at the time of consummation of this offering.
Our board of directors currently consists of seven members. Our amended and restated certificate of incorporation and by-laws provide that the size of our board of directors will be determined by a resolution of a majority of the board of directors. Directors are elected for one-year terms or until their successors are duly elected and qualified. Executive officers serve at the discretion of the board of directors.
As required under the listing standards of the Nasdaq Global Market, where we intend to apply to list our common stock, a majority of the members of our board of directors must qualify as “independent,” as affirmatively determined by the board of directors. We currently comply with the independence requirements of the SEC and the Nasdaq Global Market. Our board of directors ensures that its determinations regarding the definition of “independent” are consistent with the listing standards of the Nasdaq Global Market, the SEC rules and relevant securities and other laws and regulations. Consistent with these considerations, and after reviewing all relevant transactions or relationships between each director or any of his family members, and us, our senior management and our independent auditors, our board of directors has affirmatively determined that five of our directors, Ms. Miltner and Messrs. Bascur, Pallordet, Small and Madden, are independent directors within the meaning of the applicable rules, laws and the listing standards of the Nasdaq Global Market. Messrs. Anthony Shalom and Michael Shalom are not “independent” directors under the applicable independence standards.
We currently are parties to a shareholders agreement pursuant to which, prior to an initial public offering and so long as Anthony Shalom and Michael Shalom control securities in the aggregate representing not less than 25% of our voting power, five of our directors are to be nominated by CVC International, two of our directors are
70
Table of Contents
to be nominated by Anthony Shalom and Michael Shalom and two of our directors are to be independent. CVC International is entitled to remove the independent directors at any time and replace them with other individuals who would be independent directors pursuant to the terms of the shareholders agreement. Following this offering, Anthony Shalom and Michael Shalom will beneficially own approximately % and %, respectively, of our common stock on a fully diluted basis (approximately % and %, respectively, if the underwriters’ overallotment option is exercised in full).
Committees of the Board
Our standing board committees consist of an audit committee, a nominating and corporate governance committee and a compensation committee.
Audit Committee. Our audit committee consists of Mr. Madden (Chairperson), Ms. Miltner, and . Mr. Madden, Ms. Miltner and satisfy the audit committee members independence requirements of the Nasdaq Global Market, the Securities Exchange Act of 1934, as amended, and the rules and regulations of the SEC. Our board of directors has determined that Mr. Madden qualifies as an “audit committee financial expert” under the SEC rules and regulations.
The audit committee assists the board in monitoring the integrity of our financial statements, our independent auditors’ qualifications and independence, the performance of our internal audit function and independent auditors, and our compliance with legal and regulatory requirements. The audit committee has direct responsibility for the appointment, compensation, retention (including termination) and oversight of our independent auditors, and our independent auditors report directly to the audit committee.
Nominating and Corporate Governance Committee. Our nominating and corporate governance committee consists of (Chairperson), and . , and satisfy the independence requirements of the Nasdaq Global Market. The nominating and corporate governance committee will identify qualified individuals to become members of the board of directors, determine the composition of the board of directors and its committees and develop and recommend to the board of directors sound corporate governance policies and procedures.
Compensation Committee. Our compensation committee consists of Ms. Miltner (Chairperson) and Messrs. Madden and Pallordet. Ms. Miltner and Messrs. Madden and Pallordet satisfy the independence requirements of the Nasdaq Global Market and qualify as the outside directors within the meaning of Section 162(m) of the Internal Revenue Code of 1986, as amended, and non-employee directors within the meaning of Rule 16b-3 of the rules promulgated under the Securities Exchange Act of 1934, as amended.
The primary duty of the compensation committee is to discharge the responsibilities of the board of directors relating to compensation practices for our executive officers and other key employees, as the committee may determine, to ensure that management’s interests are aligned with the interests of our equity holders. The compensation committee also reviews and makes recommendations to the board of directors with respect to our employee benefits plans, compensation and equity-based plans and compensation of directors. The compensation committee makes recommendations to the board of directors with respect to the compensation and benefits of the chief executive officer and approves the compensation and benefits of the other executive officers. The compensation committee uses the same performance appraisal form used for our other employees to evaluate the performance of executive officers on an annual basis.
Compensation Committee Interlocks and Insider Participation
None of our executive officers serve as a member of the board of directors or compensation committee of any entity that has one or more of its executive officers serving as member of our board of directors or compensation committee.
Director Compensation
We established in 2007 and maintain a basic board membership compensation plan comprised a quarterly cash retainer of $12,000 for board membership and a quarterly cash retainer of $3,000 per committee chair, as
71
Table of Contents
well as the opportunity to purchase stock options under the 2007 Founders’ Grant Stock Option Plan, or the Plan. Board representatives from CVC International, Anthony Shalom and Michael Shalom do not receive director compensation. In addition, travel expenses related to board and committee meetings are reimbursed by us. We did not compensate our directors for their services prior to 2007.
Executive Officer Compensation
Compensation Discussion and Analysis
We maintain a compensation program comprised primarily of fixed and performance-variable elements. The design and operation of the program reflects the following objectives:
| • | recruiting and retaining talented leadership; |
| • | implementing measurable performance targets; and |
| • | our pay for performance philosophy. |
Designing a Competitive Compensation Package. The recruitment and retention of leadership to manage our company requires a competitive compensation package. Our approach includes: (1) fixed compensation elements of base salary and benefits; and (2) some elements of variable compensation contingent upon our company’s performance. We have not engaged compensation consultants to advise us as to where our executive compensation package ranks relative to our peer industry group. Rather, we rely on our knowledge of relevant labor market conditions and negotiations to establish appropriate pay levels.
During 2006, our Chief Executive Officer recommended to the other members of our board of directors (consisting at the time of Messrs. Michael Shalom, Bascur, Pallordet and Ms. Everett) compensation levels for each of our executive officers, including himself, and our board of directors considered and approved the compensation levels after discussion among themselves. Compensation decisions were made by the board of directors because we were not required to have, and did not then have, a separate compensation committee. The Chief Executive Officer was present during and participated in most of those conversations.
Our compensation practices were very simple during 2006, as we determined was appropriate in light of our management and board structure, our historic development and our status as a privately owned company. The reasons for the discretion and judgment exercised by the board of directors in setting compensation levels are not conducive to precise retrospective reduction to numerical formulae or explanation, but involved a non-formulaic process of balancing various factors and coming to a decision about their relative importance and how best to reflect that in a result that was most beneficial to our company. The factors that went into that subjective analysis are those set forth in this Compensation Discussion and Analysis, including primarily the objectives of recruiting and retaining talented leadership, achieving measurable performance targets with respect to EBITDA, gross revenues and working capital management, pay for performance, job scope, tenure and other subjective evaluations of job performance. At the time our 2006 performance objectives were established by our board of directors, the performance targets represented a 15%, 16% and 21% improvement over our 2005 results for gross revenue, EBITDA and working capital management, respectively. Accordingly, our board of directors established what it believed to be aggressive but achievable performance objectives for management.
It is not possible to describe the relative weights given to each of the factors described above that were considered by our board of directors, since that information was not required to be, and was therefore not in fact, crystallized in the minds of members of the boards of directors. Decisions concerning each element of compensation did effect decisions concerning each other element of compensation. For example, we decided not to permit Messrs. Anthony and Michael Shalom to participate in our annual bonus program because of their significant equity interests in the company. That decision caused us to provide Messrs. Anthony and Michael Shalom with larger base salaries than we would have had they been eligible for annual bonuses. We believed this adjustment was necessary in order to provide them with a total compensation package that would appropriately compensate and incentivize them over both the short and long term.
72
Table of Contents
We believe that all compensation paid to our named executive officers for 2006 is accounted for as expense in the period to which it relates in accordance with GAAP and is deductible for U.S. federal income tax purposes. In no case during 2006 was any proposed form of compensation materially revised to take into account the impact of tax or accounting treatment. The impact of the deductibility limits of Section 162(m) of the Internal Revenue Code did not materially impact our compensation decisions for 2006, because those provisions of the Internal Revenue Code did not apply to us in 2006, and our compensation levels for 2006 did not approach the $1 million per named executive officer level at which compensation deductions may be denied under those provisions.
In contemplation of this offering, in 2007, we formed a compensation committee consisting of Ms. Miltner (Chairperson) and Messrs. Madden and Pallordet. Ms. Miltner and Messrs. Madden and Pallordet satisfy the independence requirements of the Nasdaq Global Market and qualify as the outside directors within the meaning of Section 162(m) of the Internal Revenue Code of 1986, as amended, and non-employee directors within the meaning of Rule 16b-3 of the rules promulgated under the Securities Exchange Act of 1934, as amended. Since its inception, the compensation committee has met six times with our Chief Executive Officer present and three times without him present. In 2007, the compensation committee has conducted an executive compensation study to determine appropriate compensation levels and established and approved quantitative metrics and qualitative factors related to payout of bonuses to executive officers.
Fixed Compensation. The principal elements of our fixed compensation not directly linked to performance targets include base salary, benefits (e.g., health, life and disability insurance) and 401(k) contributions. Individual variations in base salary are based on job scope, tenure, retention risk and other factors relevant to us.
Insurance benefits for executives employ the same formulae as are applicable to all our employees. We contribute 3.0% of total salary up to IRS contribution limits to a 401(k) savings plan covering substantially all U.S. based employees regardless whether the employee makes any contributions to the savings plan.
We do not provide any executives or employees with perquisites or a perquisite allowance.
Variable Compensation. Our incentive compensation program is linked to performance metrics related to the executive’s job scope. These metrics are tied to our growth, profitability and performance objectives as determined by our board of directors during the annual budgeting process. More specifically, the bonus paid to Mr. Olson was based on the subjective assessment of the board of directors, based in part on input from and arrived at with the participation of our Chief Executive Officer, of the extent to which Mr. Olson’s individual performance contributed to the timely and quality preparation of the Company’s financial statements and our meeting certain levels of EBITDA, gross revenues, and working capital management targets and project specific performance (such as, preparing us for an initial public offering) that contributed to our growth, profitability and overall success. Incentive compensation awards are in the form of annual cash bonuses. Messrs. Anthony and Michael Shalom did not participate in our annual cash bonus program because the board of directors believed that their base salary and stock ownership in our company provided them with sufficient financial incentive to focus on maximizing the value of our stock. For a discussion of our incentive compensation plans, see “—Annual Bonus; Long-Term Incentive Awards.”
Named Executive Officer Compensation
The following summarizes the principal elements of compensation affecting the named executive officers, or NEOs, in 2006.
Base Salary. Messrs. Anthony Shalom and Michael Shalom’s compensation includes only a base salary component due to their equity ownership interest in our company. Mr. Olson’s compensation includes a base salary component that is appropriate for his scope of responsibilities as our Treasurer and Chief Financial Officer. Actual base salary compensation details for each NEO are shown in the Summary Compensation Table below.
Annual Bonus. Actual bonus awards for each of the NEOs are shown in the Summary Compensation Table below. Mr. Olson’s bonus was paid in accordance with his employment agreement and was based upon the performance targets set forth in that agreement. For a discussion of Mr. Olson’s employment agreement, see “—Employment Agreements; Potential Payments Upon Termination or Change of Control.”
73
Table of Contents
Long-Term Incentive Awards. We did not offer any long-term incentive awards in 2006 except to Mr. Olson. For a discussion of Mr. Olson’s long-term incentive awards, see “—Employment Agreements; Potential Payments Upon Termination or Change of Control.”
On April 23, 2007, our stockholders unanimously approved the establishment of the 2007 Founders’ Grant Stock Option Plan, which was also approved by our board of directors on February 27, 2007. The Plan provides that the Plan shall be administered by the board of directors or any of its committees, and different committees may administer for executives and directors. The Plan provides for the grant of nonqualified and incentive stock options to management employees and directors, as designated by the plan administrator.
Under the Plan, stock options will be granted at fair market value on the date of grant and have a 10-year exercise period and a vesting period as determined by the plan administrator pursuant to the stock option award agreement. Upon a termination of service with us, a plan participant’s options to the extent vested remain exercisable for a period ending on the earlier of three months from termination of service (or 12 months from termination of service, in the case of death or disability) or as specified in the stock option award agreement. Any portion of the option that is unvested as of termination of service will be forfeited. The Plan provides for acceleration of vesting on a change of control. “Change of control” means the occurrence of any of the following events: (i) any “person” (as such term is used in Sections 13(d) and 14(d) of the Exchange Act) becomes the “beneficial owner” (as defined in Rule 13d-3 of the Exchange Act), directly or indirectly, of securities of the company representing more than 50.0% of the total voting power represented by the company’s then outstanding voting securities; (ii) the consummation of the sale or disposition by the company of all or substantially all of the company’s assets; or (iii) the consummation of a merger or consolidation of the company with any other corporation, other than a merger or consolidation which would result in the voting securities of the company outstanding immediately prior thereto continuing to represent (either by remaining outstanding or by being converted into voting securities of the surviving entity or its parent) at least 50.0% of the total voting power represented by the voting securities of the company or such surviving entity or its parent outstanding immediately after such merger or consolidation.
The board of directors may at any time amend, alter, suspend or terminate the Plan, except as such amendment, suspension or termination of the Plan would impair the rights of any participant under the Plan, unless otherwise agreed to by the plan participant.
A maximum of 1,700 shares of common stock may be issued under the Plan, and subject to certain capital adjustment provisions, a maximum of 250 shares subject to options may be granted to management employees and directors in a single calendar year. Upon exercise of the outstanding stock options granted under the Plan as of the date of this filing, 1,540 shares of common stock are issuable with a weighted average exercise price of $1,077 per share.
In addition to the shares available under the Plan, we intend to grant to Ms. Miltner and Mr. Madden 32 restricted shares of common stock each, with a vesting period of one year for each third of such shares at the initial public offering price.
2006 Summary Compensation Table
Name and Principal Position | Year | Salary | Bonus | Stock Awards | Option Awards | Non-Equity Incentive Plan Compensation | Change in Pension Value and Nonqualified Deferred Compensation Earnings | All Other Compensation (2) | Total | ||||||||||||||||||
Anthony Shalom, CEO | 2006 | $ | 350,000 | $ | — | $ | — | $ | — | $ | — | $ | — | $ | 6,600 | (1) | $ | 356,600 | |||||||||
Michael Shalom, President | 2006 | $ | 300,000 | $ | — | $ | — | $ | — | $ | — | $ | — | $ | 6,600 | (1) | $ | 306,600 | |||||||||
Russell Olson, Treasurer and Chief Financial Officer, Assistant Secretary | 2006 | $ | 245,000 | $ | 107,187 | $ | — | $ | — | $ | — | $ | — | $ | 6,600 | (1) | $ | 358,787 | |||||||||
| (1) | Includes $6,600 of 401(k) contributions. |
| (2) | The amounts are net of the following amounts of excess contributions that were deducted from the 401(k) Plan: Anthony Shalom of $3,231, Michael Shalom of $2,400 and Mr. Olson of $2,261. These amounts were duplicate contributions inadvertently made and reversed by deducting the duplicative amounts from the individual accounts and refunding to the Company. |
74
Table of Contents
Employment Agreements; Potential Payments Upon Termination or Change of Control
The following describes certain of our obligations on various termination situations for Russell Olson. We have no other obligation with respect to any termination or change in control payments to any of the NEOs.
We have an employment agreement with Mr. Olson, our Chief Financial Officer and Treasurer, which expires on December 31, 2007 unless terminated earlier. As set forth in Mr. Olson’s employment agreement. Mr. Olson’s annual base salary is $245,000, plus (i) a guaranteed annual bonus of $122,500 prorated for 2005 from the commencement of his employment to December 31, 2005, (ii) an annual performance bonus of up to $122,500 for the term of the agreement based on the achievement of specified performance targets, including achieving certain levels of EBITDA, gross revenues, working capital management and project specific performance and (iii) a long-term incentive bonus of 75% of Mr. Olson’s base salary for each of the years commencing January 1, 2006 and January 1, 2007 based on the achievement of targeted financial performance goals and objectives, including EBITDA and working capital targets. Mr. Olson is eligible to receive employee benefits comparable to the benefits provided to our other employees and reimbursement of certain relocation and temporary housing costs and reasonable business-related expenses.
In the event of termination of Mr. Olson’s employment by us without cause, we will be obligated to pay to Mr. Olson all bonuses on a prorated basis to the date of termination plus an amount equal to four months of his base salary if the termination occurs during the period between March 14, 2006 and December 31, 2007. If a sale of more than 50.1% of the voting stock of our company results in a material adverse change in Mr. Olson’s duties and responsibilities not acceptable to him, we will be obligated to pay Mr. Olson a severance payment in an amount equal to six months of his base salary and to reimburse him for certain relocation costs. If we terminate Mr. Olson’s employment for due cause or if he resigns prior to the end of the term, he will not be entitled to any compensation other than his base salary through the date of his termination or resignation. For purposes of the employment agreement, “due cause” means Mr. Olson’s willful misconduct in the discharge of his duties and responsibilities to us; his failure to carry out and execute any material directions from the President and/or board of directors; any act of him against us intended to enrich him, or any other party, in derogation of his duties to us; any willful or purposeful act or omission (or any act or omission taken in bad faith) having the effect of injuring our business or business relationships; his commission of a crime of moral turpitude, fraud or misrepresentation; or his breach of the his employment agreement. Following the termination of his employment, Mr. Olson will be subject to non-solicitation and other non-competition restrictions for a period of two years if Mr. Olson resigns or we terminate his employment for cause (as such term is defined in the employment agreement), or for a period of one year if we terminate Mr. Olson’s employment without cause or the employment agreement is not renewed after its expiration.
401(k) Plan
Our employees participate in a 401(k) plan to provide them with retirement benefits and with a means to save for their retirement. The 401(k) plan is intended to be a tax-qualified plan under Section 401(a) of the Internal Revenue Code of 1986, as amended.
75
Table of Contents
CERTAIN RELATIONSHIPS AND RELATED PARTY TRANSACTIONS
Shareholders Agreement
Prior to the consummation of this offering, all of our stockholders were party to a shareholders agreement, relating to, among other things, nomination of directors, required consents for certain transactions, restrictions on share transfers, rights to acquire shares of other stockholders and rights of Centel pre-acquisition stockholders. Pursuant to the shareholders agreement, five of our directors were nominated by CVC International, two directors were nominated by Anthony Shalom and Michael Shalom and two were independent directors. CVC International is entitled to remove the independent directors at any time and replace them with other individuals who would be independent directors pursuant to the terms of the shareholders agreement. The shareholders agreement terminates in connection with this offering.
CVC International Indemnity
Pursuant to the terms of the stock purchase agreement, dated as of August 27, 2004, under which CVC International acquired its controlling interest in our company, we, Anthony Shalom, Michael Shalom and certain other sellers have agreed to indemnify CVC International for losses sustained or incurred by CVC International arising out of or relating to breaches of representations or warranties and covenants, such as those related to tax matters.
In connection with the settlement by our Uruguayan subsidiary, T.G.M., S.A., with the Uruguayan tax agency, DGI, and the Uruguayan customs authorities in June 2007, Anthony Shalom and Michael Shalom indemnified CVC International for the outflow of funds in connection with that portion of the settlement payments corresponding to the tax audit period from 2002 until August 31, 2004 (the closing date under the stock purchase agreement) and in connection with certain related legal, accounting and other expenses pursuant to an indemnity agreement as of June 29, 2007. The indemnity agreement provided for the payment by Anthony Shalom and Michael Shalom of approximately $3.0 million to us by August 14, 2007. To secure the payment obligation, the indemnity agreement required Anthony and Michael Shalom to arrange for a pledge of 11 3/4% Notes in the same principal amount as the indemnity payment by the Pledging Noteholders. This pledge was executed as of June 29, 2007. Payment under the indemnity agreement was made prior to August 14, 2007. See “Management’s Discussion and Analysis of Financial Condition and Results of Operations—Uruguayan Tax Audit.”
Repurchases of Notes
As a result of a privately negotiated arms’ length transaction arranged by Anthony Shalom and Michael Shalom, on August 15, 2007, we repurchased $2.2 million of 11 3/4% Notes held by the Pledging Noteholders, at the same market price as $2.8 million of 11 3/4% Notes we purchased in the open market on the same day. We delivered to the trustee under the indenture governing the 11 3/4% Notes all $5.0 million aggregate principal amount of the 11 3/4% Notes purchased on August 15, 2007 for cancellation in satisfaction of our mandatory sinking fund redemption that we were required to make by August 15, 2007 under the indenture.
Transactions with IFX Corporation
Michael Shalom, our President, is the Chairman of IFX Corporation. IFX is privately held by Michael Shalom and a family member. IFX provides Internet access services for our offices in Miami and our subsidiaries in Guatemala, Colombia, Panama and Chile. The total amounts paid for these services in 2006, 2005 and 2004 were $353,000, $232,000 and $73,000, respectively, and from January 1, 2007 through June 30, 2007, $255,000 was paid. In addition, we sell IT products to IFX. We sold $67,000, $118,000 and $409,000 worth of IT products to IFX in 2006, 2005 and 2004, respectively, and from January 1, 2007 through June 30, 2007, we sold $104,000 worth of IT products. The trade receivables of IFX Corporation are guaranteed by Techno-Mundial, S.A., a former stockholder of our company. The outstanding receivable balance from IFX as of December 31, 2006 and 2005 was $1,158,000 and $1,403,000, respectively. We believe that all transactions with IFX have been made on terms that are not less favorable to us than those available in a comparable arm’s length transaction and in the ordinary course of business.
76
Table of Contents
Mexican Facility
Harry Luchtan, General Director, Centel, is a co-owner of warehouse and office space located in Mexico City, Mexico, which we lease for approximately $23,800 per month. The lease expires on January 1, 2015 and we have an option to purchase the facility for $2.8 million through June 1, 2008. We believe that the terms of the lease and option to purchase the facility are not less favorable to us than those available in a comparable arm’s length transaction and in the ordinary course of business.
77
Table of Contents
PRINCIPAL AND SELLING STOCKHOLDERS
The following table sets forth certain information regarding beneficial ownership of our common shares (i) as of June 30, 2007 and (ii) as adjusted to reflect the sale of the common shares offered in this offering and:
| • | assumes that the underwriters do not exercise their option to purchase up to additional shares of common stock from us and the selling stockholder; |
| • | assumes the exchange by the holders of the 2,182 shares of Class B non-voting common stock for 2,182 shares of our voting common stock; and |
| • | reflects a for one split of our common stock in the form of a stock dividend to our existing stockholders prior to or simultaneously with the completion of this offering. |
| • | excludes 1,540 shares of common stock issuable upon exercise of outstanding stock options granted prior to this offering to certain of our officers and directors with a weighted average exercise price of $1,077 per share, none of which were vested as of June 30, 2007; and |
| • | excludes restricted stock grants of 64 shares of common stock with a vesting period of one year for each third of such shares that we intend to grant to two independent directors at the initial public offering price. |
The table sets forth stockholder information with respect to:
| • | all persons known by us to be the beneficial owners of more than 5% of our common stock; |
| • | all named executive officers; |
| • | all directors; |
| • | all directors and executive officers as a group; and |
| • | the selling stockholder. |
We have based our calculation of the percentage of the beneficial ownership on common shares outstanding on June 30, 2007 and common shares outstanding upon the closing of this offering.
CVC International, our controlling stockholder and an affiliate of Citigroup Global Markets Inc., one of the underwriters, is selling common shares in this offering. In addition, CVC International has granted to the underwriters an option, exercisable not later than 30 days after the date of this prospectus, to purchase up to a total amount of common shares at the public offering price less the underwriting discount.
Unless otherwise indicated, each person named or included in the following table has sole voting and investment power with respect to the common shares set forth opposite the stockholder’s name and no person has pledged as security any of our shares. Shares not outstanding but deemed beneficially owned by virtue of the individual’s right to acquire them as of June 30, 2007, or within 60 days of the date hereof, are treated as outstanding when determining the percent of the class owned by such individual and when determining the percent owned by the group. The number and percentages in the “Shares Beneficially Owned After this Offering” column assume that the underwriters do not exercise their over-allotment option to purchase up to additional shares from us and the selling stockholder. We have determined beneficial ownership in accordance with the rules of the SEC. Unless otherwise indicted in the table below, the address of each beneficial owner listed in the table below is c/o Intcomex, Inc., 3505 NW 107th Avenue, Miami, Florida 33178.
78
Table of Contents
Beneficial Owner | Shares Beneficially Owned Before This Offering | Percentage of Total Shares Owned Before This Offering | Number of Shares Offered in This Offering | Shares Beneficially Owned After This Offering | Percentage of Total Shares Owned After This Offering | ||||||
Co-Investment LLC VII (Intcomex)(1)(2) 399 Park Avenue, 14th Floor New York, NY 10022 | 52,545 | 52.5 | % | ||||||||
Anthony Shalom(3)(4) | 23,036 | 23.0 | % | ||||||||
Michael Shalom(3)(5) | 8,952 | 9.0 | % | ||||||||
Enrique Bascur(1)(2) | — | — | |||||||||
Thomas A. Madden(6)(7) | — | — | |||||||||
Carol Miltner(6)(7) | — | — | |||||||||
Juan Pablo Pallordet(1) | — | — | |||||||||
Andres Small(1) | — | — | |||||||||
Russell Olson(7) | — | — | |||||||||
All directors and executive officers as a group (8 persons) | 31,988 | 32.0 | % |
| (1) | Co-Investment LLC VII (Intcomex) is controlled by Citigroup Inc, a publicly-traded company that has securities listed on the New York Stock Exchange. Each of Messrs. Bascur, Pallordet and Small was nominated as a director of our company by CVC International pursuant to the terms of the shareholders agreement in effect prior to the consummation of this offering. |
| (2) | Mr. Bascur is a member of the CVC International divestment committee that must approve any sale of Co-Investment LLC VII (Intcomex)’s shares in our company. |
| (3) | Each of Messrs. Anthony Shalom and Michael Shalom were nominated as a director of our company by themselves pursuant to the terms of the shareholders agreement in effect prior to the consummation of this offering. |
| (4) | Held by Shalom Holdings 1 LLLP. Mr. Michael Shalom has sole voting control and investment discretion over the shares held by Shalom Holdings 1 LLLP. |
| (5) | Held by Shalom Holdings 3 LLLP. Mr. Michael Shalom has sole voting control and investment discretion over the shares held by Shalom Holdings 3 LLLP. |
| (6) | We intend to grant to Thomas A. Madden and Carol Miltner 32 restricted shares of common stock each, with a vesting period of one year for each third of such shares at the initial public offering price. |
| (7) | Pursuant to our Founders Stock Option Grant Agreement, we awarded options to purchase shares of our common stock to the following directors and executive officers, among others, in the following amounts: |
Individual | Shares | |||||||||||
Carol Miltner | 160 | |||||||||||
Thomas Madden | 160 | |||||||||||
Russell Olson | 200 |
79
Table of Contents
General
We were incorporated in Delaware in 2004. The following description summarizes the material terms of our capital stock as it is expected to be in effect following the consummation of this offering and the amendment of our organization documents in connection with this offering, forms of which will be filed as exhibits to the registration statement of which this prospectus is a part. We encourage investors to read the underlying documents for the complete terms of our organization documents. Prior to the consummation of this offering, our common stock was divided into two classes consisting of 140,000 shares of voting common stock and 10,000 shares of Class B non-voting common stock. Prior to the offering, Centel’s pre-acquisition shareholders held 2,182 shares of our Class B non-voting common stock and there were 17 beneficial holders of our common stock, including Class B non-voting common stock.
Common Stock
General
Prior to this offering, our authorized capital stock consisted of 150,000 shares of common stock, with a par value of $0.01 per share. Assuming the underwriters do not exercise their over-allotment option, we will have shares of common stock outstanding after the consummation of this offering.
Voting Rights
Holders of common stock are entitled to one vote for each share held on all matters submitted to a vote of stockholders, except for the election of directors. In the case of elections of directors, a holder of common stock will be entitled to as many votes as will equal the number of votes which such holder would be entitled to cast for the election of directors with respect to such holder’s shares of stock multiplied by the number of directors to be elected, and each holder may cast all of such votes for a single nominee for director or may distribute them among the number to be voted for, or for any two or more of them as he may see fit.
Rights to Dividends and Liquidation, Dissolution and Winding Up
Holders of common stock are entitled to receive proportionately any dividends as may be declared by our board of directors. Upon our liquidation, dissolution or winding up, the holders of common stock are entitled to receive proportionately our net assets available after the payment of all debts and other liabilities. Holders of common stock have no preemptive, subscription, redemption or conversion rights. Our outstanding shares of common stock are, and the shares offered by us in this offering will be, when issued and paid for, validly issued, fully paid and nonassessable. The rights, preferences and privileges of holders of common stock are subject to, and may be negatively affected by, the rights of the holders of shares of any series of preferred stock that we may designate and issue in the future.
Provisions in Our Certificate of Incorporation and Bylaws
All references to our certificate of incorporation and by-laws are to the certificate of incorporation and by-laws as they are expected to be in effect following the consummation of this offering.
Certificate of Incorporation
Our amended and restated certificate of incorporation provides that:
| • | our board of directors or a duly authorized committee thereof may resolve to increase or decrease from time to time the number of shares designated as voting common stock; |
| • | the numbers of our directors is fixed by, or in the manner provided in, our by-laws; |
| • | our board of directors has powers without the assent or vote of the stockholders to make, alter, amend, change, add to or repeal our by-laws (subject to any rights of the stockholders set forth in Section 109 of |
80
Table of Contents
the General Corporation Law of the State of Delaware); to fix and vary the amount to be reserved for any proper purpose; to authorize and cause to be executed mortgages and liens upon all or any part of the property of our company; to determine the use and disposition of any surplus or net profits; and to fix the times for the declaration and payment of dividends; |
| • | our directors in their discretion may submit any act for approval or ratification at any stockholders’ meeting and, in case of a majority vote in favor of such act, it will be as valid and binding upon our company and all our stockholders as though it had been approved or ratified by every stockholder, whether or not the act would otherwise have been open to legal attack because of directors’ interest or for any other reason; and |
| • | our directors are empowered to exercise all such powers and do all such acts as may be exercised or done by our company (subject to the provisions of the statues of Delaware, of the restated certificate of incorporation and to our by-laws). |
Bylaws
Our bylaws provide that, while annual stockholders meetings are to be held each May, or such other time as specified by the board of directors, special meetings of the stockholders may be held when directed by the board of directors, or when requested in writing by the holders of no less than 10% of all the shares of our voting common stock. A meeting requested by stockholders will be called for a date not less than 10 and no more than 60 days after the request is made, unless the stockholders requesting the meeting designate a later date. Written notice stating the place, day and hour of the meeting and the general nature of the business to be considered, will be delivered no less than 10 nor more than 60 days before the meeting. No business other than that stated in the notice will be transacted at any such meeting without the unanimous consent of all the stockholders entitled to vote thereat.
Generally, the presence of stockholders, in person or by proxy, holding a majority of our common stock entitled to vote will constitute a quorum at all meetings of the stockholders. Any action to be taken at any annual or special meeting of stockholders may be taken without a meeting, without prior notice and without a vote, if a consent in writing, setting forth the action so taken, will be signed by the holders of outstanding shares having not less than the minimum number of votes that would be necessary to authorize or take such action at a meeting at which all shares entitled to vote thereon were present and voted, as is provided by law. Prompt notice of the taking of the corporate action without a meeting by less than the unanimous written consent will be given to those stockholders who have not consented in writing.
Unless otherwise restricted by statute or our certificate of incorporation, any director or our entire board of directors may be removed, with or without cause, by the holders of a majority of the shares then entitled to vote at an election of directors; provided, however, that, so long as our shareholders are entitled to cumulative voting, if less than the entire board is to be removed, no director may be removed without cause if the votes cast against his or her removal would be sufficient to elect him or her if then cumulatively voted at an election of our entire board of directors. In order that our company may determine the stockholders entitled to notice or to vote at any meeting of stockholders, or to express consent to corporate action in writing without a meeting, or entitled to receive payment of any dividend or other distribution or allotment of any rights, or entitled to exercise any rights in respect of any change, conversion or exchange of stock or for the purpose of any other lawful action, the board of directors may fix, in advance, a record date, which will not be more than 60 nor less than 10 days before the date of such meeting, nor more than 60 days prior to any other action.
Limitation of Liability and Indemnification of Officers and Directors
Our certificate of incorporation limits the liability of our officers and directors as well as former officers and directors to the maximum extent permitted by Delaware law.
81
Table of Contents
According to the General Corporation Law of the State of Delaware, or DGCL, corporations can eliminate a director’s personal liability for monetary damages for breach of fiduciary duty as a director, except liability for:
| • | any breach of the director’s duty of loyalty to the corporation or its stockholders; |
| • | acts of omissions not in good faith or which involve intentional misconduct or a knowing violation of law; |
| • | unlawful payments of dividends or unlawful stock repurchases or redemptions; or |
| • | any transaction from which the director derived an improper personal benefit. |
Pursuant to the DGCL §145, a corporation can indemnify its directors, officers, employees and agents against expenses (including attorney’s fees), judgments, fines, and amounts paid in settlement actually and reasonably incurred by them in actions, suits or proceedings threatened, pending or completed against them because of them serving or having served the corporation in their respective capacity, provided that they acted in good faith and the reasonable belief of not opposing the best interests of the company. Further, with respect to criminal actions or proceedings, they must have had no reasonable cause to believe their conduct was unlawful.
The DGCL also provides that a corporation can indemnify its directors, officers, employees and agents against expenses actually and reasonably incurred in defending against actions or suits by or in the right of the corporation to procure a judgment in its favor by the reason of the fact that they are or were serving the company in their respective capacity, if they acted in good faith and the reasonable belief of not opposing the best interests of the company, except that they will generally not be indemnified in cases where they have been adjudged to be liable to the company.
Transfer Agent and Registrar
The transfer agent and registrar for our common stock is .
Nasdaq Global Market Listing
We intend to apply to have our common stock listed on the Nasdaq Global Market under the symbol “ICMX.”
82
Table of Contents
DESCRIPTION OF CERTAIN INDEBTEDNESS
The following is a summary of the material terms contained in the agreements governing our material outstanding indebtedness. We encourage investors to read the underlying documents which are filed as exhibits to the registration statement of which this prospectus is a part for the complete terms of such governing agreements.
11 3/4% Notes
On August 25, 2005 we completed the offering of $120 million of the 11 3/4% Second Priority Senior Secured Notes due 2011, or the 11 3/4% Notes. On December 14, 2006 we completed the exchange of 100.0% of the outstanding principal of the 11 3/4% Notes for SEC registered publicly tradable notes that have substantially identical terms and conditions as the initial notes.
Maturity and Interest
Our 11 3/4% Notes are governed by the indenture dated as of August 25, 2005, as supplemented by the supplemental indenture dated as of October 31, 2006. The maturity date of our 11 3/4% Notes is January 15, 2011 and they accrue interest at a rate of 11 3/4% per annum with interest being payable on January 15 and July 15 of each year. On or after January 15, 2007, we may redeem some or all of our 11 3/4% Notes.
Optional Redemption
On or after January 15, 2007, we may redeem some or all of the 11 3/4% Notes, upon not less than 30 nor more than 60 days’ notice at the redemption prices (expressed as percentages of the principal amount to be redeemed) set forth below, plus accrued and unpaid interest, if any, to, but not including, the redemption date (subject to the right of 11 3/4% Notes holders of record on the relevant regular record date to receive interest due on an interest payment date that is on or prior to the redemption date), if redeemed during the 12-month period beginning January 15, of the years indicated:
Year | Redemption Price | ||
2007 | 106.000 | % | |
2008 | 105.875 | % | |
2009 | 102.500 | % | |
2010 and thereafter | 100.000 | % |
Guarantees and Security
The 11 3/4% Notes are wholly and unconditionally guaranteed on a senior subordinated basis by all of our existing and future domestic restricted subsidiaries. Our obligations under the 11 3/4% Notes and the guarantors’ obligations under the guarantees are secured on a second priority basis by a lien on substantially all the assets of our subsidiary SBA to the extent that those assets secure its revolving credit facility, subject to certain exceptions. In addition, the 11 3/4% Notes are secured by a first priority lien on:
| • | 100% of the capital stock of certain of our and each guarantor’s directly owned domestic restricted subsidiaries; and |
| • | 65% of the capital stock of our and each guarantor’s directly owned foreign restricted subsidiaries. |
The liens do not extend to the assets of any of our foreign subsidiaries, which as of December 31, 2006 accounted for approximately 51.4% of the book value of our total assets. The second priority lien is subordinated
83
Table of Contents
to a first priority lien securing SBA’s revolving credit facility. Under certain circumstances, the indenture and the security documents relating to the 11 3/4% Notes permit us to incur additional debt that may also be secured by liens on the collateral that are senior to the second priority lien securing the 11 3/4% Notes, and to incur additional debt secured by the second priority lien securing the 11 3/4% Notes.
Mandatory redemption
Pursuant to a mandatory sinking fund, we are required to redeem on August 15 of each of the years 2007 to 2009, inclusive, $5,000,000 aggregate principal amount of the 11 3/4% Notes. We may, at our option, credit against any mandatory sinking fund redemption any 11 3/4% Notes previously or contemporaneously redeemed or acquired by us and delivered to the trustee for cancellation. The redemption price will be equal to 100% of the principal amount of the 11 3/4% Notes being redeemed, plus any accrued and unpaid interest to the date of redemption.
Covenants
Subject to certain exceptions and qualifications, the indenture governing the 11 3/4% Notes contains covenants that limit, among other things, our ability and the ability of our restricted subsidiaries to: (i) incur additional indebtedness or enter into sale and leaseback obligations; (ii) pay certain dividends or make certain distributions on our capital stock or repurchase our capital stock; (iii) make certain investments or other restricted payments; (iv) place restrictions on the ability of subsidiaries to pay dividends or make other payments to us; (v) engage in transactions with stockholders or affiliates; (vi) sell certain assets or merge with or into other companies; (vii) guarantee indebtedness; and (viii) create liens.
Events of Default
The indenture governing the 11 ¾% Notes defines certain events of default, including, among others, (i) nonpayment of principal and premium, if any, at maturity; (ii) nonpayment of interest or any sinking fund payment when due and payable and continuance of such default for a period of 30 days; (iii) default in the making of an offer to purchase and the continuance of such default for a period of 30 days; (iv) failure to perform or comply with certain indenture provisions regarding consolidations, mergers, etc.; (v) decisions holding note guarantees to be invalid or unenforceable; (vi) default in the performance, or breach, of any covenant or agreement of us or any guarantor in the indenture (other than a covenant or agreement a default in whose performance or whose breach is specifically already listed above), and continuance of such default or breach for a period of 30 days; (vii) default under certain bonds, debentures, notes, etc. of us or certain of our subsidiaries, resulting in the acceleration of the maturity of such debt prior to its stated maturity or constituting a failure to pay at least $10 million of such debt when due and payable after the expiration of any applicable grace period with respect thereto; (viii) entry against us or certain of our subsidiaries of a final judgment for the payment of money in an aggregate amount in excess of $10 million by a court of competent jurisdiction, which judgment remains undischarged, unwaived, unstayed, unbonded or unsatisfied for a period of 60 consecutive days; (ix) certain events in bankruptcy, insolvency or reorganization affecting us or certain of our subsidiaries; and (x) defaults related to specified security documents.
The indenture also sets forth certain procedures to be followed in most of the events of default, such as notice and majority requirements, and provides for grace periods and waiver of defaults.
We are required to furnish to the trustee annually a statement as to the performance of certain obligations under the indenture and as to any default in such performance. We are also required to notify the trustee if we become aware of the occurrence of certain defaults or events of default.
84
Table of Contents
Revolving Credit Facility
On August 25, 2005, SBA, one of our wholly owned subsidiaries, which is our only operating entity in the United States, entered into a senior secured revolving credit facility with Comerica Bank, or Comerica. The terms of this facility were amended on November 2, 2006, May 15 and August 17, 2007. We refer to the senior secured revolving credit facility with Comerica, as amended, as the revolving credit facility.
Drawings
Subject to customary conditions, including the absence of defaults, amounts available under the revolving credit facility (computed on the basis of a borrowing base formula linked to the value of SBA’s inventory and the accounts receivable of SBA and certain of its foreign affiliates, subject to a cap of $30.0 million) may be borrowed, repaid and reborrowed on or after the closing, as applicable, $7.5 million of which can be in the form of letters of credit, until the maturity date thereof. The revolving credit facility may be utilized to fund our working capital requirements.
Maturity
Unless terminated earlier, the revolving credit facility matures on August 25, 2010.
Interest and Fees
At SBA’s option, amounts due under the revolving credit facility bear interest at a rate equal to (i) Comerica’s prime-based rate or (ii) a LIBOR-based rate plus 1.90% per annum. Comerica’s prime-based rate is a rate that is the greater of (i) Comerica’s prime rate minus 0.75% per annum and (ii) the interest rate applicable to overnight Federal Funds transactions between members of the Federal Reserve System. In addition, SBA paid an administrative fee of $100,000 at closing and $50,000 at the first anniversary of the closing and will pay $55,000 per annum thereafter. An unused fee equal to 0.25% per annum of the daily average undrawn portion of the revolving credit facility shall accrue and shall be payable quarterly in arrears. Additional customary fees are payable upon the issuance of letters of credit. Upon the occurrence of any event of default under the revolving credit facility, interest will accrue at a rate equal to 3% per annum above the otherwise applicable rate.
Guarantees
SBA’s obligations under the revolving credit facility are unconditionally guaranteed by Intcomex, Inc., limited to a maximum guaranteed principal amount of $30.0 million plus interest and Comerica’s costs of collection.
Security
The revolving credit facility is secured by first priority security interests in all the assets of SBA (but excluding equity interests in SBA or our other direct and indirect subsidiaries).
Covenants
The revolving credit facility contains a number of covenants that, among other things, restrict SBA’s ability to (i) incur additional indebtedness; (ii) make certain capital expenditures; (iii) guarantee obligations, other than SBA’s guarantee of our 11 3/4% Notes; (iv) create or allow liens on assets, other than liens securing our 11 3/4% Notes; (v) make investments, loans or advances; (vi) pay dividends, make distributions or undertake stock and other equity interest buybacks; (vii) make certain acquisitions; (viii) engage in mergers, consolidations or sales of assets; (ix) use proceeds of the revolving credit facility for certain purposes; (x) enter into certain lease obligations; (xi) enter into transactions with affiliates on non-arms’ length terms, (xii) sell or securitize receivables, (xiii) make payments on subordinated indebtedness provided that SBA is permitted to repay
85
Table of Contents
principal under its intercompany loan from Intcomex ($22.6 million of which remains outstanding) for use by Intcomex to pay interest and sinking funds payments due under our 11 3/4% Notes as long as no default exists under the revolving credit facility, and (xiv) create or acquire subsidiaries. The revolving credit facility contains financial covenants requiring us to (i) maintain tangible effective net worth of at least $37.0 million which minimum level shall decline from the end of the third fiscal quarter of 2006 to the end of the third fiscal quarter of 2007 to $25.0 million and remain at $25.0 million thereafter (tested quarterly); (ii) maintain a ratio of senior debt to tangible effective net worth of not more than 2.5 to 1.0 (tested quarterly); (iii) maintain for the fiscal year ending December 31, 2007 net income of not less than $7.5 million; and (iv) maintain as of the last day of each fiscal year, commencing with the fiscal year ending December 31, 2008, a fixed charge coverage ratio of not less than 1.0 to 1.0.
Events of Default
The revolving credit facility contains customary events of default, including (i) nonpayment of principal, interest or fees; (ii) certain defaults under our or SBA’s agreements or instruments of indebtedness; (iii) noncompliance with covenants; (iv) material breaches of representations and warranties; (v) certain change of management, ownership or control events; (vi) insolvency and bankruptcy-related events or dissolution; (vii) certain ERISA matters; and (viii) judgment defaults.
In-country Credit Facilities
Some of our in-country operations have outstanding credit facilities, which we use primarily to finance local working capital needs. See “Management’s Discussion and Analysis of Financial Condition and Results of Operations—Liquidity and Capital Resources.”
86
Table of Contents
CERTAIN UNITED STATES TAX CONSEQUENCES TO NON-UNITED STATES HOLDERS
The following is a general discussion of certain United States federal income and estate tax consequences of the ownership and disposition of common stock by a person that is not a “United States person” for United States federal income tax purposes (a “non-U.S. holder”) and that does not own, and is not deemed to own, more than 5% of our common stock. For this purpose, a “United States person” is a citizen or resident of the United States, a corporation, partnership or other entity created or organized in or under the laws of the United States or any political subdivision thereof, an estate the income of which is subject to United States federal income taxation regardless of its source or a trust if (i) a U.S. court is able to exercise primary supervision over the trust’s administration and (ii) one or more United States persons have the authority to control all of the trust’s substantial decisions. This discussion is based on the Internal Revenue Code of 1986, as amended (the “Code”), and administrative pronouncements, judicial decisions and final, temporary and proposed Treasury Regulations, changes to any of which subsequent to the date of this prospectus may affect the tax consequences described herein. This discussion also does not consider any specific facts or circumstances that may apply to a non-U.S. holder subject to special treatment under the U.S. federal income tax laws (such as insurance companies, tax-exempt organizations, financial institutions, brokers, dealers in securities, partnerships and certain U.S. expatriates). Accordingly, each non-U.S. holder is urged to consult its own tax advisor with respect to the United States tax consequences of the ownership and disposition of common stock, as well as any tax consequences that may arise under the laws of any state, municipality, foreign country or other taxing jurisdiction.
Dividends
Dividends paid to a non-U.S. holder of common stock ordinarily will be subject to withholding of United States federal income tax at a 30 percent rate, or at a lower rate under an applicable income tax treaty that provides for a reduced rate of withholding. In order to obtain a reduced rate of withholding, if available, a non-U.S. holder will be required to provide an Internal Revenue Service Form W-8BEN certifying its entitlement to benefits under a treaty. However, if the non-U.S. holder provides a Form W-8ECI, certifying that dividends are effectively connected with the conduct by the holder of a trade or business within the United States, then the dividends will be exempt from the withholding tax described above and instead will be subject to United States federal income tax on a net income basis. A non-U.S. corporation receiving effectively connected dividends may also be subject to an additional “branch profits tax” imposed at a rate of 30% (or a lower treaty rate).
Gain on Disposition of Common Stock
A non-U.S. holder generally will not be subject to United States federal income tax in respect of gain realized on a disposition of common stock, provided that (a) the gain is not effectively connected with a trade or business conducted by the non-U.S. holder in the United States, (b) in the case of a non-U.S. holder who is an individual and who holds the common stock as a capital asset, such holder is present in the United States for less than 183 days in the taxable year of the sale and other conditions are met or (c) the Company is not, nor has been a U.S. real property holding corporation, as defined in Section 897 of the Code, at any time within the five-year period preceding the disposition or the non-U.S. holder’s holding period, whichever period is shorter. We believe that we are not, and do not anticipate becoming, a U.S. real property holding corporation.
Federal Estate Taxes
Common stock owned or treated as being owned by a non-U.S. holder at the time of death will be included in such holder’s gross estate for United States federal estate tax purposes, unless an applicable estate tax treaty provides otherwise.
U.S. Information Reporting Requirements and Backup Withholding Tax
U.S. information reporting requirements and backup withholding tax (currently at 28%) will not apply to dividends paid on common stock to a non-U.S. holder, provided the non-U.S. holder provides a Form W-8BEN
87
Table of Contents
(or satisfies certain documentary evidence requirements for establishing that it is a non-United States person) or otherwise establishes an exemption. Information reporting and backup withholding also generally will not apply to a payment of the proceeds of a sale of common stock effected outside the United States by a foreign office of a foreign broker. However, information reporting requirements (but not backup withholding) will apply to a payment of the proceeds of a sale of common stock effected outside the United States by a foreign office of a broker if the broker (i) is a United States person, (ii) derives 50 percent or more of its gross income for certain periods from the conduct of a trade or business in the United States, (iii) is a “controlled foreign corporation” as to the United States, or (iv) is a foreign partnership that, at any time during its taxable year is more than 50 percent (by income or capital interest) owned by United States persons or is engaged in the conduct of a U.S. trade or business, unless in any such case the broker has documentary evidence in its records that the holder is a non-U.S. holder and certain conditions are met, or the holder otherwise establishes an exemption. Payment by a United States office of a broker of the proceeds of a sale of common stock will be subject to both backup withholding and information reporting unless the holder certifies its non-United States status under penalties of perjury or otherwise establishes an exemption.
Any amounts withheld under the backup withholding rules may be allowed as a refund or a credit against such holder’s United States federal income tax liability provided the required information is furnished to the IRS in a timely manner.
88
Table of Contents
SHARES ELIGIBLE FOR FUTURE SALE
Prior to this offering, there has been no public market for our common stock. Future sales of substantial amounts of our common stock in the public market following this offering or the possibility of these sales occurring could adversely affect prevailing market prices for our common stock or could impair our future ability to raise capital through an offering of equity securities.
Upon the consummation of this offering, we expect that shares of our common stock will be outstanding, assuming no exercise of outstanding options, and shares if the underwriters’ over-allotment option is exercised in full. All of the shares sold in this offering will be freely tradable without restriction or further registration under the Securities Act, except for any shares purchased by our affiliates, as that term is defined in Rule 144 under the Securities Act.
The shares outstanding prior to the offering are restricted shares. Restricted shares may be sold in the public market only if they are registered under the Securities Act or if they are sold pursuant to an exemption from registration, such as the exemptions provided by Rule 144, 144(k) or 701 promulgated under the Securities Act.
After the expiration of the lock-up agreements described below under “Lock-up Agreements,” shares of our common stock, subject to the lock-up agreements, will be freely transferable and shares of our common stock, subject to the lock-up agreements, will be freely transferable subject to the applicable volume, manner of sale, holding period and other limitations of Rule 144 or under other exemptions from registration.
Following the completion of this offering, we intend to file a registration statement on Form S-8 to provide for immediate resale, subject to the lock-up agreements, of shares of common stock issued upon the exercise of options granted under our founders’ grant plan and to be granted in the future.
Lock-up Agreements
Our officers, directors, the selling stockholder and our other existing stockholders and option holders, who will, after the offering, collectively hold an aggregate of shares, will enter into lock-up agreements with the underwriters in connection with this offering. These lock-up agreements will provide that, with limited exceptions, for a period of 180 days from the date of this prospectus, each will not, without the prior written consent of Citi and UBS, dispose of or pledge any shares of our common stock or any securities convertible into or exchangeable for our common stock. Citi and UBS, in their sole discretion, may release any of the securities subject to these lock-up agreements at any time without notice.
Option Grants
As of June 30, 2007, stock options to purchase a total of 1,540 shares of our common stock were outstanding under our founders’ stock options grant. These stock options have a weighted average exercise price of $1,077 per share and a weighted average of 10 years until expiration.
89
Table of Contents
Citigroup Global Markets Inc. (“Citi”) and UBS Securities LLC (“UBS”) are acting as joint bookrunning managers of the offering and representatives of the underwriters named below. Subject to the terms and conditions stated in the underwriting agreement dated the date of this prospectus, each underwriter named below has agreed to purchase, and we and the selling stockholder have agreed to sell to that underwriter, the number of shares set forth opposite the underwriter’s name.
Underwriter | Number of shares | |
Citigroup Global Markets Inc. | ||
UBS Securities LLC | ||
Banc of America Securities LLC | ||
Raymond James & Associates Inc. | ||
Broadpoint Capital, Inc. | ||
Total | ||
The underwriting agreement provides that the obligations of the underwriters to purchase the shares included in this offering are subject to approval of legal matters by counsel and to other conditions. The underwriters are obligated to purchase all the shares (other than those covered by the over-allotment option described below) if they purchase any of the shares.
The underwriters propose to offer some of the shares directly to the public at the public offering price set forth on the cover page of this prospectus and some of the shares to dealers at the public offering price less a concession not to exceed $ per share. The underwriters may allow, and dealers may reallow, a concession not to exceed $ per share on sales to other dealers. If all of the shares are not sold at the initial offering price, the representatives may change the public offering price and the other selling terms.
We and the selling stockholder have granted to the underwriters an option, exercisable for 30 days from the date of this prospectus, to purchase up to an aggregate of additional shares of common stock at the public offering price less the underwriting discount. The underwriters may exercise the option solely for the purpose of covering over-allotments, if any, in connection with this offering. To the extent the option is exercised, each underwriter must purchase a number of additional shares approximately proportionate to that underwriter’s initial purchase commitment.
We, our officers and directors, the selling stockholder and our other existing stockholders and option holders have agreed, subject to limited exceptions, that for a period of 180 days from the date of this prospectus, each will not, without the prior written consent of Citi and UBS, dispose of or hedge any shares of our common stock or any securities convertible into or exchangeable for our common stock. Citi and UBS in their sole discretion may release any of the securities subject to these lock-up agreements at any time without notice.
At our request, the underwriters have reserved up to % of the shares of common stock for sale at the initial public offering price to persons who are directors, officers or employees, or who are otherwise associated with us, through a directed share program. The number of shares of common stock available for sale to the general public will be reduced by the number of directed shares purchased by participants in the program. Any directed shares not purchased will be offered by the underwriters to the general public on the same basis as all other shares of common stock offered. We have agreed to indemnify the underwriters against certain liabilities and expenses, including liabilities under the Securities Act, in connection with the sales of the directed shares.
Each underwriter has represented, warranted and agreed that:
| • | it has only communicated and caused to be communicated and will only communicate or cause to be communicated any invitation or inducement to engage in investment activity (within the meaning of |
90
Table of Contents
section 21 of the Financial Services and Markets Act 2000 (“FSMA”)) received by it in connection with the issue or sale of any shares included in this offering in circumstances in which section 21(1) of the FSMA does not apply to us; |
| • | it has complied and will comply with all applicable provisions of the FSMA with respect to anything done by it in relation to the shares included in this offering in, from or otherwise involving the United Kingdom; |
| • | the offer in The Netherlands of the shares included in this offering is exclusively limited to persons who trade or invest in securities in the conduct of a profession or business (which include banks, stockbrokers, insurance companies, pension funds, other institutional investors and finance companies and treasury departments of large enterprises); |
| • | (1) it has not offered or sold and will not offer or sell our common stock in Hong Kong SAR by means of this prospectus or any other document, other than to persons whose ordinary business involves buying or selling shares or debentures, whether as principal or agent or in circumstances which do not constitute an offer to the public within the meaning of the Companies Ordinance (Cap. 32 of the Laws of Hong Kong SAR), and (2) unless it is a person who is permitted to do so under the securities laws of Hong Kong SAR, it has not issued or held for the purpose of issue in Hong Kong and will not issue or hold for the purpose of issue in Hong Kong SAR this prospectus, any other offering material or any advertisement, invitation or document relating to the common stock, otherwise than with respect to common stock intended to be disposed of to persons outside Hong Kong SAR or only to persons whose business involves the acquisition, disposal, or holding of securities, whether as principal or as agent; |
| • | the shares offered in this prospectus have not been registered under the Securities and Exchange Law of Japan, and it has not offered or sold and will not offer or sell, directly or indirectly, the common stock in Japan or to or for the account of any resident of Japan, except (1) pursuant to an exemption from the registration requirements of the Securities and Exchange Law and (2) in compliance with any other applicable requirements of Japanese law; and |
| • | this prospectus has not been registered as a prospectus with the Monetary Authority of Singapore; accordingly, this prospectus or any other document or material in connection with the offer or sale, or invitation for subscription or purchase, of the common stock, may not be circulated or distributed, nor may the common stock be offered or sold, or be made the subject of an invitation for subscription or purchase, whether directly or indirectly, to the public or any member of the public in Singapore other than (1) to an institutional investor or other person specified in Section 274 of the Securities and Futures Act, Chapter 289 of Singapore (the “SFA”), (2) to a sophisticated investor, and in accordance with the conditions, specified in Section 275 of the SFA or (3) otherwise pursuant to, and in accordance with the conditions of, any other applicable provision of the SFA. |
| • | with respect to each Member State of the European Economic Area which has implemented Prospectus Directive 2003/71/EC, including any applicable implementing measures, from and including the date on which the Prospectus Directive is implemented in that Member State, the offering of the common stock in this offering is only being made: |
| • | to legal entities which are authorized or regulated to operate in the financial markets or, if not so authorized or regulated, whose corporate purpose is solely to invest in securities; |
| • | to any legal entity which has two or more of (1) an average of at least 250 employees during the last financial year; (2) a total balance sheet of more than Euro 43,000,000 and (3) an annual net turnover of more than Euro 50,000,000, as shown in its last annual or consolidated accounts; or |
| • | in any other circumstances which do not require the publication by Intcomex of a prospectus pursuant to Article 3 of the Prospectus Directive. |
Shares of our common stock may be offered in Switzerland only on the basis of a non-public offering. This prospectus does not constitute an issuance prospectus according to articles 652a or 1156 of the Swiss Federal
91
Table of Contents
Code of Obligations or a listing prospectus according to article 32 of the Listing Rules of the Swiss exchange. The shares of our common stock may not be offered or distributed on a professional basis in or from Switzerland and neither this prospectus nor any other offering material relating to shares of our common stock may be publicly issued in connection with any such offer or distribution. The shares have not been and will not be approved by any Swiss regulatory authority. In particular, the shares are not and will not be registered with or supervised by the Swiss Federal Banking Commission, and investors may not claim protection under the Swiss Investment Fund Act.
Prior to this offering, there has been no public market for our common stock. Consequently, the initial public offering price for the shares was determined by negotiations among us, the selling stockholder and the representatives (including UBS in its role as the “qualified independent underwriter” as discussed below). Among the factors considered in determining the initial public offering price were our record of operations, our current financial condition, our future prospects, our markets, the economic conditions in and future prospects for the industry in which we compete, our management, and currently prevailing general conditions in the equity securities markets, including current market valuations of publicly traded companies considered comparable to our company. We cannot assure you, however, that the prices at which the shares will sell in the public market after this offering will not be lower than the initial public offering price or that an active trading market in our common stock will develop and continue after this offering.
We intend to apply to have our common stock listed on the Nasdaq Global Market under the symbol “ICMX.”
The following table shows the underwriting discounts and commissions that we and the selling stockholder are to pay to the underwriters in connection with this offering. These amounts are shown assuming both no exercise and full exercise of the underwriters’ option to purchase additional shares of common stock.
| Paid by Intcomex | Paid by selling stockholder | |||||||||||
| No Exercise | Full Exercise | No Exercise | Full Exercise | |||||||||
Per share | $ | $ | $ | $ | ||||||||
Total | $ | $ | $ | $ | ||||||||
In connection with the offering, UBS on behalf of the underwriters, may purchase and sell shares of common stock in the open market. These transactions may include short sales, syndicate covering transactions and stabilizing transactions. Short sales involve syndicate sales of common stock in excess of the number of shares to be purchased by the underwriters in the offering, which creates a syndicate short position. “Covered” short sales are sales of shares made in an amount up to the number of shares represented by the underwriters’ over-allotment option. In determining the source of shares to close out the covered syndicate short position, the underwriters will consider, among other things, the price of shares available for purchase in the open market as compared to the price at which they may purchase shares through the over-allotment option. Transactions to close out the covered syndicate short involve either purchases of the common stock in the open market after the distribution has been completed or the exercise of the over-allotment option. The underwriters may also make “naked” short sales of shares in excess of the over-allotment option. The underwriters must close out any naked short position by purchasing shares of common stock in the open market. A naked short position is more likely to be created if the underwriters are concerned that there may be downward pressure on the price of the shares in the open market after pricing that could adversely affect investors who purchase in the offering. Stabilizing transactions consist of bids for or purchases of shares in the open market while the offering is in progress.
The underwriters also may impose a penalty bid. Penalty bids permit the underwriters to reclaim a selling concession from a syndicate member when UBS repurchases shares originally sold by that syndicate member in order to cover syndicate short positions or make stabilizing purchases. Any of these activities may have the effect of preventing or retarding a decline in the market price of the common stock. They may also cause the price of the common stock to be higher than the price that would otherwise exist in the open market in the absence of
92
Table of Contents
these transactions. The underwriters may conduct these transactions on the Nasdaq Global Market or in the over-the-counter market, or otherwise. If the underwriters commence any of these transactions, they may discontinue them at any time.
We and the selling stockholder estimate that our respective portions of the total expenses of this offering will be $ and $ .
Prior to the completion of this offering, CVC International, an affiliate of Citi, owned more than 10% of our outstanding common stock and therefore Citi is presumed to have a “conflict of interest” with us under Rule 2720 of the NASD Rules. Citi may also have a conflict of interest with us because CVC is receiving all of the proceeds from the sale of its shares in this offering. Because of the conflict of interest under Rule 2720, this offering is being conducted in accordance with the applicable provisions of that rule. Rule 2720 requires that the initial public offering price of the common stock be no higher than that recommended by a “qualified independent underwriter” (as such term is defined by Rule 2720), which also participates in the preparation of the registration statement and prospectus and conducts due diligence. Accordingly, UBS is assuming the responsibilities of acting as the qualified independent underwriter in this offering. The initial public offering price of the common stock will be no higher than the price recommended by UBS. We have agreed to indemnify UBS for acting as qualified independent underwriter against certain liabilities, including liabilities under the Securities Act, and to contribute to payments that UBS may be required to make for these liabilities.
Certain of the underwriters have performed investment banking and advisory services for us from time to time for which they have received customary fees and expenses. The underwriters may, from time to time, engage in transactions with and perform services for us in the ordinary course of their business in the future.
A prospectus in electronic format may be made available on the websites maintained by one or more of the underwriters. The representatives may agree to allocate a number of shares to underwriters for sale to their online brokerage account holders. The representatives will allocate shares to underwriters that may make Internet distributions on the same basis as other allocations. In addition, shares may be sold by the underwriters to securities dealers who resell shares to online brokerage account holders.
We and the selling stockholder have agreed to indemnify the underwriters against certain liabilities, including liabilities under the Securities Act of 1933, or to contribute to payments the underwriters may be required to make because of any of those liabilities.
93
Table of Contents
The validity of the common stock offered hereby will be passed upon for us by Cleary Gottlieb Steen & Hamilton LLP, New York, New York. Weil, Gotshal & Manges LLP advised the underwriters in connection with the offering of the common stock.
The consolidated financial statements of Intcomex Inc. and subsidiaries as of December 31, 2006 and 2005 and for each of the years in the three-year period ended December 31, 2006 included in this prospectus and in the registration statement have been audited by BDO Seidman, LLP, an independent registered public accounting firm, to the extent and for the periods set forth in their report appearing elsewhere herein and in the registration statement, and are included in reliance upon such report given upon the authority of said firm as experts in auditing and accounting.
The financial statements of Centel, S.A. de C.V. as of December 31, 2006 and 2005 and for the periods ended December 31, 2006, 2005 and May 31, 2005, not included in this prospectus or in the registration statement, have been audited by PricewaterhouseCoopers, S.C., an independent registered public accounting firm, as stated in their report appearing elsewhere herein and in the registration statement and are included in reliance upon such report given upon the authority of said firm as experts in auditing and accounting.
The financial statements of Intcomex, S.A. de C.V. as of December 31, 2005 and 2004 and for the years then ended, not included in this prospectus or in the registration statement, have been audited by Figueroa Jimenez & Co., S.A. (before 2005, Peat, Marwick, Mitchell & Co. (Latin America), S.A.), to the extent and for the periods set forth in their report appearing elsewhere herein and in the registration statement, and are included in reliance upon such report given upon the authority of said firm as experts in auditing and accounting.
The financial statements of Computacion Morenca Panama S. A. as of December 31, 2005 and for each of the years in the two-year period ended December 31, 2005 (not presented separately herein) and Intcomex de las Americas, S. A. for the year ended December 31, 2004 (not presented separately herein) have been audited by Ernst & Young Ltd. Corp., an independent registered public accounting firm, to the extent and for the periods set forth in their reports (the report on the financial statements of Intcomex de las Americas, S. A. contains an explanatory paragraph regarding the Company’s ability to continue as a going concern), appearing elsewhere herein and upon the authority of such firm as experts in auditing and accounting.
In this prospectus we rely on and refer to information and statistics regarding the IT products distribution industry, related industries and our market share or market share position in the sectors and countries in which we compete. Where possible, we obtained this information and statistics from third-party sources, such as IDC, a market intelligence and advisory firm in the IT and telecommunications industries; Pyramid Research, a market intelligence and consulting services firm in the global communications industry; Gartner, Inc., a provider of research and analysis on the global IT industry; the Global Insight, Inc., a provider of economic, financial and political analysis of various countries, regions and industries; and Euromonitor International Inc., a provider of business intelligence on industries, countries and consumers. Based on our familiarity with the market, we believe that estimates by these third party sources are reliable, but we have not independently verified the third-party information. Additionally, we have supplemented third-party information where necessary with management estimates based on information from our customers and vendors, trade and business organizations, industry publications, government records, and other contacts in markets in which we operate, our management’s knowledge and experience in the industry and the markets in which we operate, and information made publicly available by our public company competitors. Although we believe that our management estimates are reasonable, there is no information from third-party sources available to us that would confirm our management estimates.
94
Table of Contents
USE OF TRADEMARKS AND TRADE NAMES
We have registered a number of trademarks, such as “Intcomex,” “Blue Code,” “CENTEL,” “FORZA,” “Hurricane,” “KLIP XTREME,” “KLIP” and “NEXXT Solutions” in the United States and/or in various Latin American and Caribbean jurisdictions. This prospectus also contains trademarks and trade names of other companies. All trademarks and trade names appearing in this prospectus are the property of their respective holders.
WHERE YOU CAN FIND MORE INFORMATION
We have filed with the SEC a registration statement on Form S-1 under the Securities Act with respect to the common stock offered hereby. This prospectus does not contain all of the information set forth in the registration statement and the exhibits and schedules thereto. For further information with respect to us and the common stock offered hereby, you should refer to the registration statement and to the exhibits and schedules filed therewith. We also file annual, quarterly and current reports and other information with the SEC under the Securities Exchange Act of 1934, as amended. A copy of those reports and this registration statement and the exhibits and schedules thereto may be inspected without charge at the public reference room maintained by the SEC located at 100 F Street, N.E., Room 1580, Washington, DC 20549. Copies of those reports and all or any portion of the registration statements and the filings may be obtained from such offices upon payment of prescribed fees. The public may obtain information on the operation of the public reference room by calling the SEC at 1-800-SEC-0330. The SEC maintains a website atwww.sec.gov that contains reports, proxy and information statements and other information regarding Registrants that file electronically with the SEC.
You may obtain a copy of any of our filings, at no cost, by writing or telephoning us at:
Intcomex, Inc.
3505 NW 107th Avenue
Miami, Florida 33178
(305) 477-6230
Attn: Russell Olson
95
Table of Contents
INDEX TO CONSOLIDATED FINANCIAL STATEMENTS
| Page | ||
Unaudited Condensed Financial Consolidated Statements | ||
Condensed Consolidated Balance Sheets as of June 30, 2007 (unaudited) and December 31, 2006 | F-2 | |
| F-3 | ||
| F-4 | ||
Notes to Unaudited Condensed Consolidated Financial Statements | F-5 | |
Audited Annual Consolidated Financial Statements | ||
| F-20 | ||
| F-21 | ||
| F-22 | ||
| F-23 | ||
Consolidated Balance Sheets as of December 31, 2006 and 2005 | F-25 | |
Consolidated Statements of Operations for the years ended December 31, 2006, 2005 and 2004 | F-26 | |
| F-27 | ||
Consolidated Statements of Cash Flows for the years ended December 31, 2006, 2005 and 2004 | F-29 | |
| F-30 | ||
F-1
Table of Contents
INTCOMEX, INC. AND SUBSIDIARIES
CONDENSED CONSOLIDATED BALANCE SHEETS
(Dollars in thousands, except per share data)
As of June 30, | As of December 31, 2006 | |||||
| (Unaudited) | ||||||
ASSETS | ||||||
Current Assets: | ||||||
Cash and cash equivalents | $ | 18,034 | $ | 20,574 | ||
Trade accounts receivable, net of allowance for doubtful accounts of $4,725 and $ 4,066 | 111,280 | 89,290 | ||||
Inventories | 116,728 | 94,410 | ||||
Prepaid expenses and other | 37,766 | 30,084 | ||||
Total Current Assets | 283,808 | 234,358 | ||||
Property and equipment, net | 13,764 | 11,019 | ||||
Goodwill | 34,257 | 34,257 | ||||
Identifiable intangible assets, net | 3,413 | 3,883 | ||||
Other assets | 9,207 | 9,058 | ||||
Total Assets | $ | 344,449 | $ | 292,575 | ||
LIABILITIES AND SHAREHOLDERS’ EQUITY | ||||||
Current Liabilities: | ||||||
Lines of credit | $ | 23,882 | $ | 17,653 | ||
Current maturities of long-term debt | 5,481 | 5,376 | ||||
Accounts payable | 130,676 | 95,972 | ||||
Accrued expenses and other | 19,403 | 17,038 | ||||
Related parties | 99 | 97 | ||||
Total Current Liabilities | 179,541 | 136,136 | ||||
Long-term debt, net of current portion | 115,222 | 114,833 | ||||
Other long-term liabilities | 4,053 | 3,269 | ||||
Total Liabilities | 298,816 | 254,238 | ||||
Commitments and Contingencies | ||||||
Shareholders’ Equity: | ||||||
Common stock, voting $0.01 par value, 140,000 shares authorized, 100,000 shares issued and outstanding | 1 | 1 | ||||
Common stock, non-voting $0.01 par value, 10,000 shares authorized, 2,182 shares issued and outstanding | — | — | ||||
Additional paid in capital | 20,680 | 17,597 | ||||
Retained earnings | 24,770 | 20,717 | ||||
Accumulated other comprehensive income | 182 | 22 | ||||
Total Shareholders’ Equity | 45,633 | 38,337 | ||||
Total Liabilities and Shareholders’ Equity | $ | 344,449 | $ | 292,575 | ||
The accompanying notes to these unaudited condensed consolidated financial statements are an integral part of the condensed consolidated financial statements.
F-2
Table of Contents
INTCOMEX, INC. AND SUBSIDIARIES
CONDENSED CONSOLIDATED STATEMENTS OF OPERATIONS
(Dollars in thousands, except per share data)
(Unaudited)
| Three months Ended June 30, | Six months Ended June 30, | |||||||||||||||
| 2007 | 2006 | 2007 | 2006 | |||||||||||||
Revenue: | $ | 254,370 | $ | 213,731 | $ | 498,147 | $ | 427,299 | ||||||||
Cost of revenue: | 229,003 | 192,532 | 448,045 | 383,181 | ||||||||||||
Gross Profit | 25,367 | 21,199 | 50,102 | 44,118 | ||||||||||||
Operating Expenses: | ||||||||||||||||
Selling, General and Administrative | 20,615 | 13,020 | 35,254 | 26,045 | ||||||||||||
Depreciation and Amortization | 861 | 648 | 1,677 | 1,273 | ||||||||||||
Total Operating Expenses | 21,476 | 13,668 | 36,931 | 27,318 | ||||||||||||
Operating Income | 3,891 | 7,531 | 13,171 | 16,800 | ||||||||||||
Other Expense (Income): | ||||||||||||||||
Interest Expense | 4,264 | 4,065 | 8,445 | 8,060 | ||||||||||||
Interest Income | (148 | ) | (136 | ) | (283 | ) | (500 | ) | ||||||||
Other Expense | 11 | 17 | 27 | 4 | ||||||||||||
Foreign Exchange (Gain) Loss | (1,376 | ) | 1,585 | (968 | ) | 2,570 | ||||||||||
Total Other Expense | 2,751 | 5,531 | 7,221 | 10,134 | ||||||||||||
Income Before Provision for Income Taxes | 1,140 | 2,000 | 5,950 | 6,666 | ||||||||||||
Provision for Income Taxes: | 567 | 719 | 1,897 | 2,169 | ||||||||||||
Net Income | $ | 573 | $ | 1,281 | $ | 4,053 | $ | 4,497 | ||||||||
Earnings per weighted average share of common stock, voting and non-voting: | ||||||||||||||||
Basic | $ | 5.61 | $ | 12.54 | $ | 39.66 | $ | 44.01 | ||||||||
Diluted | $ | 5.61 | $ | 12.54 | $ | 39.66 | $ | 44.01 | ||||||||
Weighted average number of shares used in per share calculation of common stock, voting and non-voting: | ||||||||||||||||
Basic | 102,182 | 102,182 | 102,182 | 102,182 | ||||||||||||
Diluted | 102,182 | 102,182 | 102,182 | 102,182 | ||||||||||||
The accompanying notes to these unaudited condensed consolidated financial statements are an integral part of the condensed consolidated financial statements.
F-3
Table of Contents
INTCOMEX, INC. AND SUBSIDIARIES
CONDENSED CONSOLIDATED STATEMENTS OF CASH FLOWS
(Dollars in thousands, except per share data)
(Unaudited)
| Six months ended June 30, | ||||||||
| 2007 | 2006 | |||||||
Cash flows from operating activities: | ||||||||
Net income | $ | 4,053 | $ | 4,497 | ||||
Adjustments to reconcile net income to net cash (used in) provided by operating activities: | ||||||||
Depreciation expense | 1,207 | 764 | ||||||
Amortization of intangibles | 470 | 509 | ||||||
Amortization of deferred loan costs | 547 | 661 | ||||||
Bad debt expense | 908 | 773 | ||||||
Inventory obsolescence expense | 472 | 852 | ||||||
Deferred tax (benefit) | (1,656 | ) | (947 | ) | ||||
Loss (Gain) on sale of property and equipment, net | 8 | (2 | ) | |||||
Change in operating assets and liabilities: | ||||||||
(Increase) decrease in: | ||||||||
Trade accounts receivables | (22,898 | ) | (6,620 | ) | ||||
Inventories | (22,790 | ) | (11,132 | ) | ||||
Prepaid expenses and other assets | (4,423 | ) | 461 | |||||
Increase (decrease) in: | ||||||||
Accounts payable | 34,704 | 12,718 | ||||||
Due to related parties | 2 | 45 | ||||||
Accrued expenses and other | 3,388 | 2,251 | ||||||
Net cash (used in) provided by operating activities | (6,008 | ) | 4,830 | |||||
Cash flows from investing activities: | ||||||||
Additions to property and equipment | (4,022 | ) | (1,762 | ) | ||||
Proceeds from disposition of assets | 116 | 2 | ||||||
Other assets | (34 | ) | — | |||||
Notes receivable and other | 525 | 18 | ||||||
Net cash used in investing activities | (3,415 | ) | (1,742 | ) | ||||
Cash flows from financing activities: | ||||||||
Borrowings (payments) under line of credit, net | 6,229 | (4,166 | ) | |||||
Borrowings of notes payable | 494 | 545 | ||||||
Net cash provided by (used in) financing activities | 6,723 | (3,621 | ) | |||||
Effect of foreign currency exchange rates | 160 | (946 | ) | |||||
Net decrease in cash | (2,540 | ) | (1,479 | ) | ||||
Cash and cash equivalents, beginning of period | 20,574 | 12,995 | ||||||
Cash and cash equivalents, end of period | $ | 18,034 | $ | 11,516 | ||||
Six months ended June 30, | ||||||||
| 2007 | 2006 | |||||||
Supplemental disclosure of non-cash flow information: | ||||||||
Due from related parties | $ | 3,029 | $ | — | ||||
Stock option compensation | $ | 54 | $ | — | ||||
The accompanying notes to these unaudited condensed consolidated financial statements are an integral part of the condensed consolidated financial statements.
F-4
Table of Contents
INTCOMEX, INC. AND SUBSIDIARIES
NOTES TO CONDENSED UNAUDITED CONSOLIDATED FINANCIAL STATEMENTS
(Dollars in thousands, except per share data)
Note 1. Organization and Basis of Presentation
Intcomex, Inc., (“Intcomex”) a Delaware Company and its subsidiaries are international distributors of computer equipment and peripherals, and include the accounts of Intcomex Holdings, LLC (Parent Company of SBA and IXLA), Intcomex Holdings SPC-1, LLC (Parent Company of Centel, S.A. de C.V., a Mexican company), Software Brokers of America, Inc. (“SBA”) and IXLA Holdings, Ltd. (“IXLA”). IXLA is the holding company of fourteen separate subsidiaries located in Central America, South America and the Caribbean.
The condensed consolidated financial statements include the accounts of Intcomex and its subsidiaries (collectively referred to herein as the “Company”). These condensed consolidated financial statements have been prepared by the Company, without audit, pursuant to the rules and regulations of the United States Securities and Exchange Commission (the “SEC”). In the opinion of management, the accompanying unaudited condensed consolidated financial statements contain all material adjustments (consisting of only normal, recurring adjustments) necessary to fairly state the financial position of the Company as of June 30, 2007, and its results of operations for the three and six months ended June 30, 2007 and 2006, respectively, and its statement of cash flows for the six months ended June 30, 2007 and 2006, respectively. All significant intercompany accounts and transactions have been eliminated in consolidation. As permitted under the applicable rules and regulations of the SEC, these consolidated financial statements do not include all disclosures and footnotes normally included with annual consolidated financials statements and, accordingly, should be read in conjunction with the consolidated financial statements and the notes thereto, included in the Company’s Form 10-K filing with the SEC. The results of operations for the three and six months ended June 30, 2007 may not be indicative of the results of operations that can be expected for the full year.
Reclassifications
Certain 2006 amounts have been reclassified to conform to the 2007 presentation.
Note 2. Comprehensive Income
Statement of Financial Accounting Standards No. 130 (“SFAS 130”), “Reporting Comprehensive Income” establishes standards for reporting and displaying comprehensive income and its components in the Company’s consolidated financial statements. Comprehensive income is defined in SFAS 130 as the change in equity (net assets) of a business enterprise during a period from transactions and other events and circumstances from non-owner sources and is comprised of net income and other comprehensive income (loss). For the three and six months ended June 30, 2007 and 2006, respectively, comprehensive income is presented below:
| Three months ended June 30, | Six months ended June 30, | |||||||||||||
| 2007 | 2006 | 2007 | 2006 | |||||||||||
Net income | $ | 573 | $ | 1,281 | $ | 4,053 | $ | 4,497 | ||||||
Changes in foreign currency translation adjustments | 423 | (567 | ) | 160 | (946 | ) | ||||||||
Comprehensive income | $ | 996 | $ | 714 | $ | 4,213 | $ | 3,551 | ||||||
F-5
Table of Contents
INTCOMEX, INC. AND SUBSIDIARIES
NOTES TO CONDENSED UNAUDITED CONSOLIDATED FINANCIAL STATEMENTS—(Continued)
(Dollars in thousands, except per share data)
Note 3. Property and Equipment
Property and equipment consisted of the following at June 30, 2007 and December 31, 2006:
| 2007 | 2006 | |||||||
Land | $ | 405 | $ | 374 | ||||
Building and leasehold improvements | 6,750 | 5,517 | ||||||
Office furniture, vehicles and equipment | 8,411 | 7,494 | ||||||
Warehouse equipment | 2,168 | 1,277 | ||||||
Software | 3,672 | 2,833 | ||||||
| 21,406 | 17,495 | |||||||
Less accumulated depreciation and amortization | (7,642 | ) | (6,476 | ) | ||||
| $ | 13,764 | $ | 11,019 | |||||
Note 4. Intangible Assets
The identifiable intangible assets balance consists of the following amounts:
As of June 30, 2007 | Gross carrying Amount | Accumulated Amortization | Net carrying Amount | Useful Life | ||||||||
Customer relationships | $ | 3,630 | $ | (757 | ) | $ | 2,873 | 10.0 | ||||
Tradenames | 1,080 | (765 | ) | 315 | 3.5 | |||||||
Non-compete agreements | 730 | (507 | ) | 223 | 3.0 | |||||||
Sub-total | $ | 5,440 | $ | (2,029 | ) | $ | 3,411 | |||||
Patents | 5 | (3 | ) | 2 | ||||||||
Total | $ | 5,445 | $ | (2,032 | ) | $ | 3,413 | |||||
As of December 31, 2006 | Gross carrying Amount | Accumulated Amortization | Net carrying Amount | Useful Life | ||||||||
Customer relationships | $ | 3,630 | $ | (575 | ) | $ | 3,055 | 10.0 | ||||
Tradenames | 1,080 | (599 | ) | 481 | 3.5 | |||||||
Non-compete agreements | 730 | (385 | ) | 345 | 3.0 | |||||||
Sub-total | $ | 5,440 | $ | (1,559 | ) | $ | 3,881 | |||||
Patents | 5 | (3 | ) | 2 | ||||||||
Total | $ | 5,445 | $ | (1,562 | ) | $ | 3,883 | |||||
F-6
Table of Contents
INTCOMEX, INC. AND SUBSIDIARIES
NOTES TO CONDENSED UNAUDITED CONSOLIDATED FINANCIAL STATEMENTS—(Continued)
(Dollars in thousands, except per share data)
Note 5. Lines of Credit and Long-term debt
Lines of credits as of June 30, 2007 and December 31, 2006 consisted of the following:
| 2007 | 2006 | |||||
SBA – Miami | $ | 19,609 | $ | 16,617 | ||
T.G.M., S.A. (Uruguay) | 1,552 | 628 | ||||
Computacion Monrenca Panama, S.A. | 1,000 | — | ||||
Intcomex Peru, S.A.C. | 550 | 260 | ||||
Intcomex de Guatemala, S.A. | 497 | — | ||||
Intcomex de Ecuador, S.A. | 356 | — | ||||
Intcomex Colombia, LTDA | 153 | 76 | ||||
Intcomex, S.A. (Chile) | 165 | 72 | ||||
Total lines of credit | $ | 23,882 | $ | 17,653 | ||
As of June 30, 2007, the Company and its subsidiaries were in compliance with all bank covenants.
The Company’s long-term debt as of June 30, 2007 and December 31, 2006 consists of the following:
| 2007 | 2006 | |||||||
Intcomex, Inc 11 3/4% Second Priority Senior Secured Notes due 2011 | $ | 119,383 | $ | 119,151 | ||||
Intcomex Peru, S.A.C. collateralized notes | 671 | 353 | ||||||
Intcomex Chile, S.A. lease contracts | 107 | 150 | ||||||
Other, including various capital leases | 542 | 555 | ||||||
Total long-term debt | 120,703 | 120,209 | ||||||
Current maturities of long-term debt | (5,481 | ) | (5,376 | ) | ||||
Total long-term debt | $ | 115,222 | $ | 114,833 | ||||
On August 25, 2005 the Company completed a $120.0 million high yield debt offering. The notes are a second priority senior secured obligation of the Company and are due January 15, 2011. The notes are secured with 100.0% of the common shares of Intcomex Holdings, LLC and Intcomex Holdings SPC-I, LLC and 65.0% of the shares of IXLA Holdings, LTD plus a second priority lien on the assets of SBA.
Concurrent with the high yield debt offering, SBA entered into a new $25.0 million three year revolving credit facility with Comerica Bank. Borrowings against the facility will be at prime less 75 basis points and are secured on a first priority basis with all the assets of SBA. On November 2, 2006 the Company asked for and obtained certain waivers and amendments to the credit agreement and the subordination agreement from Comerica Bank. The amendments to the credit and subordination agreements allow SBA to make these payments to the Company for the remaining $22,608. In addition, the Company must maintain a minimum level of tangible effective net worth of at least $37.0 million (which minimum level shall decline from the end of the third fiscal quarter of 2006 to the end of the third fiscal quarter of 2007 to $25.0 million and remain at $25.0 million thereafter).
On December 14, 2006 the Company completed the exchange of 100.0% of the outstanding principal of its Second Priority Senior Secured Notes due 2011 for SEC registered publicly tradable notes that have substantially identical terms and conditions as the initial Notes.
F-7
Table of Contents
INTCOMEX, INC. AND SUBSIDIARIES
NOTES TO CONDENSED UNAUDITED CONSOLIDATED FINANCIAL STATEMENTS—(Continued)
(Dollars in thousands, except per share data)
Note 6. Income Taxes
Income tax provision for the three and six months ended June 30, 2007 and 2006 consist of the following:
| Three months Ended June 30, | Six months Ended June 30, | |||||||||||||||
| 2007 | 2006 | 2007 | 2006 | |||||||||||||
Current expense (benefit) | ||||||||||||||||
Federal and State | $ | 12 | $ | 1 | $ | 17 | $ | (188 | ) | |||||||
Foreign | 1,811 | 1,374 | 3,536 | 3,304 | ||||||||||||
Total current expense | 1,823 | 1,375 | 3,553 | 3,116 | ||||||||||||
Deferred expense (benefit) | ||||||||||||||||
Federal and State | (981 | ) | (464 | ) | (1,162 | ) | (487 | ) | ||||||||
Foreign | (275 | ) | (192 | ) | (494 | ) | (460 | ) | ||||||||
Total deferred | (1,256 | ) | (656 | ) | (1,656 | ) | (947 | ) | ||||||||
| $ | 567 | $ | 719 | $ | 1,897 | $ | 2,169 | |||||||||
A reconciliation of the statutory federal income tax rate and effective rate as a percentage of pre-tax income was as follows:
Three months Ended June 30, | Six months Ended June 30, | |||||||||||||||||||||||||||
| 2007 | % | 2006 | % | 2007 | % | 2006 | % | |||||||||||||||||||||
U.S. | $ | (6,688 | ) | $ | (1,489 | ) | $ | (7,146 | ) | $ | (2,054 | ) | ||||||||||||||||
Foreign | 7,828 | 3,489 | 13,096 | 8,720 | ||||||||||||||||||||||||
Income before provision for income taxes | 1,140 | 2,000 | 5,950 | 6,666 | ||||||||||||||||||||||||
Tax at statutory rate | $ | 388 | 34 | $ | 680 | 34 | $ | 2,023 | 34 | $ | 2,267 | 34 | ||||||||||||||||
State income taxes, net of federal income tax benefit | (143 | ) | (13 | ) | (65 | ) | (3 | ) | (170 | ) | (3 | ) | (94 | ) | (1 | ) | ||||||||||||
Effect of tax rates on non-U.S. operations | 334 | 29 | 104 | 5 | 61 | 1 | (4 | ) | — | |||||||||||||||||||
Change in valuation allowance | (12 | ) | — | — | — | (17 | ) | — | — | — | ||||||||||||||||||
Effective tax rate | $ | 567 | 50 | $ | 719 | 36 | $ | 1,897 | 32 | $ | 2,169 | 33 | ||||||||||||||||
F-8
Table of Contents
INTCOMEX, INC. AND SUBSIDIARIES
NOTES TO CONDENSED UNAUDITED CONSOLIDATED FINANCIAL STATEMENTS—(Continued)
(Dollars in thousands, except per share data)
The Company’s deferred tax assets were attributable to the following:
June 30, 2007 | December 31, 2006 | |||||||
Deferred tax assets: | ||||||||
Current: | ||||||||
Allowance for doubtful accounts | $ | 636 | $ | 510 | ||||
Inventory | 653 | 621 | ||||||
Accrued expense | 303 | 231 | ||||||
Tax goodwill | 247 | 247 | ||||||
Current | 1,839 | 1,609 | ||||||
Non-current: | ||||||||
Tax goodwill | 1,234 | 1,358 | ||||||
Net operating loss | 2,625 | 1,391 | ||||||
Other – prepaid foreign taxes | 409 | 315 | ||||||
Valuation allowance | (560 | ) | (543 | ) | ||||
Non-current | 3,708 | 2,521 | ||||||
Total deferred tax assets | $ | 5,547 | $ | 4,130 | ||||
Deferred tax liabilities: | ||||||||
Current: | ||||||||
Leasehold improvements | (11 | ) | (27 | ) | ||||
Inventory | (208 | ) | (415 | ) | ||||
Current | $ | (219 | ) | $ | (442 | ) | ||
Non-current: | ||||||||
Fixed assets | (477 | ) | (356 | ) | ||||
Amortizable intangibles | (1,018 | ) | (1,164 | ) | ||||
Inventory | (1,337 | ) | (1,328 | ) | ||||
Non-current | $ | (2,832 | ) | $ | (2,848 | ) | ||
Total deferred tax liabilities | (3,051 | ) | (3,290 | ) | ||||
Net deferred tax asset | $ | 2,496 | $ | 840 | ||||
SBA recorded tax goodwill of approximately $9,800 in July 1998, which is being amortized for tax purposes over 15 years. As of June 30, 2007 the remaining balance of the tax goodwill was $3,937. SBA established a deferred tax asset of $262 for foreign withholding taxes paid in El Salvador during 2005. Management established a $262 valuation allowance against this asset pending further tax planning efforts to realize its full benefit.
Intcomex Colombia has a $274 deferred tax asset related to a net operating loss (NOL) carry forward. Management established a $250 valuation allowance against this deferred tax asset pending Intcomex Colombia’s further growth in taxable income. Colombia allows for an 8 year carry forward on net operating losses and expires through 2013.
The Company has State of Florida and U.S. net operating losses resulting in a deferred tax asset of $2,351 which expires in 2026. No valuation allowance has been recorded against this NOL as management believes it will fully realize the NOL.
F-9
Table of Contents
INTCOMEX, INC. AND SUBSIDIARIES
NOTES TO CONDENSED UNAUDITED CONSOLIDATED FINANCIAL STATEMENTS—(Continued)
(Dollars in thousands, except per share data)
The Company conducts business globally and, as a result, one or more of its subsidiaries files income and other tax returns in U.S. federal, state and foreign jurisdictions. In the normal course of business, the Company is subject to examination by taxing authorities in the countries in which it operates. Currently, the Company is under on going tax examinations in several countries. While such examinations are subject to inherent uncertainties, it is not currently anticipated that any such examination would have a material adverse impact on the Company’s consolidated financial statements.
The Company adopted Financial Accounting Standards Board (“FASB”) Interpretation No. 48 (“FIN No. 48”), “Accounting for Uncertainty in Income Taxes – an Interpretation of FASB Statement No. 109” in the first quarter of 2007. FIN 48 is an interpretation of FASB Statement No. 109, “Accounting for Income Taxes”, and seeks to reduce the diversity in practice associated with certain aspects of measurement and recognition in accounting for income taxes. FIN 48 prescribes a recognition threshold and measurement attribute for financial statement recognition and measurement of a tax position that an entity takes or expects to take in a tax return. Under FIN 48, an entity may only recognize or continue to recognize tax positions that meet a “more likely than not” threshold. In the ordinary course of business there is a inherent uncertainty in quantifying our income tax positions. The Company assesses its income tax positions and records tax benefits for all years subject to examination based on management’s evaluation of the facts, circumstances and information available at the reporting date. For those tax positions where it is more likely than not that a tax benefit will be sustained, the Company has recognized the largest amount of tax benefit with a greater than 50% likelihood of being realized upon ultimate settlement with a taxing authority that has full knowledge of all relevant information. For those income tax positions where it is not more likely than not that a tax benefit will be sustained, no tax benefit has been recognized in the Company’s financial statements.
The Company performed a review of its tax positions taken in accordance with FIN 48 and concluded that there were no adjustments required to uncertain tax positions. As of the adoption date, the Company did not have any unrecognized tax benefits and had no accrued interest expense or penalties related to the unrecognized tax benefits. Interest and penalties, if incurred, would be recognized as a component of income tax expense.
Note 7. Stock Based Compensation
The Company recognizes stock-based compensation expense under the provisions of SFAS No. 123R,Share-Based Payment (revised 2004), (“SFAS No. 123R”) for the stock-based compensation plan utilizing the modified prospective method. Under SFAS No. 123R, compensation cost is recognized for any awards issued, modified, repurchased, or canceled after January 1, 2006. All stock-based compensation is measured at the grant date, based on the fair value of the award, and is recognized as an expense in earnings over the requisite service period.
On February 27, 2007, options to acquire an aggregate of approximately 1,540 shares of common stock of the Company were granted under the Company’s 2007 Founders’ Grant Stock Option Plan (the “Plan) to certain management employees and non-employee directors. The options were granted at an exercise price of $1,077.00 per share, which was equal to the fair value of the Company’s common stock on the date of grant. The shares vest ratably over three years (one-third per year) and expire 10 years from the date of grant. There were no options granted during the three and six months ended June 30, 2006. The options were not dilutive during the three and six months ended June 30, 2007, and June 30, 2006.
F-10
Table of Contents
INTCOMEX, INC. AND SUBSIDIARIES
NOTES TO CONDENSED UNAUDITED CONSOLIDATED FINANCIAL STATEMENTS—(Continued)
(Dollars in thousands, except per share data)
A summary of the option activity under the Plan as of June 30, 2007, and changes during the period ended June 30, 2007, consisted of the following:
| Shares | Weighted- per Share | Number of Shares Exercisable | |||||
Outstanding at January 1, 2007 | — | — | — | ||||
Granted | 1,540 | $ | 1,077.00 | — | |||
Exercised | — | — | — | ||||
Forfeited or expired | — | — | — | ||||
Outstanding at June 30, 2007 | 1,540 | $ | 1,077.00 | — | |||
Exercisable at June 30, 2007 | — | $ | 1,077.00 | — | |||
The weighted-average grant date fair value of options granted during the three and six months ended June 30, 2007, was $565.71. There were no options granted during the three and six months ended June 30, 2006. There were no options exercised or vested during the three and six months ended June 30, 2007, and June 30, 2006.
The fair value for the options was determined using the Black-Scholes option pricing model as of the measurement date, April 23, 2007, the date the Company received unanimous approval from its shareholders for the Plan. The Black-Scholes option pricing model, a permitted valuation approach under SFAS No. 123R, was developed for use in estimating the fair value of traded options and are fully transferable. In addition, this model requires the input of subjective assumptions, including expected price volatility and term. Changes in these subjective assumptions can materially affect the fair value of the estimate, and therefore, the existing valuation models do not provide a precise measure of the fair value of the Company’s employee stock options. Projected data related to the expected volatility and expected life of stock options is typically based upon historical and other information. The fair value of the options was estimated at the date of grant using the following assumptions:
Expected term | 6 years | |
Expected volatility | 37.00% | |
Dividend yield | 0.00% | |
Risk-free investment rate | 4.58% |
The expected term of the options granted under the Plan is based on the simplified method for estimating the expected life of the options, as historical data related to the expected life of the stock options is not available. The Company used the historical volatility of the industry sector index, as it is not practicable to estimate the expected volatility of the Company’s share price. The risk-free investment rate for periods within the contractual life of the option is based on the U.S. Treasury yield curve of the same maturity in effect at the time of grant.
Total compensation costs related to stock-based compensation charged against income during the three and six months ended June 30, 2007 was $54. These costs are recorded in salaries, wages and benefits in the Condensed Unaudited Consolidated Statements of Operations. There were no compensation costs related to stock-based compensation charged against income during the three and six months ended June 30, 2006. As of June 30, 2007, there was $817 of total unrecognized compensation cost related to stock-based compensation arrangements, which is expected to be recognized over a weighted average period of approximately 3.0 years.
F-11
Table of Contents
INTCOMEX, INC. AND SUBSIDIARIES
NOTES TO CONDENSED UNAUDITED CONSOLIDATED FINANCIAL STATEMENTS—(Continued)
(Dollars in thousands, except per share data)
SFAS No. 123R also requires the Company to estimate forfeitures in calculating the expense relating to stock-based compensation. At the grant date, the Company estimated the number of shares expected to vest and will subsequently adjust compensation costs for the estimated rate of forfeitures on an annual basis. The Company will use historical data to estimate option exercise and employee termination in determining the estimated forfeiture rate. The estimated forfeiture rate applied as of the most recent option grant date in 2007 was 0% because it was the Company’s initial option grant.
Note 8. Commitments and Contingencies and Other
As part of its normal course of business, the Company is involved in certain claims, regulatory and tax matters. In the opinion of management, the final disposition of such matters will not have a material adverse impact on the Company’s results of operations and financial condition.
We incurred a net pre-tax charge of $3.8 million, including legal and accounting fees, in operating expenses ($3.7 million after tax) in the second quarter of 2007 as a result of settlements with Uruguayan regulatory authorities described below.
On June 29, 2007, our Uruguayan subsidiary, T.G.M., S.A., reached a settlement agreement with the Uruguayan tax agency Dirección General Impositiva, or the DGI, following a tax audit for the period 2002 through 2006. During this tax audit, questions were raised by the DGI about the alleged failure of two local suppliers operating through several legal entities to pay value added and other taxes in connection with the sale of certain IT products to our Uruguayan subsidiary. Our Uruguayan subsidiary cooperated fully with the audit and, based on an internal investigation, we believe our Uruguayan subsidiary has at all times complied with its tax payment obligations and properly recorded, reported and paid all taxes. At the same time, due to the possibility of significant potential fines and related legal expenses, our Uruguayan subsidiary approached the DGI seeking a resolution, and after negotiation agreed to pay the amount of UYP 53.0 million, or approximately $2.2 million, and forfeit $0.5 million in previously recognized tax credits in connection with the settlement agreement. Our Uruguayan subsidiary was also engaged in a parallel negotiation process with the Uruguayan customs authorities relating to the same time periods and facts, and entered into a similar settlement agreement with the customs authorities providing for the payment of UYP 26.2 million, or approximately $1.1 million. In connection with this $1.1 million payment, we received a credit from the customs authorities of approximately $0.3 million in connection with the cash payments to be made through the remainder 2007.
We believe that payment of the settlement amounts is the best course of action for both our Uruguayan subsidiary and us, in particular because Uruguayan tax law may in certain cases impose joint and several financial liability on us for acts committed by third parties, such as the two suppliers described above, that result in the loss of tax revenue. In addition, the settlement payments avoid the risk connected with, and the commitment of potentially significant financial and managerial resources to, potential regulatory claims.
In order to indemnify our controlling shareholder, CVC International, as required by the stock purchase agreement dated as of August 27, 2004, for the outflow of funds related to that portion of the settlement payments and certain expenses corresponding to the tax audit period from 2002 through August 31, 2004 (i.e., the closing date under the stock purchase agreement) the indemnifying shareholders agreed to reimburse the Company for their respective share of such amount. In July and early August, the Company received approximately $3.0 million cash in satisfaction of the obligations of the indemnifying parties under the 2004 stock purchase agreement with CVC International as a result of the settlement reached on June 29, 2007 with the Uruguayan tax agency.
F-12
Table of Contents
INTCOMEX, INC. AND SUBSIDIARIES
NOTES TO CONDENSED UNAUDITED CONSOLIDATED FINANCIAL STATEMENTS—(Continued)
(Dollars in thousands, except per share data)
Note 9. Additional Paid in Capital
On June 29, 2007, the Company recorded $3.0 million of additional paid in capital and a due from related parties receivable to record the indemnifying shareholders obligation to the controlling shareholder CVC International as required by the stock purchase agreement dated August 27, 2004 (the “Stock Purchase Agreement”) for the outflow of funds in connection with the settlement reached with the Uruguayan tax agency. (See Management’s Discussion and Analysis of Financial Condition and Results of Operations—Uruguay Tax Audit).
Note 10. Segment Information
The Company operates in a single industry segment, that being a distributor of information technology (“IT”) products. The Company’s operating segments are based on geographic location. Geographic areas in which the Company operated during the three and six months ended June 30, 2007 and 2006 and for the year ended December 31, 2006 include United States (sales generated and invoiced from Miami operation) and In-country (sales generated and invoiced by all of the Latin American subsidiaries). All the Latin American subsidiaries have been aggregated as one segment due to similar products, services and economic characteristics.
Inter-segment revenue primarily represents intercompany revenue between United States and In-country operations at established prices between the related companies and are eliminated in consolidation.
The measure for segment profit is operating income.
Financial information by geographic segments is as follows:
| Three months Ended June 30, | Six months Ended June 30, | |||||||||||||||
| (Unaudited) | (Unaudited) | |||||||||||||||
| 2007 | 2006 | 2007 | 2006 | |||||||||||||
Net sales: | ||||||||||||||||
United States | ||||||||||||||||
Sales to unaffiliated customers | $ | 71,626 | $ | 65,469 | $ | 146,577 | $ | 134,773 | ||||||||
Inter-segments | 80,220 | 61,015 | 148,662 | 131,667 | ||||||||||||
Total | 151,846 | 126,484 | 295,239 | 266,440 | ||||||||||||
In-country | 182,744 | 148,262 | 351,570 | 292,526 | ||||||||||||
Eliminations of Inter-segments sales | (80,220 | ) | (61,015 | ) | (148,662 | ) | (131,667 | ) | ||||||||
Total | $ | 254,370 | $ | 213,731 | $ | 498,147 | $ | 427,299 | ||||||||
Operating income (loss): | ||||||||||||||||
United States | $ | (1,734 | ) | $ | 2,628 | $ | 1,624 | $ | 5,848 | |||||||
In-country | 5,625 | 4,903 | 11,547 | 10,952 | ||||||||||||
Total | $ | 3,891 | $ | 7,531 | $ | 13,171 | $ | 16,800 | ||||||||
F-13
Table of Contents
INTCOMEX, INC. AND SUBSIDIARIES
NOTES TO CONDENSED UNAUDITED CONSOLIDATED FINANCIAL STATEMENTS—(Continued)
(Dollars in thousands, except per share data)
As of June 30, 2007 and December 31, 2006 | 2007 | 2006 | ||||
| (Unaudited) | ||||||
Assets: | ||||||
United States | $ | 171,467 | $ | 142,068 | ||
In-country | 172,982 | 150,507 | ||||
Total | $ | 344,449 | $ | 292,575 | ||
Property & equipment, net: | ||||||
United States | $ | 5,657 | $ | 3,348 | ||
In-country | 8,107 | 7,671 | ||||
Total | $ | 13,764 | $ | 11,019 | ||
Goodwill: | ||||||
United States | $ | 21,253 | $ | 21,253 | ||
In-country | 13,004 | 13,004 | ||||
Total | $ | 34,257 | $ | 34,257 | ||
Note 11. Guarantor Condensed Consolidating Financial Statements
Pursuant to Rule 3-10(f) of Regulation S-X, the Parent company has prepared condensed unaudited consolidating financial information as of June 30, 2007 and for the six months ended June 30, 2007 and 2006 for the parent company, the subsidiaries that are guarantors of the Company’s obligations under the 11 3/4% Second Priority Senior Secured Notes due 2011 on a combined basis and the non-guaranteeing subsidiaries on a combined basis. All guarantor subsidiaries are 100.0% owned subsidiaries of the Company and all guarantees are full and unconditional. The condensed consolidating financial information is as follows:
F-14
Table of Contents
INTCOMEX, INC. AND SUBSIDIARIES
NOTES TO CONDENSED UNAUDITED CONSOLIDATED FINANCIAL STATEMENTS—(Continued)
(Dollars in thousands, except per share data)
Balance Sheets as of June 30, 2007
(Unaudited)
Intcomex, Inc. (Parent) | Guarantors | Non - Guarantors | Eliminations | Intcomex, Inc. Consolidated | ||||||||||||||
ASSETS | ||||||||||||||||||
Current assets: | ||||||||||||||||||
Cash and cash equivalents | $ | 2 | $ | 35 | $ | 17,997 | $ | — | $ | 18,034 | ||||||||
Trade accounts receivable, net | — | 93,982 | 73,973 | (56,675 | ) | 111,280 | ||||||||||||
Inventories | 25,757 | 92,717 | (1,746 | ) | 116,728 | |||||||||||||
Other current assets | 56,412 | 29,130 | 31,702 | (79,478 | ) | 37,766 | ||||||||||||
Total current assets | 56,414 | 148,904 | 216,389 | (137,899 | ) | 283,808 | ||||||||||||
Property, plant and equipment, net | 1,726 | 3,932 | 8,106 | — | 13,764 | |||||||||||||
Long-term assets: | ||||||||||||||||||
Investments in subsidiaries | 108,011 | 144,577 | — | (252,588 | ) | — | ||||||||||||
Goodwill | — | 21,253 | 13,004 | — | 34,257 | |||||||||||||
Other assets | 6,766 | 1,051 | 4,803 | — | 12,620 | |||||||||||||
Total | 114,777 | 166,881 | 17,807 | (252,588 | ) | 46,877 | ||||||||||||
Total assets | $ | 172,917 | $ | 319,717 | $ | 242,302 | $ | (390,487 | ) | $ | 344,449 | |||||||
LIABILITIES AND SHAREHOLDERS’ EQUITY | ||||||||||||||||||
Current liabilities | $ | 12,898 | $ | 164,734 | $ | 138,027 | $ | (136,118 | ) | $ | 179,541 | |||||||
Long term debt, net of current maturities | 114,323 | 308 | 591 | — | 115,222 | |||||||||||||
Other long term liabilities | 63 | 1,045 | 2,945 | — | 4,053 | |||||||||||||
Total liabilities | 127,284 | 166,087 | 141,563 | (136,118 | ) | 298,816 | ||||||||||||
Commitments and Contingencies | ||||||||||||||||||
Shareholders’ equity | ||||||||||||||||||
Common stock | 1 | 3 | 1,155 | (1,158 | ) | 1 | ||||||||||||
Treasury stock | — | (3,286 | ) | (16,587 | ) | 19,873 | — | |||||||||||
Additional paid-in capital | 20,680 | 4,966 | 24,347 | (29,313 | ) | 20,680 | ||||||||||||
Accumulated retained earnings | 24,770 | 151,765 | 96,090 | (247,855 | ) | 24,770 | ||||||||||||
Dividend & deemed dividend tax | — | — | (4,885 | ) | 4,885 | — | ||||||||||||
Accumulated other comprehensive income | 182 | 182 | 619 | (801 | ) | 182 | ||||||||||||
Total stockholders’ equity | 45,633 | 153,630 | 100,739 | (254,369 | ) | 45,633 | ||||||||||||
Total liabilities and stockholders’ equity | $ | 172,917 | $ | 319,717 | $ | 242,302 | $ | (390,487 | ) | $ | 344,449 | |||||||
F-15
Table of Contents
INTCOMEX, INC. AND SUBSIDIARIES
NOTES TO CONDENSED UNAUDITED CONSOLIDATED FINANCIAL STATEMENTS—(Continued)
(Dollars in thousands, except per share data)
Statement of Operations for the six months ended June 30, 2007
(Unaudited)
Intcomex, Inc. (Parent) | Guarantors | Non - Guarantors | Eliminations | Intcomex, Inc. Consolidated | ||||||||||||||||
Revenue | $ | — | $ | 295,239 | $ | 351,570 | $ | (148,662 | ) | $ | 498,147 | |||||||||
Cost of revenue | — | 278,361 | 317,909 | (148,225 | ) | 448,045 | ||||||||||||||
Gross profit | — | 16,878 | 33,661 | (437 | ) | 50,102 | ||||||||||||||
Operating expenses | 4,990 | 9,827 | 22,114 | — | 36,931 | |||||||||||||||
Operating (loss) income | (4,990 | ) | 7,051 | 11,547 | (437 | ) | 13,171 | |||||||||||||
Other (income) expense | ||||||||||||||||||||
Interest expense (income), net | 7,791 | 430 | (59 | ) | — | 8,162 | ||||||||||||||
Other | (13,184 | ) | (13,539 | ) | (967 | ) | 26,749 | (941 | ) | |||||||||||
Total other (income) expense | (5,393 | ) | (13,109 | ) | (1,026 | ) | 26,749 | 7,221 | ||||||||||||
Income (loss) from continuing operations before income taxes | 403 | 20,160 | 12,573 | (27,186 | ) | 5,950 | ||||||||||||||
Provision for income taxes | (3,650 | ) | 2,505 | 3,042 | — | 1,897 | ||||||||||||||
Net income | $ | 4,053 | $ | 17,655 | $ | 9,531 | $ | (27,186 | ) | $ | 4,053 | |||||||||
Statement of Operations for the six months ended June 30, 2006
(Unaudited)
Intcomex, Inc. (Parent) | Guarantors | Non - Guarantors | Eliminations | Intcomex, Inc. Consolidated | |||||||||||||||
Revenue | $ | — | $ | 266,440 | $ | 292,526 | $ | (131,667 | ) | $ | 427,299 | ||||||||
Cost of revenue | — | 250,964 | 264,089 | (131,872 | ) | 383,181 | |||||||||||||
Gross profit | — | 15,476 | 28,437 | 205 | 44,118 | ||||||||||||||
Operating expenses | 1,114 | 9,005 | 17,199 | — | 27,318 | ||||||||||||||
Operating income (loss) | (1,114 | ) | 6,471 | 11,238 | 205 | 16,800 | |||||||||||||
Other (income) expense | |||||||||||||||||||
Interest expense, net | 7,646 | (34 | ) | (52 | ) | — | 7,560 | ||||||||||||
Other | (9,929 | ) | (1,678 | ) | 2,586 | 11,595 | 2,574 | ||||||||||||
Total other (income) expense | (2,283 | ) | (1,712 | ) | 2,534 | 11,595 | 10,134 | ||||||||||||
Income (loss) from continuing operations before income taxes | 1,169 | 8,183 | 8,704 | (11,390 | ) | 6,666 | |||||||||||||
Provision for income taxes | (3,328 | ) | 2,506 | 2,991 | — | 2,169 | |||||||||||||
Net income | $ | 4,497 | $ | 5,677 | $ | 5,713 | $ | (11,390 | ) | $ | 4,497 | ||||||||
F-16
Table of Contents
INTCOMEX, INC. AND SUBSIDIARIES
NOTES TO CONDENSED UNAUDITED CONSOLIDATED FINANCIAL STATEMENTS—(Continued)
(Dollars in thousands, except per share data)
Statement of Cash Flows for the six months ended June 30, 2007
(Unaudited)
Intcomex, Inc. (Parent) | Guarantors | Non - Guarantors | Eliminations | Intcomex, Inc. Consolidated | |||||||||||||||
Cash flows from (used in) operating activities: | $ | 536 | $ | (1,003 | ) | $ | (5,541 | ) | $ | — | $ | (6,008 | ) | ||||||
Cash flows from (used in) investing activities: | |||||||||||||||||||
Additions to plant and equipment, net from disposals | (767 | ) | (2,043 | ) | (1,096 | ) | — | (3,906 | ) | ||||||||||
Other | — | 16 | 475 | — | 491 | ||||||||||||||
Cash used in investing activities | (767 | ) | (2,027 | ) | (621 | ) | — | (3,415 | ) | ||||||||||
Cash flows from (used in) financing activities: | |||||||||||||||||||
Borrowings (payments), net | 231 | 2,934 | 3,558 | — | 6,723 | ||||||||||||||
Cash flows from (used in) financing activities | 231 | 2,934 | 3,558 | — | 6,723 | ||||||||||||||
Effects of exchange rate changes on cash | — | — | 160 | — | 160 | ||||||||||||||
Net increase (decrease) in cash | — | (96 | ) | (2,444 | ) | — | (2,540 | ) | |||||||||||
Cash and cash equivalents, beginning of period | 2 | 131 | 20,441 | — | 20,574 | ||||||||||||||
Cash and cash equivalents, end of period | $ | 2 | $ | 35 | $ | 17,997 | $ | — | $ | 18,034 | |||||||||
Statement of Cash Flows for the six months ended June 30, 2006
(Unaudited)
Intcomex, Inc. (Parent) | Guarantors | Non - Guarantors | Eliminations | Intcomex, Inc. Consolidated | |||||||||||||||
Cash flows from operating activities: | $ | 192 | $ | 1,196 | $ | 3,442 | $ | — | $ | 4,830 | |||||||||
Cash flows from (used in) investing activities: | |||||||||||||||||||
Additions to plant and equipment | (114 | ) | (724 | ) | (924 | ) | — | (1,762 | ) | ||||||||||
Other | — | 16 | 4 | — | 20 | ||||||||||||||
Cash used in investing activities | (114 | ) | (708 | ) | (920 | ) | — | (1,742 | ) | ||||||||||
Cash flows from (used in) financing activities: | |||||||||||||||||||
Borrowings (payments), net | — | (599 | ) | (3,567 | ) | — | (4,166 | ) | |||||||||||
Issuance of senior notes | — | 266 | 279 | — | 545 | ||||||||||||||
Cash flows from (used in) financing activities | — | (333 | ) | (3,288 | ) | — | (3,621 | ) | |||||||||||
Effects of exchange rate changes on cash | — | — | (946 | ) | — | (946 | ) | ||||||||||||
Net increase (decrease) in cash | 78 | 155 | (1,712 | ) | — | (1,479 | ) | ||||||||||||
Cash and cash equivalents, beginning of period | 34 | 89 | 12,872 | — | 12,995 | ||||||||||||||
Cash and cash equivalents, end of period | $ | 112 | $ | 244 | $ | 11,160 | $ | — | $ | 11,516 | |||||||||
F-17
Table of Contents
INTCOMEX, INC. AND SUBSIDIARIES
NOTES TO CONDENSED UNAUDITED CONSOLIDATED FINANCIAL STATEMENTS—(Continued)
(Dollars in thousands, except per share data)
Note 12. New Accounting Pronouncements
In February 2007, the Financial Accounting Standards Board, or FASB, issued Statement of Financial Accounting Standards No. 159, or SFAS 159, “The Fair Value Option for Financial Assets and Liabilities.” SFAS 159 permits companies to make an election to carry certain eligible financial assets and liabilities at fair value, even if fair value measurement has not historically been required for such assets and liabilities under U.S. GAAP. The Company is required to adopt the provisions of SFAS 159 in the first quarter of 2008. We are currently evaluating the effect SFAS 159 will have on our consolidated results of operations and financial condition.
In September 2006, FASB issued Statement of Financial Accounting Standards No. 157, or SFAS 157, Fair Value Measurements. SFAS 157 defines fair value, establishes a framework for measuring fair value in generally accepted accounting principles, and expands disclosures about fair value measurements. This pronouncement is effective for financial statements issued for fiscal years beginning after November 15, 2007. We are currently evaluating the effect SFAS 157 will have on our consolidated results of operations and financial condition.
In September 2006, the SEC staff issued Staff Accounting Bulletin No. 108, or SAB 108, “Considering the effects of Prior Year Misstatements when Quantifying Misstatements in Current Year Financial Statements.” Traditionally, there have been two widely-recognized methods for quantifying the effects of financial statement misstatements: the “roll-over” method and the “iron curtain” method. The roll-over method focuses primarily on the impact of a misstatement on the income statement, including the reversing effect of prior year misstatements. The iron-curtain method focuses primarily on the effect of correcting the period-end balance sheet with less emphasis on the reversing effects of prior year errors on the income statement. In SAB 108, the SEC staff established an approach that is commonly referred to as a “dual approach” because it now requires quantification of errors under both the iron curtain and the roll-over methods. For us, SAB 108 is effective for the fiscal year ended December 31, 2006. The adoption of SAB 108 did not have a material effect on our consolidated results of operations and financial condition.
In July 2006, the FASB issued Financial Interpretation No. 48, or FIN No. 48, “Accounting for Uncertainty in Income Taxes—An Interpretation of FASB Statement No. 109.” This interpretation prescribes a recognition threshold and measurement attribute for the financial statement recognition and measurement of a tax position taken or expected to be taken in a tax return. This interpretation also provides guidance on de-recognition, classification, interest and penalties, accounting in interim periods, disclosure and transition. FIN 48 is effective for the first quarter of fiscal years beginning after December 15, 2006 and we adopted it effective March 31, 2007. We conducted an assessment of the effect of FIN 48 on the consolidated results of operations and financial condition and the impact was immaterial.
In March 2006, the FASB issued Statement of Financial Accounting Standards No. 156, or SFAS No. 156, “Accounting for Servicing Financial Assets—an amendment of FASB Statement No. 140.” SFAS 156 requires separate recognition of a servicing asset and a servicing liability each time an entity undertakes an obligation to service a financial asset by entering into a servicing contract. This statement also requires that servicing assets and liabilities be initially recorded at fair value and subsequently be adjusted to the fair value at the end of each reporting period. SFAS 156 is effective for an entity’s first fiscal year that begins after September 15, 2006. The adoption of SFAS 156 did not have a material effect on our consolidated results of operations and financial condition.
In February 2006, the FASB issued Statement of Financial Accounting Standards No. 155, or SFAS No. 155, “Accounting for Certain Hybrid Financial Instruments, an amendment of FASB Statements No. 133 and
F-18
Table of Contents
INTCOMEX, INC. AND SUBSIDIARIES
NOTES TO CONDENSED UNAUDITED CONSOLIDATED FINANCIAL STATEMENTS—(Continued)
(Dollars in thousands, except per share data)
140.” SFAS 155 improves financial reporting by eliminating the exemption from applying SFAS 133 to interest in securitized financial assets so that similar instruments are accounted for similarly regardless of the form of the instrument. SFAS 155 also improves financial reporting by allowing a preparer to elect fair value measurement at acquisition, at issuance, or when a previously recognized financial instrument is subject to a remeasurement event, on an instrument-by-instrument basis, in cases in which a derivative would otherwise be bifurcated. At the adoption of SFAS 155, any difference between the total carrying amount of the individual components of any existing hybrid financial instrument and the fair value of the combined hybrid financial instrument should be recognized as a cumulative-effect adjustment to our beginning retained earnings. SFAS 155 is effective for us for all financial instruments acquired or issued after January 1, 2007. The adoption of SFAS 155 did not have a material effect on our consolidated results of operations and financial condition.
In May 2005, the FASB issued Statement of Financial Accounting Standards No. 154, or SFAS No. 154, Accounting Changes and Error Corrections, which supersedes APB Opinion No. 20, Accounting Changes, and SFAS No. 3, Reporting Accounting Changes in Interim Financial Statements. SFAS 154 changes the requirements for the accounting for and reporting of changes in accounting principle. The statement requires the retroactive application to prior periods’ financial statements of changes in accounting principles, unless it is impracticable to determine either the period specific effects or the cumulative effect of the change. SFAS 154 does not change the guidance for reporting the correction of an error in previously issued financial statements or the change in an accounting estimate. SFAS 154 is effective for accounting changes and corrections of errors made in fiscal years beginning after December 15, 2005. The adoption of SFAS 154 did not have a material effect on our consolidated results of operations and financial condition.
Note 13. Subsequent Events
In July and early August, 2007 the Company received approximately $3.0 million cash in satisfaction of the obligations of the indemnifying parties under the 2004 stock purchase agreement with CVC International as a result of the settlement reached on June 29, 2007 with the Uruguayan tax agency.
On August 14 and 15, 2007, the Company repurchased a total of $5.0 million of its 11 3/4% Notes in connection with its mandatory sinking fund redemption requirement.
F-19
Table of Contents
REPORT OF INDEPENDENT REGISTERED PUBLIC ACCOUNTING FIRM (BDO SEIDMAN, LLP)
Board of Directors
Intcomex, Inc. and Subsidiaries
We have audited the accompanying consolidated balance sheets of Intcomex, Inc. and Subsidiaries (the “Company”) as of December 31, 2006 and 2005, and the related consolidated statements of operations, shareholders’ equity and cash flows for each of the three years in the period ended December 31, 2006. These consolidated financial statements are the responsibility of the Company’s management. Our responsibility is to express an opinion on these consolidated financial statements based upon our audits. We did not audit the financial statements of one, three and three foreign subsidiaries in the years ended December 31, 2006, 2005 and 2004, respectively. These statements reflect total assets of approximately $34 million and $43 million as of December 31, 2006 and 2005 and total revenues of approximately $104 million, $91 million and $36 million for each of the years in the three-year period ended December 31, 2006. Those statements were audited by other auditors whose reports have been furnished to us, and our opinion, insofar as it relates to the amounts included for such subsidiaries, is based solely on the reports of the other auditors.
We conducted our audits in accordance with the standards of the Public Company Accounting Oversight Board. Those standards require that we plan and perform the audit to obtain reasonable assurance about whether the financial statements are free of material misstatement. An audit includes consideration of internal control over financial reporting as a basis for designing audit procedures that are appropriate in the circumstances, but not for the purpose of expressing an opinion on the effectiveness of the Company’s internal control over financial reporting. Accordingly, we express no such opinion. An audit also includes examining, on a test basis, evidence supporting the amounts and disclosures in the financial statements, assessing the accounting principles used and significant estimates made by management, as well as evaluating the overall financial statement presentation. We believe that our audits and the report of other auditors provide a reasonable basis for our opinion.
In our opinion, based on our audits and the report of other auditors, the consolidated financial statements referred to above present fairly, in all material respects, the consolidated financial position of Intcomex, Inc. and Subsidiaries as of December 31, 2006 and 2005, and the results of their operations and their cash flows for each of the three years in the period ended December 31, 2006, in conformity with accounting principles generally accepted in the United States of America.
/s/ BDO Seidman, LLP
Miami, Florida
March 22, 2007
F-20
Table of Contents
REPORT OF INDEPENDENT REGISTERED PUBLIC ACCOUNTING FIRM (PRICEWATERHOUSECOOPERS, S.C.)
Mexico City, January 31, 2007
To the Stockholders and the Board of Directors of
Centel, S. A. de C. V.
We have audited the accompanying balance sheets of Centel, S. A. de C. V. as of December 31, 2006 and 2005, and the related statements of income, of changes in stockholders’ equity and of cash flows for the year ended December 31, 2006, for the seven-month period ended December 31,2005 and for the five-month period ended May 31, 2005. These financial statements are the responsibility of the Company’s management. Our responsibility is to express an opinion on these financial statements based on our audits.
We conducted our audits in accordance with auditing standards of the Public Company Accounting Oversight Board (United States). Those standards require that we plan and perform the audit to obtain reasonable assurance about whether the financial statements are free of material misstatement. An audit includes examining, on a test basis, evidence supporting the amounts and disclosures in the financial statements. An audit also includes assessing the accounting principles used and significant estimates made by management, as well as evaluating the overall financial statement presentation. We believe that our audits provide a reasonable basis for our opinion.
In our opinion, the financial statements referred to above present fairly, in all material respects, the financial position of Centel, S. A. de C. V. at December 31, 2006 and 2005, and the results of its operations and its cash flows for the year ended December 31, 2006, for the seven-month period ended December 31, 2005 and for the five-month period ended May 31, 2005, in conformity with accounting principles generally accepted in the United States of America.
PricewaterhouseCoopers
/s/ Roberto Vargas Flores
Audit Partner
F-21
Table of Contents
REPORT OF INDEPENDENT AUDITORS (FIGUEROA JIMÉNEZ & CO., S.A.)
The Stockholders
INTCOMEX, S.A. de C.V.:
We have audited the accompanying balance sheet of Intcomex, S.A. de C.V., at December 31, 2005, and the related statements of income, stockholders’ equity and cash flows the years ended December 31, 2005 and 2004. These financial statements are the responsibility of the Company’s management. Our responsibility is to express an opinion on these financial statements based on our audits.
We conducted our audits in accordance with the Standards of the Public Company Accounting Oversight Board (United States). Those standards require that we plan and perform the audits to obtain reasonable assurance about whether the financial statements are free of material misstatement. An audit includes examining, on a test basis, evidence supporting the amounts and disclosures in the financial statements. An audit also includes assessing the accounting principles used and significant estimates made by management, as well as evaluating the overall financial statements presentation. We believe that our audits provide a reasonable basis for our opinion.
In our opinion, the financial statements referred to above, present fairly, in all material respects, the financial position of Intcomex, S.A. de C.V., at December 31, 2005, and the results of its operations and its cash flows for the years ended December 31, 2005 and 2004, in conformity with generally accepted accounting principles in the United States of America.
As described in note (4) to the financial statements, the Company is member of a group of affiliated and related companies, which are under the same management and control, and that have commercial relations among them.
Figueroa Jimenez & Co., S.A.
(Before Peat, Marwick Mitchell & Co. (Latin America). S.A.)
Registry N° 215
/s/ Ciro Rómulo Mejia Gonzglez
Partner
Registry N° 2234
San Salvador, El Salvador January 30, 2006.
F-22
Table of Contents
REPORT OF INDEPENDENT REGISTERED PUBLIC ACCOUNTING FIRM
(ERNST & YOUNG, LTD. CORP.)
The Board of Directors and Shareholders of
Computación Monrenca Panama, S. A.
We have audited the balance sheet of Computación Monrenca Panama, S. A. (a wholly-owned subsidiary of IXLA Holdings, Ltd.) as of December 31, 2005, and the related statements of income, shareholders’ equity and cash flows for each of the two years in the period ended December 31, 2005 (not presented separately herein). These financial statements are the responsibility of the Company’s management. Our responsibility is to express an opinion on these financial statements based on our audits.
We conducted our audits in accordance with the Standards of the Public Company Accounting Oversight Board (United States). Those standards require that we plan and perform the audit to obtain reasonable assurance about whether the financial statements are free of material misstatement. We were not engaged to perform an audit of the Company’s internal control over financial reporting. Our audits included consideration of internal control over financial reporting as a basis for designing audit procedures that are appropriate in the circumstances, but not for the purpose of expressing an opinion on the effectiveness of the Company’s internal control over financial reporting. Accordingly, we express no such opinion. An audit also includes examining, on a test basis, evidence supporting the amounts and disclosures in the financial statements, assessing the accounting principles used and significant estimates made by management, and evaluating the overall financial statement presentation. We believe that our audits provide a reasonable basis for our opinion.
In our opinion, the financial statements referred to above, present fairly, in all material respects, the financial position of Computación Monrenca Panama, S. A. at December 31, 2005, and the results of its operations and its cash flows for each of the two years in the period ended December 31, 2005, in conformity with U.S. generally accepted accounting principles.
/s/ Ernst & Young
February 17, 2006
Panama, Republic of Panama
F-23
Table of Contents
REPORT OF INDEPENDENT REGISTERED PUBLIC ACCOUNTING FIRM
(ERNST & YOUNG, LTD. CORP.)
The Board of Directors and Shareholders of
Intcomex de las Americas, S. A.
We have audited the statements of income, shareholders’ equity and cash flows of Intcomex de las Americas, S. A. (a wholly-owned subsidiary of IXLA Holdings, Ltd.) for the year ended December 31, 2004 (not presented separately herein). These financial statements are the responsibility of the Company’s management. Our responsibility is to express an opinion on these financial statements based on our audit.
We conducted our audit in accordance with the Standards of the Public Company Accounting Oversight Board (United States). Those standards require that we plan and perform the audit to obtain reasonable assurance about whether the financial statements are free of material misstatement. We were not engaged to perform an audit of the Company’s internal control over financial reporting. Our audit included consideration of internal control over financial reporting as a basis for designing audit procedures that are appropriate in the circumstances, but not for the purpose of expressing an opinion on the effectiveness of the Company’s internal control over financial reporting. Accordingly, we express no such opinion. An audit also includes examining, on a test basis, evidence supporting the amounts and disclosures in the financial statements, assessing the accounting principles used and significant estimates made by management, and evaluating the overall financial statement presentation. We believe that our audit provides a reasonable basis for our opinion.
Since the date of completion of our audit of the financial statements referred to above and initial issuance of our report thereon dated February 4, 2005, Intcomex de las Americas, S.A., as discussed in Note 7, has not had revenues and maintained its expenses that adversely affect Intcomex de las Americas, S. A.’s current results of operations and liquidity. The ability of Intcomex de las Americas, S. A. to continue as a going concern depends of the ability of its Parent Company to continue providing the necessary funding to it to continue to provide administrative and technological advisory services to related parties.
In our opinion, the financial statements referred to above, present fairly, in all material respects, the results of Intcomex de las Americas, S. A.’s operations and its cash flows for the year ended December 31, 2004, in conformity with U.S. generally accepted accounting principles.
/s/ Ernst & Young
February 4, 2005 (except for Note 7
as to which the date is August 4, 2006)
Panama, Republic of Panama
F-24
Table of Contents
INTCOMEX, INC. AND SUBSIDIARIES
CONSOLIDATED BALANCE SHEETS AS OF DECEMBER 31, 2006 AND 2005
(Dollars in thousands, except per share data)
| As of December 31, | ||||||
| 2006 | 2005 | |||||
ASSETS | ||||||
Current assets: | ||||||
Cash and cash equivalents | $ | 20,482 | $ | 12,964 | ||
Certificates of deposit-restricted | 92 | 31 | ||||
Trade accounts receivable, net of allowance for doubtful accounts of $4,066 and $4,282 | 89,290 | 71,589 | ||||
Notes and other receivables | 18,584 | 18,340 | ||||
Due from related parties | 791 | 890 | ||||
Inventories | 94,410 | 77,038 | ||||
Prepaid expenses and other | 9,100 | 10,076 | ||||
Deferred tax assets | 1,609 | 1,495 | ||||
Total current assets | $ | 234,358 | $ | 192,423 | ||
Property and equipment, net | 11,019 | 8,237 | ||||
Notes receivable | 525 | 213 | ||||
Identifiable intangible assets, net of amortization of $1,562 and $574 | 3,883 | 4,866 | ||||
Goodwill | 34,257 | 34,257 | ||||
Deferred tax assets | 2,521 | 1,831 | ||||
Other assets | 6,012 | 6,484 | ||||
Total assets | $ | 292,575 | $ | 248,311 | ||
LIABILITIES AND SHAREHOLDERS’ EQUITY | ||||||
Current Liabilities: | ||||||
Lines of credit | $ | 17,653 | $ | 5,413 | ||
Current maturities of long-term debt | 5,376 | 282 | ||||
Accounts payable | 95,972 | 80,686 | ||||
Accrued expenses | 12,039 | 7,475 | ||||
Income taxes payable | 1,117 | 2,947 | ||||
Due to related parties | 97 | 53 | ||||
Deferred tax liabilities | 442 | 404 | ||||
Other liabilities | 3,440 | 2,317 | ||||
Total current liabilities | 136,136 | 99,577 | ||||
Long-term debt, net of current maturities | 114,833 | 119,346 | ||||
Other long-term liabilities | 421 | 286 | ||||
Deferred tax liabilities | 2,848 | 3,535 | ||||
Total liabilities | 254,238 | 222,744 | ||||
Commitments and contingencies | — | — | ||||
Shareholders’ equity | ||||||
Common stock, voting $0.01 par value, 140,000 shares authorized, 100,000 issued and outstanding | 1 | 1 | ||||
Common stock, non-voting $0.01 par value, 10,000 shares authorized, 2,182 issued and outstanding | — | — | ||||
Additional paid in capital | 17,597 | 17,597 | ||||
Retained earnings | 20,717 | 7,654 | ||||
Accumulated other comprehensive income | 22 | 315 | ||||
Total shareholders’ equity | 38,337 | 25,567 | ||||
Total liabilities and shareholders’ equity | $ | 292,575 | $ | 248,311 | ||
The accompanying notes are an integral part of the consolidated financial statements.
F-25
Table of Contents
INTCOMEX, INC. AND SUBSIDIARIES
CONSOLIDATED STATEMENTS OF OPERATIONS FOR THE YEARS ENDED
DECEMBER 31, 2006, 2005 AND 2004
(Dollars in thousands, except per share data)
| Years Ended December 31, | ||||||||||||
| 2006 | 2005 | 2004 | ||||||||||
Revenue: | $ | 889,779 | $ | 716,440 | $ | 554,345 | ||||||
Cost of revenue: | 797,665 | 642,737 | 495,536 | |||||||||
Gross profit | 92,114 | 73,703 | 58,809 | |||||||||
Operating expenses: | ||||||||||||
Selling, general and administrative | 54,794 | 41,555 | 32,966 | |||||||||
Depreciation and amortization | 2,743 | 1,788 | 849 | |||||||||
Total operating expenses | 57,537 | 43,343 | 33,815 | |||||||||
Operating income | 34,577 | 30,360 | 24,994 | |||||||||
Other (income) expense: | ||||||||||||
Interest expense | 16,233 | 16,805 | 3,429 | |||||||||
Interest income | (876 | ) | (456 | ) | (153 | ) | ||||||
Other (income) expense, net | 164 | 600 | (196 | ) | ||||||||
Foreign exchange loss (Gain) | 1,099 | (1,407 | ) | (986 | ) | |||||||
Total other expense | 16,620 | 15,542 | 2,094 | |||||||||
Income before provision for income taxes and minority interest | 17,957 | 14,818 | 22,900 | |||||||||
Provision for income taxes: | 4,894 | 2,755 | 6,417 | |||||||||
Income before minority interest | 13,063 | 12,063 | 16,483 | |||||||||
Minority interest: | — | — | 314 | |||||||||
Net income | $ | 13,063 | $ | 12,063 | $ | 16,169 | ||||||
Earnings per weighted average share of common stock, voting and non-voting: | ||||||||||||
Basic | $ | 127.84 | $ | 119.28 | $ | 277.48 | ||||||
Diluted | $ | 127.84 | $ | 119.28 | $ | 277.48 | ||||||
Weighted average number of shares used in per share calculation of common stock, voting and non-voting: | ||||||||||||
Basic | 102,182 | 101,133 | 58,270 | |||||||||
Diluted | 102,182 | 101,133 | 58,270 | |||||||||
The accompanying notes are an integral part of the consolidated financial statements.
F-26
Table of Contents
INTCOMEX, INC. AND SUBSIDIARIES
CONSOLIDATED STATEMENTS OF CHANGES IN STOCKHOLDERS’ EQUITY
FOR THE YEARS ENDED DECEMBER 31, 2006, 2005 AND 2004
(Dollars in thousands, except per share data)
| Years Ended December 31, 2006, 2005 and 2004 | |||||||||||||||||||||||||||||||||||
| Members’ Equity | Common Stock | Additional Paid in capital | Retained Earnings | Accumulated Other Comprehensive Income (Loss) | Shareholders’ Equity | Comprehensive Income (Loss) | |||||||||||||||||||||||||||||
| Units | Members’ Equity | Shares | $0.01par value | ||||||||||||||||||||||||||||||||
| Voting | Non-voting | ||||||||||||||||||||||||||||||||||
Balance at December 31, 2003 | 37,405 | $ | 13,722 | — | — | — | — | 55,629 | (59 | ) | 69,292 | ||||||||||||||||||||||||
Net income thru August 31, 2004 | — | — | — | — | — | — | 11,729 | — | 11,729 | 11,729 | |||||||||||||||||||||||||
Liquidation of Holdco Carribbean, LDC | (37,405 | ) | (13,722 | ) | — | — | — | — | (67,358 | ) | 59 | (81,021 | ) | ||||||||||||||||||||||
Capitalization of Incomex, Inc. by existing shareholders | — | — | 67,073 | — | 1 | 13,723 | (8,865 | ) | — | 4,859 | |||||||||||||||||||||||||
Common stock repurchases | — | — | (5,904 | ) | — | — | (3,944 | ) | — | — | (3,944 | ) | |||||||||||||||||||||||
Issuance of common stock, net of expenses of $1,121 | — | — | 38,831 | — | — | 24,818 | — | — | 24,818 | ||||||||||||||||||||||||||
Other | — | — | — | — | — | — | 16 | — | 16 | 16 | |||||||||||||||||||||||||
Net income from September 1 through December 31, 2004 | — | — | — | — | — | — | 4,440 | — | 4,440 | 4,440 | |||||||||||||||||||||||||
Total comprehensive income | 16,185 | ||||||||||||||||||||||||||||||||||
Balance at December 31, 2004 | — | $ | — | 100,000 | 0 | 1 | 34,597 | (4,409 | ) | — | 30,189 | ||||||||||||||||||||||||
Issuance of common stock in connection with Cartel re-acquisition | — | — | — | 2,182 | — | 3,000 | — | — | 3,000 | ||||||||||||||||||||||||||
Dividends | — | — | — | — | — | (20,000 | ) | — | — | (20,000 | ) | ||||||||||||||||||||||||
Net income | — | — | — | — | — | — | 12,063 | — | 12,063 | 12,063 | |||||||||||||||||||||||||
Foreign currency translation | — | — | — | — | — | 315 | 315 | 315 | |||||||||||||||||||||||||||
Total comprehensive income | $ | 12,378 | |||||||||||||||||||||||||||||||||
Balance at December 31, 2005 | — | $ | — | 100,000 | 2,182 | $ | 1 | $ | 17,597 | $ | 7,654 | $ | 315 | $ | 25,567 | ||||||||||||||||||||
Net income | — | — | — | — | — | — | 13,063 | — | 13,063 | 13,066 | |||||||||||||||||||||||||
Foreign currency translation | — | — | — | — | — | — | — | (293 | ) | (293 | ) | (293 | ) | ||||||||||||||||||||||
Total comprehensive income | $ | 12,770 | |||||||||||||||||||||||||||||||||
Balance at December 31, 2006 | — | $ | — | 100,000 | 2,182 | $ | 1 | $ | 17,597 | $ | 20,717 | $ | 22 | $ | 38,337 | ||||||||||||||||||||
The accompanying notes are an integral part of the consolidated financial statements.
F-27
Table of Contents
INTCOMEX, INC. AND SUBSIDIARIES
CONSOLIDATED STATEMENTS OF CASH FLOWS FOR THE YEARS ENDED
DECEMBER 31, 2006, 2005 AND 2004
(Dollars in thousands, except per share data)
| Years ended December 31, | ||||||||||||
| 2006 | 2005 | 2004 | ||||||||||
Cash flows from operating activities: | ||||||||||||
Net income | $ | 13,063 | $ | 12,063 | $ | 16,169 | ||||||
Adjustments to reconcile net income to net cash provided by (used in) operating activities: | ||||||||||||
Depreciation expense | 1,755 | 1,214 | 849 | |||||||||
Amortization of intangibles | 988 | 574 | — | |||||||||
Amortization of deferred loan costs | 1,333 | 3,029 | 162 | |||||||||
Bad debt expense | 1,265 | 1,491 | 1,756 | |||||||||
Inventory obsolescence expense | 1,417 | 1,332 | 659 | |||||||||
Deferred tax (benefit) expense | (1,455 | ) | (950 | ) | 678 | |||||||
Gain on sale of property and equipment | (2 | ) | (18 | ) | (24 | ) | ||||||
Minority interest | — | — | 314 | |||||||||
Other | — | — | (23 | ) | ||||||||
Change in operating assets and liabilities net of assets acquired: | ||||||||||||
(Increase) decrease in: | ||||||||||||
Trade accounts receivables | (17,485 | ) | (12,706 | ) | (17,284 | ) | ||||||
Other receivables | (244 | ) | (4,028 | ) | (1,329 | ) | ||||||
Inventories | (18,789 | ) | (16,213 | ) | (17,723 | ) | ||||||
Prepaid expenses and other assets | (484 | ) | (8,975 | ) | (4,646 | ) | ||||||
Due from related parties | 99 | (641 | ) | 220 | ||||||||
Increase (decrease) in: | ||||||||||||
Accounts payable | 15,286 | 6,709 | 16,051 | |||||||||
Income taxes payable | (1,830 | ) | 1,007 | 632 | ||||||||
Due to related parties | 44 | 270 | — | |||||||||
Accrued expenses and other | 5,147 | 5,108 | (149 | ) | ||||||||
Net cash provided by (used in) operating activities | 108 | (10,734 | ) | (3,688 | ) | |||||||
Cash flows from investing activities: | ||||||||||||
Additions to property and equipment | (4,824 | ) | (2,874 | ) | (1,496 | ) | ||||||
Purchase of minority interests | — | (203 | ) | (2,727 | ) | |||||||
Proceeds from disposition of assets | 289 | 37 | 507 | |||||||||
Restricted cash and short-term investments | (61 | ) | 499 | 470 | ||||||||
Notes receivables | (312 | ) | 356 | (69 | ) | |||||||
Acquisitions, net of cash acquired | — | (11,866 | ) | — | ||||||||
Net cash used in investing activities | (4,908 | ) | (14,051 | ) | (3,315 | ) | ||||||
Cash flows from financing activities: | ||||||||||||
Borrowings under line of credit, net | 12,240 | (4,358 | ) | 243 | ||||||||
Borrowings of notes payable | 371 | 120,535 | 41,057 | |||||||||
(Payments) of notes payable | — | (65,645 | ) | (1,582 | ) | |||||||
Proceeds from issuance of common stock, net | — | — | 17,687 | |||||||||
Distributions to shareholders | — | (20,000 | ) | (55,954 | ) | |||||||
Net cash provided by financing activities | 12,611 | 30,532 | 1,451 | |||||||||
Effect of foreign currency exchange rates | (293 | ) | 315 | — | ||||||||
Net increase (decrease) in cash | 7,518 | 6,062 | (5,552 | ) | ||||||||
Cash and cash equivalents, beginning of period | 12,964 | 6,902 | 12,454 | |||||||||
Cash and cash equivalents, end of period | $ | 20,482 | $ | 12,964 | $ | 6,902 | ||||||
The accompanying notes are an integral part of the consolidated financial statements.
F-28
Table of Contents
INTCOMEX, INC. AND SUBSIDIARIES
CONSOLIDATED STATEMENTS OF CASH FLOWS FOR THE YEARS ENDED
DECEMBER 31, 2006, 2005 AND 2004—(Continued)
(Dollars in thousands, except per share data)
| Years Ended December 31, | |||||||||
| 2006 | 2005 | 2004 | |||||||
Supplemental disclosure of cash flow information: | |||||||||
Cash paid during the period for: | |||||||||
Interest | $ | 13,300 | $ | 7,892 | $ | 1,956 | |||
Taxes | $ | 7,361 | $ | 6,471 | $ | 5,555 | |||
Non-cash investing activities: | |||||||||
Acquisition of fixed assets by Intcomex Peru through cancellation of accounts receivable | $ | — | $ | — | $ | 838 | |||
Capital leases | $ | 356 | $ | 199 | $ | 97 | |||
Non-cash financing activities: | |||||||||
Issuance of Sellers Notes A & B | $ | — | $ | — | $ | 20,000 | |||
Issuance of Sellers Note C for acquisition of Centel | $ | — | $ | 2,750 | $ | — | |||
Capitalization of Intcomex by existing stockholders | $ | — | $ | — | $ | 4,859 | |||
Issuance of non-voting common stock to selling stockholders for acquisition of Centel | $ | — | $ | 3,000 | $ | — | |||
Issuance of common shares to foreign and minority stockholders’ in Holdings, LLC | $ | — | $ | — | $ | 5,722 | |||
The accompanying notes are an integral part of the consolidated financial statements.
F-29
Table of Contents
INTCOMEX, INC. AND SUBSIDIARIES
NOTES TO AUDITED CONSOLIDATED FINANCIAL STATEMENTS
(Dollars in thousands, except per share data)
| NOTE 1. | Summary of Significant Accounting Policies |
Nature of Operations
The subsidiaries comprising Intcomex, Inc., a Delaware company (the “Company”), are international distributors of computer equipment and peripherals, and include the accounts of Intcomex Holdings, LLC (Parent Company of SBA and IXLA), Intcomex Holdings SPC-1, LLC (Parent Company of Centel, S.A. de C.V., a Mexican company), Software Brokers of America, Inc. (“SBA”) and IXLA Holdings, Ltd. (“IXLA”). IXLA is the holding company of fourteen separate subsidiaries located in Central America, South America and the Caribbean.
Basis of Presentation
In August 2004, the Company went through a restructuring. At that time, Holdco Caribbean LDC (“Parent”), a company organized under the laws of the Cayman Islands, BWI, was the parent company of Intcomex Holdings, LLC (“Holdings”). All domestic management shareholders of Parent, representing 37.12% of the total shareholders of Parent, held their investment in Parent through a Florida corporation called Eccounting, Inc. On August 13, 2004 Intcomex, Inc. was incorporated in the State of Delaware. As part of the restructuring, Parent was liquidated and distributed 100% of its investment in Holdings to Parent’s shareholders. The shareholders of Eccounting, Inc. agreed to merge with Intcomex, Inc. by contributing their 67,073 shares and their equity of $4,859 to the formation of the Company. The Company then repurchased 5,904 common shares from certain domestic shareholders for $3,944. In addition, on August 31, 2004 certain foreign management investors purchased 10,675 shares of common stock for $7,131 and Citigroup Venture Capital (“CVC”) purchased 28,156 shares of common stock for $18,808, less transaction fees of $1,121, to complete the capitalization of the Company.
As of August 31, 2004, CVC had acquired directly from the Company common stock, representing a 28.2% stake in the Company, and acquired indirectly from existing Company stockholders an additional 24.3% for a total of 52.5% ownership in the Company. The remaining 47.5% of the Company is held by domestic and foreign management shareholders.
The consolidated financial statements reflect Intcomex, Inc. and its subsidiaries as the new reporting entity for all periods presented.
Principles of Consolidation
The consolidated financial statements include the accounts of Intcomex, Inc. and its subsidiaries. All significant intercompany accounts have been eliminated in consolidation.
At December 31, 2006, the Company has two wholly-owned subsidiaries; Intcomex Holdings, LLC and Intcomex Holdings SPC-I, LLC (“SPC-I”). Holdings has two wholly owned subsidiaries as follows:
Software Brokers of America, Inc.
IXLA Holdings, Ltd., a limited time duration company located in Cayman Islands.
F-30
Table of Contents
INTCOMEX, INC. AND SUBSIDIARIES
NOTES TO AUDITED CONSOLIDATED FINANCIAL STATEMENTS—(Continued)
The following subsidiaries are 100.0% owned by IXLA:
Intcomex Argentina SRL – Located in Argentina
Intcomex S.A. – Located in Chile
| • | Intcomex Iquique S.A. |
| • | Sociedad de Inversiones y Financiamiento TC, S.A. |
Intcomex Colombia LTDA – Located in Colombia
Intcomex Costa Rica Mayorista en Equipo de Computo, S.A. – Located in Costa Rica
Intcomex de Ecuador, S.A. – Located in Ecuador
| • | Hurricane Systems, S.A. |
Intcomex El Salvador, S.A. – Located in El Salvador
Intcomex de Guatemala, S.A. (formerly Centel, S.A.) – Located in Guatemala
Intcomex Jamaica Ltd. – Located in Jamaica
Inset Finance Ltd. – Located in Cayman Islands
Computacion Monrenca Panama, S.A. – Located in Panama
Intcomex Peru, S.A.C. – Located in Peru
| • | DTMK Inmobiliaria S.A. C. – Located in Peru |
T.G.M., S.A. – Located in Uruguay
Pontix Trading S.A. – Located in Uruguay
Intcomex De Las Americas, S.A. – Located in Panama
SPC-I has one wholly owned subsidiary:
Centel, S.A. de C.V. – located in México
| • | Compañía de Servicios IMSC, S. de R.L. de C.V. |
Accounting Estimates
The Company prepares its financial statements in conformity with accounting principles generally accepted in the United States of America. These principles require management to make estimates and assumptions that affect the reported amounts of assets and liabilities and disclosure of contingent assets and liabilities at the date of the financial statements and the reported amounts of revenues and expenses during the reporting period. On an on-going basis, we review and evaluate our estimates and assumptions, including, but not limited to, those that
F-31
Table of Contents
INTCOMEX, INC. AND SUBSIDIARIES
NOTES TO AUDITED CONSOLIDATED FINANCIAL STATEMENTS—(Continued)
relate to accounts receivable, inventories, goodwill, intangibles and other long lived assets, income taxes, and contingencies and litigation. Actual results could differ from those estimates.
Foreign Currency
The U.S. dollar is considered the functional currency in all of the Company’s foreign operations except for Mexico where the functional currency is the Mexican peso. Non-monetary balance sheet amounts are translated at historical exchange rates. Other balance sheet amounts are translated at the exchange rates in effect at the balance sheet date. Statements of operations accounts, excluding those items of income and expenses that relate to non-monetary assets and liabilities, are translated at the average exchange rate for the month. Re-measurement adjustments are included in the determination of net income under the caption “Foreign Exchange (Gain) Loss.” Translation adjustments related to our Mexican subsidiary are recorded in accumulated other comprehensive income in the consolidated statement of stockholders’ equity.
In the accompanying consolidated statements of operations a foreign exchange loss of $1,099 was included for the year ended December 31, 2006 and foreign exchange gains of $1,407 and $986 were included for the years ended December 31, 2005 and 2004, respectively. These amounts include the effect of foreign currency re-measurement, realized foreign currency transaction gains and losses and changes in the value of foreign currency denominated accounts receivable and accounts payable.
No material U.S. dollar foreign exchange forward contracts were outstanding at December 31, 2006 and 2005.
Cash Equivalents
The Company considers all highly liquid investments purchased with an original maturity of three months or less to be cash equivalents.
Revenue Recognition
Revenue is recognized once the following criteria are met: the Company has persuasive evidence that an arrangement exists; delivery must have occurred, which happens at the point of shipment (this includes the transfer of both title and risk of loss, provided that no significant obligations remain); the price is fixed and determinable; and collectibility is reasonably assured.
The Company allows its customers to return defective products for exchange or credit within 30 days of delivery based on the warranty of the Original Equipment Manufacturer (OEM). An exception is infrequently made for long-standing customers with current accounts, on a case-by-case basis and upon approval by management. A return is recorded in the period of the return because, based on our past experience, such returns are infrequent and immaterial.
Shipping and handling costs billed to customers are included in revenue and related costs are included in the cost of sales.
In accordance with Emerging Issues Task Force Issue 06-03:How Taxes Collected from Customers and Remitted to Governmental Authorities Should Be Presented in the Income Statement (That Is, Gross Versus Net Presentation), the Company’s revenues are reported net of any sales, gross receipts or value added taxes (“VAT”).
The Company extends a warranty for products to customers with the same terms as the OEM’s warranty to the Company. All product related warranty costs incurred by the Company are reimbursed by OEMs.
F-32
Table of Contents
INTCOMEX, INC. AND SUBSIDIARIES
NOTES TO AUDITED CONSOLIDATED FINANCIAL STATEMENTS—(Continued)
Accounts Receivable
The Company maintains an allowance for doubtful accounts for estimated losses resulting from the inability of its customers to make required payments. In estimating the required allowance, the Company takes into consideration the overall quality and aging of the accounts, the existence of credit insurance and specifically identified customer risks. If actual customer performance were to deteriorate to an extent not expected, additional allowances may be required which could have an adverse effect on the Company’s financial performance. Uncollectible accounts are written-off annually against the allowance.
Vendor Programs
We receive funds from vendors for price protection, product rebates, marketing and promotions and competitive programs, which are recorded as adjustments to product costs or SG&A expenses according to the nature of the program. Some of these programs may extend over one or more quarterly reporting periods. We recognize rebates or other vendor incentives as earned based on sales of qualifying products or as services are provided in accordance with the terms of the related program. We provide reserves for receivables on vendor programs for estimated losses resulting from vendors’ inability to pay or rejections of claims by vendors.
Inventories
Inventories, consisting entirely of finished goods, are stated at the lower of cost or market. Cost is determined primarily on the first-in, first-out (“FIFO”) method. Some of the Company’s foreign affiliates use the average cost method which approximates FIFO due to the availability of “price protection” guarantees with many vendors on a significant portion of their inventory. The Company operates in an industry characterized by the continuous introduction of new products, rapid technological advances and product obsolescence. The Company continuously evaluates the salability of its inventories and has developed incentive sales programs for slow moving items.
Rebates earned on products sold are recognized when the product is shipped to a third party customer and is recorded as a reduction to cost of sales in accordance with Emerging Issues Task Force (“EITF”) 02-16 “Accounting by a Customer (Including a Reseller) for Certain Consideration Received from a Vendor”.
Deferred Loan Costs
Deferred loan costs are amortized over the life of the applicable indebtedness using the straight-line method which approximates the effective interest method. Deferred loan costs, net of accumulated amortization, amounted to $5,060 and $5,136 at December 31, 2006 and 2005, respectively, and are included in Other assets in the accompanying balance sheets.
Property and Equipment
Property and equipment are stated at cost. Depreciation is computed using straight-line and accelerated methods based on the estimated economic lives of the related assets as follows:
| Years | ||
Buildings and leasehold improvements | 30 –39 | |
Office furniture, vehicles and equipment | 5 – 7 | |
Warehouse equipment | 5 – 7 | |
Software | 5 |
F-33
Table of Contents
INTCOMEX, INC. AND SUBSIDIARIES
NOTES TO AUDITED CONSOLIDATED FINANCIAL STATEMENTS—(Continued)
Long-Lived Assets
The Company reviews long-lived assets and definite-lived intangibles for impairment whenever events or changes in circumstances indicate that the carrying amount of an asset may not be recoverable. If the carrying amount of an asset exceeds the asset’s fair value, the Company measures and records an impairment loss for the excess. An asset’s fair value is assessed by determining the expected future undiscounted cash flows of the asset. The Company’s long-lived assets are primarily composed of property and equipment.
There are numerous uncertainties and inherent risks in conducting business, such as but not limited to general economic conditions, actions of competitors, ability to manage growth, actions of regulatory authorities, pending investigations and/or litigation, customer demand and risk relating to international operations. Adverse effects from these risks may result in adjustments to the carrying value of the Company’s assets and liabilities in the future including, but not necessarily limited to, long-lived assets.
Goodwill
The Company’s goodwill represents the excess of the purchase price over the fair value of the net assets of acquired businesses. The Company assesses goodwill for impairment on an annual basis, or sooner if events indicate such a review is necessary. Based on this assessment, the Company determined that no impairment of its assets existed as of December 31, 2006 or 2005. As of December 31, 2006, the Company is not aware of any items or events that would cause it to adjust the recorded value of goodwill for impairment. Potential impairment exists if the fair value of a reporting unit to which goodwill has been allocated, is less than the carrying value of the reporting unit. The amount of the impairment to recognize, if any, is calculated as the amount by which the carrying value of the goodwill exceeds its implied value. Future changes in the estimates used to conduct the impairment review, including revenue projections, market values and changes in the discount rate used could cause the analysis to indicate that the Company’s goodwill is impaired in subsequent periods and result in a write-off of a portion of or all of the goodwill. The discount rate used is based on the Company’s capital mix and an estimated market premium. The assumptions used in estimating revenue projections are consistent with internal planning.
There are numerous uncertainties and inherent risks in conducting business, such as but not limited to general economic conditions, actions of competitors, ability to manage growth, actions of regulatory authorities, pending investigations and/or litigation, customer demand and risk relating to international operations. Adverse effects from these risks may result in adjustments to the carrying value of the Company’s assets and liabilities in the future including, but not necessarily limited to, goodwill.
Income Taxes
Income taxes are accounted for under the provisions of Statement of Financial Accounting Standards (“SFAS”) No. 109, “Accounting for Income Taxes.” Under SFAS No. 109, deferred tax assets and liabilities are determined based on the differences between the financial statement and tax basis of assets and liabilities as measured by the enacted tax rates which will be in effect when these differences reverse. Valuation allowances are established when necessary to reduce deferred tax assets to the amount expected to be realized.
Undistributed earnings of certain international subsidiaries are indefinitely reinvested. No provision has been made for income taxes that might be payable upon the remittance of such indefinitely reinvested earnings. Upon distribution of those earnings, the Company would be subject to withholding taxes payable to the various foreign countries. The Company has not determined the amount of tax liability associated with an unplanned distribution of these permanently reinvested earnings.
F-34
Table of Contents
INTCOMEX, INC. AND SUBSIDIARIES
NOTES TO AUDITED CONSOLIDATED FINANCIAL STATEMENTS—(Continued)
Comprehensive Income (Loss)
Statement of Financial Accounting Standards No. 130, “Reporting Comprehensive Income” (“SFAS 130”) establishes standards for reporting and displaying comprehensive income and its components in the Company’s consolidated financial statements. Comprehensive income is defined in SFAS 130 as the change in equity (net assets) of a business enterprise during a period from transactions and other events and circumstances from non-owner sources and is comprised of net income and other comprehensive income (loss).
Fair Value of Financial Instruments
The Company believes that carrying amounts of cash and cash equivalents, certificates of deposit, trade accounts receivables, other receivables, accounts payable and accrued expenses approximate fair value because of the short-term nature of these financial instruments. The fair value of short-term and long-term debt approximates market, as the interest rates on these financial instruments approximate current rates available to the Company.
Earnings per Share
The Company reports both basic earnings per share (“Basic EPS”) and diluted earnings per share (“Diluted EPS”). Basic EPS excludes dilution and is computed by dividing net income by the weighted average number of common shares outstanding during the period. Diluted EPS reflects the potential dilution that could occur if stock options and warrants and other commitments to issue common stock were exercised using the treasury stock method or the if-converted method was applicable. The Company has no stock options, warrants or other commitments to issue common stock at this time.
The Company has two classes of common stock: voting and non-voting. Common stock, voting and common stock, non-voting have substantially identical rights with respect to any dividends or distributions of cash or property declared on shares of common stock and rank equally as to the right to receive proceeds on liquidation or dissolution of the Company after the payment of the Company’s indebtedness.
The Company uses the two-class method for calculating earnings per share because both classes have the same rights in dividends. Basic and diluted earnings per share of common stock, voting and non-voting are the same.
The following table sets forth the computation of basic and diluted earnings per weighted average share of common stock, voting and common stock, non-voting:
For the Years Ended December 31, | |||||||||
| 2006 | 2005 | 2004 | |||||||
Basic and diluted earnings per share - numerator: | |||||||||
Net income | $ | 13,063 | $ | 12,063 | $ | 16,169 | |||
Denominator: | |||||||||
Denominator for basic earnings per share - weighted average shares | 102,182 | 101,133 | 58,270 | ||||||
Effect of dilutive securities: | |||||||||
Stock options | — | — | — | ||||||
Denominator for diluted earnings per share - adjusted weighted average shares | 102,182 | 101,133 | 58,270 | ||||||
Basic earnings per common share | $ | 127.84 | $ | 119.28 | $ | 277.48 | |||
Diluted earnings per common share | $ | 127.84 | $ | 119.28 | $ | 277.48 | |||
F-35
Table of Contents
INTCOMEX, INC. AND SUBSIDIARIES
NOTES TO AUDITED CONSOLIDATED FINANCIAL STATEMENTS—(Continued)
New Accounting Pronouncements
In February 2007, the Financial Accounting Standards Board (“FASB”) issued Statement of Financial Accounting Standards (“SFAS”) No. 159, The Fair Value for Financial Assets and Financial Liabilities. This Statement permits entities to choose to measure financial assets and liabilities, with certain exceptions, at fair value at specified election dates. A business entity shall report unrealized gains and losses on items for which the fair value option has been elected in earnings at each subsequent reporting date. This Statement is effective as of the beginning of an entity’s first fiscal year that begins after November 15, 2007. The Company has not determined the effect, if any, that the adoption of SFAS No. 159 will have on its consolidated financial condition.
In September 2006, the FASB issued SFAS No. 158, Employers’ Accounting for Defined Benefit Pension and Other Postretirement Plans. This Statement requires an employer to recognize the over-funded or under-funded status of a defined benefit postretirement plan (other than a multiemployer plan) as an asset or liability in its statement of financial position and to recognize changes in that funded status in the year in which the changes occur through comprehensive income. This statement also requires an employer to measure the funded status of a plan as of the date of its year-end statement of financial position, with limited exceptions. An employer with publicly traded equity securities is required to initially recognize the funded status of a defined benefit postretirement plan and to provide the required disclosures as of the end of the fiscal year ending after December 15, 2006. The requirement to measure plan assets and benefit obligations as of the date of the employer’s fiscal year-end statement of financial position is effective for fiscal years ending after December 15, 2008. The adoption of SFAS No. 158 does not have a material impact on the Company’s consolidated financial condition as it has no pension obligations.
In September 2006, the Financial Accounting Standards Board (“FASB”) issued SFAS No. 157, Fair Value Measurements. SFAS 157 defines fair value, establishes a framework for measuring fair value in generally accepted accounting principles, and expands disclosures about fair value measurements. This pronouncement is effective for financial statements issued for fiscal years beginning after November 15, 2007. The Company is currently evaluating the effect SFAS 157 will have on its consolidated results of operations and financial condition.
In September 2006, the Securities and Exchange Commission (“SEC”) staff issued Staff Accounting Bulletin No. 108 (“SAB 108”), “Considering the effects of Prior Year Misstatements when Quantifying Misstatements in Current Year Financial Statements.” Traditionally, there have been two widely-recognized methods for quantifying the effects of financial statement misstatements: the “roll-over” method and the “iron curtain” method. The roll-over method focuses primarily on the impact of a misstatement on the income statement, including the reversing effect of prior year misstatements. The iron-curtain method focuses primarily on the effect of correcting the period-end balance sheet with less emphasis on the reversing effects of prior year errors on the income statement. In SAB 108, the SEC staff established an approach that is commonly referred to as a “dual approach” because it now requires quantification of errors under both the iron curtain and the roll-over methods. For the Company, SAB 108 is effective for the fiscal year ended December 31, 2006. The adoption of SAB 108 did not have a material effect on the Company’s consolidated results of operations and financial condition.
In July 2006, the FASB issued Financial Interpretation No. 48 (“FIN No. 48”), “Accounting for Uncertainty in Income Taxes – An Interpretation of FASB Statement No. 109.” This interpretation prescribes a recognition threshold and measurement attribute for the financial statement recognition and measurement of a tax position taken or expected to be taken in a tax return. This Interpretation also provides guidance on de-recognition, classification, interest and penalties, accounting in interim periods, disclosure and transition. FIN 48 is effective for the first quarter of fiscal years beginning after December 15, 2006. The Company has conducted a preliminary assessment of the effect FIN 48 will have on its consolidated results of operations and financial condition and expects the impact to be immaterial.
F-36
Table of Contents
INTCOMEX, INC. AND SUBSIDIARIES
NOTES TO AUDITED CONSOLIDATED FINANCIAL STATEMENTS—(Continued)
In March 2006, the FASB issued SFAS No. 156, “Accounting for Servicing Financial Assets – an amendment of FASB Statement No. 140.” SFAS 156 requires separate recognition of a servicing asset and a servicing liability each time an entity undertakes an obligation to service a financial asset by entering into a servicing contract. This statement also requires that servicing assets and liabilities be initially recorded at fair value and subsequently be adjusted to the fair value at the end of each reporting period. SFAS 156 is effective for an entity’s first fiscal year that begins after September 15, 2006. The Company does not expect the adoption of SFAS 156 to have a material impact on its consolidated results of operations and financial condition.
In February 2006, the FASB issued SFAS No. 155, “Accounting for Certain Hybrid Financial Instruments, an amendment of FASB Statements No. 133 and 140”. SFAS 155 improves financial reporting by eliminating the exemption from applying SFAS 133 to interest in securitized financial assets so that similar instruments are accounted for similarly regardless of the form of the instrument. SFAS 155 also improves financial reporting by allowing a preparer to elect fair value measurement at acquisition, at issuance, or when a previously recognized financial instrument is subject to a remeasurement event, on an instrument-by-instrument basis, in cases in which a derivative would otherwise be bifurcated. At the adoption of SFAS 155, any difference between the total carrying amount of the individual components of any existing hybrid financial instrument and the fair value of the combined hybrid financial instrument should be recognized as a cumulative-effect adjustment to our beginning retained earnings. SFAS 155 is effective for us for all financial instruments acquired or issued after January 1, 2007. The Company does not expect the adoption of SFAS 155 to have a material impact on its consolidated results of operations and financial condition.
In May 2005, the FASB issued SFAS 154, Accounting Changes and Error Corrections, a replacement of APB Opinion No. 20 and FASB Statement No. 3. The Statement requires retrospective application to prior periods’ financial statements of a voluntary change in accounting principle unless it is deemed impracticable, unless the change in accounting relates to the principle method of depreciation, amortization, or depletion for long-lived, non-financial assets in which case the change is accounted for as a change in accounting estimate that is affected by a change in accounting principle. The Statement is effective for accounting changes and corrections of errors made occurring in fiscal years beginning after December 15, 2005. The adoption of SFAS No. 154 did not have a material impact on the Company’s consolidated results of operations and financial condition.
In March 2005, the SEC issued Staff Accounting Bulletin No. 107 (“SAB 107”), “Share-Based Payment,” providing guidance on option valuation methods, the accounting for income tax effects of share-based payment arrangements upon adoption of SFAS 123R, and the disclosures in Management’s Discussion and Analysis of Financial Condition and Results of Operations subsequent to the adoption. The Company will provide SAB 107 required disclosures upon adoption of SFAS 123R. The Company is currently evaluating SAB 107 and will be incorporating it as part of its adoption of SFAS 123R in 2007 when the Company incorporates a share based incentive program.
Reclassifications
Certain 2005 and 2004 amounts have been reclassified to conform to the 2006 presentation.
| Note 2. | Acquisitions |
Mexico
On June 23, 2005 the Company acquired a 100.0% interest in Centel, S.A. de C.V. (Centel), a distributor of IT products and peripherals located in Mexico, in order to establish an in-country presence in the second largest market of Latin America. After exploring several opportunities, the Company determined that Centel was the best option for re-establishing this presence based on, among other things, Centel’s well-established presence in the market, performance and market share. The acquisition price was $19,750, of which $14,000 was paid in
F-37
Table of Contents
INTCOMEX, INC. AND SUBSIDIARIES
NOTES TO AUDITED CONSOLIDATED FINANCIAL STATEMENTS—(Continued)
cash, $3,000 was in newly issued non-voting shares (2,182) of the Company’s common stock and $2,750 was in seller notes. As of December 31, 2005 Centel has been included into the accompanying consolidated balance sheet. For the twelve months ended December 31, 2005 Centel’s results of operations have been included in the consolidated statement of operations since June 23, 2005, the date of acquisition.
The following is a summary of the purchase price allocation as of the date of acquisition:
Cash and cash equivalents | $ | 4,294 | ||
Accounts receivable | 3,766 | |||
Notes and other receivables | 160 | |||
Inventories | 7,607 | |||
Prepaid expenses and other current assets | 161 | |||
Property and equipment | 753 | |||
Identifiable intangible assets | 5,440 | |||
Goodwill | 8,809 | |||
Accounts payable and other liabilities | (8,776 | ) | ||
Purchase Price | $ | 22,214 | ||
In connection with the acquisition, the Company paid approximately $1,745 in accordance with the purchase agreement and incurred approximately $719 of expenses. These amounts have been recorded as additional purchase price. The Company has performed a valuation of the assets and liabilities of Centel S.A. de C.V. in order to complete the final purchase price allocation. The valuation was completed in December, 2005 and the purchase price allocation was pushed down to the subsidiary level in consolidation.
Of the $5,440 in acquired identifiable intangible assets, $3,630 was for purchased customer relationships with a 10 year useful life, $1,080 was for tradenames with a 3.5 year weighted average useful life and $730 for non-compete agreements with a 3 year useful life. For the years ended December 31, 2006 and 2005, the Company recorded $988 and $574 in amortization expense related to these intangible assets, respectively.
For the year ended December 31, 2006 Centel’s results of operations have been included in the consolidated statement of operations. The following table shows the (unaudited) pro forma consolidated results of operations for the years ended December 31, 2005 and 2004, respectively. They have been prepared as if the acquisition of Centel, S.A. de C.V. had occurred at January 1, 2004. In connection with the acquisition, certain expenses, mainly executive salaries, building lease expenses and interest expense associated with the increased level of indebtedness related to the acquisition, have been included in the pro forma results. In addition, intercompany revenue has been eliminated.
| Year ended December 31, | ||||||
| 2005 | 2004 | |||||
Revenue | $ | 753,293 | $ | 621,189 | ||
Income before income taxes and minority interest | 15,582 | 23,771 | ||||
Net income | 12,506 | 16,974 | ||||
Net income per share – Basic | $ | 122.39 | $ | 280.79 | ||
Net income per share – Diluted | $ | 122.39 | $ | 280.79 | ||
Weighted average shares – Basic | 102,182 | 60,452 | ||||
Weighted average shares – Diluted | 102,182 | 60,452 | ||||
F-38
Table of Contents
INTCOMEX, INC. AND SUBSIDIARIES
NOTES TO AUDITED CONSOLIDATED FINANCIAL STATEMENTS—(Continued)
| Note 3. | Business and Credit Concentrations |
The Company principally sells products to a large base of resellers throughout Latin America and to agents in the United States for export to Latin America and the Caribbean. Credit risk on trade receivables is diversified over several geographic areas and a large number of customers. No one customer accounts for more than 2.0% and 2.9% of sales for the years ended December 31, 2006 and 2005, respectively. The Company provides trade credit to its customers in the normal course of business. The collection of a substantial portion of the Company’s receivables is susceptible to changes in Latin American economies and political climates. The Company monitors its exposure for credit losses and maintains allowances for anticipated losses after giving consideration to delinquency data, historical loss experience, and economic conditions impacting the industry. The financial condition of its customers and the related allowance for doubtful accounts is continually reviewed by management.
Prior to extending credit, a customer’s financial history is analyzed and, if appropriate, forms of personal guarantees are obtained. SBA uses credit insurance and makes provisions for estimated credit losses. The insurance contract is with EULER American Credit Indemnity Company. The current policy expires July 31, 2007. This credit insurance policy covers trade sales to non-affiliated buyers. The policy’s aggregate limit is $20,000 with a total deductible of $500. In addition, 10.0% to 20.0% buyer coinsurance provisions apply, as well as sub-limits in coverage on a per-buyer and on a per-country basis.
In some countries there are risks of continuing periodic devaluations of local currencies. In these countries, no hedging mechanism exists. The Company’s risks in these countries are that such devaluations could cause economic loss and negatively impact future sales since its product costs would increase in local terms after such devaluations.
The Company currently purchases from various suppliers located in the United States and the Far East. Sales of products purchased from two vendors each representing 14.8% and 11.3%, 14.8% and 13.1% and 14.0% and 11.5% of the Company’s revenue for the year ended December 31, 2006, 2005 and 2004, respectively.
| Note 4. | Property and Equipment |
Property and equipment consisted of the following at December 31, 2006 and 2005:
December 31, 2006 | December 31, 2005 | |||||||
Land | $ | 374 | $ | 222 | ||||
Building and leasehold improvements | 5,517 | 4,754 | ||||||
Office furniture, vehicles and equipment | 7,494 | 6,656 | ||||||
Warehouse equipment | 1,277 | 780 | ||||||
Software | 2,833 | 1,287 | ||||||
| 17,495 | 13,699 | |||||||
Less accumulated depreciation and amortization | (6,476 | ) | (5,462 | ) | ||||
| $ | 11,019 | $ | 8,237 | |||||
Property and equipment included approximately $1,569 and $1,314 of capitalized leases at December 31, 2006 and 2005, respectively.
F-39
Table of Contents
INTCOMEX, INC. AND SUBSIDIARIES
NOTES TO AUDITED CONSOLIDATED FINANCIAL STATEMENTS—(Continued)
| Note 5. | Goodwill and Intangible Assets |
Goodwill
The change in the Company’s goodwill balance as of December 31, 2006 reflects the following transactions:
Balance as of December 31, 2003 | $ | 21,253 | |
Purchase of minority interests in Costa Rica, Ecuador and Jamaica | 3,992 | ||
Balance as of December 31, 2004 | $ | 25,245 | |
Centel—acquisition | 8,809 | ||
Intcomex Colombia—acquisition of minority interest | 175 | ||
Other—Jamaica acquisition of minority interest fees | 28 | ||
Balance as of December 31, 2005 | $ | 34,257 | |
Balance as of December 31, 2006 | $ | 34,257 | |
Identifiable Intangible Assets
The identifiable intangible assets balance consists of the following amounts:
As of December 31, 2006 | Gross Carrying Amount | Accumulated Amortization | Net Carrying Amount | Useful Life | ||||||||
Customer relationships | $ | 3,630 | $ | (575 | ) | $ | 3,055 | 10.0 | ||||
Tradenames | 1,080 | (599 | ) | 481 | 3.5 | |||||||
Non-compete agreements | 730 | (385 | ) | 345 | 3.0 | |||||||
Sub-total | $ | 5,440 | $ | (1,559 | ) | $ | 3,881 | |||||
Patents—Uruguay | 5 | (3 | ) | 2 | ||||||||
Total | $ | 5,445 | $ | (1,562 | ) | $ | 3,883 | |||||
As of December 31, 2005 | Gross Carrying Amount | Accumulated Amortization | Net Carrying Amount | Useful Life | ||||||||
Customer relationships | $ | 3,630 | $ | (212 | ) | $ | 3,418 | 10.0 | ||||
Tradenames | 1,080 | (220 | ) | 860 | 3.5 | |||||||
Non-compete agreements | 730 | (142 | ) | 588 | 3.0 | |||||||
Total | $ | 5,440 | $ | (574 | ) | $ | 4,866 | |||||
As of December 31, 2006, expected future identifiable intangible asset amortization is as follows:
Fiscal Years:
2007 | $ | 827 | |
2008 | 573 | ||
2009 | 471 | ||
2010 | 408 | ||
2011 | 363 | ||
Thereafter | 1,241 | ||
| $ | 3,883 | ||
F-40
Table of Contents
INTCOMEX, INC. AND SUBSIDIARIES
NOTES TO AUDITED CONSOLIDATED FINANCIAL STATEMENTS—(Continued)
| NOTE 6. | Lines of Credit |
Outstanding lines of credit as of December 31, 2006 and 2005 consisted of the following:
December 31, 2006 | December 31, 2005 | |||||
SBA – Miami | $ | 16,617 | $ | 1,084 | ||
TGM S.A. (Uruguay) | 628 | 100 | ||||
Intcomex Peru S.A.C | 260 | 835 | ||||
Intcomex Colombia LTDA | 76 | 53 | ||||
Intcomex Chile S.A. | 72 | 2,891 | ||||
Intcomex de Guatemala S.A. | — | 450 | ||||
Total lines of credit | $ | 17,653 | $ | 5,413 | ||
Miami
On August 25, 2005, Software Brokers of America, Inc. (“SBA”) entered into a new $25,000 revolving credit facility with Comerica Bank. The interest rate on the facility is Prime less 0.75% (effectively 7.50% at December 31, 2006) or Eurodollar plus 1.9% and has a maturity date of August 25, 2008. The facility is collateralized with 100.0% of the accounts receivable, inventory and other assets of SBA. Amounts borrowed under the revolver may be repaid and re-borrowed at anytime during the term of the agreement with the bank. Borrowing capacity is established monthly based on certain parameters established by the agreement.
Advances under the line of credit are provided based on 85.0% of eligible domestic accounts receivables and 67.5% of eligible foreign accounts receivable plus 60.0% of eligible domestic inventory less any credit facility reserves.
The above credit facility contains certain financial and non-financial covenants, including but not limited to, maintenance of a minimum level of tangible effective net worth, as defined and annual limitations on capital expenditures.
At December 31, 2006, the Company was in compliance with its tangible effective net worth and capital expenditure financial covenants. However, in September 2006 the Company was in default under its credit agreement with Comerica Bank due to the payments made by SBA to the Company on the intercompany loan that was restricted under the subordination agreement to the credit agreement. The Company asked for and on November 2, 2006 obtained certain waivers and amendments to the credit agreement and the subordination agreement from Comerica Bank. The amendments to the credit and subordination agreements allow SBA to make these payments to the Company for the remaining $22,608. In addition, the Company must maintain a minimum level of tangible effective net worth of at least $37.0 million (which minimum level shall decline from the end of the fourth fiscal quarter of 2006 to the end of the fourth fiscal quarter of 2007 to $25.0 million and remain at $25.0 million thereafter).
As of December 31, 2006 and 2005 the total amounts outstanding under the Comerica credit facility were $10,862 and $1,084, respectively. Amounts available, based on collateral limitations, were $11,938 and $23,916, respectively. Included in the balance at December 31, 2006 and 2005 were $5,755 and $1,084, respectively, of outstanding checks issued in excess of bank balances.
Uruguay
TGM S.A. (Intcomex Uruguay) has two lines of credit with local financial institutions totaling $900. The lines are collateralized with a guarantee from Intcomex Holdings, LLC. As of December 31, 2006 and 2005 the outstanding balances were $628 and $100, respectively. Amounts available, based upon collateral limitations, were $272 and $800, respectively. Both lines expire on April 30, 2007. The lines carry an interest rate of 7.0%.
F-41
Table of Contents
INTCOMEX, INC. AND SUBSIDIARIES
NOTES TO AUDITED CONSOLIDATED FINANCIAL STATEMENTS—(Continued)
Peru
Intcomex Peru S.A.C. has four lines of credit with two financial institutions totaling $1,030. The lines are secured with a guarantee from Intcomex Holdings, LLC. As of December 31, 2006 and December 31, 2005 the outstanding balance was $260 and $556, respectively. In addition, $279 in discounted invoices were outstanding with the banks at December 31, 2005. The interest rates range between 5.0% and 10.0%.
Colombia
Intcomex Colombia has an unsecured revolving line of credit with a local financial institution for cash overdrafts. As of December 31, 2006 and 2005, Intcomex Colombia had outstanding balances of $76 and $53, respectively. The lines carry an interest rate of 24.0%.
Chile
Intcomex, S.A.—Chile has an unsecured 30 day revolving line of credit with Banco BBVA totaling $72 and $2,891 as of December 31, 2006 and 2005, respectively. Included in the outstanding balance was $186 of outstanding checks issued in excess of bank balances at December 31, 2005. The line carries an interest rate of 4.3% and matures on May 1, 2007.
Guatemala
Intcomex de Guatemala, S.A. has two unsecured credit lines totaling $1,500 which are used to provide financing to certain qualifying third party customers. As of December 31, 2006 Intcomex de Guatemala, S.A. had no outstanding balance. A balance of $450 was outstanding as of December 31, 2005. The line of credit was renewed for $2,000 in 2007 and expires on January 14, 2008. This line carried and interest rate of 6.0% and the renewed rate is 7.0%.
| Note 7. | Notes Payable and Long-term Debt |
Long-term debt consisted of the following:
| December 31, 2006 | December 31, 2005 | |||||
On August 25, 2005 Intcomex, Inc. completed a high-yield note offering for $120,000 less an original issuance discount of $1,132 with an interest rate of 11.75% (effective rate of 12.0%) due January 15, 2011. Per the covenants, the Company is required to either redeem or repurchase $5,000 of notes each August beginning in 2007 through 2009. The facility is collateralized with a second priority lien on essentially all assets of Software Brokers of America, Inc. and 100.0% of the capital stock of certain domestic subsidiaries and 65.0% of the capital stock of all the foreign restricted subsidiaries. | $ | 119,151 | $ | 118,942 | ||
Intcomex Chile S.A. has lease contracts collateralized by land and building improvements located in Chile. These leasing contracts expire at various dates through 2007. The leases have an interest rate of 10.0%. | 150 | 240 | ||||
Intcomex Peru, S.A.C. purchased a warehouse building in April 2006 and financed the purchase with a five year note that carries an interest rate of 8.25% and matures in April 2011. The note is collateralized with a mortgage on the building. | 353 | — | ||||
Other, including various capital leases | 555 | 446 | ||||
Total long-term debt | $ | 120,209 | $ | 119,628 | ||
Less current portion | 5,376 | 282 | ||||
Long-term debt | $ | 114,833 | $ | 119,346 | ||
F-42
Table of Contents
INTCOMEX, INC. AND SUBSIDIARIES
NOTES TO AUDITED CONSOLIDATED FINANCIAL STATEMENTS—(Continued)
Annual maturities of long-term debt from December 31, 2006 are as follows:
2007 | $ | 5,376 | |
2008 | 5,489 | ||
2009 | 5,080 | ||
2010 | 80 | ||
2011 and thereafter | 104,184 | ||
| $ | 120,209 | ||
In connection with the $120,000 high-yield notes offering, the board of directors declared and approved the payment of a $20,000 dividend to shareholders of record on August 25, 2005.
| Note 8. | Income Taxes |
Income tax provision for the years ended December 31, 2006, 2005 and 2004 consist of the following:
| 2006 | 2005 | 2004 | |||||||||
Current (benefit) expense | |||||||||||
Federal and State | $ | (129 | ) | $ | (828 | ) | $ | 2,967 | |||
Foreign | 6,478 | 4,533 | 2,772 | ||||||||
Total current | 6,349 | 3,705 | 5,739 | ||||||||
Deferred (benefit) expense | |||||||||||
Federal and State | (733 | ) | (512 | ) | 220 | ||||||
Foreign | (722 | ) | (438 | ) | 458 | ||||||
Total deferred (benefit) expense | (1,455 | ) | (950 | ) | 678 | ||||||
| $ | 4,894 | $ | 2,755 | $ | 6,417 | ||||||
A reconciliation of the statutory federal income tax rate and effective rate as a percentage of pre-tax income was as follows:
| 2006 Amount | % | 2005 Amount | % | 2004 Amount | % | ||||||||||||||||
U.S. | $ | (2,438 | ) | $ | (2,589 | ) | $ | 7,101 | |||||||||||||
Foreign | 20,395 | 17,407 | 15,799 | ||||||||||||||||||
Income before provision for income taxes | $ | 17,957 | $ | 14,818 | $ | 22,900 | |||||||||||||||
Tax at statutory rate | $ | 6,105 | 34 | $ | 5,038 | 34 | $ | 7,786 | 34 | ||||||||||||
State income taxes, net of federal income tax benefit | (137 | ) | (1 | ) | (138 | ) | (1 | ) | 415 | 2 | |||||||||||
Effect of tax rates on non-U.S. operations | (1,043 | ) | (6 | ) | (2,233 | ) | (15 | ) | (1,784 | ) | (8 | ) | |||||||||
Change in valuation allowance | (31 | ) | — | 88 | 1 | — | — | ||||||||||||||
Effective tax rate | $ | 4,894 | 27 | $ | 2,755 | 19 | $ | 6,417 | 28 | ||||||||||||
F-43
Table of Contents
INTCOMEX, INC. AND SUBSIDIARIES
NOTES TO AUDITED CONSOLIDATED FINANCIAL STATEMENTS—(Continued)
The Company’s deferred tax assets (liabilities) were attributable to the following:
| December 31, 2006 | December 31, 2005 | |||||||
Deferred tax assets: | ||||||||
Current: | ||||||||
Allowance for doubtful accounts | $ | 510 | $ | 558 | ||||
Inventory | 621 | 545 | ||||||
Accrued expense | 231 | 145 | ||||||
Tax goodwill | 247 | 247 | ||||||
Current | 1,609 | 1,495 | ||||||
Non-current: | ||||||||
Tax goodwill | 1,358 | 1,605 | ||||||
Net operating loss | 1,391 | 412 | ||||||
Other – prepaid foreign | ||||||||
Taxes | 315 | 326 | ||||||
Valuation allowance | (543 | ) | (512 | ) | ||||
Non-current | 2,521 | 1,831 | ||||||
Total deferred tax assets | $ | 4,130 | $ | 3,326 | ||||
Deferred tax liabilities: | ||||||||
Current: | ||||||||
Leasehold Improvements | $ | (27 | ) | $ | — | |||
Inventories | (415 | ) | (404 | ) | ||||
Current | $ | (442 | ) | $ | (404 | ) | ||
Non-current: | ||||||||
Fixed assets | (356 | ) | (235 | ) | ||||
Amortizable Intangibles | (1,164 | ) | (1,460 | ) | ||||
Inventories | (1,328 | ) | (1,840 | ) | ||||
Non-current | (2,848 | ) | (3,535 | ) | ||||
Total deferred tax liabilities | (3,290 | ) | (3,939 | ) | ||||
Net deferred tax asset | $ | 840 | $ | (613 | ) | |||
The Company’s subsidiary Software Brokers of America, Inc. (SBA) recorded tax goodwill of approximately $9,800 in July 1998, which is being amortized for tax purposes over 15 years. As of December 31, 2006 the remaining balance of the tax goodwill was $4,265. At December 31, 2004 there was a $600 valuation allowance against such deferred tax asset that was reversed in 2005 as management determined that future projected taxable income will be sufficient to realize the deferred tax asset. SBA established a deferred tax asset of $262 for foreign withholding taxes paid in El Salvador during 2005. Management established a $262 valuation allowance against this asset pending further tax planning efforts to realize its full benefit.
Intcomex Colombia has a $274 deferred tax asset related to a net operating loss (NOL) carry forward. Management established a $250 valuation allowance against this deferred tax asset pending Intcomex Colombia’s further growth in taxable income. Colombia allows for an 8 year carry forward on net operating losses and expires through 2013.
F-44
Table of Contents
INTCOMEX, INC. AND SUBSIDIARIES
NOTES TO AUDITED CONSOLIDATED FINANCIAL STATEMENTS—(Continued)
The Company has State of Florida and U.S. net operating losses resulting in a deferred tax asset of $1,117, which expires in 2026. No valuation allowance has been recorded against this NOL as management believes it will fully realize the NOL.
| Note 9. | Commitments and Contingencies |
Litigation
In the normal course of business, the Company is subject to litigation. In the opinion of management, the ultimate resolution of these litigations will not have a material adverse effect on the consolidated financial statements.
Leases
The Company leases office, warehouse facilities, and warehouse equipment expiring through 2011. In May 2006, the Company entered into a new 10 year lease for 221,021 square feet of office and warehouse space in Miami, Florida. The commencement date of the lease is May 1, 2007 with a base rent expense of approximately $146 and an annual 3.0% escalation clause. A summary of future minimum lease payments as of December 31, 2006 are as follows:
2007 | $ | 4,366 | |
2008 | 3,927 | ||
2009 | 3,848 | ||
2010 | 3,617 | ||
2011 and thereafter | 15,072 | ||
| $ | 30,830 | ||
For the years ended December 31, 2006, 2005 and 2004 rent expense was $3,337, $2,837 and $2,289, respectively.
| Note 10. | Related Party Transactions |
Due from Related Parties
The Company sells merchandise to and purchases Internet access from IFX Corporation, whose Chairman is both a stockholder of the Company and of IFX Corporation. The total amount paid to IFX for Internet access services for the years ended December 31, 2006, 2005 and 2004 was $353, $232 and $73, respectively. The Company sold $67, $118 and $409 worth of merchandise to IFX in 2006, 2005 and 2004, respectively. The trade receivables of IFX Corporation are guaranteed by a former shareholder of the Company. The outstanding receivable balance as of December 31, 2006 and 2005 was $1,158 and $1,403, respectively.
Leases
The Company leases warehouse and office space in Mexico City, Mexico from two shareholders for approximately $23 per month. The lease has a 10 year term expiring January 1, 2015 and has an increase provision based upon the official inflation rate in Mexico (INPC). In addition, the Company has an option to purchase the building for $2.75 million which expires on June 1, 2008.
| Note 11. | Segments |
The Company operates in a single industry segment, that being a distributor of IT products. The Company’s operating segments are based on geographic location. Geographic areas in which the Company operated during
F-45
Table of Contents
INTCOMEX, INC. AND SUBSIDIARIES
NOTES TO AUDITED CONSOLIDATED FINANCIAL STATEMENTS—(Continued)
the years ended December 31, 2006, 2005 and 2004 include United States (sales generated and invoiced from Miami operation) and In-country (sales generated and invoiced by all of the Latin American subsidiaries). All the Latin American subsidiaries have been aggregated as one segment due to similar products and economic characteristics. The Company sells one type at product line (IT products). It is a distributor of IT products and does not provide any separately billable services. It is impracticable for the Company to report the revenues from external customers for the group of similar products within the product line because the general ledger used to prepare the Company’s financial statements does not track sales by product.
Inter-segment revenue primarily represents intercompany revenue between United States and In-country operations at established prices between the related companies and are eliminated in consolidation.
The measure for segment profit is operating income.
Financial information by geographic segments is as follows:
| Years Ended December 31, | ||||||||||||
| 2006 | 2005 | 2004 | ||||||||||
Revenue | ||||||||||||
Miami | ||||||||||||
Revenue to unaffiliated customers(1) | $ | 266,790 | $ | 246,573 | $ | 200,881 | ||||||
Intersegment | 267,125 | 220,583 | 171,800 | |||||||||
Total Miami | 533,915 | 467,156 | 372,681 | |||||||||
In-country | 622,989 | 469,867 | 353,464 | |||||||||
Eliminations of intersegment revenue | (267,125 | ) | (220,583 | ) | (171,800 | ) | ||||||
Total revenue | $ | 889,779 | $ | 716,440 | $ | 554,345 | ||||||
Operating income | ||||||||||||
Miami | $ | 13,030 | $ | 13,706 | $ | 9,790 | ||||||
In-country | 21,547 | 16,654 | 15,204 | |||||||||
Total operating income | $ | 34,577 | $ | 30,360 | $ | 24,994 | ||||||
| As of December 31, | ||||||||||||
| 2006 | 2005 | |||||||||||
Total assets | ||||||||||||
Miami | $ | 142,068 | $ | 120,987 | ||||||||
In-country | 150,507 | 127,324 | ||||||||||
Total assets | $ | 292,575 | $ | 248,311 | ||||||||
Total property & equipment | ||||||||||||
Miami | $ | 3,348 | $ | 1,645 | ||||||||
In-country | 7,671 | 6,592 | ||||||||||
Total property & equipment | $ | 11,019 | $ | 8,237 | ||||||||
Total goodwill | ||||||||||||
Miami | $ | 21,253 | $ | 21,253 | ||||||||
In-country | 13,004 | 13,004 | ||||||||||
Total goodwill | $ | 34,257 | $ | 34,257 | ||||||||
| (1) | For purposes of geographic disclosure, revenue is attributable to the country in which the Company’s individual business resides. |
F-46
Table of Contents
INTCOMEX, INC. AND SUBSIDIARIES
NOTES TO AUDITED CONSOLIDATED FINANCIAL STATEMENTS—(Continued)
| Note 12. | Subsequent Events |
On February 27, 2007 the Company’s Board of Directors approved a 2007 Founders’ Grant Stock Option Plan for a limited group of management employees and directors of the board. The plan is a one-time grant with a three year vesting period and a ten year exercise period. The Company does not expect the incremental expense associated with this grant to have a material impact to its results of operation. The plan is pending final shareholder approval.
| Note 13. | Guarantor Condensed Consolidating Financial Statements |
Pursuant to Rule 3-10(f) of Regulation S-X, the Parent company has prepared condensed consolidating financial information as of December 31, 2006 and 2005, respectively, for the parent company, the subsidiaries that are guarantors of the Company’s obligations under the 11 3/4% Second Priority Senior Secured Notes due 2011 on a combined basis and the non-guaranteeing subsidiaries on a combined basis.
All guarantor subsidiaries are 100.0% owned subsidiaries of the Company and all guarantees are full and unconditional.
Software Brokers of America, Inc., as a guarantor of the 11 3/4% Second Priority Senior Secured Notes due 2011, has certain limitations on paying dividends to the Parent company under its $25.0 million credit facility with Comerica Bank. Software Brokers of America, Inc. must maintain a senior debt to tangible effective net worth ratio of not more than 2.5 to 1.0 and tangible effective net worth, (as defined and amended on November 2, 2006) of at least $37.0 million (which minimum level shall decline from the end of the third fiscal quarter of 2006 to the end of the third fiscal quarter of 2007 to $25.0 million and remain at $25.0 million thereafter).
The indenture governing the notes and the security documents provide that, in the event that Rule 3-16 of Regulation S-X under the Securities Act (or any successor regulation) requires the filing with the SEC of separate financial statements of any of the Company’s subsidiaries the capital stock of which is pledged as collateral securing the notes, the portion (or, if necessary, all) of such capital stock necessary to eliminate such filing requirement will automatically be deemed released and not to have been part of the collateral securing the notes.
The Rule 3-16 requirement to file with the SEC separate financial statements of a subsidiary is triggered if the aggregate principal amount, par value, or book value of the capital stock as carried by the registrant, or the market value of such capital stock, whichever is greatest, equals 20 percent or more of the principal amount of the notes. These values are calculated by using a discounted cash flow model that combines the unlevered free cash flows from our annual five-year business plan plus a terminal value based upon the final year EBITDA of that business plan which is then multiplied by a multiple based upon comparable companies’ implied multiples, validated by third-party experts, to arrive at an enterprise value. Existing debt, net of cash on hand, is then subtracted to arrive at estimated market value.
F-47
Table of Contents
INTCOMEX, INC. AND SUBSIDIARIES
NOTES TO AUDITED CONSOLIDATED FINANCIAL STATEMENTS—(Continued)
Balance Sheet as of December 31, 2006
INTCOMEX (PARENT) | GUARANTORS | NON-GUARANTORS | ELIMINATIONS | INTCOMEX INC. CONSOLIDATED | ||||||||||||||
Current assets: | ||||||||||||||||||
Cash and equivalents | $ | 2 | $ | 131 | $ | 20,349 | $ | — | $ | 20,482 | ||||||||
Certificates of deposit | — | — | 92 | — | 92 | |||||||||||||
Accounts receivable, net | — | 73,494 | 61,586 | (45,790 | ) | 89,290 | ||||||||||||
Inventories | — | 29,223 | 66,348 | (1,161 | ) | 94,410 | ||||||||||||
Other | 62,593 | 27,756 | 28,247 | (88,512 | ) | 30,084 | ||||||||||||
Total Current Assets | 62,595 | 130,604 | 176,622 | (135,463 | ) | 234,358 | ||||||||||||
Property, plant and equipment, less accumulated depreciation | 1,139 | 2,209 | 7,671 | — | 11,019 | |||||||||||||
Long-term assets | ||||||||||||||||||
Investments in subsidiaries | 94,665 | 130,852 | — | (225,517 | ) | — | ||||||||||||
Goodwill | — | 21,253 | 13,004 | — | 34,257 | |||||||||||||
Other | 6,039 | 1,158 | 5,743 | 1 | 12,941 | |||||||||||||
Total long term assets | 100,704 | 153,263 | 18,747 | (225,516 | ) | 47,198 | ||||||||||||
Total assets | $ | 164,438 | $ | 286,076 | $ | 203,040 | $ | (360,979 | ) | $ | 292,575 | |||||||
Liabilities and shareholders’ equity | ||||||||||||||||||
Current liabilities | 11,931 | 149,680 | 108,642 | (134,117 | ) | 136,136 | ||||||||||||
Long-term debt, net of current portion | 114,151 | 359 | 323 | — | 114,833 | |||||||||||||
Deferred tax liability – long term | 19 | 221 | 2,608 | — | 2,848 | |||||||||||||
Other long-term liabilities | — | — | 421 | — | 421 | |||||||||||||
Total liabilities | 126,101 | 150,260 | 111,994 | (134,117 | ) | 254,238 | ||||||||||||
Shareholders’ equity | ||||||||||||||||||
Common stock | 1 | 3 | 1,155 | (1,158 | ) | 1 | ||||||||||||
Treasury stock | — | (3,286 | ) | (16,587 | ) | 19,873 | — | |||||||||||
Additional paid in capital | 17,597 | 4,966 | 24,347 | (29,313 | ) | 17,597 | ||||||||||||
Retained earnings | 20,717 | 134,111 | 86,558 | (220,669 | ) | 20,717 | ||||||||||||
Dividend and deemed dividend tax | — | — | (4,885 | ) | 4,885 | — | ||||||||||||
Accumulated other comprehensive income | 22 | 22 | 458 | (480 | ) | 22 | ||||||||||||
Total stockholders equity | 38,337 | 135,816 | 91,046 | (226,862 | ) | 38,337 | ||||||||||||
Total liabilities and Shareholders’ equity | $ | 164,438 | $ | 286,076 | $ | 203,040 | $ | (360,979 | ) | $ | 292,575 | |||||||
F-48
Table of Contents
INTCOMEX, INC. AND SUBSIDIARIES
NOTES TO AUDITED CONSOLIDATED FINANCIAL STATEMENTS—(Continued)
Statement of Operations for the Year Ended December 31, 2006
| INTCOMEX INC. (PARENT) | GUARANTORS | NON-GUARANTORS | ELIMINATIONS | INTCOMEX INC. CONSOLIDATED | |||||||||||||||
Revenue | $ | — | $ | 533,915 | $ | 622,989 | $ | (267,125 | ) | $ | 889,779 | ||||||||
Cost of revenue | — | 501,393 | 562,990 | (266,718 | ) | 797,665 | |||||||||||||
Gross profit | — | 32,522 | 59,999 | (407 | ) | 92,114 | |||||||||||||
Operating expenses | 2,702 | 16,790 | 38,045 | — | 57,537 | ||||||||||||||
Operating income (loss) | (2,702 | ) | 15,732 | 21,954 | (407 | ) | 34,577 | ||||||||||||
Other (income) and expense Interest expense, net | 15,364 | 117 | (124 | ) | — | 15,357 | |||||||||||||
Other | (24,355 | ) | (24,774 | ) | 1,276 | 49,116 | 1,263 | ||||||||||||
Total other (income) expenses | (8,991 | ) | (24,657 | ) | 1,152 | 49,116 | 16,620 | ||||||||||||
Income (loss) from continuing operations before income taxes | 6,289 | 40,389 | 20,802 | (49,523 | ) | 17,957 | |||||||||||||
Provision for income taxes | (6,774 | ) | 5,943 | 5,725 | — | 4,894 | |||||||||||||
Net income (loss) | $ | 13,063 | $ | 34,446 | $ | 15,077 | $ | (49,523 | ) | $ | 13,063 | ||||||||
Statement of Cash Flows for the Year Ended December 31, 2006
| INTCOMEX INC. (PARENT) | GUARANTORS | NON-GUARANTORS | ELIMINATIONS | INTCOMEX INC. CONSOLIDATED | |||||||||||||||
Cash flows from operating activities | $ | 1,083 | $ | (15,782 | ) | $ | 14,807 | $ | — | $ | 108 | ||||||||
Cash flows from investing activities | |||||||||||||||||||
Additions to plant and equipment | (1,115 | ) | (1,006 | ) | (2,703 | ) | — | (4,824 | ) | ||||||||||
Other | — | 16 | (100 | ) | — | (84 | ) | ||||||||||||
Cash used in investing activities | (1,115 | ) | (990 | ) | (2,803 | ) | — | (4,908 | ) | ||||||||||
Cash flows from financing activities | |||||||||||||||||||
Net borrowings (repayments) | — | 16,618 | (4,378 | ) | 12,240 | ||||||||||||||
Borrowings of notes payable | — | 196 | 175 | — | 371 | ||||||||||||||
Other | — | — | — | — | — | ||||||||||||||
Cash flows from financing activities | — | 16,814 | (4,203 | ) | — | 12,611 | |||||||||||||
Effects of exchange rate changes on cash | — | — | (293 | ) | — | (293 | ) | ||||||||||||
| (32 | ) | 42 | 7,508 | — | 7,518 | ||||||||||||||
Cash and cash equivalents, beginning of period | 34 | 89 | 12,841 | — | 12,964 | ||||||||||||||
Cash and cash equivalents, end of period | $ | 2 | $ | 131 | $ | 20,349 | — | $ | 20,482 | ||||||||||
F-49
Table of Contents
INTCOMEX, INC. AND SUBSIDIARIES
NOTES TO AUDITED CONSOLIDATED FINANCIAL STATEMENTS—(Continued)
Balance Sheet as of December 31, 2005
INTCOMEX (PARENT) | GUARANTORS | NON- GUARANTORS | ELIMINATIONS | INTCOMEX INC. CONSOLIDATED | ||||||||||||||
Current assets: | ||||||||||||||||||
Cash and equivalents | $ | 34 | $ | 89 | $ | 12,841 | $ | — | $ | 12,964 | ||||||||
Certificates of deposit | — | — | 31 | — | 31 | |||||||||||||
Accounts receivable, net | — | 59,446 | 45,061 | (32,918 | ) | 71,589 | ||||||||||||
Inventories | — | 28,224 | 49,717 | (903 | ) | 77,038 | ||||||||||||
Other | 73,626 | 57,871 | 27,445 | (128,141 | ) | 30,801 | ||||||||||||
Total Current Assets | 73,660 | 145,630 | 135,095 | (161,962 | ) | 192,423 | ||||||||||||
Property, plant and equipment, less accumulated depreciation | — | 1,645 | 6,592 | — | 8,237 | |||||||||||||
Long-term assets | ||||||||||||||||||
Investments in subsidiaries | 70,471 | 106,385 | 9,058 | (185,914 | ) | — | ||||||||||||
Goodwill | — | 21,253 | 13,004 | — | 34,257 | |||||||||||||
Other | 5,274 | 1,415 | 6,705 | — | 13,394 | |||||||||||||
Total long term assets | 75,745 | 129,053 | 28,767 | (185,914 | ) | 47,651 | ||||||||||||
Total assets | $ | 149,405 | $ | 276,328 | $ | 170,454 | $ | (347,876 | ) | $ | 248,311 | |||||||
Liabilities and shareholders’ equity | ||||||||||||||||||
Current liabilities | 4,897 | 174,401 | 81,250 | (160,970 | ) | 99,577 | ||||||||||||
Long term debt, net of current portion | 118,941 | 215 | 190 | — | 119,346 | |||||||||||||
Deferred tax liability – long-term | — | 130 | 3,406 | (1 | ) | 3,535 | ||||||||||||
Other long term liabilities | — | — | 287 | (1 | ) | 286 | ||||||||||||
Total liabilities | 123,838 | 174,746 | 85,133 | (160,973 | ) | 222,744 | ||||||||||||
Shareholders’ equity | ||||||||||||||||||
Common stock | 1 | 3 | 5,378 | (5,381 | ) | 1 | ||||||||||||
Treasury stock | — | (3,286 | ) | (16,587 | ) | 19,873 | — | |||||||||||
Additional paid in capital | 17,597 | 4,966 | 20,584 | (25,550 | ) | 17,597 | ||||||||||||
Retained earnings | 7,654 | 99,583 | 75,194 | (174,777 | ) | 7,654 | ||||||||||||
Accumulated other comprehensive income | 315 | 316 | 752 | (1,068 | ) | 315 | ||||||||||||
Total stockholders equity | 25,567 | 101,582 | 85,321 | (186,903 | ) | 25,567 | ||||||||||||
Total liabilities and Shareholders’ equity | $ | 149,405 | $ | 276,328 | $ | 170,454 | $ | (347,876 | ) | $ | 248,311 | |||||||
F-50
Table of Contents
INTCOMEX, INC. AND SUBSIDIARIES
NOTES TO AUDITED CONSOLIDATED FINANCIAL STATEMENTS—(Continued)
Statement of Operations for the Year Ended December 31, 2005
| INTCOMEX INC. (PARENT) | GUARANTORS | NON- GUARANTORS | ELIMINATIONS | INTCOMEX INC. CONSOLIDATED | |||||||||||||||
Revenue | $ | — | $ | 466,769 | $ | 470,254 | $ | (220,583 | ) | $ | 716,440 | ||||||||
Cost of revenue | — | 438,069 | 425,102 | (220,434 | ) | 642,737 | |||||||||||||
Gross profit | — | 28,700 | 45,152 | (149 | ) | 73,703 | |||||||||||||
Operating expenses | 2 | 15,569 | 27,772 | — | 43,343 | ||||||||||||||
Operating income (loss) | (2 | ) | 13,131 | 17,380 | (149 | ) | 30,360 | ||||||||||||
Other (income) and expense | |||||||||||||||||||
Interest expense, net | 9,649 | 6,645 | 55 | — | 16,349 | ||||||||||||||
Other | (17,902 | ) | 22 | (850 | ) | 17,923 | (807 | ) | |||||||||||
Total other (income) expense | (8,253 | ) | 6,667 | (795 | ) | 17,923 | 15,542 | ||||||||||||
Income (loss) from continuing operations before income taxes | 8,251 | 6,464 | 18,175 | (18,072 | ) | 14,818 | |||||||||||||
Provision for income taxes | (3,812 | ) | 2,300 | 4,267 | — | 2,755 | |||||||||||||
Net income (loss) | $ | 12,063 | $ | 4,164 | $ | 13,908 | $ | (18,072 | ) | $ | 12,063 | ||||||||
Statement of Cash Flows for the Year Ended December 31, 2005
| INTCOMEX INC. (PARENT) | GUARANTORS | NON- GUARANTORS | ELIMINATIONS | INTCOMEX INC. CONSOLIDATED | |||||||||||||||
Cash flows from operating activities | $ | (75,407 | ) | $ | 58,252 | $ | 6,421 | $ | — | $ | (10,734 | ) | |||||||
Cash flows from investing activities | |||||||||||||||||||
Additions to plant and equipment | — | (1,488 | ) | (1,386 | ) | — | (2,874 | ) | |||||||||||
Other | — | (11,839 | ) | 662 | — | (11,177 | ) | ||||||||||||
Cash used in investing activities | — | (13,327 | ) | (724 | ) | — | (14,051 | ) | |||||||||||
Cash flows from financing activities | |||||||||||||||||||
Net borrowings (repayments) | — | (5,820 | ) | 1,462 | — | (4,358 | ) | ||||||||||||
Issuance of senior notes | 108,962 | 15,000 | — | — | 123,962 | ||||||||||||||
(Payments) of notes payable | (10,094 | ) | (54,273 | ) | (1,278 | ) | — | (65,645 | ) | ||||||||||
Debt issuance costs | (3,427 | ) | — | — | — | (3,427 | ) | ||||||||||||
Dividends | (20,000 | ) | — | — | — | (20,000 | ) | ||||||||||||
| — | — | — | — | — | |||||||||||||||
Cash flows from financing activities | 75,441 | (45,093 | ) | 184 | — | 30,532 | |||||||||||||
Effects of exchange rate changes on cash | — | — | 315 | — | 315 | ||||||||||||||
| 34 | (168 | ) | 6,196 | — | 6,062 | ||||||||||||||
Cash and cash equivalents, beginning of period | — | 257 | 6,645 | — | 6,902 | ||||||||||||||
Cash and cash equivalents, end of period | $ | 34 | $ | 89 | $ | 12,841 | $ | — | $ | 12,964 | |||||||||
F-51
Table of Contents
INTCOMEX, INC. AND SUBSIDIARIES
NOTES TO AUDITED CONSOLIDATED FINANCIAL STATEMENTS—(Continued)
Statement of Operations for the Year Ended December 31, 2004
| INTCOMEX INC. (PARENT) | GUARANTORS | NON- GUARANTORS | ELIMINATIONS | INTCOMEX INC. CONSOLIDATED | ||||||||||||||||
Revenue | $ | — | $ | 372,682 | $ | 442,321 | $ | (260,658 | ) | $ | 554,345 | |||||||||
Cost of revenue | — | 350,696 | 405,205 | (260,365 | ) | 495,536 | ||||||||||||||
Gross profit | — | 21,986 | 37,116 | (293 | ) | 58,809 | ||||||||||||||
Operating expenses | 3 | 12,196 | 22,001 | (385 | ) | 33,815 | ||||||||||||||
Operating income (loss) | (3 | ) | 9,790 | 15,115 | 92 | 24,994 | ||||||||||||||
Other (income) and expense | ||||||||||||||||||||
Interest expense, net | 723 | 1,952 | 601 | — | 3,276 | |||||||||||||||
Other | (17,111 | ) | (863 | ) | (4,597 | ) | 21,389 | (1,182 | ) | |||||||||||
Total other (income) expense | (16,388 | ) | 1,089 | (3,996 | ) | 21,389 | 2,094 | |||||||||||||
Income (loss) from continuing operations before income taxes | 16,385 | 8,701 | 19,111 | (21,297 | ) | 22,900 | ||||||||||||||
Provision for income taxes | 216 | 2,971 | 3,230 | — | 6,417 | |||||||||||||||
Income (loss) from continuing operations before minority interest | 16,169 | 5,730 | 15,881 | (21,297 | ) | 16,483 | ||||||||||||||
(Reduction) for minority interest | — | — | — | (314 | ) | (314 | ) | |||||||||||||
Net income (loss) | $ | 16,169 | $ | 5,730 | $ | 15,881 | $ | (21,611 | ) | $ | 16,169 | |||||||||
Statement of Cash Flows for the Year Ended December 31, 2004
| INTCOMEX INC. (PARENT) | GUARANTORS | NON- GUARANTORS | ELIMINATIONS | INTCOMEX INC. CONSOLIDATED | ||||||||||||||||
Cash flows from operating activities | $ | 38,267 | $ | (40,516 | ) | $ | (917 | ) | $ | (522 | ) | $ | (3,688 | ) | ||||||
Cash flows from investing activities | ||||||||||||||||||||
Additions to plant and equipment | — | (291 | ) | (1,205 | ) | — | (1,496 | ) | ||||||||||||
Other | — | 276 | (2,095 | ) | — | (1,819 | ) | |||||||||||||
Cash used in investing activities | — | (15 | ) | (3,300 | ) | — | (3,315 | ) | ||||||||||||
Cash flows from financing activities | ||||||||||||||||||||
Net borrowings (repayments) | — | (621 | ) | 864 | — | 243 | ||||||||||||||
Issuance of senior notes | — | 40,000 | 1,057 | — | 41,057 | |||||||||||||||
(Payments) of notes payable | — | (572 | ) | (1,010 | ) | — | (1,582 | ) | ||||||||||||
Proceeds from issuance of common stock | 17,687 | — | — | — | 17,687 | |||||||||||||||
Dividends | — | (522 | ) | — | 522 | — | ||||||||||||||
Distributions to shareholders | (55,954 | ) | — | — | — | (55,954 | ) | |||||||||||||
| — | — | — | — | — | ||||||||||||||||
Cash flows from financing activities | (38,267 | ) | 38,285 | 911 | 522 | 1,451 | ||||||||||||||
Effects of exchange rate changes on cash | — | — | — | — | — | |||||||||||||||
| — | (2,246 | ) | (3,306 | ) | — | (5,552 | ) | |||||||||||||
Cash and cash equivalents, beginning of period | — | 2,503 | 9,951 | — | 12,454 | |||||||||||||||
Cash and cash equivalents, end of period | $ | — | $ | 257 | $ | 6,645 | $ | — | $ | 6,902 | ||||||||||
F-52
Table of Contents
Shares
Intcomex, Inc.
Common Stock
P R O S P E C T U S
, 2007
Joint Book-Running Managers
Citi | UBS Investment Bank |
Banc of America Securities LLC
Raymond James
Broadpoint.
Table of Contents
PART II
INFORMATION NOT REQUIRED IN PROSPECTUS
| Item 13. | Other Expenses of Issuance and Distribution. |
The following table sets forth the costs and expenses, other than underwriting discounts and commissions, payable in connection with the sale of securities being registered. Except as otherwise noted, we will pay all of these amounts. All amounts are estimates except the registration fee, the NASD filing fee and the Nasdaq Global Market fee.
Registration fee | $ | 3,838 | |
NASD filing fee | $ | 13,000 | |
Nasdaq Global Market fee | * | ||
Printing and engraving expenses | * | ||
Legal fees and expenses | * | ||
Accounting fees and expenses | * | ||
Blue sky fees and expenses | * | ||
Transfer agent and registrar fees | * | ||
Miscellaneous | * | ||
Total | * | ||
| * | To be provided by amendment. |
| Item 14. | Indemnification of Directors and Officers. |
Subsection (a) of Section 145 of the General Corporation Law of the State of Delaware, or DGCL, empowers a corporation to indemnify any person who was or is a party or is threatened to be made a party to any threatened, pending or completed action, suit or proceeding, whether civil, criminal, administrative or investigative (other than an action by or in the right of the corporation) by reason of the fact that the person is or was a director, officer, employee or agent of the corporation, or is or was serving at the request of the corporation as a director, officer, employee or agent of another corporation, partnership, joint venture, trust or other enterprise, against expenses (including attorneys’ fees), judgments, fines and amounts paid in settlement actually and reasonably incurred by the person in connection with such action, suit or proceeding if the person acted in good faith and in a manner the person reasonably believed to be in or not opposed to the best interests of the corporation, and, with respect to any criminal action or proceeding, had no reasonable cause to believe the person’s conduct was unlawful. The termination of any action, suit or proceeding by judgment, order, settlement, conviction, or upon a plea of nolo contendere or its equivalent, shall not, of itself, create a presumption that the person did not act in good faith and in a manner which the person reasonably believed to be in or not opposed to the best interest of the corporation, and, with respect to any criminal action or proceeding, had reasonable cause to believe that the person’s conduct was unlawful.
Subsection (b) of Section 145 of the DGCL empowers a corporation to indemnify any person who was or is a party or is threatened to be made a party to any threatened, pending or completed action or suit by or in right of the corporation to procure a judgment in its favor by reason of the fact that such person acted in any of the capacities set forth above, against expenses (including attorneys’ fees) actually and reasonably incurred by the person in connection with the defense or settlement of such action or suit if the person acted in good faith and in a manner the person reasonably believed to be in or not opposed to the best interests of the corporation and except that no indemnification may be made in respect of any claim, issue or matter as to which such person shall have been adjudged to be liable to the corporation unless and only to the extent that the Court of Chancery or the court in which such action or suit was brought shall determine upon application that, despite the adjudication of liability but in view of all the circumstances of the case, such person is fairly and reasonably entitled to indemnity for such expenses which the Court of Chancery or such other court shall deem proper.
II-1
Table of Contents
Subsection (d) of Section 145 of the DGCL provides that any indemnification under subsections (a) and (b) of Section 145 (unless ordered by a court) shall be made by the corporation only as authorized in the specific case upon a determination that indemnification of the present or former director, officer, employee or agent is proper in the circumstances because the person has met the applicable standard of conduct set forth in subsections (a) and (b) of Section 145. Such determination shall be made, with respect to a person who is a director or officer at the time of such determination, (1) by a majority vote of the directors who are not parties to such action, suit or proceeding, even though less than a quorum, or (2) by a committee of such directors designated by the majority vote of such directors, even though less than a quorum, or (3) if there are no such directors, or if such directors so direct, by independent legal counsel in a written opinion, or (4) by the stockholders.
Section 145 of the DGCL further provides that to the extent a present or former director or officer of a corporation has been successful on the merits or otherwise in the defense of any action, suit or proceeding referred to in subsections (a) and (b) of Section 145, or in defense of any claim, issue or matter therein, such person shall be indemnified against expenses (including attorneys’ fees) actually and reasonably incurred by such person in connection therewith and that such expenses may be paid by the corporation in advance of the final disposition of such action, suit or proceeding upon receipt of an undertaking by or on behalf of such director or officer to repay such amount if it shall ultimately be determined that such person is not entitled to be indemnified by the corporation as authorized in Section 145 of the DGCL; that any indemnification and advancement of expenses provided by, or granted pursuant to, Section 145 shall not be deemed exclusive of any other rights to which the indemnified party may be entitled; that indemnification provided by, or granted pursuant to, Section 145 shall, unless otherwise provided when authorized and ratified, continue as to a person who has ceased to be a director, officer, employee or agent and shall inure to the benefit of such person’s heirs, executors and administrators; and empowers the corporation to purchase and maintain insurance on behalf of any person who is or was a director, officer, employee or agent of the corporation or is or was serving at the request of the corporation as a director, officer, employee or agent of another corporation, partnership, joint venture, trust or other enterprise against any liability asserted against such person and incurred by such person in any such capacity, or arising out of such person’s status as such, whether or not the corporation would have the power to indemnify such person against such liabilities under Section 145. Article IX of the Company’s Certificate of Incorporation provides that the Company shall indemnify any officer or director, or any former officer or director, to the full extent permitted by Section 145 of the DGCL.
The Company also provides liability insurance for its directors and officers which provides for coverage against loss from claims made against directors and officers in their capacity as such, including, subject to certain exceptions, liabilities under the federal securities laws.
Section 102(b) (7) of the DGCL provides that a certificate of incorporation may contain a provision eliminating or limiting the personal liability of a director to the corporation or its stockholders for monetary damages for breach of fiduciary duty as a director, provided that such provision shall not eliminate or limit the liability of a director (i) for any breach of the director’s duty of loyalty to the corporation or its stockholders, (ii) for acts or omissions not in good faith or which involve intentional misconduct or a knowing violation of law, (iii) under Section 174 of the DGCL, or (iv) for any transaction from which the director derived an improper personal benefit. Article X of the Company’s Certificate of Incorporation limits the personal liability of the directors of the Company to the fullest extent permitted by Section 102(b) (7) of the DGCL.
In addition to the foregoing, the proposed form of Underwriting Agreement filed as Exhibit 1.1 to this Registration Statement contains certain provisions pursuant to which the Underwriters have agreed to indemnify the Registrant, each person, if any, who controls the Registrant within the meaning of Section 15 of the Securities Act, each director of the Registrant and, each officer of the Registrant who signs the Registration Statement, with respect to information furnished in writing by or on behalf of the Underwriters for use in the Registration Statement.
Further, the proposed form of Underwriting Agreement also contains certain provisions by which the Selling Stockholder has agreed to indemnify the Registrant, each person, if any, who controls the Registrant within the
II-2
Table of Contents
meaning of Section 15 of the Securities Act, each director of the Registrant, each officer of the Registrant who signs the Registration Statement, with respect to information furnished in writing by or on behalf of the Selling Stockholder for use in the Registration Statement.
| Item 15. | Recent Sales of Unregistered Securities. |
The following relates to sales of securities that have occurred in the last three years that have not been registered under the Securities Act:
On August 25, 2005, we completed an offering of $120 million 11 3/4% Second Priority Senior Secured Notes due 2011, or the 11 3/4% Notes. 100% of the outstanding principal of the 11 3/4% Notes were exchanged on December 14, 2006 for SEC registered publicly tradable notes that have substantially identical terms and conditions as the initial notes.
On August 22, 2005, we issued 2,182 non-voting common shares to the sellers of Centel as part of the consideration for acquiring all of the outstanding shares of Centel on June 23, 2005. The aggregate consideration of $19.8 million for all Centel shares consisted of $14.0 million in cash, $2.8 million in seller notes and $3.0 million in non-voting common shares.
In connection with CVC International’s investment in our company, we entered into a stock purchase agreement on August 27, 2004 pursuant to which we sold 5,904 common shares for a purchase price of $3,943,763 and issued 22,252 new shares of common stock for a subscription price of $14,863,926 to CVC International. Further, we purchased from two of our stockholders 3,964 and 1,940 common shares, issuing seller notes in the amount of $661,940 and $324,081, respectively, as consideration. We also issued 851 and 1,259 common shares to Emibasher Sociedad Anónima and Mardel Holdings Limited for a subscription price of $568,305 and $841,008 and seller notes in the amount of $158,117 and $233,990, respectively.
The issuance of securities described above were exempt from registration under the Securities Act of 1933 in reliance on Section 4(2) of the Securities Act of 1933 as transactions by an issuer not involving any public offering. The purchasers of the securities in these transactions represented that they were accredited investors or qualified institutional buyers and they were acquiring the securities for investment only and not with a view toward the public sale or distribution thereof. Such purchasers received written disclosures that the securities had not been registered under the Securities Act of 1933 and that any resale must be made pursuant to a registration statement or an available exemption from registration. All purchasers either received adequate access, through their relationship with the registrant, to financial statement or non-financial statement information about the registrant or had adequate access, through their relationship with the registrant, to financial statement or non-financial statement information about the registrant. The sale of these securities was made without general solicitation or advertising.
II-3
Table of Contents
| Item 16. | Exhibits and Financial Statement Schedules. |
(a)Exhibits. The following is a complete list of Exhibits filed as part of this Registration Statement.
| Exhibits | Document | ||
| 1.1 | Form of Underwriting Agreement.(1) | ||
| 3.1 | Second Amended and Restated Certificate of Incorporation of Intcomex, Inc. Incorporated by reference to Exhibit 3.1 to the Registration Statement on Form S-4 (File No. 333-134090) (the “S-4 Registration Statement). | ||
| 3.2 | By-laws of Intcomex, Inc. Incorporated by reference to Exhibit 3.2 of the S-4 Registration Statement. | ||
| Instruments Defining the Rights of Security Holders, Including Indentures | |||
| 4.1 | Specimen Common Stock Certificate of Intcomex, Inc.(1) | ||
| 4.2 | (a) | Indenture, dated as of August 25, 2005, between Intcomex, Inc., the guarantors named therein, and the Bank of New York as Trustee. Incorporated by reference to Exhibit 4.1 of the S-4 Registration Statement. | |
| 4.2 | (b) | Supplemental Indenture, dated as of October 31, 2006 to the Indenture, dated as of August 25, 2005. Incorporated by reference to Exhibit 4.10 of the S-4 Registration Statement. | |
| 4.3 | Pledge Agreement among Intcomex, Inc., Intcomex Holdings, LLC and Intcomex Holdings SPC-I, LLC, as pledgors, in favor of The Bank of New York, as trustee, dated as of August 25, 2005. Incorporated by reference to Exhibit 4.4 of the S-4 Registration Statement. | ||
| 4.4 | Security Agreement by Software Brokers of America, Inc. and The Bank of New York, as trustee, dated as of August 25, 2005. Incorporated by reference to Exhibit 4.5 of the S-4 Registration Statement. | ||
| 4.5 | Lien Subordination Agreement among Comerica Bank, The Bank of New York and Software Brokers of America, Inc., dated as of August 25, 2005. Incorporated by reference to Exhibit 4.6 of the S-4 Registration Statement. | ||
| 4.6 | Stock Pledge Agreement between Intcomex Holdings, SPC-I, LLC, as pledgor, in favor of The Bank of New York, as trustee, dated as of August 25, 2005. Incorporated by reference to Exhibit 4.7 of the S-4 Registration Statement. | ||
| 4.7 | Share Charge between Intcomex Holdings, LLC, The Bank of New York and IXLA Holdings Ltd., dated as of August 25, 2005. Incorporated by reference to Exhibit 4.8 of the S-4 Registration Statement. | ||
| 4.8 | Treasury Management Services Controlled Collateral Account Service Agreement among Comerica Bank, Software Brokers of America, Inc. and The Bank of New York, dated August 25, 2005. Incorporated by reference to Exhibit 4.9 of the S-4 Registration Statement. | ||
| Legal Opinion | |||
| 5.1 | Legal Opinion of Cleary Gottlieb Steen & Hamilton LLP.(1) | ||
| Material Contracts | |||
| 10.1 | Credit Agreement between Software Brokers of America, Inc. and Comerica Bank, dated as of August 25, 2005. Incorporated by reference to Exhibit to 10.1 of the S-4 Registration Statement. | ||
| 10.2 | Third Amended and Restated Shareholders Agreement among Co-Investment LLC VII (Intcomex), the Shalom shareholders named therein, the Centel shareholders named therein, the additional shareholders named therein, and Intcomex, Inc., dated June 23, 2005. Incorporated by reference to Exhibit 10.1 of the Current Report on Form 8-K filed with the SEC on August 23, 2007. | ||
II-4
Table of Contents
| Exhibits | Document | |
| #10.3 | Employment Agreement of Russell Olson, dated March 9, 2005. Incorporated by reference to Exhibit 10.4 of the S-4 Registration Statement. | |
| 10.4 | Lease Agreement between Lit Industrial Limited Partnership, as landlord, and Software Brokers of America, Inc., as tenant, dated May 12, 2006. Incorporated by reference to Exhibit 10.6 of the S-4 Registration Statement. | |
| 10.5 | Amendment No. 1 to Credit Agreement, Amendment to Intcomex Subordination Agreement and Waiver Re Intcomex Subordinated Indebtedness, dated as of November 2, 2006, by and among Software Brokers of America, Inc., Comerica Bank and Intcomex, Inc. Incorporated by reference to Exhibit 10.7 of the S-4 Registration Statement. | |
| 10.6 | Amendment No. 2 to Credit Agreement, dated as of May 15, 2007, by and among Software Brokers of America, Inc. and Comerica Bank. Incorporated by reference to Exhibit 10.1 of the Current Report on Form 8-K filed with the SEC on July 18, 2007. | |
| 10.7 | Amendment No. 3 to Credit Agreement, dated as of August 17, 2007, by and among Software Brokers of America, Inc. and Comerica Bank. Incorporated by reference to Exhibit 10.1 of our Current Report on Form 8-K filed with the SEC on August 23, 2007. | |
| #10.8 | Founders Stock Option Grant Agreement, dated February 27, 2007. Incorporated by reference to Exhibit 10.8 of our Annual Report on Form 10-K filed with the SEC on March 30, 2007. | |
| 10.9 | Indemnity Agreement between Co-Investment LLC VII (Intcomex), Anthony Shalom and Michael Shalom, as Main Sellers, dated as of June 29, 2007. Incorporated by reference to Exhibit 10.1 of our Quarterly Report on Form 10-Q filed with the SEC on August 17, 2007. | |
| Other Exhibits | ||
| 21.1 | Subsidiaries of Intcomex, Inc. Incorporated by reference to Exhibit 21.1 of our Annual Report on Form 10-K filed with the SEC on March 30, 2007. | |
| 23.1 | Consent of Independent Registered Public Accounting Firm (BDO Seidman, LLP).(2) | |
| 23.2 | Consents of Other Independent Registered Public Accounting Firms.(2) • PricewaterhouseCoopers, S.C.(2) • Figueroa, Jimenez & Co. S.A.(2) • Ernst & Young Ltd. Corp.(2) | |
| 23.3 | Consent of Cleary Gottlieb Steen & Hamilton LLP. included in Exhibit 5.1. | |
| 24.1 | Power of Attorney.(3) | |
| (1) | To be filed by amendment. |
| (2) | Filed herewith. |
| (3) | Previously filed. |
| # | Indicates a management contract or a compensatory plan or arrangement. |
(b)Financial Statement Schedules. Schedules not listed above have been omitted because the information to be set forth therein is not material, not applicable or is shown in the financial statements or notes thereto.
II-5
Table of Contents
| Item 17. | Undertakings. |
The undersigned Registrant hereby undertakes to provide to the underwriters at the closing specified in the underwriting agreement certificates in such denominations and registered in such names as required by the underwriters to permit prompt delivery to each purchaser.
Insofar as indemnification for liabilities arising under the Securities Act of 1933 may be permitted to directors, officers and controlling persons of the Registrant pursuant to the foregoing provisions, or otherwise, the Registrant has been advised that in the opinion of the Securities and Exchange Commission such indemnification is against public policy as expressed in the Securities Act and is, therefore, unenforceable. In the event that a claim for indemnification against such liabilities (other than the payment by the Registrant of expenses incurred or paid by a director, officer, or controlling person of the Registrant in the successful defense of any action, suit or proceeding) is asserted by such director, officer or controlling person in connection with the securities being registered, the Registrant will, unless in the opinion of its counsel the matter has been settled by controlling precedent, submit to a court of appropriate jurisdiction the question whether such indemnification by it is against public policy as expressed in the Securities Act and will be governed by the final adjudication of such issue.
The undersigned Registrant hereby undertakes that:
(1) For purposes of determining any liability under the Securities Act of 1933, the information omitted from the form of prospectus filed as part of this registration statement in reliance upon Rule 430A and contained in a form of prospectus filed by the Registrant pursuant to Rule 424(b)(1) or (4) or 497(h) under the Securities Act shall be deemed to be part of this registration statement as of the time it was declared effective.
(2) For the purpose of determining any liability under the Securities Act of 1933, each post-effective amendment that contains a form of prospectus shall be deemed to be a new registration statement relating to the securities offered therein, and the offering of such securities at that time shall be deemed to be the initialbona fide offering thereof.
The undersigned Registrant hereby undertakes that
(1) For purposes of determining liability under the Securities Act of 1933 to any purchaser, each prospectus filed pursuant to Rule 424(b) as part of a registration statement relating to an offering, other than registration statements relying on Rule 430B or other than prospectuses filed in reliance on Rule 430A, shall be deemed to be part of an included in the registration statement as of the date it is first used after effectiveness.Provided, however, that no statement made in a registration statement or prospectus that is part of the registration statement or made in a document incorporated or deemed incorporated by reference into the registration statement or prospectus that is part of the registration statement will, as to a purchaser with a time of contract of sale prior to such first use, supersede or modify any statement that was made in the registration statement or prospectus that was part of the registration statement or made in any such document immediately prior to such date of first use.
(2) For the purpose of determining liability of the registrant under the Securities Act of 1933 to any purchaser in the initial distribution of securities, the undersigned registrant undertakes that in a primary offering of securities of the undersigned registrant pursuant to this registration statement, regardless of the underwriting method used to sell the securities to the purchaser, if the securities are offered or sold to such purchaser by means of any of the following communications, the undersigned registrant will be a seller to the purchaser and will be considered to offer or sell such securities to such purchaser:
(i) Any preliminary prospectus or prospectus of the undersigned registrant relating to the offering required to be filed pursuant to Rule 424;
(ii) Any free writing prospectus relating to the offering prepared by or on behalf of the undersigned registrant or used or referred to by the undersigned registrant;
II-6
Table of Contents
(iii) The portion of any other free writing prospectus relating to the offering containing material information about the undersigned registrant or its securities provided by or on behalf of the undersigned registrant; and
(iv) Any other communication that is an offer in the offering made by the undersigned registrant to the purchaser.
II-7
Table of Contents
SIGNATURES
Pursuant to the requirements of the Securities Act of 1933, the registrant has duly caused this registration statement to be signed on its behalf by the undersigned, thereunto duly authorized, in the City of Miami, State of Florida, on October 25, 2007.
Intcomex, Inc. | ||
| By: | /s/ ANTHONY SHALOM | |
Anthony Shalom Chief Executive Officer | ||
Pursuant to the requirements of the Securities Act of 1933, as amended, this Registration Statement has been signed by the following persons in the capacities and on the dates indicated:
Signature | Title | Date | ||
/s/ ANTHONY SHALOM Anthony Shalom |
Chief Executive Officer and a Director (Principal Executive Officer) | October 25, 2007 | ||
/s/ MICHAEL SHALOM Michael Shalom |
President and Director | October 25, 2007 | ||
/s/ RUSSELL OLSON Russell Olson |
Treasurer and Chief Financial Officer, Assistant Secretary (Principal Financial Officer and Principal Accounting Officer) | October 25, 2007 | ||
* Enrique Bascur |
Director | October 25, 2007 | ||
* Thomas A. Madden |
Director | October 25, 2007 | ||
* Carol Miltner |
Director | October 25, 2007 | ||
* Juan Pablo Pallordet |
Director | October 25, 2007 | ||
* Andres Small |
Director | October 25, 2007 | ||
| *By: | /s/ RUSSELL OLSON | |
| Attorney-in-Fact | ||
II-8
Table of Contents
EXHIBIT INDEX
| Exhibits | Document | ||
| 1.1 | Form of Underwriting Agreement.(1) | ||
| 3.1 | Second Amended and Restated Certificate of Incorporation of Intcomex, Inc. Incorporated by reference to Exhibit 3.1 to the Registration Statement on Form S-4 (File No. 333-134090) (the “S-4 Registration Statement). | ||
| 3.2 | By-laws of Intcomex, Inc. Incorporated by reference to Exhibit 3.2 of the S-4 Registration Statement. | ||
| Instruments Defining the Rights of Security Holders, Including Indentures | |||
| 4.1 | Specimen Common Stock Certificate of Intcomex, Inc.(1) | ||
| 4.2 | (a) | Indenture, dated as of August 25, 2005, between Intcomex, Inc., the guarantors named therein, and the Bank of New York as Trustee. Incorporated by reference to Exhibit 4.1 of the S-4 Registration Statement. | |
| 4.2 | (b) | Supplemental Indenture, dated as of October 31, 2006 to the Indenture, dated as of August 25, 2005. Incorporated by reference to Exhibit 4.10 of the S-4 Registration Statement. | |
| 4.3 | Pledge Agreement among Intcomex, Inc., Intcomex Holdings, LLC and Intcomex Holdings SPC-I, LLC, as pledgors, in favor of The Bank of New York, as trustee, dated as of August 25, 2005. Incorporated by reference to Exhibit 4.4 of the S-4 Registration Statement. | ||
| 4.4 | Security Agreement by Software Brokers of America, Inc. and The Bank of New York, as trustee, dated as of August 25, 2005. Incorporated by reference to Exhibit 4.5 of the S-4 Registration Statement. | ||
| 4.5 | Lien Subordination Agreement among Comerica Bank, The Bank of New York and Software Brokers of America, Inc., dated as of August 25, 2005. Incorporated by reference to Exhibit 4.6 of the S-4 Registration Statement. | ||
| 4.6 | Stock Pledge Agreement between Intcomex Holdings, SPC-I, LLC, as pledgor, in favor of The Bank of New York, as trustee, dated as of August 25, 2005. Incorporated by reference to Exhibit 4.7 of the S-4 Registration Statement. | ||
| 4.7 | Share Charge between Intcomex Holdings, LLC, The Bank of New York and IXLA Holdings Ltd., dated as of August 25, 2005. Incorporated by reference to Exhibit 4.8 of the S-4 Registration Statement. | ||
| 4.8 | Treasury Management Services Controlled Collateral Account Service Agreement among Comerica Bank, Software Brokers of America, Inc. and The Bank of New York, dated August 25, 2005. Incorporated by reference to Exhibit 4.9 of the S-4 Registration Statement. | ||
| Legal Opinion | |||
| 5.1 | Legal Opinion of Cleary Gottlieb Steen & Hamilton LLP.(1) | ||
| Material Contracts | |||
| 10.1 | Credit Agreement between Software Brokers of America, Inc. and Comerica Bank, dated as of August 25, 2005. Incorporated by reference to Exhibit to 10.1 of the S-4 Registration Statement. | ||
| 10.2 | Third Amended and Restated Shareholders Agreement among Co-Investment LLC VII (Intcomex), the Shalom shareholders named therein, the Centel shareholders named therein, the additional shareholders named therein, and Intcomex, Inc., dated June 23, 2005. Incorporated by reference to Exhibit 10.1 of the Current Report on Form 8-K filed with the SEC on August 23, 2007. | ||
II-9
Table of Contents
| Exhibits | Document | |
| #10.3 | Employment Agreement of Russell Olson, dated March 9, 2005. Incorporated by reference to Exhibit 10.4 of the S-4 Registration Statement. | |
| 10.4 | Lease Agreement between Lit Industrial Limited Partnership, as landlord, and Software Brokers of America, Inc., as tenant, dated May 12, 2006. Incorporated by reference to Exhibit 10.6 of the S-4 Registration Statement. | |
| 10.5 | Amendment No. 1 to Credit Agreement, Amendment to Intcomex Subordination Agreement and Waiver Re Intcomex Subordinated Indebtedness, dated as of November 2, 2006, by and among Software Brokers of America, Inc., Comerica Bank and Intcomex, Inc. Incorporated by reference to Exhibit 10.7 of the S-4 Registration Statement. | |
| 10.6 | Amendment No. 2 to Credit Agreement, dated as of May 15, 2007, by and among Software Brokers of America, Inc. and Comerica Bank. Incorporated by reference to Exhibit 10.1 of the Current Report on Form 8-K filed with the SEC on July 18, 2007. | |
| 10.7 | Amendment No. 3 to Credit Agreement, dated as of August 17, 2007, by and among Software Brokers of America, Inc. and Comerica Bank Incorporated by reference to Exhibit 10.1 of our Current Report on Form 8-K filed with the SEC on August 23, 2007. | |
| #10.8 | Founders Stock Option Grant Agreement, dated February 27, 2007.Incorporated by reference to Exhibit 10.8 of our Annual Report on Form 10-K filed with the SEC on March 30, 2007. | |
| 10.9 | Indemnity Agreement between Co-Investment LLC VII (Intcomex), Anthony Shalom and Michael Shalom, as Main Sellers, dated as of June 29, 2007. Incorporated by reference to Exhibit 10.1 of our Quarterly Report on Form 10-Q filed with the SEC on August 17, 2007. | |
| Other Exhibits | ||
| 21.1 | Subsidiaries of Intcomex, Inc. Incorporated by reference to Exhibit 21.1 of our Annual Report on Form 10-K filed with the SEC on March 30, 2007. | |
| 23.1 | Consent of Independent Registered Public Accounting Firm (BDO Seidman, LLP).(2) | |
| 23.2 | Consents of Other Independent Registered Public Accounting Firms.(2) • PricewaterhouseCoopers, S.C.(2) • Figueroa, Jimenez & Co. S.A.(2) • Ernst & Young Ltd. Corp.(2) | |
| 23.3 | Consent of Cleary Gottlieb Steen & Hamilton LLP. included in Exhibit 5.1. | |
| 24.1 | Power of Attorney.(3) | |
| (1) | To be filed by amendment. |
| (2) | Filed herewith. |
| (3) | Previously filed. |
| # | Indicates a management contract or a compensatory plan or arrangement. |
II-10