 May 9, 2007 UBS 2007 Leveraged Finance Conference Exhibit 99 |
 1 Forward Looking Statements This presentation may contain certain "forward-looking statements“. These statements reflect management’s expectations, estimates, and assumptions, based on information available at the time of the statement. Forward-looking statements include, but are not limited to, statements regarding future events, plans, goals, objectives, and expectations. The words “anticipate,” “believe,” “estimate,” “expect,” “plan,” “intend,” “likely,” “will,” “should,” and similar expressions are intended to identify forward-looking statements. Forward-looking statements are not guarantees of future performance and involve risks, uncertainties and other factors, which may cause our actual results, performance or achievements to be materially different from any future results, performance, or achievements to be materially different from any future results, performance, or achievements expressed or implied by those statements. Factors that could cause actual results to differ materially from those in the forward- looking statements include: loss of existing customers and/or failure to acquire new customers; graphic products industry trends, including greater than anticipated pricing pressures, product and service rates and factors affecting supply and demand; and our ability to execute our business plan, including the costs of and ability to integrate acquisitions. Additional risk factors that could cause actual results to differ materially are discussed in SGS International, Inc.’s filings with the Securities and Exchange Commission (“SEC”). These documents may be accessed through the SEC’s website (www.sec.gov). We undertake no obligation to publicly update or revise any forward-looking statements to reflect changed assumptions, the occurrence of anticipated or unanticipated events, or changes to future results over time. |
 2 SGS Evolution 1946 Primarily Cylinder Engraving Southern Gravure Services established in Louisville, KY Prepress Services Opened first dedicated prepress facility Flexographic Plate Making Acquired flexographic plate making capabilities Enterprise Solutions Began providing Enterprise Solutions to its customers Creative Services Completed acquisition to enhance Design-to- Print services to its customer base Marketing Services Solution Provider Premier graphic services provider, backward integrated across the value chain 1991 1995 1997 2004 Today |
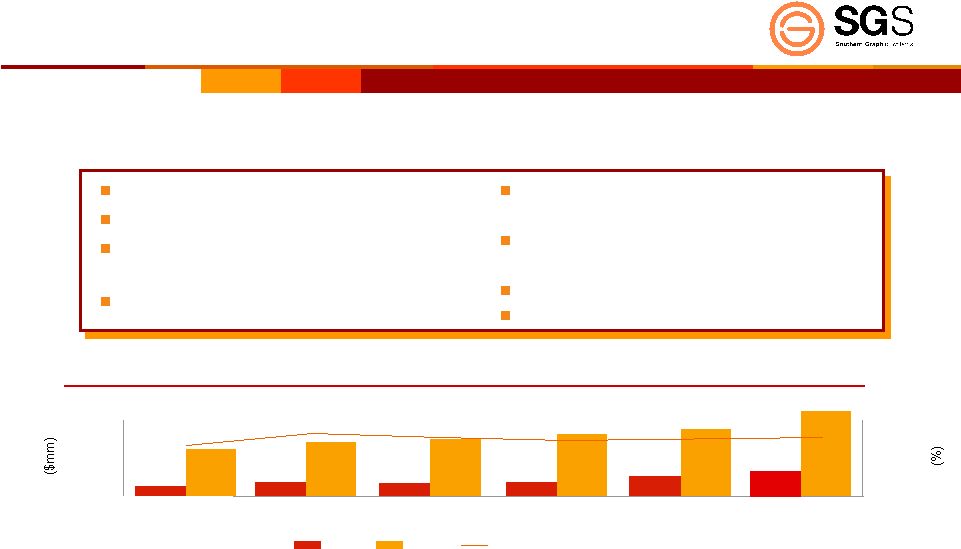 3 Company Snapshot 61-year heritage Leading market share Strong technical expertise. Reputation for speed, accuracy, quality and value 1,800 + employees Revenue & EBITDA growth Long-standing relationships with a blue- chip customer base National footprint with facilities close to our customers Consistent cash flow generation Management team of seasoned veterans SGS has maintained EBITDA margins in excess of 20% through various market conditions and economic cycles Design-to-print graphic services provider with full spectrum product offering Design-to-print graphic services provider with full spectrum product offering 53 53 38 54 58 276 247 226 214 187 0 100 200 300 2001 2002 2003 2004 2005 0.0% 10.0% 20.0% 30.0% EBITDA Revenue EBITDA Margin 61 290 2006 |
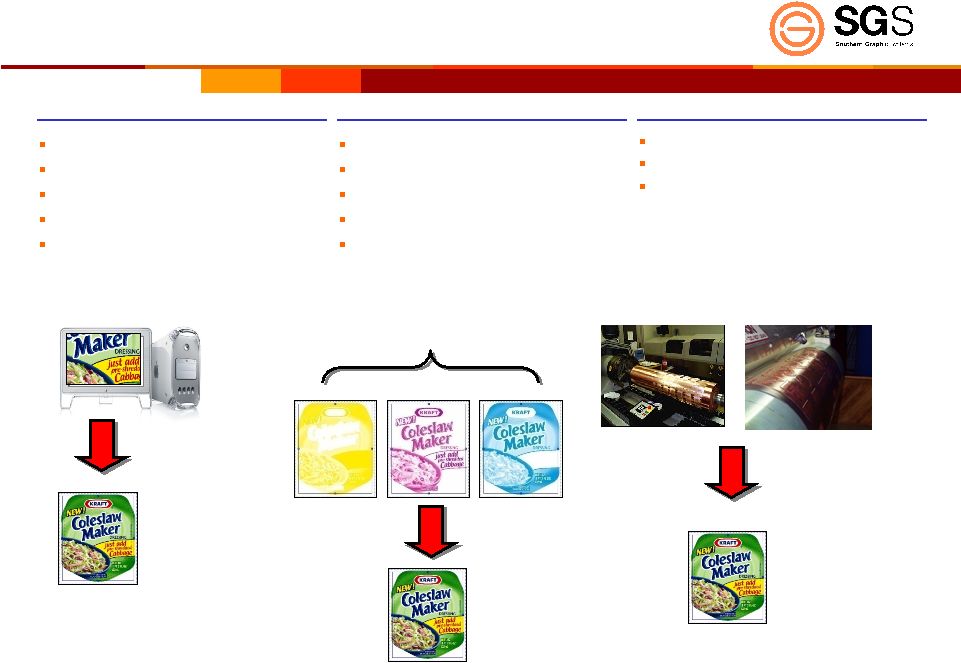 4 Product Overview Creative Services Graphics and Pre-Press Image Carriers Brand identity/creation Brand development Package design Interactive media development Product Photography Creative retouching Production art Color separation File creation Digital/Film output Gravure Cylinders Flexographic Plates Sales samples Package Design Design Proof Prepress Color Separation Image Carriers Prepress Proof Printed Package |
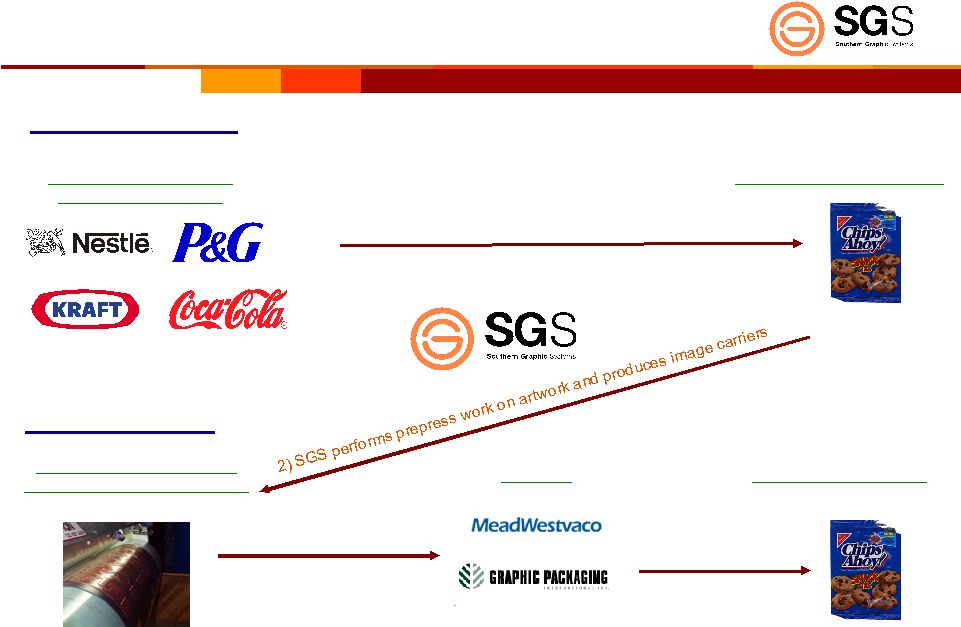 5 SGS’s Role in the Consumer Packaged Goods Industry Consumer Packaged Goods Companies 1) Utilize SGS creative service agency to produce packaged good design artwork Printers Finished Packaging Prepress Services and Image Carrier Production Concept Design Design-to-Print 3) SGS supplies image carriers to printers 4) Printers print labels on packaging material Packaged Good Design |
 6 SGS Value Proposition Customer Needs / Market Trends Value Proposition Shorter lead times Speed to market Cost reduction focus Brand consistency Global branding Supplier consolidation More value added / support & aftermarket services Customers are demanding that suppliers have a global capability Design-to-Print service offering Delivering integrated customized solutions Lowest total cost focus Proximity to customer – optimize footprint – on-site / FM approach Use of technology to enhance quality and reduce lead times |
 7 Core Business Packaging Graphics and Image Carriers Corrugated, Metal Decorating POP / POS, Collateral Materials, Consumer Promotions Production Artwork Services Creative Design Services Asset Management Services/Workflow Solutions On-site Graphics Management & Facilities Management Print Consulting and Color Management Press Fingerprinting and Press Approvals Marketing Creative Design Production Art Pre-press Image Carriers Print |
 8 Blue Chip Customer Base Relationships with major customers average over 20 years Relationships with major customers average over 20 years |
 9 Deep Roots Within Customers SGS services multiple brands at each of its large customers SGS services multiple brands at each of its large customers Revenue ($mm) 2006 Customer 1 18.5 Customer 2 18.4 Customer 3 16.9 Customer 4 13.0 Customer 5 10.6 Customer 6 7.2 Customer 7 6.2 Customer 8 5.0 Customer 9 4.8 Customer 10 4.7 Customer 11 4.5 Total 109.8 % of Total 38% |
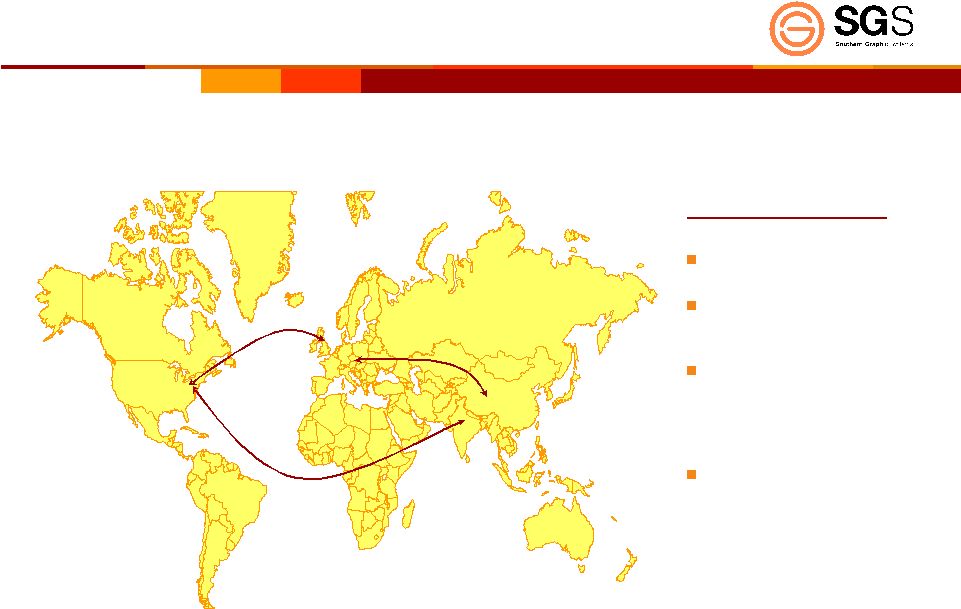
 10 Global Footprint with Proximity to Customers Global footprint addresses need for customer proximity many of our customers have multiple locations and can only be serviced by a Global provider Global footprint addresses need for customer proximity many of our customers have multiple locations and can only be serviced by a Global provider • As of 3/19/07 we had 35 production facilities across the US, Canada, Mexico, the UK, and The Netherlands. • We also operate on-site at numerous consumer products locations and 5 printers. • In February of 2007, we acquired the assets of the C.M. Jackson Company giving us design capability and entry into the Private Label Market. • In April of 2007, we acquired the Mc Gurk Company in the UK giving us two new production locations in the UK along with a facility in Hong Kong. |
 11 Strong Industry Growth Fundamentals Prepress graphics and image carrier volume in the consumer packaged goods segment is growing faster than gross domestic product growth – Heightened focus on package design as marketing driver – Proliferation of SKUs and new product launches – Product line extensions – Regionally customized packaging – Event marketing concepts (e.g. Super Bowl marketing) – Constantly changing regulatory labeling requirements – Consumer packaging company brand proliferation – Consolidation of consumer packaging companies – Globalization of brands – Heightened sensitivity to fads (i.e. Atkins, low-carb, low trans-fat, etc) |
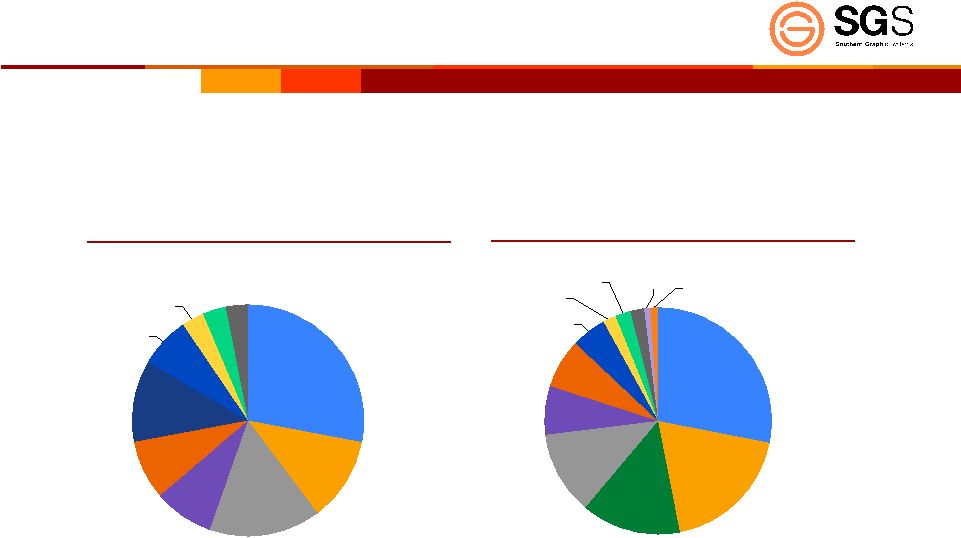 12 Diversified End Markets Packaging End Markets Diverse customer needs and changing tastes lead to constant innovation in the consumer packaged goods industry and in turn propel SGS’s growth Diverse customer needs and changing tastes lead to constant innovation in the consumer packaged goods industry and in turn propel SGS’s growth Markets Served by SGS Beverage 11% Pet Food 8% Institutional 3% Other 3% Personal care 15% Food 27% Industrial 3% Agri-chem 7% Pharmaceuticals 11% Household Products 8% SGS generates a greater proportion of its revenue from favorable food and beverage markets (Percentages are SGS Estimates) Food 28% Beverage 19% Tobacco 14% Retail 2% Pharmaceuticals 5% Pet Food 7% Personal Care 12% Commercial 1% Household Products 7% Decorative 2% Industrial 2% Distilled Spirits 1% |
 13 Globalization Customers are expanding businesses globally; competition to retain customers drives the graphic imaging industry to open/acquire manufacturing facilities abroad Customers are expanding businesses globally; competition to retain customers drives the graphic imaging industry to open/acquire manufacturing facilities abroad How SGS Benefits Best-in-class reputation One of three with access to opportunity Management team highly experienced with expansion and acquisition Commitment towards pursuing “right” opportunities |
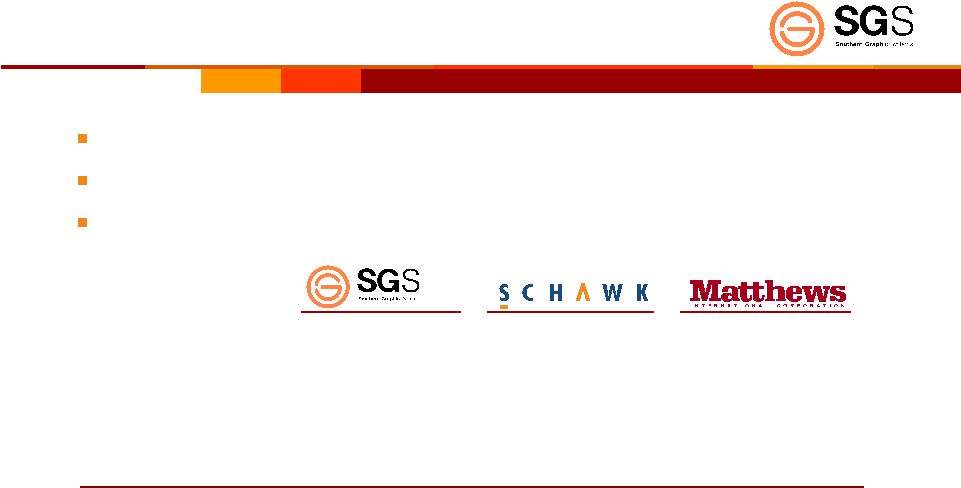 14 Best-in-Class Performance SGS is one of three packaging industry participants with the scale and sophistication to meet customer demands Industry is highly fragmented. There are hundreds of industry participants, few with revenues over $20 million Only 3 packaging industry participants have sales over $100 million Notes 1 Represents Graphics Imaging and Merchandising Solutions divisions. Matthews fiscal period ends September 30 2 Market share based on an estimated market size of $6 billion. ($ mm) FY 2006 Revenue 290.1 548.4 140.9 1 Packaging Focus Estimate 100% 100% 20% 2005 Revenue 272.8 614.5 143.2 1 2006 EBITDA Margin 21.1% 15.2% N/A Revenue/Employee $160k $156k N/A Estimated Market Share 2 5% 9% 2% |
 Business Strategy |
 16 SGS Business Strategy Provide additional value-added services to existing customers Provide complementary digital asset management and workflow management solutions Extend service in creative design and further one-stop shop concept Deploy sales and marketing team aggressively across consumer product companies Grow with private label and store-brand customers Acquire small/medium-size businesses that offer complementary products, services and/or customer relationships Integrate businesses quickly and realize revenue and cost synergies Provide Additional Services Pursue New Business Opportunities Continue Domestic Acquisition Strategy Continue Building a Global Footprint Evaluate international opportunities with a strong customer focus Follow right customers overseas Unique opportunity unavailable to most of market Application Innovation Be at forefront of technology changes Deploy appropriate technologies specific to customer solutions Enhance customer satisfaction through innovative application of latest technologies Capture outsource business opportunities resulting from technology changes Pursue Offshore Labor Strategy Tremendous cost savings potential Available to only a handful of industry players |
 17 HOW WE MAKE MONEY Past – Value Proposition – Producing commodity products (image carriers/graphics) supported by services Future – Value Proposition – Provide Services supported by products • Revenue Stream will continue to be predominately from products Way to get rich – Make commodity that people need and it repeats • Repurpose Value Proposition |
 18 Industry Consolidation Expected to Continue The industry has been consolidating over the last 10 years – Driven in large part by desire to have facilities close to large national customers – Significant cost savings can be achieved though facility consolidation and new raw material supply arrangements The consolidation has been led by SGS and Schawk – Both SGS and Schawk have integrated 20+ acquisitions in this timeframe The prepress graphics and flexographic plate markets remain fragmented and represent an opportunity for SGS |
 19 Target / Asset Year of Acquisition Rationale Key Capabilities Select Customers London Graphics 1999 Scale/Synergies Flexo Hershey Canada North American Roto Engravers 1999 Scale/Synergies Gravure Bureau of Engraving AEP Flexo 1999 Scale Flexo Zumbiel TSI 1999 Scale/Synergies Graphics Nestlé Swan Engraving 1999 Scale Graphics Unilever Cage Graphics 2000 Location/Scale Flexo Tyco, J&J, Global Packaging Lanscape 2001 Location Graphics General Mills APP 2001 Location/Scale Flexo Sonoco PDC 2001 Design Creative Design Greenlight Colorbrite 2002 Scale Graphics/Flexo Target/Anagram Pechiney Plastic Packaging 2002 Scale Gravure Contract with Pechiney ADS 2002 Art Production Art Kraft LiveWire 2003 Scale Graphics Nestlé/Cott Hobbs 2003 Scale Graphics Pilgrims Pride Wetzel 2003 Decorative Gravure N.A. Wallpaper Smurfit Stone (Winston-Salem) 2003 Scale Gravure Contract with Smurfit Mozaic Group (51%) 2004 Design Creative/Photography/Interactive Levis, Anheuser-Busch MacKay (Florence) 2004 Scale Gravure Nestlé Beverage Smurfit Stone (Dayton) 2004 Scale Graphics Smurfit L'Image Cré-o 2005 Location Graphics/Flexo Sonoco MCG Graphics Limited The Box Room Lukkien Packaging Synnoflex CM Jackson Mc Gurk 2005 2006 2006 2006 2007 2007 Location Location Location/Tech Customer Capability Location Graphics/Flexo Graphics Graphics Graphics/Flexo Creative Graphics/Flexo Nestlé Kraft Phillips A&P Store Brands Tesco SGS has acquired and integrated 26 acquisitions since 1999 Experienced in Growth Through Acquisitions Roll-up strategy includes many small acquisitions such that no single acquisition will put SGS at risk Long history of success in executing this strategy |
 20 Conservative Acquisition Strategy SGS has completed 26 small acquisitions since 1999 – Generally $1–$18 million purchase price – Generally 1.9x–5.0x EBITDA purchase multiple Strategy – Continue to execute small acquisitions ($2 million - $20 million) on an accretive basis (4.0x to 5.0x pre-synergy EBITDA) SGS’s focus continues to be North America and Western Europe. We will selectively move to Asia in response to a demand pull from the right customers. SGS has a conservative acquisition strategy |
 Financial Summary Jim Dahmus Jim Dahmus |
 22 Year Ended Dec 31 214 226 247 159 189 150 200 250 300 2000 2001 2002 2003 2004 Net Sales Year Ended Dec 31 53 38 34 54 53 20 30 40 50 60 70 2000 2001 2002 2003 2004 EBITDA Financial Performance Net Sales EBITDA After One-Time Adjustments 2005 2006 2006 2005 2006 2006 58 61 272 290 350 324 69 Pro Forma Including Acquisitions Made In 2006 and January – April 2007 Pro Forma Including Acquisitions Made In 2006 and January – April 2007 |
 23 Net Free Cash Free Cash Flow Data: (M$) 2003 2004 2005 2006 EBITDA Before One-Time Adjustments 52.7 54.4 56.1 57.8 Interest Expense 5.6 4.9 6.8 35.2 Capital Spending 5.6 5.6 13.9 8.7 Provision for Taxes on Income Net Free Cash 12.8 29.7 13.7 30.2 12.7 22.7 1.0 12.9 |
 24 Goals Moving Forward Operating Goals 3 - 5% organic growth $30-40 million in annualized acquisition revenues for 2007, $20.0 million in annual acquisition-related revenue 2008–2010 Mid-30% gross margin, low-20% EBITDA margin North American Acquisition Strategy 4.0–5.0x EBITDA average purchase price $1 million annual cost savings with 1-year lag for receiving cost-saving benefits Financed with borrowings under the Acquisition Facility and Revolver Small/mid-sized targets ($2 million - $20 million in revenue) International Acquisition Strategy React to customer brand globalization by following customers overseas Purchase assets that fit with SGS core competencies Focus on Western Europe and Asia |
 25 Current Liquidity $ M Cash on hand (as of 12/31/06) $13 Revolving credit facility availability $35 Acquisition facility availability $40 Less borrowing on acquisition credit facility ($23) Less letters of credit (0) Less reserves (0) Available liquidity $65 |
 Conclusion Henry Baughman Henry Baughman |
 27 Conclusion Leading market share in flexographic plates, gravure cylinders and prepress services Second largest provider of graphic service globally. One of three national/global providers Strong loyal, blue-chip customer base and diversified end-markets Attractive industry dynamics with graphics services growing faster than the GDP Well positioned to capitalize on globalization and consolidation Best-in-class financial performance Consistent EBITDA margins (20%+) and steady cash flows Highly experienced management team |
 28 Transaction Timetable Appendix Biographies |
 29 Biographies Henry Baughman – President & CEO of SGS , SGS Board Of Directors, Louisville, KY Hank became President of SGS in 1999. Prior to becoming President he held various Senior Executive level positions with SGS since 1982. He has 33 years of service, which are all with Southern. He is a graduate of Rochester Institute of Technology. In 1991 he attended and completed the Executive Development Program at the University of Tennessee. Jim Dahmus – Chief Financial Officer SGS, Louisville, KY Jim was named as CFO of SGS in April of 2006. His previous positions were that of CFO of the Sunny Delight Beverages Company in 2004-2006, and CFO of ADVO, Inc in 2003-2004. Prior to that time, Jim was President of Convergys Corporation’s Asian Operations, and worked at Procter & Gamble for fifteen years in a variety of financial and marketing assignments. He has an MBA from Northwestern University and a BA from the Pennsylvania State University. |
 30 Transaction Timetable Reconciliation of Net Income to EBITDA (Figures in M$) Reported Reported Reported Reported Reported Reported Pro Forma 2001 2002 2003 2004 2005 2006 2006 Net Income 10.6 21.4 20.2 20.6 19.8 0.6 5.5 Depreciation/Amortization 13.1 13.1 15.1 15.2 16.9 20.5 21.0 Interest Expense 7.0 4.8 4.6 4.9 6.8 35.2 37.0 Other/One-Time Expenses 0.0 0.0 0.0 0.0 1.5 3.9 2.0 Provision for Taxes on Income 8.0 13.6 12.8 13.7 12.8 1.1 3.5 EBITDA 38.7 52.9 52.7 54.4 57.6 61.2 69.0 Note: EBITDA is a non-GAAP measure which should be used in conjunction with other GAAP measures |