| ☐ | Registration statement pursuant to section 12(b) or (g) of the Securities Exchange Act of 1934 |
| ☒ | Annual report pursuant to section 13 or 15(d) of the Securities Exchange Act of 1934 For the 18 months ended October 31, 2018 |
| ☐ | Transition report pursuant to section 13 or 15(d) of the Securities Exchange Act of 1934 |
| ☐ | Shell company report pursuant to section 13 or 15(d) of the Securities Exchange Act of 1934 |
| The Lawn | |
| 22-30 Old Bath Road | |
| Newbury | |
| Berkshire RG14 1QN | |
| United Kingdom | United Kingdom |
Tim Brill | ||
Director of Investor Relations and Corporate Communications | ||
c/o Micro Focus International plc | ||
| The Lawn, 20-30 Old Bath Road | ||
| Newbury, Berkshire RG14 1QN | ||
| United Kingdom | ||
| Tel: +44 (0) 1635 32646 | ||
| Email: investors@microfocus.com | ||
| Large accelerated filer ☐ | Accelerated filer ☐ | Non-accelerated filer ☒ | Emerging growth company ☐ |
| 4 | |||
| 4 | |||
6 6 | |||
| Item 1. Identity of Directors, Senior Management and Advisers | 6 | |
| 6 | ||
| 6 | ||
|
| 6 | |
|
| 8 | |
|
| 8 | |
|
| 9 | |
| 13 | ||
|
| 13 | |
|
| 14 14 | |
|
| 21 | |
|
| 21 | |
| 22 | ||
|
| 22 | |
|
| 34 | |
|
| Item 5. C. Research and development, patents and licenses, etc. | 37 |
|
| 37 | |
|
| 38 | |
|
| 38 | |
|
| 38 | |
|
| 39 | |
|
| 62 | |
|
| 68 | |
|
| 68 | |
| 64 69 | ||
|
| 64 69 | |
|
| 64 69 | |
|
| 65 70 | |
| 66 71 | ||
|
| Item 8. A. Consolidated Statements and Other Financial Information. | 66 71 |
|
| 66 71 | |
|
| 67 72 | |
| 68 73 | ||
|
| 68 73 | |
|
| 68 73 | |
|
| 73 | |
|
| 73 | |
|
| 73 | |
|
| 73 | |
| 69 74 | ||
|
| 74 | |
| 74 | |||
|
| 71 76 | |
|
| 71 77 | |
|
| 72 77 | |
|
| 75 80 | |
|
| 75 80 | |
|
| 75 80 | |
|
| 75 80 | |
| Item 11. Quantitative and Qualitative Disclosures About Market Risk. | 76 81 | |
| Item 12. Description of Securities Other than Equity Securities. | 78 83 | |
79 84 | |||
| 79 84 | ||
| Item 14.Material Modifications to the Rights of Security Holders and Use of Proceeds. | 79 84 | |
| 80 85 | ||
|
| 80 85 | |
|
| 80 85 | |
|
| Item 15. D. Changes in internal control over financial reporting. | 80 85 |
| 81 86 | ||
| 81 86 | ||
| Item 16. D. Exemptions from the listing standards for audit committees | 87 | |
| Item 16. E. Purchase of equity securities by the issuer and affiliated purchases | 82 87 | |
| 88 | ||
| 83 88 | ||
| 84 89 | ||
85 90 | |||
| 85 90 | ||
| 85 90 | ||
| 85 90 | ||
| · | our ability to attract and retain sufficiently qualified management and key employees; |
| · | restrictions on our ability to secure additional financing or refinance our existing financing; |
| · | the ongoing integration of HPE Software into the Company, which may impede the ability of the Enlarged Group to obtain the same types and levels of benefits, services and resources that have historically been provided to HPE Software by HPE, which could lead to a failure to realize the anticipated benefits of the Merger; |
| · | the implementation of the U.S. Tax Cuts and Jobs Act and any impact to our earnings; |
| · | our exposure to fluctuations in interest rates, which could affect our variable rate indebtedness and currency exchange rates; |
| · | the covenants under our Credit Facilities (see Note 21 of the consolidated financial statements in Item 18); |
| · | our dependence on intellectual property, our ability to protect intellectual property and third-party claims of infringement on intellectual property; |
| · | our ability to develop products and services that satisfy the needs of our customers; |
| · | competition in the markets in which we operate; |
| · | the availability, integrity and security of our IT systems; |
| · | our ability to protect the personal information of our customers; |
| · | the effectiveness of our sales force and distribution channels; |
| · | our potential liability or lost business opportunities related to defective products; |
| · | decisions to discontinue or restrict development expenditures; |
| · | our ability to complete the SUSE disposition on the terms contemplated, or at all; |
| · | the possibility of being required, in certain circumstances, to make tax indemnification payments to the former owner of the HPE Software business; and |
| · | our ability to manage the risks involved in the foregoing. |
| · | On September 1, 2017, the Group acquired the software business of Hewlett Packard Enterprise (“HPE”), which are reported within the Micro Focus product portfolio. The Group aligned the Micro Focus accounting period end (previously April 30) to the HPE Software business accounting period end of October 31 resulting in an 18-month accounting period to October 31, 2018 for the combined entity. |
| · | On August 21, 2018, shareholders voted to approve the proposed transaction whereby the Group agreed to sell its SUSE Product Portfolio. On approval of this vote, the SUSE operating segment meets the definition of a discontinued operation under IFRS 5, which results in the SUSE performance being excluded from the individual line items of the income statement and balance sheet. SUSE is instead included as a single line entitled “profits from discontinued operations” within the income statement and as an “asset held for sale” or “liability held for sale” on the balance sheet. The transaction is expected to complete in the first quarter of calendar year 2019 and SUSE remains under the control of the Group until that point. |
18 months ended October 31, 2018 $’000 | 12 months ended April 30, 2017 1 $’000 | 12 months ended April 30, 2016 1 $’000 | 12 months ended April 30, 2015 1 $’000 | 12 months ended April 30, 2014 $’000 | ||||||||||||||||
| Revenue | 4,754,398 | 1,077,273 | 991,233 | 733,435 | 433,058 | |||||||||||||||
| Cost of sales | (1,259,306 | ) | (216,412 | ) | (202,530 | ) | (83,313 | ) | (29,912 | ) | ||||||||||
| Gross profit | 3,495,092 | 860,861 | 788,703 | 650,122 | 403,146 | |||||||||||||||
| Selling and distribution costs | (1,670,000 | ) | (363,133 | ) | (312,610 | ) | (252,359 | ) | (120,669 | ) | ||||||||||
| Research and development expenses | (659,413 | ) | (122,824 | ) | (117,395 | ) | (141,948 | ) | (57,833 | ) | ||||||||||
| Administrative expenses | (788,855 | ) | (147,512 | ) | (111,502 | ) | (119,198 | ) | (68,924 | ) | ||||||||||
| Operating profit | 376,824 | 227,392 | 247,196 | 136,617 | 155,720 | |||||||||||||||
| Finance costs | (350,366 | ) | (96,824 | ) | (98,357 | ) | (56,231 | ) | (8,197 | ) | ||||||||||
| Finance income | 7,654 | 979 | 1,009 | 1,210 | 318 | |||||||||||||||
| Profit before tax | 34,112 | 131,547 | 149,848 | 81,596 | 147,841 | |||||||||||||||
| Taxation | 673,081 | (7,464 | ) | (13,869 | ) | 14,338 | (25,759 | ) | ||||||||||||
| Profit from continuing operations | 707,193 | 124,083 | 135,979 | 95,934 | 122,082 | |||||||||||||||
| Discontinued Operation | 76,940 | 33,720 | 26,993 | 5,517 | - | |||||||||||||||
| Profit after tax | 784,133 | 157,803 | 162,972 | 101,451 | 122,082 | |||||||||||||||
| Other comprehensive income | 29,305 | (5,746 | ) | 598 | (11,270 | ) | 2,176 | |||||||||||||
| Total comprehensive income for the period | 813,438 | 152,057 | 163,570 | 90,181 | 124,258 | |||||||||||||||
| Attributable to: | ||||||||||||||||||||
| Equity shareholders of the Company | 813,353 | 152,160 | 163,492 | 90,483 | 124,258 | |||||||||||||||
| Non-controlling interest | 85 | (103 | ) | 78 | (302 | ) | - | |||||||||||||
| Total comprehensive income for the period | 813,438 | 152,057 | 163,570 | 90,181 | 124,258 | |||||||||||||||
| Continuing and Discontinued Operations | ||||||||||||||||||||
| Earnings per share | ||||||||||||||||||||
| Basic (cents) | 201.70 | 68.88 | 74.50 | 58.54 | 84.75 | |||||||||||||||
| Diluted (cents) | 196.17 | 66.51 | 71.61 | 56.71 | 82.35 | |||||||||||||||
| Continuing Operations | ||||||||||||||||||||
| Earnings per share | ||||||||||||||||||||
| Basic (cents) | 181.91 | 54.17 | 62.40 | 55.36 | 84.75 | |||||||||||||||
| Diluted (cents) | 176.92 | 52.31 | 59.97 | 53.64 | 82.35 | |||||||||||||||
October 31, 2018 $’000 | April 30, 2017 1 $’000 | April 30, 2016 1 $’000 | April 30, 2015 1 $’000 | April 30, 2014 1 $’000 | ||||||||||||||||
| Non-current assets | 13,720,467 | 3,995,511 | 3,482,575 | 3,629,748 | 422,314 | |||||||||||||||
| Current assets | 1,917,637 | 442,193 | 954,361 | 460,967 | 140,072 | |||||||||||||||
| Current assets classified as held for sale | 1,142,451 | - | - | - | - | |||||||||||||||
| Total assets | 16,780,555 | 4,437,704 | 4,436,936 | 4,090,715 | 562,386 | |||||||||||||||
| Current liabilities | 2,010,391 | 944,697 | 1,061,797 | 988,030 | 568,433 | |||||||||||||||
| Current liabilities classified as held for sale | 437,699 | - | - | - | - | |||||||||||||||
| Non-current liabilities | 6,540,485 | 1,879,517 | 1,781,411 | 1,824,624 | 10,204 | |||||||||||||||
| Total liabilities | 8,988,575 | 2,824,214 | 2,843,208 | 2,812,654 | 578,637 | |||||||||||||||
| Net Assets | 7,791,980 | 1,613,490 | 1,593,728 | 1,278,061 | (16,251 | ) | ||||||||||||||
| Share capital | 65,798 | 39,700 | 39,573 | 39,555 | 37,802 | |||||||||||||||
| Number of shares | 436,800,513 | 229,674,479 | 228,706,210 | 228,587,397 | 152,419,885 | |||||||||||||||
18 months ended October 31, 2018 | 12 months ended April 30, 2017 | 12 months ended April 30, 2016 | 12 months ended April 30, 2015 | 12 months ended April 30, 2014 | ||||||||||||||||
| Interim dividend 1 | 34.60 | 29.73 | 16.94 | 15.40 | 14.00 | |||||||||||||||
| Interim dividend 2 | 58.33 | - | - | - | - | |||||||||||||||
| Final dividend | 58.33 | 58.33 | 49.74 | 33.00 | 30.00 | |||||||||||||||
| Dividend declared per share (cents) | 151.26 | 88.06 | 66.68 | 48.40 | 44.00 | |||||||||||||||
Products | |
Principal Risk Description To remain successful, the Group must ensure that its products continue to meet the requirements of customers and must be effectively balanced between growth and legacy products. Investment in research and innovation in product development is essential to meet customer and partner requirements in order to maximize revenues and corporate performance. The Group has a large number of products, at differing stages of their life cycle. The extent of investment in each product set needs to be managed and prioritized considering the expected future prospects, to ensure an effective balance between growth and legacy products. The Group’s business and reputation may be harmed by errors or defects in its products. | |
Potential Impact If products do not meet the requirements of customers, they will seek alternative solutions, resulting in the loss of new revenue opportunities and the cancellation of existing contracts. Insufficient focus on key research and development projects may damage the long-term growth prospects of the Group. |
Go-To-Market (“GTM”) Models | |
Principal Risk Description For the Group to succeed in meeting revenue and growth targets it requires successful GTM models across the full product portfolio, with effective strategies and plans to exploit channel opportunities and focus the sales force on all types of customer categories. In addition, effective GTM models may be more successful if accompanied by compelling Micro Focus brand awareness programs. The Group is dependent upon the effectiveness of its sales force and distribution channels to maintain and grow license, maintenance and consultancy sales. | |
Potential Impact Poor design and/or execution of GTM plans may limit the success of the Group by targeting the wrong customers through the wrong channels and using the wrong product offerings. |
Competition | |
Principal Risk Description Comprehensive information about the markets in which Micro Focus and SUSE operate is required for the Group to assess competitive risks effectively and to perform successfully. The Group operates in a number of competitive markets and success in those markets depends on a variety of factors. | |
Potential Impact Failure to understand the competitive landscape adequately and thereby identify where competitive threats exist may damage the successful sales of the Group’s products. If the Group is not be able to compete effectively against its competitors, it is likely to lose market share, which may result in decreased sales and weaker financial performance. |
Employees and culture | |
Principal Risk Description The retention and recruitment of highly skilled and motivated employees, at all levels of the Group, is critical to the success and future growth of the Group in all countries in which it operates. Employees require clear business objectives, and a well communicated vision and values, for the Group to achieve alignment and a common sense of corporate purpose among the workforce. | |
Potential Impact Failure to retain and develop skill sets, particularly in sales, IT and research and development, may hinder the Group’s sales and development plans. Weak organizational alignment and inadequate incentivization may lead to poor performance and instability. It could also have an adverse impact on the realization of strategic plans. |
Business Strategy and Change Management | |
Principal Risk Description The Group is engaged in a number of major change projects, including acquisitions and divestments, to shape and grow the business by strengthening the portfolio of products and capabilities and IT projects to standardize systems and processes. The successful integration of businesses will build a solid base for further expansion. These projects expose the Group to significant transformation risks. The Group’s strategy may involve the making of further acquisitions to protect or enhance its competitive position and failure to identify, manage, complete and integrate acquisitions, divestitures and other significant transactions successfully could have a material adverse effect on the Group’s business. The integration of HPE Software and the divestment of SUSE are both complex transactions with a range of integration and separation risks. The integration of HPE Software with the existing businesses carried on by the Group may be more time consuming and costly than anticipated. Successful execution of the SUSE divestment may be compromised by adding a new level of complexity to an existing heightened operation environment across the Group and be a distraction to deliver business plans. | |
Potential Impact Failure to analyze, execute and co-ordinate the various integration, divestment and transformation programs successfully may result in the disruption of the ongoing business without delivering the anticipated strategic and operational benefits of such transactions. In addition, this may affect the ability to execute strategic plans for growth. |
IT Systems and information | |
Principal Risk Description The Group’s operations, as with most businesses, are dependent on maintaining and protecting the integrity and security of the IT systems and management of information. Integration of HPE Software with the existing businesses, including the respective IT systems, may be more time consuming and costly than anticipated, given the amount of change management that is involved. The Group continues to operate on two IT architectures with the attendant complexity to business operations and the control environment. | |
Potential Impact Disruption to the IT systems could adversely affect business and Group operations in a variety of ways, which may result in an adverse impact on business operations, revenues, customer relations, supplier relations, and reputational damage. Dependency on IT providers could have an adverse impact on revenue and compliance in the event that they cannot resume business operations. |
Legal and Regulatory Compliance | |
Principal Risk Description The Group operates across a number of jurisdictions and two regulated exchanges. Compliance with national and regional laws and regulations is essential to successful business operations. The Group may be involved in legal and other proceedings from time to time, and as a result may face damage to its reputation or legal liability. The Group has entered into various acquisitions and a disposal over recent years and may be subject to, or have the benefit of, certain residual representations, warranties, indemnities, covenants or other liabilities, obligations or rights. The Group has a variety of customer contracts in a variety of sectors, including government clients. | |
Potential Impact Failure to comply could result in civil or criminal sanctions (i.e. personal liability for directors), as well as possible claims, legal proceedings, fines, loss of revenue and reputational damage. |
Intellectual Property (“IP”) | |
Principal Risk Description The Group is dependent upon its intellectual property, and its rights to such intellectual property may be challenged or infringed by others or otherwise prove insufficient to protect its business. Some of the Group’s SUSE products utilize Open Source technology, which is dependent upon third party developers. The Group’s products and services depend in part on intellectual property and technology licensed from third parties, and third-party claims of intellectual property infringement against the Group may disrupt its ability to sell its products and services. | |
Potential Impact Failure could adversely affect the ability of the Group to compete in the market place and affect the Group’s revenue and reputation. |
Treasury | |
Principal Risk Description The Group operates across a number of jurisdictions and so is exposed to currency fluctuations. The risk of foreign exchange fluctuations may be increased as a result of Brexit. The Group may require additional debt funding in order to execute its acquisition strategy. The Group is exposed to interest rate risk related to its variable rate indebtedness, which could cause its indebtedness service obligations to increase significantly. The Group’s operational and financial flexibility may be restricted by its level of indebtedness and covenants and financing costs could increase or financing could cease to be available in the long term. The Group may incur materially significant costs if it breaches its covenants under its banking arrangements. | |
Potential Impact The relative values of currencies can fluctuate and may have a significant impact on business results. Insufficient access to funding could limit the Group’s ability to achieve its desired capital structure or to complete acquisitions. An increase in interest rates could have a significant impact on business results. |
Tax | |
Principal Risk Description The tax treatment of the Group’s operations is subject to the risk of challenge by tax authorities in all territories in which it operates. Cross-border transactions may be challenged under tax rules and initiatives targeting multinationals’ tax arrangements, including the OECD’s Base Erosion and Profit Shifting project and EU state aid rules. As a result of the HPE Software acquisition, the Group may be required under the tax matters agreement entered into with HPE (the “TMA”) to indemnify HPE, if actions undertaken by the Group affect the tax treatment of the separation of HPE Software from HPE. Future changes to U.S. and non-U.S. tax laws could adversely affect the Group. The Group will be subject to tax laws of numerous jurisdictions, and the interpretation of those laws is subject to challenge by the relevant governmental authorities. | |
Potential Impact Tax liabilities in various territories in which the Group operates, particularly as a result of the HPE Software acquisition, could be significantly higher than expected. The Group may be obliged to make indemnification payments to HPE under the TMA, which, if payable, would likely be substantial. |
Macro-Economic Environment and Brexit | |
Principal Risk Description The Group’s businesses may be subject to inherent risks arising from the general and sector specific economic and political conditions in one or more of the markets in which the Group operates. This is heightened by the fact the Group sells and distributes its software products globally. Exposure to political developments in the United Kingdom, including the terms and manner of the U.K.’s withdrawal from the EU (Brexit), could have an adverse effect on the Group. Additionally, failure to have appropriate processes in place to assess, respond, monitor and track the impact of Brexit on the Group could also have an adverse effect on the Group. | |
Potential Impact Adverse economic conditions could affect sales, and other external economic or political matters, such as price controls, could affect the business and revenues. Adverse Brexit outcomes could also negatively impact upon people, tax, treasury, regulatory or commercial matters across the Group. |
Cyber Security (previously part of IT Systems and Information) | |
Principal Risk Description Risk of hacking or other cybersecurity threat leading to data loss and/or disruptions to business. The IT environments of both the Group and its customers may be subject to hacking or other cybersecurity threats, which may harm customer relationships, financial performance and the market perception of the effectiveness of the Group’s products. | |
Potential Impact Data loss, which could harm client and customer relationships, compliance and/or perception of the effectiveness of the Group’s products. |
Internal Controls over financial reporting | |
Principal Risk Description As part of its disclosure obligations in the United States the Group is required to furnish an annual report by its management on its internal controls over financial reporting and include an attestation report issued by its independent registered public accounting firm pursuant to Section 404 of the Sarbanes –Oxley Act of 2002 (SOX) . The first report will be required to be produced as of October 31, 2019. As part of the SOX Implementation Plan, we have identified two material weaknesses in our internal control over financial reporting, as defined in the standards established by the Public Company Accounting Oversight Board of the United States, or PCAOB, and other control deficiencies. The two identified material weaknesses related to the fact that the Group did not have sufficient formally documented and implemented processes and review procedures, nor did it have sufficient formality and evidence of controls over key reports and spreadsheets. Following the identification of the material weaknesses and control deficiencies, we have taken and plan to continue to take remedial measures to remedy these weaknesses. For details of these remedies, see ‘‘Item 15. D Changes in internal control over financial reporting”. However, there is a risk that the implementation of these measures may not fully address the material weaknesses in our internal control over financial reporting by October 31, 2019, and there is a risk that other deficiencies may be identified. | |
Potential Impact Failure to correct the material weaknesses or our failure to discover and address any other material weakness or control deficiencies could result in inaccuracies in our financial statements and impair our ability to comply with applicable financial reporting requirements and related regulatory filings on a timely basis. It could also result in an adverse reaction in the financial markets due to a loss of confidence in the reliability of the Group’s financial statements and could have a material adverse effect on the Group’s business, financial condition, results of operation and prospects. |
| · | Enterprise DevOps (Speed) |
| · | Hybrid IT Management (Agility) |
| · | Security, Risk, and Governance (Security) |
| · | Predictive Analytics (Insights) |
| • | On September 1, 2017, the Group acquired the Software business of Hewlett Packard Enterprise (“HPE Software”), within the Micro Focus Product Portfolio. |
| • | On July 2, 2018, the Group announced, and on August 21, 2018, our shareholders approved, the sale of our SUSE operating segment. The transaction is expected to complete in the first quarter of calendar year 2019 and SUSE remains under the control of the Group until this point. For the purposes of the Group’s financial statements, the SUSE business is treated as a discontinued operation. |
New Models Products or consumption models (cloud and subscription) that open new opportunities could become growth drivers or represent emerging use cases that we need to be able to embrace. | Growth Drivers Products with consistent growth performance and market opportunity to build the future revenue foundations of the Group. | ||
Optimize Products with declining revenue performance driven by the market or execution. Investments directed to correct trajectory to move back to the core category or focused to optimize long-term returns. | Core Products that have maintained broadly flat revenue performance but represent the current foundations of the Group and must be protected and extended. |
The customer proposition |
| What sets us apart | What drives our business | What this means for our customers | ||||
Strong products and intellectual property Our products are deeply embedded in customers’ infrastructure and underpin transactions, processes and systems globally. + | Bridging now and next We bridge the now and the next, enabling mission critical applications and data to continue to be leveraged across the organization. + | > | Improved return on investment so customers can extend productive use and maximize return on investment (“ROI”). | |||
Broad portfolio Our portfolio delivers solutions across many IT disciplines and provides customers with the opportunity to simplify their vendor landscape. + | Latest innovative features We build the latest innovative features and capabilities that are enterprise-grade and scalable into our core products. + | > | Reduce risk so customers can run and transform their business through adopting innovation with less risk. | |||
Customer centered innovation We fully understand the needs of customers and deliver tangible business impact. + | Easy to do business with We provide customers with the choices to meet their IT operating objectives and run their business models. This includes flexibility in both deployment and commercial models. | > | Flexibility so customers can select what works for their enterprise and budget. This allows customers to plan for today and tomorrow with flexibility to adapt and change. | |||
The four-box model Our investment priorities consider opportunities in all stages of the product lifecycle to ensure that we maximize the value delivered to the customers over the entire life of a product. |
What this means for our investors |
| What sets us apart | What drives our business | What this means for our investors | |||||
| 1 | We operate at size and scale As a natural consolidator in the market, we have economies of scale leveraging shared functions and resources across our portfolio. + | A proven financial operating model Efficient and fit for purpose operating model supported by strong financial discipline. + | > | Return on investment Total shareholder returns of between 15-20% | |||
| 2 | People We have a broad, highly experienced management team, skilled in applying the Micro Focus financial and operating model. + | Value creation through consolidation Experience in bringing together complex products through market consolidation, delivering better integration and strong value creation. + | > | Margins Industry leading operating margins. | |||
| 3 | Highly cash generative portfolio We have a broad portfolio of products with significant market positions and high switching costs. This generates significant recurring revenue streams and cash generation. + | Efficiency in capital allocation Efficient investment in capital whether organic or inorganic. | > | Cash returns Exceptional levels of cash generation and returns to shareholders. | |||
| 4 | A track record of market consolidation We have a proven track record of consolidating the market and successfully executing complex integrations. |
| Speed | Enterprise DevOps Build and deliver better software faster | In the digital economy, time-to-market and quality determine success. With our solutions, our customers can unleash the power of DevOps across their hybrid IT landscape — quickly bringing innovative ideas to life at the pace your business demands. Now speed and quality can go hand in hand. | |||
| Agility | Hybrid IT Management Operate with agility | Hybrid IT can be a sprawling, volatile, siloed place that jeopardizes our customers’ ability to compete. With our solutions, our customers can master hybrid IT with new agility — bridging traditional and transformational IT services from mainframe to mobile, from corporate to cloud. Embracing the future does not mean replacing the past. | |||
| Security | Security, Risk & Governance Secure what matters most – identities, applications, and data | Cyber threats are escalating. Aging applications and both existing and new processes are full of unforeseen risks. Privacy and compliance requirements are mounting and point solutions do not offer the scope, vision, or cross-silo analytics needed for these company-wide challenges. With our solutions, our customers can take a holistic, analytics-driven approach to securing what matters most — identities, applications, and data. | |||
| Insights | Predictive Analytics Accurate predictions, actionable insights, and automated discovery | Lakes of data are valuable only if our customers can surface the insights hidden within their depths. With our solutions, they can leverage machine learning to transform unlimited volumes of data into accurate, actionable, automated insights — at the speed of your business. Now they are ready to make predictions and influence business outcomes. | |||
Our product group Micro Focus has 5 portfolios with over 300 product lines, which each deliver unique value in areas our customers demand. Our product groups, as set out in the Portfolio Review section, include a combination of stand-alone products that address specific use cases and integrated suites to help our customers run and transform IT infrastructure. This approach means our customers are able to innovate faster with less risk. | 5 product portfolios | ||||
Application Modernization & Connectivity (AMC) | Application Delivery Management (ADM) | IT Operations Management (ITOM) | Security | Information Management & Governance (IM&G) | |||||
| Micro Focus’ Application Modernization and Connectivity solutions help customers lower cost and improve speed and agility by modernizing core business systems. With a combination of COBOL, Mainframe, Host Connectivity and CORBA software, this portfolio helps customers bridge the old and the new and future-proof investments made in technology, applications and processes over time. | Micro Focus’ Application Delivery Management solutions help our customers to accelerate their application delivery and ensure quality and security at every stage of the application lifecycle from the first backlog item, to the user experience in production. Micro Focus is the only vendor to provide an integrated end-to-end application life-cycle management solution that is built for any methodology, technology, and delivery model. | Micro Focus’ IT Operations Management solutions allow teams to operate with agility to both run and transform their businesses. Providing customers with the capabilities to manage and accelerate the end-to-end service fulfilment lifecycle, enabling them to more efficiently assure and govern services and helping them shift to being an IT service provider that continually provides value and insights. Micro Focus’ ITOM portfolio has a broad range of offerings from enterprise service and network monitoring and management through to cloud-native and multi cloud management and migration supported by an integrated platform with a common data layer, analytics and orchestration (AIOps). | Micro Focus provides customers with a comprehensive set of cybersecurity solutions that protect data, secure applications and endpoints, manage identities and access, and provide continuous security motoring through an operations center. Micro Focus Security solutions help customers secure what matters most—identities, applications and data. | Micro Focus’ Information Management & Governance solutions help customers access, understand and control data throughout its lifecycle to manage information-borne risk that can manifest itself in the form of fines, sanctions and legal matters. Primary solutions address compliance, governance and privacy requirements. | |||||
Case study: Empire Life | Case study: CONA services LC | Case study: Allianz Czech Republic | Case study: Allegiant | Case study: RTVE | |||||
The challenge Simplify support and maintenance environment, while achieving cost savings. Empire Life wanted to move towards DevOps and needed to be more responsive to growing business requirements. Products and services Micro Focus Enterprise Developer Micro Focus Enterprise Server Results • 30% development productivity increase. • Annual cost savings of up to $1.15m. • Ready to move to DevOps. • Higher quality product and service. • Increased team collaboration. | The challenge Ensure SAP platform stability and uninterrupted service while deploying rapidly at a scale during Coca-Cola bottler refranchising effort. Products and services Performance Centre SaaS, Application Lifecycle Management, Professional services, Customer Success Manager. Results • Performance test SAP applications on shared-instance platform used by North America Coca-Cola bottlers to generate $21bn in annual revenue. • Scale users and loads without service interruption. • Support uninterrupted daily operations of more than 80,000 bottler employees. | The challenge Allianz wanted to take a more transparent and collaborative approach to all its key DevOps processes by implementing a home developed helpdesk system and separate tool for development processes Products and services Use Micro Focus SSM to create a single point of contract into IT and streamline both IT and business processes Results · Our unified platform for development and helpdesk requirements · 30% increase in efficiency and productivity · Improved helpdesk performance · Increased insight and transparency + Improved collaboration between IT and business | The challenge Protect credit card data and customer information while complying with the Payment Card Industry Data Security Standard (PCI DSS). Products and services Voltage SecureData, Voltage SecureData Web, Secure Stateless Tokenization. Results • Millions of dollars in enhanced revenue by redeploying development staff to revenue generating projects. • 100% customer transactions now protected by Voltage SecureData. • No credit card details stored- reduced from millions previously. | The challenge Significantly reduce TV production times by creating an easily searchable repository containing 50 years’ worth of archived content with over 20m assets. Products and services Micro Focus IDOL Results • Content searches and retrieval completed in seconds instead of hours or days • Support corporate digital transformation project. • Effective collaborative relationship with Micro Focus Professional Services. • User-friendly search solution for producers and journalists. |
| • | “Property, plant and equipment” in note 12 of the “Notes to the consolidated financial statements” in Item 18; |
| • | “Operating lease commitments – minimum lease payments” in note 36 of the “Notes to the consolidated financial statements” in Item 18. |
| · | the 18 month ended October 31, 2018, as compared to the 12 month period ended April 30, 2017; and |
| · | the 12 month period ended April 30, 2017, as compared to the 12 month period ended April 30, 2016. |
| · | Status of the unresolved matter; |
| · | Strength of technical argument and clarity of legislation; |
| · | External advice; |
| · | Resolution process, past experience and precedents set with the particular taxing authority; |
| · | Agreements previously reached in other jurisdictions on comparable issues; and |
| · | Statute of limitations. |
| · | On September 1, 2017, the Group acquired the software business of HPE, which are reported within the Micro Focus Product Portfolio. The Group aligned the Micro Focus accounting period end (previously April 30,) to the HPE Software business period end of October 31, resulting in an 18-month accounting period to October 31, 2018 for the combined entity. |
| · | On August 21, 2018, shareholders voted to approve the proposed transaction whereby the Group agreed to sell its SUSE Product Portfolio. Following the approval, the SUSE operating segment meets the definition of a discontinued operation under IFRS 5, which results in the SUSE performance being excluded from the individual line items of the income statement and balance sheet. SUSE is instead included as a single line entitled “profits from discontinued operations” within the income statement and as an “asset held for sale” or “liability held for sale” on the balance sheet. The transaction is expected to complete in the first quarter of calendar year 2019 and SUSE remains under the control of the Group until that point. |
18 months ended October 31, 2018 | 12 months ended April 30, 2017 | 12 months ended April 30, 2016 | |
| HPE Software | 14 months post acquisition | Excluded | Excluded |
| SUSE | Excluded from continuing operations | Revised and excluded from continuing operations | Revised and excluded from continuing operations |
18 months ended October 31, 2018 | 12 months ended April 30, 2017 1 | |||||||
| Continuing operations | $m | $m | ||||||
| Revenue | 4,754.4 | 1,077.3 | ||||||
| Operating profit (before exceptional items) | 915.0 | 324.7 | ||||||
| Exceptional items | (538.2 | ) | (97.3 | ) | ||||
| Operating profit | 376.8 | 227.4 | ||||||
| Net finance costs | (336.9 | ) | (95.8 | ) | ||||
| Exceptional finance costs | (5.8 | ) | - | |||||
| Profit before tax | 34.1 | 131.6 | ||||||
| Taxation | 673.1 | (7.5 | ) | |||||
| Profit from continuing operations | 707.2 | 124.1 | ||||||
| Profit from discontinued operations | 76.9 | 33.7 | ||||||
| Profit for the period | 784.1 | 157.8 | ||||||
18 months ended October 31, 2018 | 12 months ended April 30, 2017 1 | Period-on- period change | ||||||||||
| Continuing operations | $m | $m | % | |||||||||
| Licence | 1,213.7 | 308.4 | 293.5 | % | ||||||||
| Maintenance | 2,861.6 | 727.6 | 293.3 | % | ||||||||
| SaaS & other recurring | 373.9 | - | n/a | |||||||||
| Consulting | 366.3 | 48.2 | 660.0 | % | ||||||||
| Revenue before haircut | 4,815.5 | 1,084.2 | 344.2 | % | ||||||||
| Deferred revenue haircut | (61.1 | ) | (6.9 | ) | 785.5 | % | ||||||
| Total Revenue | 4,754.4 | 1,077.3 | 341.3 | % | ||||||||
| Continuing operations | Licence $m | Maintenance $m | Consulting $m | SaaS & other recurring $m | Total $m | |||||||||||||||
| Application Modernization & Connectivity (AMC) | 256.3 | 497.6 | 17.9 | - | 771.8 | |||||||||||||||
| Application Delivery Management (ADM) | 185.4 | 646.7 | 41.6 | 114.1 | 987.8 | |||||||||||||||
| IT Operations Management (ITOM) | 363.2 | 869.9 | 192.8 | 15.1 | 1,441.0 | |||||||||||||||
| Security | 291.6 | 580.3 | 81.4 | 41.6 | 994.9 | |||||||||||||||
| Information Management & Governance (IM&G) | 117.2 | 267.1 | 32.6 | 203.1 | 620.0 | |||||||||||||||
| Subtotal | 1,213.7 | 2,861.6 | 366.3 | 373.9 | 4,815.5 | |||||||||||||||
| Deferred revenue haircut | (7.6 | ) | (42.7 | ) | (2.0 | ) | (8.8 | ) | (61.1 | ) | ||||||||||
| Total Revenue | 1,206.1 | 2,818.9 | 364.3 | 365.1 | 4,754.4 | |||||||||||||||
18 months ended October 31, 2018 | 12 months ended April 30, 2017 | |||||||
| Continuing operations | $m | $m | ||||||
| Cost of sales | 1,259.3 | 216.5 | ||||||
| Selling and distribution costs | 1,670.0 | 363.1 | ||||||
| Research and development expenses | 659.4 | 122.8 | ||||||
| Administrative expenses | 788.9 | 147.5 | ||||||
| Total operating costs | 4,377.6 | 849.9 | ||||||
18 months ended October 31, 2018 | 12 months ended April 30, 2017 | |||||||
| $m | $m | |||||||
| Exceptional items | ||||||||
| MF/ HPE Software business integration related: | ||||||||
| System and IT infrastructure costs | 114.4 | - | ||||||
| Integration costs | 147.6 | - | ||||||
| Severance | 129.1 | - | ||||||
| Property costs | 29.9 | - | ||||||
| MF/ HPE Software business integration related costs | 421.0 | - | ||||||
| SUSE and other divestiture costs | 21.3 | - | ||||||
| HPE Software business acquisition / pre-acquisition costs | 70.1 | 58.0 | ||||||
| Integration in respect of previous acquisitions | 17.0 | 27.7 | ||||||
| Other acquisition costs | - | 2.6 | ||||||
| Property costs relating to previous acquisitions | 8.2 | 5.5 | ||||||
| Severance costs relating to previous acquisitions | 0.6 | 3.5 | ||||||
| Total exceptional costs (reported in Operating profit) | 538.2 | 97.3 | ||||||
| · | System and IT infrastructure costs of $114.4 million principally reflect the cost of implementing and then stabilizing the IT platform acquired with the HPE Software business (“FAST”); |
| · | Integration costs of $147.6 million across a wide range of projects undertaken to conform, simplify and increase efficiency across the two businesses; |
| · | Severance costs of $129.1 million in relation to ongoing headcount reductions as we integrate the HPE Software business; and |
| · | Property costs of $29.9 million as the Group began the process of simplifying the real estate footprint by exiting 27 offices since the completion of the transaction. |
| · | Amortization of intangible assets increased from $206.8 million in the 12 months ended April 30, 2017, to $903.0 million in the 18 months ended October 31, 2018, predominately relating to the amortization of customer relationships and technology acquired from HPE; and |
| · | Depreciation of plant property and equipment increased from $9.7 million to $88.6 million, reflecting the assets associated with the larger headcount within the HPE business. |
18 months ended October 31, 2018 | 12 months ended April 30, 2017 | |||||||||||||||
Basic Cents | Diluted Cents | Basic Cents | Diluted Cents | |||||||||||||
| Continuing operations | 181.91 | 176.92 | 54.17 | 52.31 | ||||||||||||
| Discontinued operations | 19.79 | 19.25 | 14.71 | 14.20 | ||||||||||||
| Total EPS | 201.70 | 196.17 | 68.88 | 66.51 | ||||||||||||
12 months ended April 30, 2017 1 $m | 12 months ended April 30, 2016 1 $m | |||||||
| Revenue | 1,077.3 | 991.2 | ||||||
| Cost of sales | (216.4 | ) | (202.5 | ) | ||||
| Gross profit | 860.9 | 788.7 | ||||||
| Selling and distribution costs | (363. 2 | ) | (312.6 | ) | ||||
| Research and development expenses | (122.8 | ) | (117.4 | ) | ||||
| Administrative expenses | (147. 5 | ) | (111.5 | ) | ||||
| Operating profit | 227.4 | 247.2 | ||||||
| Share of associates results | - | - | ||||||
| Finance costs | (96.8 | ) | (98.4 | ) | ||||
| Finance income | 0.9 | 1.0 | ||||||
| Profit before tax | 131.5 | 149.8 | ||||||
| Taxation | (7.4 | ) | (13.8 | ) | ||||
| Profit from continuing operations | 124.1 | 136.0 | ||||||
| Discontinued Operation | 33.7 | 27.0 | ||||||
| Profit after tax | 157.8 | 163.0 | ||||||
12 months ended April 30, 2017 1 | 12 months ended April 30, 2016 1 | Period-on- period change | ||||||||||
| Continuing operations | $m | $m | % | |||||||||
| License | 308.4 | 304.8 | 1.2 | % | ||||||||
| Maintenance | 727.6 | 654.7 | 11.1 | % | ||||||||
| SaaS and other recurring | - | - | - | |||||||||
| Consulting | 48.2 | 41.9 | 15.0 | % | ||||||||
| Constant currency revenue before haircut | 1,084.2 | 1,001.4 | 8.3 | % | ||||||||
| Deferred revenue haircut | (6.9 | ) | (10.2 | ) | (32.7 | %) | ||||||
| Total | 1,077.3 | 991.2 | 8.7 | % | ||||||||
License $’000 | Maintenance $’000 | Consulting $’000 | SaaS & other recurring $’000 | Total $’000 | ||||||||||||||||
| CDMS | 105.9 | 149.7 | 9.5 | - | 265.1 | |||||||||||||||
| Host Connectivity | 69.2 | 104.9 | 1.8 | - | 175.9 | |||||||||||||||
| Identity, Access & Security | 48.6 | 141.3 | 18.4 | - | 208.3 | |||||||||||||||
| Development & IT Operations Management Tools | 55.5 | 219.6 | 13.9 | - | 289.0 | |||||||||||||||
| Collaboration & Networking | 29.2 | 112.1 | 4.6 | - | 145.9 | |||||||||||||||
| Subtotal | 308.4 | 727.6 | 48.2 | - | 1,084.2 | |||||||||||||||
| Deferred revenue haircut | - | (6.9 | ) | - | - | (6.9 | ) | |||||||||||||
| Total Revenue | 308.4 | 720.7 | 48,2 | - | 1,077.3 | |||||||||||||||
License $m | Maintenance $m | Consulting $’m | SaaS & other recurring $m | Total $m | ||||||||||||||||
| CDMS | 104.7 | 145.2 | 8.9 | - | 258.8 | |||||||||||||||
| Host Connectivity | 89.9 | 107.2 | 2.9 | - | 200.0 | |||||||||||||||
| Identity, Access & Security | 52.4 | 145.6 | 22.1 | - | 220.1 | |||||||||||||||
| Development & IT Operations Management Tools | 33.9 | 121.3 | 2.2 | - | 157.4 | |||||||||||||||
| Collaboration & Networking | 23.9 | 135.4 | 5.8 | - | 165.1 | |||||||||||||||
| Subtotal | 304.8 | 654.7 | 41.9 | - | 1,001.4 | |||||||||||||||
| Deferred revenue haircut | - | (10.2 | ) | - | - | (10.2 | ) | |||||||||||||
| Total Revenue | 304.8 | 644.5 | 41.9 | - | 991.2 | |||||||||||||||
| Continued Operations | 12 months ended April 30, 2017 1 $m | 12 months ended April 30, 2016 1 $m | ||||||
| Cost of sales | 216.4 | 202.5 | ||||||
| Selling and distribution costs | 363. 2 | 312.6 | ||||||
| Research and development expenses | 122.8 | 117.4 | ||||||
| Administrative expenses | 147. 5 | 111.5 | ||||||
| Total Operating costs | 849.9 | 744.0 | ||||||
| Exceptional items | 12 months ended April 30, 2017 $m | 12 months ended April 30, 2016 $m | ||||||
| Integration costs | 27.7 | 23.6 | ||||||
| Acquisition costs | 2.6 | 0.5 | ||||||
| Pre-acquisition costs | 58.0 | 5.6 | ||||||
| Property costs | 5.5 | 6.0 | ||||||
| Severance and legal costs | 3.5 | (4.8 | ) | |||||
| Royalty provision releases | - | (3.0 | ) | |||||
| 97.3 | 27.9 | |||||||
| · | The amortization of $14.2 million of prepaid facility arrangement, original issue discounts and facility fees incurred on the Group’s loan facilities (2016: $13.9 million); |
| · | Loan interest and commitment fees of $82.0 million (2016: $84.0 million); |
| · | Interest on pension liability $0.6 million (2016: $0.5 million); |
| · | Other interest costs of $0.1million (2016: $0.1million); offset by |
| · | $1.0 million (2016: $1.0 million) of interest received. |
12 months ended April 30, 2017 | 12 months ended April 30, 2016 | |||||||||||||||
Basic Cents | Diluted Cents | Basic Cents | Diluted Cents | |||||||||||||
| Continuing operations | 54.17 | 52.31 | 62.40 | 59.97 | ||||||||||||
| Discontinued operations | 14.71 | 14.20 | 12.10 | 11.64 | ||||||||||||
| Total EPS | 68.88 | 66.51 | 74.50 | 71.61 | ||||||||||||
October 31, 2018 $’m | April 30, 2017 $’m | |||||||
| Non-current assets | 13,720.5 | 3,995.5 | ||||||
| Current assets | 1,917.6 | 442.2 | ||||||
| Current assets classified as held for sale | 1,142.5 | - | ||||||
| Total assets | 16,780.6 | 4,437.7 | ||||||
| Current liabilities | 2,010.4 | 944.7 | ||||||
| Current liabilities classified as held for sale | 437.7 | - | ||||||
| Non-current liabilities | 6,540.5 | 1,879.5 | ||||||
| Total liabilities | 8,988.6 | 2,824.2 | ||||||
| Net assets | 7,792.0 | 1,613.5 | ||||||
| Total equity attributable to owners of the parent | 7,791.0 | 1,612.5 | ||||||
| Non-controlling interests | 1.0 | 1.0 | ||||||
| Total equity | 7,792.0 | 1,613.5 | ||||||
| · | Non-current assets increased to $13,720.5 million primarily due to the recognition of goodwill totaling $4,858.4 million and purchased intangibles totaling $6,539.8 million recognized as a result of the acquisition of the HPE Software business; |
| · | Current assets increased from $442.2 million to $1,917.6 million with the Group acquiring $721.0 million of trade receivables with the HPE Software business. Since acquisition, the system issues set out earlier in this section have resulted in an increase in DSO days such that trade receivables for the total Group were $1,047.7 million at October 31, 2018. |
| · | Current assets and current liabilities classified as held for sale reflect primarily the assets and liabilities of SUSE business segment, which are due to be disposed of. |
| · | Non-current liabilities increased from $1,879.5 million to $6,540.5 million, primarily due to the new term bank loans drawn down in order to fund the acquisition of the HPE Software business. |
| · | Total equity attributable to the owners of the parent increased from $1,612.5 million to $7,791.0 million, driven primarily by the issue of new share capital on the acquisition of the HPE Software business. On completion of the acquisition of HPE Software business, American Depositary Shares representing 222,166,897 Ordinary Shares were issued to HPE Shareholders, representing 50.1% of the fully diluted share capital of the Company at that time. |
Term Loan B-2 | Term Loan B-3 | Seattle Spinco Term Loan B | Euro Term Loan B | Revolving Facility | Total | |||||||||||||||||||
| $m | $m | $m | $m | $m | $m | |||||||||||||||||||
| At April 30, 2017 | 1,515.2 | - | - | - | 80.0 | 1,595.2 | ||||||||||||||||||
| Acquisitions | - | - | 2,600.0 | - | - | 2,600.0 | ||||||||||||||||||
| Draw downs | - | 385.0 | - | 523.8 | 135.0 | 1,043.8 | ||||||||||||||||||
| Repayments | (11.4 | ) | (2.9 | ) | (19.5 | ) | (4.2 | ) | (215.0 | ) | (253.0 | ) | ||||||||||||
| Foreign exchange | - | - | - | 10.9 | - | 10.9 | ||||||||||||||||||
| At October 31, 2018 | 1,503.8 | 382.1 | 2,580.5 | 530.5 | - | 4,996.9 | ||||||||||||||||||
| October 31, 2018 | April 30, 2017 | |||||||
| $’000 | $’000 | |||||||
| Bank loan secured | 4,996,913 | 1,595,188 | ||||||
| Unamortized prepaid facility arrangement fees and original issue discounts | (151,033 | ) | (33,652 | ) | ||||
| 4,845,880 | 1,561,536 | |||||||
Term Loan B-2 | Term Loan B | Term Loan C | Term Loan B-3 | Seattle SpinCo Term Loan B | Euro Term Loan B | Revolving Facility | Total | |||||||||||||||||||||||||
| $’000 | $’000 | $’000 | $’000 | $’000 | $’000 | $’000 | $’000 | |||||||||||||||||||||||||
| At May 1, 2016 | - | 1,112,250 | 450,000 | - | - | - | 225,000 | 1,787,250 | ||||||||||||||||||||||||
| Repayments | - | (9,562 | ) | (37,500 | ) | - | - | - | (325,000 | ) | (372,062 | ) | ||||||||||||||||||||
| Draw downs | - | - | - | - | - | - | 180,000 | 180,000 | ||||||||||||||||||||||||
| Transfer | 1,515,188 | (1,102,688 | ) | (412,500 | ) | - | - | - | - | - | ||||||||||||||||||||||
| At April 30, 2017 | 1,515,188 | - | - | - | - | - | 80,000 | 1,595,188 | ||||||||||||||||||||||||
| Acquisitions | - | - | - | - | 2,600,000 | - | - | 2,600,000 | ||||||||||||||||||||||||
| Draw downs | - | - | - | 385,000 | - | 523,815 | 135,000 | 1,043,815 | ||||||||||||||||||||||||
| Repayments | (11,364 | ) | - | - | (2,888 | ) | (19,500 | ) | (4,184 | ) | (215,000 | ) | (252,936 | ) | ||||||||||||||||||
| Foreign exchange | - | - | - | - | - | 10,846 | - | 10,846 | ||||||||||||||||||||||||
| At October 31, 2018 | 1,503,824 | - | - | 382,112 | 2,580,500 | 530,477 | - | 4,996,913 | ||||||||||||||||||||||||
| · | The $1,503.8 million senior secured term loan B-2 issued by MA FinanceCo LLC is priced at LIBOR plus 2.25% (subject to a LIBOR floor of 0.00%); |
| · | The $2,580.5 million senior secured seven-year term loan B issued by Seattle SpinCo. Inc. is priced at LIBOR plus 2.50% (subject to a LIBOR floor of 0.00%) with an original issue discount of 0.25%; |
| · | The $382.1million senior secured seven-year term loan B-3 issued by MA FinanceCo LLC is priced at LIBOR plus 2.50% (subject to a LIBOR floor of 0.00%) with an original issue discount of 0.25%; and |
| · | The €466.5 million (equivalent to $530.5m) senior secured seven-year term loan B issued by MA FinanceCo LLC is priced at EURIBOR plus 2.75% (subject to a EURIBOR floor of 0.00%) with an original issue discount of 0.25%. |
| · | A senior secured revolving credit facility of $500.0 million, (“Revolving Facility”), with an interest rate of 3.25% above LIBOR on amounts drawn (and 0.375% on amounts undrawn) thereunder (subject to a LIBOR floor of 0.00%). |
| October 31, 2018 | April 30, 2017 | |||||||
| $’000 | $’000 | |||||||
| Carrying amount | 86,381 | - | ||||||
| Notional amount (4 x $562.5 million) | 2,250,000 | - | ||||||
| Maturity date | September 30, 2022 | - | ||||||
| Change in fair value of outstanding hedging instruments | 86,381 | - | ||||||
| Change in value of hedging instruments adjusted for credit risk | 84,666 | - | ||||||
| • | New Models – Products or consumption models (cloud and subscription) that open new opportunities that could become growth drivers or represent emerging use cases that we need to be able to embrace; |
| • | Growth Drivers – Products with consistent growth performance and market opportunity to build the future revenue foundations of the Group; |
| • | Optimize – Products with declining revenue performance driven by the market or execution where the trajectory must be corrected to move back to the core category or investments focused to optimize long-term returns; and |
| • | Core – Products that have maintained broadly flat revenue performance but represent the current foundations of the Group and must be protected and extended. |
| Payment due by period | ||||||||||||||||||||
| Less than 1 year | 1-3 years | 3-5 years | After 5 years | Total | ||||||||||||||||
| $m | $m | $m | $m | $m | ||||||||||||||||
| Debt principal repayment | 50.3 | 100.7 | 1,528.8 | 3,317.1 | 4,996.9 | |||||||||||||||
| Interest payments on debt | 227.6 | 448.9 | 309.3 | 96.6 | 1,082.4 | |||||||||||||||
| 277.9 | 549.6 | 1,838.1 | 3,413.7 | 6,079.3 | ||||||||||||||||
| Finance Leases | 13.6 | 13.3 | 1.6 | - | 28.5 | |||||||||||||||
| Operating Leases | 65.8 | 86.4 | 53.3 | 22.5 | 228.0 | |||||||||||||||
| 357.3 | 649.3 | 1,893.0 | 3,436.2 | 6,335.8 | ||||||||||||||||
| Name | Role | Age | Committee membership | |||
| Kevin Loosemore | Executive Chairman | 60 | ||||
| Stephen Murdoch | Chief Executive Officer | 52 | Executive Committee | |||
| Chris Kennedy | Chief Financial Officer | 55 | Executive Committee | |||
| Karen Slatford | Senior independent non-executive director | 62 | Remuneration Committee and Nomination Committee | |||
| Richard Atkins | Independent non-executive director | 66 | Audit Committee and Nomination Committee | |||
| Amanda Brown | Independent non-executive director | 50 | Audit Committee and Remuneration Committee | |||
| Darren Roos | Independent non-executive director | 44 | Remuneration Committee and Nomination Committee | |||
| Lawton Fitt | Independent non-executive director | 65 | Audit Committee and Nomination Committee | |||
| Silke Scheiber | Independent non-executive director | 46 | Audit Committee and Remuneration Committee |
| - | Strategy and budgets; |
| - | Business and financial performance; |
| - | Product plans and development; |
| - | Corporate activities; |
| - | Human resources; and |
| - | Investor relations. |
| · | Darren Roos and Silke Scheiber were appointed as non-executive directors on May 15, 2017; |
| · | Stephen Murdoch resigned from the board on September 1, 2017 to take up the role of Chief Operating Officer; |
| · | Chris Hsu was appointed Chief Executive Officer and John Schultz was appointed as a non-executive director on September 1, 2017; |
| · | Lawton Fitt was appointed as an HPE nominated independent non-executive director on October 17, 2017; |
| · | John Schultz resigned as an HPE nominated non-executive director on December 20, 2017; |
| · | Mike Phillips resigned as Chief Financial Officer on January 8, 2018 and stepped down from the board on January 31, 2018 (but continued as M&A Director); |
| · | Chris Kennedy was appointed as Chief Financial Officer and joined the board on January 8, 2018; |
| · | Chris Hsu resigned as Chief Executive Officer and Stephen Murdoch was appointed as Chief Executive Officer on March 19, 2018; |
| · | Nils Brauckmann resigned from the board on July 11, 2018 (but continued as Chief Executive Officer – SUSE). |
| · | Chris Kennedy is expected to resign as Chief Financial Officer and Brian McArthur-Muscroft is expected to be appointed as Chief Financial Officer on 21 February 2019. |
| · | Chris Kennedy (Chief Financial Officer); and |
| · | Brian McArthur-Muscroft (Chief Financial Officer) |
| • | “Related Parties” note in the “Notes to the consolidated financial statements” in Item 18; |
| • | “Employees and directors” in the “Notes to the consolidated financial statements” in Item 18; |
| • | “Pension commitments” in the “Notes to the consolidated financial statements” in Item 18. |
| 1 | Directors’ Remuneration Policy |
| 2 | Annual Report on Remuneration |
| 1. | The Additional Share Grants relating to The Attachmate Group (“TAG”) acquisition, which vested on November 1, 2017 reflects the Total Shareholder Return (“TSR”) performance for the three year period ended October 31, 2017. |
| 2. | The Additional Share Grants relating to the HPE Software business acquisition, which were replaced to align the vesting date with the 2020 value creation plan. |
| 3. | Performance for the 18 months ended 31 October 2018 and incentive outcomes relating to that financial period. |
| · | Base salary |
| · | Pension |
| · | Annual bonus |
| · | Long-term incentive |
| Element of Remuneration | Link to Strategy | Framework | |||
| Fixed | Base Salary | Attract and retain key talent to deliver the agreed strategy | Reviewed annually to ensure competitive, taking into account market positioning and increases generally within the Group | ||
| Benefits | Competitive package of benefits including car allowance and health plan | ||||
| Pension | Up to a maximum of 20% of base salary either as a pension contribution or cash allowance | ||||
| Variable | Annual bonus | Performance measures aligned to key financial metrics | Maximum opportunity of 150% base salary for achieving 10% growth in Adjusted EBITDA (“Adjusted EBITDA”) 2 | ||
| Long-term Incentives | Normally awards vest after three years to align to longer-term performance | Annual grants of up to 200% of base salary with a performance measure based on growth in aggregate EPS of between 3% p.a. and 9% p.a. above RPI | |||
| Additional Share Grants | Awards made within 18 months of completion of major acquisitions with stretching total shareholder return targets over three-year period | Awards made following the HPE Software business acquisition vesting 1 September 2020 subject to three-year shareholder return of 50% to 100%. A further one-year holding period is applied. | |||
| Shareholding Requirement | Directly aligns executive directors’ interests with those of shareholders | 200% of base salary | |||
| Non-executive director | Appointment Date | Expiration date |
| Karen Slatford | July 5, 2010 | July 5, 2019 |
| Amanda Brown | July 1, 2016 | July 1, 2019 |
| Richard Atkins | April 16, 2014 | April 16, 2020 |
| Silke Scheiber | May 15, 2017 | May 15, 2020 |
| Darren Roos | May 15, 2017 | May 15, 2020 |
| Lawton Fitt | October 17, 2017 | October 17, 2020 |
John Schultz1 | September 1, 2017 | September 1, 2020 |
| Fees | |||||||||
| 18 months | 12 months | ||||||||
| Non-executive Directors | £’000 | £’000 | |||||||
| Karen Slatford | 2018 | 180 | 120 | ||||||
| 2017 | 103 | ||||||||
| Richard Atkins | 2018 | 135 | 90 | ||||||
| 2017 | 78 | ||||||||
| Amanda Brown (1) | 2018 | 135 | 90 | ||||||
| 2017 | 68 | ||||||||
| Silke Scheiber (2) | 2018 | 103 | 70 | ||||||
| 2017 | - | ||||||||
| Darren Roos (3) | 2018 | 103 | 70 | ||||||
| 2017 | - | ||||||||
| Lawton Fitt (4) | 2018 | 83 | 80 | ||||||
| 2017 | - | ||||||||
| Steve Schuckenbrock (5) | 2018 | - | - | ||||||
| 2017 | 71 | ||||||||
| Tom Virden (5) | 2018 | - | - | ||||||
| 2017 | 62 | ||||||||
| John Schultz (6) | 2018 | - | - | ||||||
| 2017 | - | ||||||||
| Total | 2018 | 739 | 520 | ||||||
| 2017 | 382 | ||||||||
| 1 | Amanda Brown’s fees were paid direct to her employer. |
| 2 | Silke Scheiber joined the board on May 15, 2017. |
| 3 | Daren Roos joined the board on May 15, 2017. |
| 4 | Lawton Fitt joined the board on October 17, 2017 and receives an additional fee of £10,000 per annum due to her SEC and SOX experience. |
| 5 | Steve Schuckenbrock and Tom Virden resigned on April 25, 2017. |
| 6 | John Schultz joined the board on September 1, 2017 in a non-remunerated role and resigned on December 20, 2017. |
| Independent non-executive director base fee | £70,000 p.a. |
| Additional fee for chairing a committee | £20,000 p.a. |
| Fee for the SID (including chairing committees) | £120,000 p.a. |
| Committee member | Held | Number of meetings attended | ||||||
| Amanda Brown (Chair) | 13 | 13 | ||||||
| Karen Slatford | 13 | 12 | ||||||
| Richard Atkins(1) | 5 | 4 | �� | |||||
| Silke Scheiber(2) | 8 | 7 | ||||||
| Darren Roos(2) | 8 | 6 | ||||||
| · | Determine and agree with the board the framework or broad policy for the remuneration of the Company’s Chairman, CEO and other executive directors, the Company Secretary and other members of the executive management team (as appointed from time to time); |
| · | Determine the total individual remuneration package of each executive director and other senior executives including bonuses, incentive payments, share options and any other share awards; |
| · | Determine the policy for, and scope of, pension arrangements for each executive director and other senior executives; |
| · | Approve the framework of salaries for senior managers, determine targets for any performance-related pay schemes operated by the Company and approve the total annual payments; |
| · | Review the design of all share incentive plans for approval by the board and shareholders; |
| · | Oversee any major changes in employee benefit structures throughout the Company or Group; and |
| · | Review the on-going appropriateness and relevance of the Remuneration Policy. |
| · | Approval of the Directors’ Remuneration report for the year ended April 30, 2017; |
| · | Approval of the packages of executive directors joining and leaving the board; |
| · | Reviewed the reward strategy of the enlarged group following the acquisition of the HPE Software business, including the award of LTIPs and ASGs post completion and the arrangements for dealing with the US excise tax implications. |
| · | Reviewed the salaries of the executive directors and the Chief Executive Officer’s direct reports; |
| · | Reviewed bonus payments, LTIPs and TAG ASGs vesting against targets; |
| · | Conducted annual review and ratification of remuneration packages for executive directors and senior executives; |
| · | Considered current guidelines on executive compensation from advisory bodies’ and institutional investors; |
| · | Established targets for annual bonuses for the financial year ending October 31, 2019; |
| · | Reviewed the impact of the sale of SUSE on LTIPs and ASGs for those affected; |
| · | Approved the surrender and replacement of ASGs awarded to executive directors following the HPE Software business acquisition to align the performance period to the three years post completion; |
| · | Engaged with major shareholders and advisory bodies to seek their views following publication of the 2017 Directors’ Remuneration Report and following publication of the SUSE circular; |
| · | Restructured the incentive arrangements for those below the board to better align to the delivery of the 2020 business plan; and |
| · | Reviewed the performance and terms of reference of the committee. |

| Value of TAG ASG shares | ||||||||||||||||
Executive director | ASG Shares awarded and vesting | At date of award on November 20, 2014 at £10.61 | At date of vesting on November 1, 2017 at £26.64 | At period end of October 31, 2018 at £12.18½ | ||||||||||||
£’000 | £’000 | £’000 | ||||||||||||||
| Kevin Loosemore | 947,140 | 10,040 | 25,232 | 11,541 | ||||||||||||
| Stephen Murdoch | 405,917 | 4,303 | 10,814 | 4,946 | ||||||||||||
| Mike Phillips | 676,529 | 7,171 | 18,023 | 8,244 | ||||||||||||
| Nils Brauckmann | 405,917 | 4,303 | 10,814 | 4,946 | ||||||||||||
| 1. | The statutory basis valuing the TAG ASGs and LTIPs at the date of vesting; and |
| 2. | Alternative approach valuing the TAG ASGs and LTIPs using the share price at October 31, 2018 to allow for the impact of the 1-year holding period on TAG ASGs and that none of the LTIPs were exercised during the period. |
| LTIPs and ASGs | ||||||||||||||||||||||||||||||||||
| Executive Directors | Base Salary and Fees(1) | Benefits in Kind(2) | Annual Bonus(3) | LTIPs(4) | ASG(5) | Total | Pension(6) | Total | ||||||||||||||||||||||||||
£’000 | £’000 | £’000 | £’000 | £’000 | £’000 | £’000 | £’000 | |||||||||||||||||||||||||||
| Kevin Loosemore | 2017 (12 months) | 750 | 32 | 506 | 2,788 | - | 2,788 | 150 | 4,226 | |||||||||||||||||||||||||
| 2018 (12 months) | 750 | 33 | 855 | 1,407 | - | 1,407 | 150 | 3,195 | ||||||||||||||||||||||||||
| 2018 (18 months) | 1,125 | 47 | 855 | 1,407 | 25,232 | 26,639 | 225 | 28,891 | ||||||||||||||||||||||||||
| Chris Hsu(7) | 2017 (12 months) | - | - | - | - | - | - | - | - | |||||||||||||||||||||||||
| 2018 (12 months) | 288 | 11 | - | - | - | - | - | 299 | ||||||||||||||||||||||||||
| 2018 (18 months) | 413 | 4,466 | (8) | 73 | (9) | - | - | - | - | 4,952 | ||||||||||||||||||||||||
| Stephen Murdoch(10) | 2017 (12 months) | 500 | 18 | 338 | 1,365 | - | 1,365 | 75 | 2,296 | |||||||||||||||||||||||||
| 2018 (12 months) | 497 | 11 | 569 | 513 | - | 513 | 75 | 1,665 | ||||||||||||||||||||||||||
| 2018 (18 months) | 668 | 17 | 569 | 513 | 5,809 | 6,322 | 100 | 7,676 | ||||||||||||||||||||||||||
| Chris Kennedy(11) | 2017 (12 months) | - | - | - | - | - | - | - | - | |||||||||||||||||||||||||
| 2018 (12 months) | 487 | 12 | - | - | - | - | 97 | 596 | ||||||||||||||||||||||||||
| 2018 (18 months) | 487 | 12 | - | - | - | - | 97 | 596 | ||||||||||||||||||||||||||
| Mike Phillips(12) | 2017 (12 months) | 470 | 19 | 317 | 1,493 | - | 1,493 | 71 | 2,370 | |||||||||||||||||||||||||
| 2018 (12 months) | 120 | 4 | 137 | 607 | - | 607 | 18 | 886 | ||||||||||||||||||||||||||
| 2018 (18 months) | 361 | 13 | 137 | 607 | 18,023 | 18,630 | 54 | 19,195 | ||||||||||||||||||||||||||
| Nils Brauckmann(13) | 2017 (12 months) | 423 | 12 | 285 | 684 | (14) | - | 684 | 63 | 1,467 | ||||||||||||||||||||||||
| 2018 (12 months) | 339 | 7 | 387 | 423 | - | 423 | 51 | 1,207 | ||||||||||||||||||||||||||
| 2018 (18 months) | 583 | 13 | 387 | 423 | 6,421 | 6,844 | 87 | 7,914 | ||||||||||||||||||||||||||
| Total | 2017 (12 months) | 2,143 | 81 | 1,446 | 6,330 | - | 6,330 | 359 | 10,359 | |||||||||||||||||||||||||
| 2018 (12 months) | 2,481 | 78 | 1,948 | 2,950 | - | 2,950 | 391 | 7,848 | ||||||||||||||||||||||||||
| 2018 (18 months) | 3,637 | 4,568 | 2,021 | 2,950 | 55,485 | 58,435 | 563 | 69,224 | ||||||||||||||||||||||||||
| 1 | Base Salary and Fees: the amount earned during the period in respect of service as a director. |
| 2 | Benefits in Kind: including car, private medical insurance, permanent health insurance, life insurance and financial and tax advice for a US director. |
| 3 | Annual Bonus: payment for performance during the period in respect of service as a director. One-third of the annual bonus is deferred into shares for three years with the exception of the Executive Chairman and the bonus to Chris Hsu, which was based on the performance of the HPE Software business. |
| 4 | LTIPs (excluding ASGs): the value of LTIP awards (excluding those awards under the ASG program) which vest based on performance conditions ending during the relevant period, pro-rated to reflect the period as a director during the relevant three year performance period. The 2017 figures are based on the share price at vesting of £24.20 (June 27, 2017) and £25.18 (December 16, 2017). The 2018 figures are based on the share price at vesting of £12.64 (July 17, 2018) and £13.05 (being the average share price over the final quarter of the financial year for the awards which will vest on March 23, 2019). |
| 5 | ASG: the value of the ASG award made in November 2014 following the TAG transaction, which vested on November 1, 2017 based on a three year performance period ended October 31, 2017 (pro-rated to reflect the period of service as a director during the performance period). As the performance period ended on October 31, 2017, the value of the TAG ASGs is included in the figures for the full 18 month period ended October 31, 2018 but not in the figures for the 12 month period from November 1, 2017 to October 31, 2018. |
| 6 | Pension: the Company’s pension contribution or cash allowance paid during the period in respect of service as a director. |
| 7 | Chris Hsu joined the board on September 1, 2017 following the acquisition of the HPE Software business and resigned from the board on March 19, 2018. |
| 8 | Chris Hsu’s benefits in kind include a payment of $5,918,705 to cover the grossed-up cost of the excise tax incurred as a result of US “inversion” tax treatment of the HPE Software business transaction. |
| 9 | The bonus payment for Chris Hsu relates to the two month proportion of his HPE Software business bonus for the year ending October 31, 2017. No bonus was paid in respect of the 2018 financial year performance. |
| 10 | Stephen Murdoch left the board on September 1, 2017 to take on the role of Chief Operating Officer and re-joined the board on March 19, 2018 following his appointment as Chief Executive Officer. His salary, benefits, bonus and pension for the 12 month and 18 month periods ended October 31, 2018 reflect his service whilst a director and his LTIPs and ASG reflect the period of the performance period whilst a director. |
| 11 | Chris Kennedy joined the board on January 8, 2018 on his appointment as Chief Financial Officer. |
| 12 | Mike Phillips left the board on January 31, 2018, taking on the role of Director of M&A. His salary, benefits, bonus and pension for the 12 month and 18 month periods ended October 31, 2018 reflect his service whilst a director but his LTIPs and ASGs reflect the period of the performance period whilst a director. |
| 13 | Nils Brauckmann left the board on July 11, 2018 following the announcement of the sale of SUSE. His salary, benefits, bonus and pension for the 12 month and 18 month periods ended October 31, 2018 reflect his service whilst a director but his LTIPs and ASGs reflect the period of the performance period whilst a director. |
| 14 | The LTIP figure for 2017 has been revised to reflect the share price at vesting of £25.18 (December 16, 2017). |
| Executive Directors | Base Salary and Fees (1) | Benefits in Kind (2) | Annual Bonus (3) | LTIPs (4) | ASG (5) | Total | Pension (6) | Total | |||||||||||||||||||||||||
£’000 | £ | £’000 | £ | £’000 | £’000 | £’000 | £’000 | £’000 | £’000 | ||||||||||||||||||||||||
| Kevin Loosemore | 2017 (12 months) | 750 | 32 | 506 | 2,788 | - | 2,788 | 150 | 4,226 | ||||||||||||||||||||||||
| 2018 (12 months) | 750 | 33 | 855 | 1,356 | - | 1,356 | 150 | 3,144 | |||||||||||||||||||||||||
| 2018 (18 months) | 1,125 | 47 | 855 | 1,356 | 11,541 | 12,897 | 225 | 15,149 | |||||||||||||||||||||||||
| Chris Hsu (7) | 2017 (12 months) | - | - | - | - | - | - | - | - | ||||||||||||||||||||||||
| 2018 (12 months) | 288 | 11 | - | - | - | - | - | 299 | |||||||||||||||||||||||||
| 2018 (18 months) | 413 | 4,466 | (8) | 73 | (9) | - | - | - | - | 4,952 | |||||||||||||||||||||||
| Stephen Murdoch (10) | 2017 (12 months) | 500 | 18 | 338 | 1,365 | - | 1,365 | 75 | 2,296 | ||||||||||||||||||||||||
| 2018 (12 months) | 497 | 11 | 569 | 489 | - | 489 | 75 | 1,641 | |||||||||||||||||||||||||
| 2018 (18 months) | 668 | 17 | 569 | 489 | 2,657 | 3,146 | 100 | 4,500 | |||||||||||||||||||||||||
| Chris Kennedy (11) | 2017 (12 months) | - | - | - | - | - | - | - | - | ||||||||||||||||||||||||
| 2018 (12 months) | 487 | 12 | - | - | - | - | 97 | 596 | |||||||||||||||||||||||||
| 2018 (18 months) | 487 | 12 | - | - | - | - | 97 | 596 | |||||||||||||||||||||||||
| Mike Phillips (12) | 2017 (12 months) | 470 | 19 | 317 | 1,493 | - | 1,493 | 71 | 2,370 | ||||||||||||||||||||||||
| 2018 (12 months) | 120 | 4 | 137 | 585 | - | 585 | 18 | 864 | |||||||||||||||||||||||||
| 2018 (18 months) | 361 | 13 | 137 | 585 | 8,244 | 8,829 | 54 | 9,394 | |||||||||||||||||||||||||
| Nils Brauckmann (13) | 2017 (12 months) | 423 | 12 | 285 | 684 | (14) | - | 684 | 63 | 1,467 | |||||||||||||||||||||||
| 2018 (12 months) | 339 | 7 | 387 | 400 | - | 400 | 51 | 1,184 | |||||||||||||||||||||||||
| 2018 (18 months) | 583 | 13 | 387 | 400 | 2,937 | 3,337 | 87 | 4,407 | |||||||||||||||||||||||||
| Total | 2017 (12 months) | 2,143 | 81 | 1,446 | 6,330 | - | 6,330 | 359 | 10,359 | ||||||||||||||||||||||||
| 2018 (12 months) | 2,481 | 78 | 1,948 | 2,830 | - | 2,830 | 391 | 7,728 | |||||||||||||||||||||||||
| 2018 (18 months) | 3,637 | 4,568 | 2,021 | 2,830 | 25,379 | 28,209 | 563 | 38,998 | |||||||||||||||||||||||||
| 1 | Base Salary and Fees: the amount earned during the period in respect of service as a director. |
| 2 | Benefits in Kind: including car, private medical insurance, permanent health insurance, life insurance and financial and tax advice for a US director. |
| 3 | Annual Bonus: payment for performance during the period in respect of service as a director. One-third of the annual bonus is deferred into shares for three years with the exception of the Executive Chairman and the bonus to Chris Hsu, which was based on the performance of the HPE Software business. |
| 4 | LTIPs (excluding ASGs): the value of LTIP awards (excluding those awards under the ASG program) which vest based on performance conditions ending during the relevant period, pro-rated to reflect the period as a director during the relevant three year performance period. The 2018 figures are based on the share price at the end of the period (£12.18½) to reflect that none of them were exercised during the period and were still outstanding as at October 31, 2018. The 2017 figures are based on the share price at vesting of £24.20 (June 27, 2017) and £25.18 (December 16, 2017). |
| 5 | ASG: the value of the ASG award made in November 2014 following the TAG transaction, which vested on November 1, 2017 based on a three year performance period ended October 31, 2017 (pro-rated to reflect the period of service as a director during the performance period). As the performance period ended on October 31, 2017, the value of the TAG ASGs is included in the figures for the full 18 month period ended October 31, 2018 but not in the 12 month period from November 1, 2017 to October 31, 2018. The 2018 (18 months) figures are based on the share price at the end of the period (£12.18½) as none were exercised during the period due to the one year holding period and were still outstanding as at October 31, 2018. |
| 6 | Pension: the Company’s pension contribution or cash allowance paid during the period in respect of service as a director. |
| 7 | Chris Hsu joined the board on September 1, 2017 following the acquisition of the HPE Software business and resigned from the board on March 19, 2018. |
| 8 | Chris Hsu’s benefits in kind include a payment of $5,918,705 to cover the grossed-up cost of the excise tax incurred as a result of US “inversion” tax treatment of the HPE Software business transaction. |
| 9 | The bonus payment for Chris Hsu relates to the two month proportion of his HPE Software business bonus for the 12 months ended October 31, 2017. No bonus was paid in respect of the 12 months ended October 31, 2018. |
| 10 | Stephen Murdoch left the board on September 1, 2017 to take on the role of Chief Operating Officer and re-joined the board on March 19, 2018 following his appointment as Chief Executive Officer. His salary, benefits, bonus and pension for the 12 month and 18 month periods ended October 31, 2018 reflect his service whilst a director and his LTIPs and ASG reflect the period of the relevant performance period whilst a director. |
| 11 | Chris Kennedy joined the board on January 8, 2018 on his appointment as Chief Financial Officer. |
| 12 | Mike Phillips left the board on January 31, 2018, taking on the role of Director of M&A. His salary, benefits, bonus and pension for the 12 month and 18 month periods ended October 31, 2018 reflect his service whilst a director but his LTIPs and ASGs reflect the period of the relevant performance period whilst a director. |
| 13 | Nils Brauckmann left the board on July 11, 2018 following the announcement of the sale of SUSE. His salary, benefits, bonus and pension for the 12 month and 18 month periods ended October 31, 2018 reflect his service whilst a director but his LTIPs and ASGs reflect the period of the relevant performance period whilst a director. |
| 14 | The LTIP figure for 2017 has been revised to reflect the share price at vesting of £25.18 (December 16, 2017). |
| Executive director | Adjusted EBITDA growth threshold | Adjusted EBITDA growth Maximum | Maximum bonus £’000 | % of maximum | Bonus for 2018 £’000 | ||||||||||||||||
| Kevin Loosemore | 0 | % | 10 | % | 1,125 | 76 | % | 855 | |||||||||||||
| Stephen Murdoch(1) | 0 | % | 10 | % | 749 | 76 | % | 569 | |||||||||||||
| Mike Phillips(1) | 0 | % | 10 | % | 181 | 76 | % | 137 | |||||||||||||
| Nils Brauckmann(1) | 0 | % | 10 | % | 509 | 76 | % | 387 | |||||||||||||
1 | The figures for Stephen Murdoch, Mike Phillips and Nils Brauckmann reflect the period served as a director. |
| Average aggregate EPS growth of the Company in excess of RPI over the performance period | Vesting percentage of the shares subject to an award |
| Less than 3% p.a. | 0% |
| Equal to 3% p.a. | 25% |
| Between 3% and 9% p.a. | Between 25% and 100% on a straight-line basis |
| Equal to or above 9% p.a. | 100% |
| Executive director | Interest held | % vesting | Interest vesting | Vesting date | |||||||||
| Kevin Loosemore | 111,275 | 100 | % | 111,275 | July 17, 2018 | ||||||||
Stephen Murdoch1 | 44,510 | 100 | % | 44,510 | July17, 2018 | ||||||||
Stephen Murdoch2 | 26,024 | 100 | % | 26,024 | March 23, 2019 | ||||||||
| Mike Phillips | 52,299 | 100 | % | 52,299 | July 17, 2018 | ||||||||
| Nils Brauckmann | 17,722 | 100 | % | 17,722 | July 17, 2018 | ||||||||
Nils Brauckmann2 | 26,024 | 100 | % | 26,024 | March 23, 2019 | ||||||||
| 1 | Stephen Murdoch’s awards were made to him prior to his appointment to the board. |
| 2 | The performance condition for these awards has been met but they will not time vest until March 23, 2019. |
| Shareholder return (as defined below) | Vesting percentage of the shares subject to an award |
| 50% or less | 0% |
| Between 50% and 100% | Between 25% and 100% on a straight-line basis |
| 100% or more | 100% |
| Executive director | Interest held | % vesting | Interest vesting | Vesting date | |||||||||
| Kevin Loosemore | 947,140 | 100 | % | 947,140 | November 1, 2017 | ||||||||
| Stephen Murdoch | 405,917 | 100 | % | 405,917 | November 1, 2017 | ||||||||
| Mike Phillips | 676,529 | 100 | % | 676,529 | November 1, 2017 | ||||||||
| Nils Brauckmann | 405,917 | 100 | % | 405,917 | November 1, 2017 | ||||||||
| Executive director | Date of grant | Awards made during the period | Share price at grant1 | Face value at grant | |||||||||
| Stephen Murdoch | July 25, 2017 | 5,051 | £ | 22.27 | £ | 112,486 | |||||||
| Mike Phillips | July 25, 2017 | 4,748 | £ | 22.27 | £ | 105,738 | |||||||
| Nils Brauckmann | July 25, 2017 | 4,519 | £ | 22.27 | £ | 100,638 | |||||||
1 | Share price at grant is the closing mid-market price on the day before grant. |
| Executive director | Date of grant | Performance period | Awards made during the period | Share price at grant1 | Face value at grant | Grant basis | |||||||||
| Kevin Loosemore | September 6, 2017 | 3 years from May 1, 2017 | 67,965 | £ | 22.07 | £ | 1,499,988 | 200% of salary | |||||||
Chris Hsu2 | September 6, 2017 | 3 years from May 1, 2017 | 69,848 | £ | 22.07 | £ | 1,541,545 | 200% of salary | |||||||
Stephen Murdoch3 | September 6,2017 | 3 years from May 1, 2017 | 36,664(4 | ) | £ | 22.07 | £ | 809,174 | 150% of salary | ||||||
Stephen Murdoch5 | September 20, 2018 | 3 years from May 1, 2018 | 67,537 | £ | 13.19 | £ | 890,813 | Top-up | |||||||
Chris Kennedy6 | January 11, 2018 | 3 years from May 1, 2017 | 46,275 | £ | 22.69 | £ | 1,049,980 | 200% of salary | |||||||
Chris Kennedy5,6 | September 20, 2018 | 3 years from May 1, 2018 | 26,536 | £ | 13.19 | £ | 350,010 | Top-up | |||||||
| Mike Phillips | September 6, 2017 | 3 years from May 1, 2017 | 34,464(4 | ) | £ | 22.07 | £ | 760,620 | 150% of salary | ||||||
| Nils Brauckmann | September 6, 2017 | 3 years from May 1, 2017 | 33,633(4 | ) | £ | 22.07 | £ | 742,280 | 150% of salary | ||||||
| 1 | Share price at grant is the closing mid-market price on the day before grant. |
| 2 | Chris Hsu’s award lapsed on his service terminating on September 19, 2018. |
| 3 | Stephen Murdoch’s award was made to him between stepping down from the board September 1, 2017 and re-joining the board 19, March 2018. |
| 4 | The number of shares was calculated based on the share price of £20.97, which would have been used had the grant been made on August 10, 2017 as originally planned. |
| 5 | The award made to Stephen Murdoch and Chris Kennedy on September 20, 2018 were to top up their grants in the 18 months ended October 31, 2018 to 200% of salary at the date of grant. |
| 6 | Chris Kennedy’s LTIP awards will lapse as a result of his resignation and subsequent leaving employment in February 2019. |
Annualized EPS growth of the Company in excess of RPI over the performance period | Vesting percentage of the shares subject to an award | |||
| Less than 3% p.a. | 0 | % | ||
| Equal to 3% p.a. | 25 | % | ||
| Between 3% and 9% p.a. | Between 25% and 100% on a straight-line basis | |||
| Equal to or above 9% p.a. | 100 | % | ||
| Original HPE Software ASG Awards | Replacement HPE Software ASG Awards | |||||||||||||||||
Executive director | Date of grant | Awards made during the period | Face value at grant(1) | Date of grant | Awards made during the period | Face value at grant(1) | ||||||||||||
| Kevin Loosemore | September 21, 2017 | 1,100,000 | £ | 26,862,000 | September 20, 2018 | 1,100,000 | £ | 14,509,000 | ||||||||||
Chris Hsu 2 | September 21, 2017 | 900,000 | £ | 21,978,000 | ||||||||||||||
Stephen Murdoch 3 | September 21, 2017 | 500,000 | £ | 12,210,000 | September 20, 2018 | 947,000 | £ | 12,490,930 | ||||||||||
Chris Kennedy 4 | January 11, 2018 | 500,000 | £ | 11,345,000 | September 20, 2018 | 676,000 | £ | 8,916,440 | ||||||||||
| Mike Phillips | September 21, 2017 | 676,000 | £ | 16,507,920 | September 20, 2018 | 676,000 | £ | 8,916,440 | ||||||||||
| Nils Brauckmann | September 21, 2017 | 500,000 | £ | 12,210,000 | September20, 2018 | 500,000 | £ | 6,595,000 | ||||||||||
1 | Face value at grant is calculated using the closing mid-market share price on the day before grant: £24.42 (September 21, 2017), £22.69 (January 11, 2017) and £13.19 (September 20, 2018). |
2 | Chris Hsu’s original HPE Software ASG award lapsed on his service terminating on September 19, 2018. |
3 | Stephen Murdoch’s original HPE Software ASG award was made to him between stepping down from the board September 1, 2017 and re-joining the board March 19, 2018. |
4 | Chris Kennedy’s replacement HPE Software ASG award will lapse as a result of his resignation and subsequent leaving employment in February 2019. |
| Executive director | Date of service contract | Notice period |
Kevin Loosemore1 | April 14, 2011 | The agreement is terminable by either party on six months’ notice |
Stephen Murdoch 2 | April 16, 2014 | The agreement is terminable by either party on six months’ notice |
Chris Kennedy3 | January 5, 2018 | The agreement is terminable by either party on six months’ notice |
Brian McArthur-Muscroft4 | November 4, 2018 | The agreement is terminable by either party on six months’ notice |
1 | Kevin Loosemore’s service contract was amended December 9, 2015 and April 12, 2017. |
2 | Stephen Murdoch stepped down from the board on completion of the HPE Software business acquisition on 1 September 2017 to become Chief Operating Officer. He was reappointed to the board as Chief Executive Officer on March 19, 2018. |
3 | The Company announced on November 5, 2018 that Chris Kennedy would be leaving the Company early in 2019. |
4 | Brian McArthur-Muscroft joined the Company on November 5, 2018 and will take up the role of Chief Financial Officer and be appointed to the board in early 2019. |
| Executive director | Base salary at November 1, 2018 | Max Annual bonus opportunity | LTIP grant as a % of base salary | |||||||||
| Kevin Loosemore | £ | 750,000 | 150 | % | 200 | % | ||||||
| Stephen Murdoch | £ | 850,000 | 150 | % | 200 | % | ||||||
Chris Kennedy1 | £ | 700,000 | n/a | n/a | ||||||||
Brian McArthur-Muscroft2 | £ | 600,000 | 100 | % | 200 | % | ||||||
1 | Chris Kennedy announced on November 5, 2018 that he would be leaving the Company in early 2019. Accordingly no annual bonus will be payable in respect of the 18 months ended October 31, 2018 and no annual grant of LTIPs will be made to him in 2019. |
2 | Brian McArthur-Muscroft joined the Company on November 5, 2018 and will take up the role of Chief Financial Officer and be appointed to the board in early 2019. His annual bonus opportunity in 2019 will be 100% of salary, rising to 150% of salary as for the other executive directors from November 1, 2019. An additional one-off LTIP will be granted to him over 200% of salary on the same terms as the normal annual LTIP grants but with a four year vesting period rather than the normal three years. |
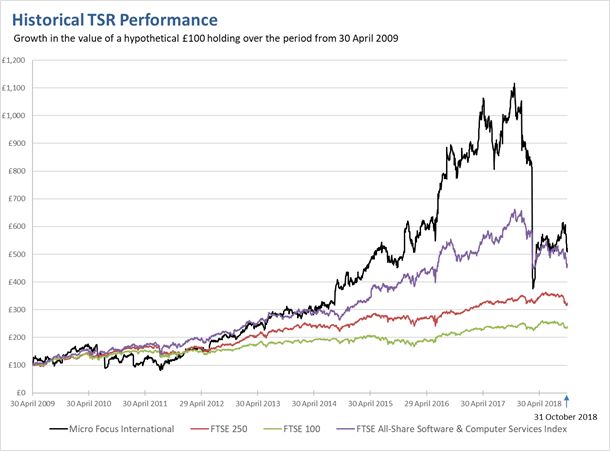
Year ended April 30, | 18 months ended October 31, | |||||||||||||||||||||||||||||||||||
| 2010 | 2011 | 2012 | 2013 | 2014 | 2015 | 2016 | 2017 | 2018 | ||||||||||||||||||||||||||||
£’000 | £’000 | £’000 | £’000 | £’000 | £’000 | £’000 | £’000 | £’000 | ||||||||||||||||||||||||||||
| Stephen Murdoch(1) | ||||||||||||||||||||||||||||||||||||
| Single total figure of remuneration | 2,710 | |||||||||||||||||||||||||||||||||||
| Annual bonus outcome (% of maximum) | 57 | % | ||||||||||||||||||||||||||||||||||
| LTIP vesting (% of maximum) | 100 | % | ||||||||||||||||||||||||||||||||||
| Chris Hsu(2) | ||||||||||||||||||||||||||||||||||||
| Single total figure of remuneration | 4,952 | |||||||||||||||||||||||||||||||||||
| Annual bonus outcome (% of maximum) | 12 | % | ||||||||||||||||||||||||||||||||||
| LTIP vesting (% of maximum) | n/a | |||||||||||||||||||||||||||||||||||
| Kevin Loosemore | ||||||||||||||||||||||||||||||||||||
| Single total figure of remuneration | 23 | 1,291 | 1,304 | 12,468 | 4,315 | 4,231 | 4,226 | |||||||||||||||||||||||||||||
| Annual bonus outcome (% of maximum) | Nil | 90 | % | 92 | % | 100 | % | 100 | % | 100 | % | 45 | % | |||||||||||||||||||||||
| LTIP vesting (% of maximum) | Nil | Nil | Nil | 199 | % | 100 | % | 100 | % | 100 | % | |||||||||||||||||||||||||
| Nigel Clifford | ||||||||||||||||||||||||||||||||||||
| Single total figure of remuneration | 628 | |||||||||||||||||||||||||||||||||||
| Annual bonus outcome (% of maximum) | Nil | |||||||||||||||||||||||||||||||||||
| LTIP vesting (% of maximum) | Nil | |||||||||||||||||||||||||||||||||||
| Stephen Kelly | ||||||||||||||||||||||||||||||||||||
| Single total figure of remuneration | 3,696 | |||||||||||||||||||||||||||||||||||
| Annual bonus outcome (% of maximum) | Nil | |||||||||||||||||||||||||||||||||||
| LTIP vesting (% of maximum) | 100 | % | ||||||||||||||||||||||||||||||||||
1 | Stephen Murdoch assumed the CEO responsibilities from May 1, 2017 in the build up to the acquisition of the HPE Software business and stepped down on completion of the transaction September 1, 2017 to take on the role of Chief Operating Officer. He was reappointed as CEO from March 16, 2018. The figure is slightly different from that shown in the single figure for remuneration table as the value placed on the LTIPs and ASG reflect the period of the relevant performance period that he was undertaking the CEO role. |
2 | Chris Hsu’s period as CEO was from September 1, 2017 to March 16, 2018. The 2018 single figure of remuneration includes the benefits in kind payment of $5,918,705 to cover the grossed-up cost of the excise tax incurred as a result of US “inversion” tax treatment of the HPE Software business transaction. The figure for his annual bonus outcome as a percentage of maximum has been calculated by reference to a maximum bonus of 150% of his salary earned over the period as a director. |
| Executive Chairman £000 | Other employees | |||||||||||||||||||
| 2018 | 2017 (12-month period) | Annualized % change | Annualized % change | |||||||||||||||||
| Base package | 18-month period | Annualized | ||||||||||||||||||
| Salary | 1,125 | 750 | 750 | No change | 3 | % | ||||||||||||||
| Taxable benefits | 47 | 31 | 32 | (3 | %) | 4 | % | |||||||||||||
| Annual performance bonus | 855 | 570 | 506 | 13 | % | 23 | % | |||||||||||||
| Total | 2,027 | 1,351 | 1,288 | 5 | % | 5 | % | |||||||||||||
18 months ended October 31, 2018 $m | 12 months ended April 30, 2017 $m | Change from 2017 (%) | ||||||||||
| Distribution to shareholders | ||||||||||||
● Dividends paid | 542.2 | 177.5 | 205.5 | % | ||||||||
● Share buy-backs | 171.2 | - | n/a | |||||||||
● Return of Value | 500.0 | - | n/a | |||||||||
| Total | 1,213.4 | 177.5 | 583.7 | % | ||||||||
| Employee remuneration | 2,030.7 | 449.2 | 352.1 | % | ||||||||
| Shares | Nil-cost options held | Current | ||||||||||||||||||||||||||
held (owned outright) | Vested but not exercised | Unvested and not subject to performance | Unvested and subject to performance | Shareholding requirement (% of salary) | shareholding (% of salary) | Requirement met? | ||||||||||||||||||||||
| Kevin Loosemore | 747,539 | 1,507,896 | - | 1,237,121 | 200 | % | 3,664 | % | Yes | |||||||||||||||||||
Chris Hsu1 | - | - | - | - | - | - | n/a | |||||||||||||||||||||
Stephen Murdoch2 | 5,390 | 592,969 | 31,075 | 1,090,841 | 200 | % | 858 | % | Yes | |||||||||||||||||||
Chris Kennedy3 | 14,437 | - | - | 748,811 | 200 | % | 25 | % | Not yet due | |||||||||||||||||||
Mike Phillips4 | 145,656 | 940,968 | 4,748 | 747,726 | - | - | n/a | |||||||||||||||||||||
Nils Brauckmann5 | - | 450,798 | 30,543 | 567,109 | - | - | n/a | |||||||||||||||||||||
| Karen Slatford | 17,704 | - | - | - | - | - | n/a | |||||||||||||||||||||
Richard Atkins6 | 16,710 | - | - | - | - | - | n/a | |||||||||||||||||||||
| Amanda Brown | 4,631 | - | - | - | - | - | n/a | |||||||||||||||||||||
| Silke Scheiber | - | - | - | - | - | - | n/a | |||||||||||||||||||||
| Darren Roos | 18,704 | - | - | - | - | - | n/a | |||||||||||||||||||||
| Lawton Fitt | - | - | - | - | - | n/a | ||||||||||||||||||||||
1 | Chris Hsu resigned his employment and left the board on March 19, 2018, at which time he did not own any shares in the Company and all his share awards lapsed. |
2 | Stephen Murdoch is required to have a 200% shareholding within three years of re-joining the board on March 19, 2018. |
3 | Chris Kennedy’s shareholding requirement to have a shareholding of 200% of salary within three years of joining as a director on January 8, 2018 will fall away and all his share awards will lapse on his leaving the Company early in 2019. |
4 | 113,080 shares are held by Mike Phillips’ wife, Josephine Phillips. His shareholding requirement fell away on his leaving the board on January 31, 2018. |
5 | Nils Brauckmann’s shareholding requirement fell away on his leaving the board on July 11, 2018. |
6 | 12,902 shares are held by Richard Atkins’ wife, Julie Atkins. |
Number at May 1, 2017 | Number granted in the period | Number exercised in the period | Number lapsed in the period | Number at October 31, 2018 | Exercise price | Date for exercise/release | |||||||||||||||||||
Kevin Loosemore 1 | 192,157 | – | – | – | 192,157 | 0.0 | p | June 27, 2015 to June 26, 2022 | |||||||||||||||||
Kevin Loosemore 1 | 142,132 | – | – | – | 142,132 | 0.0 | p | June 26, 2016 to June 25, 2023 | |||||||||||||||||
Kevin Loosemore 1 | 115,192 | – | – | – | 115,192 | 0.0 | p | June 27, 2017 to June 26, 2024 | |||||||||||||||||
Kevin Loosemore 1 | 111,275 | – | – | – | 111,275 | 0.0 | p | July 17, 2018 to July 16, 2025 | |||||||||||||||||
Kevin Loosemore 2 | 69,156 | – | – | – | 69,156 | 0.0 | p | July 26, 2019 to July 25, 2026 | |||||||||||||||||
Kevin Loosemore 2 | – | 67,965 | – | – | 67,965 | 0.0 | p | July 17, 2020 to July 25, 2027 | |||||||||||||||||
Stephen Murdoch 1 | 96,237 | – | 50,000 | – | 46,237 | 0.0 | p | December 27, 2015 to December 26, 2022 | |||||||||||||||||
Stephen Murdoch 1 | 39,884 | – | – | – | 39,884 | 0.0 | p | June 26, 2016 to June 25, 2023 | |||||||||||||||||
Stephen Murdoch 1 | 56,421 | – | – | – | 56,421 | 0.0 | p | June 27, 2017 to June 26, 2024 | |||||||||||||||||
Stephen Murdoch 1 | 44,510 | – | – | – | 44,510 | 0.0 | p | July 17, 2018 to July 16, 2025 | |||||||||||||||||
Stephen Murdoch 3 | 26,024 | – | – | – | 26,024 | 0.0 | p | March 23, 2019 to March, 22 2026 | |||||||||||||||||
Stephen Murdoch 2 | 39,640 | – | – | – | 39,640 | 0.0 | p | July 26, 2019 to July 25, 2026 | |||||||||||||||||
Stephen Murdoch 2 | – | 36,664 | – | – | 36,664 | 0.0 | p | July 17, 2020 to July 16, 2027 | |||||||||||||||||
Stephen Murdoch 2 | – | 67,537 | – | – | 67,537 | 0.0 | p | September 20, 2021 to September 19, 2028 | |||||||||||||||||
Chris Kennedy 2 | – | 46,275 | 46,275 | 0.0 | p | January 11, 2021 to January 10, 2028 | |||||||||||||||||||
Chris Kennedy 2 | – | 26,536 | – | – | 26,536 | 0.0 | p | September 20, 2021 to September 19, 2028 | |||||||||||||||||
Mike Phillips 1 | 86,471 | – | – | – | 86,471 | 0.0 | p | June 27, 2015 to June 26, 2022 | |||||||||||||||||
Mike Phillips 1 | 63,959 | – | – | – | 63,959 | 0.0 | p | June 26, 2016 to June 25, 2023 | |||||||||||||||||
Mike Phillips 1 | 61,710 | – | – | – | 61,710 | 0.0 | p | June 27, 2017 to June 26, 2024 | |||||||||||||||||
Mike Phillips 1 | 52,299 | – | – | – | 52,299 | 0.0 | p | July 17, 2018 to July 16, 2025 | |||||||||||||||||
Mike Phillips 2 | 37,262 | – | – | – | 37,262 | 0.0 | p | July 26, 2019 to July 25, 2026 | |||||||||||||||||
Mike Phillips 2 | – | 34,464 | – | – | 34,464 | 0.0 | p | July 17, 2020 to July 16, 2027 | |||||||||||||||||
| Nils Brauckmann 1 | 27,159 | – | – | – | 27,159 | 0.0 | p | December 16, 2017 to December 15, 2024 | |||||||||||||||||
Nils Brauckmann 1 | 17,722 | – | – | – | 17,722 | 0.0 | p | July 17, 2018 to July 16, 2025 | |||||||||||||||||
Nils Brauckmann 3 | 26,024 | – | – | – | 26,024 | 0.0 | p | March 23,2019 to March 22, 2026 | |||||||||||||||||
Nils Brauckmann 2 | 33,476 | – | – | – | 33,476 | 0.0 | p | July 26, 2019 to July 25, 2026 | |||||||||||||||||
Nils Brauckmann 2 | – | 33,633 | – | – | 33,633 | n/a | July 17, 2020 | ||||||||||||||||||
| 1 | This award vested in full as the performance condition was fully met. |
| 2 | Performance condition requires that cumulative EPS growth over a three-year performance period starting on the May 1, preceding the date of grant is at least equal to RPI plus 3% per annum (at which point 25% of awards will vest) and for full vesting the aggregate EPS growth will be required to be RPI plus 9% per annum. Straight-line vesting will apply between these points. Performance against these objectives is determined by the Committee based on the Company’s audited results. |
| 3 | These LTIP awards to Stephen Murdoch and Nils Brauckmann do not vest until March 23, 2019 but the performance condition measured over the performance period from May 1, 2015 to April 30, 2018 has been fully met. |
| Executive director | No of options exercised | Exercise price | Share price at exercise | Gain on exercise | ||||||||||||
Stephen Murdoch1 | 50,000 | - | £ | 21.83½ | £ | 1,091,750 | ||||||||||
| 1 | Stephen Murdoch exercised part of his award on January 26, 2018 after leaving the board on September 1, 2017 and prior to re-joining the board on March 19, 2018. |
Number at May 1, 2017 | Number granted in the period | Number exercised in the period | Number lapsed in the period | Number at October 31, 2018 | Date of release | ||||||||||||||||
| Stephen Murdoch | - | 5,051 | - | - | 5,051 | July 25, 2020 | |||||||||||||||
| Mike Phillips | - | 4,748 | - | - | 4,748 | July 25, 2020 | |||||||||||||||
| Nils Brauckmann | - | 4,519 | - | - | 4,519 | July 25, 2020 | |||||||||||||||
Number at May 1, 2017 | Number granted in the period | Number exercised in the period | Number lapsed in the period | Number at October 31, 2018 | Exercise price | Date of exercise | |||||||||||||||||||
Kevin Loosemore1 | 947,140 | - | - | - | 947,140 | 0.0 | p | November 1, 2017 to October 31, 2024 | |||||||||||||||||
Kevin Loosemore2 | - | 1,100,000 | - | - | 1,100,000 | 0.0 | p | September 1, 2020 to August 31, 2027 | |||||||||||||||||
Stephen Murdoch1 | 405,917 | - | - | - | 405,917 | 0.0 | p | November 1, 2017 to October 31, 2024 | |||||||||||||||||
Stephen Murdoch2 | - | 947,000 | - | - | 947,000 | 0.0 | p | September 1, 2020 to August 31, 2027 | |||||||||||||||||
Chris Kennedy2 | 676,000 | - | - | 676,000 | 0.0 | p | September 1, 2020 to August 31, 2027 | ||||||||||||||||||
Mike Phillips1 | 676,529 | - | - | - | 676,529 | 0.0 | p | November 1, 2017 to October 31, 2024 | |||||||||||||||||
Mike Phillips2 | - | 676,000 | - | - | 676,000 | 0.0 | p | September 1, 2020 to August 31, 2027 | |||||||||||||||||
Nils Brauckmann1 | 405,917 | - | - | - | 405,917 | 0.0 | p | November 1, 2017 to October 31, 2024 | |||||||||||||||||
Nils Brauckmann2 | - | 500,000 | - | - | 500,000 | 0.0 | p | September 1, 2020 to August 31, 2027 | |||||||||||||||||
| 1 | This award vested in full as the performance condition was fully met. |
| 2 | The performance condition is that the percentage of ordinary shares subject to the ASG which may be acquired on exercise on or after the vesting date is as follows: |
| (i) | 0% if the Shareholder Return Percentage (as defined below) is 50% or less; |
| (ii) | 100% if the Shareholder Return Percentage is 100% or more; and |
| (iii) | a percentage determined on a straight-line basis between (i) and (ii) above. |
| Votes for | Votes against | |||||||||||||||||||||||
| Number | Percentage | Number | Percentage | Votes Cast | Votes withheld | |||||||||||||||||||
| 2017 Remuneration Policy | 162,259,404 | 86.46 | % | 25,408,333 | 13.54 | % | 188,129,640 | 461,903 | ||||||||||||||||
| 2017 Directors’ Remuneration Report | 174,387,960 | 93.13 | % | 12,854,303 | 6.87 | % | 188,129,640 | 887,377 | ||||||||||||||||
| - | Strategy and budgets; |
| - | Business and financial performance; |
| - | Product plans and development; |
| - | Corporate activities; |
| - | Human resources; and |
| - | Investor relations. |
Board Held * | Attended | |||||||
| Kevin Loosemore | 24 | 24 | ||||||
Stephen Murdoch1 | 15 | 15 | ||||||
Chris Kennedy2 | 14 | 14 | ||||||
Mike Phillips3 | 11 | 11 | ||||||
Nils Brauckmann4 | 21 | 21 | ||||||
| Karen Slatford | 24 | 23 | ||||||
| Richard Atkins | 24 | 23 | ||||||
| Amanda Brown | 24 | 22 | ||||||
Darren Roos5 | 23 | 19 | ||||||
Silke Scheiber5 | 23 | 19 | ||||||
Lawton Fitt6 | 18 | 17 | ||||||
Chris Hsu7 | 8 | 8 | ||||||
John Schultz8 | 4 | 1 | ||||||
| 1 | Stephen Murdoch resigned from the board on September 1, 2017 and was re-appointed to the board on March 19, 2018 |
| 2 | Chris Kennedy was appointed to the board January 8, 2018 |
| 3 | Mike Phillips resigned from the board on January 31, 2018 |
| 4 | Nils Brauckmann resigned from the board on July 11, 2018 |
| 5 | Darren Roos and Silke Scheiber were appointed to the board on May 15, 2017 |
| 6 | Lawton Fitt was appointed to the board on October 17, 2017 |
| 7 | Chris Hsu was appointed to the board on September 1, 2017 and resigned on March 19, 2018 |
| 8 | John Schultz was appointed to the board on September 1, 2017 and resigned on December 20, 2017 |
| Roles | Responsibilities | |
| Executive Chairman | The Executive Chairman, Kevin Loosemore, leads the board and the Company in its relationships with all stakeholders and customers. The Executive Chairman has responsibility for setting the board agenda (in conjunction with the senior independent director and the Company Secretary), the delivery of strategy and M&A activities and investor relations. He is also responsible for chairing board and general meetings, facilitating the effective contribution of non-executive directors, ensuring effective communication with shareholders and upholding the highest standards of integrity and probity. | |
| Senior independent director (“SID”) | The senior independent director, Karen Slatford, chairs the Nomination Committee and is therefore responsible for succession planning. Also, in her role as senior independent non-executive director, Karen Slatford leads on governance issues, including the annual review of overall board effectiveness and of the Executive Chairman’s performance. The senior independent non-executive director also acts as an intermediary, if necessary, between non-executive directors and the Executive Chairman and between the Company and its shareholders, providing a point of contact for those shareholders who wish to raise issues with the board, other than through the Executive Chairman. | |
| Executive directors | The executive directors are responsible for developing the Group’s strategy and proposing the budget for board approval. They are also responsible for the financial and operational performance of the Group and, in conjunction with the operating committee; they are collectively responsible for the day-to-day running of the business. | |
| Non-executive directors | The role of the non-executive directors is to ensure that independent judgment is brought to board deliberations and decisions. They promote the highest standards of integrity, probity and corporate governance throughout the Company. The non-executive directors possess a wide range of skills and experience, relevant to the development of the Company, which complement those of the executive directors. | |
| Company Secretary | The Company Secretary is accountable to the board through the Executive Chairman to whom she reports. It is the responsibility of the Company Secretary to ensure that board procedures are followed and all rules and regulations are complied with. The Company Secretary’s responsibilities include facilitating the induction and professional development of directors and ensuring the smooth flow of information between board members, between the board and its committees and between non-executive directors and senior management. In addition, all directors have direct access to the advice and services of the Company Secretary. |
| 1 | Appointed on May 15, 2017. |
| 2 | Appointed on October 17, 2017 |
| Matters considered at all scheduled board meetings | Key activities for the board in the 18 months to October 31, 2018 |
Key Project status and progress Strategy Financial reports and statements Operational reports, issues and highlights Investor relations and capital markets update Key legal updates Key transactions Assurance and risk management Compliance Committee Reports | 2018 budget review and 2019 budget approval Periodic updates on corporate regulatory changes and reporting requirements Internally facilitated board review Completion of the HPE Software Transaction and integration planning and implementation Approved initial Share Buyback program and extension Reviewed and recommended the disposal of the SUSE business Approved new Code of Conduct and revised Group policies relating to anti-bribery and data protection Reviewed and updated the matters reserved for the board Reviewed and approved changes to the membership of the board’s committees Reviewed IT infrastructure changes Reviewed compliance with debt covenants and liquidity Reviewed risk and long-term viability review and evolution of Risk Management Framework |
| Audit Committee | Number of meetings for which eligible to attend | Number of meetings attended | |
| Members: | |||
| Richard Atkins | Chairman | 10 | 10 |
| Karen Slatford (resigned September 21, 2017) | Independent non-executive director | 3 | 3 |
| Amanda Brown | Independent non-executive director | 10 | 10 |
| Lawton Fitt (appointed October 17, 2017) | Independent non-executive director | 7 | 7 |
| Silke Scheiber (appointed September 21, 2017) | Independent non-executive director | 7 | 6 |
| · | Reviewing the Group’s Annual Report and Accounts and Interim Report prior to submission to the full board for approval; |
| · | Monitoring the Group’s accounting policies, internal financial control systems and financial reporting procedures; |
| · | Providing a forum through which the Group’s external and internal auditors and external tax advisors report to the board. The external and internal auditors together with the tax advisor attend all meetings of the Committee and also meet privately with Committee members in the absence of executive management prior to each Committee meeting; |
| · | Overseeing the relationship with the external auditors, including the independence and objectivity of the auditors (taking into account UK professional and regulatory requirements and the relationship with the audit firm as a whole) and the consideration of audit fees and fees for non-audit work; and |
| · | The process for employees of the Company to raise, in confidence, concerns about possible impropriety in matters of financial reporting or other matters, which are contained in the Committee’s terms of reference. |
| · | To report to the board on its proceedings, identifying any matters in respect of which it considers that action or improvement is needed and make recommendations as to the steps to be taken; |
| · | To monitor the integrity of the financial statements of the Company and ensure that the interests of shareholders are properly protected in relation to financial reporting and internal controls; |
| · | To assist the board in fulfilling its oversight responsibilities by reviewing and monitoring the Company’s internal financial controls and internal control and risk management systems and at least annually carry out a review of its effectiveness; |
| · | To ensure that a robust assessment of the principal risks facing the Company has been undertaken and provide advice on the management and mitigation of those risks; |
| · | To keep under review the adequacy and effectiveness of the Company’s internal controls, internal financial controls and risk management systems; |
| · | To review and challenge where necessary the going concern assessment and the longer-term viability statement; |
| · | To review the Company’s procedures for preventing and detecting fraud, the Company’s systems and controls for the prevention of bribery, the adequacy and effectiveness of the Company’s anti-money laundering systems and the Company’s arrangements for its employees to raise concerns about possible wrongdoing in financial reporting or other matters; |
| · | To monitor and review the need for, and the effectiveness of, the Company’s internal audit function in the context of the Company’s overall risk management system; |
| · | To report to the board as to whether the Annual Report and Accounts, taken as a whole, is fair, balanced and understandable; and |
| · | To oversee the relationship with the Company’s auditors, ensuring the independence and objectivity of the auditors, considering audit fees and fees for non-audit work and making recommendations to the board in relation to the appointment, reappointment and removal of the Company’s external auditor. |
| Nomination committee | Number of eligible meetings during the 18 months ended October 31, 2018 | Number of meetings attended |
| Members | ||
| Karen Slatford (Chair) | 6 | 6 |
| Richard Atkins | 6 | 6 |
| Amanda Brown (resigned September 21, 2017) | 2 | 2 |
| Darren Roos (appointed September 21, 2017) | 4 | 4 |
| Lawton Fitt (appointed October 17, 2017) | 4 | 4 |
| · | To review the structure, size and composition (including the skills, knowledge, experience and diversity) required of the board and make recommendations to the board with regard to any changes; |
| · | To identify and nominate, for the approval of the board, candidates to fill board vacancies as and when they arise; |
| · | To give full consideration to succession planning for directors and other senior executives; |
| · | To keep under review the leadership needs of the Group, both executive and non-executive, with a view to ensuring the continued ability of the Group to compete effectively in the marketplace; and |
| · | To review annually the time required from non-executives, evaluating whether they are spending enough time to fulfil their duties. |
| Committee member | Held | Number of meetings attended |
| Amanda Brown (Chair) | 13 | 13 |
| Karen Slatford | 13 | 12 |
| Richard Atkins(1) | 5 | 4 |
| Silke Scheiber(2) | 8 | 7 |
| Darren Roos(2) | 8 | 6 |
| 1 | Richard Atkins resigned from the Committee on September 21, 2017 |
| 2 | Silke Scheiber and Darren Roos joined the Committee on September 21, 2017 |
| · | Determine and agree with the board the framework or broad policy for the remuneration of the Company’s Chairman, CEO and other executive directors, the Company Secretary and other members of the executive management team (as appointed from time to time); |
| · | Determine the total individual remuneration package of each executive director and other senior executives including bonuses, incentive payments, share options and any other share awards; |
| · | Determine the policy for, and scope of, pension arrangements for each executive director and other senior executives; |
| · | Approve the framework of salaries for senior managers, determine targets for any performance-related pay schemes operated by the Company and approve the total annual payments; |
| · | Review the design of all share incentive plans for approval by the board and shareholders; |
| · | Oversee any major changes in employee benefit structures throughout the Company or Group; and |
| · | Review the ongoing appropriateness and relevance of the Remuneration Policy. |
18 months ended October 31, 2018 | 12 months ended April 30, 2017 | 12 months ended April 30, 2016 | ||||||||||
| Number | Number | Number | ||||||||||
| Average monthly number of people | ||||||||||||
| (including executive directors) employed by the Group: | ||||||||||||
| Continuing Operations | ||||||||||||
| Sales and distribution | 5,860 | 1,818 | 1,692 | |||||||||
| Research and development | 4,323 | 1,400 | 1,301 | |||||||||
| General and administration | 1,378 | 642 | 582 | |||||||||
| 11,561 | 3,860 | 3,575 | ||||||||||
| Discontinued Operations | ||||||||||||
| Sales and distribution | 515 | 323 | 266 | |||||||||
| Research and development | 629 | 476 | 375 | |||||||||
| General and administration | 8 | 4 | 2 | |||||||||
| 1,152 | 803 | 643 | ||||||||||
| Total | ||||||||||||
| Sales and distribution | 6,375 | 2,141 | 1,958 | |||||||||
| Research and development | 4,952 | 1,876 | 1,676 | |||||||||
| General and administration | 1,386 | 646 | 584 | |||||||||
| Total | 12,713 | 4,663 | 4,218 | |||||||||
| October 31, 2018 | April 30, 2017 | April 30, 2016 | ||||||||||||||||||||||
| Shares | $’000 | Shares | $’000 | Shares | $’000 | |||||||||||||||||||
| Issued and fully paid | ||||||||||||||||||||||||
| At May 1, | 229,674,479 | 39,700 | 228,706,210 | 39,573 | 228,587,397 | 39,555 | ||||||||||||||||||
| Shares issued to satisfy option awards | 1,894,673 | 251 | 968,269 | 127 | 118,313 | 18 | ||||||||||||||||||
| Share reorganization | (16,935,536 | ) | (2,926 | ) | - | - | - | - | ||||||||||||||||
| Shares issued relating to acquisition of HPE Software | 222,166,897 | 28,773 | - | - | - | - | ||||||||||||||||||
| Share placement issues | - | - | - | - | 500 | - | ||||||||||||||||||
| At October 31 / April 30 | 436,800,513 | 65,798 | 229,674,479 | 39,700 | 228,706,210 | 39,573 | ||||||||||||||||||
| October 31, 2018 | April 30, 2017 | April 30, 2016 | ||||||||||||||||||||||
| Shares | $’000 | Shares | $’000 | Shares | $’000 | |||||||||||||||||||
| Issued and fully paid | ||||||||||||||||||||||||
| At May 1 | - | - | - | - | - | - | ||||||||||||||||||
| Issue of B shares | 229,799,802 | 500,000 | - | - | - | - | ||||||||||||||||||
| Redemption of B shares | (229,799,802 | ) | (500,000 | ) | - | - | - | - | ||||||||||||||||
| At October 31 / April 30 | - | - | - | - | - | - | ||||||||||||||||||
Ordinary shares of 10 pence each | % Percentage of issued share capital | |||||||
| Dodge & Cox | 61,313,932 | 14.05 | % | |||||
| FMR LLC | 29,272,034 | 6.72 | % | |||||
| BlackRock Inc. | 24,394,293 | 5.58 | % | |||||
| Causeway Capital Management LLC | 22,050,026 | 5.05 | % | |||||
| · | On November 21, 2018, Dodge & Cox disclosed that their percentage interest in the ordinary share capital of the Company had increased to 15.01% (63,751,164 ordinary shares); |
| · | On February 5, 2019, BlackRock, Inc disclosed that their shareholding in the ordinary share capital of the Company was 6.6% (27,609,990 ordinary shares); and |
| · | On February 13, 2019, FMR LLC disclosed that their percentage interest in the ordinary share capital of the Company has increased to 8.987% (37,615,411 ordinary shares) |
| ● | On a show of hands, every ordinary member present in person and every proxy duly appointed by a member shall have one vote; and |
| ● | On a poll, every member who is present in person or by proxy shall have one vote for every ordinary share of which he or she is the holder. |
| · | The $1,503.8 million senior secured term loan B-2 issued by MA FinanceCo LLC is priced at LIBOR plus 2.25% (subject to a LIBOR floor of 0.00%); |
| · | The $2,580.5 million senior secured seven-year term loan B issued by Seattle SpinCo. Inc. is priced at LIBOR plus 2.50% (subject to a LIBOR floor of 0.00%) with an original issue discount of 0.25%; |
| · | The $382.1million senior secured seven-year term loan B-3 issued by MA FinanceCo LLC is priced at LIBOR plus 2.50% (subject to a LIBOR floor of 0.00%) with an original issue discount of 0.25%; and |
| · | The €466.5 million (equivalent to $530.5 million) senior secured seven-year term loan B issued by MA FinanceCo LLC is priced at EURIBOR plus 2.75% (subject to a EURIBOR floor of 0.00%) with an original issue discount of 0.25%. |
| · | A senior secured revolving credit facility of $500.0 million, (“Revolving Facility”), with an interest rate of 3.25% above LIBOR on amounts drawn (and 0.375% on amounts undrawn) thereunder (subject to a LIBOR floor of 0.00%). |
Financial October 31, 2018 | Non- financial October 31, 2018 | Total October 31, 2018 | Financial April 30, 2017 | Non- financial April 30, 2017 | Total April 30, 2017 | |||||||||||||||||||
| $’000 | $’000 | $’000 | $’000 | $’000 | $’000 | |||||||||||||||||||
| Financial assets | ||||||||||||||||||||||||
| Non-current | ||||||||||||||||||||||||
| Derivative financial instruments – Interest rate swaps | - | 86,381 | 86,381 | - | - | - | ||||||||||||||||||
| Current | ||||||||||||||||||||||||
| Cash and cash equivalents | 620,896 | - | 620,896 | 150,983 | - | 150,983 | ||||||||||||||||||
| Trade and other receivables | 1,212,067 | 59,966 | 1,272,033 | 263,626 | 25,883 | 289,509 | ||||||||||||||||||
| 1,832,963 | 146,347 | 1,979,310 | 414,609 | 25,883 | 440,492 | |||||||||||||||||||
Financial October 31, 2018 | Non- financial October 31, 2018 | Total October 31, 2018 | Financial April 30, 2017 | Non- financial April 30, 2017 | Total April 30, 2017 | |||||||||||||||||||
| $’000 | $’000 | $’000 | $’000 | $’000 | $’000 | |||||||||||||||||||
| Financial liabilities – financial liabilities at amortized cost | ||||||||||||||||||||||||
| Non-current | ||||||||||||||||||||||||
| Borrowings | 4,946,566 | - | 4,946,566 | 1,511,400 | - | 1,511,400 | ||||||||||||||||||
| Finance leases | 14,923 | - | 14,923 | - | - | - | ||||||||||||||||||
| Provisions | 35,421 | - | 35,421 | 11,837 | 100 | 11,937 | ||||||||||||||||||
| Current | ||||||||||||||||||||||||
| Borrowings | 50,347 | - | 50,347 | 83,788 | - | 83,788 | ||||||||||||||||||
| Finance leases | 13,560 | - | 13,560 | - | - | - | ||||||||||||||||||
| Trade and other payables | 676,917 | - | 676,917 | 16,891 | 153,151 | 170,042 | ||||||||||||||||||
| Provisions | 57,411 | - | 57,411 | 4,406 | 15,736 | 20,142 | ||||||||||||||||||
| 5,795,145 | - | 5,795,145 | 1,628,322 | 168,987 | 1,797,309 | |||||||||||||||||||
| October 31, 2018 | April 30, 2017 | |||||||
| $’000 | $’000 | |||||||
| Trade receivables | 1,212,067 | 263,626 | ||||||
| Cash and cash equivalents | 620,896 | 150,983 | ||||||
| Total | 1,832,963 | 414,609 | ||||||
| October 31, 2018 | April 30, 2017 | |||||||
| $’000 | $’000 | |||||||
| Carrying amount | 86,381 | - | ||||||
| Notional amount (4 x $562.5m) | 2,250,000 | - | ||||||
| Maturity date | 30 September 2022 | - | ||||||
| Change in fair value of outstanding hedging instruments | 86,381 | - | ||||||
| Change in value of hedging instruments adjusted for credit risk | 84,666 | - | ||||||
Group exposure | +/-5% | +/-10% | +/-1% interest | |||||||||||||
| Key aggregate currency exposures | $’000 | $’000 | $’000 | $’000 | ||||||||||||
| Euro | 377,324 | 18,866 | 37,732 | |||||||||||||
| GBP | 25,436 | 1,271 | 2,543 | |||||||||||||
| ILS | 52,147 | 2,607 | 5,215 | |||||||||||||
| CAN$ | 60,468 | 3,023 | 6,046 | |||||||||||||
Borrowings Interest rate LIBOR +1% | n/a | n/a | n/a | 49,969 | ||||||||||||
| October 31, 2018 | April 30, 2017 | |||||||
| $’000 | $’000 | |||||||
| Bank and other borrowings | 4,845,880 | 1,561,536 | ||||||
| Finance lease obligations | 28,483 | - | ||||||
| Less cash and cash equivalents | (620,896 | ) | (150,983 | ) | ||||
| Total net debt | 4,253,467 | 1,410,553 | ||||||
| Total equity | 7,791,980 | 1,613,490 | ||||||
| Debt / equity % | 54.59 | % | 87.42 | % | ||||
18 months ended October 31, 2018 | 12 months ended April 30, 2017 | 12 months ended April 30, 2016 | ||||||||||
| $’000 | $’000 | $’000 | ||||||||||
| Audit | 15,128 | 6,127 | 3,653 | |||||||||
| Audit Related | 35 | 33 | 587 | |||||||||
| Tax Services | 410 | 102 | 130 | |||||||||
| Other | 560 | 7,470 | 1,842 | |||||||||
| Total | 16,133 | 13,732 | 6,212 | |||||||||
18 months ended October 31, 2018 | 12 months ended April 30, 2017 | 12 months ended April, 30, 2016 | ||||||||||
| $’000 | $’000 | $’000 | ||||||||||
| Audit of Company | 12,223 | 1,032 | 563 | |||||||||
| Audit of subsidiaries | 1,887 | 2,494 | 2,895 | |||||||||
| Total audit | 14,110 | 3,526 | 3,458 | |||||||||
| Audit related assurance services | 914 | 2,634 | 782 | |||||||||
| Other assurance services | 664 | - | - | |||||||||
| Total assurance services | 1,578 | 2,634 | 782 | |||||||||
| Tax compliance services | 214 | 49 | 60 | |||||||||
| Tax advisory services | 196 | 53 | 70 | |||||||||
| Services relating to taxation | 410 | 102 | 130 | |||||||||
| Other non-audit services | 35 | 7,470 | 1,842 | |||||||||
| Total | 16,133 | 13,732 | 6,212 | |||||||||
Period | (a) Total Number of Shares Purchased | (b) Average Price Paid per Share | (c) Total Number of Shares (or Units) Purchased as Part of Publicly Announced Plans or Programs | (d) Maximum Number (or Approximate Dollar Value) of Shares ( or Units) that May Yet Be Purchased Under the Plans or Programs | ||||||||||||
Month # 1 -15 beginning: May 1, 2017; ending: July 31, 2018 | - | - | - | - | ||||||||||||
Month # 16 beginning: August 1, 2018; ending: August 31, 2018 | 932,162 | $ | 17.08 | 932,162 | $ | 184.1 | m | |||||||||
Month # 17 beginning: September 1, 2018; ending: September 30, 2018 | 5,426,805 | $ | 16.95 | 6,358,967 | $ | 92.1 | m | |||||||||
Month # 18 beginning: October 1, 2018; ending: October 31, 2018 | 3,499,238 | $ | 17.78 | 9,858,205 | $ | 29.9 | m | |||||||||
| Total | 9,858,205 | $ | 17.39 | 9,858,205 | $ | 29.9 | m | |||||||||
| Articles of Association of Micro Focus International plc. | |
| Credit Agreement, among Micro Focus International plc, Micro Focus Group Limited, MA FinanceCo., LLC, the Lenders party thereto and JPMorgan Chase Bank, N.A., as Administrative Agent and Collateral Agent. (incorporated by reference to Exhibit 10.2 to the Registration Statement on Form F-4 (File No. 333-219678) filed with the Securities and Exchange Commission on August 4, 2017). | |
| List of Significant Subsidiaries | |
| Code of Conduct | |
| Certification pursuant to Section 302 of the Sarbanes-Oxley Act of 2002 | |
| Certification pursuant to Section 302 of the Sarbanes-Oxley Act of 2002 | |
| Certification of Stephen Murdoch under Section 906 of the Sarbanes-Oxley Act of 2002 | |
| Certification of Chris Kennedy under Section 906 of the Sarbanes-Oxley Act of 2002 | |
| Consent of KPMG LLP. | |
| Consent of PricewaterhouseCoopers LLP. | |
| 15.3 | Letter from PricewaterhouseCoopers LLP |
| Unaudited financial statements for the 12 months ended October 31, 2018 and the six months ended October 31, 2017. |
| 101.INS | XBRL Instance Document |
| 101.SCH | XBRL Taxonomy Extension Schema Document |
| 101.CAL | XBRL Taxonomy Extension Calculation Linkbase Document |
| 101.DEF | XBRL Taxonomy Extension Definition Linkbase Document |
| 101.LAB | XBRL Taxonomy Extension Label Linkbase Document |
| 101.PRE | XBRL Taxonomy Extension Presentation Linkbase Document |
| F-3 | |
| F-4 | |
| F-10 | |
| F-12 | |
| F-15 | |
| F-16 | |
| F-30 |
/s/ KPMG LLP
Before exceptional items | Exceptional items (note 4) | Total | ||||||||||||||
| Note | $’000 | $’000 | $’000 | |||||||||||||
| Revenue | 1,2 | 4,754,398 | - | 4,754,398 | ||||||||||||
| Cost of sales | (1,193,898 | ) | (65,408 | ) | (1,259,306 | ) | ||||||||||
| Gross profit | 3,560,500 | (65,408 | ) | 3,495,092 | ||||||||||||
| Selling and distribution costs | (1,630,785 | ) | (39,215 | ) | (1,670,000 | ) | ||||||||||
| Research and development expenses | (642,061 | ) | (17,352 | ) | (659,413 | ) | ||||||||||
| Administrative expenses | (372,674 | ) | (416,181 | ) | (788,855 | ) | ||||||||||
| Operating profit | 914,980 | (538,156 | ) | 376,824 | ||||||||||||
| Finance costs | 6 | (344,040 | ) | (6,326 | ) | (350,366 | ) | |||||||||
| Finance income | 6 | 7,101 | 553 | 7,654 | ||||||||||||
| Net finance costs | 6 | (336,939 | ) | (5,773 | ) | (342,712 | ) | |||||||||
| Profit/(loss) before tax | 578,041 | (543,929 | ) | 34,112 | ||||||||||||
| Taxation | 7 | (125,115 | ) | 798,196 | 673,081 | |||||||||||
| Profit from continuing operations | 452,926 | 254,267 | 707,193 | |||||||||||||
| Profit from discontinued operation (attributable to equity shareholders of the company) | 19 | 76,940 | - | 76,940 | ||||||||||||
| Profit for the period | 529,866 | 254,267 | 784,133 | |||||||||||||
| Attributable to: | ||||||||||||||||
| Equity shareholders of the company | 529,781 | 254,267 | 784,048 | |||||||||||||
| Non-controlling interests | 85 | - | 85 | |||||||||||||
| Profit for the period | 529,866 | 254,267 | 784,133 | |||||||||||||
Consolidated statement of comprehensive income continued
for the 18 months ended October 31, 2018Before exceptional items | Exceptional items (note 4) | Total | ||||||||||||||
| Note | $’000 | $’000 | $’000 | |||||||||||||
| Profit for the period | 529,866 | 254,267 | 784,133 | |||||||||||||
| Other comprehensive income/(expense): | ||||||||||||||||
| Items that will not be reclassified to profit or loss | ||||||||||||||||
| Continuing operations: | ||||||||||||||||
| Actuarial loss on pension schemes liabilities | 27 | (8,949 | ) | - | (8,949 | ) | ||||||||||
| Actuarial loss on non-plan pension assets | 27 | (5,258 | ) | - | (5,258 | ) | ||||||||||
| Deferred tax movement | 3,754 | - | 3,754 | |||||||||||||
| Discontinued operation: | ||||||||||||||||
| Actuarial loss on pension schemes liabilities | 27 | (1,465 | ) | - | (1,465 | ) | ||||||||||
| Actuarial loss on non-plan pension assets | 27 | (529 | ) | - | (529 | ) | ||||||||||
| Deferred tax movement | 527 | - | 527 | |||||||||||||
| Items that may be subsequently reclassified to profit or loss | ||||||||||||||||
| Cash flow hedge movements | 33 | 86,381 | - | 86,381 | ||||||||||||
| Deferred tax movement | 33 | (16,413 | ) | - | (16,413 | ) | ||||||||||
| Currency translation differences – continuing operations | (29,456 | ) | - | (29,456 | ) | |||||||||||
| Currency translation differences - discontinued operation | 713 | - | 713 | |||||||||||||
| Other comprehensive income for the period | 29,305 | - | 29,305 | |||||||||||||
| Total comprehensive income for the period | 559,171 | 254,267 | 813,438 | |||||||||||||
| Attributable to: | ||||||||||||||||
| Equity shareholders of the company | 559,086 | 254,267 | 813,353 | |||||||||||||
| Non-controlling interests | 85 | - | 85 | |||||||||||||
| Total comprehensive income for the period | 559,171 | 254,267 | 813,438 | |||||||||||||
| Total comprehensive income attributable to the equity shareholders of the company arises from: | ||||||||||||||||
| Continuing operations | 482,985 | 254,267 | 737,252 | |||||||||||||
| Discontinued operations | 76,186 | - | 76,186 | |||||||||||||
| 559,171 | 254,267 | 813,438 | ||||||||||||||
| Earnings per share (cents) | ||||||||||||||||
| Earnings per share (cents) | ||||||||||||||||
| From continuing and discontinued operations | cents | |||||||||||||||
| - basic | 9 | 201.70 | ||||||||||||||
| - diluted | 9 | 196.17 | ||||||||||||||
| From continuing operations | ||||||||||||||||
| - basic | 9 | 181.91 | ||||||||||||||
| - diluted | 9 | 176.92 | ||||||||||||||
| Earnings per share (pence) | ||||||||||||||||
| From continuing and discontinued operations | pence | |||||||||||||||
| - basic | 9 | 151.61 | ||||||||||||||
| - diluted | 9 | 147.45 | ||||||||||||||
| From continuing operations | ||||||||||||||||
| - basic | 9 | 136.73 | ||||||||||||||
| - diluted | 9 | 132.98 | ||||||||||||||
Consolidated statement of comprehensive income
for the 12 months ended April 30, 2017Before exceptional items1 | Exceptional items (note 4) | Total1 | ||||||||||||||
| Note | $’000 | $’000 | $’000 | |||||||||||||
| Revenue | 1,2 | 1,077,273 | - | 1,077,273 | ||||||||||||
| Cost of sales | (213,463 | ) | (2,949 | ) | (216,412 | ) | ||||||||||
| Gross profit | 863,810 | (2,949 | ) | 860,861 | ||||||||||||
| Selling and distribution costs | (357,654 | ) | (5,479 | ) | (363,133 | ) | ||||||||||
| Research and development expenses | (116,032 | ) | (6,792 | ) | (122,824 | ) | ||||||||||
| Administrative expenses | (65,474 | ) | (82,038 | ) | (147,512 | ) | ||||||||||
| Operating profit | 324,650 | (97,258 | ) | 227,392 | ||||||||||||
| Finance costs | 6 | (96,824 | ) | - | (96,824 | ) | ||||||||||
| Finance income | 6 | 979 | - | 979 | ||||||||||||
| Net finance costs | 6 | (95,845 | ) | - | (95,845 | ) | ||||||||||
| Profit/(loss) before tax | 228,805 | (97,258 | ) | 131,547 | ||||||||||||
| Taxation | 7 | (19,097 | ) | 11,633 | (7,464 | ) | ||||||||||
| Profit/(loss) from continuing operations | 209,708 | (85,625 | ) | 124,083 | ||||||||||||
| Profit from discontinued operation (attributable to equity shareholders of the company) | 19 | 33,720 | - | 33,720 | ||||||||||||
| Profit/(loss) for the period | 243,428 | (85,625 | ) | 157,803 | ||||||||||||
| Attributable to: | ||||||||||||||||
| Equity shareholders of the company | 243,531 | (85,625 | ) | 157,906 | ||||||||||||
| Non-controlling interests | (103 | ) | - | (103 | ) | |||||||||||
| Profit for the period | 243,428 | (85,625 | ) | 157,803 | ||||||||||||
Before exceptional items1 | Exceptional items (note 4) | Total1 | ||||||||||||||
| Note | $’000 | $’000 | $’000 | |||||||||||||
| Profit for the period | 243,428 | (85,625 | ) | 157,803 | ||||||||||||
| Other comprehensive income/(expense): | ||||||||||||||||
| Items that will not be reclassified to profit or loss | ||||||||||||||||
| Continuing operations: | ||||||||||||||||
| Actuarial loss on pension schemes liabilities | 27 | (217 | ) | - | (217 | ) | ||||||||||
| Actuarial gain on non-plan pension assets | 27 | 318 | - | 318 | ||||||||||||
| Deferred tax movement | (62 | ) | - | (62 | ) | |||||||||||
| Discontinued operation: | ||||||||||||||||
| Actuarial gain on pension schemes liabilities | 27 | 619 | - | 619 | ||||||||||||
| Actuarial loss on non-plan pension assets | 27 | (188 | ) | - | (188 | ) | ||||||||||
| Deferred tax movement | (263 | ) | - | (263 | ) | |||||||||||
| Items that may be subsequently reclassified to profit or loss | ||||||||||||||||
| Currency translation differences – continuing operations | (4,942 | ) | - | (4,942 | ) | |||||||||||
| Currency translation differences - discontinued operation | (1,011 | ) | - | (1,011 | ) | |||||||||||
| Other comprehensive expense for the period | (5,746 | ) | - | (5,746 | ) | |||||||||||
| Total comprehensive income/(expense) for the period | 237,682 | (85,625 | ) | 152,057 | ||||||||||||
| Attributable to: | ||||||||||||||||
| Equity shareholders of the company | 237,785 | (85,625 | ) | 152,160 | ||||||||||||
| Non-controlling interests | (103 | ) | - | (103 | ) | |||||||||||
| Total comprehensive income for the period | 237,682 | (85,625 | ) | 152,057 | ||||||||||||
| Total comprehensive income/(expense) attributable to the equity shareholders of the company arises from: | ||||||||||||||||
| Continuing operations | 204,805 | (85,625 | ) | 119,180 | ||||||||||||
| Discontinued operations | 32,877 | - | 32,877 | |||||||||||||
| 237,682 | (85,625 | ) | 152,057 | |||||||||||||
| Earnings per share (cents) | ||||||||||||||||
| Earnings per share (cents) | ||||||||||||||||
| From continuing and discontinued operations | cents | |||||||||||||||
| - basic | 9 | 68.88 | ||||||||||||||
| - diluted | 9 | 66.51 | ||||||||||||||
| From continuing operations | ||||||||||||||||
| - basic | 9 | 54.17 | ||||||||||||||
| - diluted | 9 | 52.31 | ||||||||||||||
| Earnings per share (pence) | ||||||||||||||||
| From continuing and discontinued operations | pence | |||||||||||||||
| - basic | 9 | 53.25 | ||||||||||||||
| - diluted | 9 | 51.42 | ||||||||||||||
| From continuing operations | ||||||||||||||||
| - basic | 9 | 41.88 | ||||||||||||||
| - diluted | 9 | 40.44 | ||||||||||||||
Consolidated statement of comprehensive income
for the 12 months ended April 30, 2016Before exceptional items1 | Exceptional items (note 4) | Total1 | ||||||||||||||
| Note | $’000 | $’000 | $’000 | |||||||||||||
| Revenue | 1,2 | 991,233 | - | 991,233 | ||||||||||||
| Cost of sales | (200,358 | ) | (2,172 | ) | (202,530 | ) | ||||||||||
| Gross profit | 790,875 | (2,172 | ) | 788,703 | ||||||||||||
| Selling and distribution costs | (308,238 | ) | (4,372 | ) | (312,610 | ) | ||||||||||
| Research and development expenses | (116,137 | ) | (1,258 | ) | (117,395 | ) | ||||||||||
| Administrative expenses | (91,451 | ) | (20,051 | ) | (111,502 | ) | ||||||||||
| Operating profit | 275,049 | (27,853 | ) | 247,196 | ||||||||||||
| Finance costs | 6 | (98,357 | ) | - | (98,357 | ) | ||||||||||
| Finance income | 6 | 1,009 | - | 1,009 | ||||||||||||
| Net finance costs | 6 | (97,348 | ) | - | (97,348 | ) | ||||||||||
| Profit/(loss) before tax | 177,701 | (27,853 | ) | 149,848 | ||||||||||||
| Taxation | 7 | (20,704 | ) | 6,835 | (13,869 | ) | ||||||||||
| Profit from continuing operations | 156,997 | (21,018 | ) | 135,979 | ||||||||||||
| Profit from discontinued operation (attributable to equity shareholders of the company) | 19 | 26,993 | - | 26,993 | ||||||||||||
| Profit for the period | 183,990 | (21,018 | ) | 162,972 | ||||||||||||
| Attributable to: | ||||||||||||||||
| Equity shareholders of the company | 183,912 | (21,018 | ) | 162,894 | ||||||||||||
| Non-controlling interests | 78 | - | 78 | |||||||||||||
| Profit for the period | 183,990 | (21,018 | ) | 162,972 | ||||||||||||
Consolidated statement of comprehensive income continued
Before exceptional items1 | Exceptional items (note 4) | Total1 | ||||||||||||||
| Note | $’000 | $’000 | $’000 | |||||||||||||
| Profit for the period | 183,990 | (21,018 | ) | 162,972 | ||||||||||||
| Other comprehensive income/(expense): | ||||||||||||||||
| Items that will not be reclassified to profit or loss | ||||||||||||||||
| Continuing operations: | ||||||||||||||||
| Actuarial gain on pension schemes liabilities | 27 | 1,695 | - | 1,695 | ||||||||||||
| Actuarial gain on non-plan pension assets | 27 | 1,951 | - | 1,951 | ||||||||||||
| Deferred tax movement | (333 | ) | - | (333 | ) | |||||||||||
| Discontinued operation: | ||||||||||||||||
| Actuarial loss on pension schemes liabilities | 27 | 1,002 | - | 1,002 | ||||||||||||
| Actuarial loss on non-plan pension assets | 27 | 1,153 | - | 1,153 | ||||||||||||
| Deferred tax movement | (1,412 | ) | - | (1,412 | ) | |||||||||||
| Items that may be subsequently reclassified to profit or loss | ||||||||||||||||
| Currency translation differences – continuing operations | (2,871 | ) | - | (2,871 | ) | |||||||||||
| Currency translation differences - discontinued operation | (587 | ) | - | (587 | ) | |||||||||||
| Other comprehensive income for the period | 598 | - | 598 | |||||||||||||
| Total comprehensive income/(expense) for the period | 184,588 | (21,018 | ) | 163,570 | ||||||||||||
| Attributable to: | ||||||||||||||||
| Equity shareholders of the company | 184,510 | (21,018 | ) | 163,492 | ||||||||||||
| Non-controlling interests | 78 | - | 78 | |||||||||||||
| Total comprehensive income for the period | 184,588 | (21,018 | ) | 163,570 | ||||||||||||
| Total comprehensive income/(expense) attributable to the equity shareholders of the company arises from: | ||||||||||||||||
| Continuing operations | 154,079 | (21,018 | ) | 133,061 | ||||||||||||
| Discontinued operations | 30,509 | - | 30,509 | |||||||||||||
| 184,588 | (21,018 | ) | 163,570 | |||||||||||||
| Earnings per share (cents) | ||||||||||||||||
| Earnings per share (cents) | ||||||||||||||||
| From continuing and discontinued operations | cents | |||||||||||||||
| - basic | 9 | 74.50 | ||||||||||||||
| - diluted | 9 | 71.61 | ||||||||||||||
| From continuing operations | ||||||||||||||||
| - basic | 9 | 62.4 | ||||||||||||||
| - diluted | 9 | 59.97 | ||||||||||||||
| Earnings per share (pence) | ||||||||||||||||
| From continuing and discontinued operations | pence | |||||||||||||||
| - basic | 9 | 49.59 | ||||||||||||||
| - diluted | 9 | 47.66 | ||||||||||||||
| From continuing operations | ||||||||||||||||
| - basic | 9 | 41.54 | ||||||||||||||
| - diluted | 9 | 39.92 | ||||||||||||||
Consolidated statements of financial position
| Note | October 31, 2018 $’000 | April 30, 2017 $’000 | ||||||||||
| Non-current assets | ||||||||||||
| Goodwill | 10 | 6,805,043 | 2,828,604 | |||||||||
| Other intangible assets | 11 | 6,629,325 | 1,089,370 | |||||||||
| Property, plant and equipment | 12 | 144,250 | 40,956 | |||||||||
| Investments in associates | 14 | - | 11,457 | |||||||||
| Derivative asset | 29 | 86,381 | - | |||||||||
| Long-term pension assets | 27 | 16,678 | 22,031 | |||||||||
| Other non-current assets | 15 | 38,790 | 3,093 | |||||||||
| 13,720,467 | 3,995,511 | |||||||||||
| Current assets | ||||||||||||
| Inventories | 16 | 204 | 64 | |||||||||
| Trade and other receivables | 17 | 1,272,033 | 289,509 | |||||||||
| Current tax receivables | 23 | 24,504 | 1,637 | |||||||||
| Cash and cash equivalents | 18 | 620,896 | 150,983 | |||||||||
| 1,917,637 | 442,193 | |||||||||||
| Assets classified as held for sale | 19 | 1,142,451 | - | |||||||||
| Total current assets | 3,060,088 | 442,193 | ||||||||||
| Total assets | 16,780,555 | 4,437,704 | ||||||||||
| Current liabilities | ||||||||||||
| Trade and other payables | 20 | 676,917 | 170,042 | |||||||||
| Borrowings | 21 | 3,702 | 71,184 | |||||||||
| Finance leases | 22 | 13,560 | - | |||||||||
| Provisions | 26 | 57,411 | 20,142 | |||||||||
| Current tax liabilities | 23 | 124,071 | 42,679 | |||||||||
| Deferred income | 24 | 1,134,730 | 640,650 | |||||||||
| 2,010,391 | 944,697 | |||||||||||
| Current liabilities classified as held for sale | 19 | 437,699 | - | |||||||||
| 2,448,090 | 944,697 | |||||||||||
| Non-current liabilities | ||||||||||||
| Deferred income | 25 | 178,064 | 223,786 | |||||||||
| Borrowings | 21 | 4,842,178 | 1,490,352 | |||||||||
| Finance leases | 22 | 14,923 | - | |||||||||
| Retirement benefit obligations | 27 | 110,351 | 30,773 | |||||||||
| Long-term provisions | 26 | 35,421 | 11,937 | |||||||||
| Other non-current liabilities | 28 | 58,011 | 4,191 | |||||||||
| Current tax liabilities | 23 | 131,048 | - | |||||||||
| Deferred tax liabilities | 30 | 1,170,489 | 118,478 | |||||||||
| 6,540,485 | 1,879,517 | |||||||||||
| Total liabilities | 8,988,575 | 2,824,214 | ||||||||||
| Net assets | 7,791,980 | 1,613,490 | ||||||||||
| Note | October 31, 2018 $’000 | April 30, 2017 $’000 | ||||||||||
| Capital and reserves | ||||||||||||
| Share capital | 31 | 65,798 | 39,700 | |||||||||
| Share premium account | 32 | 40,961 | 192,145 | |||||||||
| Merger reserve | 33 | 3,724,384 | 338,104 | |||||||||
| Capital redemption reserve | 33 | 666,289 | 163,363 | |||||||||
| Hedging reserve | 33 | 69,968 | - | |||||||||
| Retained earnings | 3,275,243 | 902,183 | ||||||||||
| Foreign currency translation deficit | (51,702 | ) | (22,959 | ) | ||||||||
| Total equity attributable to owners of the parent | 7,790,941 | 1,612,536 | ||||||||||
| Non-controlling interests | 34 | 1,039 | 954 | |||||||||
| Total equity | 7,791,980 | 1,613,490 | ||||||||||
Share capital | Share premium account | Retained (deficit)/ earnings | Foreign currency translation deficit | Capital redemption reserves | Hedging reserve | Merger reserve | Total equity attributable to owners of the parent | Non- controlling interests | Total equity | |||||||||||||||||||||||||||||||||||
| Note | $’000 | $’000 | $’000 | $’000 | $’000 | $’000 | $’000 | $’000 | $’000 | $’000 | ||||||||||||||||||||||||||||||||||
| Balance as at May 1, 2015 | 39,555 | 16,087 | (96,479 | ) | (13,548 | ) | 163,363 | - | 1,168,104 | 1,277,082 | 979 | 1,278,061 | ||||||||||||||||||||||||||||||||
| Profit for the financial period | - | - | 162,894 | - | - | - | - | 162,894 | 78 | 162,972 | ||||||||||||||||||||||||||||||||||
| Other comprehensive income/(expense) for the period | - | - | 4,056 | (3,458 | ) | - | - | - | 598 | - | 598 | |||||||||||||||||||||||||||||||||
| Total comprehensive income/(expense) for the period | - | - | 166,950 | (3,458 | ) | - | - | - | 163,492 | 78 | 163,570 | |||||||||||||||||||||||||||||||||
| Transactions with owners: | ||||||||||||||||||||||||||||||||||||||||||||
| Dividends | 7 | - | - | (105,159 | ) | - | - | - | - | (105,159 | ) | - | (105,159 | ) | ||||||||||||||||||||||||||||||
| Share options: | ||||||||||||||||||||||||||||||||||||||||||||
| Issue of share capital – share options | 29,30 | 18 | 950 | (70 | ) | - | - | - | - | 898 | - | 898 | ||||||||||||||||||||||||||||||||
| Movement in relation to share options | - | - | 23,582 | - | - | - | - | 23,582 | - | 23,582 | ||||||||||||||||||||||||||||||||||
| Corporation tax on share options | - | - | 1,545 | - | - | - | - | 1,545 | - | 1,545 | ||||||||||||||||||||||||||||||||||
| Deferred tax on share options | - | - | 8,490 | - | - | - | - | 8,490 | - | 8,490 | ||||||||||||||||||||||||||||||||||
| Share placement: | ||||||||||||||||||||||||||||||||||||||||||||
| Issue of share capital – share placement | 30 | - | 176,235 | 49,485 | - | - | - | 225,720 | - | 225,720 | ||||||||||||||||||||||||||||||||||
| Share placement issue costs | 37 | - | (2,979 | ) | - | - | - | - | (2,979 | ) | - | (2,979 | ) | |||||||||||||||||||||||||||||||
| Reallocation of merger reserve | 31 | - | - | 180,000 | - | - | - | (180,000 | ) | - | - | - | ||||||||||||||||||||||||||||||||
| Total movements for the period | 18 | 174,206 | 324,823 | (3,458 | ) | - | - | (180,000 | ) | 315,589 | 78 | 315,667 | ||||||||||||||||||||||||||||||||
| Balance as at April 30, 2016 | 39,573 | 190,293 | 228,344 | (17,006 | ) | 163,363 | - | 988,104 | 1,592,671 | 1,057 | 1,593,728 | |||||||||||||||||||||||||||||||||
Consolidated statement of changes in equity
For the 12 months ended April 30, 2017Share capital | Share premium account | Retained (deficit)/ earnings | Foreign currency translation deficit | Capital redemption reserves | Hedging reserve | Merger reserve | Total equity attributable to owners of the parent | Non- controlling interests | Total equity | |||||||||||||||||||||||||||||||||||
| Note | $’000 | $’000 | $’000 | $’000 | $’000 | $’000 | $’000 | $’000 | $’000 | $’000 | ||||||||||||||||||||||||||||||||||
| Balance as at May 1, 2016 | 39,573 | 190,293 | 228,344 | (17,006 | ) | 163,363 | - | 988,104 | 1,592,671 | 1,057 | 1,593,728 | |||||||||||||||||||||||||||||||||
| Profit for the financial period | - | - | 157,906 | - | - | - | - | 157,906 | (103 | ) | 157,803 | |||||||||||||||||||||||||||||||||
| Other comprehensive income/(expense) for the period | - | - | 207 | (5,953 | ) | - | - | - | (5,746 | ) | - | (5,746 | ) | |||||||||||||||||||||||||||||||
| Total comprehensive income/(expense) for the period | - | - | 158,113 | (5,953 | ) | - | - | - | 152,160 | (103 | ) | 152,057 | ||||||||||||||||||||||||||||||||
| Transactions with owners: | ||||||||||||||||||||||||||||||||||||||||||||
| Dividends | 8 | - | - | (177,535 | ) | - | - | - | - | (177,535 | ) | - | (177,535 | ) | ||||||||||||||||||||||||||||||
| Treasury shares purchased | - | - | (7,678 | ) | - | - | - | - | (7,678 | ) | - | (7,678 | ) | |||||||||||||||||||||||||||||||
| Share options: | ||||||||||||||||||||||||||||||||||||||||||||
| Issue of share capital – share options | 31,32 | 127 | 1,852 | (90 | ) | - | - | - | - | 1,889 | - | 1,889 | ||||||||||||||||||||||||||||||||
| Movement in relation to share options | - | - | 23,952 | - | - | - | - | 23,952 | - | 23,952 | ||||||||||||||||||||||||||||||||||
| Corporation tax on share options | - | - | 4,081 | - | - | - | - | 4,081 | - | 4,081 | ||||||||||||||||||||||||||||||||||
| Deferred tax on share options | - | - | 22,996 | - | - | - | - | 22,996 | - | 22,996 | ||||||||||||||||||||||||||||||||||
| Reallocation of merger reserve | 33 | - | - | 650,000 | - | - | - | (650,000 | ) | - | - | - | ||||||||||||||||||||||||||||||||
| Total movements for the period | 127 | 1,852 | 673,839 | (5,953 | ) | - | - | (650,000 | ) | 19,865 | (103 | ) | 19,762 | |||||||||||||||||||||||||||||||
| Balance as at April 30, 2017 | 39,700 | 192,145 | 902,183 | (22,959 | ) | 163,363 | - | 338,104 | 1,612,536 | 954 | 1,613,490 | |||||||||||||||||||||||||||||||||
Share capital | Share premium account | Retained (deficit)/ earnings | Foreign currency translation deficit | Capital redemption reserves | Hedging reserve | Merger reserve | Total equity attributable to owners of the parent | Non- controlling interests | Total equity | |||||||||||||||||||||||||||||||||||
| Note | $’000 | $’000 | $’000 | $’000 | $’000 | $’000 | $’000 | $’000 | $’000 | $’000 | ||||||||||||||||||||||||||||||||||
| Balance as at May 1, 2017 | 39,700 | 192,145 | 902,183 | (22,959 | ) | 163,363 | - | 338,104 | 1,612,536 | 954 | 1,613,490 | |||||||||||||||||||||||||||||||||
| Profit for the financial period | - | - | 784,048 | - | - | - | - | 784,048 | 85 | 784,133 | ||||||||||||||||||||||||||||||||||
| Other comprehensive (expense)/income for the period | - | - | (11,920 | ) | (28,743 | ) | - | 69,968 | - | 29,305 | - | 29,305 | ||||||||||||||||||||||||||||||||
| Total comprehensive income/(expense) for the period | - | - | 772,128 | (28,743 | ) | - | 69,968 | - | 813,353 | 85 | 813,438 | |||||||||||||||||||||||||||||||||
| Transactions with owners: | ||||||||||||||||||||||||||||||||||||||||||||
| Dividends | 8 | - | - | (542,161 | ) | - | - | - | - | (542,161 | ) | - | (542,161 | ) | ||||||||||||||||||||||||||||||
| Share options: | ||||||||||||||||||||||||||||||||||||||||||||
| Issue of share capital – share options | 31,32 | 251 | 5,499 | (61 | ) | - | - | - | - | 5,689 | - | 5,689 | ||||||||||||||||||||||||||||||||
| Movement in relation to share option | - | - | 78,643 | - | - | - | - | 78,643 | - | 78,643 | ||||||||||||||||||||||||||||||||||
| Corporation tax on share options | - | - | 4,145 | - | - | - | - | 4,145 | - | 4,145 | ||||||||||||||||||||||||||||||||||
| Deferred tax on share options | - | - | (23,724 | ) | - | - | - | - | (23,724 | ) | - | (23,724 | ) | |||||||||||||||||||||||||||||||
| Acquisitions: | ||||||||||||||||||||||||||||||||||||||||||||
| Shares issued to acquire HPE Software business | 31 | 28,773 | - | - | - | - | - | 6,485,397 | 6,514,170 | - | 6,514,170 | |||||||||||||||||||||||||||||||||
| Share reorganization and buy-back: | ||||||||||||||||||||||||||||||||||||||||||||
| Return of Value – share consolidation | 31,33 | (2,926 | ) | - | - | - | 2,926 | - | - | - | - | - | ||||||||||||||||||||||||||||||||
| Issue and redemption of B shares | 31,33 | - | (156,683 | ) | (500,000 | ) | - | 500,000 | - | (343,317 | ) | (500,000 | ) | - | (500,000 | ) | ||||||||||||||||||||||||||||
| Share buy-back | 31 | - | - | (171,710 | ) | - | - | - | - | (171,710 | ) | - | (171,710 | ) | ||||||||||||||||||||||||||||||
| Reallocation of merger reserve | 33 | - | - | 2,755,800 | - | - | - | (2,755,800 | ) | - | - | - | ||||||||||||||||||||||||||||||||
| Total movements for the period | 26,098 | (151,184 | ) | 2,373,060 | (28,743 | ) | 502,926 | 69,968 | 3,386,280 | 6,178,405 | 85 | 6,178,490 | ||||||||||||||||||||||||||||||||
| Balance as at October 31, 2018 | 65,798 | 40,961 | 3,275,243 | (51,702 | ) | 666,289 | 69,968 | 3,724,384 | 7,790,941 | 1,039 | 7,791,980 | |||||||||||||||||||||||||||||||||
Note | 18 months ended October 31, 2018 $’000 | 12 months ended April 30, 2017 $’000 | 12 months ended April 30, 2016 * $’000 | |||||||||||||
| Cash flows from operating activities | ||||||||||||||||
| Cash generated from operations | 40 | 1,424,311 | 564,792 | 456,113 | ||||||||||||
| Interest paid | (301,791 | ) | (81,115 | ) | (91,807 | ) | ||||||||||
| Bank loan costs | (101,159 | ) | (6,654 | ) | (1,805 | ) | ||||||||||
| Tax paid | (99,490 | ) | (24,644 | ) | (79,282 | ) | ||||||||||
| Net cash generated from operating activities | 921,871 | 452,379 | 283,219 | |||||||||||||
| Cash flows from/(used in) investing activities | ||||||||||||||||
| Payments for intangible assets | 11 | (92,115 | ) | (31,438 | ) | (34,488 | ) | |||||||||
| Purchase of property, plant and equipment | 12 | (40,091 | ) | (11,727 | ) | (10,281 | ) | |||||||||
| Finance leases | 22 | (735 | ) | - | - | |||||||||||
| Interest received | 9,224 | 979 | 1,009 | |||||||||||||
| Payment for acquisition of business | 39 | (19,260 | ) | (299,061 | ) | (9,960 | ) | |||||||||
| Repayment of bank borrowings on acquisition of businesses | 39 | - | (316,650 | ) | - | |||||||||||
| Net cash acquired with acquisitions | 39 | 321,668 | 68,173 | 106 | ||||||||||||
| Net cash from/(used in) investing activities | 178,691 | (589,724 | ) | (53,614 | ) | |||||||||||
| Cash flows (used in)/from financing activities | ||||||||||||||||
| Investment in non-controlling interest | 34 | (3 | ) | (2 | ) | - | ||||||||||
| Proceeds from issue of ordinary share capital | 31 | 5,750 | 1,979 | 968 | ||||||||||||
| Purchase of treasury shares | 31 | (171,710 | ) | (7,678 | ) | - | ||||||||||
| Return of Value paid to shareholders | 33 | (500,000 | ) | - | - | |||||||||||
| Repayment of working capital in respect of HPE Software business acquisition | 39 | (225,800 | ) | - | - | |||||||||||
| Proceeds from share capital placement | 33 | - | - | 225,720 | ||||||||||||
| Costs associated with share placement | - | - | (2,979 | ) | ||||||||||||
| Repayment of bank borrowings | 21 | (252,936 | ) | (372,062 | ) | (157,750 | ) | |||||||||
| Proceeds from bank borrowings | 21 | 1,043,815 | 180,000 | 245,000 | ||||||||||||
| Dividends paid to owners | 8 | (542,161 | ) | (177,535 | ) | (105,159 | ) | |||||||||
| Net cash (used in)/from financing activities | (643,045 | ) | (375,298 | ) | 205,800 | |||||||||||
| Effects of exchange rate changes | 15,302 | (3,552 | ) | (9,551 | ) | |||||||||||
| Net increase/(decrease) in cash and cash equivalents | 472,819 | (516,195 | ) | 425,854 | ||||||||||||
| Cash and cash equivalents at beginning of period | 150,983 | 667,178 | 241,324 | |||||||||||||
| 18 | 623,802 | 150,983 | 667,178 | |||||||||||||
| Reclassification to current assets classified as held for sale | 19 | (2,906 | ) | - | - | |||||||||||
| Cash and cash equivalents at end of period | 18 | 620,896 | 150,983 | 667,178 | ||||||||||||
Consolidated financial statements and notes
Summary of significant accounting policies continued| i) | Assets and liabilities for each consolidated statement of financial position presented are translated at the closing rate at the date of that consolidated statement of financial position; |
| ii) | Income and expenses for each consolidated statement of comprehensive income item are translated at average exchange rates (unless this average is not a reasonable approximation of the cumulative effect of the rates prevailing on the transaction dates, in which case income and expenses are translated at the dates of the transactions); and |
| iii) | All resulting exchange differences are recognized as a separate component of equity. |
18 months ended October 31, 2018 | 12 months ended April 30, 2017 | 12 months ended April 30, 2016 | ||||||||||||||||||||||
| Average | Closing | Average | Closing | Average | Closing | |||||||||||||||||||
| £1 = $ | 1.33 | 1.27 | 1.29 | 1.29 | 1.50 | 1.46 | ||||||||||||||||||
| €1 = $ | 1.18 | 1.14 | 1.09 | 1.09 | 1.11 | 1.14 | ||||||||||||||||||
| C$ = $ | 0.78 | 0.76 | 0.76 | 0.73 | 0.77 | 0.80 | ||||||||||||||||||
| ILS = $ | 0.28 | 0.27 | 0.26 | 0.28 | 0.26 | 0.27 | ||||||||||||||||||
| Purchased software | Three to five years |
| Technology | Three to 12 years |
| Trade names | Three to 20 years |
| Customer relationships | Two to 15 years |
| Lease contracts | Five and half years |
| Buildings | 30 years |
| Leasehold improvements | Three to 10 years |
| Fixtures and fittings | Two to seven years |
| Computer equipment | One to five years |
| - | IFRS 15 ‘Revenue from contracts with customers’ establishes the principles that an entity shall apply to report useful information to users of financial statements about the nature, amount, timing, and uncertainty of revenue and cash flows arising from a contract with a customer. Application of the standard is mandatory for annual reporting periods starting from January 1, 2018 onwards. Earlier application is permitted. The standard replaces IAS 18 ‘Revenue’ and IAS 11 ‘Construction contracts’ and related interpretations clarifications. Please refer to below for a more detailed assessment to-date on implementing this standard. |
| - | IFRS 9 ‘Financial instruments’. This standard replaces the guidance in IAS 39 and applies to periods beginning on or after January 1, 2018. It includes requirements on the classification and measurement of financial assets and liabilities; it also includes an expected credit loss model that replaces the current incurred loss impairment model. |
| - | Amendments to IFRS 2, ‘Share based payments’ on clarifying how to account for certain types of share-based payment transactions are effective on periods beginning on or after January 1, 2018, subject to EU endorsement. These amendments clarify the measurement basis for cash-settled share-based payments and the accounting for modifications that change an award from cash-settled to equity-settled. It also introduces an exception to the principles in IFRS 2 that will require an award to be treated as if it was wholly equity-settled, where an employer is obliged to withhold an amount for the employee’s tax obligation associated with a share-based payment and pay that amount to the tax authority. |
| - | IFRS 16, ‘Leases’ addresses the definition of a lease, recognition and measurement of leases and establishes principles for reporting useful information to users of financial statements about the leasing activities of both lessees and lessors. A key change arising from IFRS 16 is that most operating leases will be accounted for on balance sheet for lessees. The standard replaces IAS 17 ‘Leases', and related interpretations. The standard is effective for annual periods beginning on or after January 1, 2019 and earlier application is permitted if the entity is adopting IFRS 15 'Revenue from contracts with customers' at the same time, subject to EU endorsement. |
| - | Annual improvements 2014–2016 include amendments to IFRS 1, ‘First-time adoption of IFRS’, IFRS 12, ‘Disclosure of interests in other entities’ and IAS 28, ’Investments in associates and joint ventures’ regarding measuring an associate or joint venture at fair value applies for periods beginning on or after January 1, 2018, subject to EU endorsement. |
| - | IFRIC 22, ‘Foreign currency transactions and advance consideration’ addresses foreign currency transactions or parts of transactions where there is consideration that is denominated or priced in a foreign currency. The interpretation provides guidance for when a single payment/receipt is made as well as for situations where multiple payments/receipts are made, effective for annual periods beginning on or after January 1, 2018, subject to EU endorsement. |
| - | Clarifications to IFRS 15 ‘Revenue from Contracts with Customers’ are effective on periods beginning on or after January 1, 2018, subject to EU endorsement. These amendments comprise clarifications of the guidance on identifying performance obligations, accounting for licences of intellectual property and the principal versus agent assessment (gross versus net revenue presentation). |
| - | IFRIC 23, ‘Uncertainty over Income Tax Treatments’ clarifies how to apply the recognition and measurement requirements in IAS 12 when there is uncertainty over income tax treatments. In such a circumstance, an entity shall recognize and measure its current or deferred tax asset or liability applying the requirements in IAS 12 based on taxable profit (tax loss), tax bases, unused tax losses, unused tax credits and tax rates determined applying this interpretation. This interpretation is effective for annual periods beginning on or after January 1, 2019, subject to EU endorsement. |
| - | Annual Improvements 2017 includes amendments to IFRS 3, ‘Business combinations’, IFRS 11 ‘Joint arrangements’ and IAS 12 Income taxes applies for periods beginning on or after January 1, 2019, subject to EU endorsement. |
| - | Amendments to IAS 28 Investments in Associates and Joint Ventures – ‘Long-term Interests in Associates and Joint Ventures’, clarifies that IFRS 9 ‘Financial instruments’ applies, including its impairment requirements to long-term interests in an associate or joint venture that form part of the net investment in the associate or joint venture but to which the equity method is not applied’, subject to EU endorsement. |
| - | Amendments to IAS 19 ‘Employee Benefits’ clarify that on a plan amendment, curtailment or settlement of a defined benefit plan, entities must use updated actuarial assumptions to determine its current service cost and net interest for the period; and the effect of the asset ceiling is disregarded when calculating the gain or loss on any settlement of the plan and is dealt with separately in other comprehensive income, effective January 1, 2019, subject to EU endorsement. |
| - | Amendments to References to the Conceptual Framework in IFRS Standards - Amendments to IFRS 2, IFRS 3, IFRS 6, IFRS 14, IAS 1, IAS 8, IAS 34, IAS 37, IAS 38, IFRIC 12, IFRIC 19, IFRIC 20, IFRIC 22, and SIC-32 to update those pronouncements with regard to the revised the Conceptual Framework, effective January 1, 2020, subject to EU endorsement. |
Increase in opening Retained Earnings on November 1, 2018 | Estimated increase in Revenue in FY19 | Estimated increase / (decrease) in operating expenses in FY19 | Estimated increase in profit before tax in FY19 | |||||||||||||
| $’m | $’m | $’m | $’m | |||||||||||||
| Cost of obtaining customer contracts | 66 | - | (20 | ) | 20 | |||||||||||
| Rebillable Expenses | - | 2 | 2 | - | ||||||||||||
| Consideration payable to a customer | 5 | 23 | 23 | - | ||||||||||||
| 71 | 25 | 5 | 20 | |||||||||||||
| · | Status of the unresolved matter; |
| · | Strength of technical argument and clarity of legislation; |
| · | External advice; |
| · | Resolution process, past experience and precedents set with the particular taxing authority; |
| · | Agreements previously reached in other jurisdictions on comparable issues; and |
| · | Statute of limitations. |
18 months ended October 31, 2018 | 12 months ended April 30, 20171 | 12 months ended April 30, 20161 | ||||||||||||||
| Note | $’000 | $’000 | $’000 | |||||||||||||
| Revenue before deferred revenue haircut | 4,815,460 | 1,084,165 | 1,001,483 | |||||||||||||
| Deferred revenue haircut | (61,062 | ) | (6,892 | ) | (10,250 | ) | ||||||||||
| Segment revenue | 4,754,398 | 1,077,273 | 991,233 | |||||||||||||
| Directly managed costs | (2,997,545 | ) | (564,072 | ) | (566,457 | ) | ||||||||||
| Allocation of centrally managed costs | 52,730 | 26,196 | 28,883 | |||||||||||||
| Total segment costs | (2,944,815 | ) | (537,876 | ) | (537,574 | ) | ||||||||||
| Adjusted Operating Profit | 1,809,583 | 539,397 | 453,659 | |||||||||||||
| Exceptional items | 4 | (538,156 | ) | (97,258 | ) | (27,853 | ) | |||||||||
| Share based compensation charge | 35 | (64,284 | ) | (31,463 | ) | (26,254 | ) | |||||||||
| Amortization of purchased intangibles | 11 | (830,319 | ) | (183,284 | ) | (152,356 | ) | |||||||||
| Operating profit | 376,824 | 227,392 | 247,196 | |||||||||||||
| Net finance costs | 6 | (342,712 | ) | (95,845 | ) | (97,348 | ) | |||||||||
| Profit before tax | 34,112 | 131,547 | 149,848 | |||||||||||||
| Reconciliation to Adjusted EBITDA: | ||||||||||||||||
| Profit before tax | 34,112 | 131,547 | 149,848 | |||||||||||||
| Finance costs | 6 | 350,366 | 96,824 | 98,357 | ||||||||||||
| Finance income | 6 | (7,654 | ) | (979 | ) | (1,009 | ) | |||||||||
| Depreciation of property, plant and equipment | 12 | 88,611 | 9,704 | 9,736 | ||||||||||||
| Amortization of intangible assets | 11 | 903,008 | 206,751 | 187,337 | ||||||||||||
| Exceptional items (reported in Operating profit) | 4 | 538,156 | 97,258 | 27,853 | ||||||||||||
| Share-based compensation charge | 35 | 64,284 | 31,463 | 26,254 | ||||||||||||
| Product development intangible costs capitalized | 11 | (44,350 | ) | (27,664 | ) | (30,877 | ) | |||||||||
| Foreign exchange credit | (37,292 | ) | (2,901 | ) | (2,584 | ) | ||||||||||
| Adjusted EBITDA | 1,889,241 | 542,003 | 464,915 | |||||||||||||
18 months ended October 31, 2018 | 12 months ended April 30, 20171 | 12 months ended April 30, 2016 1 | ||||||||||
| $’000 | $’000 | $’000 | ||||||||||
| UK | 299,579 | 52,230 | 55,257 | |||||||||
| USA | 2,279,840 | 551,519 | 459,045 | |||||||||
| Germany | 309,534 | 86,799 | 108,541 | |||||||||
| France | 195,464 | 43,242 | 39,561 | |||||||||
| Japan | 145,820 | 42,369 | 35,969 | |||||||||
| Other | 1,524,161 | 301,114 | 292,869 | |||||||||
| Total | 4,754,398 | 1,077,273 | 991,233 | |||||||||
Licence $’000 | Maintenance $’000 | Consulting $’000 | SaaS & other recurring $’000 | Total $’000 | ||||||||||||||||
| Application Modernization & Connectivity | 256,256 | 497,632 | 17,941 | - | 771,829 | |||||||||||||||
| Application Delivery Management | 185,460 | 646,711 | 41,639 | 114,145 | 987,956 | |||||||||||||||
| IT Operations Management | 363,150 | 869,891 | 192,772 | 15,055 | 1,440,868 | |||||||||||||||
| Security | 291,603 | 580,228 | 81,429 | 41,614 | 994,875 | |||||||||||||||
| Information Management & Governance | 117,227 | 267,133 | 32,521 | 203,053 | 619,933 | |||||||||||||||
| Subtotal | 1,213,696 | 2,861,595 | 366,302 | 373,867 | 4,815,460 | |||||||||||||||
| Deferred revenue haircut | (7,592 | ) | (42,657 | ) | (2,046 | ) | (8,767 | ) | (61,062 | ) | ||||||||||
| Total Revenue | 1,206,104 | 2,818,938 | 364,256 | 365,100 | 4,754,398 | |||||||||||||||
Licence $’000 | Maintenance $’000 | Consulting $’000 | SaaS & other recurring $’000 | Total $’000 | ||||||||||||||||
| CDMS | 105,962 | 149,668 | 9,530 | - | 265,160 | |||||||||||||||
| Host Connectivity | 69,158 | 104,912 | 1,857 | - | 175,927 | |||||||||||||||
| Identity, Access & Security | 48,635 | 141,298 | 18,354 | - | 208,287 | |||||||||||||||
| Development & IT Operations Management Tools | 55,464 | 219,604 | 13,860 | - | 288,928 | |||||||||||||||
| Collaboration & Networking | 29,175 | 112,079 | 4,609 | - | 145,863 | |||||||||||||||
| Subtotal | 308,394 | 727,561 | 48,210 | - | 1,084,165 | |||||||||||||||
| Deferred revenue haircut | - | (6,892 | ) | - | - | (6,892 | ) | |||||||||||||
| Total Revenue | 308,394 | 720,669 | 48,210 | - | 1,077,273 | |||||||||||||||
Licence $’000 | Maintenance $’000 | Consulting $’000 | SaaS $’000 | Total $’000 | ||||||||||||||||
| Micro Focus Product Portfolio (continuing operations): | ||||||||||||||||||||
| CDMS | 104,737 | 145,180 | 8,911 | - | 258,828 | |||||||||||||||
| Host Connectivity | 89,862 | 107,171 | 2,920 | - | 199,953 | |||||||||||||||
| Identity, Access & Security | 52,360 | 145,648 | 22,083 | - | 220,091 | |||||||||||||||
| Development & IT Operations Management Tools | 33,918 | 121,310 | 2,219 | - | 157,447 | |||||||||||||||
| Collaboration & Networking | 23,943 | 135,392 | 5,829 | - | 165,164 | |||||||||||||||
| Subtotal | 304,820 | 654,701 | 41,962 | - | 1,001,483 | |||||||||||||||
| Deferred revenue haircut | - | (10,250 | ) | - | - | (10,250 | ) | |||||||||||||
| Total Revenue | 304,820 | 644,451 | 41,962 | - | 991,233 | |||||||||||||||
18 months ended October 31, 2018 | 12 months ended April 30, 20171 | 12 months ended April 30, 20161 | ||||||||||||||
| Note | $’000 | $’000 | $’000 | |||||||||||||
| Staff costs | 35 | 2,095,025 | 480,654 | 429,493 | ||||||||||||
| Depreciation of property, plant and equipment | ||||||||||||||||
| owned assets | 12 | 71,184 | 9,704 | 9,736 | ||||||||||||
| leased assets | 12 | 17,427 | - | - | ||||||||||||
| Loss on disposal of property, plant and equipment | 12 | 4,581 | 520 | - | ||||||||||||
| Amortization of intangibles | 11 | 903,008 | 206,751 | 187,337 | ||||||||||||
| Inventories | ||||||||||||||||
| – cost of inventories recognized as a credit (included in cost of sales) | 16 | 324 | (71 | ) | (72 | ) | ||||||||||
| Operating lease rentals payable | ||||||||||||||||
| – plant and machinery | 8,840 | 2,880 | 1,559 | |||||||||||||
| – property | 85,328 | 18,356 | 20,706 | |||||||||||||
| Provision for receivables impairment | 17 | 40,016 | 2,023 | 2,531 | ||||||||||||
| Foreign exchange gains | (37,292 | ) | (2,901 | ) | (2,584 | ) | ||||||||||
| 4 | Exceptional items |
18 months ended October 31, 2018 | 12 months ended April 30, 2017 | 12 months ended April 30, 2016 | ||||||||||
| Reported within Operating profit: | $’000 | $’000 | $’000 | |||||||||
| Integration costs | 278,995 | 27,696 | 23,634 | |||||||||
| Pre-acquisition costs | 43,025 | 58,004 | 5,569 | |||||||||
| Acquisition costs | 27,116 | 2,597 | 531 | |||||||||
| Property related costs | 38,014 | 5,525 | 5,964 | |||||||||
| Severance and legal costs | 129,743 | 3,436 | (4,845 | ) | ||||||||
| Divestiture | 21,263 | - | - | |||||||||
| Royalty provision release | - | - | (3,000 | ) | ||||||||
| 538,156 | 97,258 | 27,853 | ||||||||||
| Reported within finance costs: | ||||||||||||
Finance costs incurred in escrow period (note 6) | 6,326 | - | - | |||||||||
| Reported within finance income: | ||||||||||||
Finance income earned in escrow period (note 6) | (553 | ) | - | - | ||||||||
| 5,773 | - | - | ||||||||||
| Exceptional costs before tax | 543,929 | 97,258 | 27,853 | |||||||||
| Tax: | ||||||||||||
| Tax effect of exceptional items | (105,911 | ) | (11,633 | ) | (6,835 | ) | ||||||
| Tax exceptional item | (692,285 | ) | - | - | ||||||||
| (798,196 | ) | (11,633 | ) | (6,835 | ) | |||||||
| Exceptional (income)/costs after tax | (254,267 | ) | 85,625 | 21,018 | ||||||||
18 months ended October 31, 2018 | 12 months ended April 30, 2017 | 12 months ended April 30, 2016 | ||||||||||
| $’000 | $’000 | $’000 | ||||||||||
| Audit of Company | 12,223 | 1,032 | 563 | |||||||||
| Audit of subsidiaries | 1,887 | 2,494 | 2,895 | |||||||||
| Total audit | 14,110 | 3,526 | 3,458 | |||||||||
| Audit related assurance services | 914 | 2,634 | 782 | |||||||||
| Other assurance services | 664 | - | - | |||||||||
| Total assurance services | 1,578 | 2,634 | 782 | |||||||||
| Tax compliance services | 214 | 49 | 60 | |||||||||
| Tax advisory services | 196 | 53 | 70 | |||||||||
| Services relating to taxation | 410 | 102 | 130 | |||||||||
| Other non-audit services | 35 | 7,470 | 1,842 | |||||||||
| Total | 16,133 | 13,732 | 6,212 | |||||||||
| Note | 18 months ended October 31, 2018 | 12 months ended April 30, 2017 | 12 months ended April 30, 2016 | |||||||||||||
| $’000 | $’000 | $’000 | ||||||||||||||
| Finance costs | ||||||||||||||||
| Interest on bank borrowings | 276,530 | 81,157 | 82,369 | |||||||||||||
| Commitment fees | 3,294 | 796 | 1,108 | |||||||||||||
| Amortization of facility costs and original issue discounts | 60,377 | 14,219 | 13,762 | |||||||||||||
| Finance costs on bank borrowings | 340,201 | 96,172 | 97,239 | |||||||||||||
| Net interest expense on retirement obligations | 27 | 2,823 | 565 | 467 | ||||||||||||
| Finance lease expense | 2,690 | - | - | |||||||||||||
| Interest rate swaps: cash flow hedges, transfer from equity | 3,399 | - | - | |||||||||||||
| Interest on tax provisions | - | - | 525 | |||||||||||||
| Other | 1,254 | 87 | 126 | |||||||||||||
| Total | 350,366 | 96,824 | 98,357 | |||||||||||||
18 months ended October 31, 2018 | 12 months ended April 30, 2017 | 12 months ended April 30, 2016 | ||||||||||||||
| $’000 | $’000 | $’000 | ||||||||||||||
| Finance income | ||||||||||||||||
| Bank interest | 3,593 | 438 | 377 | |||||||||||||
| Interest on non-plan pension assets | 27 | 633 | 404 | 333 | ||||||||||||
| Other | 3,428 | 137 | 299 | |||||||||||||
| Total | 7,654 | 979 | 1,009 | |||||||||||||
| Net finance cost | 342,712 | 95,845 | 97,348 | |||||||||||||
| Included within exceptional items | 4 | |||||||||||||||
| Finance costs incurred in escrow period | 6,326 | - | - | |||||||||||||
| Finance income earned in escrow period | (553 | ) | - | - | ||||||||||||
| 5,773 | - | - | ||||||||||||||
18 months ended October 31, 2018 | 12 months ended April 30, 20171 | 12 months ended April 30, 20161 | ||||||||||
| $’000 | $’000 | $’000 | ||||||||||
| Current tax | ||||||||||||
| Current period | 245,875 | 33,928 | 23,359 | |||||||||
| Adjustments to tax in respect of previous periods | (14,725 | ) | 1,698 | (20,570 | ) | |||||||
| 231,150 | 35,626 | 2,789 | ||||||||||
| Deferred tax | ||||||||||||
| Origination and reversal of timing differences | 26,421 | (22,426 | ) | (4,145 | ) | |||||||
| Adjustments to tax in respect of previous periods | 1,213 | (4,445 | ) | 16,010 | ||||||||
| Impact of change in tax rates | (931,865 | ) | (1,291 | ) | (785 | ) | ||||||
| (904,231 | ) | (28,162 | ) | 11,080 | ||||||||
| Total tax (credit)/charge | (673,081 | ) | 7,464 | 13,869 | ||||||||
18 months ended October 31, 2018 | 12 months ended April 30, 20171 | 12 months ended April 30, 20161 | ||||||||||
| $’000 | $’000 | $’000 | ||||||||||
| Profit before taxation | 34,112 | 131,547 | 149,848 | |||||||||
| Tax at UK corporation tax rate 19.00% (April 30, 2017: 19.92%; April 30, 2016: 20.00%) | 6,481 | 26,005 | 29,970 | |||||||||
| Effects of: | ||||||||||||
| Tax rates other than the UK standard rate | 17,778 | 571 | 5,556 | |||||||||
| Intra-group financing | (20,654 | ) | (15,636 | ) | (14,445 | ) | ||||||
| Innovation tax credit benefits | (21,374 | ) | (9,834 | ) | (9,393 | ) | ||||||
| US foreign inclusion income | 39,053 | 394 | - | |||||||||
| US transition tax | 238,270 | - | - | |||||||||
| Share options | 10,236 | - | - | |||||||||
| Movement in deferred tax not recognized | 7,306 | 200 | (759 | ) | ||||||||
| Effect of change in tax rates | (931,865 | ) | (1,291 | ) | (237 | ) | ||||||
| Expenses not deductible and other permanent differences | (4,800 | ) | 9,802 | 7,737 | ||||||||
| (659,569 | ) | 10,211 | 18,429 | |||||||||
| Adjustments to tax in respect of previous periods: | ||||||||||||
| Current tax | (14,725 | ) | 1,698 | (20,570 | ) | |||||||
| Deferred tax | 1,213 | (4,445 | ) | 16,010 | ||||||||
| (13,512 | ) | (2,747 | ) | (4,560 | ) | |||||||
| Total taxation | (673,081 | ) | 7,464 | 13,869 | ||||||||
18 months ended October 31, 2018 | 12 months ended April 30, 2017 | 12 months ended April 30, 2016 | ||||||||||
| Equity - ordinary | $’000 | $’000 | $’000 | |||||||||
| Final paid 58.33 cents (April 30, 2017: 49.74 cents; April 30, 2016 49.74 cents) per ordinary share | 133,889 | 111,023 | 70,015 | |||||||||
| First Interim paid 34.60 cents (April 30, 2017: 29.73 cents; April 30, 2016: 16.94 cents) per ordinary share | 156,243 | 66,512 | 35,144 | |||||||||
| Second Interim paid 58.33 cents (April 30, 2017: nil cents; April 30, 2016: nil cents) per ordinary share | 252,029 | - | - | |||||||||
| 542,161 | 177,535 | 105,159 | ||||||||||
18 months ended October 31, 2018 | 12 months ended April 30, 20171 | 12 months ended April 30, 20161 | ||||||||||
| Earnings ($’000) | ||||||||||||
| Profit for the period from continuing operations | 707,108 | 124,186 | 135,901 | |||||||||
| Profit for the period from discontinued operations | 76,940 | 33,720 | 26,993 | |||||||||
| 784,048 | 157,906 | 162,894 | ||||||||||
| Number of shares (‘000) | ||||||||||||
| Weighted average number of shares | 388,717 | 229,238 | 218,635 | |||||||||
| Dilutive effects of shares | 10,963 | 8,165 | 8,847 | |||||||||
| 399,680 | 237,403 | 227,482 | ||||||||||
| Earnings per share | ||||||||||||
| Basic earnings per share (cents) | ||||||||||||
| Continuing operations | 181.91 | 54.17 | 62.40 | |||||||||
| Discontinued operation | 19.79 | 14.71 | 12.10 | |||||||||
| 201.70 | 68.88 | 74.50 | ||||||||||
| Diluted earnings per share (cents) | ||||||||||||
| Continuing operations | 176.92 | 52.31 | 59.97 | |||||||||
| Discontinued operation | 19.25 | 14.20 | 11.64 | |||||||||
| 196.17 | 66.51 | 71.61 | ||||||||||
| Basic earnings per share (pence) | ||||||||||||
| Continuing operations | 136.73 | 41.88 | 41.54 | |||||||||
| Discontinued operation | 14.88 | 11.37 | 8.05 | |||||||||
| 151.61 | 53.25 | 49.59 | ||||||||||
| Diluted earnings per share (pence) | ||||||||||||
| Continuing operations | 132.98 | 40.44 | 39.92 | |||||||||
| Discontinued operations | 14.47 | 10.98 | 7.74 | |||||||||
| 147.45 | 51.42 | 47.66 | ||||||||||
| Earnings attributable to ordinary shareholders | ||||||||||||
| From continuing operations | 707,193 | 124,083 | 135,979 | |||||||||
| Excluding non-controlling interests | (85 | ) | 103 | (78 | ) | |||||||
| Profit for the period from continuing operations | 707,108 | 124,186 | 135,901 | |||||||||
| From discontinued operation | 76,940 | 33,720 | 26,993 | |||||||||
| 784,048 | 157,906 | 162,894 | ||||||||||
| Average exchange rate | $ | 1.33 / £ 1 | $ | 1.29 / £1 | $ | 1.50 / £1 | ||||||
| October 31, 2018 | April 30, 2017 | |||||||||||
| Note | $’000 | $’000 | ||||||||||
| Cost and net book amount | ||||||||||||
| At 1 May | 2,828,604 | 2,436,168 | ||||||||||
| Acquisitions | 39 | 4,863,962 | 392,436 | |||||||||
| Reclassification to assets held for sale | 19 | (887,523 | ) | - | ||||||||
| 6,805,043 | 2,828,604 | |||||||||||
| A segment-level summary of the goodwill allocation is presented below: | ||||||||||||
| Micro Focus | 6,805,043 | 1,969,038 | ||||||||||
| SUSE | - | 859,566 | ||||||||||
| 6,805,043 | 2,828,604 | |||||||||||
| 2018 | 2017 | |||||||
| Long-term growth rate | 1.0 | % | 1.0 | % | ||||
| Pre-tax discount rate (based upon the Groups weighted average cost of capital “WACC”) | 9.7 | % | 11.4 | % | ||||
| Purchased intangibles | ||||||||||||||||||||||||||||
Purchased software | Product Development costs | Technology | Trade names | Customer relationships | Lease Contracts | Total | ||||||||||||||||||||||
| $’000 | $’000 | $’000 | $’000 | $’000 | $’000 | $’000 | ||||||||||||||||||||||
| Cost | ||||||||||||||||||||||||||||
| At May 1, 2017 | 24,635 | 213,822 | 398,917 | 239,621 | 972,378 | - | 1,849,373 | |||||||||||||||||||||
| Continuing operations: | ||||||||||||||||||||||||||||
Acquisitions - HPE Software business (note 39) | 72,825 | - | 1,809,000 | 163,000 | 4,480,000 | 15,000 | 6,539,825 | |||||||||||||||||||||
Acquisitions – COBOL-IT (note 39) | - | - | 1,537 | 154 | 12,317 | - | 14,008 | |||||||||||||||||||||
Acquisitions – Covertix (note39) | 2,490 | - | - | - | - | - | 2,490 | |||||||||||||||||||||
| Additions | 46,812 | 44,350 | - | - | - | - | 91,162 | |||||||||||||||||||||
| Additions – external consultants | - | 953 | - | - | - | - | 953 | |||||||||||||||||||||
| Exchange adjustments | (439 | ) | - | - | - | - | - | (439 | ) | |||||||||||||||||||
Discontinued operation: | ||||||||||||||||||||||||||||
Reclassification to current assets classified as held for sale (note 19) | (5,121 | ) | - | (50,987 | ) | (135,116 | ) | (87,521 | ) | - | (278,745 | ) | ||||||||||||||||
| At October 31, 2018 | 141,202 | 259,125 | 2,158,467 | 267,659 | 5,377,174 | 15,000 | 8,218,627 | |||||||||||||||||||||
| Accumulated amortization | ||||||||||||||||||||||||||||
| At May 1, 2017 | 20,970 | 164,695 | 222,986 | 38,849 | 312,503 | - | 760,003 | |||||||||||||||||||||
| Continuing operations: | ||||||||||||||||||||||||||||
| Amortization charge for the period | 30,682 | 42,007 | 280,478 | 26,724 | 519,935 | 3,182 | 903,008 | |||||||||||||||||||||
| Exchange adjustments | (848 | ) | 20 | - | - | - | - | (828 | ) | |||||||||||||||||||
| Discontinued operation: | ||||||||||||||||||||||||||||
| Amortization charge for the period | 765 | - | 13,425 | 9,118 | 16,894 | - | 40,202 | |||||||||||||||||||||
Reclassification to current assets classified as held for sale (note 19) | (1,422 | ) | - | (38,037 | ) | (25,810 | ) | (47,814 | ) | - | (113,083 | ) | ||||||||||||||||
| At October 31, 2018 | 50,147 | 206,722 | 478,852 | 48,881 | 801,518 | 3,182 | 1,589,302 | |||||||||||||||||||||
Net book amount at October 31, 2018 | 91,055 | 52,403 | 1,679,615 | 218,778 | 4,575,656 | 11,818 | 6,629,325 | |||||||||||||||||||||
Net book amount at April 30, 2017 | 3,665 | 49,127 | 175,931 | 200,772 | 659,875 | - | 1,089,370 | |||||||||||||||||||||
| Purchased intangibles | ||||||||||||||||||||||||||||
Purchased software | Product Development costs | Technology | Trade names | Customer relationships | Lease contracts | Total | ||||||||||||||||||||||
| $’000 | $’000 | $’000 | $’000 | $’000 | $ | $’000 | ||||||||||||||||||||||
| Cost | ||||||||||||||||||||||||||||
| At May 1, 2016 | 22,028 | 185,546 | 303,672 | 217,510 | 761,634 | - | 1,490,390 | |||||||||||||||||||||
Acquisitions (note 39) | - | - | 95,245 | 22,111 | 210,744 | - | 328,100 | |||||||||||||||||||||
| Additions | 3,162 | 27,664 | - | - | - | - | 30,826 | |||||||||||||||||||||
| Additions – external consultants | - | 612 | - | - | - | - | 612 | |||||||||||||||||||||
| Exchange adjustments | (555 | ) | - | - | - | - | - | (555 | ) | |||||||||||||||||||
| At April 30, 2017 | 24,635 | 213,822 | 398,917 | 239,621 | 972,378 | - | 1,849,373 | |||||||||||||||||||||
| Accumulated amortization | ||||||||||||||||||||||||||||
| At May 1, 2016 | 20,061 | 142,297 | 153,888 | 22,854 | 184,735 | - | 523,835 | |||||||||||||||||||||
| Charge for the period | 1,175 | 22,398 | 69,098 | 15,995 | 127,768 | - | 236,434 | |||||||||||||||||||||
| Exchange adjustments | (266 | ) | - | - | - | - | - | (266 | ) | |||||||||||||||||||
| At April 30, 2017 | 20,970 | 164,695 | 222,986 | 38,849 | 312,503 | - | 760,003 | |||||||||||||||||||||
Net book amount at April 30, 2017 | 3,665 | 49,127 | 175,931 | 200,772 | 659,875 | - | 1,089,370 | |||||||||||||||||||||
Net book amount at April 30, 2016 | 1,967 | 43,249 | 149,784 | 194,656 | 576,899 | - | 966,555 | |||||||||||||||||||||
18 months ended October 31, 2018 $’000 | 12 months ended April 30, 20171 $’000 | |||||||
| Cost of sales: | ||||||||
| - amortization of product development costs | 42,007 | 22,398 | ||||||
| - amortization of acquired purchased technology | 280,478 | 59,029 | ||||||
| Selling and distribution: | ||||||||
| - amortization of acquired purchased trade names and customer relationships | 549,841 | 124,254 | ||||||
| Administrative expenses: | ||||||||
| - amortization of purchased software | 30,682 | 1,070 | ||||||
| Total amortization charge for the period | 903,008 | 206,751 | ||||||
| Research and development: | ||||||||
| - capitalization of product development costs | 44,350 | 27,664 | ||||||
Freehold land and buildings | Leasehold improvements | Computer equipment | Fixtures and fittings | Total | ||||||||||||||||
| $’000 | $’000 | $’000 | $’000 | $’000 | ||||||||||||||||
| Cost | ||||||||||||||||||||
| At May 1, 2017 | 14,363 | 27,269 | 32,615 | 6,037 | 80,284 | |||||||||||||||
| Continuing operations: | ||||||||||||||||||||
Acquisition –HPE Software business (note 39) | - | 56,568 | 79,473 | 24,077 | 160,118 | |||||||||||||||
Acquisition – COBOL-IT (note 39) | - | - | 52 | - | 52 | |||||||||||||||
| Additions | - | 10,444 | 33,286 | 6,408 | 50,138 | |||||||||||||||
| Disposals | - | (7,417 | ) | (27,105 | ) | (4,645 | ) | (39,167 | ) | |||||||||||
| Exchange adjustments | (15 | ) | (3,609 | ) | (8,205 | ) | (2,467 | ) | (14,296 | ) | ||||||||||
| Discontinued operation: | ||||||||||||||||||||
| Additions | - | 20 | 2,018 | 29 | 2,067 | |||||||||||||||
| Disposals | - | - | (85 | ) | (15 | ) | (100 | ) | ||||||||||||
| Exchange adjustments | - | 123 | 264 | 6 | 393 | |||||||||||||||
Reclassification to current assets classified as held for sale (note 19) | - | (4,198 | ) | (9,050 | ) | (344 | ) | (13,592 | ) | |||||||||||
| At October 31, 2018 | 14,348 | 79,200 | 103,263 | 29,086 | 225,897 | |||||||||||||||
| Accumulated depreciation | ||||||||||||||||||||
| At May 1, 2017 | 1,851 | 12,751 | 22,063 | 2,663 | 39,328 | |||||||||||||||
| Continuing operations: | ||||||||||||||||||||
| Charge for the period | 479 | 26,271 | 50,725 | 11,136 | 88,611 | |||||||||||||||
| Disposals | - | (4,005 | ) | (26,858 | ) | (3,745 | ) | (34,608 | ) | |||||||||||
| Exchange adjustments | (51 | ) | (1,354 | ) | (6,406 | ) | (2,696 | ) | (10,507 | ) | ||||||||||
| Discontinued operation: | ||||||||||||||||||||
| Charge for the period | - | 2,695 | 2,612 | 1,261 | 6,568 | |||||||||||||||
| Disposals | - | - | (66 | ) | (11 | ) | (77 | ) | ||||||||||||
| Exchange adjustments | - | 29 | 107 | 2 | 138 | |||||||||||||||
Reclassification to current assets classified as held for sale (note 19) | - | (2,078 | ) | (5,595 | ) | (133 | ) | (7,806 | ) | |||||||||||
| At October 31, 2018 | 2,279 | 34,309 | 36,582 | 8,477 | 81,647 | |||||||||||||||
| Net book amount at October 31, 2018 | 12,069 | 44,891 | 66,681 | 20,609 | 144,250 | |||||||||||||||
| Net book amount at May 1, 2017 | 12,512 | 14,518 | 10,552 | 3,374 | 40,956 | |||||||||||||||
Freehold land and buildings | Leasehold improvements | Computer equipment | Fixtures and fittings | Total | ||||||||||||||||
| $’000 | $’000 | $’000 | $’000 | $’000 | ||||||||||||||||
| Cost | ||||||||||||||||||||
| At May 1, 2016 | 15,183 | 23,418 | 25,455 | 5,604 | 69,660 | |||||||||||||||
| Reclassified from assets held for sale | 888 | - | - | - | 888 | |||||||||||||||
Acquisition – Serena (note 39) | - | 1,068 | 648 | 211 | 1,927 | |||||||||||||||
Acquisition – GWAVA (note 39) | - | - | 111 | 84 | 195 | |||||||||||||||
| Additions | 75 | 3,536 | 7,739 | 377 | 11,727 | |||||||||||||||
| Disposals | - | (450 | ) | (589 | ) | (218 | ) | (1,257 | ) | |||||||||||
| Exchange adjustments | (1,783 | ) | (303 | ) | (749 | ) | (21 | ) | (2,856 | ) | ||||||||||
| At April 30, 2017 | 14,363 | 27,269 | 32,615 | 6,037 | 80,284 | |||||||||||||||
| Accumulated depreciation | ||||||||||||||||||||
| At May 1, 2016 | 1,571 | 8,814 | 16,741 | 1,667 | 28,793 | |||||||||||||||
| Charge for the period | 454 | 4,170 | 6,132 | 1,038 | 11,794 | |||||||||||||||
| Disposals | - | (79 | ) | (560 | ) | (98 | ) | (737 | ) | |||||||||||
| Exchange adjustments | (174 | ) | (154 | ) | (250 | ) | 56 | (522 | ) | |||||||||||
| At April 30, 2017 | 1,851 | 12,751 | 22,063 | 2,663 | 39,328 | |||||||||||||||
| Net book amount at April 30, 2017 | 12,512 | 14,518 | 10,552 | 3,374 | 40,956 | |||||||||||||||
| Net book amount at May 1, 2016 | 13,612 | 14,604 | 8,714 | 3,937 | 40,867 | |||||||||||||||
Company name | Country of incorporation | Principal activities | Key to Registered Office address | |||||
| Holding companies: | ||||||||
| 1 | Micro Focus Midco Limited | UK | Holding company | 1 | ||||
| 2 | Micro Focus Group Limited | UK | Holding company | 1 | ||||
| 3 | Micro Focus CHC Limited | UK | Holding company | 1 | ||||
| 4 | Micro Focus MHC Limited | UK | Holding company | 1 | ||||
| 5 | Micro Focus Holdings Unlimited (formerly Micro Focus Holdings Limited) | UK | Holding company | 1 | ||||
| 6 | Micro Focus (IP) Limited | UK | Holding company | 1 | ||||
| 7 | Micro Focus (US) Holdings | UK | Holding company | 1 | ||||
| 8 | Micro Focus IP Limited | Cayman Islands | Holding company | 35 | ||||
| 9 | Novell Holdings Deutschland GmbH | Germany | Holding company | 50 | ||||
| 10 | Micro Focus Finance Ireland Limited | Ireland | Holding company | 67 | ||||
| 11 | Micro Focus Group Holdings Unlimited | Ireland | Holding company | 66 | ||||
| 12 | Micro Focus International Holdings Limited | Ireland | Holding company | 66 | ||||
| 13 | NetIQ Ireland Limited | Ireland | Holding company | 66 | ||||
| 14 | Novell Cayman Software Unlimited Company | Ireland | Holding company | 66 | ||||
| 15 | Novell Cayman Software International Unlimited Company | Ireland | Holding company | 66 | ||||
| 16 | Novell Ireland Real Estate Unlimited Company | Ireland | Holding company | 66 | ||||
| 17 | SUSE Linux Holdings Limited | Ireland | Holding company | 66 | ||||
| 18 | Novell Software International Limited | Ireland | Holding company | 66 | ||||
| 19 | Micro Focus Finance S.a.r.l | Luxembourg | Holding company | 80 | ||||
| 20 | Minerva Finance S.à.r.l. | Luxembourg | Holding company | 80 | ||||
| 21 | Borland Corporation | USA | Holding company | 4 | ||||
| 22 | Micro Focus (US) Group, Inc | USA | Holding company | 4 | ||||
| 23 | MA FinanceCo., LLC | USA | Holding company | 4 | ||||
| 24 | The Attachmate Group, Inc. | USA | Holding company | 4 | ||||
| 25 | Novell Holdings, Inc. | USA | Holding company | 4 | ||||
| 26 | Novell International Holdings, Inc. | USA | Holding company | 4 | ||||
| 27 | Micro Focus (US) International Holdings Inc. | USA | Holding company | 4 | ||||
| 28 | Spartacus Acquisition Holdings Corp. | USA | Holding company | 6 | ||||
| 29 | Spartacus Acquisition Corp. | USA | Holding company | 6 | ||||
| 30 | Serena Software, Inc. | USA | Holding company | 6 | ||||
| 31 | Serena Holdings Limited | UK | Holding company | 1 | ||||
| 32 | Merant Holdings Limited | UK | Holding company | 1 | ||||
| 33 | GWAVA ULC (formerly GWAVA Inc.) | Canada | Holding company | 28 | ||||
| 34 | Seattle Holdings, Inc. | USA | Holding company | 6 | ||||
| Trading companies: | ||||||||
| 35 | Attachmate Group Australia Pty Limited | Australia | Sale and support of software | 11 | ||||
| 36 | Borland Australia Pty Limited | Australia | Sale and support of software | 11 | ||||
| 37 | Micro Focus Pty Limited | Australia | Sale and support of software | 11 | ||||
| 38 | Attachmate Group Austria GmbH | Austria | Sale and support of software | 14 | ||||
| 39 | Borland Entwicklung GmbH | Austria | Development of software | 15 | ||||
| 40 | Attachmate Group Belgium BVBA | Belgium | Sale and support of software | 16 | ||||
| 41 | Micro Focus SPRL (formerly Micro Focus NV) | Belgium | Sale and support of software | 16 | ||||
| 42 | Borland Latin America Ltda | Brazil | Sale and support of software | 19 | ||||
| 43 | Micro Focus Programmeação de Computadores Ltda | Brazil | Sale and support of software | 19 | ||||
| 44 | Novell do Brasil Software Ltda | Brazil | Sale and support of software | 19 | ||||
| 45 | Micro Focus APM Solutions Limited (EOOD) | Bulgaria | Development of software | 25 | ||||
| 46 | Micro Focus (Canada) ULC (formerly Micro Focus (Canada) Limited) | Canada | Development, sale and support of software | 27 | ||||
| 47 | Micro Focus Software (Canada), ULC | Canada | Sale and support of software | 29 | ||||
| 48 | Novell Software (Beijing) Limited | China | Development, sale and support of software | 37 |
| Company name | Country of incorporation | Principal activities | Key to Registered Office address | |||||
Trading companies continued: | ||||||||
| 49 | SUSE Linux s.r.o. | Czech Republic | Development, sale and support of software | 42 | ||||
| 50 | Attachmate Group Denmark ApS (formerly Attachmate Group Demark A/s) | Denmark | Sale and support of software | 44 | ||||
| 51 | Micro Focus Middle East FZ-LLC | United Arab Emirates | Sale and support of software | 124 | ||||
| 52 | Attachmate Group France SARL | France | Sale and support of software | 48 | ||||
| 53 | Borland (France) Sarl | France | Sale and support of software | 48 | ||||
| 54 | Micro Focus SAS | France | Sale and support of software | 48 | ||||
| 55 | Attachmate Group Germany GmbH | Germany | Sale and support of software | 51 | ||||
| 56 | Micro Focus GmbH | Germany | Sale and support of software | 51 | ||||
| 57 | SUSE Linux GmbH | Germany | Development, sale and support of software | 52 | ||||
| 58 | Attachmate Group Hong Kong Limited | Hong Kong | Sale and support of software | 56 | ||||
| 59 | Micro Focus India Private Limited | India | Support of software | 60 | ||||
| 60 | Micro Focus Software India Private Limited | India | Development, sale and support of software | 60 | ||||
| 61 | Relativity Technologies Private Limited | India | Sale and support of software | 60 | ||||
| 62 | Attachmate Ireland Limited | Ireland | Sale and support of software | 65 | ||||
| 63 | Micro Focus Ireland Limited | Ireland | Development, sale and support of software | 66 | ||||
| 64 | Micro Focus Software (Ireland) Limited | Ireland | Development, sale and support of software | 67 | ||||
| 65 | NetIQ Europe Limited | Ireland | Sale and support of software | 65 | ||||
| 66 | Micro Focus Israel Limited | Israel | Development and support of software | 69 | ||||
| 67 | Attachmate Group Italy Srl | Italy | Sale and support of software | 73 | ||||
| 68 | Micro Focus Srl | Italy | Sale and support of software | 73 | ||||
| 69 | Borland Co, Limited | Japan | Sale and support of software | 78 | ||||
| 70 | Micro Focus KK | Japan | Sale and support of software | 78 | ||||
| 71 | Novell Japan Limited | Japan | Sale and support of software | 78 | ||||
| 72 | NetIQ KK | Japan | Sale and support of software | 78 | ||||
| 73 | Novell Corporation (Malaysia) Sdn. Bhd. | Malaysia | Sale and support of software | 83 | ||||
| 74 | Attachmate Group Netherlands B.V. | Netherlands | Sale and support of software | 86 | ||||
| 75 | Authasas B.V. | Netherlands | Sale and support of software | 86 | ||||
| 76 | Borland B.V. | Netherlands | Sale and support of software | 86 | ||||
| 77 | Micro Focus B.V. (formerly Micro Focus NV) | Netherlands | Sale and support of software | 86 | ||||
| 78 | Micro Focus Software (New Zealand) Unlimited (formerly Novell New Zealand Limited) | New Zealand | Sale and support of software | 90 | ||||
| 79 | Micro Focus AS | Norway | Sale and support of software | 91 | ||||
| 80 | Novell Portugal Informatica Lda | Portugal | Sale and support of software | 94 | ||||
| 81 | Attachmate Group Singapore Pte. Limited | Singapore | Sale and support of software | 100 | ||||
| 82 | Borland (Singapore) Pte. Limited | Singapore | Sale and support of software | 100 | ||||
| 83 | Micro Focus Pte Limited | Singapore | Sale and support of software | 100 | ||||
| 84 | Attachmate Group South Africa (Pty) Limited | South Africa | Sale and support of software | 103 | ||||
| 85 | Micro Focus South Africa (Pty) Limited | South Africa | Sale and support of software | 104 | ||||
| 86 | Micro Focus Korea Limited | South Korea | Sale and support of software | 106 | ||||
| 87 | Novell Korea Co., Limited | South Korea | Sale and support of software | 107 | ||||
| 88 | Attachmate Group Spain S.L. | Spain | Sale and support of software | 108 | ||||
| 89 | Micro Focus S.L.U. | Spain | Sale and support of software | 109 | ||||
| 90 | Attachmate Group Sweden AB | Sweden | Sale and support of software | 112 | ||||
| 91 | Attachmate Group Schweiz AG | Switzerland | Sale and support of software | 114 | ||||
| 92 | Micro Focus GmbH (formerly Micro Focus AG) | Switzerland | Sale and support of software | 115 | ||||
| 93 | Novell (Taiwan) Co., Limited | Taiwan | Sale and support of software | 119 | ||||
| 94 | Attachmate Teknoloji Satış ve Pazarlama Ltd. Şti. | Turkey | Sale and support of software | 121 | ||||
| 95 | Attachmate Sales UK Limited | UK | Sale and support of software | 1 |
Company name | Country of incorporation | Principal activities | Key to Registered Office address | |||||
Trading companies continued: | ||||||||
| 96 | Micro Focus IP Development Limited | UK | Development and support of software | 1 | ||||
| 97 | Micro Focus Limited | UK | Sale and support of software | 1 | ||||
| 98 | Novell U.K. Limited | UK | Sale and support of software | 1 | ||||
| 99 | Novell UK Software Limited | UK | Sale and support of software | 1 | ||||
| 100 | Micro Focus Software, Inc. | USA | Development and support of software | 4 | ||||
| 101 | Attachmate Corporation | USA | Development and support of software | 5 | ||||
| 102 | Micro Focus (US), Inc. | USA | Development and support of software | 4 | ||||
| 103 | NetIQ Corporation | USA | Development and support of software | 4 | ||||
| 104 | SUSE LLC | USA | Development and support of software | 7 | ||||
| 105 | Borland Software Corporation | USA | Development and support of software | 4 | ||||
| 106 | Serena Software Pty Limited | Australia | Sale and support of software | 11 | ||||
| 107 | Serena Software Benelux BVBA | Belgium | Sale and support of software | 16 | ||||
| 108 | Serena Software Do Brasil Ltda | Brazil | Sale and support of software | 21 | ||||
| 109 | Serena Software SAS | France | Sale and support of software | 48 | ||||
| 110 | Serena Software GmbH | Germany | Sale and support of software | 54 | ||||
| 111 | Serena Software Japan KK | Japan | Sale and support of software | 78 | ||||
| 112 | Serena Software Pte. Limited | Singapore | Sale and support of software | 100 | ||||
| 113 | Serena Software SA | Spain | Sale and support of software | 110 | ||||
| 114 | Serena Software Europe Limited | UK | Sale and support of software | 1 | ||||
| 115 | Serena Software Ukraine LLC | Ukraine | Sale and support of software | 123 | ||||
| 116 | GWAVA Technologies Inc. | USA | Sale and support of software | 6 | ||||
| 117 | GWAVA EMEA GmbH | Germany | Sale and support of software | 53 | ||||
| Dormant companies: | ||||||||
| 118 | Cambridge Technology Partners do Brasil s.c. Ltda | Brazil | Dormant | 20 | ||||
| 119 | NetManage Canada ULC (formerly NetManage Canada Inc.) | Canada | Dormant | 27 | ||||
| 120 | Borland Canada Software ULC (formerly Borland Canada, Inc. | Canada | Dormant | 28 | ||||
| 121 | Micro Focus International Limited | Cayman Islands | Dormant | 35 | ||||
| 122 | NetIQ Software International Limited | Cyprus | Dormant | 41 | ||||
| 123 | NOVL Czech s.r.o. | Czech Republic | Dormant | 42 | ||||
| 124 | Attachmate Middle East LLC | Egypt | Dormant | 46 | ||||
| 125 | Borland GmbH | Germany | Dormant | 51 | ||||
| 126 | Attachmate (Hong Kong) Limited | Hong Kong | Dormant | 56 | ||||
| 127 | Borland (H.K.) Limited | Hong Kong | Dormant | 57 | ||||
| 128 | NetIQ Asia Ltd. | Hong Kong | Dormant | 57 | ||||
| 129 | Attachmate India Private Limited | India | Dormant | 59 | ||||
| 130 | Borland Software India Private Limited | India | Dormant | 60 | ||||
| 131 | Cambridge Technology Partners India Private Limited | India | Dormant | 60 | ||||
| 132 | Novell India Pvt. Limited | India | Dormant | 61 | ||||
| 133 | SUSE Linux Ireland Limited | Ireland | Dormant | 66 | ||||
| 134 | N.Y. NetManage (Yerushalayim) Limited | Israel | Dormant | 70 | ||||
| 135 | Novell Israel Software Limited | Israel | Dormant | 71 | ||||
| 136 | Authasas Advanced Authentication B.V. | Netherlands | Dormant | 86 | ||||
| 137 | Borland (Holding) UK Limited | UK* | Dormant | 1 | ||||
| 138 | Borland (UK) Limited | UK* | Dormant | 1 | ||||
| 139 | Micro Focus APM Solutions Limited | UK* | Dormant | 1 | ||||
| 140 | Micro Focus UK Limited | UK* | Dormant | 1 | ||||
| 141 | NetIQ Limited | UK* | Dormant | 1 | ||||
| 142 | Ryan McFarland Limited | UK* | Dormant | 1 |
Company name | Country of incorporation | Principal activities | Key to Registered Office address | |||||
Dormant companies continued: |
| 143 | XDB (UK) Limited | UK* | Dormant | 1 | ||||
| 144 | Borland Technology Corporation | USA | Dormant | 4 | ||||
| 145 | CJDNLD, LLC | USA | Dormant | 4 | ||||
| 146 | Micro Focus (IP) Holdings Limited | UK | Dormant | 1 | ||||
| 147 | Micro Focus (IP) Ireland Limited | Ireland | Dormant | 66 | ||||
| Acquisitions in the period ended October 31, 2018: | ||||||||
| HPE Software business: | ||||||||
| 148 | Autonomy Australia Pty Limited | Australia | Sale and support of software | 12 | ||||
| 149 | Autonomy Systems Australia Pty Limited | Australia | Sale and support of software | 12 | ||||
| 150 | Entco Australia Pty Limited | Australia | Sale and support of software | 12 | ||||
| 151 | Entcorp Australia Pty Limited | Australia | Sale and support of software | 12 | ||||
| 152 | Autonomy Belgium BVBA | Belgium | Sale and support of software | 17 | ||||
| 153 | Entco Belgium BVBA | Belgium | Sale and support of software | 17 | ||||
| 154 | Entco Holdings L.P. | Bermuda | Holding company | 18 | ||||
| 155 | Entco Brasil Servicos de Tecnologia Ltda | Brazil | Sale and support of software | 22 | ||||
| 156 | Peregrine Systems do Brazil Limitada | Brazil | Sale and support of software | 23 | ||||
| 157 | Verity Worldwide Limited | British Virgin Islands | Sale and support of software | 24 | ||||
| 158 | Entco Bulgaria EOOD | Bulgaria | Sale and support of software | 26 | ||||
| 159 | Autonomy Systems (Canada) Limited | Canada | Sale and support of software | 32 | ||||
| 160 | Entco Software Canada Co. Logiciels Entco Canada Cie | Canada | Sale and support of software | 33 | ||||
| 161 | Entcorp Canada, Inc. | Canada | Sale and support of software | 34 | ||||
| 162 | Entco Bellatrix HoldCo | Cayman Islands | Sale and support of software | 36 | ||||
| 163 | Entco Capital Co | Cayman Islands | Sale and support of software | 36 | ||||
| 164 | Entco Investment Co | Cayman Islands | Sale and support of software | 36 | ||||
| 165 | Entco Marigalante Limited | Cayman Islands | Sale and support of software | 36 | ||||
| 166 | Autonomy Systems (Beijing) Limited Company | China | Sale and support of software | 38 | ||||
| 167 | Shanghai Entco Software Technology Co., Limited | China | Sale and support of software | 39 | ||||
| 168 | Entco CentroAmerica CAC Limitada | Costa Rica | Sale and support of software | 40 | ||||
| 169 | Entco Costa Rica Limitada | Costa Rica | Sale and support of software | 40 | ||||
| 170 | Entcorp Czechia, s.r.o. | Czech Republic | Sale and support of software | 43 | ||||
| 171 | Entco Denmark ApS | Denmark | Sale and support of software | 45 | ||||
| 172 | Entco France SAS | France | Sale and support of software | 49 | ||||
| 173 | Entco Deutschland GmbH | Germany | Sale and support of software | 55 | ||||
| 174 | EntCorp Hong Kong Limited | Hong Kong | Sale and support of software | 58 | ||||
| 175 | Autonomy Software Asia Private Limited | India | Sale and support of software | 64 | ||||
| 176 | Entco IT Services Private Limited | India | Sale and support of software | 62 | ||||
| 177 | Entco Software India Private Limited | India | Sale and support of software | 63 | ||||
| 178 | Entsoft Galway Limited | Ireland | Sale and support of software | 68 | ||||
| 179 | Entsoft Holding Ireland Unlimited Company | Ireland | Holding company | 68 | ||||
| 180 | Entsoft Ireland Limited | Ireland | Sale and support of software | 68 | ||||
| 181 | Entco Interactive (Israel) Limited | Israel | Sale and support of software | 72 | ||||
| 182 | Entcorp Software Israel Limited | Israel | Sale and support of software | 72 | ||||
| 183 | Autonomy Italy Srl | Italy | Sale and support of software | 74 | ||||
| 184 | Entco Italiana Srl | Italy | Sale and support of software | 75 | ||||
| 185 | Enterprise Corp Italiana Srl | Italy | Sale and support of software | 76 | ||||
| 186 | Verity Italia Srl | Italy | Sale and support of software | 77 | ||||
| 187 | Entcorp Japan K.K. | Japan | Sale and support of software | 79 | ||||
| 188 | Micro Focus Enterprise Limited | Japan | Sale and support of software | 78 | ||||
| 189 | Entco Luxembourg Sarl | Luxembourg | Sale and support of software | 81 | ||||
| 190 | Verity Luxembourg S.à r.l. | Luxembourg | Sale and support of software | 82 | ||||
| 191 | Entco Software Malaysia Sdn. Bhd. | Malaysia | Sale and support of software | 84 | ||||
| 192 | Entco Mexico, S. de R.L. de C.V. | Mexico | Sale and support of software | 85 | ||||
| 193 | Entco Software México, S. de R.L. de C.V. | Mexico | Sale and support of software | 85 |
Company name | Country of incorporation | Principal activities | Key to Registered Office address | |||||
Acquisitions in the period ended October 31, 2018 continued: | ||||||||
HPE Software business continued: | ||||||||
| 194 | Entcorp Software México, S. de R.L. de C.V. | Mexico | Sale and support of software | 85 | ||||
| 195 | Autonomy HoldCo B.V. | Netherlands | Sale and support of software | 87 | ||||
| 196 | Autonomy Netherlands BV | Netherlands | Sale and support of software | 88 | ||||
| 197 | Entco Caribe B.V. | Netherlands | Sale and support of software | 87 | ||||
| 198 | Entco Draco B.V. | Netherlands | Sale and support of software | 87 | ||||
| 199 | Entco Eastern Holding B.V. | Netherlands | Holding company | 87 | ||||
| 200 | Entco Eastern Holding II B.V. | Netherlands | Holding company | 87 | ||||
| 201 | Entco Enterprise B.V. | Netherlands | Sale and support of software | 87 | ||||
| 202 | Entco Gatriam Holding B.V. | Netherlands | Holding company | 87 | ||||
| 203 | Entco HoldCo B.V. | Netherlands | Holding company | 87 | ||||
| 204 | Entco HoldCo I B.V. | Netherlands | Holding company | 87 | ||||
| 205 | Entco HoldCo II B.V. | Netherlands | Holding company | 87 | ||||
| 206 | Entco HoldCo III B.V. | Netherlands | Holding company | 87 | ||||
| 207 | Entco HoldCo IV B.V. | Netherlands | Holding company | 87 | ||||
| 208 | Entco Holding Berlin B.V. | Netherlands | Holding company | 87 | ||||
| 209 | Entco Holding Finance B.V. | Netherlands | Holding company | 87 | ||||
| 210 | Entco Holding Hague B.V. | Netherlands | Holding company | 87 | ||||
| 211 | Entco Holding Hague II B.V. | Netherlands | Holding company | 87 | ||||
| 212 | Entco International Trade B.V. | Netherlands | Sale and support of software | 87 | ||||
| 213 | Entco Nederland B.V. | Netherlands | Sale and support of software | 87 | ||||
| 214 | Entco Puerto Rico B.V. | Netherlands | Sale and support of software | 87 | ||||
| 215 | Entco Sinope Holding B.V. | Netherlands | Holding company | 87 | ||||
| 216 | Entcorp Nederlands B.V. | Netherlands | Sale and support of software | 88 | ||||
| 217 | Verity Benelux B.V. | Netherlands | Sale and support of software | 88 | ||||
| 218 | Entcorp Philippines, Inc. | Philippines | Sale and support of software | 92 | ||||
| 219 | Entco Polska sp. z o.o. | Poland | Sale and support of software | 93 | ||||
| 220 | Entco Caribe B.V. LLC | Puerto Rico | Sale and support of software | 95 | ||||
| 221 | Entco Puerto Rico B.V. LLC | Puerto Rico | Sale and support of software | 96 | ||||
| 222 | Entco Software Romania SRL | Romania | Sale and support of software | 97 | ||||
| 223 | Limited Liability Company Entco | Russian Federation | Sale and support of software | 98 | ||||
| 224 | Autonomy Systems Singapore Pte Ltd | Singapore | Sale and support of software | 101 | ||||
| 225 | Micro Focus Software Pte. Ltd (formerly - Entco Singapore (Sales) Pte. Ltd.) | Singapore | Sale and support of software | 101 | ||||
| 226 | Entco Software Pte. Ltd. | Singapore | Sale and support of software | 101 | ||||
| 227 | Autonomy Systems Software South Africa Pty Ltd | South Africa | Sale and support of software | 105 | ||||
| 228 | Entco Field Delivery Spain, S.L.U. | Spain | Sale and support of software | 111 | ||||
| 229 | EntCo Software Spain S.L.U. | Spain | Sale and support of software | 111 | ||||
| 230 | Entco Sverige AB | Sweden | Sale and support of software | 113 | ||||
| 231 | Entco International Sàrl | Switzerland | Sale and support of software | 116 | ||||
| 232 | Entco Schweiz GmbH | Switzerland | Sale and support of software | 117 | ||||
| 233 | Trilead GmbH | Switzerland | Sale and support of software | 118 | ||||
| 234 | Entco Turkey Teknoloji Çözümleri Limited Şirketi | Turkey | Sale and support of software | 122 | ||||
| 235 | Entco Software Services Middle East FZ-LLC | United Arab Emirates | Sale and support of software | 125 | ||||
| 236 | Autonomy Systems Limited | United Kingdom | Sale and support of software | 2 | ||||
| 237 | Entco Foreign HoldCo Limited | United Kingdom | Holding company | 2 | ||||
| 238 | Entco Situla Holding Limited | United Kingdom | Holding company | 2 | ||||
| 239 | Entcorp Marigalante UK Limited | United Kingdom | Sale and support of software | 2 | ||||
| 240 | Entcorp UK Limited | United Kingdom | Sale and support of software | 2 | ||||
| 241 | Longsand Limited | United Kingdom | Sale and support of software | 2 | ||||
| 242 | ArcSight, LLC | USA | Sale and support of software | 10 | ||||
| 243 | Entco Andromeda LLC | USA | Sale and support of software | 10 | ||||
| 244 | Entco Brazil Holdings LLC | USA | Holding company | 8 | ||||
| 245 | Entco Delaware LLC | USA | Sale and support of software | 10 |
Company name | Country of incorporation | Principal activities | Key to Registered Office address | |||||
Acquisitions in the period ended October 31, 2018 continued: | ||||||||
HPE Software business continued: | ||||||||
| 246 | Entco Government Software LLC | USA | Sale and support of software | 10 | ||||
| 247 | Entco Holdings, Inc. | USA | Holding company | 10 | ||||
| 248 | Entco MS, Inc. | USA | Sale and support of software | 10 | ||||
| 249 | Entco Technologies, Inc. | USA | Sale and support of software | 10 | ||||
| 250 | Entco, LLC | USA | Sale and support of software | 10 | ||||
| 251 | EntIT Software LLC | USA | Sale and support of software | 10 | ||||
| 252 | MicroLink LLC | USA | Sale and support of software | 10 | ||||
| 253 | Seattle Escrow Borrower LLC | USA | Holding company | 10 | ||||
| 254 | Seattle SpinCo, Inc. | USA | Holding company | 10 | ||||
| 255 | Stratify, Inc. | USA | Sale and support of software | 10 | ||||
| 256 | Vertica Systems, LLC | USA | Sale and support of software | 10 | ||||
| 257 | Voltage Security International, Inc. | USA | Sale and support of software | 10 | ||||
| COBOL IT: | ||||||||
| 258 | Cobol-IT, SAS | France | Sale and support of software | 47 | ||||
| New companies incorporated in the period ended October 31, 2018: | ||||||||
| 259 | SUSE Software Solutions Australia Pty Limited | Australia | Sale and support of software | 13 | ||||
| 260 | Serena Software Canada Limited | Canada | Sale and support of software | 30 | ||||
| 261 | SUSE Software Solutions Canada ULC | Canada | Sale and support of software | 31 | ||||
| 262 | SUSE International Holdings GmbH | Germany | Holding company | 52 | ||||
| 263 | Attachmate Australasia Pty Limited | Australia | Sale and support of software | 11 | ||||
| 264 | SUSE Software Solutions Hong Kong Limited | Hong Kong | Sale and support of software | 59 | ||||
| 265 | SUSE Software Solutions Netherlands BV | Netherlands | Sale and support of software | 89 | ||||
| 266 | Micro Focus Software (IP) Holdings Limited | UK | Holding company | 1 | ||||
| 267 | SUSE Software Solutions International Services Limited | Ireland | Sale and support of software | 66 | ||||
| 268 | SUSE Software Solutions Ireland Limited | Ireland | Sale and support of software | 66 | ||||
| 269 | Micro Focus LLC | Saudi Arabia | Sale and support of software | 99 | ||||
| 270 | SUSE Software Solutions South Africa (Pty) Limited | South Africa | Sale and support of software | 102 | ||||
| 271 | Micro Focus Enterprise (Tunisia) LLC | Tunisia | Sale and support of software | 120 | ||||
| 272 | SUSE Software Solutions UK Limited | UK | Sale and support of software | 3 | ||||
| 273 | Micro Focus Integration Holdings Limited | UK | Holding company | 1 | ||||
| 274 | Micro Focus Integration Limited | UK | Sale and support of software | 1 | ||||
| 275 | Micro Focus Midco Holdings Limited | UK | Holding company | 1 | ||||
| 276 | Marcel Holdings LLC | USA | Sale and support of software | 9 |
| (1) | The Lawn, 22-30 Old Bath Road, Newbury, Berkshire, United Kingdom, RG14 1QN |
| (2) | Cain Road, Amen Corner, Bracknell, Berkshire RG12 1HN, United Kingdom |
| (3) | Cornwall Court, 19 Cornwall Street, Birmingham, B3 2DT United Kingdom |
| (4) | The Corporation Trust Company, Corporation Trust Center 1209 Orange St, Wilmington, New Castle, DE19801, U.S.A. |
| (5) | 505 Union Ave SE STE120, Olympia, WA 98501, U.S.A. |
| (6) | The Company Corporation, 2711 Centerville Rd, STE 400, Wilmington, New Castle, DE19808, U.S.A. |
| (7) | CT Corporation, 155 Federal St. Suite 700, Boston, MA02110, U.S.A. |
| (8) | 1209 Orange St, Wilmington, New Castle, DE, 19801, U.S.A. |
| (9) | Corporation Service Company, 251 Little Falls Drive, Wilmington, New Castle, DE19808, U.S.A. |
| (10) | 1140 Enterprise Way, Building G, Sunnyvale, CA, 94089 U.S.A. |
| (11) | Level 8, 76 Berry Street, North Sydney, NSW 2060 Australia |
| (12) | 410 Concord Road, Rhodes, NSW 2138, Australia |
| (13) | Level 17, 100 Barangaroo Avenue, Barangaroo NSW 2000, Australia |
| (14) | Parkring 2, 1010, Vienna, Austria |
| (15) | Donau Centre, Hauptstrasse 4-10, Linz, 4040, Austria |
| (16) | EU Parliament, 4th Floor, 37 De Meeussquare, Brussels, 1000, Belgium |
| (17) | Pegasuslaan 5 1831 Diegem Belgium |
| (18) | 4th Floor, Washington House, 16 Church Street, Hamilton, HM 11, Bermuda |
| (19) | Rua Joaquim Floriano, 466-12 Ander, Sao Paulo, CEP 04534-002 Brazil |
| (20) | Rua Arizonia, 1349 10th Floor, Sao Paulo, 04567-003, Brazil |
| (21) | Rua Dom Jose de Barros, 177, 3rd Floor, Suite 302, Villa Buarque, Sao Paulo 01038‑100 Brazil |
| (22) | Av Marcos Penteado De Ulhoa Rodrigues, No 939, Andar 8 Conj 818 Torre 1, 06.460-040, Tambore, Barueri, Brazil |
| (23) | Avenida das nações Unidas, nº 12.901, conjunto 2302, sala 72, Itaim Bibi, São Paulo, CEP 04578, Brazil |
| (24) | Appleby Corporate Services (BVI) Limited, Jayla Place, PO Box 3190, Road Town, Tortola, VG1110, British Virgin Islands |
| (25) | 76A James Bourchier Blvd, Lozenetz, Sofia, 1407, Bulgaria |
| (26) | 1715 Sofia, Mladost district, Business Park Sofia, Building 9, Sophia, Bulgaria |
| (27) | 199 Bay Street, Suite 4000, Toronto, Ontario, M5L 1A9, Canada |
| (28) | Suite 2600, Three Bentall Centre, 595 Burrard Street, PO Box 49314, Vancouver BC V7X 1L3, Canada |
| (29) | 4300 Bankers Hall West, 888 - 3rd Street S.W., Calgary, Alberta T2P 5C5, Canada |
| (30) | Suite 800, 1959 Upper Water street, PO BOX 997 Halifax, B3J 2X2 NS Canada |
| (31) | 250 Howe Street, Suite 1400-C, Vancouver, BC V6C 3S7, Canada |
| (32) | 200-204 Lambert Street, Whitehorse, YT, Y1A 3T2 Canada |
| (33) | 161 Bay Street, Suite 2700 Toronto, ON M5J 2S1 Canada |
| (34) | Barker House 570 Queen Street, Suite 600, Fredericton, NB, E3B 6Z6 Canada |
| (35) | PO Box 309, Ugland House, South Church Street, George Town, South Cayman, KY1-1104, Cayman Islands |
| (36) | 18 Forum Lane, Camana Bay, P.O. Box 258, Grand Cayman, 1104, Cayman Islands |
| (37) | 3603-3606 Off Tow A, No.7, Dongsanhuan, Beijing, 100020, People’s Republic of China |
| (38) | Room 507, 508 Tower A, Raycom Info Tech Park No. 2, Science Institute, South Road, Beijing, 100080, China |
| (39) | Floor 2, Building 1, No. 799 Naxian Road, Shanghai, China |
| (40) | Calle 7 Avenida 7 y 9, Edificio 751, Barrio Amon, San Jose, Costa Rica |
| (41) | 54 Digeni Akrita, Akrita 2nd Floor, Office 201-202, PC 1061, Nicosia, Cyprus |
| (42) | Krizikova 148/34, Karlin, 186 00 Praha 8, Czech Republic |
| (43) | Za Brumlovkou 1559/5, Michle, Prague, 140 00, Czech Republic |
| (44) | Lyngsø Alle 3b, Hørsholm, 2970, Denmark |
| (45) | Lautruphoj 1-3 2750 Ballerup Denmark |
| (46) | 19 Helmy Elmasry Street, Almaza, Cairo, Egypt |
| (47) | 231 rue Saint Honore, Paris, 75001, France |
| (48) | Tour Atlantique, La Défense 9, 1 Place de la Pyramide, La Défense, Cedex, Paris 92911, France |
| (49) | 1 avenue du Canada, Les Ulis, 91947, France |
| (50) | Amtsgericht Nürnberg Germany |
| (51) | Fraunhoferstrasse 7, Ismaning, 85737, Germany |
| (52) | Maxfeldstrasse 5 90409 Nürnberg Germany |
| (53) | Von-Braun-Strasse 38a 48683 Ahaus Germany |
| (54) | Nöerdlicher Zubringer 9-11, 40470, Düsseldorf, Germany |
| (55) | Herrenberger Str. 140, 71034 Boeblingen, Germany |
| (56) | 21st floor, Henley Building, 5 Queen’s Road Central, Hong Kong |
| (57) | Level 54, Hopewell Centre, 183 Queens Road East, Hong Kong |
| (58) | 35/F Central Plaza, 18 Harbour Road, Wanchai, Hong Kong |
| (59) | U&I Corporation Centre, 47 Echelon, Sector 32, Gurgaon Harayana, India |
| (60) | Laurel, Block D, 65/2, Bagmane Tech Park, C.V. Raman Nagar, Byrasandra Post Bangalore – 560093, India |
| (61) | Leela Galleria, 1st Floor, Andheri Kurla Road, Andheri (East), Mumbai – 400059, India |
| (62) | 24 Salarpuria Arena, Hosur Main Road, Adugodi, Bangalore, 560-030, India |
| (63) | 66/1, 6th Floor,Olympia Building, Bagmane Tech Park, Byrasandra, CV Raman Nagar, Bangalore, Karnataka, 560093, India |
| (64) | 2Floor, Hibiscus,Vrindavan Tech Village,Marathahalli Outer Ring Rd, Bangalore, India, 560037, India |
| (65) | Building 2, 2nd Floor, Parkmore East Business Park, Galway, Ireland |
| (66) | 70 Sir John Rogerson’s Quay, Dublin 2, Ireland |
| (67) | Corrig Court, Corrig Road, Sandyford Industrial Estate, Sandyford, Dublin 18, Ireland |
| (68) | Liffey Park Technology Campus, Barnhall Road, Leixlip, Co. Kildare, Ireland |
| (69) | Matam Advanced Tech Center, Building 5/1, Haifa, 31 905, Israel |
| (70) | Scientific Industries Center, Haifa, 33262, Israel |
| (71) | 17 Hatidhar St, Raannana, 43665, Israel |
| (72) | 5 Altalef St., Yahud, Israel |
| (73) | Viale Sarca 235, 20126 Milano Italy |
| (74) | Via Vittor Pisani. 16, Milan, 20124, Italy |
| (75) | Via C. Donat Cattin 5, 20063 Cernusco sul Naviglio (MI) Italy |
| (76) | Corso Matteotti 1/A, Milan, 20121, Italy |
| (77) | Via S. Maria alla Porta n.9, Milan, 20123, Italy |
| (78) | Midtown Tower 19F, 9-7-1 Akasaka, Minato-ku, Tokyo 107-6219, Japan |
| (79) | No. 8 Center Plaza Bldg, 5F, 1-10-16 Horidomecho Nihonbashi, Chuo-ku, Tokyo 103-0012, Japan |
| (80) | 20, rue des Peupliers, 2328, Luxembourg |
| (81) | 75, Parc d'Activités Capellen, Capellen, 8308, Luxembourg |
| (82) | 5, Rue Guillaume Kroll, L - 1882, Luxembourg |
| (83) | Unit 501 Level 5 Uptown 1, 1 Jalan SS2, Selangor Darul Ehsan, Malaysia |
| (84) | Level 21 - Suite 21.01, The Gardens South Tower, Mid Valley City, Lingkaran Syed Putra, 59200 Kuala Lumpur, Malaysia |
| (85) | Periferico Sur 6751, Col. Toluquilla, Municipio Tlaquepaque, C.P. 45610, Jalisco, Mexico |
| (86) | Raoul Wallenbergplein 23, 2404 ND Alphen a/d Rijn, Netherlands |
| (87) | Startbaan 16, 1187 XR, Amstelveen, Netherlands |
| (88) | Coltbaan 31, Nieuwegein, 3439 NG, Netherlands |
| (89) | Herengracht 282, 1016BX Amsterdam, Netherlands |
| (90) | Simpson Grierson, Level 27, 88 Shortland Street Auckland 1141 New Zealand |
| (91) | 7th Floor, Dronning Eufemias gate 16, 0191 Oslo, Norway |
| (92) | 7th Floor Robinson Summit Center, 6783 Ayala Avenue, Makati City, Metro Manila, Philippines |
| (93) | Centrum Biurowe Globis, Powstańców Śląskich 7A, 53-332 Wrocław, Poland |
| (94) | Centro Empresarial Torres de Lisboa, Torre G 1* Andar Sala 111, Rue Tomas da Fonseca, Lisbon, Portugal |
| (95) | 110 Highway North Km 28, Bldg 1, Aguadilla, 00605, Puerto Rico |
| (96) | 350 Chardon Avenue, Chardon Tower, Suite 801, San Juan, 00918, Puerto Rico |
| (97) | Bucharest, 3 George Constantinescu Street, BOC Office Building, 4th floor, entrance B, 2nd District, PC 020339, Romania |
| (98) | Leningradskoye shosse 16A, building 3, Moscow, 125171, Russian Federation |
| (99) | Maazar Street, Futuro Tower, 3rd Floor, P.O. Box 69171, Riyadh 11547, Saudi Arabia |
| (100) | 80 Robinson Road #02-00, 068898, Singapore |
| (101) | #12-04/06, 1 Harbourfront Place, Harbourfront Tower 1, Singapore, Singapore |
| (102) | 22 Smith Street, Braamfontein, Johannesburg, Gauteng, 2000, South Africa |
| (103) | Morning View Office Park 255 Rivonia Road, Morningside, South Africa |
| (104) | 4th Floor Aloe Grove, Houghton Estate Office Park, 2 Osborn Road, Houghton, 2198, South Africa |
| (105) | PO Box 2238, Florida Hills, 1716, South Africa |
| (106) | Yeoidodong, SK Building, 15F, 31 Gukjegeumyung-ro 8-gil, Yeongdeungpo-gu, Seoul, South Korea |
| (107) | Gangnam Finance Centre, Level 41, 152 Teheren-ro, Gangnam-gu, Seoul - 06236 South Korea |
| (108) | C/Jose Echegaray 8, Las Rozas, Madrid 28230, Spain |
| (109) | Paseo de la Castellana 42, Madrid, 28046, Spain |
| (110) | Ronda General Mitre 28-30, Barcelona 08017, Spain |
| (111) | Calle José Echegaray 8, Las Rozas de Madrid, 28232 Madrid, 28232, Spain |
| (112) | Kronborgsgränd 1, 164 46 Kista, Stockholm, Sweden |
| (113) | Gustav III:s Boulevard 36, SE-169 85, Stockholm, Sweden, SE, Sweden |
| (114) | Merkurstrasse 14, 8953 Dietikon, Switzerland |
| (115) | Lindenstrasse 26, Zurich, 8008, Switzerland |
| (116) | Jean-Baptiste Vandelle 3A, 1290 Versoix Switzerland |
| (117) | 1, Ueberlandstrasse, 8600 Duebendorf, Switzerland |
| (118) | Rembach 7, Altendorf, 8852, Switzerland |
| (119) | Room B 26/F #26 Tun-Hwa S Road Sec, Taipei ROC 106, Taiwan |
| (120) | ZI Chotrana, Technopôle El Ghazala, Lot N° 45, 2088, Ariana, Tunisia |
| (121) | Palladium Ofis Binasi, Halk Cad, No.8/A Kat 2, Atasehir 34748, Istanbul, Turkey |
| (122) | Barbaros Mah.Kardelen SK. No. 2/42-43 Atasehir, Istanbul, Turkey |
| (123) | 13 Pimonenko str, building 1, Office 1B/22, Kiev 04050, Ukraine |
| (124) | Dubai Internet City, DIC Building 2, 3rd Floor, Suite 315, Dubai, United Arab Emirates |
| (125) | Shatha Tower, 12th floor, Dubai Internet City, Dubai, United Arab Emirates |
18 months ended October 31, 2018 | 12 months ended April 30, 2017 | |||||||
| $’000 | $’000 | |||||||
| At 1 May | 11,457 | 12,711 | ||||||
| Gain on dilution of investment | - | 966 | ||||||
| Share of post-tax loss of associates | (1,809 | ) | (2,220 | ) | ||||
| (1,809 | ) | (1,254 | ) | |||||
Reclassification to current assets classified as held for sale (note 19) | (9,648 | ) | - | |||||
| - | 11,457 | |||||||
| Company name | Country of incorporation and principal place of business | Proportion held | Principal activities | |||
| Open Invention Network LLC | USA | 12.5 | % | Sale and support of software | ||
September 30, 2018 | March 31, 2017 | |||||||
| $’000 | $’000 | |||||||
| Non-current assets | 38,206 | 43,649 | ||||||
| Current assets | 41,672 | 50,137 | ||||||
| Current liabilities | (672 | ) | (604 | ) | ||||
| Non-current liabilities | (1,028 | ) | (527 | ) | ||||
| Net assets | 78,178 | 92,655 | ||||||
| Equity | (78,178 | ) | (92,655 | ) | ||||
18 months ended September 30, 2018 | 12 months ended March 31, 2017 | |||||||
| $’000 | $’000 | |||||||
| Revenue | - | - | ||||||
| Net loss | 14,477 | 16,212 | ||||||
18 months to October 31, 2018 | 12 months to April 30, 2017 | |||||||
| $’000 | $’000 | |||||||
| Loss attributable to the Group for the period ended 30 September 2018 (March 31, 2017 (14.3% ownership to June 6, 2016, 12.5% thereafter)) | 1,810 | 2,095 | ||||||
| Adjustment on estimated October 31, 2018 result attributable to the Group (April 30, 2017) | (1 | ) | 125 | |||||
| Loss attributable to the Group for the period ended October 31, 2018 (April 30, 2017 (14.3% ownership to June 6, 2016, 12.5% thereafter)) | 1,809 | 2,220 | ||||||
| October 31, 2018 | April 30, 2017 | |||||||
| $’000 | $’000 | |||||||
| Employee Benefit Deposit | 31,132 | - | ||||||
| Long-term rent deposits | 4,140 | 2,844 | ||||||
| Long Term Prepaid Expenses | 2,893 | - | ||||||
| Other | 625 | 249 | ||||||
| 38,790 | 3,093 | |||||||
| October 31, 2018 | April 30, 2017 | |||||||
| $’000 | $’000 | |||||||
| Work in progress | - | 13 | ||||||
| Finished goods | 204 | 51 | ||||||
| 204 | 64 | |||||||
| October 31, 2018 | April 30, 2017 | |||||||
| $’000 | $’000 | |||||||
| Trade receivables | 1,089,589 | 266,225 | ||||||
| Less: provision for impairment of trade receivables | (41,860 | ) | (2,599 | ) | ||||
| Trade receivables net | 1,047,729 | 263,626 | ||||||
| Prepayments | 59,966 | 23,239 | ||||||
| Other receivables | 79,062 | 1,534 | ||||||
| Accrued income | 85,276 | 1,110 | ||||||
| 1,272,033 | 289,509 | |||||||
October 31, 2018 | April 30, 2017 | |||||||
| $’000 | $’000 | |||||||
| Up to three months | - | 48 | ||||||
| Three to four months | 3,621 | 731 | ||||||
| Over four months | 38,239 | 1,820 | ||||||
| 41,860 | 2,599 | |||||||
| October 31, 2018 | April 30, 2017 | |||||||
| $’000 | $’000 | |||||||
| At 1 May | 2,599 | 4,486 | ||||||
| Provision for receivables impairment | 40,016 | 2,023 | ||||||
| Receivables written off as uncollectable | (686 | ) | (1,271 | ) | ||||
| Receivables previously provided for but now collected | (53 | ) | (2,542 | ) | ||||
| Exchange adjustments | (16 | ) | (97 | ) | ||||
| At October 31 / April 30 | 41,860 | 2,599 | ||||||
| October 31, 2018 | April 30, 2017 | |||||||
| $’000 | $’000 | |||||||
| Cash at bank and in hand | 387,115 | 146,832 | ||||||
| Short-term bank deposits | 236,687 | 4,151 | ||||||
| 623,802 | 150,983 | |||||||
Reclassification to current assets classified as held for sale (note 19) | (2,906 | ) | - | |||||
| Cash and cash equivalents | 620,896 | 150,983 | ||||||
October 31, 2018 | April 30, 2017 | ||||||||
| $’000 | $’000 | ||||||||
| S&P/Moody’s/Fitch rating: | |||||||||
| AAA | 231,517 | 33,057 | |||||||
| AA- | 80,975 | 69,814 | |||||||
| A+ | 260,404 | 25,221 | |||||||
| A | 20,063 | 6,355 | |||||||
| A- | 3,767 | 5,820 | |||||||
| BBB+ | 4,546 | 471 | |||||||
| BBB | 994 | 903 | |||||||
| BBB- | 558 | 165 | |||||||
| BB+ | 2,042 | 357 | |||||||
| BB | 32 | 283 | |||||||
| BB- | 15,187 | 8,221 | |||||||
| B+ | - | 24 | |||||||
| CCC+ | 212 | 193 | |||||||
| C- | 321 | - | |||||||
| Not Rated | 278 | 99 | |||||||
| 620,896 | 150,983 | ||||||||
18 months ended October 31, 2018 | 12 months ended April 30, 2017 | 12 months ended April 30, 2016 | ||||||||||
| $’000 | $’000 | $’000 | ||||||||||
| Revenue | 538,160 | 303,429 | 253,816 | |||||||||
| Operating costs | (427,014 | ) | (238,632 | ) | (208,268 | ) | ||||||
| Profit before taxation | 111,146 | 64,797 | 45,548 | |||||||||
| Taxation | (34,206 | ) | (31,077 | ) | (18,615 | ) | ||||||
| Profit for the period from discontinued operation | 76,940 | 33,720 | 26,933 | |||||||||
18 months ended October 31, 2018 $’000 | 12 months ended April 30, 2017 $’000 | 12 months ended April 30, 2016 $’000 | ||||||||||
| Net cash inflows from operating activities | 136,058 | 70,411 | 66,107 | |||||||||
| Net cash outflows from investing activities | (2,512 | ) | (7,430 | ) | (1,298 | ) | ||||||
| Net cash flows from financing activities | - | - | - | |||||||||
| October 31, 2018 | ||||||||||||
Reported in: | Current assets | Current liabilities | Total | |||||||||
| $’000 | $’000 | $’000 | ||||||||||
| SUSE | 1,114,264 | (427,236 | ) | 687,028 | ||||||||
| Atalla | 28,187 | (10,463 | ) | 17,724 | ||||||||
| 1,142,451 | (437,699 | ) | 704,752 | |||||||||
| Note | October 31, 2018 | |||||||
| $’000 | ||||||||
| Non-current assets | ||||||||
| Goodwill | 10 | 859,566 | ||||||
| Other Intangible assets | 11 | 165,662 | ||||||
| Property, plant and equipment | 12 | 5,786 | ||||||
| Investment in associates | 14 | 9,648 | ||||||
| Deferred tax assets | 1,586 | |||||||
| Long-term pension assets | 27 | 1,543 | ||||||
| Other non-current assets | 2,020 | |||||||
| 1,045,811 | ||||||||
| Current assets | ||||||||
| Trade and other receivables | 65,547 | |||||||
| Cash and cash equivalents | 2,906 | |||||||
| 68,453 | ||||||||
| Current Assets | 1,114,264 | |||||||
| Current liabilities | ||||||||
| Trade and other payables | (37,833 | ) | ||||||
| Provisions | 26 | (664 | ) | |||||
| Current tax liabilities | (1,156 | ) | ||||||
| Deferred income | (218,349 | ) | ||||||
| (258,002 | ) | |||||||
| Non-current liabilities | ||||||||
| Deferred income | (160,791 | ) | ||||||
| Retirement benefit obligations | 27 | (5,530 | ) | |||||
| Long-term provisions | 26 | (2,376 | ) | |||||
| Other non-current liabilities | (537 | ) | ||||||
| (169,234 | ) | |||||||
| Current Liabilities | (427,236 | ) | ||||||
| Net assets classified as held for sale | 687,028 | |||||||
October 31, 2018 | ||||
| $’000 | ||||
| Goodwill | 27,957 | |||
| Property, plant and equipment | 230 | |||
| Non-current assets | 28,187 | |||
| Deferred income | (10,463 | ) | ||
| Current Liabilities | (10,463 | ) | ||
| Net assets classified as held for sale | 17,724 | |||
| October 31, 2018 | April 30, 2017 | |||||||
| $’000 | $’000 | |||||||
| Trade payables | 46,096 | 16,891 | ||||||
| Tax and social security | 46,525 | 3,032 | ||||||
| Accruals | 584,296 | 150,119 | ||||||
| 676,917 | 170,042 | |||||||
| October 31, 2018 | April 30, 2017 | |||||||
| $’000 | $’000 | |||||||
| Bank loan secured | 4,996,913 | 1,595,188 | ||||||
| Unamortized prepaid facility arrangement fees and original issue discounts | (151,033 | ) | (33,652 | ) | ||||
| 4,845,880 | 1,561,536 | |||||||
| October 31, 2018 | April 30, 2017 | |||||||||||||||||||||||
Bank loan secured | Unamortized prepaid facility arrangement fees and original issue discounts | Total | Bank loan secured | Unamortized prepaid facility arrangement fees and original issue discounts | Total | |||||||||||||||||||
| Reported within: | $’000 | $’000 | $’000 | $’000 | $’000 | $’000 | ||||||||||||||||||
| Current liabilities | 50,347 | (46,645 | ) | 3,702 | 83,788 | (12,604 | ) | 71,184 | ||||||||||||||||
| Non-current liabilities | 4,946,566 | (104,388 | ) | 4,842,178 | 1,511,400 | (21,048 | ) | 1,490,352 | ||||||||||||||||
| 4,996,913 | (151,033 | ) | 4,845,880 | 1,595,188 | (33,652 | ) | 1,561,536 | |||||||||||||||||
| · | The $1,503.8m senior secured term loan B-2 issued by MA FinanceCo LLC is priced at LIBOR plus 2.25% (subject to a LIBOR floor of 0.00%); |
| · | The $2,580.5m senior secured seven-year term loan B issued by Seattle SpinCo. Inc. is priced at LIBOR plus 2.50% (subject to a LIBOR floor of 0.00%) with an original issue discount of 0.25%; |
| · | The $382.1m senior secured seven-year term loan B-3 issued by MA FinanceCo LLC is priced at LIBOR plus 2.50% (subject to a LIBOR floor of 0.00%) with an original issue discount of 0.25%; and |
| · | The €466.5m (equivalent to $530.5m) senior secured seven-year term loan B issued by MA FinanceCo LLC is priced at EURIBOR plus 2.75% (subject to a EURIBOR floor of 0.00%) with an original issue discount of 0.25%. |
| · | A senior secured revolving credit facility of $500.0m, (“Revolving Facility”), with an interest rate of 3.25% above LIBOR on amounts drawn (and 0.375% on amounts undrawn) thereunder (subject to a LIBOR floor of 0.00%). |
Term Loan B-2 | Term Loan B | Term Loan C | Term Loan B-3 | Seattle Spinco Term Loan B | Euro Term Loan B | Revolving Facility | Total | |||||||||||||||||||||||||
| $’000 | $’000 | $’000 | $’000 | $’000 | $’000 | $’000 | $’000 | |||||||||||||||||||||||||
| At May 1, 2016 | - | 1,112,250 | 450,000 | - | - | - | 225,000 | 1,787,250 | ||||||||||||||||||||||||
| Repayments | - | (9,562 | ) | (37,500 | ) | - | - | - | (325,000 | ) | (372,062 | ) | ||||||||||||||||||||
| Draw downs | - | - | - | - | - | - | 180,000 | 180,000 | ||||||||||||||||||||||||
| Transfer | 1,515,188 | (1,102,688 | ) | (412,500 | ) | - | - | - | - | - | ||||||||||||||||||||||
| At April 30, 2017 | 1,515,188 | - | - | - | - | - | 80,000 | 1,595,188 | ||||||||||||||||||||||||
| Acquisitions | - | - | - | - | 2,600,000 | - | - | 2,600,000 | ||||||||||||||||||||||||
| Draw downs | - | - | - | 385,000 | - | 523,815 | 135,000 | 1,043,815 | ||||||||||||||||||||||||
| Repayments | (11,364 | ) | - | - | (2,888 | ) | (19,500 | ) | (4,184 | ) | (215,000 | ) | (252,936 | ) | ||||||||||||||||||
| Foreign exchange | - | - | - | - | - | 10,846 | - | 10,846 | ||||||||||||||||||||||||
| At October 31, 2018 | 1,503,824 | - | - | 382,112 | 2,580,500 | 530,477 | - | 4,996,913 | ||||||||||||||||||||||||
| Term Loan B-2 | Term Loan B-3 | Seattle Spinco Term Loan B | Euro Term Loan B | Revolving Facility | Total | |||||||||||||||||||
| $’000 | $’000 | $’000 | $’000 | $’000 | $’000 | |||||||||||||||||||
| Within one year | 84,294 | 22,383 | 151,161 | 20,080 | - | 277,918 | ||||||||||||||||||
| In one to two years | 83,782 | 22,246 | 150,235 | 19,971 | - | 276,234 | ||||||||||||||||||
| In two to three years | 82,895 | 22,009 | 148,629 | 19,782 | - | 273,315 | ||||||||||||||||||
| In three to four years | 1,462,056 | 21,821 | 147,363 | 19,632 | - | 1,650,872 | ||||||||||||||||||
| In four to five years | - | 21,634 | 146,097 | 19,483 | - | 187,214 | ||||||||||||||||||
| In more than five years | - | 374,164 | 2,526,819 | 512,738 | - | 3,413,721 | ||||||||||||||||||
| At October 31, 2018 | 1,713,027 | 484,257 | 3,270,304 | 611,686 | - | 6,079,274 | ||||||||||||||||||
Term Loan B-2 | Revolving Facility | Total | ||||||||||
| $’000 | $’000 | $’000 | ||||||||||
| Within one year | 60,168 | 80,000 | 140,168 | |||||||||
| In one to two years | 71,181 | - | 71,181 | |||||||||
| In two to three years | 70,769 | - | 70,769 | |||||||||
| In three to four years | 70,053 | - | 70,053 | |||||||||
| In four to five years | 1,497,867 | - | 1,497,867 | |||||||||
| At April 30, 2017 | 1,770,038 | 80,000 | 1,850,038 | |||||||||
| October 31, 2018 | April 30, 2017 | |||||||
| $’000 | $’000 | |||||||
| Current | 13,560 | - | ||||||
| Non-current | 14,923 | - | ||||||
| 28,483 | - | |||||||
| October 31, 2018 | April 30, 2017 | |||||||
| $’000 | $’000 | |||||||
| Within one year | 15,136 | - | ||||||
| Between one and five years | 15,984 | - | ||||||
| 31,120 | - | |||||||
| Future lease charges | (2,637 | ) | - | |||||
| 28,483 | - | |||||||
| October 31, 2018 | April 30, 2017 | |||||||
| $’000 | $’000 | |||||||
| Within one year | 13,560 | - | ||||||
| Between one and five years | 14,923 | - | ||||||
| 28,483 | - | |||||||
| October 31, 2018 | April 30, 2017 | |||||||
| $’000 | $’000 | |||||||
| Corporation tax | 24,504 | 1,637 | ||||||
| October 31, 2018 | April 30, 2017 | |||||||
| $’000 | $’000 | |||||||
| Corporation tax | 124,071 | 42,679 | ||||||
| October 31, 2018 | April 30, 2017 | |||||||
| $’000 | $’000 | |||||||
| Corporation tax | 131,048 | - | ||||||
| October 31, 2018 | April 30, 2017 | |||||||
| $’000 | $’000 | |||||||
| Deferred income | 1,134,730 | 640,650 | ||||||
| October 31, 2018 | April 30, 2017 | |||||||
| $’000 | $’000 | |||||||
| Deferred income | 178,064 | 223,786 | ||||||
| October 31, 2018 | April 30, 2017 | |||||||
| $’000 | $’000 | |||||||
| Onerous leases and dilapidations | 35,105 | 16,243 | ||||||
| Restructuring and integration | 50,689 | 12,132 | ||||||
| Legal | 7,038 | 3,220 | ||||||
| Other | - | 484 | ||||||
| Total | 92,832 | 32,079 | ||||||
| Current | 57,411 | 20,142 | ||||||
| Non-current | 35,421 | 11,937 | ||||||
| Total | 92,832 | 32,079 | ||||||
Onerous Leases and dilapidations | Restructuring and integration | Legal | Other | Total | ||||||||||||||||
| $’000 | $’000 | $’000 | $’000 | $’000 | ||||||||||||||||
| At May 1, 2017 | 16,243 | 12,132 | 3,220 | 484 | 32,079 | |||||||||||||||
| Continuing operations: | ||||||||||||||||||||
Acquisitions – HPE Software business (note 39) | 11,321 | 21,398 | 36,446 | - | 69,165 | |||||||||||||||
| Additional provision in the period | 17,723 | 133,421 | 1,392 | - | 133,558 | |||||||||||||||
| Released | (3,890 | ) | (3,678 | ) | (4,733 | ) | (416 | ) | (12,717 | ) | ||||||||||
| Utilization of provision | (5,590 | ) | (110,062 | ) | (29,263 | ) | (97 | ) | (145,012 | ) | ||||||||||
| Exchange adjustments | (702 | ) | (2,522 | ) | (24 | ) | 29 | (3,219 | ) | |||||||||||
| Discontinued operation: | ||||||||||||||||||||
| Additional provision in the period | 2,835 | 205 | - | - | 3,040 | |||||||||||||||
Reclassification of current assets classified as held for sale (note 19) | (2,835 | ) | (205 | ) | - | - | (3,040 | ) | ||||||||||||
| At October 31, 2018 | 35,105 | 50,689 | 7,038 | - | 92,832 | |||||||||||||||
| Current | 11,219 | 39,154 | 7,038 | - | 57,411 | |||||||||||||||
| Non-current | 23,886 | 11,535 | - | - | 35,421 | |||||||||||||||
| Total | 35,105 | 50,689 | 7,038 | - | 92,832 | |||||||||||||||
Onerous leases and dilapidations | Restructuring and integration | Legal | Other | Total | ||||||||||||||||
| $’000 | $’000 | $’000 | $’000 | $’000 | ||||||||||||||||
| At May 1, 2016 | 18,176 | 3,523 | 1,920 | 1,280 | 24,899 | |||||||||||||||
| Additional provision in the period | 4,584 | 48,498 | 98 | 501 | 53,681 | |||||||||||||||
Acquisitions (note 37) | - | 1,201 | 2,844 | - | 4,045 | |||||||||||||||
| Utilization of provision | (5,527 | ) | (37,712 | ) | (120 | ) | (117 | ) | (43,476 | ) | ||||||||||
| Released | (857 | ) | (2,886 | ) | (1,492 | ) | (1,180 | ) | (6,415 | ) | ||||||||||
| Exchange adjustments | (133 | ) | (492 | ) | (30 | ) | - | (655 | ) | |||||||||||
| At April 30, 2017 | 16,243 | 12,132 | 3,220 | 484 | 32,079 | |||||||||||||||
| Current | 4,406 | 12,132 | 3,220 | 384 | 20,142 | |||||||||||||||
| Non-current | 11,837 | - | - | 100 | 11,937 | |||||||||||||||
| Total | 16,243 | 12,132 | 3,220 | 484 | 32,079 | |||||||||||||||
| a) | Defined contribution |
18 months ended October 31, 2018 | 12 months ended April 30, 20171 | 12 months ended April 30, 20161 | ||||||||||
| Continuing operations | $’000 | $’000 | $’000 | |||||||||
Defined contribution schemes (note 35) | 43,241 | 10,875 | 10,363 | |||||||||
October 31, 2018 | April 30, 2017 | |||||||
| $’000 | $’000 | |||||||
| Within non-current assets: | ||||||||
| Long-term pension assets | 16,678 | 22,031 | ||||||
| Within non-current liabilities: | ||||||||
| Retirement benefit obligations | (110,351 | ) | (30,773 | ) | ||||
| October 31, 2018 | April 30, 2017 | |||||||
| $’000 | $’000 | |||||||
| As at May 1, | 22,031 | 22,272 | ||||||
| Reclassification to assets held for sale | (1,543 | ) | - | |||||
Interest on non-plan assets (note 6) | 633 | 404 | ||||||
| Benefits paid | (185 | ) | (110 | ) | ||||
| Contributions | 489 | 442 | ||||||
| Included within other comprehensive income: | ||||||||
| - Change in fair value | (6,065 | ) | - | |||||
| - Actuarial (loss)/gain on non-plan assets | 278 | (2,134 | ) | |||||
| - Reclassification from defined contribution scheme to defined benefit scheme | - | 2,264 | ||||||
| (5,787 | ) | 130 | ||||||
| Foreign currency exchange (loss)/gain | 1,040 | (1,107 | ) | |||||
| As at October 31 / April 30, | 16,678 | 22,031 | ||||||
| Included within other comprehensive income: | ||||||||
| Continuing operations | (5,258 | ) | 318 | |||||
| Discontinued operation | (529 | ) | (188 | ) | ||||
| (5,787 | ) | 130 | ||||||
18 months ended October 31, 2018 | 12 months1 ended April 30, 2017 | 12 months1 ended April 30, 2016 | ||||||||||
| $’000 | $’000 | $’000 | ||||||||||
| Current service charge | 12,627 | 504 | 613 | |||||||||
| Past service credit | (5,489 | ) | - | - | ||||||||
Charge to operating profit (note 35) | 7,138 | 504 | 613 | |||||||||
| Current service charge – discontinued operations | 268 | 121 | 147 | |||||||||
| Interest on pension scheme liabilities | 5,253 | 660 | 546 | |||||||||
| Interest on pension scheme assets | (2,430 | ) | (95 | ) | (79 | ) | ||||||
Charge to finance costs (note 6) | 2,823 | 565 | 467 | |||||||||
| Total charge to consolidated statement of comprehensive income | 10,229 | 1,190 | 1,227 | |||||||||
18 months ended October 31, 2018 | 12 months ended April 30, 2017 | |||||||
| $’000 | $’000 | |||||||
| Actuarial return on assets excluding amounts included in interest income | 621 | 9 | ||||||
| Re-measurements – actuarial (gains) and losses: | ||||||||
- Demographic | 332 | - | ||||||
| - Financial | (11,104 | ) | 2,821 | |||||
| - Experience | 1,858 | 568 | ||||||
| (8,914 | ) | 3,389 | ||||||
| Reclassification from defined contribution scheme to defined benefit scheme | (2,121 | ) | (2,996 | ) | ||||
| Movement in the period / year | (10,414 | ) | 402 | |||||
| Continuing operations | (8,949 | ) | (217 | ) | ||||
| Discontinued operation | (1,465 | ) | 619 | |||||
| (10,414 | ) | 402 | ||||||
18 months ended October 31, 2018 | 12 months ended April 30, 2017 | |||||||
| Rate of increase in final pensionable salary | 2.61 | % | 2.00 | % | ||||
| Rate of increase in pension payments | 1.99 | % | 2.00 | % | ||||
| Discount rate | 1.92 | % | 1.95 | % | ||||
| Inflation | 1.89 | % | 2.00 | % | ||||
October 31, 2018 | April 30, 2017 | |||||||
| Retiring at age 65 at the end of the reporting period: | ||||||||
| Male | 20 | 19 | ||||||
| Female | 23 | 23 | ||||||
| Retiring 15 years after the end of the reporting period: | ||||||||
| Male | 22 | 19 | ||||||
| Female | 25 | 24 | ||||||
| October 31, 2018 | April 30, 2017 | |||||||||||||||
| Funded | Unfunded | Total | Funded | |||||||||||||
| $’000 | $’000 | $’000 | $’000 | |||||||||||||
| Present value of funded obligations | 213,305 | 7,903 | 221,208 | 36,480 | ||||||||||||
| Fair value of plan assets | (110,857 | ) | - | (110,857 | ) | (5,707 | ) | |||||||||
| 102,448 | 7,903 | 110,351 | 30,773 | |||||||||||||
| October 31, 2018 | April 30, 20171 | |||||||||||||||||||||||
| Defined Benefit Obligations | Defined benefit obligations | Scheme assets | Retirement benefit obligations | Defined benefit obligations | Scheme assets | Retirement benefit obligations | ||||||||||||||||||
| $’000 | $’000 | $’000 | $’000 | $’000 | $’000 | |||||||||||||||||||
| At May 1 | 36,480 | (5,707 | ) | 30,773 | 37,524 | (5,855 | ) | 31,669 | ||||||||||||||||
HPE Software business acquisition (note 39) | 181,455 | (110,010 | ) | 71,445 | - | - | - | |||||||||||||||||
| Reclassification to assets held for sale | (9,125 | ) | 3,595 | (5,530 | ) | - | - | - | ||||||||||||||||
| Current service cost | 12,895 | - | 12,895 | 625 | - | 625 | ||||||||||||||||||
| Past service credit | (5,489 | ) | - | (5,489 | ) | |||||||||||||||||||
| Benefits paid | (9,603 | ) | 9,406 | (197 | ) | (197 | ) | 87 | (110 | ) | ||||||||||||||
| Contributions by plan participants | 2,547 | (2,313 | ) | 234 | - | (114 | ) | (114 | ) | |||||||||||||||
| Contribution by employer | - | (4,012 | ) | (4,012 | ) | - | - | - | ||||||||||||||||
Interest cost/(income) (note 6) | 5,253 | (2,430 | ) | 2,823 | 660 | (95 | ) | 565 | ||||||||||||||||
| Included within other comprehensive income: | ||||||||||||||||||||||||
| Re-measurements - actuarial (gains) and losses: | ||||||||||||||||||||||||
| - Demographic | (332 | ) | - | (332 | ) | - | - | - | ||||||||||||||||
| - Financial | 11,104 | - | 11,104 | (2,821 | ) | - | (2,821 | ) | ||||||||||||||||
| - Experience | (1,858 | ) | - | (1,858 | ) | (568 | ) | - | (568 | ) | ||||||||||||||
| Actuarial return on assets excluding amounts included in interest income | - | (621 | ) | (621 | ) | - | (9 | ) | (9 | ) | ||||||||||||||
| Reclassification from defined contribution scheme to defined benefit scheme | 5,472 | (3,351 | ) | 2,121 | 2,996 | - | 2,996 | |||||||||||||||||
| 14,386 | (3,972 | ) | 10,414 | (393 | ) | (9 | ) | (402 | ) | |||||||||||||||
| Foreign currency exchange changes | (7,591 | ) | 4,586 | (3,005 | ) | (1,739 | ) | 279 | (1,460 | ) | ||||||||||||||
| At October 31 / April 30, | 221,208 | (110,857 | ) | 110,351 | 36,480 | (5,707 | ) | 30,773 | ||||||||||||||||
| October 31, 2018 | April 30, 2017 | |||||||||||||||
| Quoted | Unquoted | Total | Unquoted | |||||||||||||
| $’000 | $’000 | $’000 | $’000 | |||||||||||||
| Equity instruments | 49,890 | 1,624 | 51,514 | - | ||||||||||||
| Debt instruments | 37,419 | 5,069 | 42,488 | - | ||||||||||||
| Real estate | 1,987 | 71 | 2,058 | - | ||||||||||||
| Cash and cash equivalents | - | 2,325 | 2,325 | - | ||||||||||||
| Re-insurance contracts with guaranteed interest rates* | - | 5,486 | 5,486 | 5,707 | ||||||||||||
| Other | - | 6,986 | 6,986 | - | ||||||||||||
| Total | 89,296 | 21,561 | 110,857 | 5,707 | ||||||||||||
| Change in assumption | Change in defined benefit obligation | |||||||
| Discount rate for scheme liabilities | 0.50 | % | (10.5 | %) | ||||
| Price inflation | 0.25 | % | 2.9 | % | ||||
| Salary growth rate | 0.50 | % | 1.9 | % | ||||
| October 31, 2018 | April 30, 2017 | |||||||
| $’000 | $’000 | |||||||
| Accruals | 58,011 | 4,191 | ||||||
| 58,011 | 4,191 | |||||||
Financial October 31, 2018 | Non- financial October 31, 2018 | Total October 31, 2018 | Financial April 30, 2017 | Non- financial April 30, 2017 | Total April 30, 2017 | |||||||||||||||||||
| $’000 | $’000 | $’000 | $’000 | $’000 | $’000 | |||||||||||||||||||
| Financial assets | ||||||||||||||||||||||||
| Non-current | ||||||||||||||||||||||||
Derivative financial instruments – Interest rate swaps (note 29) | - | 86,381 | 86,381 | - | - | - | ||||||||||||||||||
| Current | ||||||||||||||||||||||||
Cash and cash equivalents (note 18) | 620,896 | - | 620,896 | 150,983 | - | 150,983 | ||||||||||||||||||
Trade and other receivables (note 17) | 1,212,067 | 59,966 | 1,272,033 | 263,626 | 25,883 | 289,509 | ||||||||||||||||||
| 1,832,963 | 146,347 | 1,979,310 | 414,609 | 25,883 | 440,492 | |||||||||||||||||||
Financial October 31, 2018 | Non- financial October 31, 2018 | Total October 31, 2018 | Financial April 30, 2017 | Non- financial April 30, 2017 | Total April 30, 2017 | |||||||||||||||||||
| $’000 | $’000 | $’000 | $’000 | $’000 | $’000 | |||||||||||||||||||
| Financial liabilities – financial liabilities at amortized cost | ||||||||||||||||||||||||
| Non-current | ||||||||||||||||||||||||
Borrowings (note 21 | 4,946,566 | - | 4,946,566 | 1,511,400 | - | 1,511,400 | ||||||||||||||||||
Finance leases (note 22) | 14,923 | - | 14,923 | - | - | - | ||||||||||||||||||
Provisions (note 26) | 35,421 | - | 35,421 | 11,837 | 100 | 11,937 | ||||||||||||||||||
| Current | ||||||||||||||||||||||||
Borrowings (note 21) | 50,347 | - | 50,347 | 83,788 | - | 83,788 | ||||||||||||||||||
Finance leases (note 22) | 13,560 | - | 13,560 | - | - | - | ||||||||||||||||||
Trade and other payables (note 20) | 676,917 | - | 676,917 | 16,891 | 153,151 | 170,042 | ||||||||||||||||||
Provisions (note 26) | 57,411 | - | 57,411 | 4,406 | 15,736 | 20,142 | ||||||||||||||||||
| 5,795,145 | - | 5,795,145 | 1,628,322 | 168,987 | 1,797,309 | |||||||||||||||||||
| October 31, 2018 | April 30, 2017 | |||||||
| $’000 | $’000 | |||||||
Trade receivables (note 17) | 1,212,067 | 263,626 | ||||||
Cash and cash equivalents (note 18) | 620,896 | 150,983 | ||||||
| Total | 1,832,963 | 414,609 | ||||||
| October 31, 2018 | April 30, 2017 | |||||||
| $’000 | $’000 | |||||||
| Carrying amount | 86,381 | - | ||||||
| Notional amount (4 x $562.5m) | 2,250,000 | - | ||||||
| Maturity date | 30 September 2022 | - | ||||||
| Change in fair value of outstanding hedging instruments | 86,381 | - | ||||||
| Change in value of hedged item adjusted for credit risk | 84,666 | - | ||||||
| Group exposure | +/- 5% | +/- 10% | +/- 1% interest | |||||||||||||
| Key aggregate currency exposures | $’000 | $’000 | $’000 | $’000 | ||||||||||||
| Euro | 377,324 | 18,866 | 37,732 | |||||||||||||
| GBP | 25,436 | 1,271 | 2,543 | |||||||||||||
| ILS | 52,147 | 2,607 | 5,214 | |||||||||||||
| CAN$ | 60,468 | 3,023 | 6,046 | |||||||||||||
Borrowings Interest rate LIBOR +1% | n/a | n/a | n/a | 49,969 | ||||||||||||
| October 31, 2018 | April 30, 2017 | |||||||
| $’000 | $’000 | |||||||
Bank and other borrowings (note 21) | 4,845,880 | 1,561,536 | ||||||
Finance lease obligations (note 22) | 28,483 | - | ||||||
Less cash and cash equivalents (note 18) | (620,896 | ) | (150,983 | ) | ||||
| Total net debt | 4,253,467 | 1,410,553 | ||||||
| Total equity | 7,791,980 | 1,613,490 | ||||||
| Debt/equity % | 54.59 | % | 87.42 | % | ||||
| October 31, 2018 | April 30, 2017 | |||||||||||
| Note | $’000 | $’000 | ||||||||||
| Net Deferred tax liability | ||||||||||||
| At May 1 | (118,478 | ) | (65,281 | ) | ||||||||
| (Debited)/credited to consolidated statement of comprehensive income: | (17,171 | ) | 26,871 | |||||||||
| - Continuing operations | 7 | (27,634 | ) | 26,871 | ||||||||
| - Discontinued operations | 10,463 | - | ||||||||||
| Credited directly to equity in relation to share options | (23,724 | ) | 22,996 | |||||||||
| Debited to other comprehensive income in relation to pensions: | 4,281 | (325 | ) | |||||||||
| - Continuing operations | 3,754 | (62 | ) | |||||||||
| - Discontinued operations | 527 | (263 | ) | |||||||||
| Acquisition of subsidiaries | 39 | (1,957,343 | ) | (97,615 | ) | |||||||
| Acquisition of subsidiaries – Serena Software | - | (96,203 | ) | |||||||||
| Acquisition of subsidiaries – GWAVA | - | (1,412 | ) | |||||||||
| Acquisition of subsidiaries – HPE Software business | (1,953,453 | ) | - | |||||||||
| Acquisition of subsidiaries – COBOL-IT | (3,890 | ) | - | |||||||||
| Foreign exchange adjustment | 11,667 | (6,415 | ) | |||||||||
| Reclassification to current assets held for sale | 19 | (1,586 | ) | - | ||||||||
| Effect of change in tax rates – charged to consolidated statement of comprehensive income | 931,865 | 1,291 | ||||||||||
| At October 31 / April 30 | (1,170,489 | ) | (118,478 | ) | ||||||||
Tax losses | Share based payments | Deferred revenue | Prepaid royalty | Tax credits | Intangible fixed assets | Other temporary differences | Total | |||||||||||||||||||||||||
| $’000 | $’000 | $’000 | $’000 | $’000 | $’000 | $’000 | $’000 | |||||||||||||||||||||||||
| Deferred tax assets | ||||||||||||||||||||||||||||||||
| At May 1, 2016 | 50,949 | 22,767 | 37,962 | - | 53,660 | 6,496 | 26,923 | 198,757 | ||||||||||||||||||||||||
Acquisition of subsidiaries (note 39) | 10,619 | - | 2,471 | - | 152 | - | 2,105 | 15,347 | ||||||||||||||||||||||||
| (Charged)/credited to consolidated statement of comprehensive income | (4,894 | ) | 4,405 | 4,057 | - | (20,024 | ) | (609 | ) | (4,964 | ) | (22,029 | ) | |||||||||||||||||||
| Credited directly to equity | - | 22,996 | - | - | - | - | 22,996 | |||||||||||||||||||||||||
| Debited to other comprehensive income | - | - | - | - | - | - | (325 | ) | (325 | ) | ||||||||||||||||||||||
| Foreign exchange adjustment | - | (6,415 | ) | - | - | - | - | - | (6,415 | ) | ||||||||||||||||||||||
| Effect of change in tax rates – credited to consolidated statement of comprehensive income | - | (78 | ) | - | - | - | - | - | (78 | ) | ||||||||||||||||||||||
| Subtotal | 56,674 | 43,675 | 44,490 | - | 33,788 | 5,887 | 23,739 | 208,253 | ||||||||||||||||||||||||
| Jurisdictional offsetting | (208,253 | ) | ||||||||||||||||||||||||||||||
| At April 30, 2017 | - | |||||||||||||||||||||||||||||||
| At May 1, 2017 | 56,674 | 43,675 | 44,490 | - | 33,788 | 5,887 | 23,739 | 208,253 | ||||||||||||||||||||||||
Acquisition of subsidiaries - HPE Software business (note 39) | 4,524 | - | (36,468 | ) | 332,036 | 39,030 | - | 43,601 | 382,723 | |||||||||||||||||||||||
| (Charged)/credited to consolidated statement of comprehensive income – continuing operations | (13,510 | ) | 110 | 45,158 | (201,355 | ) | (46,114 | ) | (825 | ) | 14,126 | (202,410 | ) | |||||||||||||||||||
| Credited directly to equity | - | (23,724 | ) | - | - | - | - | - | (23,724 | ) | ||||||||||||||||||||||
| Debited to other comprehensive income | - | - | - | - | - | - | 4,281 | 4,281 | ||||||||||||||||||||||||
| Foreign exchange adjustment | - | (320 | ) | - | - | - | - | - | (320 | ) | ||||||||||||||||||||||
| Reclassification to current assets held for sale | - | - | - | - | - | - | (1,586 | ) | (1,586 | ) | ||||||||||||||||||||||
| Effect of change in tax rates – credited to consolidated statement of comprehensive income | (21,129 | ) | (2,319 | ) | 66,673 | (88,770 | ) | 2,957 | (2,025 | ) | (13,336 | ) | (57,949 | ) | ||||||||||||||||||
| Subtotal | 26,559 | 17,422 | 119,853 | 41,911 | 29,661 | 3,037 | 70,825 | 309,268 | ||||||||||||||||||||||||
| Jurisdictional offsetting | (309,268 | ) | ||||||||||||||||||||||||||||||
| At October 31, 2018 | - |
| Expiration: | ||||||||||||||||||||||||||||||||
| 2019 | 2020 | 2021 | 2022 | 2023 | Thereafter | No expiry | Total | |||||||||||||||||||||||||
| $’000 | $’000 | $’000 | $’000 | $’000 | $’000 | $’000 | $’000 | |||||||||||||||||||||||||
| At October 31, 2018 | ||||||||||||||||||||||||||||||||
| Type of temporary difference: | ||||||||||||||||||||||||||||||||
| Losses | 35,233 | 66,078 | 99,168 | 37,529 | 33,574 | 2,117,700 | 95,578 | 2,484,860 | ||||||||||||||||||||||||
| Credits | 2,174 | 4,420 | 3,959 | 2,360 | 1,267 | 5,210 | 196,350 | 215,740 | ||||||||||||||||||||||||
| Other | 1,859 | 1 | - | - | - | - | 47,718 | 49,578 | ||||||||||||||||||||||||
| Total | 39,266 | 70,499 | 103,127 | 39,889 | 34,841 | 2,122,910 | 339,646 | 2,750,178 | ||||||||||||||||||||||||
| Expiration: | ||||||||||||||||||||||||||||||||
| 2018 | 2019 | 2020 | 2021 | 2022 | Thereafter | No expiry | Total | |||||||||||||||||||||||||
| $’000 | $’000 | $’000 | $’000 | $’000 | $’000 | $’000 | $’000 | |||||||||||||||||||||||||
| At April 30, 2017 | ||||||||||||||||||||||||||||||||
| Type of temporary difference: | ||||||||||||||||||||||||||||||||
| Losses | 1,107 | 635 | 972 | - | - | - | 19,773 | 22,487 | ||||||||||||||||||||||||
| Credits | 2,131 | 2,147 | 1,909 | 2,138 | 1,334 | 5,583 | 8,338 | 23,580 | ||||||||||||||||||||||||
| Other | - | - | - | - | - | - | 23,859 | 23,859 | ||||||||||||||||||||||||
| Total | 3,238 | 2,782 | 2,881 | 2,138 | 1,334 | 5,583 | 51,970 | 69,926 | ||||||||||||||||||||||||
Note | Intangible fixed assets | Other temporary differences | Total | |||||||||||||
| $’000 | $’000 | $’000 | ||||||||||||||
| Deferred tax liabilities | ||||||||||||||||
| At May 1, 2016 | (255,158 | ) | (8,880 | ) | (264,038 | ) | ||||||||||
| Acquisition of subsidiaries | 39 | (110,334 | ) | (2,628 | ) | (112,962 | ) | |||||||||
| Charged/(credited) to consolidated statement of comprehensive income | 52,438 | (3,538 | ) | 48,900 | ||||||||||||
| Effect of change in tax rates – charged to consolidated statement of comprehensive income | 1,369 | - | 1,369 | |||||||||||||
| Subtotal | (311,685 | ) | (15,046 | ) | (326,731 | ) | ||||||||||
| Jurisdictional offsetting | 208,253 | |||||||||||||||
| At April 30, 2017 | (118,478 | ) | ||||||||||||||
| At May 1, 2017 | (311,685 | ) | (15,046 | ) | (326,731 | ) | ||||||||||
| Acquisition of subsidiaries – HPE Software business | 39 | (2,324,060 | ) | (12,116 | ) | (2,336,176 | ) | |||||||||
| Acquisition of subsidiaries – COBOL-IT | 39 | (3,890 | ) | - | (3,890 | ) | ||||||||||
| Charged/(credited) to consolidated statement of comprehensive income – continuing operations | 186,787 | (12,011 | ) | 174,776 | ||||||||||||
| Charged/(credited) to consolidated statement of comprehensive income – discontinued operations | 10,463 | - | 10,463 | |||||||||||||
| Foreign exchange adjustment | 11,987 | - | 11,987 | |||||||||||||
| Effect of change in tax rates – charged to consolidated statement of comprehensive income | 981,955 | 7,858 | 989,814 | |||||||||||||
| (1,448,443 | ) | (31,315 | ) | (1,479,757 | ) | |||||||||||
| Jurisdictional offsetting | 309,268 | |||||||||||||||
| At October 31, 2018 | (1,170,489 | ) | ||||||||||||||
| October 31, 2018 | April 30, 2017 | April 30, 2016 | ||||||||||||||||||||||
| Shares | $’000 | Shares | $’000 | Shares | $’000 | |||||||||||||||||||
| Issued and fully paid | ||||||||||||||||||||||||
| At May 1 | 229,674,479 | 39,700 | 228,706,210 | 39,573 | 228,587,397 | 39,555 | ||||||||||||||||||
| Shares issued to satisfy option awards | 1,894,673 | 251 | 968,269 | 127 | 118,313 | 18 | ||||||||||||||||||
| Share reorganization | (16,935,536 | ) | (2,926 | ) | - | - | 500 | - | ||||||||||||||||
Shares issued relating to acquisition of HPE Software business (note 39) | 222,166,897 | 28,773 | - | - | - | - | ||||||||||||||||||
| At October 31 / April 30 | 436,800,513 | 65,798 | 229,674,479 | 39,700 | 228,706,210 | 39,573 | ||||||||||||||||||
| October 31, 2018 | April 30, 2017 | April 30, 2016 | ||||||||||||||||||||||
| Shares | $’000 | Shares | $’000 | Shares | $’000 | |||||||||||||||||||
| Issued and fully paid | ||||||||||||||||||||||||
| At May 1 | - | - | - | - | - | - | ||||||||||||||||||
| Issue of B shares | 229,799,802 | 500,000 | - | - | - | - | ||||||||||||||||||
| Redemption of B shares | (229,799,802 | ) | (500,000 | ) | - | - | - | - | ||||||||||||||||
| At October 31 / April 30 | - | - | - | - | - | - | ||||||||||||||||||
| October 31, 2018 | April 30, 2017 | April 30, 2016 | ||||||||||
| $’000 | $’000 | $’000 | ||||||||||
| At May 1 | 192,145 | 190,293 | 16,087 | |||||||||
| Share placement issues | - | 176,235 | ||||||||||
| Share placement costs | - | (2,979 | ) | |||||||||
Issue and redemption of B shares (note 31) | (156,683 | ) | - | - | ||||||||
Movement in relation to share options exercised (note 35) | 5,499 | 1,852 | 950 | |||||||||
| At October 31 / April 30 | 40,961 | 192,145 | 190,293 | |||||||||
Capital redemption reserve | Merger reserve | Hedging reserve | Total | |||||||||||||
| $’000 | $’000 | $’000 | $’000 | |||||||||||||
| As at May 1, 2015 | 163,363 | 1,168,104 | - | 1,331,467 | ||||||||||||
Reallocation of merger reserve1 | - | (180,000 | ) | - | (180,000 | ) | ||||||||||
| As at May 1, 2016 | 163,363 | 988,104 | - | 1,151,467 | ||||||||||||
Reallocation of merger reserve 1 | - | (650,000 | ) | - | (650,000 | ) | ||||||||||
| As at April 30, 2017 | 163,363 | 338,104 | - | 501,467 | ||||||||||||
| As at May 1, 2017 | 163,363 | 338,104 | - | 501,467 | ||||||||||||
Return of Value- share consolidation 2 | 2,926 | - | - | 2,926 | ||||||||||||
Return of Value- issue and redemption of B shares 2 | 500,000 | (343,317 | ) | - | 156,683 | |||||||||||
Hedge accounting (note 29) 3 | - | - | 86,381 | 86,381 | ||||||||||||
Deferred tax movement on hedging 3 | - | - | (16,413 | ) | (16,413 | ) | ||||||||||
Acquisition of the HPE Software business 4 | - | 6,485,397 | - | 6,485,397 | ||||||||||||
Reallocation of merger reserve 1 | - | (2,755,800 | ) | - | (2,755,800 | ) | ||||||||||
| As at October 31, 2018 | 666,289 | 3,724,384 | 69,968 | 4,460,641 | ||||||||||||
October 31, 2018 | April 30, 2017 | April 30, 2016 | ||||||||||
| $’000 | $’000 | $’000 | ||||||||||
| At May 1 | 954 | 1,057 | 979 | |||||||||
| Share of (loss)/profit after tax | 85 | (103 | ) | 78 | ||||||||
| At April 30 | 1,039 | 954 | 1,057 | |||||||||
| Company name | Country of incorporation and principal place of business | October 31, 2018 Proportion held | April 30, 2017 Proportion held | April 30, 2016 Proportion held | |||||||||
| Novell Japan Ltd | Japan | 81.05 | % | 74.7 | % | 71.5 | % | ||||||
18 months ended October 31, 2018 | 12 months ended April 30, 20171 | 12 months ended April 30, 20161 | ||||||||||
| $’000 | $’000 | $’000 | ||||||||||
| Staff costs | ||||||||||||
| Wages and salaries | 1,819,251 | 382,482 | 342,957 | |||||||||
| Redundancy and termination costs (non-exceptional) | 2,102 | 2,115 | 3,722 | |||||||||
| Social security costs | 159,009 | 53,215 | 45,584 | |||||||||
| Other pension costs | 50,379 | 11,379 | 10,976 | |||||||||
| Cost of employee share schemes | 64,284 | 31,463 | 26,254 | |||||||||
| Total | 2,095,025 | 480,654 | 429,493 | |||||||||
18 months ended October 31, 2018 | 12 months ended April 30, 20171 | 12 months ended April 30, 20161 | ||||||||||
| $’000 | $’000 | $’000 | ||||||||||
| Pension costs comprise: | ||||||||||||
Defined benefit schemes (note 27) | 7,138 | 504 | 613 | |||||||||
Defined contribution schemes (note 27) | 43,241 | 10,875 | 10,363 | |||||||||
| Total | 50,379 | 11,379 | 10,976 | |||||||||
18 months ended October 31, 2018 | 12 months ended April 30, 2017 | 12 months ended April 30, 2016 | ||||||||||
| Number | Number | $’000 | ||||||||||
| Average monthly number of people | ||||||||||||
| (including executive directors) employed by the Group: | ||||||||||||
| Continuing Operations | ||||||||||||
| Sales and distribution | 5,860 | 1,818 | 1,692 | |||||||||
| Research and development | 4,323 | 1,400 | 1,301 | |||||||||
| General and administration | 1,378 | 642 | 582 | |||||||||
| 11,561 | 3,860 | 3,575 | ||||||||||
| Discontinued Operations | ||||||||||||
| Sales and distribution | 515 | 323 | 266 | |||||||||
| Research and development | 629 | 476 | 375 | |||||||||
| General and administration | 8 | 4 | 2 | |||||||||
| 1,152 | 803 | 643 | ||||||||||
| Total | ||||||||||||
| Sales and distribution | 6,375 | 2,141 | 1,958 | |||||||||
| Research and development | 4,952 | 1,876 | 1,676 | |||||||||
| General and administration | 1,386 | 646 | 584 | |||||||||
| Total | 12,713 | 4,663 | 4,218 | |||||||||
18 months ended October 31, 2018 | 12 months ended April 30, 2017 | 12 months ended April 30, 2016 | ||||||||||
| $’000 | $’000 | $’000 | ||||||||||
| Key management compensation | ||||||||||||
| Short-term employee benefits | 25,893 | 8,051 | 9,297 | |||||||||
| Share based payments | 44,497 | 9,391 | 10,146 | |||||||||
| Total | 70,390 | 17,442 | 19,443 | |||||||||
18 months ended October 31, 2018 | 12 months ended April 30, 2017 | 12 months ended April 30, 2016 | ||||||||||
| $’000 | $’000 | $’000 | ||||||||||
| Directors | ||||||||||||
| Aggregate emoluments | 14,583 | 5,227 | 3,612 | |||||||||
| Aggregate gains made on the exercise of share options | 77,719 | 8,166 | 3,764 | |||||||||
| Company contributions to money purchase pension scheme | 749 | 463 | 228 | |||||||||
| Total | 93,051 | 13,856 | 7,604 | |||||||||
18 months ended October 31, 2018 | 12 months ended April 30, 20171 | 12 months ended April 30, 20161 | ||||||||||
| $’000 | $’000 | $’000 | ||||||||||
| Share based compensation – IFRS 2 charge | 70,921 | 20,798 | 17,355 | |||||||||
| Employer taxes | (6,637 | ) | 10,665 | 8,899 | ||||||||
| 64,284 | 31,463 | 26,254 | ||||||||||
| a) | Incentive Plan 2005 |
18 months ended October 31, 2018 | 12 months ended April 30, 2017 | |||||||||||||||
Number of | Weighted average | Number of | Weighted average | |||||||||||||
| ‘000 | pence | ‘000 | pence | |||||||||||||
| Outstanding at May 1 | 4,662 | 29 | 5,186 | 41 | ||||||||||||
| Exercised | (1,283 | ) | 12 | (1,008 | ) | 85 | ||||||||||
| Forfeited | (582 | ) | 3 | (120 | ) | 14 | ||||||||||
| Granted | 2,823 | - | 604 | 6 | ||||||||||||
| Outstanding at October 31, / April 30, | 5,620 | 14 | 4,662 | 29 | ||||||||||||
| Exercisable at October 31, / April 30, | 2,270 | 51 | 1,261 | 92 | ||||||||||||
| October 31, 2018 | April 30, 2017 | ||||||||||||||||||||||||
Weighted average exercise price | Number of options | Weighted average remaining contractual | Weighted average exercise price | Number of options | Weighted average remaining contractual | ||||||||||||||||||||
| Range of exercise prices | pence | ‘000 | life (years) | pence | ‘000 | life (years) | |||||||||||||||||||
| £0.10 or less | 1 | 5,127 | 6.7 | 4 | 3,856 | 7.4 | |||||||||||||||||||
| £0.11 – £1.00 | 13 | 205 | 4.9 | 13 | 506 | 6.6 | |||||||||||||||||||
| £1.01 – £2.00 | - | - | - | - | - | - | |||||||||||||||||||
| £2.01 – £3.00 | - | - | - | 281 | 5 | 0.5 | |||||||||||||||||||
| £3.01 - £4.00 | 358 | 146 | 0.7 | 358 | 146 | 2.2 | |||||||||||||||||||
| More than £4.00 | 402 | 142 | 1.7 | 402 | 149 | 3.2 | |||||||||||||||||||
| 14 | 5,620 | 4.0 | 29 | 4,662 | 7.0 | ||||||||||||||||||||
18 months ended October 31, 2018 | 12 months ended April 30, 2017 | |||||||
| Weighted average share price at the grant date | £16.87 | £20.22 | ||||||
| Expected volatility | between 28.59% and 48.54% | between 26.96% and 27.98% | ||||||
| Expected dividend yield | between 2.82% and 7.02% | between 2.70% and 3.10% | ||||||
| Expected option life | three years | three years | ||||||
| Annual risk-free interest rate | between 1.0% and 1.6% | between 0.71% and 1.09% | ||||||
| b) | Additional Share Grants |
18 months ended October 31, 2018 | 12 months ended April 30, 2017 | |||||||||||||||
Number Of | Weighted average | Number of | Weighted average | |||||||||||||
| Outstanding at May 1 | 3,262 | - | 3,262 | - | ||||||||||||
| Exercised | (200 | ) | - | - | - | |||||||||||
| Lapsed | (2,412 | ) | - | - | - | |||||||||||
| Cancelled | (3,276 | ) | - | - | - | |||||||||||
| Granted | 13,115 | - | - | - | ||||||||||||
| Outstanding at October 31 / April 30 | 10,489 | - | 3,262 | - | ||||||||||||
| Exercisable at October 31 / April 30 | 3,062 | - | 3,062 | - | ||||||||||||
Director | Number of granted and cancelled nil cost share options over Ordinary Shares | Number of replacement nil cost options over Ordinary Shares | ||||||
| ‘000 | ‘000 | |||||||
| Kevin Loosemore | 1,100 | 1,100 | ||||||
| Stephen Murdoch | 500 | 947 | ||||||
Chris Kennedy1 | 500 | 676 | ||||||
| Mike Phillips | 676 | 676 | ||||||
| Nils Brauckmann | 500 | 500 | ||||||
| 3,276 | 3,899 | |||||||
18 months ended October 31, 2018 | 12 months ended April 30, 2017 | |||||||
| Weighted average share price at the grant date | £18.35 | £11.05 | ||||||
| Expected volatility | Between 28.00% - 31.00% | Between 25.81% - 26.11% | ||||||
| Expected dividend yield | Between 3.26% - 5.29% | Between 2.90% - 3.30% | ||||||
| Expected option life | 1.96 years | 3 years | ||||||
| Annual risk-free interest rate | Between 0.43% - 0.84% | Between 1.71% - 2.08% | ||||||
| October 31, 2018 | April 30, 2017 | ||||||||||||||||||||||||
Weighted average exercise price | Number of Options | Weighted average remaining contractual | Weighted average exercise price | Number of Options | Weighted average remaining contractual | ||||||||||||||||||||
| Range of exercise prices | pence | ‘000 | life (years) | pence | ‘000 | life (years) | |||||||||||||||||||
£0.00 | - | 10,489 | 5.5 | - | 3,262 | 7.6 | |||||||||||||||||||
| - | 10,489 | 5.5 | - | 3,262 | 7.6 | ||||||||||||||||||||
| b) | Sharesave and Employee Stock Purchase Plan 2006 |
18 months ended October 31, 2018 | 12 months ended April 30, 2017 | ||||||||||||||||
Number of | Weighted average | Number Of | Weighted average | ||||||||||||||
| Sharesave | ‘000 | pence | ‘000 | pence | |||||||||||||
| Outstanding at May 1 | 559 | 1,039 | 544 | 862 | |||||||||||||
| Exercised | (294 | ) | 829 | (90 | ) | 618 | |||||||||||
| Forfeited | (223 | ) | 1,508 | (28 | ) | 1,001 | |||||||||||
| Granted | 454 | 1,293 | 133 | 1,466 | |||||||||||||
| Outstanding | 496 | 1,185 | 559 | 1,039 | |||||||||||||
| Exercisable | 47 | 1,116 | - | - | |||||||||||||
Number of Options ‘000 | Date of grant | Exercise price per share pence | Exercise period | ||||
| 1 | February 10, 2015 | 838.4 | April 1, 2018 – September 30, 2018 | ||||
| 46 | August 7, 2015 | 1,112.0 | October 1, 2018 – March 31, 2019 | ||||
| 40 | February 9, 2016 | 1,200.0 | April 1, 2019 – September 30, 2019 | ||||
| 80 | August 12, 2016 | 1,465.6 | October 1, 2019 – February 1, 2020 | ||||
| 43 | February 23, 2018 | 1,720.0 | April 1, 2021 – September 30, 2021 | ||||
| 264 | August 3, 2018 | 1,023.0 | October 1, 2021 – March 31, 2022 | ||||
| 22 | August 3, 2018 | 1,159.0 | October 1, 2021 – April 1, 2022 | ||||
| 496 | |||||||
18 months ended October 31, 2018 | 12 months ended April 30, 2017 | |||||||||||||||
Number of | Weighted Average | Number of | Weighted average | |||||||||||||
| ESPP | ‘000 | pence | ‘000 | pence | ||||||||||||
| At May 1 | 124 | 1,510 | 272 | 1,080 | ||||||||||||
| Exercised | (110 | ) | 1,598 | (93 | ) | 998 | ||||||||||
| Forfeited | (32 | ) | 1,236 | (142 | ) | 1,220 | ||||||||||
| Granted | 817 | 1,057 | 87 | 1,836 | ||||||||||||
| Outstanding | 800 | 1,047 | 124 | 1,510 | ||||||||||||
| Exercisable | - | 1,021 | - | - | ||||||||||||
Number of Options ‘000 | Date of grant | Exercise price per share pence | Exercise period | ||||
| 19 | October 1, 2016 | 1,875.6 | October 1, 2018 – December 31, 2018 | ||||
| 337 | March 1, 2018 | 1,235.6 | March 1, 2020 – May 31, 2020 | ||||
| 444 | July 1, 2018 | 868.5 | July 1, 2020 – September 30, 2020 | ||||
| 800 | |||||||
18 months ended October 31, 2018 | 12 months ended April 30, 2017 | |||||||
| Weighted average share price at the grant date | £ 15.48 | £ 20.56 | ||||||
| Expected volatility | between 28.82% - 48.60% | 26.95 | % | |||||
| Expected dividend yield | between 3.86% - 7.02% | 2.60 | % | |||||
| Expected option life | two or three years | two or three years | ||||||
| Annual risk-free interest rate | between 1.3% - 1.5% | 0.61 | % | |||||
| October 31, 2018 | April 30, 2017 | |||||||
| $’000 | $’000 | |||||||
| Future minimum lease payments under non-cancellable operating leases expiring: | ||||||||
| No later than one year | 65,831 | 28,330 | ||||||
| Later than one year and no later than five years | 139,695 | 85,008 | ||||||
| Later than five years | 22,503 | 28,749 | ||||||
| Total | 228,029 | 142,087 | ||||||
| Consideration | ||||||||||||||||||||||||
Carrying value at acquisition | Fair value adjustments | Goodwill | Shares | Cash | Total | |||||||||||||||||||
| $’000 | $’000 | $’000 | $’000 | $’000 | $’000 | |||||||||||||||||||
| Acquisitions in the 18 months ended October 31, 2018: | ||||||||||||||||||||||||
| HPE Software business | (2,487,916 | ) | 4,143,712 | 4,858,374 | 6,514,170 | - | 6,514,170 | |||||||||||||||||
| COBOL-IT | (2,952 | ) | 14,026 | 5,588 | - | 16,662 | 16,662 | |||||||||||||||||
| (2,490,868 | ) | 4,157,738 | 4,863,962 | 6,514,170 | 16,662 | 6,530,832 | ||||||||||||||||||
| Acquisitions in the 12 months ended April 30, 2017: | ||||||||||||||||||||||||
| Serena Software Inc. | 147,260 | (249,306 | ) | 379,669 | - | 277,623 | 277,623 | |||||||||||||||||
| GWAVA Inc. | 618 | 3,062 | 12,767 | - | 16,447 | 16,447 | ||||||||||||||||||
| OpenATTIC | - | 4,991 | - | - | 4,991 | 4,991 | ||||||||||||||||||
| OpenStack | - | - | - | - | - | - | ||||||||||||||||||
| 147,878 | (241,253 | ) | 392,436 | - | 299,061 | 299,061 | ||||||||||||||||||
| Acquisitions in the 12 months ended April 30, 2016: | ||||||||||||||||||||||||
| Authasas BV | 1,110 | 10 | 8,840 | - | 9,960 | 9,960 | ||||||||||||||||||
| (2,341,880 | ) | 3,916,495 | 5,265,238 | 6,514,170 | 325,683 | 6,839,853 | ||||||||||||||||||
Carrying value at acquisition | Fair value Adjustments | Fair value | ||||||||||
| $’000 | $’000 | $’000 | ||||||||||
Intangible assets (note 11) 1 | 72,825 | 6,467,000 | 6,539,825 | |||||||||
Property, plant and equipment (note 12) | 160,118 | - | 160,118 | |||||||||
| Other non-current assets | 41,929 | - | 41,929 | |||||||||
| Inventories | 185 | - | 185 | |||||||||
| Trade and other receivables | 721,009 | - | 721,009 | |||||||||
| Current tax recoverable | 496 | - | 496 | |||||||||
| Cash and cash equivalents | 320,729 | - | 320,729 | |||||||||
| Trade and other payables | (686,855 | ) | 1,616 | (685,239 | ) | |||||||
| Current tax liabilities | (9,942 | ) | - | (9,942 | ) | |||||||
| Borrowings | (2,547,604 | ) | - | (2,547,604 | ) | |||||||
| Short-term provisions | (30,182 | ) | - | (30,182 | ) | |||||||
Short-term deferred income (note 24) 2 | (701,169 | ) | 58,004 | (643,165 | ) | |||||||
Long-term deferred income (note 25) 2 | (116,858 | ) | 8,652 | (108,206 | ) | |||||||
Long-term provisions (note 26) | (38,983 | ) | - | (38,983 | ) | |||||||
Retirement benefit obligations (note 27) | (71,445 | ) | - | (71,445 | ) | |||||||
| Other non-current liabilities | (52,421 | ) | 12,145 | (40,276 | ) | |||||||
Deferred tax liabilities 3 | 450,252 | (2,403,705 | ) | (1,953,453 | ) | |||||||
| Net (liabilities)/assets | (2,487,916 | ) | 4,143,712 | 1,655,796 | ||||||||
Goodwill (note 10) | - | 4,858,374 | ||||||||||
| Consideration | 6,514,170 | |||||||||||
| Consideration satisfied by: | ||||||||||||
| Shares | 6,514,170 | |||||||||||
| 1 | Purchased intangible assets have been valued based on a market participant point of view and the fair value has been based on various characteristics of the product lines and intangible assets of the HPE Software business; |
2 | Deferred income has been valued taking account of the remaining performance obligations; |
3 | A deferred tax liability has been established relating to the purchase of intangibles. |
| Fair value | ||||
| $’000 | ||||
| Technology | 1,809,000 | |||
| Customer relationships | 4,480,000 | |||
| Trade names | 163,000 | |||
| Leases | 15,000 | |||
| 6,467,000 | ||||
Carrying value at acquisition | Fair value adjustments | Fair value | ||||||||||
| $’000 | $’000 | $’000 | ||||||||||
| Goodwill | 462,400 | (462,400 | ) | - | ||||||||
Intangible assets - purchased 1 | - | 317,700 | 317,700 | |||||||||
| Intangible assets - other | 79 | - | 79 | |||||||||
| Property, plant and equipment | 1,927 | - | 1,927 | |||||||||
| Other non-current assets | 167 | - | 167 | |||||||||
| Deferred tax asset | 15,347 | - | 15,347 | |||||||||
| Trade and other receivables | 27,362 | - | 27,362 | |||||||||
| Cash and cash equivalent | 65,784 | - | 65,784 | |||||||||
| Borrowings – short-term | (27,712 | ) | - | (27,712 | ) | |||||||
| Trade and other payables | (11,766 | ) | - | (11,766 | ) | |||||||
| Provisions – short-term | (4,045 | ) | - | (4,045 | ) | |||||||
| Current tax liabilities | (3,173 | ) | - | (3,173 | ) | |||||||
Deferred income – short-term 2 | (72,217 | ) | 3,761 | (68,456 | ) | |||||||
Deferred income – long-term 2 | (14,853 | ) | 798 | (14,055 | ) | |||||||
| Borrowings – long-term | (288,938 | ) | - | (288,938 | ) | |||||||
| Other non-current liabilities | (717 | ) | - | (717 | ) | |||||||
Deferred tax liabilities 3 | (2,385 | ) | (109,165 | ) | (111,550 | ) | ||||||
| Net assets /(liabilities) | 147,260 | (249,306 | ) | (102,046 | ) | |||||||
Goodwill (note 10) | 379,669 | |||||||||||
| Consideration | 277,623 | |||||||||||
| Consideration satisfied by: | ||||||||||||
| Cash | 277,623 | |||||||||||
| 1 | Purchased intangible assets have been valued based on a market participant point of view and the fair value has been based on various characteristics of the product lines and intangible assets of Serena; |
| 2 | Deferred income has been valued taking account of the remaining performance obligations; and |
| 3 | A deferred tax liability has been established relating to the purchase of intangibles. |
| Fair value | ||||
| $’000 | ||||
| Technology | 86,100 | |||
| Customer relationships | 210,200 | |||
| Trade names | 21,400 | |||
| 317,700 | ||||
Carrying value at acquisition | Fair value adjustments | Fair value | ||||||||||
| $’000 | $’000 | $’000 | ||||||||||
Intangible assets - purchased 1 | - | 5,330 | 5,330 | |||||||||
| Intangible assets - other 2 | 1,180 | (1,180 | ) | - | ||||||||
| Property, plant and equipment | 195 | - | 195 | |||||||||
| Trade and other receivables | 3,096 | - | 3,096 | |||||||||
| Cash and cash equivalent | 2,389 | - | 2,389 | |||||||||
| Trade and other payables | (1,331 | ) | - | (1,331 | ) | |||||||
Deferred income – short-term 3 | (4,094 | ) | 324 | (3,770 | ) | |||||||
| Deferred income – long-term | (817 | ) | - | (817 | ) | |||||||
Deferred tax liabilities 4 | - | (1,412 | ) | (1,412 | ) | |||||||
| Net assets | 618 | 3,062 | 3,680 | |||||||||
Goodwill (note 10) | 12,767 | |||||||||||
| Consideration | 16,447 | |||||||||||
| Consideration satisfied by: | ||||||||||||
| Cash | 16,447 | |||||||||||
| 1 | Purchased intangible assets have been valued based on a market participant point of view and the fair value has been based on various characteristics of the product lines and intangible assets of GWAVA Inc.; |
| 2 | Other intangible assets relating to historic IP has been written down to nil; |
| 3 | Deferred income has been valued taking account of the remaining performance obligations; and |
| 4 | A deferred tax liability has been established relating to the purchase of intangibles. |
| Fair value | ||||
| $’000 | ||||
| Technology | 4,075 | |||
| Customer relationships | 544 | |||
| Trade names | 711 | |||
| 5,330 | ||||
Carrying value at acquisition | Fair value adjustments | Fair value | ||||||||||
| $’000 | $’000 | $’000 | ||||||||||
| Intangible assets – purchased technology | - | 4,991 | 4,991 | |||||||||
| Net assets | - | 4,991 | 4,991 | |||||||||
| Goodwill | - | |||||||||||
| Consideration | 4,991 | |||||||||||
| Consideration satisfied by: | ||||||||||||
| Cash | 4,991 | |||||||||||
Carrying value at acquisition | Fair value adjustments | Fair value | ||||||||||
| $’000 | $’000 | $’000 | ||||||||||
Intangible assets - purchased 1 | - | 3,356 | 3,356 | |||||||||
Intangible assets - other 2 | 1,973 | (1,973 | ) | - | ||||||||
| Property, plant and equipment | 14 | - | 14 | |||||||||
| Inventory | 11 | - | 11 | |||||||||
Deferred tax asset 3 | 339 | (339 | ) | - | ||||||||
| Trade and other receivables | 463 | - | 463 | |||||||||
| Cash and cash equivalent | 106 | - | 106 | |||||||||
Trade and other payables 4 | (1,796 | ) | (68 | ) | (1,864 | ) | ||||||
Deferred tax liabilities 5 | - | (966 | ) | (966 | ) | |||||||
| Net assets | 1,110 | 10 | 1,120 | |||||||||
| Goodwill | 8,840 | |||||||||||
| Consideration | 9,960 | |||||||||||
| Consideration satisfied by: | ||||||||||||
| Cash | 9,960 | |||||||||||
| 1 | Purchased intangible assets have been valued based on a market participant point of view and the fair value has been based on various characteristics of the product lines and intangible assets of Authasas BV; |
| 2 | Other intangible assets relating to product development costs have been written down to nil; |
| 3 | The deferred tax asset on acquisition has been written down to nil; |
| 4 | Deferred income has been valued taking account of the remaining performance obligations; |
5 | A deferred tax liability has been established relating to the purchase of intangibles. |
| Fair value | ||||
| $’000 | ||||
| Technology | 2,545 | |||
| Customer relationships | 811 | |||
| 3,356 | ||||
| Note | 18 months ended October 31, 2018 $’000 | 12 months ended April 30, 20171 $’000 | 12 months ended April 30, 20161 $’000 | |||||||||||||
| Cash flows from operating activities | ||||||||||||||||
| Profit from continuing operations | 707,193 | 124,083 | 135,979 | |||||||||||||
| Profit from discontinued operation | 76,940 | 33,720 | 26,993 | |||||||||||||
| Profit for the period | 784,133 | 157,803 | 162,972 | |||||||||||||
| Adjustments for: | ||||||||||||||||
| Net interest | 6 | 342,712 | 95,845 | 97,348 | ||||||||||||
| Taxation | 7 | (638,875 | ) | 38,541 | 32,424 | |||||||||||
| Share of results of associates | 1,809 | 1,254 | 2,190 | |||||||||||||
| Operating profit | 489,779 | 293,443 | 294,934 | |||||||||||||
| Research and development tax credits | (2,013 | ) | (2,998 | ) | (2,041 | ) | ||||||||||
| Depreciation | 12 | 95,179 | 11,794 | 11,419 | ||||||||||||
| Loss on disposal of property, plant and equipment | 4,581 | 520 | 109 | |||||||||||||
| Amortization of intangible assets | 11 | 943,210 | 236,434 | 203,313 | ||||||||||||
| Share-based compensation charge | 35 | 72,175 | 34,506 | 28,793 | ||||||||||||
| Exchange movements | (34,505 | ) | (4,890 | ) | (2,915 | ) | ||||||||||
| Provisions movements | 26 | 142,859 | 47,266 | 12,985 | ||||||||||||
| Changes in working capital: | ||||||||||||||||
| Inventories | 35 | 29 | 28 | |||||||||||||
| Trade and other receivables | (408,879 | ) | 10,224 | (49,175 | ) | |||||||||||
| Payables and other liabilities | 131,333 | (33,252 | ) | 30,923 | ||||||||||||
| Provision utilization | 26 | (145,012 | ) | (43,476 | ) | (55,639 | ) | |||||||||
| Deferred income | 131,477 | 15,375 | (16,603 | ) | ||||||||||||
| Pension funding in excess of charge to operating profit | 4,092 | (183 | ) | (18 | ) | |||||||||||
| Cash generated from operations | 1,424,311 | 564,792 | 456,113 | |||||||||||||