SECURITIES AND EXCHANGE COMMISSION
Washington, D.C. 20549
FORM 6-K
REPORT OF FOREIGN ISSUER
PURSUANT TO RULE 13a-16 or 15d-16 OF
THE SECURITIES EXCHANGE ACT OF 1934
April 27, 2007
IBERDROLA, S.A.
(Exact name of registrant as specified in its charter)
Cardenal Gardoqui, 8
48008 Bilbao
Spain
(Address of principal executive offices)
Copies to:
Michael S. Immordino
Latham & Watkins
99 Bishopsgate
London EC2M 3XF
United Kingdom
Tel: +44 20 7710 1000
Indicate by check mark whether the registrant files or will file annual reports under cover Form 20-F or Form 40-F:
Form 20-F: x Form 40-F: ¨
Indicate by check mark whether the registrant by furnishing the information contained in this Form is also thereby furnishing the information to the Commission pursuant to Rule 12g3-2(b) under the Securities Exchange Act of 1934.
Yes: ¨ No: x
If “Yes” is marked, indicate below the file number assigned to the registrant in connection with Rule 12g3-2(b): Not applicable
Exhibit Index
| Exhibit Number | Description | |
| Exhibit 99.1 | Press release regarding Iberdrola’s 2007 First Quarter Results | |
| Exhibit 99.2 | Iberdrola’s 2007 First Quarter Results | |
| Exhibit 99.3 | Presentation regarding Iberdrola’s 2007 First Quarter Results | |
| Exhibit 99.4 | Report on Iberdrola’s 2007 First Quarter Results | |
| Exhibit 99.5 | Iberdrola and Scottish Power Presentation: Introduction | |
| Exhibit 99.6 | Iberdrola and Scottish Power Presentation: Introduction to Scottish Power and its markets | |
| Exhibit 99.7 | Iberdrola and Scottish Power Presentation: Generation and Supply | |
| Exhibit 99.8 | Iberdrola and Scottish Power Presentation: Wind | |
| Exhibit 99.9 | Iberdrola and Scottish Power Presentation: Scottish Power -Transmission and Distribution | |
| Exhibit 99.10 | Iberdrola and Scottish Power Presentation: Scottish Power - North American Businesses | |
| Exhibit 99.11 | Iberdrola and Scottish Power Presentation: Scottish Power - Strategic Fit & Valuation Considerations | |
| Exhibit 99.12 | Annex to Iberdrola’s 2007 First Quarter Results - Significant Events | |
| Exhibit 99.13 | Other communications in connection with Iberdrola’s increase of its stake in Medgaz and CNE’s authorisation | |
SIGNATURES
Pursuant to the requirements of the Securities Exchange Act of 1934, the registrant has duly caused this report to be signed on its behalf by the undersigned, thereunto duly authorized.
| IBERDROLA, S.A. | ||
| (Registrant) | ||
| By | /s/ JULIAN MARTINEZ-SIMANCAS SANCHEZ | |
| Name: Julián Martínez-Simancas Sánchez | ||
| Title: General Secretary | ||
Date: April 27, 2007
Exhibit 99.1
Birth of a world leader
PRESS RELEASE
| 26 April 2007 |  |
 | Net profit rose 13.6% to €458.2 million in the first quarter of 2007 | |
IBERDROLA IS NOW ONE OF THE WORLD’S LARGEST ELECTRICITY COMPANIES WITH THE SCOTTISHPOWER OPERATION | ||
INTEGRATED GROUP | ||
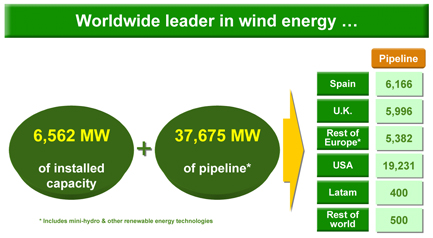
• GROWTH: With an enterprise value of more than €67 billion and a project pipeline in renewables of 37,700 MW, the combination of Iberdrola and ScottishPower represents a platform for future growth in Europe and the Americas | ||
FIRST QUARTER: KEY DATA | ||
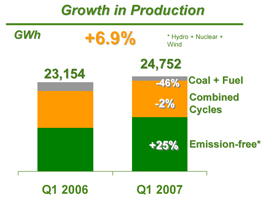
• HIGHER PRODUCTION: Electricity production rose 6.9% to 24,750 GWh; the increase in Spain is 2.5% compared to a fall of 0.5% for the rest of the sector | ||
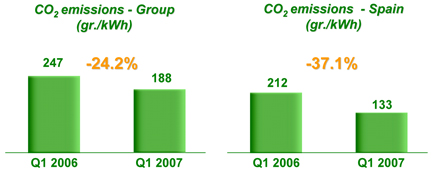
• LOWER EMISSIONS: CO2emissions per kWh were reduced by 37.1% in Spain from 212 to 133 grammes, increasing the ratio of clean energy production to 76% | ||
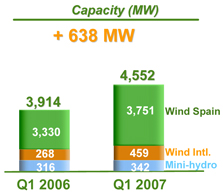
• WIND POWER: World leadership consolidated in this sector, with an operational capacity in renewables of 4,552 MW at the close of the quarter, of which 459 MW was outside Spain | ||
RESULTS | ||
• FACTORS: Group EBITDA rose 2.9% in the period to €1,087.1 million, in a context of lower prices and lower energy demand in Spain | ||
• STRATEGY: International and non-energy businesses increased their contributions to gross operating profit by 41% and 40%, respectively |
| Ø | Communications |
 | IBERDROLA has become one of the largest electricity companies in the world having last Monday completed the transaction with ScottishPower for €17.1 billion, one of the biggest in Spanish corporate history. With an enterprise value of more than €67 billion, the combination of the two companies creates a platform for future growth in Europe and the Americas. | |
During the first quarter of the year, IBERDROLA has continued the strategy initiated in 2001 that has enabled it to successfully face this large-scale operation in record time. Net profit rose 13.6% to €458.2 million, in a difficult context of low electricity prices and lower energy demand in Spain. | ||
Completion of theIBERDROLA-ScottishPowertransaction, valued at €17.1 billion and announced in November 2006, is a milestone in the Company’s 100-year history. It creates a world electricity giant, leader in renewable energy and an enterprise value of more than €67 billion. | ||
This operation, in line with the strategy drawn up byIBERDROLA last October for the period 2007-09, will enable the group to accelerate planned growth, offer new long-term business opportunities, diversify risk and maintain financial strength with a view to creating value for shareholders. | ||
The operation, which is among the largest in Spanish business history, has been strongly endorsed by shareholders of both companies – 99.5% at theIBERDROLA Shareholders Meeting and 97.6% at theScottishPowerEGM – as well as by the markets. Between 27 November 2006 and April 23 more than €4 billion in value was created. | ||
| ||
The geographical footprint ofIBERDROLA andScottishPower is now of significant proportions, creating an Atlantic platform. It has operations in Spain, the UK, the United States, Mexico, Brazil, Greece, Portugal, France, Germany, Italy, Poland, Guatemala, Bolivia and Chile. The group also has a substantial project pipeline that will enable it to continue growing in the future. |
| Ø | Communications |
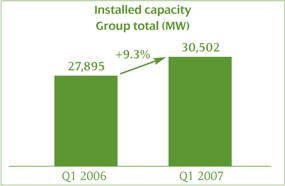
| The combined group has a total installed capacity of around 40,000 megawatts (MW) compared with the 30,500 MW ofIBERDROLA alone (a rise of 28%). Of this new capacity, 32,500 MW relates to conventional generation, an increase of 25% over IBERDROLA’s current level of 26,000 MW. | |
The new integrated group will consolidateIBERDROLA’s world leadership in renewable energy, especially in wind power. Added to the more than 4,500 MW ofIBERDROLA are over 2,000 MW fromScottishPower, mostly from U.S. company PPM, increasing capacity by 44% to 6,562 MW. | ||
The combined project pipeline ofIBERDROLAandScottishPowerin renewable energy stands at 37,675 MW: approximately 6,000 MW are in Spain and another 6,000 MW in the UK, nearly 5,400 MW in the rest of Europe, more than 19,200 MW in the United States, 400 MW in Latin America, and 500 MW in the rest of the world. | ||
The new Group has a significantly larger consumer base, with the 3.3 million customers ofScottishPower adding to the 18.4 million ofIBERDROLA to total 21.7 million in Europe and the Americas, a rise of 18%. | ||
The Company now has 2.7 billion cubic metres of gas storage capacity in the UK and the United States, with significant expansion potential. | ||
| ||
The integration ofIBERDROLA andScottishPower also represents a strengthening of the commitment of both companies with shareholders, customers, employees and communities where they operate, thanks to their powerful business platform. The Group is a leader in renewable energy, with a balanced generation mix, low dependence on foreign supplies, excellent efficiency levels and financially sound. | ||
Net profit rose 13.6% in the first quarter | ||
IBERDROLA’sstrategic decision to invest in basic energy, and its progressive international expansion, have once again been reflected in results for the first quarter of 2007 with a double digit rise in net profit (13.6%) to €458.2 million, in line with expectations for the year as a whole. | ||
In a difficult context in Spain, with falling energy prices (-41%) and modest growth in electricity demand (1.8%), the Company has succeeded in increasing gross operating profit (EBITDA) by 2.9% €1,087.1 million. | ||
IBERDROLA has assigned the bulk of investments over the past few years to increasing electricity production capacity via combined cycles and wind farms. Over the past 12 months it has started up 2,607 megawatts (MW) to achieve |
3
| Ø | Communications |
| total capacity of 30,502 MW at March 31, of which 26,084 MW was in Spain (85.2% of the total). | |
TheIBERDROLA group has increased output in the first three months of the year by 6.9% to 24,752 million kWh, as a result of new capacity. In Spain, the Company generated 18,208 million kWh in the period, a rise of 2.5% over the same period of 2006. | ||
| ||
Increased output from clean energy technology has allowedIBERDROLA to substantially reduce its emissions during the period, both at Group level (24.2% less from 247 grammes of CO2 per kWh to 188 grammes) and in Spain (37.1% lower from 212 grammes of CO2 per kWh to 133 grammes, a third the level for the rest of the sector of 378 grammes. As a result, emission free production came to 76% of the total. | ||
These figures again underline that new investments in generation have not only allowedIBERDROLA to balance and diversify its production mix, placing a limit on traditional technologies, but also to continue contributing to meeting the goals of the Kyoto protocol, to which it is firmly committed. | ||
World leadership in wind power.The Company has continued to strengthen its leadership in renewable energy with new installations and a number of transactions outside Spain in the first three months of the year. | ||
| ||
The most significant of these was the acquisition of CPV Wind Ventures LLC of the United States por €55 million, in line withIBERDROLA’s plans to increase its presence in the wind power market in this country where it already has a project pipeline of 8,500 MW. It also signed an agreement in Italy with API Group to develop wind farms, increased its stake in Greek company Rokas to 52.7% and started work on two wind farms in France. | ||
The Company incorporated 638 MW in new wind power capacity over the past 12 months, to a total of 4,552 MW, an increase of 16.3% over the 3,914 MW in |
4
| Ø | Communications |
| March 2006. Of total installed capacity, 4,210 MW relates to wind power – 459 MW outside Spain – and 342 to mini hydro plants. | ||
Renewable energy plants achieved a production of 2,725 million kWh in the first three months (+21%), accounting for 11% of total output, with a significant (23.2%) increase in wind power to 2,578 million kWh. | ||
IBERDROLA envisages renewable energy capacity of 7,000 MW on stream in 2009, almost entirely wind power, and more than 10,000 MW in 2011. | ||
The largest combined cycle operator in Spain.Consistent with its focus on clean energy,IBERDROLA continues to build combined cycle gas plants in Spain and manages a total installed capacity of 5,600 MW. It has plans to bring the Castellón 4 combined cycle on stream this year with installed capacity of 800 MW. |
Project | Capacity (MW managed) | Startup | ||
Castellón | 800 | Operative 2002 | ||
Castejón | 400 | Operative 2003 | ||
Bahía Bizkaia Electricidad | 800 | Operative 2003 | ||
Tarragona | 400 | Operative 2003 | ||
Santurce | 400 | Operative 2004 | ||
Arcos Group I & II | 800 | Operative 2004 | ||
Aceca | 400 | Operative 2005 | ||
Arcos Group III | 800 | Operative 2005 | ||
Escombreras | 800 | Operative 2006 | ||
Total 2002-2005 | 5,600 | 2006 | ||
Castellón 4 | 800 | Projected 2007 | ||
Total 2002-2007 | 6,400 (5,600 owned) | 2007 |
| In this context, a contract was signed recently to acquire the site forIBERDROLA’S first combined cycle plant in Portugal (Figueira da Foz), with a capacity of 850 MW and which could start up operations in 2009. | |
At the same time, and meeting strategic goals of starting up power stations capable of covering increased demand,IBERDROLA has received approval from the Environment Ministry for two hydroelectric plants: a new complex at La Muela (Valencia) to double its capacity to 630 MW and a 175 MW expansion of the San Esteban plant in the Sil basin. | ||
Increase in international contributionFirst quarter results were supported substantially by the fruits of investments in business outside Spain, where EBITDA rose 41% to €200.5 million. | ||
Electricity production in Latin America rose 21.5% over the same period of 2006 to 6,544 million kWh (26.4% of Group total), with a significant contribution from combined cycles which generated 22.4% more to 6,161 million kWh |
5
| Ø | Communications |
| acccounting for 94.1% of electricity produced by the Company in the region. Energy distributed there byIBERDROLA increased 6.2% to 7,254 kWh.IBERDROLA confirmed its position as the number one privately owned energy producer in Mexico, with an installed capacity of 3,814 MW. In February, it began tests at the combined cycle plant at Tamazunchale (1,135 MW) in the State of San Luis Potosí, the largest to be put in operation in this country. | ||
| IBERDROLA THERMAL GENERATION PROJECTS IN MEXICO | ||
Project | Capacity (MW) | Status | ||
Enertek | 120 | 100% operative | ||
Monterrey III | 1,037 | 100% operative | ||
Altamira III y IV | 1,036 | 100% operative | ||
La Laguna II | 500 | 100% operative | ||
Altamira V | 1,121 | 100% operative | ||
Tamazunchale | 1,135 | Operational 2007 | ||
TOTAL | 4,949 | 2007 |
|
Progressive contribution from non-energy business. These businesses, in particular the engineering and construction along with the real estate subsidiaries, played an important part in the first quarter registering a 40% rise in EBITDA to €122.5 million. | |||||||
• Iberdrola Ingeniería y Construcción. The subsidiary has projects under way in more than 25 countries, and during the first quarter won a major contract worth 605 million dollars to modernise and increase capacity of the Laguna Verde nuclear plant in Mexico. | ||||||||
• Iberdrola Inmobiliaria. The company delivered 351 houses during the period and has a total of 16 housing projects under way (1,154 units) and another 20 under negotiation (1,498 homes). In the non-residential sector, it is promoted an office building in Málaga con 1,152 m2 and the Porta Firal project in Barcelona, with 91,111 m2 above street level and 42,363 m2 below street level, due to start construction this summer. | ||||||||
| Positive results in a difficult scenario | ||||||||
| Eur MM | Q1 2007 | Q1 2006 | Change% | |||||
Gross Margin | 1,572.4 | 1,493.9 | +5.3 | |||||
Net Op. Expenses | -439.3 | -391.2 | +12.3 | |||||
EBITDA | 1,087.1 | 1,056.6 | +2.9 | |||||
Operating Profit (EBIT) | 794.8 | 788.4 | +0.8 | |||||
Financial Result | -163.5 | -163.4 | +0.1 | |||||
Non-recurrent assets +Equity Income | 29.3 | 5.7 | N/M | |||||
Net Profit | 458.2 | 403.2 | +13.6 | |||||
| Ø | Communications |
| This communication does not constitute an offer to purchase, sell or exchange or the solicitation of an offer to purchase, sell or exchange any securities. The shares of Iberdrola, S.A. may not be offered or sold in the United States of America except pursuant to an effective registration statement under the Securities Act or pursuant to a valid exemption from registration. | |
FORWARD-LOOKING STATEMENTS | ||
This communication contains forward-looking information and statements about Iberdrola, S.A. and otherwise, including financial projections and estimates and their underlying assumptions, statements regarding plans, objectives and expectations with respect to future operations, capital expenditures, synergies, products and services, and statements regarding future performance. Forward-looking statements are statements that are not historical facts and are generally identified by the words “expects,” “anticipates,” “believes,” “intends,” “estimates” and similar expressions. | ||
Although Iberdrola, S.A. believes that the expectations reflected in such forward-looking statements are reasonable, investors and holders of Iberdrola, S.A. shares are cautioned that forward-looking information and statements are subject to various risks and uncertainties, many of which are difficult to predict and generally beyond the control of Iberdrola, S.A., that could cause actual results and developments to differ materially from those expressed in, or implied or projected by, the forward-looking information and statements. These risks and uncertainties include those discussed or identified in the public documents sent by Iberdrola, S.A. to theComisión Nacional del Mercado de Valores. | ||
Forward-looking statements are not guarantees of future performance. They have not been reviewed by the auditors of Iberdrola, S.A. You are cautioned not to place undue reliance on the forward-looking statements, which speak only as of the date they were made. All subsequent oral or written forward-looking statements attributable to Iberdrola, S.A. or any of its members, directors, officers, employees or any persons acting on its behalf are expressly qualified in their entirety by the cautionary statement above. All forward-looking statements included herein are based on information available to Iberdrola, S.A. on the date hereof. Except as required by applicable law, Iberdrola, S.A. does not undertake any obligation to publicly update or revise any forward-looking statements, whether as a result of new information, future events or otherwise. | ||
7
| Ø | Communications |
Exhibit 99.2

Income Statement
First Quarter 2007
(Unaudited)
Million Euros
| Q1 2007 | Q1 2006 | Change % | |||||||
NET SALES | 2,716.6 | 2,978.4 | (8.8 | ) | |||||
PROCUREMENTS | (1,136.1 | ) | (1,377.1 | ) | (17.5 | ) | |||
EMISSION ALLOWANCES | (8.0 | ) | (107.4 | ) | (92.6 | ) | |||
GROSS MARGIN | 1,572.5 | 1,493.9 | 5.3 | ||||||
EMISSION ALLOWANCES | 2.3 | 6.2 | (62.9 | ) | |||||
NET OPERATING EXPENSES | (439.4 | ) | (391.2 | ) | 12.3 | ||||
Net personnel expenses | (202.9 | ) | (211.4 | ) | (4.0 | ) | |||
Personnel | (243.2 | ) | (253.1 | ) | (3.9 | ) | |||
In-house work on fixed assets | 40.3 | 41.7 | -3.4 | ||||||
Net External Services | (236.5 | ) | (179.8 | ) | 31.5 | ||||
External services | (275.3 | ) | (222.5 | ) | 23.7 | ||||
Other operating revenues | 38.8 | 42.7 | -9.1 | ||||||
TAX | (48.3 | ) | (52.3 | ) | (7.6 | ) | |||
EBITDA | 1,087.1 | 1,056.6 | 2.9 | ||||||
AMORTISATION AND PROVISIONS | (292.3 | ) | (268.2 | ) | 9.0 | ||||
EBIT | 794.8 | 788.4 | .8 | ||||||
TOTAL FINANCIAL REVENUES | 65.8 | 40.7 | 61.7 | ||||||
Financial revenues | 41.9 | 19.4 | 116.0 | ||||||
Positive exchange rate differences | 8.1 | 1.3 | 523.1 | ||||||
Capitalised financial expenses | 15.8 | 20.0 | (21.0 | ) | |||||
TOTAL FINANCIAL EXPENSES | (229.2 | ) | (204.1 | ) | 12.3 | ||||
Interest expenses | (169.7 | ) | (152.4 | ) | 11.4 | ||||
Negative exchange rate differences | (11.4 | ) | (2.9 | ) | 293.1 | ||||
Pension funds | (8.4 | ) | (8.8 | ) | (4.5 | ) | |||
Change in provisions for short term financial investments | (.8 | ) | (.2 | ) | N/A | ||||
Other financial expenses | (38.9 | ) | (39.8 | ) | (2.3 | ) | |||
RESULTS OF COMPANIES CARRIED BY EQUITY METHOD | 19.9 | 4.1 | 385.4 | ||||||
INCOME FROM NON-CURRENT ASSETS | 9.3 | 1.6 | 481.3 | ||||||
PROFIT BEFORE TAXES | 660.6 | 630.7 | 4.7 | ||||||
Corporate income tax | (193.8 | ) | (221.6 | ) | (12.5 | ) | |||
Minorities | (8.6 | ) | (5.9 | ) | 45.8 | ||||
NET PROFIT | 458.2 | 403.2 | 13.6 |
Balance Sheet
First Quarter 2007
(Unaudited)
Million Euros
| March 2007 | December 2006 | Change | |||||||
FIXED ASSETS | 25,532 | 25,188 | 344 | ||||||
Tangible fixed assets | 21,737 | 21,564 | 173 | ||||||
Intangible fixed assets | 967 | 900 | 67 | ||||||
Long-term financial investments | 2,828 | 2,724 | 104 | ||||||
DEFERRED TAX | 1,133 | 1,222 | (89 | ) | |||||
NON-CURRENT ACCOUNTS RECEIVABLE | 884 | 833 | 51 | ||||||
CURRENT ASSETS | 6,453 | 5,818 | 635 | ||||||
Nuclear fuel | 243 | 238 | 5 | ||||||
Inventories | 1,340 | 1,193 | 147 | ||||||
Accounts receivable | 2,759 | 2,791 | (32 | ) | |||||
Taxes receivable | 789 | 602 | 187 | ||||||
Short temp. Financial Investments | 310 | 289 | 21 | ||||||
Cash & equivalents | 1,012 | 705 | 307 | ||||||
| TOTAL ASSETS | 34,002 | 33,061 | 941 | ||||||
| March 2007 | December 2006 | Change | |||||||
SHAREHOLDERS’ EQUITY | 10,564 | 10,567 | (3 | ) | |||||
Capital Stock | 2,705 | 2,705 | |||||||
Reserves and other | 7,298 | 6,100 | 1,198 | ||||||
Profit and Loss | 458 | 1,660 | (1,202 | ) | |||||
Treasury Stock | (3 | ) | (3 | ) | |||||
Exchange differentials | (50 | ) | (44 | ) | (6 | ) | |||
Minority interest | 156 | 149 | 7 | ||||||
LONG TERM PROVISIONS | 1,658 | 1,718 | (60 | ) | |||||
DEFERRED INCOME | 864 | 818 | 46 | ||||||
FINANCIAL DEBT | 14,599 | 14,352 | 247 | ||||||
OTHER LONG-TERM DEBT | 5,217 | 4,541 | 676 | ||||||
OTHER SHORT TERM DEBT | 957 | 847 | 110 | ||||||
PAYABLE TO CO. ACCOUNTED BY EQUITY METHOD | 143 | 218 | (75 | ) | |||||
| TOTAL LIABILITIES | 34,002 | 33,061 | 941 | ||||||
Results by Business
First Quarter 2007
(Unaudited)
Million Euros
| Domestic Energy | International Business | Engineering & Non- Energy | |||||||
Net sales | 1,635.1 | 611.4 | 470.0 | ||||||
Procurements | (506.7 | ) | (344.9 | ) | (284.5 | ) | |||
Emission allowances | (8.0 | ) | |||||||
Gross Margin | 1,120.4 | 266.5 | 185.5 | ||||||
Emission allowances | 2.3 | ||||||||
Net operating expenses | (314.5 | ) | (63.7 | ) | (61.0 | ) | |||
Net personnel expenses | (149.5 | ) | (24.4 | ) | (29.0 | ) | |||
Personnel | (177.0 | ) | (27.8 | ) | (38.4 | ) | |||
In-house work on fixed assets | 27.5 | 3.4 | 9.4 | ||||||
Net External Services | (165.0 | ) | (39.3 | ) | (32.0 | ) | |||
External services | (193.8 | ) | (44.5 | ) | (36.9 | ) | |||
Other operating revenues | 28.8 | 5.2 | 4.9 | ||||||
TAX | (44.0 | ) | (2.3 | ) | (2.0 | ) | |||
EBITDA | 764.2 | 200.5 | 122.5 | ||||||
Amortisation and provisions | (230.1 | ) | (43.6 | ) | (18.6 | ) | |||
EBIT / Operating Profit | 534.1 | 156.9 | 103.9 | ||||||
Financial Result | (142.6 | ) | (21.1 | ) | .1 | ||||
Companies using equity method | .7 | 1.4 | 17.8 | ||||||
Income from non-current assets | 9.8 | (.3 | ) | (.1 | ) | ||||
PROFIT BEFORE TAXES | 402.0 | 136.9 | 121.7 | ||||||
Corporate tax & minorities | (131.1 | ) | (39.1 | ) | (32.3 | ) | |||
Net Profit | 270.9 | 97.8 | 89.4 | ||||||
| First Quarter 2006 | |||||||||
| Million Euros | |||||||||
| Domestic Energy | International Business | Engineering & Non- Energy | |||||||
Net sales | 2,048.6 | 584.6 | 345.2 | ||||||
Procurements | (795.7 | ) | (388.7 | ) | (192.6 | ) | |||
Emission allowances | (107.4 | ) | |||||||
Gross Margin | 1,145.5 | 195.9 | 152.6 | ||||||
Emission allowances | 6.2 | ||||||||
Net operating expenses | (276.0 | ) | (51.8 | ) | (63.5 | ) | |||
Net personnel expenses | (156.2 | ) | (17.9 | ) | (37.3 | ) | |||
Personnel | (181.7 | ) | (21.6 | ) | (49.7 | ) | |||
In-house work on fixed assets | 25.5 | 3.7 | 12.4 | ||||||
Net External Services | (119.8 | ) | (33.9 | ) | (26.2 | ) | |||
External services | (142.7 | ) | (46.1 | ) | (33.8 | ) | |||
Other operating revenues | 22.9 | 12.2 | 7.6 | ||||||
TAX | (48.7 | ) | (1.9 | ) | (1.6 | ) | |||
EBITDA | 827.0 | 142.2 | 87.5 | ||||||
Amortisation and provisions | (211.8 | ) | (40.0 | ) | (16.3 | ) | |||
EBIT / Operating Profit | 615.2 | 102.2 | 71.2 | ||||||
Financial Result | (131.9 | ) | (27.5 | ) | (3.9 | ) | |||
Companies using equity method | (1.5 | ) | 2.8 | 2.7 | |||||
Income from non-current assets | 2.6 | (.6 | ) | (.5 | ) | ||||
PROFIT BEFORE TAXES | 484.4 | 76.9 | 69.5 | ||||||
Corporate tax & minorities | (191.6 | ) | (18.0 | ) | (17.9 | ) | |||
Net Profit | 292.8 | 58.9 | 51.6 | ||||||
Domestic Energy Busines
First Quarter 2007
(Unaudited)
Million Euros
| GENER | RENEW | DISTRIB | SUPPLY | CORP. | |||||||||||
Net sales | 848.9 | 203.4 | 373.1 | 445.4 | (235.7 | ) | |||||||||
Procurements | (316.9 | ) | (1.9 | ) | (419.9 | ) | 232.0 | ||||||||
Emission allowances | (8.0 | ) | |||||||||||||
Gross Margin | 524.0 | 203.4 | 371.2 | 25.5 | (3.7 | ) | |||||||||
Emission allowances | 2.3 | ||||||||||||||
Net operating expenses | (139.0 | ) | (41.1 | ) | (114.0 | ) | (12.4 | ) | (8.0 | ) | |||||
Net personnel expenses | (49.2 | ) | (10.3 | ) | (44.9 | ) | (5.3 | ) | (39.7 | ) | |||||
Personnel | (54.7 | ) | (12.4 | ) | (63.7 | ) | (5.3 | ) | (40.8 | ) | |||||
In-house work on fixed assets | 5.5 | 2.1 | 18.8 | 1.1 | |||||||||||
Net External Services | (89.8 | ) | (30.8 | ) | (69.1 | ) | (7.1 | ) | 31.7 | ||||||
External services | (98.8 | ) | (35.3 | ) | (86.5 | ) | (7.1 | ) | 33.9 | ||||||
Other operating revenues | 9.0 | 4.5 | 17.4 | (2.2 | ) | ||||||||||
TAX | (18.6 | ) | (2.3 | ) | (30.6 | ) | 8.6 | (1.1 | ) | ||||||
EBITDA | 368.7 | 160.0 | 226.6 | 21.7 | (12.8 | ) | |||||||||
Amortisation and provisions | (117.5 | ) | (53.9 | ) | (50.3 | ) | (1.0 | ) | (7.5 | ) | |||||
EBIT / Operating Profit | 251.2 | 106.1 | 176.3 | 20.7 | (20.3 | ) | |||||||||
Financial Result | (33.8 | ) | (31.3 | ) | (23.3 | ) | .1 | (54.2 | ) | ||||||
Companies using equity method | .2 | .7 | (.1 | ) | |||||||||||
Income from non-current assets | (.1 | ) | 7.4 | 2.4 | |||||||||||
PROFIT BEFORE TAXES | 217.5 | 74.8 | 161.1 | 20.7 | (72.1 | ) | |||||||||
Corporate tax & minorities | (69.7 | ) | (27.9 | ) | (51.8 | ) | (6.7 | ) | 25.0 | ||||||
Net Profit | 147.8 | 46.9 | 109.3 | 14.0 | (47.1 | ) | |||||||||
| First Quarter 2006 | |||||||||||||||
| Million Euros | |||||||||||||||
| GENER | RENEW | DISTRIB | SUPPLY | CORP. | |||||||||||
Net sales | 1,345.8 | 215.2 | 265.5 | 618.8 | (396.8 | ) | |||||||||
Procurements | (556.6 | ) | (628.9 | ) | 389.8 | ||||||||||
Emission allowances | (107.4 | ) | |||||||||||||
Gross Margin | 681.8 | 215.2 | 265.5 | (10.1 | ) | (7.0 | ) | ||||||||
Emission allowances | 6.2 | ||||||||||||||
Net operating expenses | (118.5 | ) | (30.6 | ) | (124.9 | ) | (13.6 | ) | 11.6 | ||||||
Net personnel expenses | (53.1 | ) | (5.3 | ) | (51.3 | ) | (11.1 | ) | (35.4 | ) | |||||
Personnel | (57.8 | ) | (6.5 | ) | (69.5 | ) | (11.1 | ) | (36.8 | ) | |||||
In-house work on fixed assets | 4.7 | 1.2 | 18.2 | 1.4 | |||||||||||
Net External Services | (65.4 | ) | (25.3 | ) | (73.6 | ) | (2.5 | ) | 47.0 | ||||||
External services | (73.1 | ) | (27.7 | ) | (90.3 | ) | (9.2 | ) | 57.6 | ||||||
Other operating revenues | 7.7 | 2.4 | 16.7 | 6.7 | (10.6 | ) | |||||||||
TAX | (18.0 | ) | (1.9 | ) | (24.4 | ) | (3.6 | ) | (.9 | ) | |||||
EBITDA | 551.5 | 182.7 | 116.2 | (27.3 | ) | 3.7 | |||||||||
Amortisation and provisions | (96.4 | ) | (41.7 | ) | (64.7 | ) | (2.1 | ) | (6.9 | ) | |||||
EBIT / Operating Profit | 455.1 | 141.0 | 51.5 | (29.4 | ) | (3.2 | ) | ||||||||
Financial Result | (20.0 | ) | (21.2 | ) | (18.1 | ) | 1.0 | (73.6 | ) | ||||||
Companies using equity method | (2.0 | ) | .6 | ||||||||||||
Income from non-current assets | .3 | 2.2 | |||||||||||||
PROFIT BEFORE TAXES | 433.4 | 119.8 | 34.0 | (28.4 | ) | (74.6 | ) | ||||||||
Corporate tax & minorities | (146.9 | ) | (44.0 | ) | (10.9 | ) | 10.1 | .2 | |||||||
Net Profit | 286.5 | 75.8 | 23.1 | (18.3 | ) | (74.4 | ) | ||||||||
STATEMENT OF SOURCES & USES OF FUNDS
First Quarter 2007
(Unaudited)
Million Euros
| Jan - March 2007 | Jan - March 2006 | Difference | |||||||
EBIT | 795.0 | 788.0 | 7.0 | ||||||
Amortisation | 284.0 | 249.0 | 35.0 | ||||||
Provisions | 9.0 | 19.0 | (10.0 | ) | |||||
Provision for the pension funds | (11.0 | ) | 10.0 | (21.0 | ) | ||||
Operating Cash Flow | 1,077.0 | 1,066.0 | 11.0 | ||||||
Interest paid | (183.0 | ) | (195.0 | ) | 12.0 | ||||
Interest received | 39.0 | 41.0 | (2.0 | ) | |||||
Dividends received from affiliates | .0 | 5.0 | (5.0 | ) | |||||
Minority interests | (9.0 | ) | (6.0 | ) | (3.0 | ) | |||
Tax | (193.0 | ) | (221.0 | ) | 28.0 | ||||
Gross Cash Flow | 731.0 | 690.0 | 41.0 | ||||||
Dividends paid | (406.0 | ) | (331.0 | ) | (75.0 | ) | |||
Retained Cash Flow | 325.0 | 359.0 | (34.0 | ) | |||||
Investments | (506.0 | ) | (435.0 | ) | (71.0 | ) | |||
Fixed asset disposals | (9.0 | ) | 2.0 | (11.0 | ) | ||||
Financial asset disposals | .0 | .0 | .0 | ||||||
Taxes on investment activities | (1.0 | ) | (1.0 | ) | .0 | ||||
Pension payments & other | (56.0 | ) | (54.0 | ) | (2.0 | ) | |||
Total Cash Flow Applications | (572.0 | ) | (488.0 | ) | (84.0 | ) | |||
Capital subsidies received | 43.0 | 29.0 | 14.0 | ||||||
Change in working capital | (38.0 | ) | (450.0 | ) | 412.0 | ||||
Change in debt | 242.0 | 549.0 | (307.0 | ) | |||||
Change in consolidation perimeter | 4.0 | 2.0 | 2.0 | ||||||
| .0 | |||||||||
Change in Gross Debt | 246.0 | 551.0 | (305.0 | ) |
 1 First Quarter 2007 First Quarter 2007 Results Results 26 26 th April 2007 April 2007 Exhibit 99.3 |
 2 DISCLAIMER This document has been prepared by Iberdrola, S.A. (the “Company”) solely for use during the presentation corresponding to the First Quarter 2007 Results. The information and any forward looking statements contained in this document have not been independently verified and no representation or warranty express of implied is made as to, and no reliance should be placed on, the fairness, accuracy, completeness or correctness of the information or opinions contained herein. None of the Company, or any of its advisors or representatives shall have any liability whatsoever (in negligence or otherwise) for any loss howsoever arising from any use of this document or its contents or otherwise arising in connection with this document. This document does not constitute an offer or invitation to purchase or subscribe for any securities in accordance with the Spanish Securities Market Law (Law 24/1988, as amended), Royal Decree Law 5/2005 and/or Royal Decree 1310/2005 and the rules and regulations made there under. Furthermore, this document does not constitute an offer to purchase, sell or exchange or the solicitation of an offer to purchase, sell or exchange any securities or the solicitation of any vote or approval in any other jurisdiction. Neither this document nor any part of it shall form the basis of or be relied in connection with any contract or commitment whatsoever. Legal Note |
 3 Legal Note IMPORTANT INFORMATION This communication does not constitute an offer to purchase, sell or exchange or the solicitation of an offer to purchase, sell or exchange any securities. The shares of Iberdrola, S.A. may not be offered or sold in the United States of America except pursuant to an effective registration statement under the Securities Act or pursuant to a valid exemption from registration. FORWARD-LOOKING STATEMENTS This communication contains forward-looking information and statements about Iberdrola, S.A. and otherwise, including financial projections and estimates and their underlying assumptions, statements regarding plans, objectives and expectations with respect to future operations, capital expenditures, synergies, products and services, and statements regarding future performance. Forward-looking statements are statements that are not historical facts and are generally identified by the words “expects,” “anticipates,” “believes,” “intends,” “estimates” and similar expressions. Although Iberdrola, S.A. believes that the expectations reflected in such forward-looking statements are reasonable, investors and holders of Iberdrola, S.A. shares are cautioned that forward-looking information and statements are subject to various risks and uncertainties, many of which are difficult to predict and generally beyond the control of Iberdrola, S.A., that could cause actual results and developments to differ materially from those expressed in, or implied or projected by, the forward-looking information and statements. These risks and uncertainties include those discussed or identified in the public documents sent by Iberdrola, S.A. to the Comisión Nacional del Mercado de Valores. Forward-looking statements are not guarantees of future performance. They have not been reviewed by the auditors of Iberdrola, S.A. You are cautioned not to place undue reliance on the forward-looking statements, which speak only as of the date they were made. All subsequent oral or written forward-looking statements attributable to Iberdrola, S.A. or any of its members, directors, officers, employees or any persons acting on its behalf are expressly qualified in their entirety by the cautionary statement above. All forward-looking statements included herein are based on information available to Iberdrola, S.A. on the date hereof. Except as required by applicable law, Iberdrola, S.A. does not undertake any obligation to publicly update or revise any forward-looking statements, whether as a result of new information, future events or otherwise. |
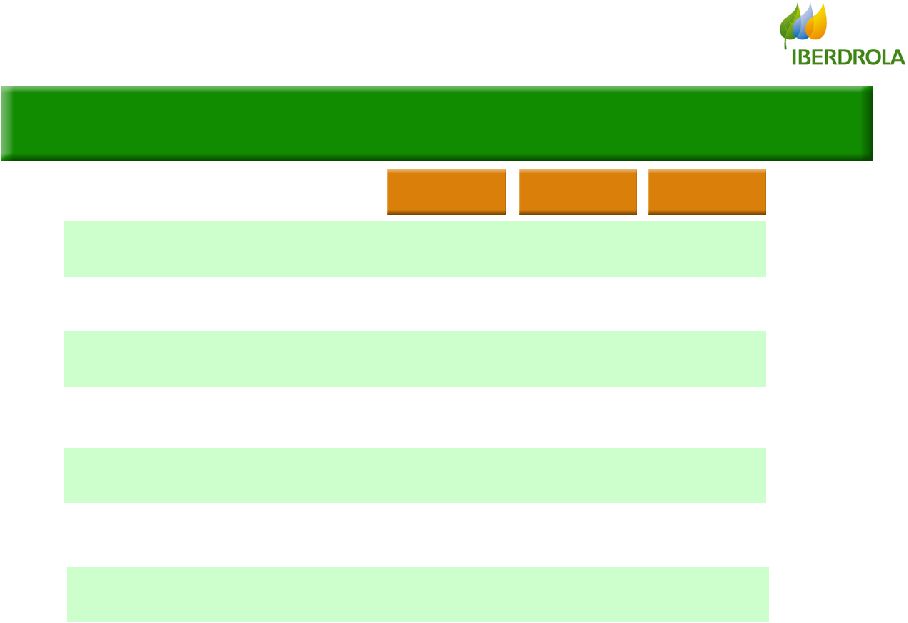
 4 Agenda Highlights of the Period Highlights of the Period Analysis of Results Analysis of Results Conclusion Conclusion Consolidated Consolidated By Business By Business |
 5 Highlights of the period Net Profit up 13.6% to Eur 458.2 MM Higher production (+6.9%) with low cost & emissions-free technologies … in a difficult scenario of low prices & moderate demand growth Efficient management to provide positive results … New transactions in wind energy expansion in the US & Europe Successful closing of ScottishPower transaction 99.5% and 97.6% of the attending capital of Iberdrola and ScottishPower, respectively, voted in favour |
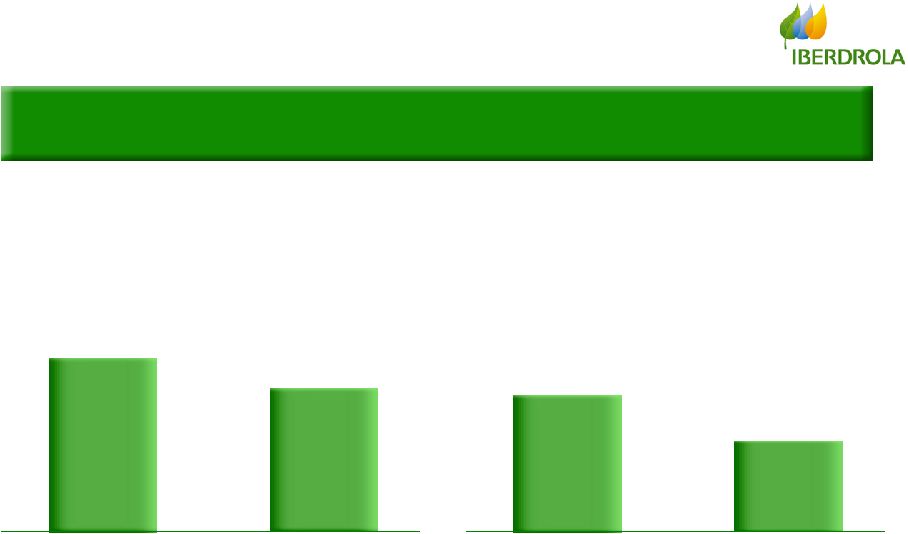
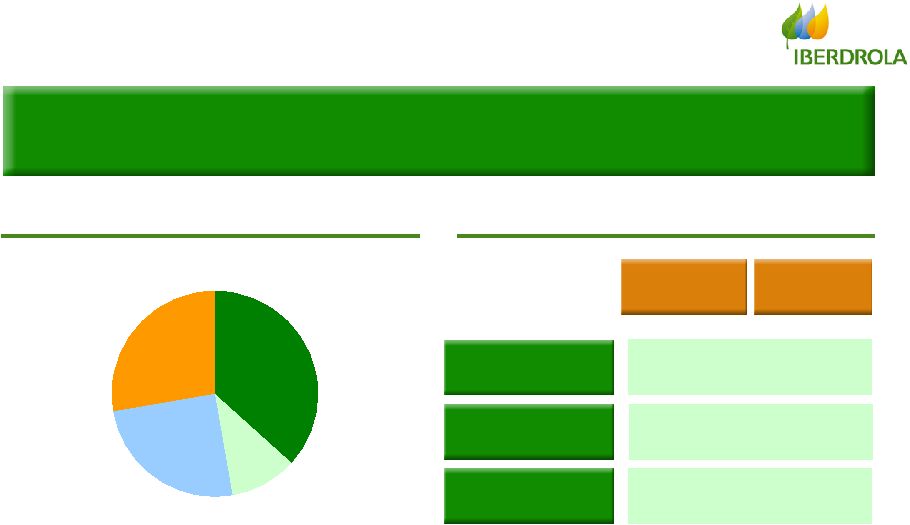
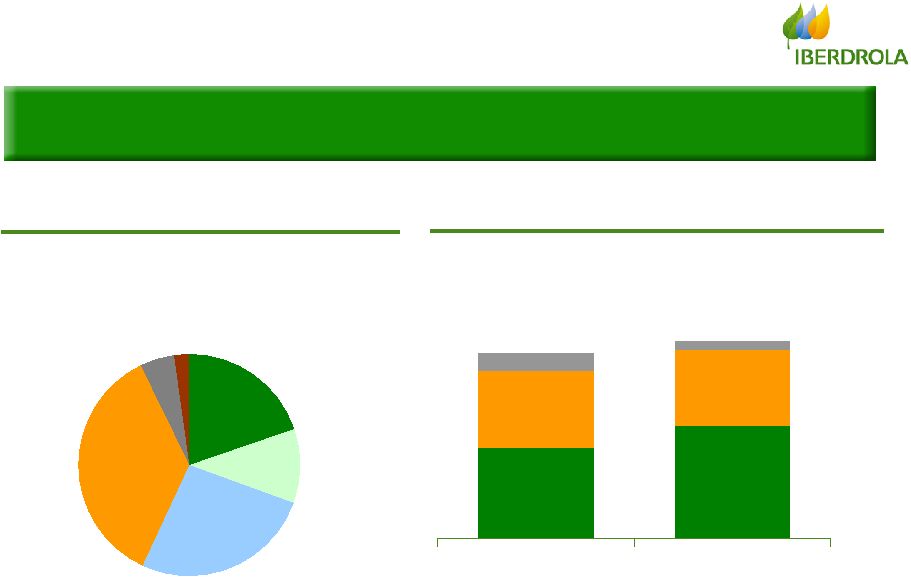 6 24,752 GWh (+6.9%) Production Mix Q1 2007 Production Mix Q1 2007 Nuclear Nuclear 26% 26% Comb. Comb. Cycles Cycles 36% 36% Coal 5% Coal 5% Fuel Fuel 0% 0% Hydro Hydro 20% 20% Wind Wind 11% 11% Cogen. 2% Cogen. 2% . 2% Production - Group Q1 2006 Q1 2007 Combined Combined Cycles Cycles Emission-free* 24,752 24,752 23,154 23,154 Growth in Production Growth in Production -2% -2% -2% +25% +25% +25% +6.9% +6.9% … … boosted by low emission technologies … boosted by low emission technologies … -46% -46% -46% 46% Coal + Fuel Coal + Fuel * Hydro + Nuclear + Wind GWh GWh |
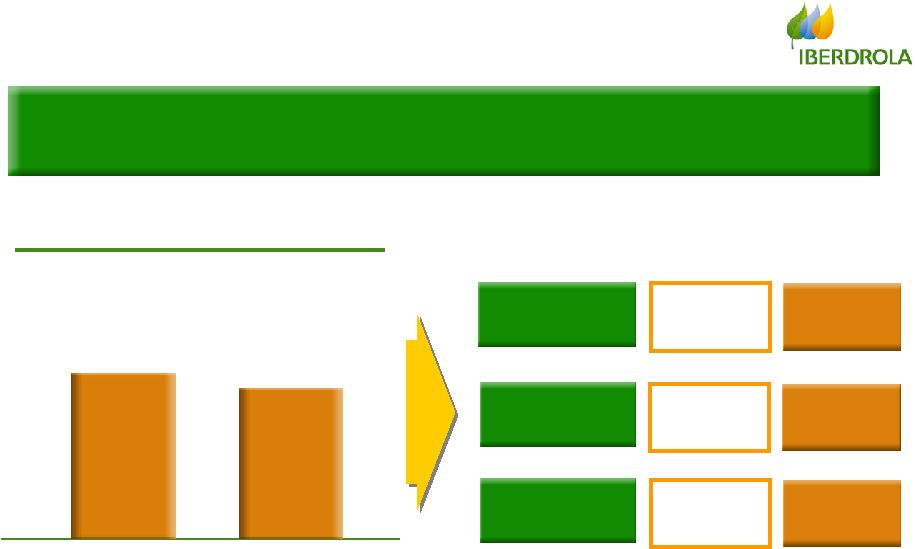
 7 Increasing production in Spain by +1.8% with low cost & emissions-free technologies … Production - Spain … … vs. -1.6% of the rest of the sector* vs. -1.6% of the rest of the sector* * Excluding Iberdrola Ordinary Regime -0.6% Special Regime +16.3% +2,442 Hydro -1,339 Nuclear -153 -485 Coal -551 Fuel +349 Wind + Mh +55 Cogeneration C. Cycles GWh GWh |
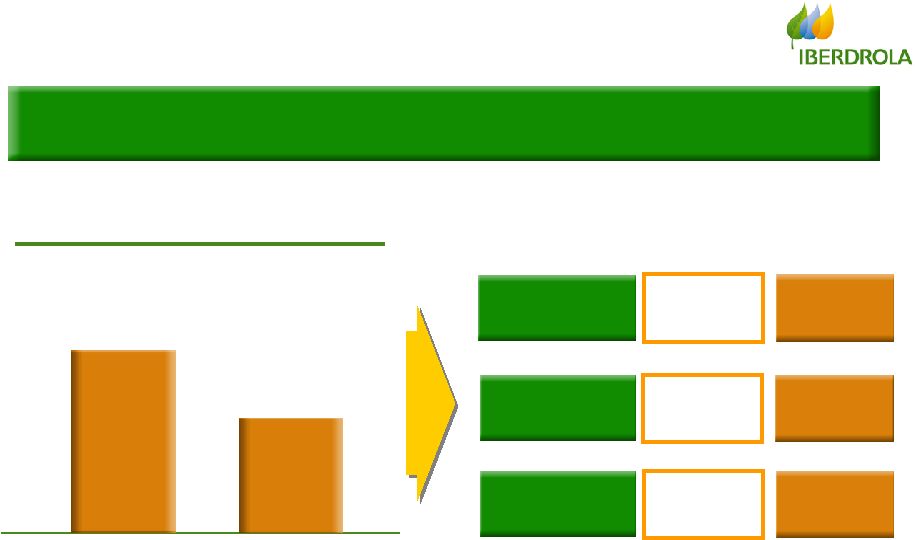
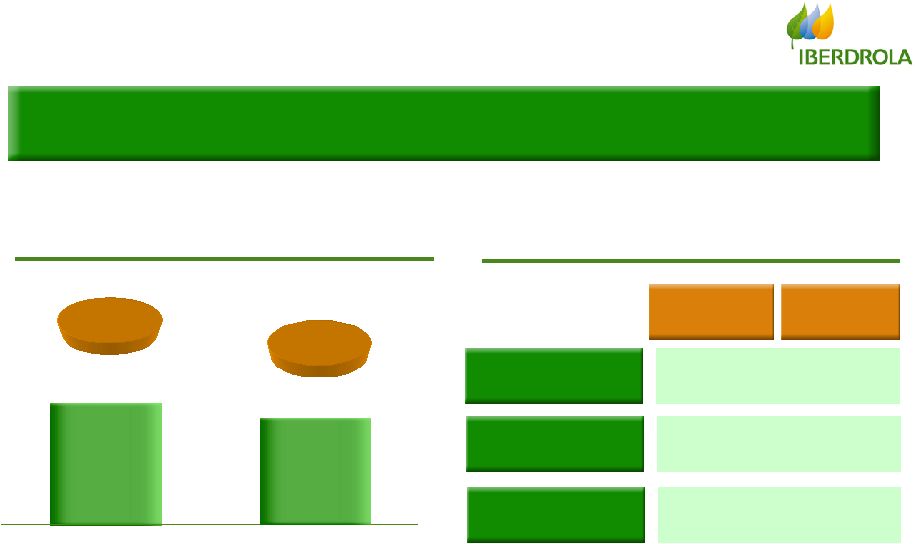
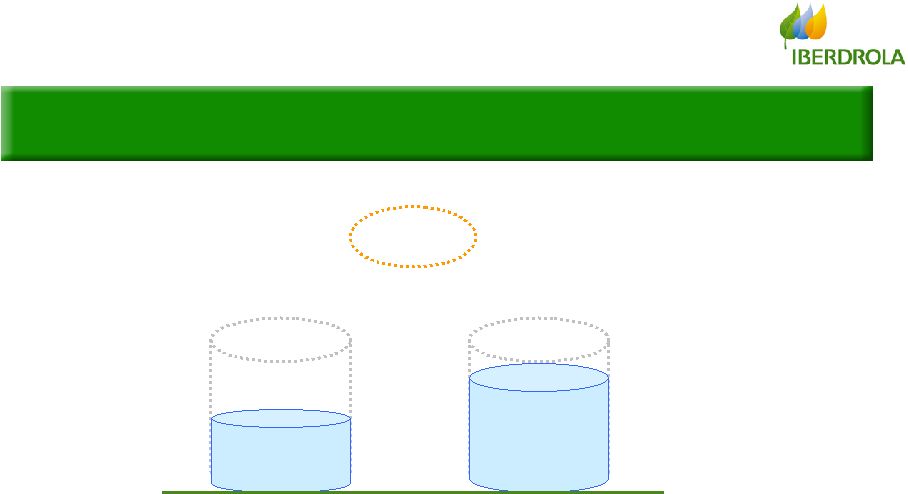 8 Increasing hydro reserves … Production - Spain 64% 55% 6,170 GWh 7,193 GWh Q1 2006 As of today … … points out for sustainable results in Generation points out for sustainable results in Generation +17% +17% |
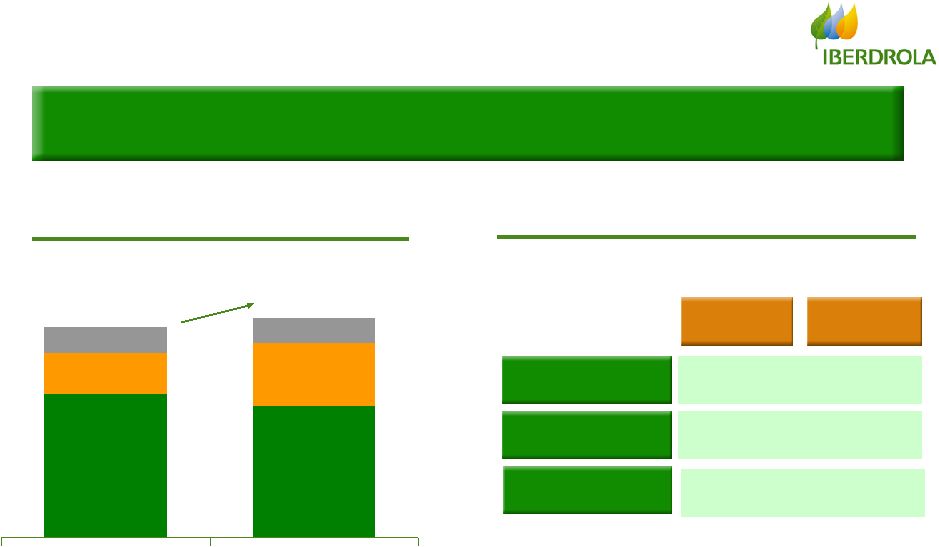
   9 Q1 2006 CO CO 2 2 emissions - emissions - Group Group (gr./kWh) (gr./kWh) Emissions 76% of Q1 ’07 production in Spain is emissions-free Q1 2007 1/3 of the emissions compared to 1/3 of the emissions compared to the rest of the sector (378* gr/kWh) the rest of the sector (378* gr/kWh) Q1 2006 Q1 2007 CO CO 2 2 emissions - emissions - Spain Spain (gr./kWh) (gr./kWh) 247 188 -24.2% -24.2% 212 133 -37.1% -37.1% * Excluding Iberdrola |
 10 Q1 2007 Results Efficient management of assets … Hydro assets + Provides Iberdrola with a balanced generation mix Wind energy assets + Flexibility of gas contracts … … to optimize results in all scenarios to optimize results in all scenarios |
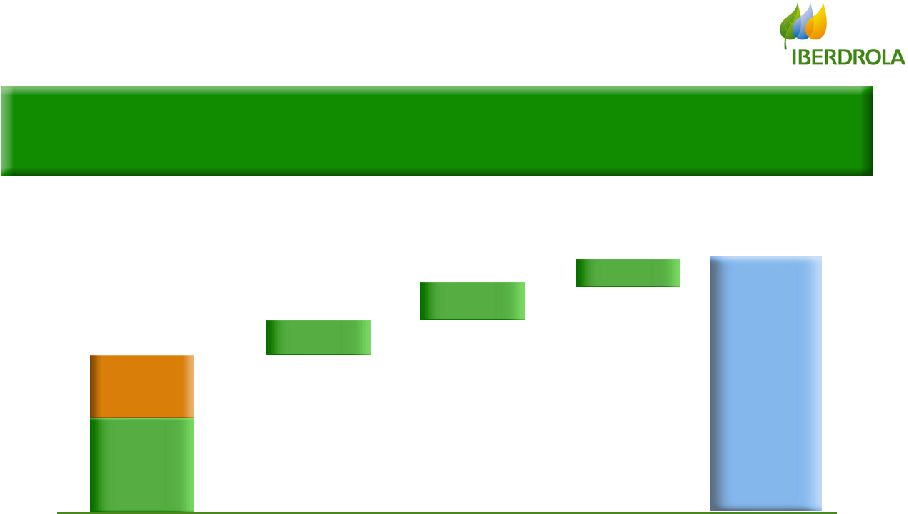
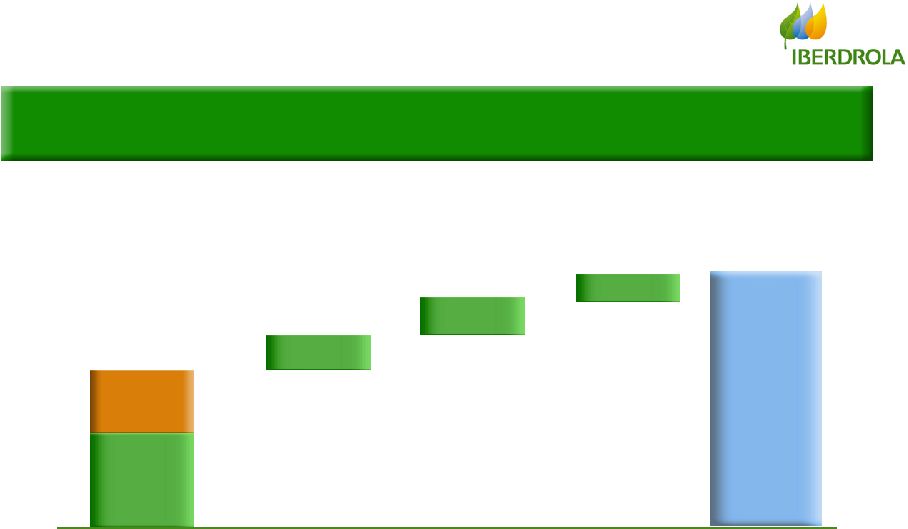
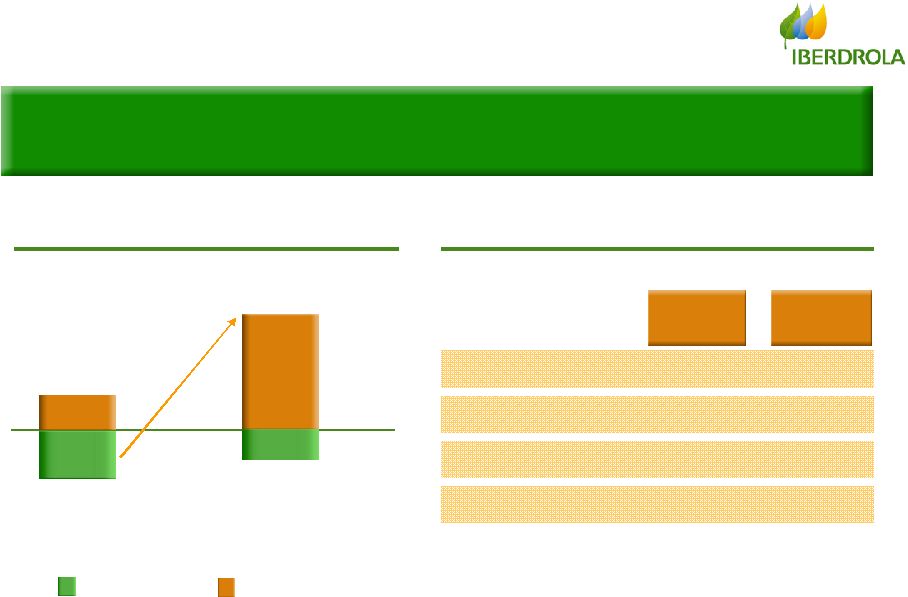
 11 EBITDA - Group EBITDA up 2.9% to Eur 1,087.1 MM … compensate Distribution Supply & Gas International Non-energy Generation Spain Wind energy business … … in a difficult scenario of low prices & in a difficult scenario of low prices & moderate demand growth moderate demand growth |
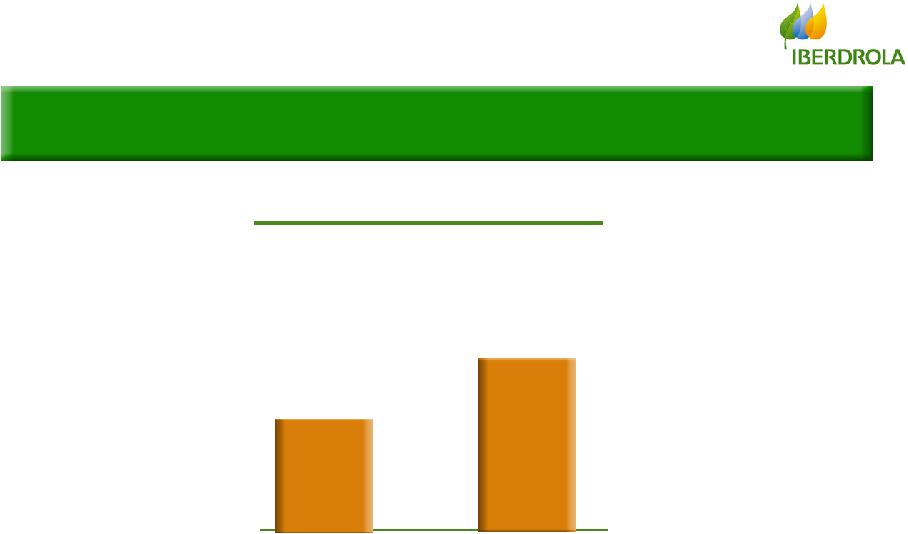 12 Net Profit +13.6% to Eur 458.2 MM … Net Profit 403.2 +13.6% +13.6% 458.2 Net Profit (Eur Net Profit (Eur MM) MM) Q1 2006 Q1 2007 … … in line with double digit growth in line with double digit growth expectations for 2007 expectations for 2007 |
 13 Consolidating the international expansion through new wind energy transactions … Internationalization … … in US & Europe, in countries in US & Europe, in countries with high growth potential with high growth potential USA: acquisition of CPV • ~1,100 MW to become operational between 2008-2011 • Agreement with GE for the supply of turbines • USD 75 MM for 100% of equity Italy: 50% joint venture with API • 350 MW to become operational between 2008-2009 Greece: taking full control of Rokas • Increasing stake to 52.7% |
 14 Agenda Highlights of the Period Highlights of the Period Analysis of Results Analysis of Results Conclusion Conclusion Consolidated Consolidated By Business By Business |
 15 Gross Margin Change % Q1 2007 Net Op. Expenses Eur MM Q1 2006 Income Statement - Group EBITDA Operating Profit (EBIT) Net Profit Non-recurrent assets +Equity Income +2.9 1,087.1 1,056.6 +0.8 794.8 788.4 N/M 29.3 5.7 +13.6 458.2 403.2 +5.3 1,572.4 1,493.9 Financial Result +0.1 -163.5 -163.4 -439.3 +12.3 -391.2 Positive results in a difficult scenario Iberdrola Iberdrola estimates Eur estimates Eur 26.5 MM of tariff insufficiency 26.5 MM of tariff insufficiency |
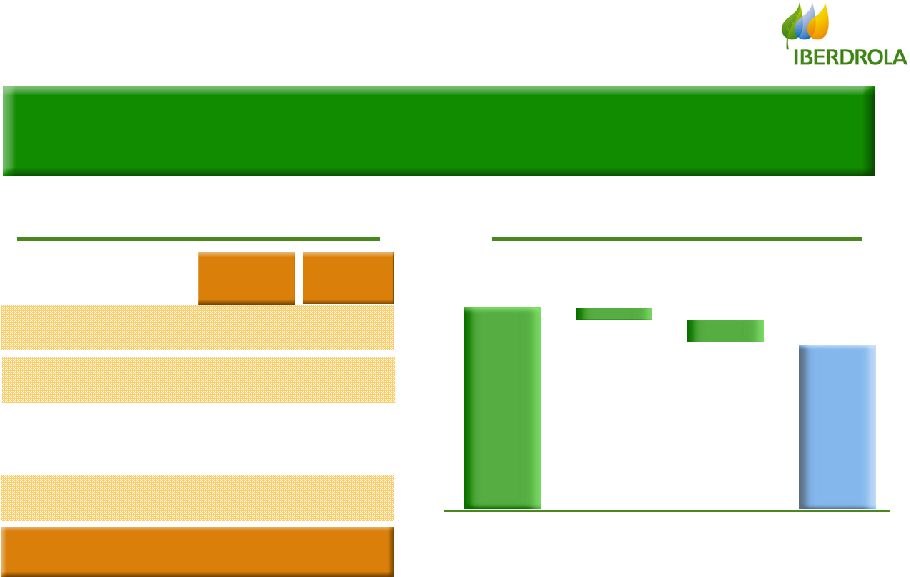
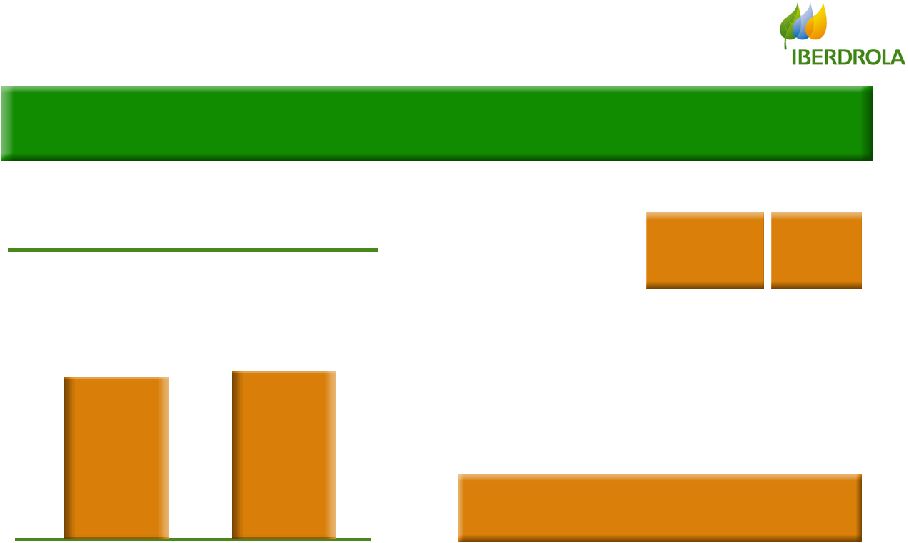
 16 Net Sales Net Sales fall by 8.8% to Eur 2,716.6 MM driven by Domestic Energy … … … due to lower prices in Generation & Wind due to lower prices in Generation & Wind Net Sales Net Sales Q1 2006 Q1 2007 -261.8 MM -261.8 MM 2,978.4 2,716.6 +36.2% +4.6% -20.2% 470.1 470.1 611.4 611.4 1,635.1 1,635.1 Eur MM Non-energy International International Domestic Domestic Energy Energy |
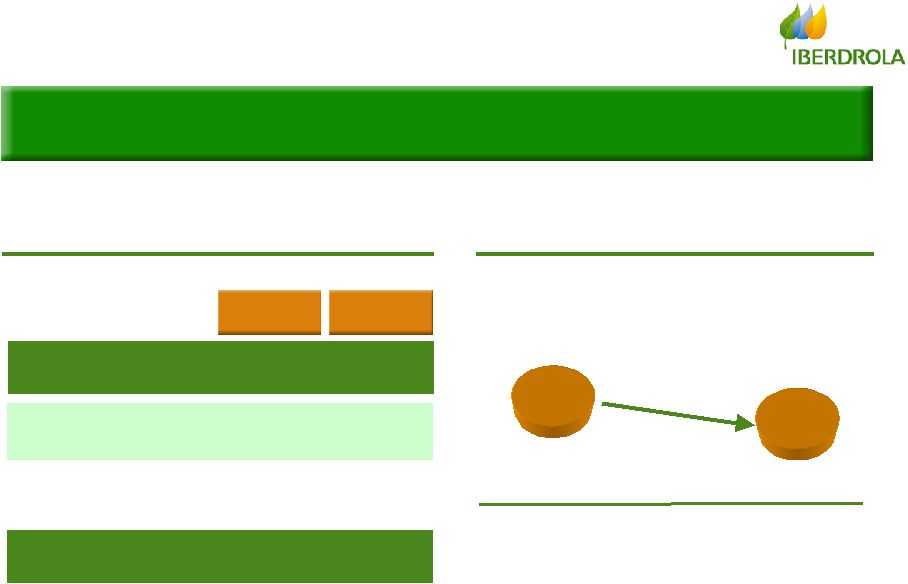
 17 Procurement Costs Procurements decrease 17.5% to Eur 1,136.1 MM … Eur MM Procurements Procurements Q1 2006 Q1 2007 -241.0 MM -241.0 MM 1,377.1 1,136.1 Non-energy Non-energy -energy energy +47.8% International International -11.3% Domestic Domestic Energy Energy -36.3% 284.5 284.5 344.9 344.9 506.7 506.7 … … due to the different production mix in Generation due to the different production mix in Generation Spain & lower procurements in International Spain & lower procurements in International |
 18 Gross Margin - Group Eur MM Domestic Energy * (ex-Wind) 917.0 (-1.4%) -18.2% -18.2% Non Energy Gross Margin 1,572.4 +5.3% +5.3% 185.5 266.5 Internat. 203.4 Wind Gross Margin +5.3% to Eur 1,572.4 MM, driven by Distribution, Supply & Gas, International and Non-energy +21.6% +21.6% -5.5% -5.5% +36.0% +36.0% Generation Spain & Wind affected by lower prices Generation Spain & Wind affected by lower prices * Generation + Supply + Gas + Distribution +39.8% +39.8% Generation, Supply & Gas Distribution |
 19 Recurrent Net Op. Expenses +4.2%, less than Gross Margin, vs. a 12.3% growth of Reported Net Op. Exp. … Net Operating Expenses - Group Net Op. Exp. by item Net Op. Exp. by item % vs. Q1 2006 Q1 ‘07 … … due to non-recurrent expenses & due to non-recurrent expenses & the 2007 AGM attendance premium the 2007 AGM attendance premium Reported Net Op. Exp. 439.3 +12.3% +12.3% Recurrent Net Op. Exp. 407.6 +4.2% +4.2% -17.6 Other non-recurrent -14.1 AGM attendance premium Recurrent Net Op. Exp. Recurrent Net Op. Exp. Eur MM Net Personnel Total 439.3 +12.3% 202.9 -4.0% Rec. N. Ext. Services 204.7 +13.8% Rep. Net Ext. Servs. 236.4 +31.5% Other non-recurrent 17.6 AGM attendance premium 14.1 |
 20 EBITDA - Group EBITDA +2.9% to Eur 1,087.1 MM Eur MM Domestic Energy * (ex-Wind) 604.1 (-6.2%) -25.5% -25.5% Non Energy EBITDA 1,087.1 +2.9% +2.9% 122.5 200.5 Internat. 160.0 Wind +40.0% +40.0% -12.4% -12.4% +41.0% +41.0% +95.0% +95.0% Generation, Supply & Gas Distribution * Generation + Supply + Gas + Distribution |
   21 EBIT - Group Operating Profit (EBIT) up 0.8% to Eur 794.8 MM … D & A % vs. Q1 2006 Total Q1 2007 292.3 +9.0% 283.8 +13.8% Provisions 8.5 -54.5% EBIT EBIT Q1 2006 Q1 2007 +6.4 MM +6.4 MM 788.4 794.8 Eur MM … … driven by 13.8% rise in D&A driven by 13.8% rise in D&A due to new plants in operation due to new plants in operation |
  22 Flat evolution of the Financial Result: +0.1% … Financial Result -163.4 -163.4 -163.5 -163.5 Q1 2006 Q1 2006 Q1 2007 Q1 2007 +0.1 MM +0.1 MM … … due to the control of the average cost of debt due to the control of the average cost of debt Financial Result (Eur Financial Result (Eur MM) MM) Average Cost of Debt Average Cost of Debt Q1 2006 Q1 2006 Q1 2007 Q1 2007 4.65% 4.65% 4.6% 4.6% |
 23 Leverage falls to 54.1% vs. 54.7% in Q1 2006 Leverage Q1 2006 Q1 2007 Leverage Leverage 54.1% Ex-tariff insufficiency impact Net Debt & Equity (Eur Net Debt & Equity (Eur MM) MM) Q1 2006 Tariff insufficiency Tariff insufficiency Adjusted Net Debt Adjusted Net Debt ex-insufficiency ex-insufficiency Equity Equity 1,583 1,583 11,448 11,448 9,486 9,486 Q1 2007 606 606 12,454 12,454 10,564 10,564 Adjusted Net Debt Adjusted Net Debt 13,031 13,031 13,061 13,061 54.7% |
   24 Profit Before Taxes up 4.7% to Eur 660.6 MM PBT, Net profit & FFO 403.2 458.2 Q1 2006 Q1 2007 Profit Before Taxes Profit Before Taxes Q1 2006 Q1 2007 630.7 +4.7% +4.7% 660.6 Eur MM Sustainable lower tax rate drives higher increase in Net Profit (+13.6%) FFO* up 8.3% to Eur 721.2 MM Net Profit Net Profit +13.6% +13.6% Eur MM Funds from Operations Funds from Operations Q1 2006 Q1 2007 665.7 +8.3% +8.3% 721.2 Eur MM * Net Profit + Depreciation & Amortization – Equity Income – Non Recurrent Results |
 25 Agenda Highlights of the Period Highlights of the Period Analysis of Results Analysis of Results Conclusion Conclusion Consolidated Consolidated By Business By Business |
 26 Gross Margin -23.1% as lower procurement costs partially compensate pool prices Financial highlights (Eur Financial highlights (Eur MM) MM) Operating highlights Operating highlights Results by Business Generation Business Gross Margin EBITDA -23.1% 524.0 -33.1% 349.0 Q1 2007 Net Op. Exp. +17.3% -139.0 % vs. Q1 2006 EBITDA affected by Eur EBITDA affected by Eur 17.6 MM of Non-recurrent Expenses 17.6 MM of Non-recurrent Expenses Similar production: -0.6% Energy prices -40.9% Lower CO 2 average cost: Eur 2.95/Tn Lower procurements cost: -43.1%* * Excluding CO2 cost ** Iberdrola’s estimates Lower capacity payments: Eur 27.8 MM** Compensated by Fuel Cost (Eur/MWh) Fuel Cost (Eur/MWh) Q1 ‘07 38.4 38.4 Avg. Fuel Cost * Q1 ‘06 38.5 38.5 % -0.1% -0.1% 0.1% |
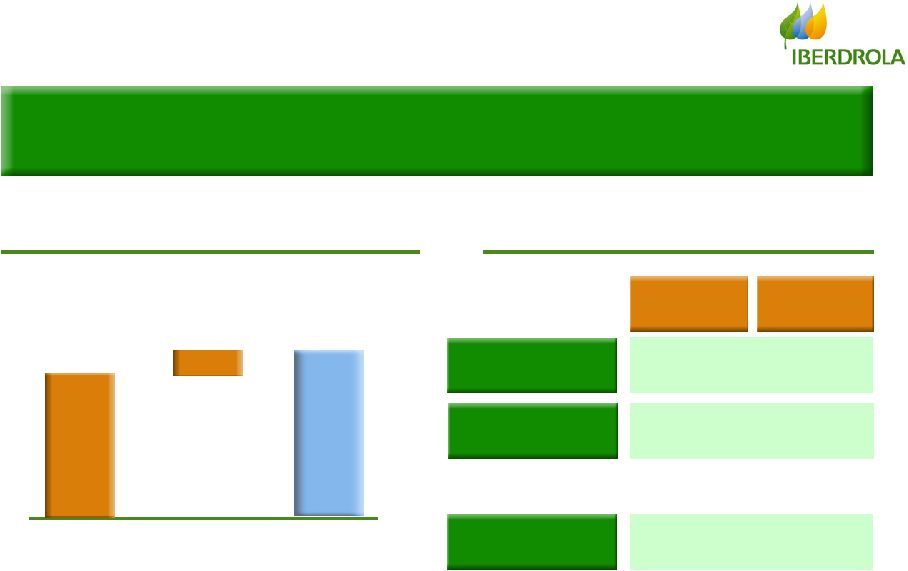
 27 Supply + Gas Gross Margin rises 35.6 MM to Eur 25.5 MM driven by optimization of gas strategy Results by Business Supply & Gas Supply + Gas Supply + Gas Gross Margin (Eur Gross Margin (Eur MM) MM) Q1 ‘06 Elect. Supply Gas Q1 ‘07 8.5 8.5 30.7 30.7 -5.2 -5.2 -18.6 -18.6 -10.1 25.5 +35.6 MM +35.6 MM EBITDA Gross Margin Q1 2007 25.5 21.7 -10.1 -27.2 Q1 2006 Net Op. Exp. -12.4 -13.6 Taxes 8.6 -3.6 Financial highlights Financial highlights EBITDA improves Eur EBITDA improves Eur 48.9 MM vs. Q1 2006 48.9 MM vs. Q1 2006 Eur MM |
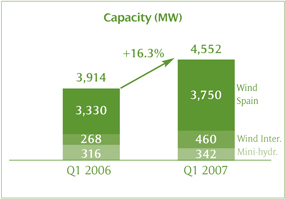
 28 Results by Business – Wind + Mh Q1 2006 4,552 4,552 Q1 2007 + 638 MW + 638 MW Capacity (MW) Capacity (MW) Wind Spain Mini-hydro 3,751 459 Q1 2006 2,253 2,253 2,725 2,725 Q1 2007 +21.0% +21.0% Production (GWh) Production (GWh) Capacity: +16.3% to 4,552 MW Production: +21.0% to 2,725 GWh International Wind: 10.1% of installed capacity & production International Wind: 10.1% of installed capacity & production 342 Wind Intl. 3,914 3,914 3,330 268 316 Wind Spain Mini-hydro 2,304 274 147 Wind Intl. 1,942 151 160 |
 29 5.5% decrease in Gross Margin due to lower prices (-21.8%) to 74.7 Eur/MWh Results by Business – Wind + Mh Financial highlights Financial highlights -5.5% 203.4 EBITDA -12.4% 160.0 Gross Margin Q1 2007 Eur MM Net Op. Exp. +34.3% -41.1 34.3% increase in Net Op. Expenses 34.3% increase in Net Op. Expenses due to international expansion due to international expansion EBITDA (EUR MM) EBITDA (EUR MM) % vs. Q1 2006 +405.2% -8.0 - International 148.0 12.0 Domestic International -14.5% +26.3% 160.0 -12.4% Total |
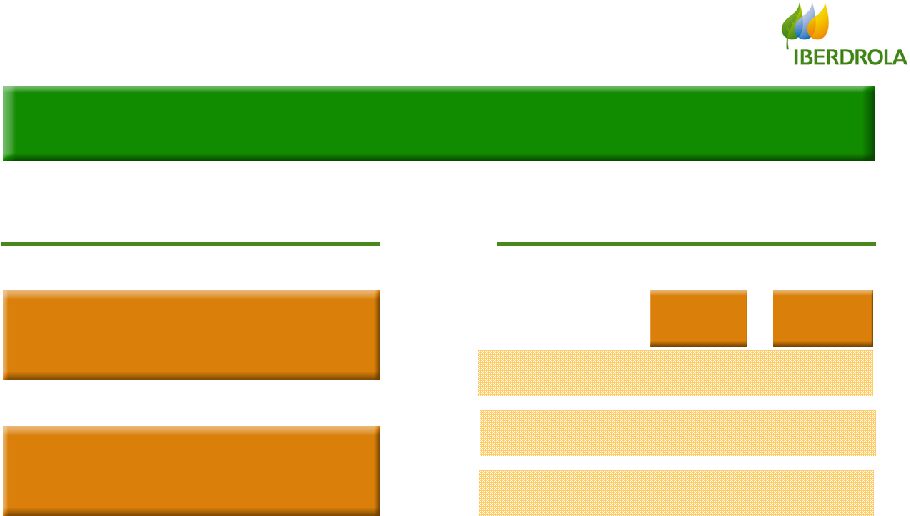 30 Results by Business - Distribution Gross Margin up 39.8% to Eur 371.2 MM Eur MM EBITDA Gross Margin Q1 2007 371.2 226.5 +39.8% +95.0% % vs. Q1 2006 Higher regulated revenues and Higher regulated revenues and lower Net Operating Expenses lower Net Operating Expenses Net Op. Exp. -114.0 -8.7% Operating Highlights Operating Highlights No impact from RDL 3/2006 Higher regulated revenues in 2007 tariff Financial Highlights Financial Highlights |
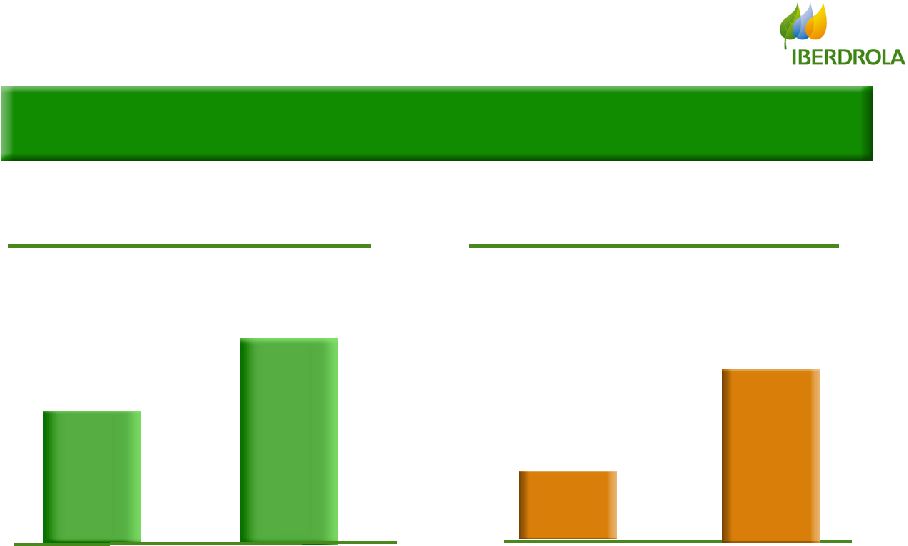
  31 Results by Business – International …and 50.4% in local currency …and 50.4% in local currency International EBITDA grows 41.0% to Eur 200.5 MM … Financial Highlights Financial Highlights EBITDA Gross Margin Q1 2007 Eur MM Net Op. Exp. +36.0% 266.5 +23.0% -63.7 +41.0% 200.5 213.8 200.5 EBITDA in local currency Reported EBITDA +50.4% +41.1% Effect of currency evolution Effect of currency evolution % vs. Q1 2006 |
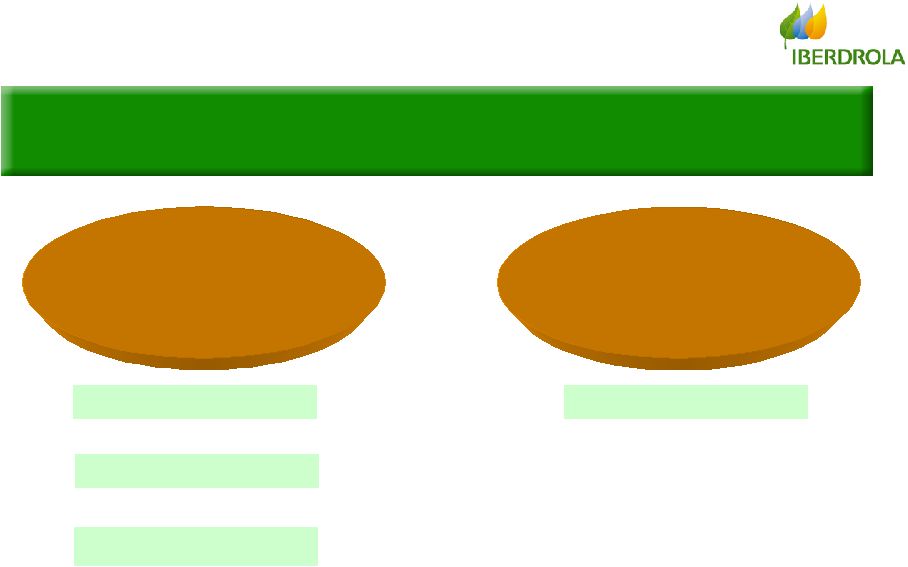
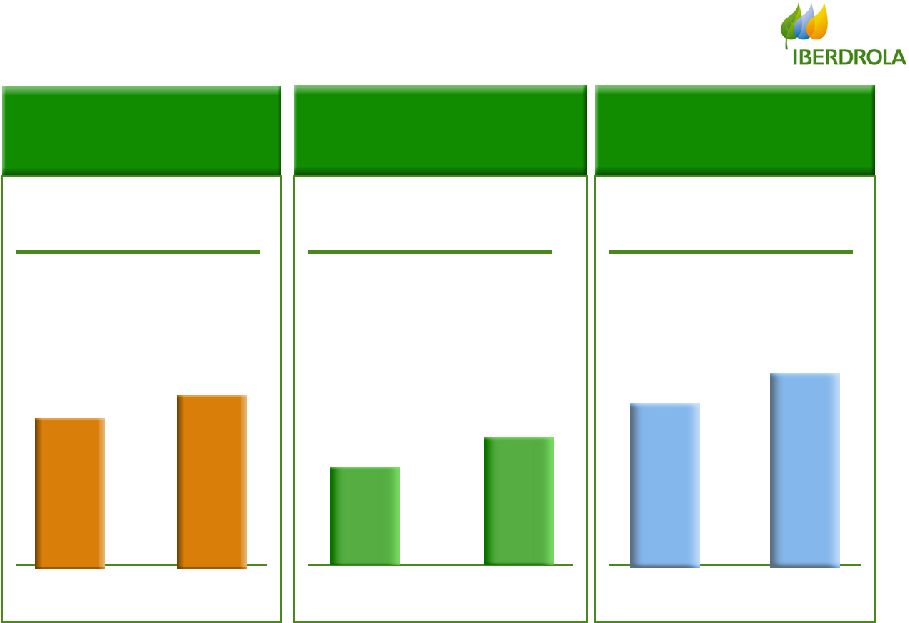
      32 Results by Business - International Operating Highlights Operating Highlights International accounts for 18.4% of total EBITDA Brazil Mexico-Guatemala Contribution to financial statements 119.1 EBITDA (Eur MM) 81.4 EBITDA (Eur MM) As a % of Debt As a % of Equity As a % of Debt As a % of Equity +6.5% demand Higher tariffs +24.2% more production (Altamira V; 1,121 MW) High availability and efficiency Business Evolution 4.6% 9.8% 7.9% 8.1% -4.4% exchange rate -8.6% exchange rate |
 33 EBITDA up 40.0% to Eur 122.5 MM, driven by strong growth in Real Estate Results by Business Non energy + Engineering Financial Highlights (Eur Financial Highlights (Eur MM) MM) +21.6% 185.5 Q1 2007 EBITDA Gross Margin Net Op. Exp. -4.0% -61.0 +40.0% 122.5 % vs. Q1 2006 Over Eur Over Eur 6.0 Bn* estimated market value of stakes in listed & 6.0 Bn* estimated market value of stakes in listed & non-energy companies and of Real Estate; Eur non-energy companies and of Real Estate; Eur 3.5 Bn 3.5 Bn of capital gains** of capital gains** Breakdown of Gross Margin Breakdown of Gross Margin Engineering & Construction Iberdrola Inmobiliaria IBV Other Services * Does not include Engineering & Construction ** Pre-tax 37% 10% 25% 28% |
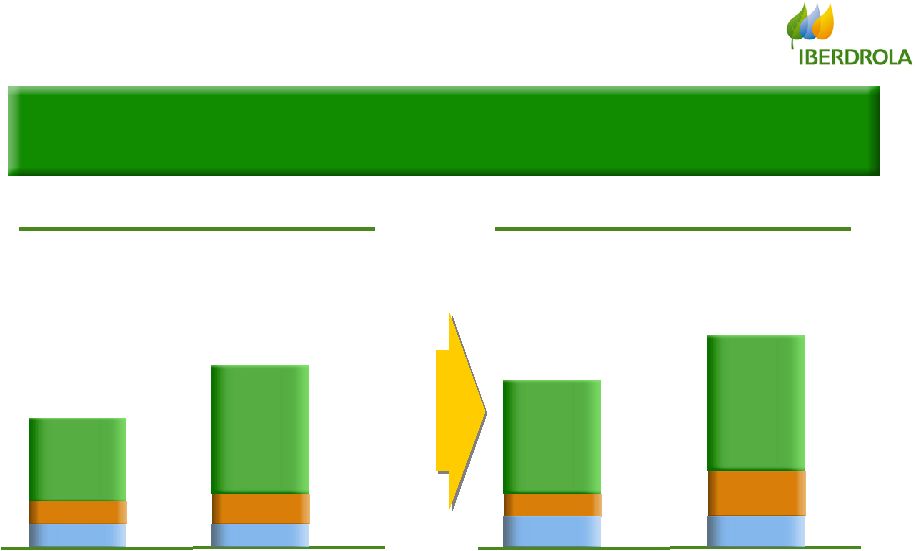
 34 Iberdrola Inmobiliaria Gross Margin triples to Eur 68.2 MM Financial Highlights Financial Highlights +199.9% 68.2 +301.7% 61.1 Q1 2007 EBITDA Gross Margin Eur MM +506.6% 35.9 Net Profit Property Portfolio Property Portfolio (buildable (buildable sq. mt.) sq. mt.) Dec-2006 Q1-2007 +4.4% +4.4% 3.57 MM 3.57 MM 3.42 MM 3.42 MM Commercial Commercial Residential Residential Rentals Rentals 28% 28% 28% 60% 60% 60% 12% 12% 12% 20% 20% 20% 68% 68% 68% 12% 12% 12% % vs. Q1 ‘06 Q1 2006 affected by seasonality Q1 2006 affected by seasonality |
 35 Engineering & Construction Sales to third parties up 57.4% to Eur 177.5 MM Increasing backlog to Eur Increasing backlog to Eur 2.6 Bn 2.6 Bn Q1 2006 112.8 112.8 177.5 177.5 Q1 2007 +57.4% +57.4% Sales to third parties (Eur Sales to third parties (Eur MM) MM) Backlog (Eur Backlog (Eur Bn) Bn) 1.0 2.6 Q1 2006 Q1 2007 +2.6x +2.6x |
 36 Agenda Highlights of the Period Highlights of the Period Analysis of Results Analysis of Results Conclusion Conclusion Consolidated Consolidated By Business By Business |
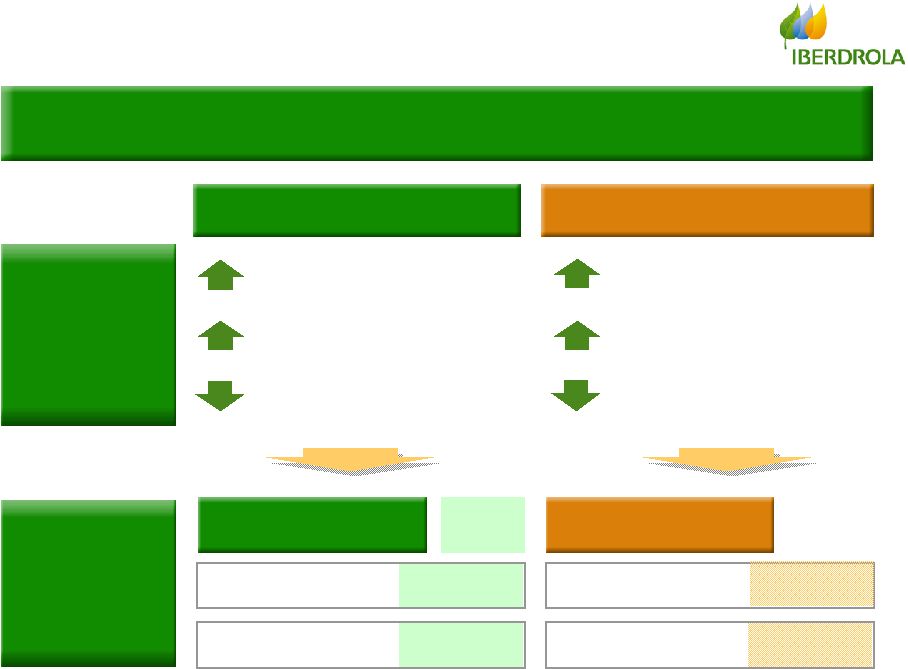
 37 Conclusion Positive results in a difficult scenario… Different trend in prices expected for 2007 vs. 2006 Impact of RDL 3/2006 in 2006 Tariff improvements in Distribution Personnel non-recurrent expenses Q4 ‘06 Higher hydro production & reserves Double-digit growth in 2007 Flexibility of gas contracts … … that will lead for an improvement throughout 2007 that will lead for an improvement throughout 2007 |
 38 First Quarter 2007 First Quarter 2007 Results Results |
Exhibit 99.4

LEGAL NOTICE:
DISCLAIMER
This document has been prepared by Iberdrola, S.A. (the “Company”) solely for use during the presentation corresponding to the First Quarter 2007 Results.
The information and any forward looking statements contained in this document have not been independently verified and no representation or warranty express of implied is made as to, and no reliance should be placed on, the fairness, accuracy, completeness or correctness of the information or opinions contained herein.
None of the Company, or any of its advisors or representatives shall have any liability whatsoever (in negligence or otherwise) for any loss howsoever arising from any use of this document or its contents or otherwise arising in connection with this document.
This document does not constitute an offer or invitation to purchase or subscribe for any securities in accordance with the Spanish Securities Market Law (Law 24/1988, as amended), Royal Decree-Law 5/2005 and/or Royal Decree 1310/2005 and the rules and regulations made there under.
Furthermore, this document does not constitute an offer to purchase, sell or exchange or the solicitation of an offer to purchase, sell or exchange any securities or the solicitation of any vote or approval in any other jurisdiction.
Neither this document nor any part of it shall form the basis of or be relied in connection with any contract or commitment whatsoever.
IMPORTANT INFORMATION
This communication does not constitute an offer to purchase, sell or exchange or the solicitation of an offer to purchase, sell or exchange any securities. The shares of Iberdrola, S.A. may not be offered or sold in the United States except pursuant to an effective registration statement under the Securities Act or pursuant to a valid exemption from registration.
FORWARD-LOOKING STATEMENTS
This communication and other documents relating to the Offer contain forward-looking information and statements about ScottishPower and Iberdrola, S.A. and their combined businesses after completion of the proposed Offer and otherwise. Forward-looking statements are statements that are not historical facts. These statements include financial projections and estimates and their underlying assumptions, statements regarding plans, objectives and expectations with respect to future operations, capital expenditures, synergies, products and services, and statements regarding future performance. Forward-looking statements are generally identified by the words “expects,” “anticipates,” “believes,” “intends,” “estimates” and similar expressions. Although the managements of ScottishPower and Iberdrola, S.A. believe that the expectations reflected in such forward-looking statements are reasonable, investors and holders of ScottishPower and Iberdrola, S.A. shares are cautioned that forward-looking information and statements are subject to various risks and uncertainties, many of which are difficult to predict and generally beyond the control of ScottishPower and Iberdrola, S.A., that could cause actual results and developments to differ materially from those expressed in, or implied or projected by, the forward-looking information and statements. These risks and uncertainties include those discussed or identified in the public documents sent by ScottishPower and Iberdrola, S.A. to the Comisión Nacional del Mercado de Valores and under “Risk Factors” in the annual report on Form 20-F for the year ended March 31, 2006 filed by ScottishPower with the SEC on June 30, 2006.
Forward-looking statements are not guarantees of future performance. They have not been reviewed by the auditors of Iberdrola, S.A. or of ScottishPower. You are cautioned not to place undue reliance on the forward-looking statements, which speak only as of the date they were made. All subsequent oral or written forward-looking statements attributable to Iberdrola, S.A. or ScottishPower or any of their respective members, directors, officers, employees or any persons acting on their behalf are expressly qualified in their entirety by the cautionary statement above. All forward-looking statements included in documents relating to the Offer are based on information available to Iberdrola, S.A. on the date thereof. Except as required by applicable law, Iberdrola, S.A. does not undertake any obligation to publicly update or revise any forward-looking statements, whether as a result of new information, future events or otherwise.
| II | First Quarter 2007 financial results |
IBERDROLA-SCOTTISH POWER: A WORLDWIDE LEADER EMERGES
Net profit up 13.6% to 458 million euros
More production (+6.9%) with a generation mix of lower variable costs and emissions (-24.2%)
| • | Flexibility of generation capacity: Production grew 2.5% in Spain (sector: -0.5%). |
| • | Production without emissions: Clean power generation in Spain grew by 25%. |
• | CO2 emissions: Down 37.1% in Spain, which is 2.8 times lower than the rest of the sector. |
| • | Market environment: Energy prices fell by 41% to 46.4 Eur/Mwh, price of emissions rights set at 2.95 Eur/ton and demand increases by 1.8%. |
In an challenging environment of low energy prices and moderate increase of demand, Gross Operating Profit (EBITDA) rose 2.9% to 1,087.1 MM€
Growing in the international business
| • | USA: Acquisition of CPV Wind Ventures LLC for 55 million euros, with pipeline of 3,500 MW |
| • | Italy: Strategic alliance with italian energy group API Holding for the construction and operation of 350 MW of wind. |
| • | Greece: Increasing the stake at the Rokas Group to 52.7%, taking full control of the Company. |
Iberdrola - ScottishPower Integration
| • | On 29 and 30 March of this year, a broad majority of the shareholders in both companies approved the merger (99.4% at Iberdrola and 97.6% at ScottishPower). |
| • | The operation is effective from 23 April, after its approval by the Sessions Court in Edinburgh. |
| • | This has been carried out under the framework of what is known as Scheme of Arrangement in British law, pursuant to Section 425 of the Companies Act in Great Britain. |
| First Quarter 2007 financial results | 1 |
Basic figures for the businesses
Operating Data | Q1 2007 | Q1 2006 | % | |||||
Net production | GWh | 24,752 | 23,154 | 6.9 | ||||
Gas combined cycle | GWh | 8,880 | 9,093 | -2.3 | ||||
Wind and Mini-Hydroelectric | GWh | 2,725 | 2,253 | 21.0 | ||||
Hydroelectric | GWh | 4,861 | 2,386 | 103.7 | ||||
Nuclear | GWh | 6,509 | 6,662 | -2.3 | ||||
Fuel oil | GWh | 15 | 566 | -97.3 | ||||
Coal | GWh | 1,212 | 1,697 | -28.6 | ||||
Cogeneration | GWh | 550 | 497 | 10.7 | ||||
Installed capacity | MW | 30,502 | 27,895 | 9.3 | ||||
Gas combined Cycle | MW | 8,818 | 6,897 | 27.9 | ||||
Wind and Mini-hydroelectric | MW | 4,552 | 3,914 | 16.3 | ||||
Hydroelectric | MW | 9,149 | 9,118 | 0.3 | ||||
Nuclear | MW | 3,344 | 3,344 | — | ||||
Fuel oil | MW | 2,889 | 2,889 | — | ||||
Coal | MW | 1,253 | 1,253 | — | ||||
Cogeneration | MW | 497 | 480 | 3.5 | ||||
Energy Distributed | GWh | 34,010 | 33,054 | 2.9 | ||||
Consumers (supply points under management) | No (mil.) | 18.5 | 17.9 | 3.3 | ||||
Employees | No | 16,347 | 17,514 | -6.6 |
| 2 | First Quarter 2007 financial results |
Operating Data | Q1 2007 | Q1 2006 | % | |||||
Spain | ||||||||
Net Production | GWh | 18,208 | 17,767 | 2.5 | ||||
Gas Combined Cycle | GWh | 2,719 | 4,058 | -33.0 | ||||
Wind and Mini-Hydroelectric (1) | GWh | 2,725 | 2,253 | 21.0 | ||||
Hydroelectric | GWh | 4,598 | 2,156 | 113.3 | ||||
Nuclear | GWh | 6,509 | 6,662 | -2.3 | ||||
Fuel oil | GWh | 15 | 566 | -97.3 | ||||
Coal | GWh | 1,212 | 1,697 | -28.6 | ||||
Cogeneration | GWh | 430 | 375 | 14.7 | ||||
Installed capacity | MW | 26,084 | 24,606 | 6.0 | ||||
Gas combined cycle | MW | 4,800 | 4,000 | 20.0 | ||||
Wind and Mini-Hydroelectric (1) | MW | 4,552 | 3,914 | 16.3 | ||||
Hydroelectric | MW | 8,842 | 8,819 | 0.3 | ||||
Nuclear | MW | 3,344 | 3,344 | — | ||||
Fuel oil | MW | 2,889 | 2,889 | — | ||||
Coal | MW | 1,253 | 1,253 | — | ||||
Cogeneration | MW | 404 | 387 | 4.4 | ||||
Energy Distributed | GWh | 26,756 | 26,224 | 2.0 | ||||
Regulated market | GWh | 22,125 | 19,790 | 11.8 | ||||
Commercial | GWh | 4,631 | 6,434 | -28.0 | ||||
Gas Supplies | GWh | 9,904 | 15,466 | -36.0 | ||||
Customers | GWh | 4,124 | 6,008 | -31.3 | ||||
Gas combined cycle | GWh | 5,780 | 9,458 | -38.9 | ||||
Customers (supply points under management) | No (mil.) | 10.0 | 9.7 | 3.0 | ||||
Latin America | ||||||||
Production | GWh | 6,544 | 5,387 | 21.5 | ||||
Gas combined cycle | GWh | 6,161 | 5,035 | 22.4 | ||||
Hydroelectric | GWh | 263 | 230 | 14.3 | ||||
Cogeneration | GWh | 120 | 122 | -1.6 | ||||
Installed capacity | MW | 4,418 | 3,289 | 34.3 | ||||
Gas combined cycle | MW | 4,018 | 2,897 | 38.7 | ||||
Hydroelectric | MW | 307 | 299 | 2.7 | ||||
Cogeneration | MW | 93 | 93 | — | ||||
Energy distributed (under management) | GWh | 7,254 | 6,830 | 6.2 | ||||
Customers (supply points under management) | No (mil.) | 8.5 | 8.2 | 3.6 |
Note: Installed capacity, production, and number of employees according to consolidation criterion.
| (1) | Includes for 2007 460 MW of international capacity with production of 274 GWh. For 2006: 316 MWwith production of 151 GWh. |
| First Quarter 2007 financial results | 3 |
Market Data | Q1 2007 | Q1 2006 | ||||
Market capitalisation (3/31) | Million € | 31,906 | 24,017 | |||
Earnings per share (quarter) | € | 0.51 | 0.45 | |||
Net operating cash flow per share (quarter) | € | 0.80 | 0.74 | |||
PER | Times | 19.2 | 16.7 | |||
Price/Book Value (Capitalisation to NBV at end of period) | Times | 3.02 | 2.53 | |||
Economic/Financial Data | ||||||
Income Statement | Q1 2007 | Q1 2006 | ||||
Net Sales | Million € | 2,716.6 | 2,978.4 | |||
EBITDA | Million € | 1,087.1 | 1,056.6 | |||
EBIT | Million € | 794.8 | 788.4 | |||
Net Profit | Million € | 458.2 | 403.2 | |||
Net Operating expenses / gross Margin | % | 27.9 | 26.2 | |||
Balance sheet | Q1 2007 | Q1 2006 | ||||
Total assets | Million € | 34,002 | 33,061 | |||
Shareholders’ Equity | Million € | 10,564 | 10,567 | |||
Net adjusted financial debt (1) | Million € | 13,061 | 13,119 | |||
ROE | % | 16.2 | 16.6 | |||
Financial leverage (2) | % | 55.3 | 55.4 | |||
Debt/equity ratio | Times | 1.24 | 1.24 |
| (1) | Includes the amounts corresponding to the tariff insufficiency: 606 million euros from March of 2007 and 572 million euros from December 2006. |
| (2) | Net Debt/Net Debt+FL. Includes financing the tariff insufficiency. If the tariff insufficiency was not included, leverage as at March 2007 would be 54.1 % and 54.3% as at December 2006. |
| 4 | First Quarter 2007 financial results |
Operating highlights
• | In the first quarter of 2007, IBERDROLA reached a new Group production record, with production rising by 6.9% to 24,752 GWh. This was achieved with a mix of low cost and cleaner generation, which allowed CO2 emissions to fall by 24.2%. |
In Spain, IBERDROLA saw growth in production of 2.5%, while overall system production in Spain fell by 0.5%. Emissions in Spain were down 37.1%, to 133 gr/kWh, a third of the rest of the sector (378 gr/kWh). Other highlights include:
| • | 103.7% increase in hydroelectric production to 5,598 GWh and a 23.2% increase in wind production to 2,578 GWh (274 GWh international). |
| • | Market environment during the first quarter of 2007 was marked by low energy prices (-41%) and very mild winter temperatures which led to a moderate increase in domestic demand (+1.8%). |
| • | In this challenging scenario of low prices and moderate increase of demand, Operating Profit improved in both gross terms (EBITDA +2.9%) and net terms (EBIT +0.8%). |
| • | Domestic Energy Business EBITDA falls by -7.6%. Distribution business growth by 95%, what offsets the falls in Generation (-33.1%) and Renewables (-12.4%), reflecting the downward trend of pool prices. In the case of Generation, lower prices have been compensated with a fall in Procurements due to a cleaner generation mix (76% of non-pollutant technologies), and lower regulatory impacts. |
| • | International and Engineering and Non Energy business achive strong growths at EBITDA level, offsetting the falls in Generation and Renewables: |
| • | International: EBITDA up 41.1% to 200.5 million euros, thanks primarily to the good development of business in Mexico and Brazil. The generation business saw an increase in production of 21.5%. The distribution business recorded an increase of 6.2% in energy distributed. In addition, it should be mentioned that the change in the exchange rate between the Brazilian Real and the Dollar in the period resulted in an effect of about-13.3 million euros. |
| • | Engineering and Non-Energy Businesses increased their EBITDA by 40.0% to 122.5 million euros, basically boosted by the results of Iberdrola Inmobiliaria. |
| • | Net Profit totalled 458.2 million euros, an increase of 13.6%, in line with the expectations of double digit growth contemplated for the full 2007 fiscal year. |
| First Quarter 2007 financial results | 5 |
Profit before taxes is up by 4.7%, slightly improving the trend followed at the operating level. The effective tax rate in 2007 has been normalized in the 29.3%, according to current tax rules, compare to 35.1% for the same period of 2006.
| • | On 29 and 30 March of this year, a broad majority of the shareholders in both companies approved the merger (99.4% at Iberdrola and 97.6% at ScottishPower). The operation is effective from 23 April, after approval by the Sessions Court in Edinburgh, and has been carried out under the framework of what is known as Scheme of Arrangement in British law, pursuant to Section 425 of the Companies Act in Great Britain. |
| 6 | First Quarter 2007 financial results |
Development of the Strategic Plan
1. GENERATION
Total installed capacity
Over the first quarter of 2007, IBERDROLA brought into service 118 MW of additional power compare to December 2006, taking total installed capacity up to 30,502 MW. All of the additional installed capacity is derived from newly installed renewable capacity, both in Spain (98 MW) and abroad (20 MW). Year on year, the additional capacity represents an increase of 9.3%.
1.1 Traditional Generation
1.1.1. Combined Cycle Plants
Spain
Installed capacity
IBERDROLA’s Combined Cycle Plant (CCGTs) total capacity in Spain was 4,800 MW at the end of March 2007 (5,600 MW under management), corresponding to nine plants. It is planned to bring the Castellón 4 Plant, with an additional 800 MW, on line during 2007.
Project | Capacity (MW managed) | Start of operations | |||
Castellón | 800 | Operative 2002 | |||
Castejón | 400 | Operative 2003 | |||
BBE | 800 | Operative 2003 | |||
Tarragona | 400 | Operative 2003 | |||
Santurce | 400 | Operative 2004 | |||
Arcos Grupos I y II | 800 | Operative 2004 | |||
Aceca | 400 | Operative 2005 | |||
Arcos Grupo III | 800 | Operative 2005 | |||
Escombreras | 800 | Operative 2006 | |||
Total 2006 | 5,600 | ||||
Castellón 4 | 800 | Planned 2007 | |||
TOTAL 2002-2007 | 6,400 | (5,600 owned) | |||
Mexico
IBERDROLA is the leading private electricity producer in Mexico. The Company now has 3,815 MW of installed capacity in operation in Mexico.
Proyect | Capacity (MW) | Operational Status | ||
Enertek | 120 | 100% operative | ||
Monterrey III | 1,037 | 100% operative | ||
Altamira III y IV | 1,036 | 100% operative | ||
La Laguna II | 500 | 100% operative | ||
Altamira V | 1,121 | 100% operative | ||
Tamazunchale | 1,135 | Operative 2007 | ||
Total | 4,949 | |||
In February 2007, IBERDROLA started the testing period for the Tamazunchale electrical plant
| First Quarter 2007 financial results | 7 |
located in the Mexican state of San Luís Potosí. With installed capacity of 1,135 MW, it is the largest combined cycle plant in operation in the country.
Portugal
On 10 April of this year, IBERDROLA and the municipality of Figueira da Foz signed a contract for the acquisition of land on which, after having received the approval of the Direcção Geral de Energia in Portugal, the first combined-cycle plant to be built by the Company in Portugal will be located. The land for the new IBERDROLA gas plant, which will be built in Lavos (Figueira da Foz), between Lisbon and Porto, has a total area of about 208,000 square metres. This new electrical generation plant, which will have an installed capacity of 850 MW, could come on line at the end of 2009 if all necessary requirements are met.
1.1.2 Hydroelectric energy Spain
The Ministry of the Environment has authorised two hydroelectric plants, a new group in the plant at La Muela, in Valencia which will double its current capacity of 630 MW, and the expansion of the San Esteban plant in the Sil basin by 175 MW. The La Muela 2 pumping plant project is now underway, with the excavation of the access tunnel.
1.1.3 Cogeneration
Spain
Operating capacity
IBERDROLA has cogeneration operating installed capacity in Spain of an attributable 404 MW, equivalent to a total of 549 MW installed.
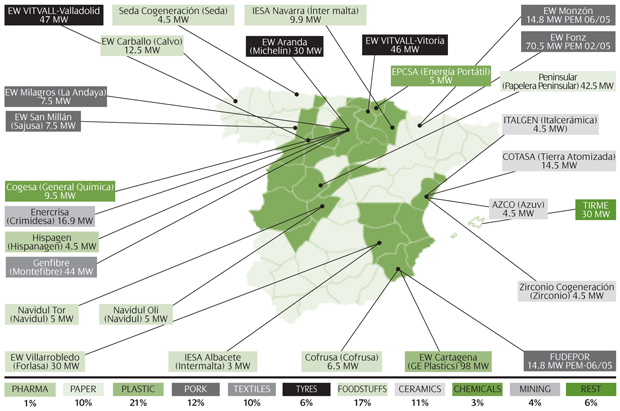
With the projects completed in 2006, IBERDROLA has consolidated its position as the largest cogeneration company in Spain, with a total of 549 MW installed. The Company also participates in more 29 cogeneration plants, supplying electricity and steam to clients such as Michelin, General Electric Plastics in Cartagena, Calvo Conservas in La Coruña, Holmen Paper in Madrid and Montefibre in Miranda de Ebro.
| 8 | First Quarter 2007 financial results |
Location of all IBERDROLA cogeneration plants
Capacity under construction
In April 2007, IBERDROLA presented a construction project for the Barcial del Barco (Zamora) bioethanol production plant. This plant, which will have the capacity to produce 149,000 cubic metres of bioethanol annually, will come on line in July 2008. The Project will be developed by the company Ecobarcial, in which Proencalsa has a 51% participation (property of our Company, Collosa and the Ente Regional de la Energía) and by Green Source (Sniace) (30%), Ecoteo (14%), ITACYL (4.9%) and various cooperatives (0.1%).
1.1.5 Wind and Mini-Hydroelectric Energy
At the close of the first quarter of 2007, IBERDROLA had an installed capacity of 4,552 MW (4,210 MW for wind farms and 342 MW for Mini-hydroelectric facilities), confirming IBERDROLA’s position as the world leader in this business. During the first quarter of the financial year, 118 MW of additional power were installed as compared with the capacity available at the close of 2006 (109 wind and 9 small-scale hydroelectric). Of the total power added, 98 MW corresponds to Spain and 20 MW is international.
| First Quarter 2007 financial results | 9 |
Year on year, the installed capacity at the close of the first quarter of 2007 is 16.3% greater than that at the close of the same period of 2006.
IBERDROLA has a portfolio of projects of almost 19,000 MW, the result of the development of our own projects and operations undertaken in the context of renewable energy outside of Spain.
Spain
The new capacity installed in Spain during the first quarter of 2007 totalled 98 MW, which breaks down as follows: Castilla y León 61 MW, Andalusia 15 MW, Region of Murcia 10 MW, Castilla - La Mancha 9 MW and La Rioja 3 MW.
United States
The United States have become one of the most important markets for developing IBERDROLA’s objectives in the area of renewable energy. The Company has 26 MW in operation, which consists of the wind farm at Locust Ridge coming from the acquisition of Community Energy, and a portfolio of projects that will be close to 8,500 MW in the first half of 2007, once they are included the MW coming from recent acquisitions. IBERDROLA already has a permanent office in the State of Pennsylvania.
To strengthen its portfolio of projects in the country, IBERDROLA has undertaken various operations. The highlights are as follows:
| • | Acquisition of the US wind company CPV Wind Ventures.IBERDROLA has reached an agreement to acquire, for 55 million euros, 100% of the US company CPV Wind Ventures LLC, headquartered in Silver Spring (Maryland), as part of the Company’s focus on international expansion and its interest in increasing its presence in the wind market in the United States. CPV Wind Ventures LLC has a portfolio of projects of 3,500 MW of wind power in 15 states in the US, with the construction of the first wind farms planned for next year. With this in mind, this company has already signed an agreement with General Electric to supply turbines beginning in 2008. |
| • | Agreement with Gamesa to purchase wind farms in the US.This agreement provides for the acquisition of wind installations with about 500 MW of power that Gamesa will bring on line before the end of 2009. Of these, 300 MW are firm commitments, while the remaining 200 MW will be subject to a right of purchase. The other 500 MW would correspond to the acquisition of developments under way. |
| • | Acquisition in the US of Community Energy (CEI),which has a portfolio of projects of 2,000 MW of wind power in various coastal zones of |
| 10 | First Quarter 2007 financial results |
the country in the initial study phase, an additional 200 MW are in an advanced stage of development. CEI has sales of more than 3,000 GWh of wind power, 100,000 residential customers and commercial agreements with about 20 municipal and private electricity companies. The US company has had two wind farms in operation since the end of 2005: Jersey-Atlantic (7.5 MW) and Bear Creek (24 MW). |
| • | Acquisition in the US of MREC Partners and its participation Midwest Renewable Energy Projects.The portfolio of projects of the two companies totals 1,600 MW of wind power located in various zones of the Midwest of the US. Of this total, 400 MW are in an advanced phase of development and 1,200 MW are in the initial study phase with a high probability of approval. |
Greece
The Alogorachis wind farm has been brought on line through its acquisition to Gamesa, and the Modi Ampliación wind farm through Rokas has been concluded, adding a total of 18 new MW. This gives IBERDROLA 210 MW in operation in the country. IBERDROLA is a strategic partner of the principal promoter and producer of wind energy in Greece, Rokas, in which it has a 52.7% interest.
Agreement with the Rokas family
During the first quarter of 2007, IBERDROLA, through its renewable energies subsidiary, has reached a new agreement with the Rokas family to promote the development of the Rokas Group, and gives another indication of the clear commitment the Company has to this market. Under the terms of the agreement:
| • | The Rokas family will transfer to IBERDROLA all of the preferred non-voting shares it holds, directly or indirectly, in the Rokas Group (about 45% of the existing shares) for about 32 million euros. |
| • | The agreement reached in December 2004 is replaced by this, subject to the approval by Greek competition authorities. After the acquisition in the market of an additional 2.8% of the capital share, for 12.5 million euros, IBERDROLA increases its participation in Rokas up to 52.7% |
In addition, the Rokas family, after reaching an agreement with various financial entities for sale of the majority of its common shares in the Rokas Group (9.82% of the capital), has proceeded to the sale of those shares. IBERDROLA has consented to this transaction, renouncing to its preferred acquisition right.
| First Quarter 2007 financial results | 11 |
The Rokas Group closed 2006 with installed wind capacity of 193.3 MW and production of 520 GWh. It currently has three wind farms under construction totalling about 60 MW, and is seeking authorisation to develop another 488 MW in Greece and 179 MW in Cyprus.
Portugal
The installation of the Alto Monçao wind farm has been completed, with an additional 18 MW included in the acquisition agreement with Gamesa in Portugal, which contemplates the construction of 32 MW. IBERDROLA also has another 18 MW in operation, corresponding to the wind farm at Catefica. In addition, IBERDROLA has 122 MW in advanced projects that will enter into operation in the next two years.
France
Fitou wind farm has been completed, with 1 additional MW. IBERDROLA’s installed wind capacity at the close of the first quarter of 2007 is 49 MW. More than 100 MW of power are planned for installation in 2007, as a result of the development of the most advanced projects of Perfect Wind and Gamesa. To reinforce its pipeline in the country, IBERDROLA acquired french company Perfect Wind, considered as one of the companies with larger development potential in our neighbour country, with a pipeline of 600 MW, 17 MW currently in operation and 78 MW corresponding to projects in an advanced stage of development.
Poland
The Kisielice wind farm (41 MW) is already in operation. This is IBERDROLA’s first installed capacity in Poland. This farm (27 1.5 MW General Electric 1.5 SL turbines) is the first Project in the portfolio acquired from Eternegy Polska in September of 2005 to be built and brought on line. When the Malbork farm (18 MW) is brought on line next, IBERDROLA will be one of the main wind generators in Poland. In addition, another 141 MW, now at an advanced stage of development, will be put into service between 2007 and 2008.
Germany
34 MW have been brought on line, as provided for in the agreement reached with Gamesa at the end of 2005. When put into service, Iberenova will be part of the German wind market, which is the most developed in the world, with more than 20,000 MW installed. The portfolio of projects totalls 47 MW.
United Kingdom
IBERDROLA is developing its own projects, with potential to reach 200 MW. In addition, the acquisition of two projects, Darracott y Clachan Flats (both in the final stage of development, totalling 21 MW) will permit IBERDROLA to have its first MWs in operation on the British market during 2007.
| 12 | First Quarter 2007 financial results |
Italy
During the period 2007 - 2009 IBERDROLA will acquire from Gamesa a total of 100 MW by means of an agreement signed for that purpose in the month of October of 2005.
Strategic alliance with the API Holding Group
During the first quarter of 2007, IBERDROLA signed a strategic alliance with the Italian energy group API Holding for the construction and development of approximately 350 MW of wind power in Italy. The projected investment is about 500 million euros. Once that alliance is realised, the Company will be a 50% stakeholder in the joint company that will be created with API Nova Energia, subsidiary of API Holding, called Società Energie Rinnovabili. The objective will be to develop seven wind projects located in the regions of Sicily and Puglia. These projects are currently at a very advanced stage of development. It is expected that the projects will be brought into service in 2008 and 2009.
Brazil
The Rio do Fogo wind farm has been completed and brought on line, an additional 43 MW to make a total of 49 MW. In Brazil, Neoenergia has the Afluente small-scale hydroelectric plant with 18 MW (8 MW attributable to IBERDROLA). Neoenergía (in which IBERDROLA has a 39% stake) has the concessions to build, maintain and operate the Baguari hydroelectric plant and the Nova Aurora and Goiandira small-scale hydroelectric plants, for a total of 188 MW.
Mexico
IBERDROLA is developing promotions in the State of Oaxaca that add up to 150 MW of capacity. In 2007, La Ventosa wind farm, 30 MW, will be brought on line.
Total project portfolio
In total, IBERDROLA already has a portfolio of projects of about 19,000 MW in different stages of development, both in Spain and abroad. This pipeline is not including the MWs coming from recent acquisitions in the US, that will be included at closing of the first half of 2007.
MW | Under development | Validated resource | Connection rights & under construction | |||
Spain | 6,166 | 5,453 | 2,519 | |||
Wind | 5,279 | 4,973 | 2,066 | |||
Mini-hydroelectric | 176 | 176 | 76 | |||
Solar | 686 | 286 | 359 | |||
Biomass | 24 | 17 | 17 | |||
Wave energy | 1 | 1 | 0 | |||
International wind | 12,829 | 5,912 | 1,452 | |||
Total | 18,996 | 11,365 | 3,971 |
1.1.6 Other Sources of Renewable Energy (Non-Wind)
Thermo-solar energy
There are currently various solar thermo-electric energy projects using parabolic cylinder collector technology in development. Total power is 50 MW. Meteorological stations for measuring
| First Quarter 2007 financial results | 13 |
solar resources for the projects have been installed in Sevilla, Ciudad Real, Badajoz and Albacete. The portfolio of three projects totals 650 MW of power. They are being developed in Extremadura, Castilla y León, Andalucía, Castilla - La Mancha, Murcia, Madrid and Aragón. During the first quarter of 2007, work has begun on the first 50 MW plant in Puertollano.
Photovoltaic energy
The priority here is to develop our own portfolio within IBERDROLA’s combined cycle installations and nuclear plants. IBERDROLA currently has an advanced portfolio of 30 MW in Spain. IBERDROLA, together with a group of partners, has set up the company Global Solar Energy, whose purpose is to promote a photovoltaic power installation of 10 MW in Murcia. Study of the possibility of other projects using this technology in some of our generation facilities has also begun, so that we can have a presence in the development of this source of renewable energy. Internationally, during the first quarter of 2007 a Greek facility (Rokas) of 0.17 MW was added.
Biomass
The development of projects will be carried out very selectively, while always ensuring the long-term supply of raw materials. IBERDROLA plans to install three forest biomass plants in Spain for a total of 24 MW, located in the municipalities of Somozas (La Coruña), Archidona (Málaga) and Corduente (Guadalajara).
In February of 2007, IBERDROLA began construction of the Corduente (Guadalajara) plant, the first of the Company’s plants in Spain that will use forest residue to generate energy, after having undertaken the appropriate environmental and viability studies and receiving the approval of the competent authorities (the regional government of Castilla-La Mancha and the municipal government of the city). The Company’s new renewable energies plant there, which should be brought on line within 18 months, is located outside Alto Tajo Natural Park. With installed capacity of 2 MW, the plan calls for the use of about 20,000 tonnes of forest residue per year.
Marine energy
IBERDROLA plans to install the first pilot wave energy plant in Europe in the municipality of Santoña (Cantabria). The project will be implemented in two phases. The first will be completed with the installation of a 40 kW buoy, and the second phase will analyse the increase in power of the plant to a total of 1.35 MW.
Special Regime Mini-hydroelectric
IBERDROLA has a domestic portfolio of 186 MW and an international portfolio of 100 MW. During the first quarter of 2007, the installation of the plant at La Fuensanta was completed. The plant is 8.84 MW and is located in Albacete.
2. DISTRIBUTION
2.1 Spain
At closing of the first quarter of 2007, IBERDROLA had 10 million customers in Spain, and the total energy distributed in the network was 26,756 GWh, an increase of 2.0% compared with the corresponding previous period. 83% of the energy (22,125 GWh) is distributed at market rates.
| 14 | First Quarter 2007 financial results |
2.2. Latin America
At closing of the first quarter of 2007, IBERDROLA had more than 8.5 million customers in the region, and the total energy distributed in the network was 7,254 GWh, an increase of 6.2% compared with the corresponding previous period.
3. SUPPLY
3.1 Electricity
| • | Spanish business: eligible electricity customers |
Energy sold in this market totalled 1,097 GWh, down -66.2% compared to the previous period of 2006, although the figure for energy sold is 30% higher than that of the 4th quarter of 2006, as a result of current market conditions.
3.2 Gas
Procurements
In the first quarter of 2007, IBERDROLA provided 14% of the total amount of gas consumed on the deregulated market. The winter season was very mild, and since production in the combined cycle plants was reduced because of hydroelectric power and increased wind production, there was a reduction of 5% in domestic demand for gas compared with the same period in 2006. In this environment, IBERDROLA has optimised its participation in the gas market with supply to the combined cycle plants, sales to customers, and domestic and international trading activities, all thanks to the flexibility of its portfolio of procurements contracts.
IBERDROLA ended the period with a global supply portfolio of 16 bcm per annum, of which 7 bcm per annum cover its procurement requirements in Spain and 9 bcm per annum its requirements in Mexico and Brazil.
The most significant gas procurement transactions in the period were the following:
| • | Regular shipments of LNG are received through the contracts signed with ENI, GNA, SONATRACH, NIGERIA LNG and SNOHVIT at the regasification plants at Bilbao, Huelva y Sagunto, three logistic centres around the peninsula that guarantee supply. The gas received originates in Algeria, Nigeria, Libya, Egypt and Qatar, well diversified sources to ensure supply. |
| First Quarter 2007 financial results | 15 |
| • | Extraction of gas reserves from the subterranean storage capacity at Gaviota (Vizcaya) and Serrablo (Huesca) to adjust supply to demand at all times, while always fulfilling the winter operation plan put into place by the Ministry for Industry and with the obligation of maintaining minimum security reserves. |
| • | Export to France through the Euskadour international gas pipeline. IBERDROLA was the first company to export gas through Euskadour after it came into service in June 2006. |
| • | During the period, for the purpose of optimising the flexibility of its gas resources, the Company undertook various international LNG trading operations. |
| • | The Company doubled its reserve capacity at the Bahía de Bizkaia Gas (BBG) regasificiation plant at the port of Bilbao, which is the principal operator at that terminal. |
| • | Additional subterranean storage capacity was contracted in France to provide supply-demand coverage for supply activities in that country and for carrying out seasonal price arbitrage. |
Infrastructures
IBERDROLA continues moving forward with the development of the Sagunto regasification plant (Saggas, 30% owned by IBERDROLA), closing an agreement with the EIB at the end of March to finance its capacity expansion. This expansion will increase the plant’s capacity by 50%. In addition, development of expansion by 50% of Bahia Bizkaia Gas (25% owned by IBERDROLA) continues. During this quarter, the application for administrative authorisation for the expansion was submitted.
With respect to Medgaz, company that will construct the direct undersea gas pipeline between Algeria and Spain with an initial capacity of 8 bcma, IBERDROLA finalised an increase in its participation in the company from 12% to 20% in January 2007. The final investment decision on the project was adopted in December 2006, ensuring that IBERDROLA will receive 1.6 bcm annually beginning in 2009.
The Company has also continued its development of natural gas distribution in various municipalities in the Madrid, Valencia and Murcia regions. In this respect, of special relevance is the recent decision to grant IBERDROLA, as the main gas distributor in the Valencia region, the GasBenidorm Distribution Authorisation, the only municipality on the Levante coast whose current level of gasification is practically nil.
Supply
As a continuation of the major supply of gas carried out in 2006, in the first quarter of 2007 IBERDROLA increased sales of gas to high-pressure industrial customers, whose prices will be completely deregulated this coming 1 July. This will significantly increase the volumes to be supplied both this year and in 2008.
| 16 | First Quarter 2007 financial results |
In addition, in the first quarter, IBERDROLA Gas Plan was launched. This is a gas sales campaign in the residential sector focussed on maximising profitability for the company and added value for the customer by including a series of services, such as maintaining gas installations in homes. At the end of the first quarter, IBERDROLA had a total of 153,000 gas sales contracts with end customers.
4. NON-ENERGY BUSINESSES
Iberdrola Inmobiliaria
IBERDROLA (through its parent company and its subsidiary Iberdrola Inmobiliaria) closed out first quarter of 2007 with 16residential developmentsunder construction, representing a total of 1,154 homes and a further 20residential developmentsunder management, representing another 1,498 homes. 351 homes were completed in the quarter.
IBDI currently has onenon-residential developmentunder construction. This development is an office building in Málaga comprising a buildable 1,152 sqm. Also under management is the development of the new Commercial Real Estate Project in Porta Firal (Barcelona). The total surface area for construction will be 91,111 sqm above ground and 42,363 sqm below ground. The below-ground construction is set to begin in June/July 2007.
The totalinvestmentmade in purchasing public deed land was 44.5 million euros during the first quarter of the year. 103,611 sqm of buildable land was acquired.
The following transactions were the highlights of the first quarter:
| • | Iberdrola Inmobiliaria will invest 75.4 million euros in a new urban development of primary residences in the area of Molina de Segura, in the Murcia region, with the anticipated completion date in 2012. The Company has also completed purchase of the land, with a gross surface area of 240,247 sqm and buildable surface of 93,060 sqm. 744 multi- and single-family dwellings will be developed. |
| • | Iberdrola Inmobiliaria will invest 57.3 million euros in a residential and commercial development in the area of Lliria, 25 km west of the city of Valencia, with the anticipated completion date in 2011. The Company has also completed the purchase of land, with a gross surface area of 250,000 sqm and buildable area of 40,000 sqm. |
| • | Iberdrola Inmobiliaria has begun marketing its new residential development Los Altos de Arroyomolinos, located in the Madrid municipality of Arroyomolinos, in the suburbs of Centro de Ocio Madrid Xanadú. This development will be handed over in the first half of 2009. |
| First Quarter 2007 financial results | 17 |
5. IBERDROLA ENGINEERING AND CONSTRUCTION
Iberdrola Engineering is working on projects in 25 countries, and already has subsidiaries in Mexico, Brazil, Venezuela, the US, the United Kingdom, Germany, Latvia, Poland, Russia, Slovakia, Bulgaria, Greece, Qatar, Kenya, Tunisia and India.
Iberdrola Engineering was awarded with a project of special relevance in the first quarter of 2007, a contract for the modernisation and redevelopment of the Laguna Verde nuclear plant in Mexico, increasing its nominal power by 20%, with a budget of 605 million dollars.
In addition, its currently carrying on nuclear-type works in the Flamamville nuclear power station in France for EDF.
Finally, on 29 March of this year, the La Venta II wind power station (85MW) was officially opened. This facility was a turnkey construction by Iberdrola Engineering in the Mexican state of Oaxaca.
6. REGULATION
The most significant events for the period in terms of regulation have been the following:
IBERDROLA and Endesa have agreed to carry out five energy auctions jointly to comply with Royal Decree 1634/2006
IBERDROLA and Endesa have agreed to carry out five energy auctions jointly to comply with Royal Decree 1634/2006, which obliges both companies to carry out primary energy auctions as a mechanism to aid development of the electricity market in Spain
The total volume auctioned off will reach 14.9 million MWh, distributed over a series of five auctions that will begin in June of this year and be held every three months until June 2008. To further this initiative, the two companies have prepared a plan of action in order to give notice of the process to all potential interested parties in Spain and in the rest of Europe.
Specifically, a Web page (www.endesa-iberdrola-vpp.com) has been launched in Spanish and in English, comprising a public area with basic information on the primary energy issues process - known on the international market as Virtual Power Plant Auctions, VPP - and another restricted area for companies interested in the process, which must register in order to be able to take part in the auctions and have access to the relevant information.
Regulation of distribution company bilateral contracts for supplies at tariff (OM ITC/400/2007)
Royal Decree-Law 3/2006 established a mechanism for assimilation to physical bilateral contracts, covering matching power sales and acquisition amounts on the electricity market made by parties belonging to the same business group.
Now, with the passing of OM ITC/400/2007, which governs this type of bilateral contracts, the assimilation method under Royal Decree-Law 3/2006 has become void and only Article 2 thereof, on deduction of the value of the
| 18 | First Quarter 2007 financial results |
emission rights allocated free to generating facilities, remains in effect.
The Ministerial Order’s Explanation of Reasons makes reference to the aforesaid provision’s loss of effectiveness. It expressly notes: “Accordingly, with the effectiveness of the present provision, the rules whereby distribution companies trade in electric power through bilateral contracts with physical delivery are understood to be implemented for the purposes provided for in Article 1, Section 1 of Royal Decree-Law 3/2006”.
In this regard, OMEL announced on the 27th of February that as of the second intraday session on that date, assimilation of Royal Decree-Law 3/2006 would no longer be carried out.
7. IBERDROLA - SCOTTISH POWER INTEGRATION
On 27 November 2006, the board of directors of Iberdrola and ScottishPower, meeting in Madrid and Glasgow, respectively, reached an agreement on the terms of an offer by Iberdrola on the entire share capital of ScottishPower.
The transaction has been carried out under what is known under British law as a Scheme of Arrangement, in accordance with Rule 425 of the British Companies Act, with its approval by the Edinburgh Court of Sessions effective dated 23 April 2007 and its subsequent application for registration at Scotland’s Companies House.
Terms of the agreement
Pursuant to the terms of the agreement reached with ScottishPower, Iberdrola is acquiring part of the ordinary shares of ScottishPower by paying consideration in cash and loan notes. The rest of the ordinary shares of ScottishPower are being acquired by Iberdrola through the delivery of new-issue ordinary Iberdrola shares as resolved by the company General Shareholders Meeting held on 29 March 2007.
The financial impact of such terms for ScottishPower shareholders is equivalent to receiving 400 pence of sterling pound in cash and 0.1646 new Iberdrola shares (valued at the close of business on 27 November 2006 at 365 pence of sterling pound) for each of their stocks. In turn, the financial impact for holders of ScottishPower ADS’s is equivalent to receiving 1,600 pence of sterling pound and 0.6584 newly created Iberdrola ADSs (the underlying investment for each Iberdrola ADS will be one new Iberdrola share).
In addition, on 27 April 2007, ScottishPower will make payment of an extraordinary dividend of 12 pence of sterling pound per share (48 pence of sterling pound in the case of ADS).
| First Quarter 2007 financial results | 19 |
Considering the IBERDROLA stock closing price on 27 November 2006 of Euros 32.75 and an exchange rate of 1.4755 euros to 1 pound sterling, under the terms of the agreement the value of each share of ScottishPower is 777 pence of sterling pound (including the special dividend of 12 pence of sterling pound that ScottishPower will pay its shareholders), whereby the valuation of this company would reach on the order of € 17,100 million. To meet the consideration in stock, IBERDROLA will have issued approximately 263 million new shares, whereby the former ScottishPower shareholders will receive shares representing over 20% of the share capital of IBERDROLA after completion of the capital increase.
Scheme of the economic effect of the terms of the agreement
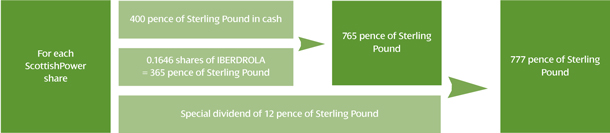
| 20 | First Quarter 2007 financial results |
Completion of the transaction
After obtaining the necessary regulatory approvals (as summarised in the table below), the shareholders of Iberdrola and ScottishPower approved at their respective General Meetings, held on 29th and 30th of March, the completion of the transaction, which became effective on 23 April after its approval by the Edinburgh Court of Sessions and its subsequent application for registration at Scotland’s Mercatile Register:
Regulatory notifications and approvals | Application filing | Approval received | ||||||||
European | European Commission | ü | 12/01/07 | ü | 15/02/07 | |||||
Hart-Scott-Rodino Act | ü | 21/12/06 | ü | 22/01/07 | ||||||
FERC | ü | 22/12/06 | ü | 25/01/07 | ||||||
U.S.A. | Federal Telecommunications Commission | ü | 23/01/07 | ü | 05/02/07 | |||||
Exxon Florio Act | ü | 22/01/07 | 21/02/07 | |||||||
NY State Public Utilities Commission | ü | 03/01/07 | 28/02/07 | |||||||
Spain | National Energy Commission: Confirmation of non-applicability of Function 14 | Delivery of documentation (12/01/07 and 05/03/07) | 22/03/07 | |||||||
National Securities Market Commission: registration of 1 the securities note | ü | 09/03/07 | ü | 12/04/07 | ||||||
| First Quarter 2007 financial results | 21 |
The schedule followed by the transaction until its completion is shown in the following chart:
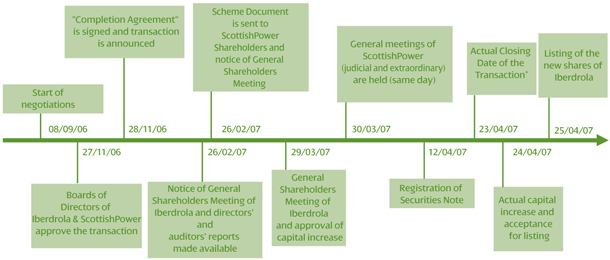
(*) | *On 14 May 2007 and on 28 June 2007, the capital increase for meeting to the exercise of rights and options under the Scottish Power Stock Plans and the exercise of conversion rights by holders of ScottishPower convertible bonds will be carried out |
Strategic sense and creation of value
Finalisation of the deal with ScottishPower comes after a period of five years of strong organic growth by the Company and creation of value for the shareholders of Iberdrola, thanks to the achievement of the 2001-2006 Strategic Plan.
The friendly takeover proposed has met all the criteria stipulated for non-organic growth in the 2007-2009 Strategic Plan, and will enable moving ahead with the objectives set in that strategy. The basic principles of action are growth, internationalisation, and efficiency, all with the ultimate goal of achieving greater profitability ratios for Iberdrola.
From the strategic point of view, Iberdrola believes that the transaction is attractive and will allow for the creation of one of the leaders on the European energy market, with a broad geographical presence and a strong platform that will make futue growth possible.
The transaction will not only bolster the internationalisation of Iberdrola, but will also consolidate the Company as one of the leaders on the global renewable energy market.
| 22 | First Quarter 2007 financial results |
Iberdrola has obtained financing in the amount of 7,655 million pounds sterling from a group of 27 top financial institutions to finance the cash component of the consideration and to refinance certain elements of ScottishPower’s existing debt.
| • | A new energy leader |
All of the foregoing means that integration of both companies will give rise to one of the largest European power company in terms of enterprise value. Finally, this integration will allow for creation of a new, more profitable, more solid, more balanced company with a greater focus on global growth.
| • | Pro forma Financial Information |
The pro forma financial information is appended to the report issued by the Board of Directors of Iberdrola relative to the capital increase, which has been filed with the Spanish securities regulator (CNMV) and is available to the public, both from the CNMV and from the company web site(www.iberdrola.com).
The pro forma financial information has been drawn up solely for reference, notably with a view to:
| • | Complying with the requirements of Appendix II to European Commission Regulation 809/2004 of 29 April 2004 relative to the application of European Parliament and Council Directive 2003/71/EC. |
| • | Providing information on how the operation might have affected the Iberdrola Group’s financial statements at 31 December 2006. |
On account of its very nature, pro forma financial information concerns a hypothetical situation and, as such, does not represent the actual financial position or earnings of the IBERDROLA Group integrated with SCOTTISH POWER.
Below is included the pro forma balance sheet and income statement at 31 December 2006, followed by explanations for the adjustments made. The audit firm Ernst & Young, S.L. has issued a special report on the revised pro forma financial information dated 21 February 2007.
| First Quarter 2007 financial results | 23 |
Pro forma balance sheet at 31 December 2006
MillIon Euros
ASSETS | Iberdrola | ScottishPower | Adjustments | Pro forma | |||||
Non-current assets | |||||||||
Fixed assets | 21,067 | 8,423 | 9,929 | (A) | 39,419 | ||||
Goodwill and intangible fixed assets | 900 | 374 | 6,440 | (B) | 7,714 | ||||
Investments recorded under equity method | 761 | 244 | — | 1,005 | |||||
Other non-current assets | 4,517 | 843 | — | 5,360 | |||||
Total non-current assets | 27,245 | 9,884 | 16,369 | 53,498 | |||||
Current assets | |||||||||
Cash and cash equivalents | 705 | 1,903 | (488 | ) (C) | 2,120 | ||||
Other current assets | 5,111 | 2,647 | 171 | (D) | 7,929 | ||||
Total current assets | 5,816 | 4,550 | (317 | ) | 10,049 | ||||
TOTAL ASSETS | 33,061 | 14,434 | 16,052 | 63,547 | |||||
SHAREHOLDERS’ EQUITY AND LIABILITIES | Iberdrola | ScottishPower | Adjustments | Pro forma | |||||
Net shareholders’ equity | |||||||||
Paid-in capital | 2,705 | 922 | (185 | )(E) | 3,442 | ||||
Other reserves | 6,053 | 751 | 5,675 | (F) | 12,479 | ||||
Earnings for the year | 1,660 | 2,204 | (1,895 | ) | 1,969 | ||||
Equity allocated to majority company partners | 10,418 | 3,877 | 3,595 | 17,890 | |||||
Minority interests | 149 | 12 | — | 161 | |||||
Total shareholders’ equity | 10,567 | 3,889 | 3,595 | 18,051 | |||||
Non-current liabilities | |||||||||
Financial debt | 12,618 | 4,989 | 9,049 | (G) | 26,656 | ||||
Other non-current liabilities | 3,419 | 2,078 | 3,408 | (D) | 8,905 | ||||
Total non-current liabilities | 16,037 | 7,067 | 12,457 | 35,561 | |||||
Current liabilities | |||||||||
Financial debt | 1,734 | 1,460 | — | 3,194 | |||||
Trade payables and related | 3,323 | 2,002 | — | 5,325 | |||||
Other current liabilities | 1,400 | 16 | — | 1,416 | |||||
Total current liabilities | 6,457 | 3,478 | — | 9,935 | |||||
TOTAL SHAREHOLDERS’ EQUITY AND LIABILITIES | 33,061 | 14,434 | 16,052 | 63,547 | |||||
| 24 | First Quarter 2007 financial results |
Pro forma income statement at 31 December 2006
Million Euros
| Iberdrola | ScottishPower | Adjustments | Pro forma | |||||||||
Operating income | 11,252 | 8,980 | — | 20,232 | ||||||||
Operating expenses | 7,363 | 7,028 | — | 14,391 | ||||||||
Depreciation and provisions | 1,235 | 382 | 373 | (H) | 1,990 | |||||||
EBIT | 2,654 | 1,570 | (373 | ) | 3,851 | |||||||
Net financial loss | (518 | ) | (278 | ) | (488 | ) (C) | (1,284 | ) | ||||
Income from equity-consolidated companies | 69 | 3 | — | 72 | ||||||||
Income from disposal of non-current assets | 181 | 3 | — | 184 | ||||||||
Consolidated pre-tax profit | 2,386 | 1,298 | (861 | ) | 2,823 | |||||||
Corporate income tax costs | 695 | 412 | (283 | ) (D) | 824 | |||||||
Profit for the period | 1,691 | 886 | (578 | ) | 1,999 | |||||||
Earnings from discontinued activities | — | 1,317 | (1,317 | ) (I) | ||||||||
Minority interests | (31 | ) | 1 | — | (30 | ) | ||||||
Profit for the period allocated to majority company shareholders | 1,660 | 2,204 | (1,895 | ) | 1,969 | |||||||
Explanation of adjustments |
| A | This adjustment factors in the impact of the allocation of part of the SCOTTISH POWER acquisition price for the fair value of its tangible fixed assets, representing a total of 10,301 million euros, net of depreciation in 2006. |
| B | This adjustment factors in the goodwill generated through the acquisition of SCOTTISH POWER for 5,011 million euros and the allocation of part of the SCOTTISH POWER acquisition price for the fair value of its intangible assets, representing a total of 1,429 million euros. |
| C | This adjustment factors in accrued interest on the bank financing taken out by IBERDROLA in connection with the acquisition of SCOTTISH POWER. |
| D | Primarily tax effects for the other adjustments. |
| E | This adjustment factors in the write-off of SCOTTISH POWER capital as a result of the pro forma consolidation process, giving a negative amount of 922 million euros, and the capital increase of 737 million euros carried out by IBERDROLA in connection with the acquisition. |
| F | This adjustment factors in the issue premium to be obtained by IBERDROLA as a result of the abovementioned capital increase, totaling 7,313 million euros, net of the write-off of SCOTTISH POWER reserves as a result of the consolidation. This also includes the impact of the adjustment indicated in Section I below on the balance sheet. |
| G | This adjustment factors in the bank financing taken out by IBERDROLA to pay for the acquisition. |
| H | This adjustment factors in the impact on depreciation for the year of the allocation of part of the SCOTTISH POWER acquisition price for the fair value of its net assets. |
| I | On 24 May 2005, SCOTTISH POWER considered that its equity interest in PacifiCorp was compliant with the conditions set out under IFRS 5: “Non-current assets held for sale and discontinued operations” for its consideration as held for the sale; the main implications of the application of this standard on SCOTTISH POWER’s financial information were as follows: |
| • | The transfer of each one of the sections from the profit and loss account over to only one line, recorded under “Earnings for the year from discontinued operations”. |
| • | Assets held for sale are valued at the lower of their book value or their fair value, less the costs required for their disposal. If the latter value is lower, the difference is booked against “Earnings for the year from discontinued operations”. |
The effective sale took place on 20 March 2006. As a result, the pro forma balance sheet does not include the equity interest in PacifiCorp. On the sale side, and for this report to be more representative of the Group resulting from IBERDROLA’s acquisition of SCOTTISH POWER, within the initial SCOTTISH POWER balances used to calculate the PRO FORMA FINANCIAL INFORMATION 1,317 million euros have been reclassified on the balance sheet, with this amount recorded as income under “Earnings for the year from discontinued operations” over the period from 1 October 2005 to 30 September 2006.
| * | Additional information, on our Web page:www.iberdrola.com |
Important information
“This notice is not intended as a purchase, sale or exchange offer or as a solicitation of a securities, purchase, sale or exchange offer. The shares of Iberdrola S.A. cannot be offered or sold in the United States, unless it is through an actual declaration of notification as provided for by the Securities Actor pursuant to a valid exemption from the duty of notification.”
| First Quarter 2007 financial results | 25 |
ANALYSIS OF Q1 2007
Energy Production
| GWh | vs. Q1 2006 | % Weight | ||||||||
Gas combined cycle | 8,880 | -213 | -2.3 | % | 35.9 | % | ||||
Wind and mini-hydroelectric | 2,725 | 472 | 21.0 | % | 11.0 | % | ||||
Hydroelectric | 4,861 | 2,475 | 103.7 | % | 19.6 | % | ||||
Nuclear | 6,509 | -153 | -2.3 | % | 26.3 | % | ||||
Fuel-oil | 15 | -551 | -97.3 | % | 0.1 | % | ||||
Coal | 1,212 | -485 | -28.6 | % | 4.9 | % | ||||
Cogeneration | 550 | 53 | 10.7 | % | 2.2 | % | ||||
TOTAL NET PRODUCTION | 24,752 | 1,598 | 6.9 | % | 100.0 | % | ||||
ENERGY DISTRIBUTED | 34,010 | 2.9% | ||||||||
Energy Production in Spain
| GWh | vs. Q1 2006 | % Weight | ||||||
Gas combined cycle | 2,719 | -33.0 | % | 14.9 | % | |||
Wind energy and mini-hydroelectric(1) | 2,725 | 21.0 | % | 15.0 | % | |||
Wind farms | 2,578 | 23.2 | % | — | ||||
Hydroelectric | 4,598 | 113.3 | % | 25.3 | % | |||
Nuclear | 6,509 | -2.3 | % | 35.7 | % | |||
Fuel-oil | 15 | -97.3 | % | 0.1 | % | |||
Coal | 1,212 | -28.6 | % | 6.7 | % | |||
Cogeneration | 430 | 14.7 | % | 2.4 | % | |||
TOTAL NET PRODUCTION | 18,208 | 2.5 | % | 100.0 | % | |||
ENERGY DISTRIBUTED | 26,756 | 2.0 | % | |||||
HYDRO ELECTRIC RESERVE LEVELS AT 31.03.07 | 7,154 GWh | (63.4%) |
Energy Production: Latin America
| GWh | vs. Q1 2006 | % Weight | ||||||
Gas combined cycle | 6,161 | 22.4 | % | 94.1 | % | |||
Hydroelectric | 263 | 14.3 | % | 4.0 | % | |||
Cogeneration | 120 | -1.6 | % | 1.8 | % | |||
TOTAL NET PRODUCTION | 6,544 | 21.5 | % | 100.0 | % | |||
ENERGY DISTRIBUTED (managed) | 7,254 | 6.2 | % |
| (1) | Includes 460 MW of international capacity with production of 274 GWh. For 2006: 316 MW with production of 151 GWh. |
| 26 | First Quarter 2007 financial results |
1. PRODUCTION: SPAIN
Group’s net production in Spain showed growth of 2.5% in the first quarter of 2007 compared to the same period during the previous fiscal year, reaching 18,208 GWh. It is important to emphasise that this increase in production by IBERDROLA was achieved during a quarter in which total net production by the Spanish electricity system overall has shown a drop of -0.5%. IBERDROLA has produced more than the system, and has moreover done so with a cleaner generation mix, reducing emissions by -37.1%:
| • | Hydroelectric production rose by 113.3%, in an increasingly hydroelectric environment where IBERDROLA has also carried out active management of existing reserves, which, together with the flexibility of the generation facilities, has allowed for more efficient management of the 55.3% increase experienced by hydroelectric production during the period in Spain overall. |
| • | Renewable energy production (wind and mini-hydroelectric) grew by 21%. Wind production grew by 23.2%, with noteworthy performance by wind production abroad, which reached 274 GWh during the period, or 10.6% of the Group’s total wind production. |
| • | Nuclear production remains stable, posting a slight decrease of -2.3%. This technology remains the one with the greatest contribution to the generation mix, with a weighting of 35.7%. |
| • | Combined-cycle production fell -33% to 2,719 GWh. This change shows the flexibility of IBERDROLA’s generation facilities, which allows the sources of production to be adapted to the conditions that arise during each period. |
| • | The significant reduction of production using more polluting sources of energy consolidated itself during the period, with a drop of -28.6% in coal production and a drop of -97.3% in fuel oil production, which, at only 15 GWh, practically reduced production from these energy sources to zero. |
Emissions have been reduced by 37.1% in year-on-year terms, reaching 133 gr/kWh, 2.8 times lower than emissions for the rest of the sector. The percentage of emission-free production rose to 76%, jumping from the 62.3% achieved during the same period of 2006.
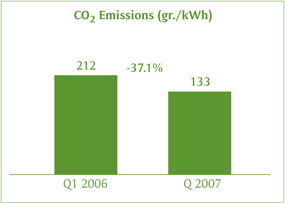
| First Quarter 2007 financial results | 27 |
IBERDROLA has obtained a market share of 26.45% on the wholesale market during the first quarter of 2007, out of total demand in Spain. Comparatively speaking, energy production can be broken down as follows:
| Q1 2007 | Q1 2006 | |||||
Gas combined cycle | 14.9 | % | 22.8 | % | ||
Renewable energy | 15.0 | % | 12.7 | % | ||
Hydroelectric | 25.3 | % | 12.1 | % | ||
Nuclear | 35.7 | % | 37.5 | % | ||
Fuel-oil | 0.1 | % | 3.2 | % | ||
Coal | 6.7 | % | 9.6 | % | ||
Cogeneration | 2.4 | % | 2.1 | % | ||
Total | 100 | % | 100 | % | ||
2. PRODUCTION: LATIN AMERICA
In Latin America, total production is up 21.5% to 6,544 GWh. This significant growth has been achieved thanks to new investments in combined-cycle plants entailing 94% of the total produced.
| Productión | Change | ||||
Mexico (c. cycles) | 5,778 | 24.2 | % | ||
South America | 766 | 4.2 | % | ||
Combined - cycle | 383 | 0.0 | % | ||
Hydroelectric | 263 | 14.3 | % | ||
Cogeneration | 120 | -1.6 | % | ||
TOTAL | 6,544 | 21.5 | % | ||
The increase posted in the region is due primarily to the 24.2% growth in combined-cycle production in Mexico thanks to the Altamira V combined-cycle plant (1,121 MW) going into operation and the full operation and greater availability of the Mexican plants of Monterrey (1,037 MW), Altamira (1,036 MW), Enertek (120 MW) and La Laguna (500 MW). In terms of hydroelectric power, it experienced growth of 14.3%.
3. MARKET: SPAIN
In the domestic market the total demand of IBERDROLA measured on the grid increased 2.0%, reaching 26,756 GWh. The number of users reached 10 million.
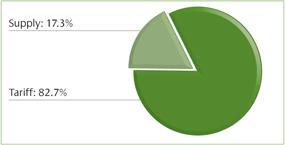
4. MARKET: LATIN AMERICA
The trend for demand at the three distributors in which IBERDROLA has an interest in Brazil is reflected in the following table:
Energy distributed (GWh) (under management) | Q1 2007 | vs.Q1 2006 | |||
Coelba | 3,132 | 4.9 | % | ||
Cosern | 984 | 10.7 | % | ||
Celpe | 2,282 | 7.0 | % | ||
TOTAL | 6,398 | 6.5 | % | ||
| 28 | First Quarter 2007 financial results |
Analysis of results for the period
Below is the interpretation adopted by IBERDROLA with respect to the following items:
Tariff Insufficiency
With regard to the tariff insufficiency estimated for 2007, sector-wide, and once the value of the emission rights consumed is discounted, the estimated tariff deviation could reach a figure on the order of € 75.8 million. According to Royal Decree 5/2005 of 11 March, the provisional percentage that would correspond to IBERDROLA for financing that tariff deviation would reach 35.01%, which entails a deviation of € 26.5 million.
Royal Decree 3/2006
Emission rights
According to the interpretation made of Royal Legislative Decree 3/2006 at IBERDROLA, and after the publication of the aforementioned Ministerial Order ITC/400/2007, the initial sector-wide deviation figure of € 75.8 million includes € 48.9 million corresponding to the value to be reimbursed for the emission rights assigned pursuant to the National Allowance Plan and consumed during the period. On the other hand, no other emission rights subsidies are considered, except those under the Special Regime, specifically those corresponding to Co-generation activity. The impact for IBERDROLA pertaining to Emission Rights according to the above interpretation, amounts to € -5.7 million, posted in the Generation business. This impact is calculated from the difference between the emission rights granted to co-generators for € 2.3 MM, and the cost of emission rights for the period, which amounts to € -8.0 MM.
Furthermore, the changes occurring with respect to CO2 emissions have been the following:
| Million Tn | Average price | |||
Allowances consumed | 2.7 | 2.95 |
No effect from assimilation to bilateral contracts
Insofar as bilateralisation, as of the publication of the Royal Decree on 2007 Tariffs, the provisional price for bilateral contracts ceases to be € 42.35/MWh, being assimilated to the market price, as stipulated in the aforementioned Royal Decree. In addition, following the publication of Ministerial Order ITC/400/2007, which governs this type of bilateral contract, the assimilation method under Royal Decree-Law 3/2006 has become void and only Article 2 thereof, on the deduction of the value of emission rights assigned for free to generating facilities, remains in effect. In this sense, OMEL announced on the 27th of February that as of the second intraday session on this date, the assimilation under Royal Decree-Law 3/2006 would no longer be carried out.
The most noteworthy aspects of the results for the first quarter of 2007 are the following:
€ Millions | Q1 2007 | vs. Q1 2006 | |||
Net Sales | 2,716.6 | -8.8 | % | ||
GROSS MARGIN | 1,572.5 | +5.3 | % | ||
EBITDA | 1,087.1 | +2.9 | % | ||
EBIT | 794.8 | +0.8 | % | ||
NET PROFIT | 458.2 | +13.6 | % |
| First Quarter 2007 financial results | 29 |
1. NET SALES
The Net Sales of the Group reached € 2,716.6 million at the end of the first quarter of 2007, a decrease of 8.8% compared to the same period of 2006. Growth in International (+4.6%) Engineering and Non-Energy (+36.2%), did not suffice to offset the drop in the Domestic Energy business (20.2%).

Net Sales for the Domestic Energy Business fall by 20.2% due to the effect of the lower prices obtained in Generation and Renewables. Nevertheless, Distribution achieved growth of 40.5% in Net Sales, deriving from two factors: the increase in remuneration for the regulated business and the lack of a negative impact from bilateralisation associated with Royal Decree 3/2006.
2. GROSS MARGIN
At a consolidated level, the Gross Margin reached € 1.572.5 million, with growth of 5.3% compared to what was obtained in the same period of 2006. Whilst International (+36%) and Engineering and Non-energy (+21.6%) improved substantially, the Domestic business (-1.4%) and Renewables (-5.5%) were affected by the aforementioned energy price situation.
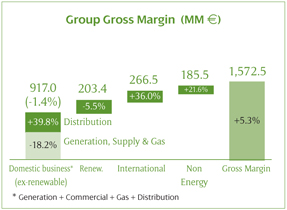
The Group’s total Procurement cost showed a significant reduction of 17.5%, as a result of a different production mix in Generation in Spain and due to less procurement in International.
The Gross Margin includes € -17 million due to the negative effect deriving from the devaluation of the Real in Brazil and the dollar in Mexico.
Breaking down the change in Gross Margin by business, the following aspects are noteworthy:
2.1 Domestic Energy Business
The Gross Margin reached E 1,120.4 million, showing a drop of -2.2% compared to the same period of 2006. For the Spain Energy business (excluding renewables), the decrease was -1.4%, which can be explained as follows: while the Distribution business posted an increase of 39.8%, the Generation, Commercial and Gas businesses together suffered a drop of -18.2%. The Renewables business alone showed a decline of -5.5%.
| 30 | First Quarter 2007 financial results |
Various factors have influenced the change in Gross Margin:
| • | The Distribution business rose by € 105.7 million (+39.8%), posting an increase of € 46 million thanks to the increase in the remuneration of regulated activities. In addition, it no longer shows any negative impact from Royal Decree 3/2006 in terms of bilateralisation, since the latter is carried out at market prices. In the first quarter of 2006, the negative impact from bilateralisation due to the effects of Royal Decree 3/2006 was € 47.6 million. |
| • | Generation experienced a drop of 23.1% due to a 40.9% decrease in the pool price. A similar amount of production under the Ordinary Regime (-0.6%), with a generation mix of variable low-cost and cleaner technologies, lowered Procurement costs by 43.1%. The impact due to emission allowances consumed during the period was only € -5.7 million, compared to the € 101.2 million posted during the same period of 2006. |
| • | The growing contribution of the Supply & Gas business, as a result of the policy followed in the liberalised market and the flexibility of the portfolio of gas contract (+35.6 million). |
| • | Renewables posted a drop of 5.5% in terms of Gross Margin, much lower than the drop of 21.8% in prices, thanks to the greater installed capacity (+16.3%), which has translated into greater wind production (+ 23.2%). |
2.2 International Business
The Gross Margin reached € 266.5 million, a 36.0% increase, due to the good evolution of the Group’s businesses in the region. The energy generated grew by 21.5% thanks to the Altamira V cycle (1,121 MW) in operation since the fourth quarter of 2006, together with a greater availability index and improvements in efficiency at the rest of the plants. Energy distributed grew by 6.2%. Procurement was reduced by 11.3%. Another factor to consider is the devaluation of the exchange rate for the region’s local currencies: the real in Brazil (-4.4%) and the U.S. dollar, which affects Mexico (-8.6%).
2.3 Non-Energy and Engineering and Services
They contributed € 185.5 million to the total Gross Margin, showing growth of 21.6%, in a quarter in which the Real Estate Business improved its contribution by €` 45.5 million following various transactions closed during the period, which was offset partially by the lower contribution by Corporación IBV in terms of Gross Margin as a result of the sale of Azertia and of Landata during the 2006 financial year.
| First Quarter 2007 financial results | 31 |
3. EBITDA / GROSS OPERATING RESULT
The consolidated EBITDA has increased by 2.9% up to € 1,087.1 million. Added to the changes already explained under Gross Margin should be an analysis of Net Operating Expenses, which increased by 12.3%, with the following items being noteworthy:
| • | The decrease in Net Personnel Expenses of 4.0%. |
| • | A 31.5% increase in Net External Services Reported. It includes two effects of an extraordinary nature: € 14.1 million of attendance premium to the General Shareholders Meeting and other non-recurring expenses of € 17.6 million |
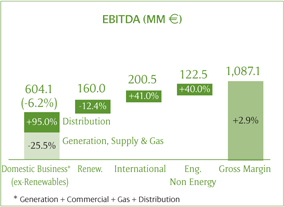
The change in Net Operating Expenses in homogeneous terms, deducting the non-recurring items, reaches growth of 4.2% (versus the 12.3% reported); lower than the 5.3% increase in Gross Margin. In addition, there is a positive impact due to exchange rate of € 4 million, associated with the changes in the currencies of the businesses in Latin America.
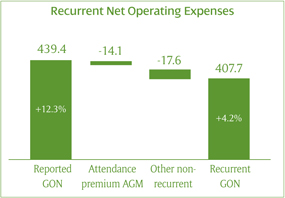
The breakdown of the Net Operating Expenses Reported is as follows:
Euros MM | Q12007 | vs. Q1 2006 | |||
Net Personnel Expenses | 202.9 | -4.0 | % | ||
Personnel | 243.2 | -3.9 | % | ||
In-house work on fixed assets | -40.3 | -3.4 | % | ||
Net External Services | 236.5 | 31.5 | % | ||
External Services | 275.3 | 23.7 | % | ||
Other operating revenues | -38.8 | -8.9 | % | ||
TOTAL | 439.3 | 12.3 | % | ||
On the other hand, Taxes decreased by 7.6% to € 48.3 million, a change that is due to issues associated with provisions for the payment of various taxes that have already lapsed. This lower tax payment more than offsets the increases in Real Estate Tax (IBI) associated with the new facilities that have gone into operation.
| 32 | First Quarter 2007 financial results |
4. EBIT / NET OPERATING RESULT
TheEBITreached €794.8 million,for an increase of 0.8% compared to the same period of 2006. Amortisation and Provisions are up 9.0% (€ 24.1 million). The increase in Amortisation and Provisions is mainly due to:
| • | Amortisations increased by 13.8% to reach € 283.8 million. This increase was mainly driven by the new facilities that have gone into operation. |
| • | Provisions decreased by € 10.2 million to € 8.5 million, as a result of a change in the provisions for the Domestic Energy Business. |
Euros MM | Q1 2007 | Q1 2006 | % Change | ||||
Amortisation | 283.8 | 249.5 | +13.8 | % | |||
Provisions | 8.5 | 18.7 | -54.5 | % | |||
TOTAL | 292.3 | 268.2 | +9.0 | % | |||
5. FINANCIAL RESULT
TheFinancial Resultreached €163.5 million, which represents an almost flat evolution (+0.1%) vs. the result for the same period of 2006. Before deducting tariff insufficiency impact, the balance of debt remains stable at 13,061 million euros by March 2007 compared to 13,031 million euros for the same period of 2006.
Furthermore, in a context of rising interest rates, the average cost of the debt reached 4.65% during the first quarter of 2007, compared to 4.6% during the same period of the previous year.
The breakdown of the Financial Results is as follows:
Euros MM | Q1 2007 | Q12006 | % Change | ||||
Financial Revenues | 65.8 | 40.7 | +61.7 | % | |||
Financial Expenses | 229.2 | 204.1 | +12.3 | % | |||
TOTAL | -163.4 | -163.4 | +0.1 | % | |||
6. RESULTS OF COMPANIES CONSOLIDATED USING THE EQUITY METHOD
The Results of Companies Consolidated by the Equity Method posted an increase of € 15.8 million up to € 19.9 million, with most of the results being contributed by the financial stakes. The breakdown is as follows:
Euros MM | Q1 2007 | Q1 2006 | % Changee | |||
Financial stakes | 17.5 | 2.5 | 15.1 | |||
Rest | 2.4 | 1.6 | 0.7 | |||
TOTAL | 19.9 | 4.1 | 15.8 | |||
The increase of these results for financial stakes is due basically to the greater contribution by Gamesa.
| First Quarter 2007 financial results | 33 |
7. NON-RECURRENT RESULTS
Non-recurrent results reached € 9.3 million, resulting from the sale of real estate assets, a usual practice engaged in by the Group.
8. NET PROFIT
Profit Before Taxes grew by +4.7% to reach a figure of 660.5 million euros. They showed slightly higher growth than the change in Net Operating Profit (+0.8%), considering the flat evolution in Financial Result and the increase of 23.5 million euros shown by the Results of Companies Consolidated by the Equity method and the Non-recurrent Results, explained above.
The effective tax rate is 29.3%, in accordance with the tax rules currently in force, which is below the 35.1% seen in the same period of 2006.
Finally, theNet Profitreached €458.1 million,a 13.6 % increase compared to the Net Profit achieved during the same period of 2006. This increase is in line with the double-digit growth expectations for the whole 2007 financial year.
| 34 | First Quarter 2007 financial results |
Results by business
1. ENERGY BUSINESS: SPAIN
1.1 Generation
a) Gross Margin
To analyse the change in this item during the first quarter of 2007, the following must be borne in mind:
| • | A similar amount of production under the Ordinary Regime (-0.6%), although with greater weight for variable low-cost emission-free production technologies, which reaffirms the flexibility of IBERDROLA’s generation mix (hydraulic +113.3%; nuclear -2.3%). |
| • | In addition, strong decreases were experienced in production through thermal energy sources -28.6% for coal, -97.3% for fuel-oil, and -33.0% for combined cycles). |
| • | A drop of 41% in the pool price. |
The Gross Margin for the Generation Business posted a 23.1% decrease. It is worth highlighting the following:
| • | Net Sales decreased by 36.9%, in line with the aforementioned drop in the pool price (-41.0%). |
| • | Procurement costs dropped -43.1%, as a result of the different production mix mentioned above. The average cost of fossil fuel (not including nuclear) stood at 38.4 € / MWh. |
Fuel Cost & CO2
Eur/MWh | Q1 2007 | Q1 2006 | % | ||||
Avg Fuel Cost* | 38.4 | 38.5 | -0.1 | % | |||
Co2 Cost (Eur/Ton) | 2.95 | 25.9 | -88.6 | % |
| * | Includes the C. Cycles, Coil & Oil |
• | In addition to the procurement cost, a negative impact of € 8.0 million was posted for the cost of the emission allowances consumed, well under the € 107.4 million seen during the same period of 2006. The average cost per CO2 allowance for the period amounted to 2.95€/t, as against 25.89€/t during the first quarter of 2006. |
b) Operating Profit/EBIT
EBIT recorded a decrease of 44.8% in relation to the same period of the previous fiscal year, reaching € 251.2 million euros. In terms of EBITDA, which totalled € 368.7 million, the decrease experienced was of 33.1%.
In addition to what was already mentioned under Gross Margin, an increase of 17.3% took place in Net Operating Expenses (€ +20.5 million), which include E 17.6 million in non-recurring items. The Recurrent Net Operating Expenses show moderate growth of only 2.4%:
| • | Net External Services increased by 37.3%. Added to the € 17.6 of an extraordinary nature mentioned above are the effects of the new installed capacity in combined cycles. |
| First Quarter 2007 financial results | 35 |
| • | Net Personnel Expenses posted a decrease of 7.3%, with the lower cost deriving from the cutting of personnel under the Early Retirement Plan. |
Amortisation & Provisions have increased by 21.9% due primarily to the new facilities put into operation. Taxes posted a slight increase of 3.3% associated with the Real Estate Tax (IBI) on the new facilities put into operation.
| • | The key figures for this Business are: |
GENERATION (Euros MM) | Q1 2007 | vs. Q1 2006 | |||
Net Sales | 848.9 | -36.9 | % | ||
Gross Margin | 524.0 | -23.1 | % | ||
EBITDA | 368.7 | -33.1 | % | ||
EBIT | 251.2 | -44.8 | % |
1.2 Supply & gas
a) Gross Margin
In terms of theGross Margin for the Supply business,the following is noteworthy:
| • | The significant reduction in the volumes of electricity sold (-66.1 %). |
| • | The policy of active management and optimization of the gas procurement portfolio. |
It thus manages to show a positive contribution of up to € 25.5 million against the losses of € 10.1 million posted during the same period of 2006.
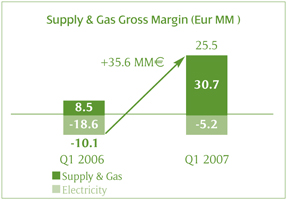
By units, the following is also worth noting:
| • | Electricity:An improvement from the € -18.6 million of the first quarter of 2006 to the € -5.2 million recorded as of March 2007, where the decrease in the volumes of electricity sold should be taken into account. |
| • | Gas: Its contribution to the Gross Margin grew by € 22.2 million, standing at € 30.7 million in the first quarter of 2007. |
b) Operating Profit / EBIT
The policy of optimising the gas and reducing exposure to the electricity business has managed to show a positive contribution in terms of EBITDA of € 21.7 million, as against losses of € -27.3 million during the same period of 2006. In terms of EBIT, a positive contribution is also shown during the first quarter of 2007 in the amount of € 20.7 million after making € 1 million in amortisation, appreciably improving the progress of the business following the € -29.4 million in losses reached in terms of EBIT at the end of the first quarter of 2006.
| 36 | First Quarter 2007 financial results |
In addition to what was already stated in terms of Gross Margin, the efficiency of the business improved significantly as a result of the policy followed, being reflected in a significant reduction in Operating Expenses, down € 1.2 million (-8.8%), with drops in Net Personnel Expenses (-52.3%) and in Net External Services (-22.8%), linked to the lower level of activity within the framework of a new more efficient organisational structure.
| • | The key figures for this Business are: |
SUPPLY (Eur MM) | Q12007 | vs. Q1 2006 | |||
Net Sales | 445.4 | -28.0 | % | ||
Gross Margin | 25.5 | N/A | |||
EBITDA | 21.7 | N/A | |||
EBIT | 20.7 | N/A |
1.3. Renewables
a) Gross Margin
The following factors are especially noteworthy in the change in the Renewables business throughout the first quarter of 2007:
| • | Following the aforementioned evolution undergone by the pool price, renewable energy prices are down 21.8%. At the end of the first quarter of 2007, 99% of the facilities are operating under the market participation system. |
| • | Total installed capacity rose 16.3% (+638 MW) to 4,552 MW. This increase in capacity has translated into growth of 23.2% in domestic and international wind production, up to 2,578 GWh. Total renewable energies production (wind plus mini-hydro) grew 21.0%. The growth achieved in renewable production is practically double that experienced by the whole Spanish electric system, which was at 11.8%. |
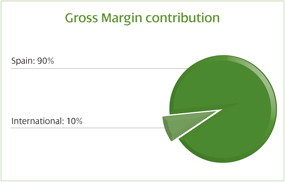
| • | International Renewables accounted for 10.1 % of installed capacity and for 10.1 % of production in the first quarter of 2007. |
| • | The 21% increase in production has managed to lessen the effects of the aforementioned 21.8% drop in prices, so that the decrease posted in terms of Gross Margin is of only 5.5% to € 203.4 million. The Gross Margin for Renewables already represents 28% of the total obtained for generation by IBERDROLA in Spain. |
b) Operating Profit / EBIT:
The EBIT posted a drop of 24.8% to € 106.1 million due to the following factors:
| First Quarter 2007 financial results | 37 |
| • | The EBITDA showed a decrease of 12.4%, slightly higher than the fall experienced in terms of Gross Margin as a result of the growth (+34.3%) in Net Operating Expenses driven by the new facilities that have become operational and the significant increase in international activity. |
The EBITDA margin remains at levels very close to 80%, despite the price situation described. In addition, the contribution by Renewables to the Group’s EBITDA continued its growth trend, to reach 14.7%, rising from the 14.3% posted for the 2006 financial year overall.
| • | Amortisation & Provisions are 29.3% higher, due to the addition of new installed capacity during the financial year. |
Insofar as Net Operating Expenses, it is important to highlight the increase in the international area, up E 6.4 million, reaching € 8.0 million and placing overall Net Operating Expenses for the business at € 41.1 million (+34.3%).
| • | The key operating figures for this business are as follows: |
RENEWABLES (Million euros) | Q1 2007 | vs. Q1 2006 | |||
Net Sales | 203.4 | - 5.5 | % | ||
Gross Margin | 203.4 | - 5.5 | % | ||
EBITDA | 160.0 | -12.4 | % | ||
EBIT | 106.1 | -24.8 | % |
1.4. Distribution
a) Gross margin
The Gross Margin of the Distribution business experienced growth of 39.8%, to reach € 371.1 million, primarily as a result of the following factors:
| • | Positive effect of € 46 million reflecting the increase in remuneration of regulated activities in line with the Royal Decree on 2007 Tariffs. |
| • | Lack of negative impact due to bilateralisation resulting from the application of Royal Decree 3/2006 of 24 February. At the end of the first quarter of 2006, the negative impact posted for that reason reached € 47.6 million. Since the publication of the Royal Decree on 2007 Tariffs, the settlement price for bilateral contracts ceases to be the provisional one of 42.35 €/MWh), being assimilated to the market price, as stipulated in the aforementioned Royal Decree on tariffs. In addition, following the publication of Ministerial Order ITC/400/2007, which governs this type of bilateral contracts, the assimilation method under Royal Decree-Law 3/2006 has remained without effect. |
b) Operating Profit / EBIT
The EBITDA for Distribution is up 95% (€ 226.5 million), given that the growth posted in terms of Gross Margin is combined with an 8.7% decrease in Net Operating Expenses, with various efficiency measures made. Net Personnel Expenses were down 12.5% and Net External Services experienced a drop of 6.1 %.
| 38 | First Quarter 2007 financial results |
The EBIT for Distribution grew by € 124.8 million (+242%) to € 176.3 million, given that the growth posted in terms of EBITDA is combined with a 22.3% decrease in Amortisation & Provisions, reaching € 50.3 million, due mainly to the change in provisions because of the inclusion of some non-recurring items in 2006, partially offset by growth of 25.4% in Taxes, associated with increased demand and the switch from free to regulated tariff energy.
| • | The key figures for this Business are as follows: |
DISTRIBUTION (Million euros) | Q1 2007 | vs. Q1 2006 | |||
Net Sales | 373.1 | 40.5 | % | ||
Gross Margin | 371.2 | 39.8 | % | ||
EBITDA | 226.6 | 95.0 | % | ||
EBIT | 176.3 | 242.3 | % |
1.5 Corporation
This includes eliminations of inter-group expenses between the corporation and the businesses.
2. INTERNATIONAL BUSINESS
a) Gross Margin
Net Sales from International increased 4.6% to reach € 611.4 million. Mexico, with a 60.5% contribution, is the area making the greatest relative contribution, thanks to increases in production, with the new Altamira V (1,121 MW) plant on line since the fourth quarter of 2006, along with greater plant availability. Also notable is the increase in Revenues in Brazil by 15.1%, resulting essentially from increased demand and from the tariff adjustments.
The Gross Margin for the International business is up 36% (€ +70.6 million) to € 266.5 million, an increase achieved even considering the negative exchange rate impact. The change in the Gross Margin for the Latin America region can be broken down as follows:
| • | Increase in the Gross Margin in functional currency: € +87.8 million |
| • | Exchange rate effect: € -17.2 million, due to the depreciation of the U.S. dollar (-8.6%) and of the Brazilian real in relation to the euro (-4.4%). |
InMexico-Guatemala,the Gross Margin amounted to € 104.9 million (+32.8%). This increase is due to the full contribution to results by the new combined cycles and the significant improvements in plant efficiency and availability, which together have led to a 24.2% increase in production in the area. The exchange rate impact is slightly negative, with the dollar posting a devaluation of-8.6%, the effect of which is € -10.2 million.
InBrazil,the Gross Margin showed a positive change of 38.2% (to € 161.6 million), thanks to a greater contribution from the distribution businesses arising from growth in demand (+6.5%), tariff adjustments and reviews that added another € 22.2 million, and the larger contribution of the Generation business. The exchange rate effect is also slightly negative following the devaluation of the real in relation to the euro (-4.4%), with an effect of € -7 million.
| First Quarter 2007 financial results | 39 |
b) Operating Profit/ EBIT
The change in International EBIT, which has increased 53.5% to € 156.9 million, reflects an increase in EBITDA of 41% and moderate growth of 9% in Amortisation & Provisions, deriving primarily from the aforementioned plants going into operation. EBITDA growth in local currency reached 50.4%.
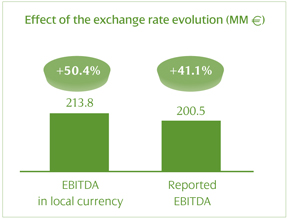
As far as EBITDA, it posted growth of +29.8% in Mexico, mainly as a result of greater activity in Generation. In South America, it rose +48.8% due to the change already described in the Gross Margin and due to the increase in efficiency.
Thus, total EBITDA growth in the International business is at 41 %.
The EBITDA per region and business is broken down as follows:
| • | Mexico-Guatemala |
EurMM | Q1 2007 | vs. Q1 2006 | |||
Generation | 63.8 | 38.7 | % | ||
Distribution | 17.6 | 5.4 | % | ||
TOTAL | 81.4 | 29.8 | % | ||
| • | South America |
EurMM | Q1 2007 | vs. Q1 2006 | |||
Generation | 18.9 | -3.1 | % | ||
Distribution | 100.2 | 67.0 | % | ||
TOTAL | 119.1 | 49.8 | % | ||
The 23% increase in Net Operating Expenses was mitigated by the impact of the change in the exchange rate (€ +3.9 million).
By geographical areas, the breakdown is as follows:
EurMM | Q1 2007 | vs. Q1 2006 | |||
Mexico-Guatemala | 23.4 | 43.6 | % | ||
South America | 40.3 | 13.5 | % | ||
TOTAL | 63.7 | 23.0 | % | ||
The key operating figures for the business are:
INTERNATIONAL (Eur MM) | Q1 2007 | vs. Q1 2006 | |||
Net Sales | 611.4 | 4.6 | % | ||
Gross Margin | 266.5 | 36.0 | % | ||
EBITDA | 200.5 | 41.0 | % | ||
EBIT | 156.9 | 53.5 | % |
| 40 | First Quarter 2007 financial results |
3. CONSTRUCTION BUSINESSES AND ENGINEERING & NON-ENERGY
a) Gross Margin
Non-energy and Engineering & Construction
Net Sales grew 36.2% to € 470 million in a quarter with a strong contribution by Iberdrola Inmobiliaria (E +82.4 million to € 126.1 million), following the closing of various transactions during the quarter, and a continued high level of contribution by the activity of the Engineering and Construction businesses, which contributed € 177.5 million in Net Sales, growing 57% (€ + 64.7 million). These increases were partially offset by the decrease in the contribution of Corporación IBV (€ -29.6 million) as a result of the sale of Azertia and of Landata in 2006.
The Gross Margin reached € 185.5 million, up 21.6% compared to the same period of 2006, thanks to the greater contribution from Iberdrola Inmobiliaria and the continued high level of contribution by Engineering and Construction, despite the effects of the aforementioned change in the accounting perimeter at Corporación IBV. It can be broken down as follows:
EurMM | Q1 2007 | Q1 2006 | Change million | |||
Engineering & Construction | 46.3 | 45.1 | +1.2 | |||
IBERDROLA Inmobiliaria | 68.2 | 22.7 | +45.5 | |||
Corporación IBV | 19.5 | 41.3 | -21.8 | |||
Other services | 51.5 | 43.5 | +8.0 | |||
TOTAL | 185.5 | 152.6 | +32.9 | |||
The increase of € 45.5 million at Iberdrola Inmobiliaria is due to the closing of various transactions during the quarter. As for Engineering & Construction (€ +1.2 million), Engineering shows growth in its contribution that is partially offset by the seasonality that affects the services area. The drop of € 21.8 million at Corporación IBV is attributable to the sale of Azertia and of Landata in 2006, which ceased contributing to results.
b) Operating Profit / EBIT
In terms of EBITDA, the contributions can be broken down as follows:
| • | In terms of the contribution of Iberdrola Engineering & Construction, the EBITDA of Engineering reached € 12.5 million, growing 96%, while the one for Services reached € 4.9 million, falling due to the seasonality proper to the business. The growth experienced in volumes also had an effect in terms of Net Operating Expenses, whereby the EBITDA for the business showed a drop of 42.7%. |
| • | The contribution of Iberdrola Inmobiliaria is € 61.1 million, in line with the trend shown in terms of Gross Margin, with a greater contribution this quarter. |
| • | Corporación IBV, which is consolidated by proportionate consolidation according to IFRS, has contributed € 5.2 million through its various industrial businesses. |
| • | The contribution of Other Services was € 38.9 million. |
The key operating figures for the business are:
| First Quarter 2007 financial results | 41 |
EurMM | Q12007 | vs. Q1 2006 | |||
Net Sales | 470.0 | 36.2 | % | ||
GROSS MARGIN | 185.5 | 21.6 | % | ||
EBITDA | 122.5 | 40.0 | % | ||
EBIT | 103.9 | 45.9 | % |
The main items forIberdrola Inmobiliariaat the end of the first quarter of 2007 are the following:
| • | Iberdrola Inmobiliariabusiness data: |
PORTFOLIO OF BUILDABLE AREA-RESIDENTIAL USE (sqm) | ||
Total | 1,551,909 | |
Under construction | 115,137 | |
Under management | 403,059 | |
In planning | 1,033,713 | |
PORTFOLIO OF BUILDABLE AREA-COMMERCIAL USE (sqm) | ||
Total | 567,581 | |
Under construction | 4,431 | |
Under management | 192,954 | |
In planning | 370,196 | |
| • | Iberdrola InmobiliariaBalance Sheet data: |
| MM€ | ||
TOTAL ASSETS | 1,763 | |
INTANGIBLE FIXED AND INVESTMENT ASSETS | 523 | |
CURRENT ASSETS | 1,191 | |
SHAREHOLDERS’ EQUITY | 731 | |
FINANCIAL DEBT | 70 |
| • | Iberdrola InmobiliariaIncome Statement data: |
| EurMM | Vs Q1 2006 | ||||
NET SALES | 126.1 | +188.5 | % | ||
GROSS MARGIN | 68.2 | +199.9 | % | ||
EBITDA | 61.1 | +301.7 | % | ||
EBIT | 59.7 | +327.4 | % | ||
Non Current Assets | 0 | 0 | |||
NET PROFIT | 35.9 | +506.5 | % |
| 42 | First Quarter 2007 financial results |
Balance sheet
January-March 2007 Period
| Million euros | vs. Dec. 2006 | ||||
TOTAL ASSETS | 34,002 | 2.9 | % | ||
TANGIBLE & INTANGIBLE FIXED | 22,703 | 1.1 | % | ||
LONG-TERM FINANCIAL INVESTMENTS | 2,828 | 3.8 | % | ||
SHAREHOLDERS’ EQUITY | 10,564 | -0.03 | % | ||
ADJUSTED NET DEBT | 13,061 | -0.4 | % |
The Balance Sheet of IBERDROLA at 31 March 2007 shows Total Assets of € 34,002 million, highlighting the maintenance of its financial strength, even taking into account the investments made during the period (€ 506 million).
The leverage ratio in March 2007 stood at 55.3%, compared to 57.9% in March 2006. If financing of the tariff insufficiency is taken into account, the adjusted leverage at March of this year would be 54.1% (in March 2006, it would have been 54.7%).
Thus, the adjusted financing of the tariff insufficiency corresponding to IBERDROLA reached € 606 million in March 2007, after the securitization of the tariff insufficiency rights attributable to IBERDROLA in 2006.
Analysis of the Balance Sheet
1. FIXED ASSETS
Total investments during the period from January to March 2007 added up to € 506 million. Their breakdown is as follows:

| Jan-March 2007 | % | ||||
Spain | 342 | 67.6 | % | ||
Generation | 79 | ||||
Renewables | 91 | ||||
Distribution | 115 | ||||
Other | 57 | ||||
Mexico | 18 | 3.6 | % | ||
Generation | 15 | ||||
Distribution | 3 | ||||
South America | 41 | 8.1 | % | ||
Generation | 15 | ||||
Distribution | 26 | ||||
Other International | 105 | 20.7 | % | ||
TOTAL | 506 |
| First Quarter 2007 financial results | 43 |
With respect to investments in Spain, those made in the Company’s basic activity, both in production and distribution, stand out, totalling € 285 million, broken down as follows:
| • | € 79 million allocated to the Generation business. |
| • | € 91 million allocated to the Renewables business. |
| • | € 115 million allocated to the Distribution business |
Under the heading “Other,” included in the Spain section, it is worth highlighting the transaction, completed in January, increasing the stake in Medgas from 12% to 20%, in addition to which there are various transactions by the Non-Energy businesses.
Investments in Mexico have mainly focused on the combined cycle of Tamazunchale, with € 11 million. As far as Brazil is concerned, investments have been made both in the distribution, as well as in the generation business, being financed in large part through funds generated in Brazil.
Under the heading “Other International”, the investments pertaining to the international area for Renewables are included, with notable investments in Greece, Portugal, the United States, Poland and France.
2. SHARE CAPITAL
TheShare Capitalat 31 December 2006 was comprised of901,549,181 bearer shareswith a par value of € 3 each.
On 2 January 2007, an interim dividend charged to the 2006 financial year in the amount of € 0.45 per share was paid.
3. FINANCIAL DEBT
The adjusted net financial debt at the end of March totalled € 13,061 million, and the financial leverage stood at 55.3%. If financing of the tariff insufficiency is taken into account, which at March 2007 amounted, in the case of IBERDROLA, to € 606 million, the adjusted net financial debt would be € 12,455 million and the adjusted leverage would reach 54.1%
Of particular relevance is the change in the Company’s financial cost, which at March 2007 stood at 4.65%, 5 basis points higher than in march 2006, which suggests significant financial cost containment considering the upward trend in interest rates.
The debt structure can be broken down by currency and interest rate as follows:
| 44 | First Quarter 2007 financial results |
| March 2007 | March 2006 | |||||
Euro | 86.4 | % | 84.8 | % | ||
Dollar | 8.3 | % | 9.8 | % | ||
Real | 4.8 | % | 5.0 | % | ||
Other currencies | 0.5 | % | 0.5 | % | ||
Fixed Rate | 57 | % | 58 | % | ||
Capped Rate | 9 | % | 12 | % | ||
Floating Rate* | 34 | % | 30 | % |
(*) | Without the tariff insufficiency (€ 606 million) and without the sector´s CO2 financing (€ 306 million), the floating rate % would be reduced to 30% in March 2007. |
Note: At March 2007, IBERDROLA had already signed Forward Swaps amounting 1,061 million euros and 200 million US dollars, to become effective almost entirely in 2007.
In line with the policy to minimise the Company’s financial risks, it is necessary to recall that currency risks have continued to be mitigated by financing investments in Latin America in local currencies (the real, in the case of Brazil) or in their functional currencies (the dollar, in the case of Mexico).
The debt structure per company is shown in the following table:
| March 2007 | March 2006 | |||||
IBERDROLA, S.A | 80.1 | % | 84.8 | % | ||
Generation | 0.5 | % | 0.5 | % | ||
Networks | 0.9 | % | 0.9 | % | ||
Mexico | 7.9 | % | 4.7 | % | ||
South America | 4.6 | % | 5.0 | % | ||
Renewables | 4.7 | % | 2.8 | % | ||
Iberdrola Inmobiliaria & others | 1.3 | % | 1.3 | % | ||
Total | 100 | % | 100 | % | ||
The breakdown of the debt by product type is as follows:
| March 2007 | March 2006 | |||||
Euro Bonds | 39.6 | % | 39.7 | % | ||
US PP | 4.3 | % | 5.1 | % | ||
Rest of Bonds | 2.7 | % | 5.4 | % | ||
Domestic com. paper | 4.5 | % | 3.6 | % | ||
Euro com. paper (ECP) | 1.4 | % | 3.7 | % | ||
Euro loans | 35.8 | % | 33.8 | % | ||
Other curr. loans | 11.7 | % | 8.7 | % | ||
Total | 100 | % | 100 | % | ||
Million euros | March 2007 | Dec. 2006 | ||||
Shareholders’ equity | 10,564 | 10,567 | ||||
Gross Debt | 14,599 | 14,353 | ||||
Cash | 1,012 | 705 | ||||
Capitalised derivatives | 87 | 98 | ||||
IFTs | 143 | 132 | ||||
CO2 Financing | 296 | 299 | ||||
Adjusted Net Debt | 13,061 | 13,119 | ||||
Leverage (*) | 55.3 | % | 55.4 | % |
| • | Without the effect of tariff insufficiency, the adjusted leverage stands at 54.1% at March 2007, compared to 54,3% in December 2006. |
4. WORKING CAPITAL
Net Working Capital was down by € 38 million, compared to the end of the 2006 financial year. This result derives fundamentally from an increase in current assets affected by an increase in inventories and in treasury instruments, offset by an increase in current liabilities as a result of changes in certain provisions and accounts payable.
| First Quarter 2007 financial results | 45 |
5. FUNDS GENERATED IN OPERATIONS
The Funds Generated from Operations at March 2007 stood at € 721.2 million, representing an increase of 8% in relation to March 2006.
Contribution by business to Profits and Loss account
| Sales | Operat. Profit | Net Profit | |||||||
Spain Business | 77.5 | % | 80.3 | % | 78.7 | % | |||
International Business | 22.5 | % | 19.7 | % | 21.3 | % | |||
TOTAL | 100 | % | 100 | % | 100 | % | |||
| 46 | First Quarter 2007 financial results |
Income Statement
First Quarter 2007
(Unaudited)
Million Euros
| Jan-March 2007 | Jan-March 2006 | % | |||||||
NET SALES | 2,716.6 | 2,978.4 | (8.8 | ) | |||||
PROCUREMENTS | (1,136.1 | ) | (1,377.1 | ) | (17,5 | ) | |||
EMISSION ALLOWANCES | (8.0 | ) | (107.4 | ) | (92,6 | ) | |||
GROSS MARGIN | 1,572.5 | 1,493.9 | 5,3 | ||||||
EMISSION ALLOWANCES | 2.3 | 6.2 | (62.9 | ) | |||||
NET OPERATING EXPENSES | (439.4 | ) | (391.2 | ) | 12.,3 | ||||
Net Personnel Expenses | (202.9 | ) | (211.4 | ) | (4.0 | ) | |||
Personnel | (243.2 | ) | (253.1 | ) | (3.9 | ) | |||
In house work on fixed assets | 40.3 | 41.7 | (3.4 | ) | |||||
Net External Services | (236.5 | ) | (179.8 | ) | 31.5 | ||||
External services | (275.3 | ) | (222.5 | ) | 23.7 | ||||
Other operating revenues | 38.8 | 42.7 | (9.1 | ) | |||||
TAXES | (48.3 | ) | (52.3 | ) | (7.6 | ) | |||
EBITDA | 1,087.1 | 1,056.6 | 2.9 | ||||||
AMORTISATION and PROVISIONS | (292.3 | ) | (268.2 | ) | 9.0 | ||||
EBIT | 794.8 | 788.4 | 0,8 | ||||||
TOTAL FINANCIAL REVENUES | 65.8 | 40.7 | 61.7 | ||||||
Financial revenues | 41.9 | 19.4 | 116.0 | ||||||
Positive exchange rate differences | 8.1 | 1.3 | 523.1 | ||||||
Capitalised financial expenses | 15.8 | 20.0 | (21.0 | ) | |||||
TOTAL FINANCIAL EXPENSES | (229.2 | ) | (204.1 | ) | 12.3 | ||||
Interest expenses | (169.7 | ) | (152.4 | ) | 11.4 | ||||
Negative exchange rate differences | (11.4 | ) | (2.9 | ) | 293.1 | ||||
On pension funds | (8.4 | ) | (8.8 | ) | (4.5 | ) | |||
Change in provision for short-term financial investments | (0.8 | ) | (0.2 | ) | N/M | ||||
Other financial expenses | (38.9 | ) | (39.8 | ) | (2.3 | ) | |||
RESULTS FROM COMPANIES CARRIED BY EQUITY METHOD | 19.9 | 4.1 | 385.4 | ||||||
RESULTS FROM NON-CURRENT ASSETS | 9.3 | 1.6 | 481.3 | ||||||
PROFIT BEFORE TAXES | 660.6 | 630.7 | 4.7 | ||||||
Corporate income tax | (193.8 | ) | (221.6 | ) | (12.5 | ) | |||
Minorities | (8.6 | ) | (5.9 | ) | 45.8 | ||||
NET PROFIT | 458.2 | 403.2 | 13.6 |
| First Quarter 2007 financial results | 47 |
Balance Sheet
First Quarter 2007
(Unaudited)
Million Euros
| March 2007 | December 2006 | Change | |||||
FIXED ASSETS | 25,532 | 25,188 | 344 | ||||
Tangible Fixed Assets | 21,737 | 21,564 | 173 | ||||
Intangible Fixed Assets | 967 | 900 | 67 | ||||
Long-term financial investments | 2,828 | 2,724 | 104 | ||||
DEFERRED TAXES | 1,133 | 1,222 | (89 | ) | |||
NON-CURRENT RECEIVABLES | 884 | 833 | 51 | ||||
CURRENT ASSETS | 6,453 | 5,818 | 635 | ||||
Nuclear Fuel | 243 | 238 | 5 | ||||
Inventories | 1,340 | 1,193 | 147 | ||||
Accounts receivable | 2,759 | 2,791 | (32 | ) | |||
Taxes receivable | 789 | 602 | 187 | ||||
Short-term financial investments | 310 | 289 | 21 | ||||
Cash and equivalents | 1,012 | 705 | 307 | ||||
TOTAL ASSETS | 34,002 | 33,061 | 941 | ||||
Million Euros
| March 2007 | December 2006 | Change | |||||||
SHAREHOLDERS’ EQUITY | 10,564 | 10,567 | (3 | ) | |||||
Capital Stock | 2,705 | 2,705 | — | ||||||
Reserves and other | 7,298 | 6,100 | 1,198 | ||||||
Profit and Loss | 458 | 1,660 | (1,202 | ) | |||||
Treasury Stock | (3 | ) | (3 | ) | |||||
Exchange differentials | (50 | ) | (44 | ) | (6 | ) | |||
Minority Shareholders | 156 | 149 | 7 | ||||||
LONG-TERM PROVISIONS | 1,658 | 1,718 | (60 | ) | |||||
DEFERRED INCOME | 864 | 818 | 46 | ||||||
FINANCIAL DEBT | 14,599 | 14,352 | 247 | ||||||
OTHER LONG-TERM DEBT | 5,217 | 4,541 | 676 | ||||||
OTHER SHORT-TERM DEBT | 957 | 847 | 110 | ||||||
GROUP INTERCOMPANY & RELATED PARTY DEBT | 143 | 218 | (75 | ) | |||||
TOTAL LIABILITIES | 34,002 | 33,061 | 941 | ||||||
| 48 | First Quarter 2007 financial results |
Results By Business
First Quarter 2007 (Unaudited)
Million Euros
| Domestic Energy | International Business | Engineering Non-energy | |||||||
Net Sales | 1,635.1 | 611.4 | 470.0 | ||||||
Procurements | (506.7 | ) | (344.9 | ) | (284.5 | ) | |||
EMISSION ALLOWANCES | (8.0 | ) | |||||||
GROSS MARGIN | 1,120.4 | 266.5 | 185.5 | ||||||
EMISSION ALLOWANCES | 2.3 | ||||||||
NET OPERATING EXPENSES | (314.5 | ) | (63.7 | ) | (61.0 | ) | |||
Net Personnel Expenses | (149.5 | ) | (24.4 | ) | (29.0 | ) | |||
Personnel | (177.0 | ) | (27.8 | ) | (38.4 | ) | |||
In house work on fixed assets | 27.5 | 3.4 | 9.4 | ||||||
Net External Services | (165.0 | ) | (39.3 | ) | (32.0 | ) | |||
External services | (193.8 | ) | (44.5 | ) | (36.9 | ) | |||
Other operating revenues | 28.8 | 5.2 | 4.9 | ||||||
TAXES | (44.0 | ) | (2.3 | ) | (2.0 | ) | |||
EBITDA | 764.2 | 200.5 | 122.5 | ||||||
Amortisation and Provisions | (230.1 | ) | (43.6 | ) | (18.6 | ) | |||
EBIT / Operating Profit | 534.1 | 156.9 | 103.9 | ||||||
Financial Result | (142.6 | ) | (21.1 | ) | 0.1 | ||||
Results from companies carried by equity method | 0.7 | 1.4 | 17.8 | ||||||
Results of non-current assets | 9.8 | (0.3 | ) | (0.1 | ) | ||||
Profit before taxes | 402.0 | 136.9 | 121.7 | ||||||
Corporate tax and minority shareholders | (131.1 | ) | (39.1 | ) | (32.3 | ) | |||
Net Profit | 270.9 | 97.8 | 89.4 |
First Quarter 2006
Million Euros
| Domestic Energy | International Business | Engineering Non-energy | |||||||
Net Sales | 2,048.6 | 584.6 | 345.2 | ||||||
Procurements | (795.7 | ) | (388.7 | ) | (192.6 | ) | |||
EMISSION ALLOWANCES | (107.4 | ) | |||||||
GROSS MARGIN | 1,145.5 | 195.9 | 152.6 | ||||||
EMISSION ALLOWANCES | 6.2 | ||||||||
NET OPERATING EXPENSES | (276.0 | ) | (51.8 | ) | (63.5 | ) | |||
Net Personnel Expenses | (156.2 | ) | (17.9 | ) | (37.3 | ) | |||
Personnel | (181.7 | ) | (21.6 | ) | (49.7 | ) | |||
In house work on fixed assets | 25.5 | 3.7 | 12.4 | ||||||
Net External Services | (119.8 | ) | (33.9 | ) | (26.2 | ) | |||
External services | (142.7 | ) | (46.1 | ) | (33.8 | ) | |||
Other operating revenues | 22.9 | 12.2 | 7.6 | ||||||
Taxes | (48.7 | ) | (1.9 | ) | (1.6 | ) | |||
EBITDA | 827,0 | 142,2 | 87,5 | ||||||
Amortisation and Provisions | (211.8 | ) | (40.0 | ) | (16.3 | ) | |||
EBIT / Operating Profit | 615.2 | 102.2 | 71.2 | ||||||
Financial result | (131.9 | ) | (27.5 | ) | (3.9 | ) | |||
Results from companies carried by equity method | (1.5 | ) | 2.8 | 2.7 | |||||
Results of non-current assets | 2.6 | (0.6 | ) | (0.5 | ) | ||||
Profit before taxes | 484.4 | 76.9 | 69.5 | ||||||
Corporate tax and minority shareholders | (191.6 | ) | (18.0 | ) | (17.9 | ) | |||
Net Profit | 292.8 | 58.9 | 51.6 |
| First Quarter 2007 financial results | 49 |
Domestic Energy Business
First Quarter 2007 (Unaudited)
Million Euros
| GENER. | RENEW. | DISTRIB. | SUPPLY & GAS | STRUCT. | |||||||||||
Net Sales | 848.9 | 203.4 | 373.1 | 445.4 | (235.7 | ) | |||||||||
Procurements | (316.9 | ) | (1.9 | ) | (419.9 | ) | 232.0 | ||||||||
Emission Allowances | (8.0 | ) | |||||||||||||
GROSS MARGIN | 524.0 | 203.4 | 371.2 | 25.5 | (3.7 | ) | |||||||||
EMISSION ALLOWANCES | 2.3 | ||||||||||||||
NET OPERATING EXPENSES | (139.0 | ) | (41.1 | ) | (114.0 | ) | (12.4 | ) | (8.0 | ) | |||||
Net Personnel Expenses | (49.2 | ) | (10.3 | ) | (44.9 | ) | (5.3 | ) | (39.7 | ) | |||||
Personnel | (54.7 | ) | (12.4 | ) | (63.7 | ) | (5.3 | ) | (40.8 | ) | |||||
In house work on fixed assets | 5.5 | 2.1 | 18.8 | 1.1 | |||||||||||
Net External Services | (89.8 | ) | (30.8 | ) | (69.1 | ) | (7.1 | ) | 31.7 | ||||||
External services | (98.8 | ) | (35.3 | ) | (86.5 | ) | (7.1 | ) | 33.9 | ||||||
Other operating revenues | 9.0 | 4.5 | 17.4 | (2.2 | ) | ||||||||||
Taxes | (18.6 | ) | (2.3 | ) | (30.6 | ) | 8.6 | (1.1 | ) | ||||||
EBITDA | 368.7 | 160.0 | 226.6 | 21.7 | (12.8 | ) | |||||||||
Amortisation and Provisions | (117.5 | ) | (53.9 | ) | (50.3 | ) | (1.0 | ) | (7.5 | ) | |||||
EBIT / Operating Profit | 251.2 | 106.1 | 176.3 | 20.7 | (20.3 | ) | |||||||||
Financial result | (33.8 | ) | (31.3 | ) | (23.3 | ) | 0.1 | (54.2 | ) | ||||||
Results from companies carried by equity method | 0.2 | 0.7 | (0.1 | ) | |||||||||||
Results of non-current assets | (0.1 | ) | 7.4 | 2.4 | |||||||||||
PROFIT BEFORE TAXES | 217.5 | 74.8 | 161.1 | 20.7 | (72.1 | ) | |||||||||
Corporate tax and minority shareholders | (69.7 | ) | (27.9 | ) | (51.8 | ) | (6.7 | ) | 25.0 | ||||||
NET PROFIT | 147.8 | 46.9 | 109.3 | 14.0 | (47.1 | ) |
First Quarter 2006
Million Euros
| GENER. | RENEW. | DISTRIB. | SUPPLY & GAS | STRUCT. | |||||||||||
Net sales | 1,345.8 | 215.2 | 265.5 | 618.8 | (396.8 | ) | |||||||||
Procurement | (556.6 | ) | (628.9 | ) | 389.8 | ||||||||||
Emission allowances | (107.4 | ) | |||||||||||||
GROSS MARGIN | 681.8 | 215.2 | 265.5 | (10.1 | ) | (7.0 | ) | ||||||||
Emission allowances | 6.2 | ||||||||||||||
Net operating expenses | (118.5 | ) | (30.6 | ) | (124.9 | ) | (13.6 | ) | 11.6 | ||||||
Net personnel expenses | (53.1 | ) | (5.3 | ) | (5.3 | ) | (11.1 | ) | (35.4 | ) | |||||
Personnel | (57.8 | ) | (6.5 | ) | (69.5 | ) | (11.1 | ) | (36.8 | ) | |||||
In house work on fixed assets | 4.7 | 1.2 | 18.2 | 1.4 | |||||||||||
Net external services | (65.4 | ) | (25.3 | ) | (73.6 | ) | (2.5 | ) | 47.0 | ||||||
External services | (73.1 | ) | (27.7 | ) | (90.3 | ) | (9.2 | ) | 57.6 | ||||||
Other operating revenues | 7.7 | 2.4 | 16.7 | 6.7 | (10.6 | ) | |||||||||
Taxes | (18.0 | ) | (1.9 | ) | (24.4 | ) | (3.6 | ) | (0.9 | ) | |||||
EBITDA | 551.5 | 182.7 | 116.2 | (27.3 | ) | 3.7 | |||||||||
Amortisation and Provisions | (96.4 | ) | (41.7 | ) | (41.7 | ) | (2.1 | ) | (6.9 | ) | |||||
EBIT / operating profit | 455.1 | 141.0 | 51.5 | (29.4 | ) | (3.2 | ) | ||||||||
Financial result | (20.0 | ) | (21.2 | ) | (18.1 | ) | 1.0 | (73.6 | ) | ||||||
Results from companies carried by equity method | (2.0 | ) | 0.6 | ||||||||||||
Results of non-current assets | 0.3 | 2.2 | |||||||||||||
PROFIT BEFORE TAXES | 433.4 | 119.8 | 34.0 | (28.4 | ) | (74.6 | ) | ||||||||
Corporate tax and minority shareholders | (146.9 | ) | (44.0 | ) | (10.9 | ) | 10.1 | 0.2 | |||||||
NET PROFIT | 286.5 | 75.8 | 23.1 | (18.3 | ) | (74.4 | ) |
| 50 | First Quarter 2007 financial results |
Statement Of Origin And Use Of Funds
First Quarter 2007
(Unaudited)
| Jan-March 2007 | Jan-March 2006 | Difference | |||||||
EBIT | 795 | 788 | 7 | ||||||
Amortisation | 284 | 249 | 35 | ||||||
Provisions | 9 | 19 | (10 | ) | |||||
Pension fund allocations | (11 | ) | 10 | (21 | ) | ||||
Operating Cash Flow | 1,077 | 1,066 | 11 | ||||||
Interest paid | (183 | ) | (195 | ) | 12 | ||||
Interest received | 39 | 41 | (2 | ) | |||||
Dividends received from affiliates | 5 | (5 | ) | ||||||
Minority interests | (9 | ) | (6 | ) | (3 | ) | |||
Taxes | (193 | ) | (221 | ) | 28 | ||||
Gross Cash Flow | 731 | 690 | 41 | ||||||
Dividends paid | (406 | ) | (331 | ) | (75 | ) | |||
Retained Cash Flow | 325 | 359 | (34 | ) | |||||
Investments | (506 | ) | (435 | ) | (71 | ) | |||
Fixed asset disposals | (9 | ) | 2 | (11 | ) | ||||
Financial asset disposals | |||||||||
Taxes on investment | (1 | ) | (1 | ) | |||||
Pension payments and other | (56 | ) | (54 | ) | (2 | ) | |||
Total Cash Flow Allocations | (572 | ) | (488 | ) | (84 | ) | |||
Capital subsidies received | 43 | 29 | 14 | ||||||
Change in working capital | (38 | ) | (450 | ) | 412 | ||||
Change in debt | 242 | 549 | (307 | ) | |||||
Change in consolidation perimeter | 4 | 2 | 2 | ||||||
Change in Gross debt | 246 | 551 | (305 | ) |
| First Quarter 2007 financial results | 51 |
Stock Market Evolution
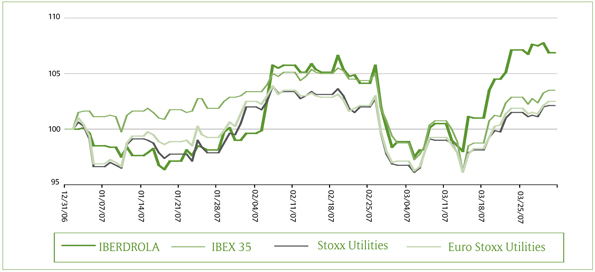
IBERDROLA stock | Q1 2007 | Q1 2006 | ||||
Number of shares outstanding | 901,549,181 | 901,549,181 | ||||
Share price at close of period | 35.39 | 26.64 | ||||
Average price over period | 33.62 | 24.97 | ||||
Average daily volume | 10,363,205 | 6,981,824 | ||||
Maximum volume (16-02-07/21-02-06) | 54,401,371 | 26,886,823 | ||||
Minimum volume (25-01-07/02-01-06) | 4,600,289 | 2,086,955 | ||||
Dividends paid (€) | 1.063 | 0.89 | ||||
Interim (2 January 2007 / 2 January 2006) | 0.450 | 0.37 | ||||
Supplemental (Payable 2 July 2007/ 3 July 2006) | 0.593 | 0.52 | ||||
AGM attendance premium | 0.02 | — | ||||
Yield per share (Div paid year/ price close of previous year) | 3.21 | % | 3.8 | % |
IBERDROLA Senior Unsecured Debt Credit Rating | ||||
Agency | Rating | Outlook | ||
Standard & Poors | A | Negative | ||
Moody´s | A2 | Negative | ||
Fitch IBCA | A+ | Negative |
NOTE: Since the asset acquisition agreement signed with Gas Natural, S&P, Moody´s and Fitch put the ratings of IBERDROLA’s Senior Debt on “credit watch with negative implications”, “review for a possible downgrade” and “credit watch negative (RWN)”, respectively. In April 2007, Fitch downgraded IBERDROLA’s rating from AA- to A+, as a result of the closing of the transaction.
| 52 | First Quarter 2007 financial results |
APPENDIX.- IBERDROLA and Sustainability
IBERDROLA’s contribution to sustainable development is reflected in several corporate responsibility practices that attend to the needs and expectations of its interest groups, with whom the Company maintains a combination of open communication channels and dialogue, which are designed for: communication on goals, activities and successes achieved in the three areas of sustainable development (economic, environmental and social), as well as receiving evaluations and requests from the parties involved.
1. SUSTAINABILITY INDICATORS
Sustainability Indicators | Q1 2006 | Q1 2007 | ||||
Contribution to GDP (Gross Margin) (*) | 0.50 | % | 0.47 | % | ||
Contribution to GDP (Turnover) (*) | 0.89 | % | 1.07 | % | ||
Investments on equipment (million euros) | 425 | 478 | ||||
Investments on clean generation (million euros) | 91.8 | 218 | ||||
Net profit (million euros) | 346.6 | 458.2 | ||||
Dividend yield (%) | 3.8 | % | 3.21 | % | ||
Emissions of CO2 in the period (gr. CO2/kWh). CO2 /kWh). Total | 247 | 188 | ||||
Emissions of CO2 in the period (gr. CO2/kWh). CO2 /kWh). Spain | 212 | 133 | ||||
Emission-free production: total (GWh) | 11,301 | 14,095 | ||||
Emission-free production: Spain (GWh) | 11,071 | 13,832 | ||||
Production free of emissions over total production (%) | 48.8 | % | 56.9 | % | ||
Ratio of emission-free production in Spain to total production (%) | 62.3 | % | 76.0 | % | ||
Total emission-free installed capacity (MW) | 16,376 | 17,045 | ||||
Total emission-free installed capacity in Spain (MW) | 16,077 | 16,738 | ||||
Total emission-free installed capacity (%) | 58.7 | % | 55.9 | % | ||
Emission-free installed capacity in Spain (%) | 65.3 | % | 64.2 | % |
| (*) | Data from 2006 and 2005. Source: Spain National Quarterly Accounting -INE (last data published for the fourth quarter of 2006) |
| First Quarter 2007 financial results | 53 |
Change in specific emissions in the thermal mix: CO2, SO2, particles and NOX
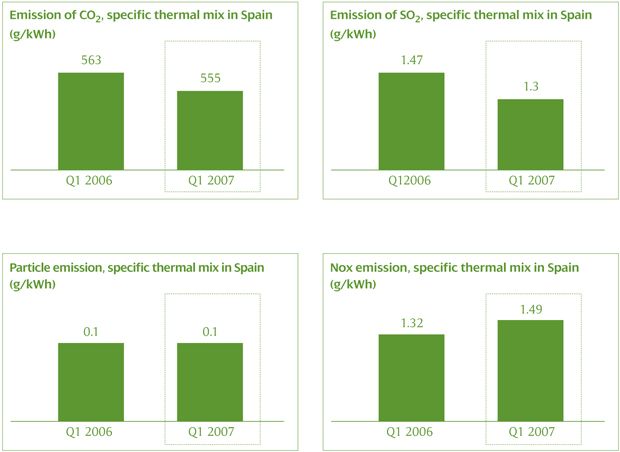
| 54 | First Quarter 2007 financial results |
2. INDEXES, RATINGS AND AWARDS
Presence of Iberdrola in indexes and Sustainability, Reputation, and Corporate Governance rankings
Sustainability Indexes | Rating / Position | |||
 | Jones Sustainability World Index 06 Dow Jones Sustainability Stoxx Index 06 | 74 points / Group of leaders in sustainability 74 points / Group of leaders in sustainability | ||
 | Climate Leadership Index | Only Spanish utility included in the index | ||
| Storebrand Investments SRI | Number two power company worldwide | ||
 | OEKOM | B- / Group of leaders: Top Spanish company and among the top 3 in the Worldwide Utilities category | ||
 | Global 100 | IBERDROLA among the 100 most sustainable companies in the world Second consecutive year | ||
| Global Roundtable on Climate Change | IBERDROLA is among the sponsors | ||
 | Pacific Sustainability Index (PSI) | Group of leaders: Among the top 3 in the Energy & Utilities Sectors category | ||
| BusinessWeek, Climate Group | Group of leaders: Top 3 ranking of most noteworthy companies in the management of greenhouse gases (GG) and Top 10 in companies that have contributed most to reducing GG’s and have been leading on environmental management in the last 10 years | ||
 | INNOVEST | Included in group 5 “Best in class” for the utilities sector | ||
| VIGEO | Rating from neutral to positive in the main categories | ||
 | CR- Risk Premium Survey. University of Hamburg & SRI Deutsche Bank | 30.5 points. IBERDROLA in utilities sector Leadership Group | ||


| First Quarter 2007 financial results | 55 |
Corporate Reputation Indexes | Rating / Position | |||
 | MERCO 2007 | IBERDROLA is in eighth position among the 100 companies comprising the overall ranking and again leads the Energy, Gas and Water sector | ||
Corporate Governance Indexes | Rating / Position | |||
 | ISS | Index Ranking 76,4. Industry Ranking 71,4 | ||
3. ENVIRONMENTAL COMMITMENT AND SOCIALLY RESPONSIBLE INVESTMENT
Analyst and Investor Assessment of Socially Responsible Investment
 | IBERDROLA is among the sponsors of the Global Roundtable on Climate the network for action against climate change |
IBERDROLA is one of the companies sponsoring the Network for Action against Climate Change, under the aegis of the Global Roundtable on Climate Change (GROCC), which was unveiled in late February at an event held in New York.
The declaration of principles by this international network, which has been joined by close to one hundred multinationals from all economic sectors, focuses on a determination to bring influence to bear in the political, social and industrial spheres in order to make the energy systems necessary for economic growth sustainable.
This founding document, which assumes that climate change is an urgent problem, urges governments to establish objectives and prices forCO2emissions and other greenhouse gas emissions, at the same time demanding that policies promoting energy efficiency be developed.
| IBERDROLA, named for the second year in a row as one of the 100 most sustainable companies in the world |
For the second year in a row, IBERDROLA has been selected as one of the 100 most sustainable companies in the world, according to the Global 100 Most Sustainable Corporations in the World, an index unveiled in late January at the World Economic Forum in Davos, Switzerland.
| 56 | First Quarter 2007 financial results |
In addition, IBERDROLA continues to be the only Spanish electric utility included in this index, prepared for the third year by Corporate Knights, a Canadian magazine specializing in corporate social responsibility, and by Innovest Strategic Value Advisors, a sustainability studies firm, which analyzes risk and stock market value components and their relationship to environmental protection, social responsibility and corporate governance initiatives.
Analyst and Investor Asessment of Corporate Reputation
| MERCO 2007. Iberdrola is in eighth position among the100 companies comprising the general classification, and again leads the Energy, Gas and Water sector |
According to the results of the 2007 Spanish Corporate Reputation Monitor (MERCO), the chief of the reputation indicators published in Spain, IBERDROLA is in eighth position among the 100 companies comprising the overall ranking and again leads the Energy, Gas and Water sector.
As far as business leaders with the best reputation are concerned, IBERDROLA’s President, Ignacio Galán, is in one of the lead positions among Spanish business leaders, ranking tenth out of the 100 leaders rated.
The method whereby the MERCO index is prepared includes a survey of 12,000 business leaders and an evaluation by various groups of experts. Financial analysts evaluate the economic and financial results; members of NGOs do the same for ethics and corporate social responsibility; union representatives weigh employment quality; and consumer associations evaluate the quality of the sales offerings. In addition, a group of opinion leaders evaluates the business managers. Finally, analysts from the Institute in charge of the charge check the reputation of companies against a “ merits questionnaire” and compare the information received.
4. CONTRIBUTION TO SOCIAL DEVELOPMENT
For IBERDROLA, the key events of 2007 with regard to its social dimension were as follows:
a) “Education and Training” Programme
| • | Promotion of Electrical Safety.IBERDROLA has continued its electrical hazard prevention awareness campaigns, offering courses to various professional groups: Electricity Installers (in Valencia and Valladolid) and Construction Companies (in Murcia). |
| • | Promotion of Energy Savings and Efficiency. Under the agreement with the Community of Madrid for the promotion of energy savings and efficiency, two new Energy Savings Guidebooks have been developed, one for Food Businesses and another for Restaurant Companies. |
| First Quarter 2007 financial results | 57 |
| • | University Support.IBERDROLA continues its support to Spanish universities, having signed various cooperation agreements during this period with the Universities of Deusto (Basque Country), Castilla-La Mancha, Cantabria, and Jaime I de Castellón. |
b) Surrounding Economic Development” Programme’
| • | Regional Advisory Boards.Working meetings have been held of the Consultative Committees of Andalucia, Castilla y León and the Valencia Community, respectively, which were formed by major industrial and financial groups of these Communities. |
| • | Dissemination of Corporate Social Responsibility.IBERDROLA has participated in 4 conferences promoting corporate social responsibility practices, presenting the “IBERDROLA model” to business and academic circles. |
c) Art and culture programme
| • | Reconstruction and Lighting of Monuments. The inauguration has been held of the complete restoration and lighting work performed at the Cartuja de Miraflores (Burgos). In addition, exterior lighting projects have been undertaken at: Yuso Monastery (San Millán de la Cogolla-La Rioja) and Hospital de la Santa Cruz (Barcelona) |
| • | Support for cultural organizations.As part of IBERDROLA’s policy of support for foundations and cultural institutions, it has renewed cooperation agreements with the Bilbao Choral Society and the Ondarreta de Getxo Choral Society (Vizcaya); in addition to which it has sponsored a CD book with the Euskadi Symphony Orchestra as part of a project to bring classical music to younger audiences. |
d) “Solidarity” Programme
| • | “Implica2” Project for the disabled.Project “Implica2,” the objective of which is to promote competitive access to the job market by disabled persons, is preparing to expand to the Community of Murcia. The respective agreement would involve the Federation of organisations working for victims of mental disability and cerebral palsy) and the Murcia Work and Social Policy Council. |
| • | ‘Castilla-La Mancha Olympic and Para- olympic’ programme.IBERDROLA has signed an agreement with the Castilla-La Mancha Culture and Sports Foundation to support the “Castilla-La Mancha Olympic Promises and Para-Olympics” program and another thirteen initiatives. |
| • | Support for other solidarity projects.The company has cooperated with various entities involved in solidarity tasks in Albacete, Cádiz, Cuenca and Vizcaya. |
e) ‘Environmental Sponsorships’ Programme’
| • | Actions against Climate Change. IBERDROLA is one of the companies sponsoring the Network for Action against Climate Change, under the aegis of the Global Roundtable on Climate Change (GROCC), and |
| 58 | First Quarter 2007 financial results |
unveiled in New York in February 2007; this initiative has been joined by close to one hundred multinationals from all economic sectors. |
5. CORPORATE GOVERNANCE
The highlights for Corporate Governance over the first quarter of 2007 were as follows:
General Shareholders Meeting Held On 29th of March 2007 last, at the Palacio Euskalduna in Bilbao, the Company’s General Shareholders meeting was held, with due notice for this purpose, and was chaired for the first time by its President and Managing Director, Ignacio Sánchez Galán.
The Meeting, which went into session with a quorum of 77.33% of the share capital (14.55% present and 62.78% represented), discussed and resolved matters regarding (i) the Annual Accounts and corporate management, (ii) the composition of the Board of Directors and the express authorisations and delegations that are being requested for that body, (ii) bringing internal regulations into line with the Unified Code of Good Governance, approved by the National Securities Market Commission (Comisión Nacional del Mercado de Valores -CNMV) on 22 May, 2006, and other bylaws and regulatory amendments, and (iv) the Scottish Power Plc transaction.
All of the resolutions were approved by a majority of shareholders, with a vote in favour greater than 99% of the capital present and represented at the meeting.
i) Resolutions regarding the Annual Accounts and the corporate management
The General Meeting approved the Annual Accounts for the 2006 fiscal year and the Management Reports for the Company and its Consolidated Group, as well as the corporate management and performance by the Board of Directors during the 2006 fiscal year. In addition, the proposed allocation of the results was approved, which includes the payment of a gross dividend of € 1.043 per share.
The full text of the Annual Accounts for the 2006 fiscal year and of the Management Reports on the Company and on its Consolidated Group, as well as the respective auditors’ reports, are available atwww.iberdrola.com.
ii) Resolutions regarding the composition of the Board of Directors and the express authorisations and delegations in favour of that body
The General Shareholders Meeting resolved to confirm the Director appointments made by cooptation since the last Meeting was held, namely, Iñigo Víctor de Oriol Ibarra, Inés Macho Stadler, Braulio Medel Cámara and José Carlos Pla Royo, as well as to re-elect the first three as Directors and José Orbegozo Arroyo, Lucas María de Oriol López-Montenegro, Mariano de Ybarra y Zubiría and Xabier de Irala Estévez. Lastly, it was also resolved to appoint Nicolás Osuna García as a Director, all of them for the five-year term stipulated in the bylaws.
| First Quarter 2007 financial results | 59 |
Accordingly the Board of Directors of Iberdrola is currently made up of a total of fifteen Directors, of which only the President and Managing Director are classified as executive. The remaining 14 directors include 12 independents, one representing substantial shareholders and one classified within the category of “other external shareholders”.
Details on the Directors’ identity, type and profile, as well as on the composition of the Executive Board, the Auditing and Compliance Board, and the Appointments and Salaries Committee, are available in continuously updated form at the Company Web site(www. iberdrola.com).
Furthermore, the General Meeting resolved to authorise the Board of Directors so that, subsequent to the completion of the merger transaction with Scottish Power Plc, it may carry out an Iberdrola share split at the rate of 1 to 4. As a result of this split, the number of shares outstanding will be increased fourfold, reducing the nominal value of each share from 3 euros to 0.75 euros, without modifying the share capital figure. In addition, as a result, Article 5 of the Corporate Bylaws on share capital will be amended.
The objectives of the split, which will be carried out in any case once the integration with Scottish Power Plc is completed, are fundamentally to offer the stock greater liquidity and negotiability and to further the performance of the loyalty-building programmes directed at investors (such as, for example, the Dividend Reinvestment Plan, implemented by the company in 2006).
In addition, the General Meeting approved the granting of the following express authorisations and delegations in favour of the Board of Directors:
| • | Authorisation for the derivative acquisition of treasury stock by the Company and/or by its Subsidiaries, up to a limit of 5% of the share capital and for a maximum term of 18 months. |
| • | Delegation, for a period of five years, of the authority to issue: a) bonds or simple debentures and other fixed-income securities of a similar nature, as well as preferred shares, with a maximum limit of € 20.0 billion and b) notes with a maximum amount, separately from the foregoing, of € 4.0 billion, and authorisation for the Board to be able to guarantee, on behalf of the Company within the limits specified above, the new securities issues that may be made by Subsidiaries. |
| • | Authorisation to request the admission and exclusion of the securities issues or that may be issued by the Company from trading on secondary markets. |
| • | Authorisation to the Board of Directors for the creation and endowment of Associations and Foundations up to the amount of € 10 million yearly. |
| 60 | First Quarter 2007 financial results |
iii) Resolutions relative to compliance with the Unified Code of Good Governance and other bylaws and regulatory amendments
The General Meeting also approved the proposed amendments of the Corporate Bylaws and Shareholder Meeting Rules and the new amalgamated drafts of these documents, and took note of the amendment and approval, dated 20 February, of a new amalgamated draft of the Board of Directors’ Rules.
In this regard, on the same date the Board of Directors resolved to amend the Internal Rules of Conduct on Securities Markets and the Appointments and Salaries Committee’s Rules, as well as to ratify the amendment of the Auditing and Compliance Committee’s Rules as approved by that Committee at a session on 14 February 2007, amendments which went into effect on 29 March 2007, as a result of the aforesaid proposed amendments of the Corporate Bylaws and the General Shareholders Meeting Rules, with the exception of the Internal Rules of Conduct on Securities Markets, which will become effective on 28 April 2007.
The purpose of these amendments is to bring the Company’s internal rules into line with the recommendations of the Unified Code of Good Governance, as well as to amend them for the purpose of clarifying the rules on certain matters.
The full draft of the Corporate Bylaws, the General Shareholders Meeting Rules, and the remaining internal rules for the corporate bodies currently in force may be consulted atwww.iberdrola.com.
iv) Resolutions relative to the Scottish Power Plc transaction
In connection with the combination agreement reached with Scottish Power Plc in November 2006, the General Shareholders Meeting resolved to increase the capital stock of Iberdrola by a maximum of 263,377,413 shares, representing over 20% of the share capital resulting from the increase. The equivalent value of that capital increase, for a maximum of approximately € 8,625 billion between the par value and the issuance premium, will be paid in by means of non-monetary contributions consisting of ordinary shares of Scottish Power Plc.
In addition, the General Meeting has approved an issue of simple debentures for a nominal amount ranging from 20 to 750 million pounds sterling for the purpose of meeting the claims of ordinary shareholders of Scottish Power Plc, who choose to receive debentures in full or partial cash consideration for their shares, delegating to the Board the authority to set the terms and conditions of that issue.
Furthermore, the General Meeting authorised (i) the continuation, once the Scottish Power Plc transaction is completed, of the plans established for the employees of the Scottish Power Plc group, in which residual rights exist to acquire shares of that company after the transaction, for the sole purpose of administering those residual rights in accordance with the plan rules and (ii) the delivery of Iberdrola shares, under the terms provided for in the Scottish Power Plc transaction, in relation to the Scottish Power Plc shares that are issued once the Scottish Power Plc transaction is completed, to the holders of such residual rights for the liquidation thereof.
| First Quarter 2007 financial results | 61 |
Similarly, for the purpose of meeting Iberdrola’s commitments in the context of the Scottish Power Plc transaction on the future maintenance of this company’s policy of compensating its personnel in shares, the General Meeting has authorised the Board of Directors so that it will be able to implement, develop and execute plans intended for the employees of Scottish Power Plc and extend them to all employees of the new Iberdrola Group and, for this purpose, it has agreed to increase the share capital, through monetary contributions, by issuing 11,649,266 new shares (or 46,597,064 new shares if the increase is carried out after the completion of the stock split described above) with exclusion of a pre-emptive right of subscription.
It is expected that the deal with Scottish Power Plc, also approved by the General Shareholders Meeting of the Scottish company this 30th of March, will be finalised during April, following the completion of the remaining relevant steps to be taken in accordance with the rules on the matter.
All information on the ScottishPower transaction may be accessed atwww.iberdrola.com.
Information Transparency
One of our Company’s core corporate governance principles is to promote maximum transparency in the information - financial and other - provided to shareholders and markets. In this regard, during the first quarter of 2007, there has been a high level of activity involving face-to-face information sessions with institutional investors and financial analysts.
On February 20, 2007, the Board approved the Annual Report on Corporate Governance for 2006, in accordance with the form required by Circular 1/2004 of 17 March of the Spanish securities regulator (CNMV).
On the same date, the Board of Directors approved the Report on the Activities of the Audit and Compliance Board for fiscal year 2006, the publication of which is intended to contribute to “good practices” in corporate governance by disseminating the annual activities of the latter Board.
Furthermore, the most significant events concerning the Company and all the relevant information it discloses (with a possible impact on the share price) have been reported first to the CNMV as a relevant event.
Once the information has been sent to the CNMV, and to the Takeover Panel and the SEC, through the appropriate channel, it was transmitted to analysts, as well as to the primary news media and international, local and regional news agencies, and then posted on the corporate Web site, in both Spanish and English.
| 62 | First Quarter 2007 financial results |
| Spanish stock market commission (CNMV): Chief Relevant Events for the first quarter of 2007 | ||
Event | Registration No. | |
| Acquisitions or transfers of holdings: The Company reports that today, 30 March 207, the shareholders of Scottish Power PLC have approved the Scheme of Arrangement, at the Meeting called by order of the Edinburgh Court of Sessions, as well as at the extraordinary General Meeting, both regarding the integration with IBERDROLA, S.A. | 78700 | |
| Acquisitions or transfers of holdings: ACS has reported to the Takeover Panel in London, pursuant to Article 8 of the Mergers and Acquisitions Code, that the derivatives contract, specifically an equity swap, referred to in the previous Relevant Events of 28 December 2006 and 10 and 23 January and 12 February 2007 affects as of today’s date a total of 27,046,475 shares representing 3% of the share capital of IBERDROLA, S.A. | 78693 | |
| Acquisitions or transfers of holdings: BBVA sends information regarding transactions made by BBVA on IBERDROLA on 29/03/2007 on the basis of discretionary management of client/investor funds. | 78678 | |
| Acquisitions or transfers of holdings: The Company announces that the General Shareholders Meeting, held on second notice on this date, has approved each and every one of the resolutions included in the Agenda. | 78634 | |
| Acquisitions or transfers of holdings: With regard to the deal announced by IBERDROLA, S.A. with ScottishPower, BBVA announces the operations made on IBERDROLA, S.A. shares. | 78624/78516/ | |
| 78454/78404/ | ||
| 78342/78312/ | ||
| 78255/78217/ | ||
| 78181/78146/ | ||
| 78104/78067/ | ||
| 78036/77992/ | ||
| 77964/77903/ | ||
| 77817/77774/ | ||
| 77661/77578/ | ||
| 77512/77436v | ||
| 77340/77270/ | ||
| 77188/77047/ | ||
| 76991/76931/ | ||
| 76888/76871/ | ||
| 76801/76701/ | ||
| 76630/76574/ | ||
| 76471/76419/ | ||
| 76346/76273/ | ||
| 76216/76171/ | ||
| 76105/76070/ | ||
| 76045/76030/ | ||
| 75882/75775/ | ||
| 75693/75671/ | ||
| 75590/75564/ | ||
| 75532/75446/ | ||
| 75328/75227/ | ||
| 75184/75158/ | ||
| 75112/75039/ | ||
| First Quarter 2007 financial results | 63 |
| Spanish stock market commission (CNMV): Chief Relevant Events for the first quarter of 2007 (cont.) | ||
Event | Registration No. | |
| Other Significant Events: The Company sends a Spanish translation of the Scheme Document, which includes the terms and conditions for the integration with Scottish Power Plc. | 78034 | |
| Acquisitions or transfers of holdings: The Company announces that the English version of the Scheme Document (hereinafter the “Agreement Document”), which includes the terms for the integration of IBERDROLA, S.A. (“IBERDROLA”) with Scottish Power Plc was made available to Iberdrola shareholders at the company headquarters and on its corporate Web page (www.iberdrola.com). In addition, a copy of the pro forma financial information is attached as an Appendix to this notice. | 77542 | |
Notices of Meeting and Meeting Resolutions: The company remits the agenda for the Ordinary General Shareholders’ Meeting to take place on May 9 or 10,2007, on first and second notice respectively. The information attached is available to the public at the offices of the CNMV. | 77421 | |
| Acquisitions or transfers of holdings: The Company submits the Scheme Document, which includes the terms for the integration of IBERDROLA, S.A. with Scottish Power, Plc | 77320/77317 | |
| Notices of Meeting and Meeting Resolutions: The Board submits an expanded announcement on account of the notice of a General Shareholders Meeting, which will be held on 28 or 29 March, on first or second notice, respectively. | 77309 | |
| Treasury stock increases or decreases: The Company submits the treasury stock purchase/sale transactions at the market session on 21 February 2007. | 77181 | |
| Annual Corporate Governance Report. | 77051 | |
| Issuer Earnings Report: The Company communicates on the financial results for H2 2006. | 77008 | |
| Board of Directors Resolutions: The company announced the resolutions adopted by the Board of Directors on this date, highlighting among these the notice of a General Shareholders Meeting to be held on 28 and 29 March. | 76979 | |
| Other Significant Facts: BBVA announces transactions made with IBERDROLA, S.A. shares on the basis of discretionary management of client/investor funds. | 76954 | |
| Acquisitions or transfers of holdings: ACS has reported to the Takeover Panel in London, pursuant to Article 8 of the Mergers and Acquisitions Code, that the derivatives contract, specifically equity swap, referred to in the previous Relevant Events of 28 December 2006 and 10 and 23 January 2007 as of today’s date affects 21,995,554 shares representing 2.440% of the share capital of IBERDROLA, S.A. | 76628 | |
| Acquisitions or transfers of holdings: Omega Capital, S.L. announced that as of 3 February 2007 it owns 2% of the capital of IBERDROLA, S.A. | 76338 | |
| Treasury stock increases or decreases: The company announces that it has made treasury stock purchase/sale transactions at the market session on 1 February 2007. | 76184 | |
| Relevant Events on compensation systems: IBERDROLA, S.A. announces that pursuant to the Board of Directors resolution, it will offer its employees, for the third year in a row, the possibility of receiving part of their variable remuneration in shares. Delivery will take place during February 2007. | 76059 | |
| Treasury stock increases or decreases: The company announces the treasury stock purchase/sale transactions it made at the market session on 25 January 2007. | 76018 | |
| Treasury stock increases or decreases: The company announces the treasury stock purchase/sale transactions it made at the market session on 17 January 2007. | 75646 | |
| 64 | First Quarter 2007 financial results |
Spanish stock market commission (CNMV): Chief Relevant Events for the first quarter of 2007 (cont.)
| ||
Event | Registration No. | |
| Acquisitions or transfers of holdings: BBVA announces the transactions made with IBERDROLA, S.A. shares at the session on 16 January 2007. | 75614 | |
| Treasury stock increases or decreases: The company announces the treasury stock purchase/sale transactions that it has made at the market session on 16 January 2007. | 75604 | |
| Treasury stock increases or decreases: The company announces the treasury stock purchase/sale transactions that it has made at the market session on 15 January 2007. | 75583 | |
| Treasury stock increases or decreases: The company announces the treasury stock purchase/sale transactions that it has made at the market session on 12 January 2007. | 75556 | |
| Acquisitions or transfers of holdings: With regard to the transaction announced by IBERDROLA, S.A. on ScottishPower, BBVA announces the transactions made with IBERDROLA, S.A. shares on the basis of discretionary management of client/investor funds since this past 10 November 2006 until 21 December 2006, inclusive. | 75534 | |
| Treasury stock increases or decreases: The company announces the treasury stock purchase/sale transactions that it has made at the market session on 11 January 2007. | 75524 | |
| Treasury stock increases or decreases: The company announces the treasury stock purchase/sale transactions that it has made at the market session on 10 January 2007. | 75440 | |
| Treasury stock increases or decreases: The company announces the treasury stock purchase/sale transactions that it has made at the market session on 9 January 2007. | 75313 | |
| Treasury stock increases or decreases: The company announces the treasury stock purchase/sale transactions that it has made at the market session on 8 January 2007. | 75197 | |
| Treasury stock increases or decreases: The company announces the treasury stock purchase/sale transactions that it has made at the market session on 5 January 2007. | 75180 | |
| Treasury stock increases or decreases: The company announces the treasury stock purchase/sale transactions that it has made at the market session on 4 January 2007. | 75141 | |
| Treasury stock increases or decreases: The company submitted a correction of Relevant Event No. 75081 regarding its treasury stock purchase/sale transactions at the market session on 3 January 2007. | 75103 | |
| Treasury stock increases or decreases: The company announces the treasury stock purchase/sale transactions that it has made at the market session on 3 January 2007. | 75081 | |
| Treasury stock increases or decreases: The company announces the treasury stock purchase/sale transactions that it has made at the market session on 2 January 2007. | 74977 | |
| Acquisitions or transfers of holdings: BBVA announces the transactions made with IBERDROLA, S.A. shares. | 74881 | |
| First Quarter 2007 financial results | 65 |
IBERDROLA informs you that the data used to send you this information are included in a file property of IBERDROLA, S. A., with the only purpose of sending you financial information about the Company. Such data were included in our file either at your request or due to previous relations held between you and IBERDROLA.
As stated by the Organic Law 15/1999 of 13 December on the Protection of Personal Data (Ley Orgánica de Protección de Datos de Carácter Personal, LO 15/1999), you can at any time exercise your rights of access, rectification, objection and cancellation on your personal data. Should this be the case, you must send a letter, with a photocopy of your identity card or passport attached, to the following address:
IBERDROLA, S.A.
Investor relations
C/Tomás Redondo, 1
28033 - Madrid (Spain)
Notwithstanding this, if you are not interested in receiving any more information related to Iberdrola, please let us know by calling the toll free line +34 900 10 00 19.
 | IBERDROLA, S.A. Investor relations Phone: 00 34 91 784 2804 Fax:0034 91 784 2064 investor.relations@iberdrola.es |
 Introduction Introduction Ignacio Galán Ignacio Galán Chairman & CEO Chairman & CEO Exhibit 99.5 |
 2 Legal Note IMPORTANT INFORMATION This communication does not constitute an offer to purchase, sell or exchange or the solicitation of an offer to purchase, sell or exchange any securities. The shares of Iberdrola, S.A. may not be offered or sold in the United States of America except pursuant to an effective registration statement under the Securities Act or pursuant to a valid exemption from registration. FORWARD-LOOKING STATEMENTS This communication contains forward-looking information and statements about Iberdrola, S.A. and otherwise, including financial projections and estimates and their underlying assumptions, statements regarding plans, objectives and expectations with respect to future operations, capital expenditures, synergies, products and services, and statements regarding future performance. Forward-looking statements are statements that are not historical facts and are generally identified by the words “expects,” “anticipates,” “believes,” “intends,” “estimates” and similar expressions. Although Iberdrola, S.A. believes that the expectations reflected in such forward-looking statements are reasonable, investors and holders of Iberdrola, S.A. shares are cautioned that forward-looking information and statements are subject to various risks and uncertainties, many of which are difficult to predict and generally beyond the control of Iberdrola, S.A., that could cause actual results and developments to differ materially from those expressed in, or implied or projected by, the forward-looking information and statements. These risks and uncertainties include those discussed or identified in the public documents sent by Iberdrola, S.A. to the Comisión Nacional del Mercado de Valores. Forward-looking statements are not guarantees of future performance. They have not been reviewed by the auditors of Iberdrola, S.A. You are cautioned not to place undue reliance on the forward-looking statements, which speak only as of the date they were made. All subsequent oral or written forward-looking statements attributable to Iberdrola, S.A. or any of its members, directors, officers, employees or any persons acting on its behalf are expressly qualified in their entirety by the cautionary statement above. All forward-looking statements included herein are based on information available to Iberdrola, S.A. on the date hereof. Except as required by applicable law, Iberdrola, S.A. does not undertake any obligation to publicly update or revise any forward-looking statements, whether as a result of new information, future events or otherwise. |
 3 ScottishPower A combination aligned with the principles of Iberdrola’s strategy … … … that will generate more value for shareholders that will generate more value for shareholders Accelerates projected growth Diversifies risk Provides new business opportunities for long term growth Maintains financial solidity + Strategic fit |
 4 ScottishPower Fulfilling the established criteria for non-organic growth Strategic Criteria Financial Criteria Form • • Liberalised markets Liberalised markets • • Integrated businesses Integrated businesses • • Operating & technological Operating & technological synergies synergies • • Complimentary businesses Complimentary businesses • • No dilution of EPS & CPS No dilution of EPS & CPS • • Maintaining financial Maintaining financial solidity solidity • • Commitment with ratings Commitment with ratings • • Through a friendly Through a friendly agreement between both agreement between both parties parties |
 5 ScottishPower Fully supported by the shareholders of both companies … 99.5% 97.6% • Of attending capital voted in favour • Of shareholders voted in favour • 77.3% attendance record |
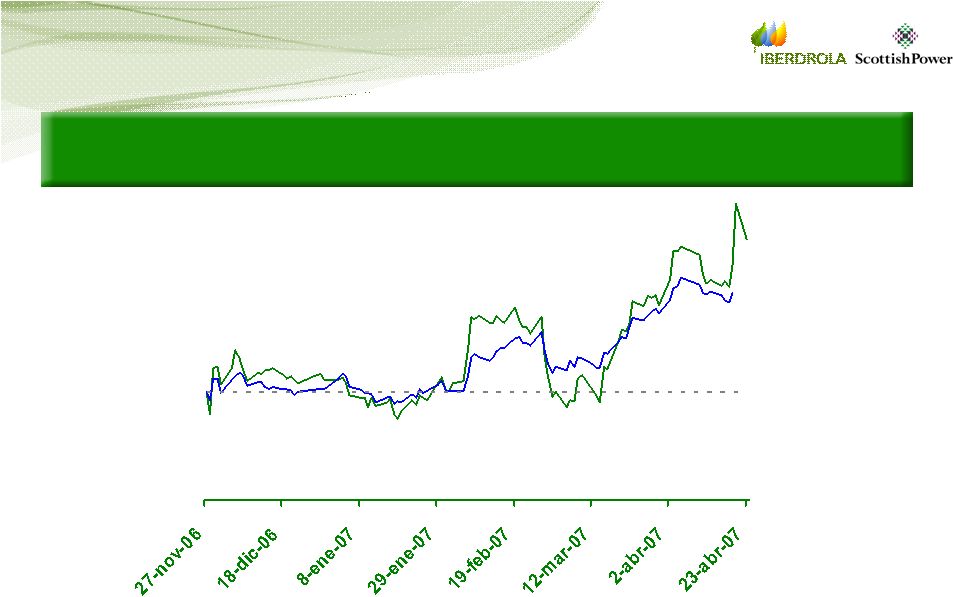  6 ScottishPower … and by the market … Iberdrola Iberdrola +14.1% +14.1% ScottishPower ScottishPower +9.1% +9.1% … … with over Eur with over Eur 4.0 Bn* of value creation 4.0 Bn* of value creation since announcement since announcement * As of 23-April-07 |
 7 ScottishPower One of the largest electricity companies in the world … + Over 67 Bn Eur of enterprise value … … and one of the largest transactions and one of the largest transactions in the Spanish business history in the Spanish business history |
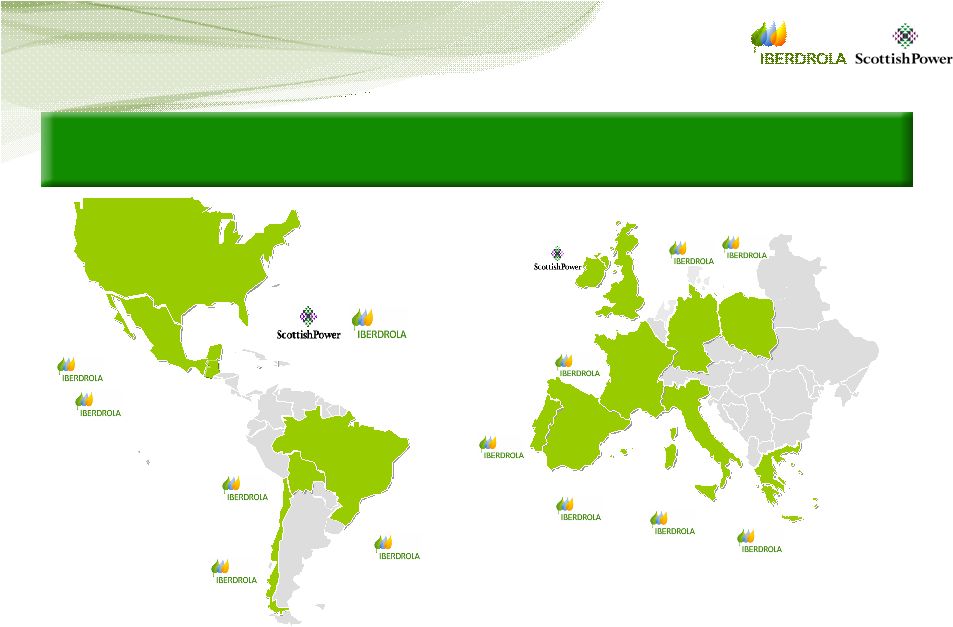  8 ScottishPower Major global presence … … … with operations in over 30 countries worldwide with operations in over 30 countries worldwide Spain Portugal Italy Greece U.K. Germany Poland France Brazil Mexico U.S.A. Chile Guatemala Bolivia |
  9 ScottishPower Well positioned for further growth … … … with a large portfolio of projects with a large portfolio of projects Europe: a reference player in the future Single Energy Market … • Benefiting from EU liberalization & integration • Spain & UK as platforms for further expansion • Playing a leading role in wind energy North America: main growth opportunity for the Group • Leading energy player (wind, gas, other…) Latin America: presence in highest growth areas (Mexico, Brazil) • Growing organically with potential additional opportunities |
  10 ScottishPower A larger Iberdrola … … … with significant expansion in all business areas with significant expansion in all business areas Points of Supply +18% Wind Energy* (MW) +44% Conventional Generation (MW) +25% Total Installed Capacity (MW) +28% IBE IBE + SPW * Includes mini-hydro & other renewable energy technologies 25,950 4,552 30,502 18.4 32,524 6,562 39,086 21.8 |
  11 ScottishPower Worldwide leader in wind energy … … … with a huge pipeline that with a huge pipeline that provides for future growth provides for future growth Pipeline 6,562 MW of installed capacity 37,675 MW of pipeline* + + Spain U.K. Rest of Europe* USA Latam Rest of world * Includes mini-hydro & other renewable energy technologies 6,166 5,996 5,382 19,231 400 500 |
  12 ScottishPower The combination strengthens our commitments … Shareholders Customers Society People + |
  13 … based on a powerful business platform ScottishPower + Worldwide leader in wind energy Benchmark in efficiency Financial solidity Low external dependency Low cost & low emissions mix |
 14 ScottishPower + Profitable + Global + Solid + Growth + Balanced Together we will grow more Together we will grow more Iberdrola + ScottishPower: a worldwide leader emerges + Efficient |
 End of the End of the Introduction Introduction |
 Technical Session I Technical Session I Introduction to Introduction to ScottishPower ScottishPower & its markets & its markets Exhibit 99.6 |
 2 Legal Note IMPORTANT INFORMATION This communication does not constitute an offer to purchase, sell or exchange or the solicitation of an offer to purchase, sell or exchange any securities. The shares of Iberdrola, S.A. may not be offered or sold in the United States of America except pursuant to an effective registration statement under the Securities Act or pursuant to a valid exemption from registration. FORWARD-LOOKING STATEMENTS This communication contains forward-looking information and statements about Iberdrola, S.A. and otherwise, including financial projections and estimates and their underlying assumptions, statements regarding plans, objectives and expectations with respect to future operations, capital expenditures, synergies, products and services, and statements regarding future performance. Forward-looking statements are statements that are not historical facts and are generally identified by the words “expects,” “anticipates,” “believes,” “intends,” “estimates” and similar expressions. Although Iberdrola, S.A. believes that the expectations reflected in such forward-looking statements are reasonable, investors and holders of Iberdrola, S.A. shares are cautioned that forward-looking information and statements are subject to various risks and uncertainties, many of which are difficult to predict and generally beyond the control of Iberdrola, S.A., that could cause actual results and developments to differ materially from those expressed in, or implied or projected by, the forward-looking information and statements. These risks and uncertainties include those discussed or identified in the public documents sent by Iberdrola, S.A. to the Comisión Nacional del Mercado de Valores. Forward-looking statements are not guarantees of future performance. They have not been reviewed by the auditors of Iberdrola, S.A. You are cautioned not to place undue reliance on the forward-looking statements, which speak only as of the date they were made. All subsequent oral or written forward-looking statements attributable to Iberdrola, S.A. or any of its members, directors, officers, employees or any persons acting on its behalf are expressly qualified in their entirety by the cautionary statement above. All forward-looking statements included herein are based on information available to Iberdrola, S.A. on the date hereof. Except as required by applicable law, Iberdrola, S.A. does not undertake any obligation to publicly update or revise any forward-looking statements, whether as a result of new information, future events or otherwise. |
 3 Agenda Introduction to UK and US Utility Sectors Introduction to UK and US Utility Sectors Introduction to ScottishPower Introduction to ScottishPower |
 4 Positive macroeconomic backdrop Second largest EU energy market History of early deregulation and privatisation leading to three distinct subsectors: • Generation – market based with attractive fundamentals • Supply – liberalised, consolidated market • Transmission / Distribution – asset based regulation Independent and stable regulatory environment Need for investment in future capacity highlighted in recent government Energy Review Rapidly developing opportunities, particularly in ScottishPower’s core US subsectors: • Wind Generation • Gas Storage • Energy Management UK market US market Key messages |
 5 Source: EIU, US Energy Information Administration, Bloomberg Note: 1. Estimated 2006 GDP per capita (US$ at PPP) 2. Current central bank rates 3. UK: 10 year gilt; Spain: 10 year government bond; US: 10 year Treasury Bond as at 23 April 2007 4. Percentage change in consumer price index over previous year Strong macroeconomic fundamentals support growth prospects 2006e GDP per capita (US$) (1) 2006 real GDP growth (% pa) Short term interest rate (2) Long term interest rate (3) 2006 inflation (4) 34,300 2.7% 5.25% 5.05% 2.3% UK 28,140 3.9% 3.75% 4.23% 3.5% Spain 44,237 3.3% 5.25% 4.64% 3.2% US 2006 energy demand (TWh) 409 268 3,820 UK, US and Spain: macroeconomic background |
 6 Production (TWh) Net imports/ (exports) (TWh) Installed capacity (MW) Electricity points of supply (MM) 399 9 81,738 26.7 Gas points of supply (MM) 21.4 Source: Department of Trade and Industry, Ofgem, UCTE and REE Note UK: Production and net imports for 2006. Points of supply as at Mar 2006 Note Spain: Production, net imports and installed capacity for 2006. Electricity points of supply as at Sep 2006. Gas points of supply as at Dec 2006 UK 271 (3) 82,336 25.2 6.4 Spain The UK and Spanish markets are the “power islands” in Europe – the UK is a significantly larger market than Spain UK and Spain: key energy market data |
 7 UK: key current utility sector themes Key drivers Security of supply Competitive markets Environment Energy efficiency All these themes are at the heart of Iberdrola’s strategic plan |
  8 Regulation From pool concept to bilateral concept BETTA (2) live Electricity pool opens for trading Mar 1990 Apr 2005 UK market has gone through a process of regulatory change and industry restructuring in order to reach a stable framework today Privatisation New foreign entrants Vertical integration Early 90s Mid 90s 2000 - today Ownership Mar 2001 Note: (1) New Electricity Trading Arrangements (NETA) (2) British Electicity Trading and Transmission Arrangements (BETTA) UK generation: regulation and industry development NETA (1) live 2001 |
 9 Fuel mix Source: Department of Trade & Industry, ScottishPower Interim Results Presentation Sep 2006 Market share of top 10 players Source: Department of Trade and Industry Note: (1) ScottishPower UK installed capacity as at Mar 2007; fuel mix and market share are based on installed capacity Total UK capacity Total UK capacity 81,738 MW 81,738 MW Total SPW capacity Total SPW capacity (1) (1) 6,380 MW 6,380 MW 3% 4% 5% 7% 8% 13% 13% 15% UK generation market is competitive compared to certain other European countries 12% 6% 14% “Big Six” Integrated Supplier UK generation: players and fuel mix 4% 5% 35% Coal Hydro Renewables 38% Gas 15% Nuclear 3% Oil |
 10 Greater need for new build in the UK compared to other European countries due to ageing coal and nuclear fleets 10 20 30 40 50 60 70 80 90 Peak demand: 75GW by 2016/17 With 20% margin: 90GW by 2016/17 Post 2016/17 20 to 35 GW supply gap “Over next two decades, UK needs substantial investment in generation capacity to replace closing coal, oil and nuclear plant…” Energy Review, July 2006 Coal CCGT and CHP Nuclear OCGT and Oil Hydro Renewables Existing capacity: 55GW by 2016/17 UK generation: significant new build required |
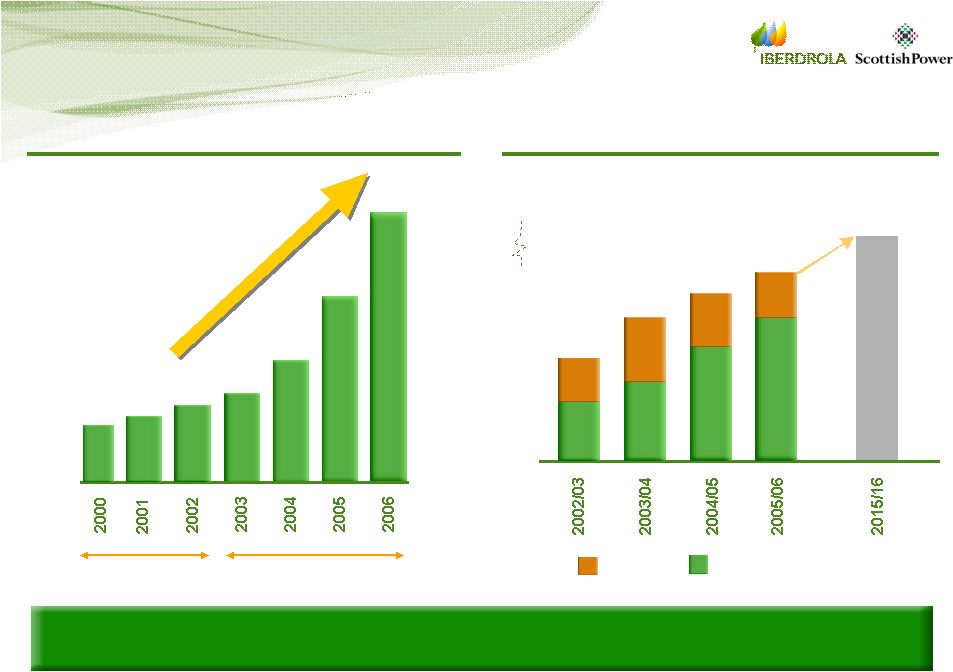 11 Source: BWEA, Department of Trade and Industry, Ofgem Compliance shortfall creates further opportunities Obligatory % supply from renewable sources Shortfall Actual supply from renewable sources (%) UK renewables: high growth outlook with committed targets ... 15.4 1 4 3 2 5 15 3.0 4.3 4.9 5.5 UK wind installed capacity (MW) Pre Renewable Obligation Renewable Obligation 1,963 1,353 888 648 552 474 406 CAGR 37% |
  12 UK supply: regulation and industry development Regulation Consumers using >1 MW allowed to switch Consumers using >100 kW allowed to switch May 1990 2001 The UK supply market is one of the most open and deregulated markets in Europe 14 companies to 6 companies Consolidated to sustainable status quo 1996 - 2005 Today Ownership May 1994 May 1999 Utilities Act separates electricity distribution and supply Electricity and gas supply markets fully open to competition across UK Ofgem confirm fully competitive market Jul 2003 |
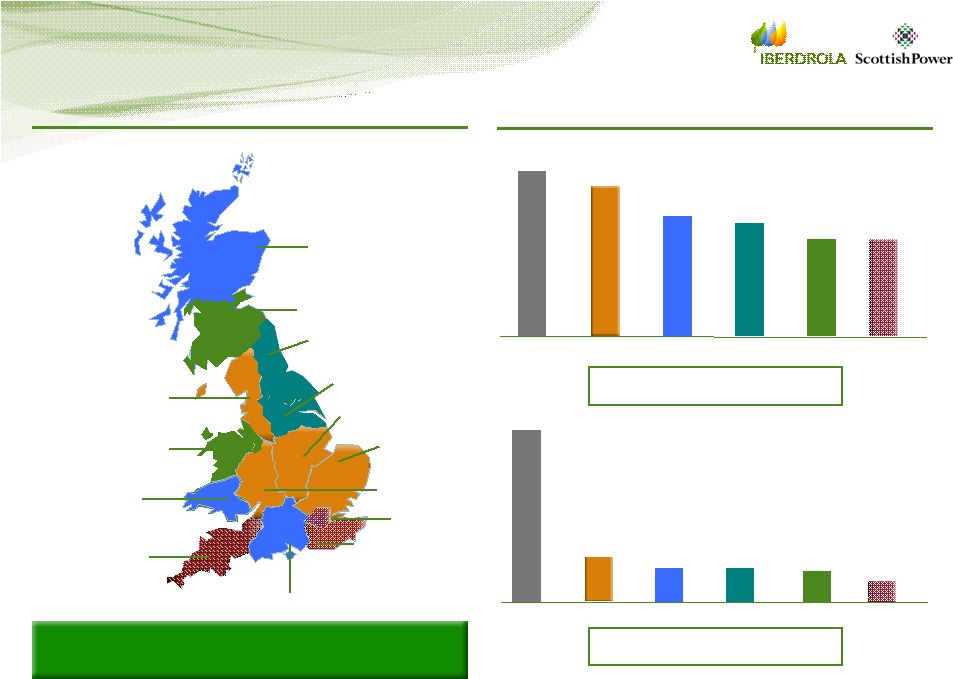       13 UK supply: overview of players UK electricity customers (1) 26.7 MM SPW electricity customers (2) 3.4 MM Source: OFGEM, Mar 2006 Note (1) Market shares as at Mar 2006 based on total customers (2) March 2007 Electricity 13% 15% 16% 20% 22% Centrica E.ON SSE RWE SPW Scottish Hydro (SSE) ScottishPower (SPW) Northern (RWE) Norweb (E.ON) SWALEC (SSE) Seeboard (EDF) Midlands (E.ON) Southern (SSE) Manweb (SPW) SWEB (EDF) London (EDF) East Midlands (E.ON) Yorkshire (RWE) Supply home areas Market share (1) A clear dual fuel supply strategy has emerged in the UK 13% EDF Eastern (E.ON) UK gas customers (1) 21.4 MM SPW gas customers (2) 2.0 MM 10% 10% 13% 52% Centrica E.ON SSE RWE Gas 6% 9% SPW EDF |
 14 Regulation Distribution Review 3 A stable and predictable framework has emerged Privatisation: 14 operators Acquisitions by foreign companies Consolidation to 7 operators Early 90s Mid 90s 2000 - today Distribution ownership Distribution Review 1 Transmission Review 3 UK transmission and distribution: Regulation and industry development Distribution Review 2 Transmission Review 2 Distribution Review 4 Transmission Review 4 Transmission Review 1 Nov 2004 Dec 1999 Jul 1995 Apr 1990 Jul 1992 Aug 1996 Sep 2000 Dec 2006 |
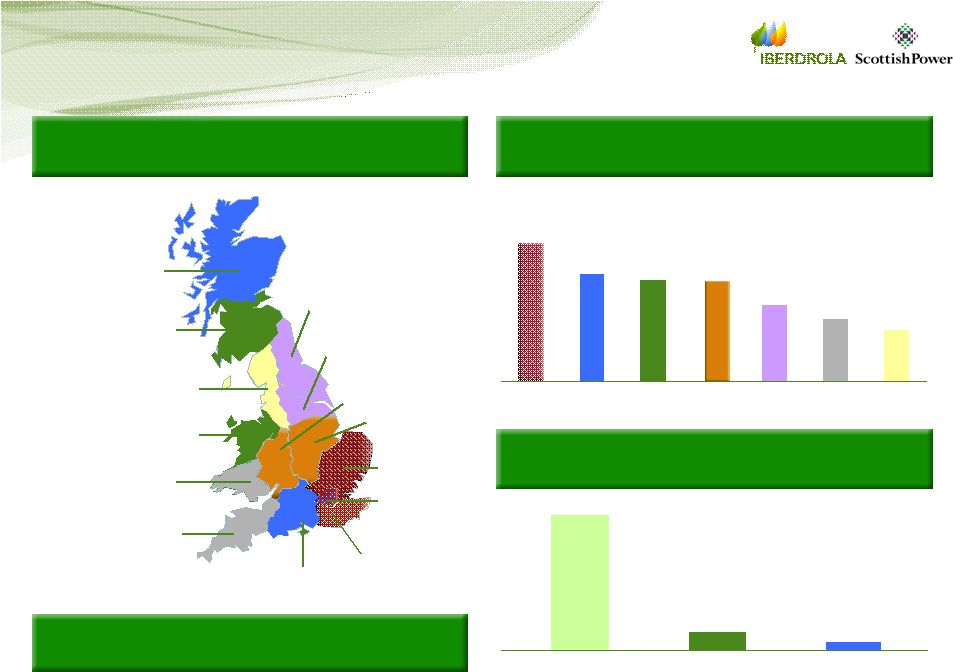     15 Distribution footprint SPW Distribution SPW Distribution RAB RAB (1) (1) Eur Eur 2,939 MM 2,939 MM Distribution activity (by RAB) Transmission activity (by RAB) Source: Ofgem, Mar 2006 (1) As at March 2006, in 2002/3 prices, converted to Eur at 1.4755 (2) As at March 2007, in 2004/5 prices, converted to Eur at 1.4755 8% 21% 17% 16% 16% 12% 10% EDF SSE SPW E.ON MidAmerican PPL United Utilities 4% 12% SSE SPW Scottish Hydro (SSE) ScottishPower (SPW) Northern (MidAm.) Norweb (UU) SWALEC (PPL) Seeboard (EDF) Midlands (E.ON) Southern (SSE) Manweb (SPW) SWEB (PPL) Yorkshire (MidAm.) London (EDF) Eastern (EDF) East Midlands (E.ON) Efficiencies are now being driven by consolidation 84% NG UK transmission and distribution: Overview of players SPW Transmission SPW Transmission RAB RAB (2) (2) Eur Eur 1,127 MM 1,127 MM |
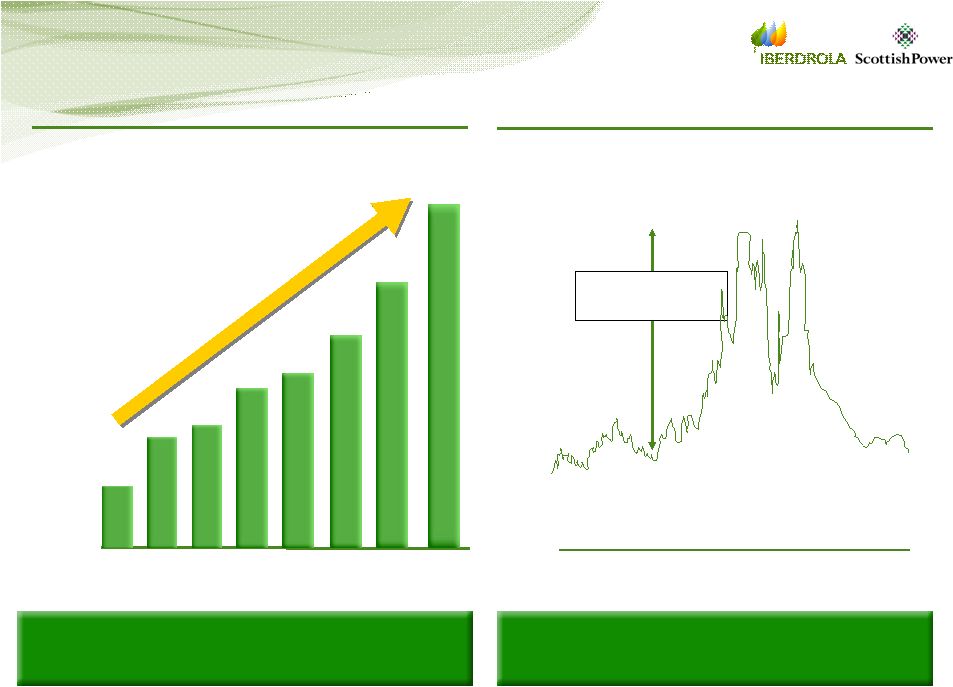 16 US renewables capacity (MW) US gas storage potential Substantial growth – over 9 GW added in last six years. Strong support through “PTC” High US gas import dependency and weather drive strong summer / winter price differentials 0 MW 2000 2001 2002 2003 2005 2006 2004 US market: summary US gas price (14 day Henry Hub average) 2007E 2,000 4,000 6,000 8,000 10,000 12,000 14,000 1.5 3.5 5.5 7.5 9.5 Jan-05 Mar-05 May-05 Jul-05 Sep-05 Nov-05 Jan-06 Mar-06 May-06 Winter/summer spread CAGR 28% |
 17 Conclusion Supply • Fully liberalised market • Concentrated market structure • Market offers scale and opportunities • Attractive fundamentals and regulation • Significant new build needed • Limited regulatory / structural risk • Shortfall in renewable targets create further growth opportunities Generation UK Distribution • Stable asset based regulation • Need for capex supports returns Liberalised business Regulated business Transmission US • Rapidly developing opportunities in distinct sub- sectors – wind generation, gas storage, energy management |
 18 Agenda Introduction to UK and US Utility Sectors Introduction to UK and US Utility Sectors Introduction to ScottishPower Introduction to ScottishPower |
 19 Key messages Highly attractive UK integrated energy player Highly attractive UK integrated energy player • • Generation and trading Generation and trading • • Electricity and gas supply Electricity and gas supply • • Transmission and distribution Transmission and distribution Early mover in two key wind power markets Early mover in two key wind power markets • • No. 2 wind operator in US market No. 2 wind operator in US market • • No.1 UK onshore wind operator No.1 UK onshore wind operator Right strategic direction Right strategic direction • • Built strong positions organically and via M&A Built strong positions organically and via M&A • • Strong EBIT growth track record Strong EBIT growth track record Attractive set of investment opportunities Attractive set of investment opportunities Strong mix of high growth competitive and low risk regulated businesses |
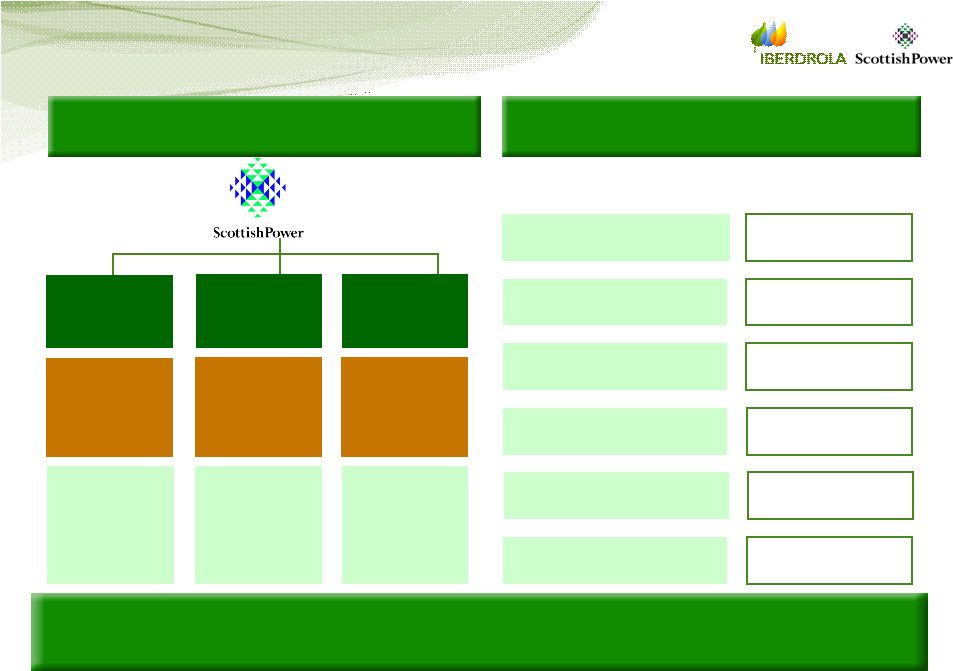 20 4,000 km transmission network 3.4MM distribution points of supply 6,036 MW conv. installed capacity 344 MW wind installed capacity 5.4 MM customers 538 MW (2) conv. installed capacity 1,666 MW wind installed capacity 2.7 bcm gas storage ScottishPower today … Note: (1) GBP:Eur exchange rate GBP 1 : Eur 1.4755 (2) Includes PPM’s 47% ownership of Klamath Cogeneration’s output (506 MW total) Business overview Key financial data (1) UK Liberalised Generation & Supply US & Canada Liberalised Generation & Gas Storage Revenue 8,980 8,980 EBITDA 1,952 1,952 Net income 887 887 Leverage 46% 46% Well positioned in UK and US with strong financial profile EBIT 1,570 1,570 Capex 1,378 1,378 Eur MM UK Regulated Transmission & Distribution 12 months 12 months to Sep 06 to Sep 06 Energy Retail & Wholesale PPM Energy Energy Networks |
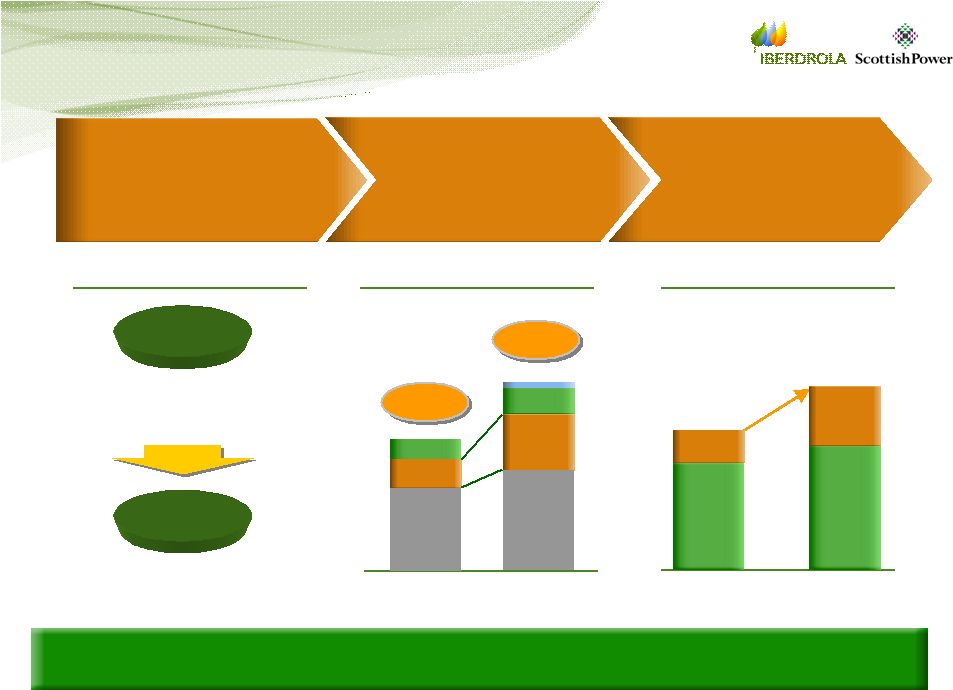    21 … created through a series of successful strategic moves … Note: (1) Installed capacity in 2000 excludes Inverkip and NEA/SHE contracts Elec 2000 (1) 2007 Scotland UK 1.7 MM points of supply 3.4 MM points of supply 2000 2007 Distribution growth Gas 2.7 3.4 2.0 5.4 3.5 0.8 Customers (MM) Geographic diversification Privatisation 1991 Manweb acquisition 1995 Generation diversification CCGT growth 2000 - 2004 Supply growth Successful organic growth and dual fuel supply strategy Coal Coal Other Other Coal Coal 6,380 6,380 4,500 4,500 CCGT CCGT Wind+Hydro Wind+Hydro CCGT CCGT Wind+Hydro Wind+Hydro Generation mix (MW) Successfully targeted key domestic growth drivers |
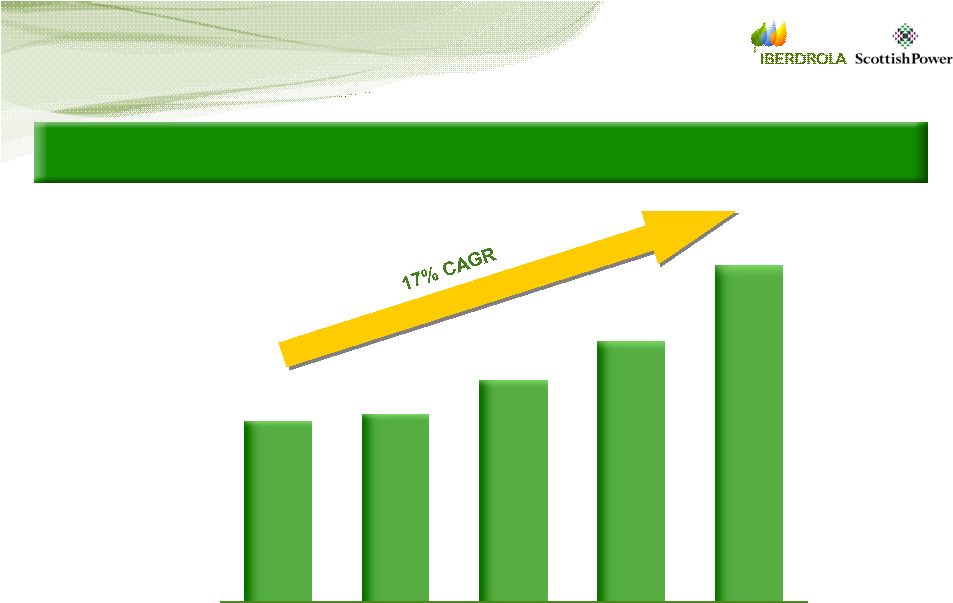 22 … whilst achieving strong EBIT growth EBIT from continuing operations 1,284 993 845 717 693 200 400 600 800 1,000 1,200 1,400 2002 (1) 2003 (1) 2004 (1) 2005 (2) 2006 (2) Eur MM Note: (1) UK GAAP (2) IFRS (3) GBP:Eur assumed 1.4755 |
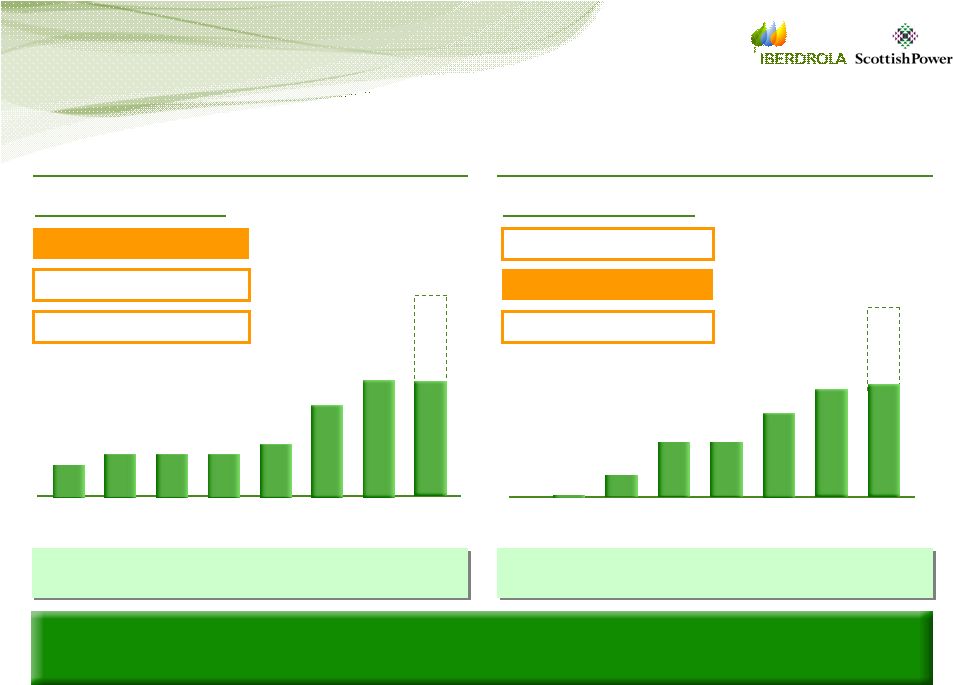 23 Growing to become leading player in UK and US wind ScottishPower is the leading wind operator in the UK and the second largest in the US with a strong pipeline US wind: second biggest in the US Cumulative installed capacity (MW) UK wind: biggest in the UK Cumulative installed capacity (MW) 2000 2001 2004 2005 2006 98 128 158 271 344 818 under construction/ consented 2002 128 2003 128 2001 26 2002 326 2003 830 2005 1,271 2006 1,621 2,192 2004 830 Average annual capacity growth 2002-2006: 43 MW Average annual capacity growth 2002-2006: 319 MW 2000 2 1. ScottishPower 17% 2. RWE 8% 3. E.ON 8% Share of installed capacity 1. FPL (1) 29% 2. ScottishPower (1) 14% 3. MidAmerican 5% Share of installed capacity Source: BWEA Feb 2007, AWEA Apr 2007 Note: (1) Adjusted for contracted capacity under construction/ consented 2007 + under const 2007 + under const |
  24 Key ScottishPower strengths • UK requiring significant generation investment over the next 10 years • Leading positions in high growth renewables markets: • No. 1 UK onshore wind farm developer • No. 2 US wind farm developer • Network assets focused in high growth areas – renewable infrastructure Well positioned in growth markets • Presence in all parts of the energy chain, diversifying risk in a competitive market with volatile commodity prices • Largely asset-backed businesses providing stable returns • Supportive regulatory and government framework Integrated across the full energy value chain • Experienced management team • Strong track record of delivery – EBIT increased by 17% per annum between FY02 and FY06 • Shareholder value focus – prioritising cash management and high levels of returns from investments Track record |
 End of Technical End of Technical Session I Session I Introduction to Introduction to ScottishPower ScottishPower & its markets & its markets |
 Technical Session II Technical Session II ScottishPower ScottishPower UK liberalised businesses: UK liberalised businesses: Generation & Supply Generation & Supply Exhibit 99.7 |
 2 Legal Note IMPORTANT INFORMATION This communication does not constitute an offer to purchase, sell or exchange or the solicitation of an offer to purchase, sell or exchange any securities. The shares of Iberdrola, S.A. may not be offered or sold in the United States of America except pursuant to an effective registration statement under the Securities Act or pursuant to a valid exemption from registration. FORWARD-LOOKING STATEMENTS This communication contains forward-looking information and statements about Iberdrola, S.A. and otherwise, including financial projections and estimates and their underlying assumptions, statements regarding plans, objectives and expectations with respect to future operations, capital expenditures, synergies, products and services, and statements regarding future performance. Forward-looking statements are statements that are not historical facts and are generally identified by the words “expects,” “anticipates,” “believes,” “intends,” “estimates” and similar expressions. Although Iberdrola, S.A. believes that the expectations reflected in such forward-looking statements are reasonable, investors and holders of Iberdrola, S.A. shares are cautioned that forward-looking information and statements are subject to various risks and uncertainties, many of which are difficult to predict and generally beyond the control of Iberdrola, S.A., that could cause actual results and developments to differ materially from those expressed in, or implied or projected by, the forward-looking information and statements. These risks and uncertainties include those discussed or identified in the public documents sent by Iberdrola, S.A. to the Comisión Nacional del Mercado de Valores. Forward-looking statements are not guarantees of future performance. They have not been reviewed by the auditors of Iberdrola, S.A. You are cautioned not to place undue reliance on the forward-looking statements, which speak only as of the date they were made. All subsequent oral or written forward-looking statements attributable to Iberdrola, S.A. or any of its members, directors, officers, employees or any persons acting on its behalf are expressly qualified in their entirety by the cautionary statement above. All forward-looking statements included herein are based on information available to Iberdrola, S.A. on the date hereof. Except as required by applicable law, Iberdrola, S.A. does not undertake any obligation to publicly update or revise any forward-looking statements, whether as a result of new information, future events or otherwise. |
 3 Agenda UK Conventional Generation UK Conventional Generation UK Supply UK Supply Integrated Generation and Supply Integrated Generation and Supply |
    4 • Asset optimisation: - availability - efficiency - maintenance • Investment: thermal - upgrades - new capacity • Customer facing business • Value delivered from: - sales capability - targeted retention - product innovation - service delivery • Trading and scheduling: - capture plant value - minimise commodity cost - manage risk and return • Oversee full chain economics: - generation and supply margins Energy Wholesale Energy Retail Managing the integrated business to maximise value Integrated energy – UK value chain Generation Trading Supply |
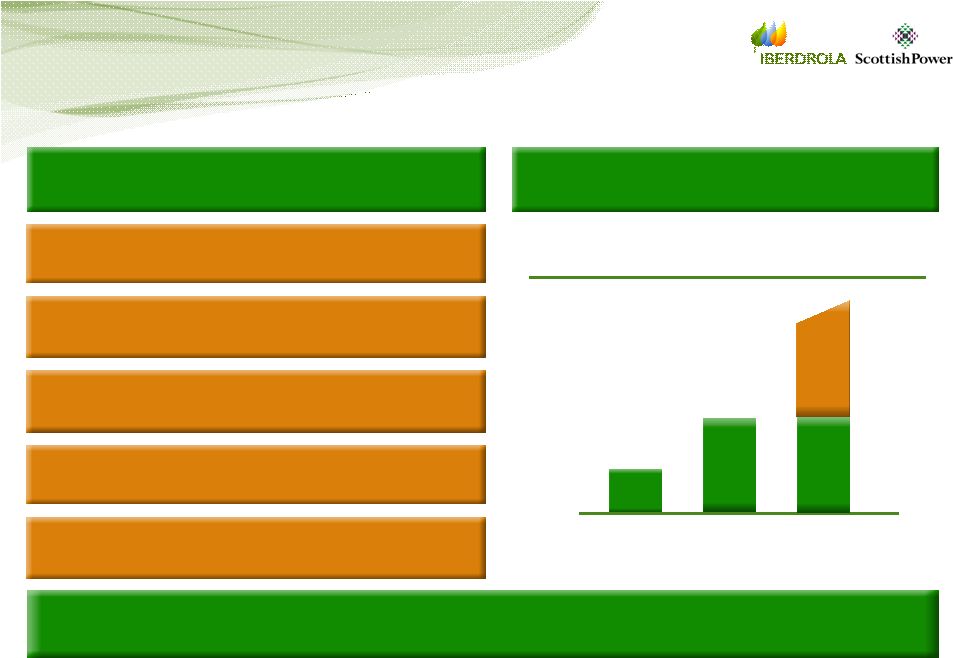   5 … with joint decision making Two businesses but one P&L Each business brings its skills and knowledge to bear Single view of forward wholesale prices Joint understanding of marginal retail economics Joint decisions on retail pricing and customer growth targets Agreed view of long term “through the cycle” supply net margins EBIT (1) trend (IFRS excl. IAS 39) 2004/05 Full Year 2005/06 Full Year 2006/07 139MM 316MM Half Year 319MM Creating value by integrating Generation and Supply Integrated commercial approach … (1) Converted to Eur at exchange rate of 1.4755 |
 6 Overall aim of growing our portfolio of assets and customers Maximising whole chain profitability 1. Increase integrated energy margins 2. Invest in generation assets 3. Focus on operational performance • Restore margins • Grow customers when economic • Competitive advantage from trading • FGD at Longannet • CCGT • Drive value from plant • Proactive customer service • Benchmarked performance Generation and Supply – strategic focus |
 7 ScottishPower - ScottishPower - Generation Generation Agenda Market overview Market overview UK Conventional Generation UK Conventional Generation UK Supply UK Supply Integrated Generation and Supply Integrated Generation and Supply |
 8 Key messages Shifting political and regulatory priorities Shifting political and regulatory priorities • • Before – Before – competition and pricing competition and pricing • • Now – Now – environment and security of supply environment and security of supply Significant new capacity requirements Significant new capacity requirements Wholesale power prices have tracked commodity cycle Wholesale power prices have tracked commodity cycle ScottishPower is one of the top generation players ScottishPower is one of the top generation players • • Attractive mix of assets Attractive mix of assets • • Customer hedge from supply business Customer hedge from supply business • • Strong investment opportunities Strong investment opportunities Managing the integrated Generation/Supply business to Managing the integrated Generation/Supply business to create value create value |
 9 Current themes in UK generation Competition Environmental Security of supply |
 10 UK generation output is changing … UK generation presents a diversified mix with growing renewables capacity Note: (1) Department of Trade and Industry (2005) (2) Internal estimates (assuming no nuclear build by 2016 and 20% plant margin) Current generation mix (1) Forecast generation mix 2016/17 (2) 4% 5% 35% Coal Hydro Renewables 38% Gas 15% Nuclear 3% Oil 0% 5% 19% Coal Hydro Renewables 59% Gas 9% Nuclear 8% Oil |
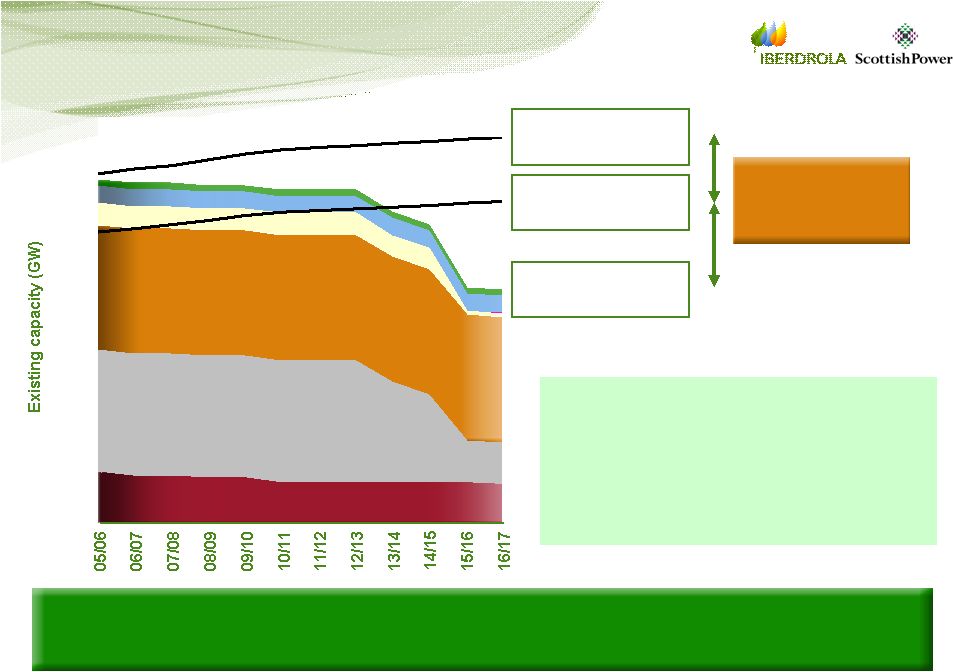 11 Greater need for new build in the UK compared to other European countries due to ageing coal and nuclear fleets 10 20 30 40 50 60 70 80 90 Peak demand: 75GW by 2016/17 With 20% margin: 90GW by 2016/17 Post 2016/17 20 to 35 GW supply gap “Over next two decades, UK needs substantial investment in generation capacity to replace closing coal, oil and nuclear plant…” Energy Review, July 2006 Coal CCGT and CHP Nuclear OCGT and Oil Hydro Renewables Existing capacity: 55GW by 2016/17 … with reserve margins becoming tighter … |
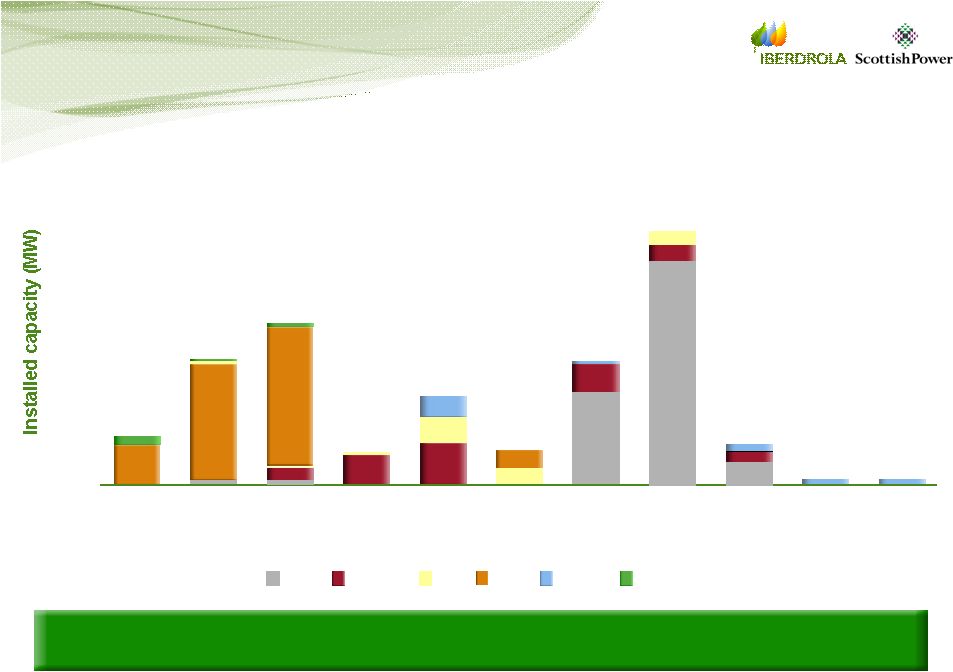 12 … and the generation capacity older … Source: Department of Trade and Industry Note: Percentages indicate installed generation capacity of that age as a proportion of the total installed capacity Almost 50% of UK generation capacity is more than 30 years old 10% 3% 5% 4% 1% 5,000 10,000 15,000 20,000 25,000 0-5 6-10 11-15 16-20 21-25 26-30 31-35 36-40 41-45 46-50 51-120 coal nuclear oil gas hydro renewables Age (years) 1% 13% 13% 18% 4% 28% Total installed capacity: 81,738 MW |
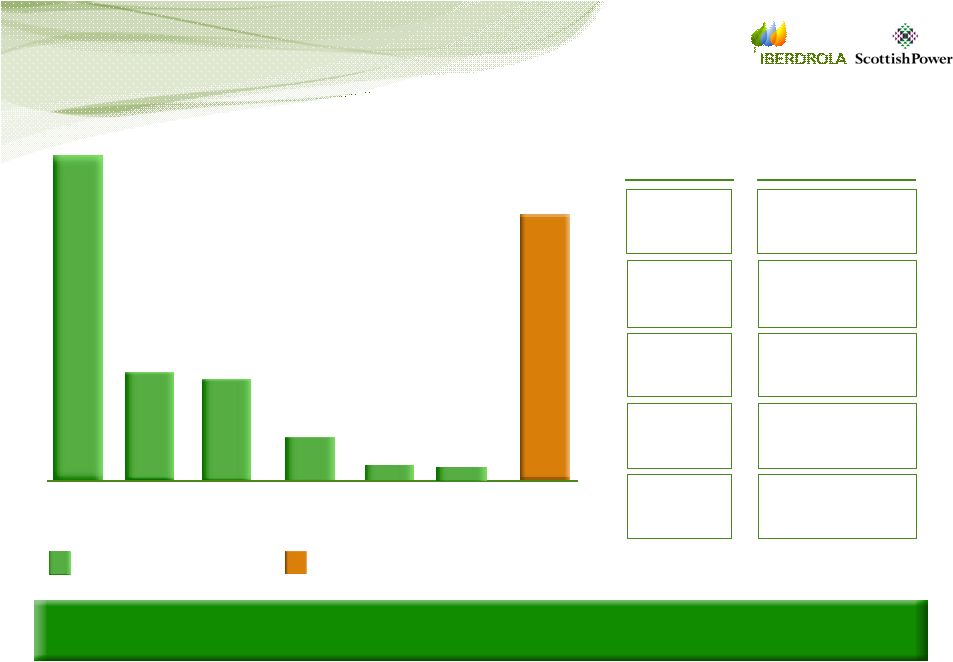 13 Significant baseload new build requirement post 2015 9,791 29,184 1,385 1,055 4,015 20,362 Coal Renewables OCGT and oil Hydro New Build High cost, dependent on RO, vital role Renewables Competitive with CCGT, depending on the cost of gas New Coal (supercritical) New environmental costs Old Coal (supercritical retrofit) Low risk, technology of choice, LNG link New CCGT Comment Technology Gas Note: Existing 2016/17 capacity reflects 2005/06 plant that has run-off by 2016/17. Gas includes CHP MW Estimated 2016/17 capacity New build required to meet estimated peak demand 9,220 Nuclear Competitive but wide cost range, other issues Nuclear … requiring new build capacity |
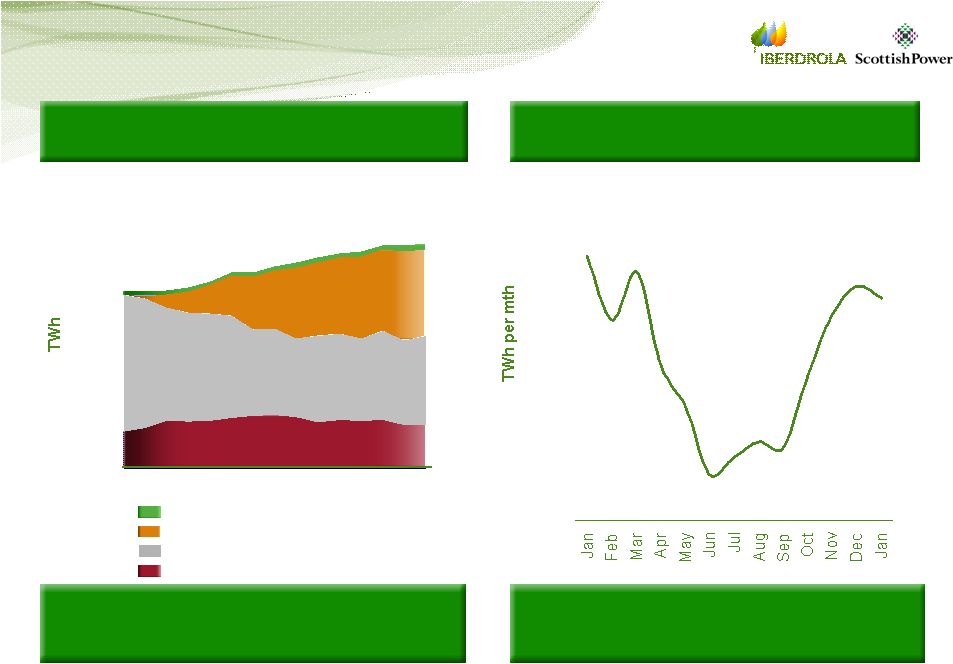 14 Demand profile (2006) Source: National Grid, Department of Trade and Industry …with some intra-year demand fluctuation Production by fuel type Conventional thermal and other CCGT Nuclear Renewables & pumped storage Decline in conventional generation more than offset by growth in CCGT… 0 50 100 150 200 250 300 350 400 450 1991 1994 1997 2000 2003 2006 UK generation market characteristics 24 26 28 30 32 34 36 |
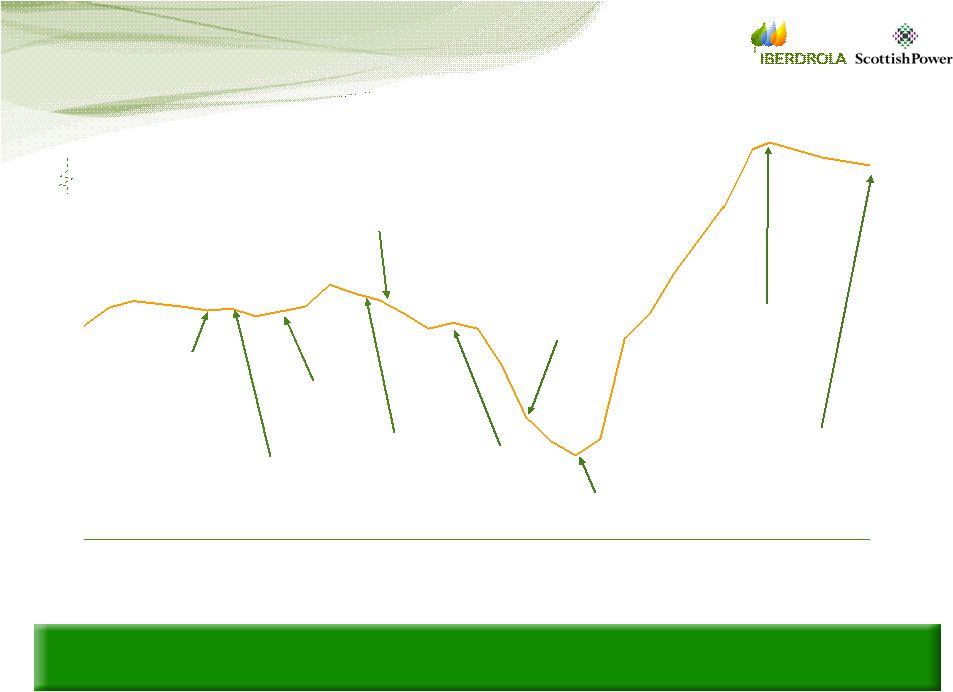 15 10 12 14 16 18 20 22 24 26 28 30 1992 1993 1994 1995 1996 1997 1998 1999 2000 2001 2002 2003 2004 2005 2006 2007 2008 • Second ETS phase • New gas infrastructure Price £ / MWh Second tranche of NPR and PWG floated Beginning of investment in UK generation by US companies British Energy floated Lifting of gas moratorium Gas moratorium announced Introduction of NETA • First ETS phase • LCPD • Net importer of gas • High oil prices Plant being mothballed Volatility highlights strength of vertical integration Legacy coal contracts expired 48 UK wholesale prices have followed need for new capacity and global commodity prices… |
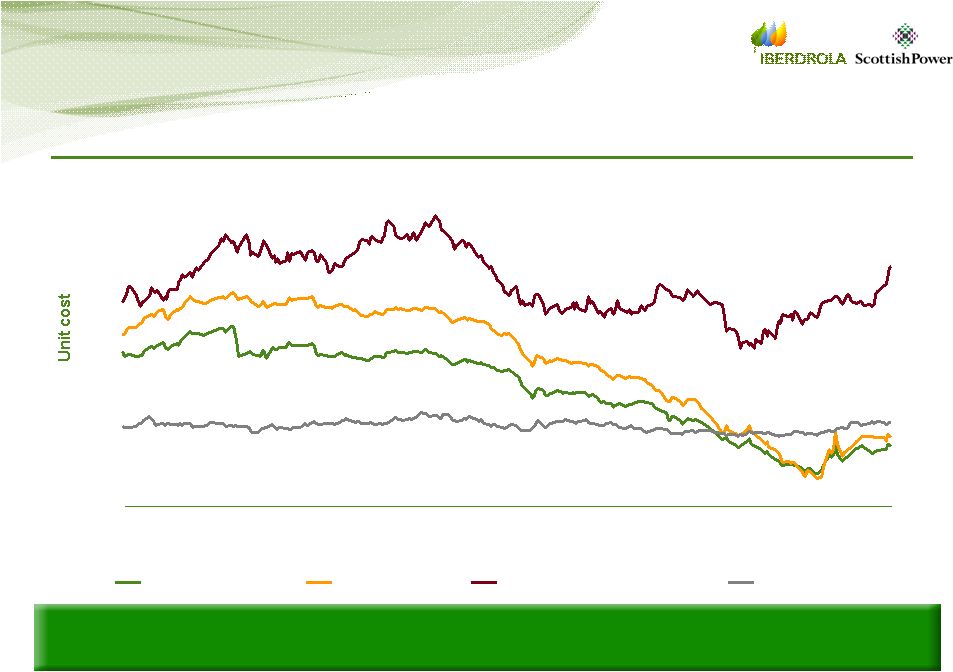 16 Gas is key to the UK market … with recent prices driven by gas market developments Wholesale Prices 07/08 (nominal) 20 30 40 50 60 70 80 Mar-06 Apr-06 May-06 Jun-06 Jul-06 Aug-06 Sep-06 Oct-06 Nov-06 Dec-06 Jan-07 Feb-07 Mar-07 Power (£/MWh) Gas (p/therm) Front month Brent ($/bbl) Coal (£/tonne) Source: Power - European Daily Electricity Markets, Heren Energy; Gas - European Spot Gas Markets, Heren Enrrgy; Front month brent - Reuters News Services, Front month coal - Daily Coal & Emissions Report, TFS Energy |
 17 ...but even vertically integrated players are not balanced at all times Vertical integration provides good hedge of value... • Fragmented generation market leads to actively traded market: Trading electricity in the UK Most trades are forward contracts ‘for physical delivery’ • Liquidity best in front year – limited liquidity for products other than baseload beyond this • Well developed broker market – final contract is bilateral between counterparties • Limited power exchange market – counterparty is always the exchange • Good price discovery for main traded products in liquid period • Only allowed to trade with system operator up to 1 hour before delivery – no trading after delivery, imbalance charges apply Industrial/commercial contracts do not give hedge beyond contract period – typically one year |
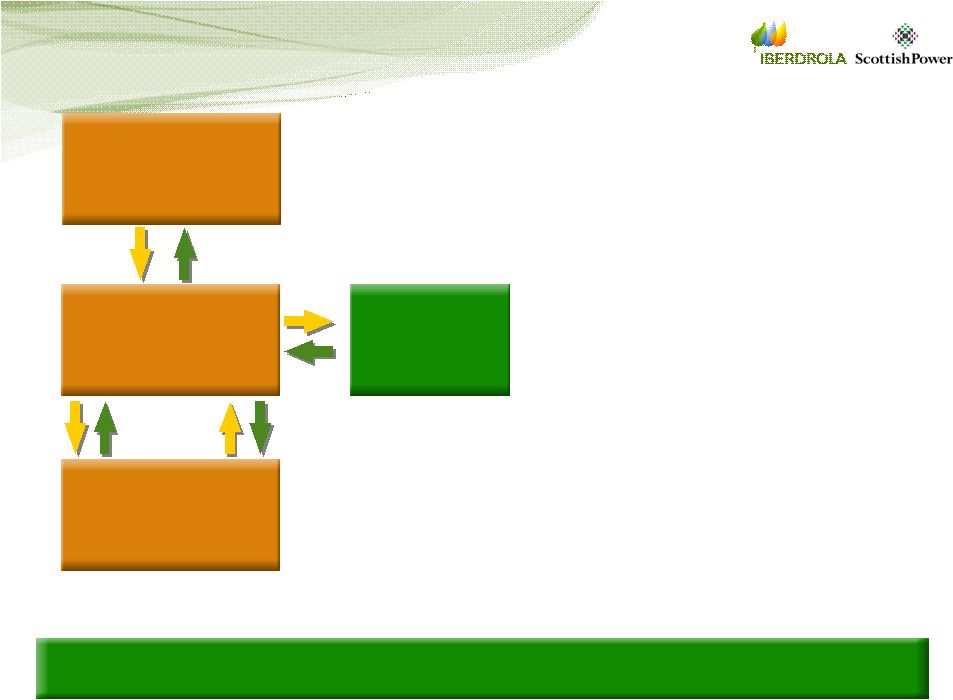 18 Trading electricity in the UK – example Trading provides the market linkage for Generation and Supply • Generation output to Supply – but not a perfect match (shape, volume) • Trading in market: - to provide balance - to reflect churn of position - for incremental value • Trading = up to 3x physical volumes i.e. liquid market • Generation returns: - part of retail price - part from wholesale trades - all returns controlled by trading Generation Trading Market Supply 33.5 TWh 28.7TWh £0.85bn £1.25bn 38.3 TWh £1.3bn £0.6bn 23.9 TWh |
 19 • The structure of the industry dictates the use of four different kinds of trading mechanism (apart from the centralised Balancing Mechanism): Internal trades between generator businesses and their wholesale trading and retail supply businesses, within vertically integrated companies Long-term agreements (typically 15 years) between independent generators and other market participants Traded markets for medium-term OTC contracts Power exchange(s) • Under the British Electricity Trading and Transmission Arrangements (“BETTA”) there is no centralised spot market or pool, so there is little public information on the means of trading electricity, used by individual players • The starting point for BETTA is a reliance on bilateral contract trading to establish the initial plan for each generator’s output • The majority of trades are forward contracts “ for physical delivery” (there is a small options market, but it is not well developed) • Parties may have to enter into brokered negotiations before settling on the transaction price Trading electricity in the UK (2) |
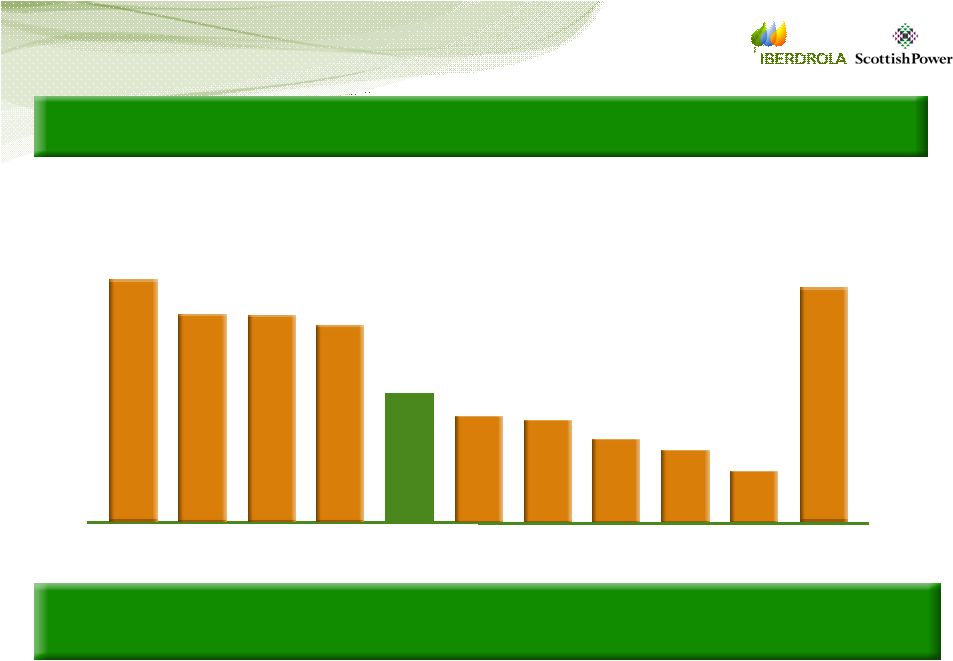 20 Key generation players in the UK … Total installed capacity: 81,738 MW Note 1: Excludes interconnector capacity with Scotland and France Source: Department of Trade and Industry Competitive UK generation market with the largest player holding less than 15% of market share % of total installed capacity 15% BE 13% RWE 12% E.ON 13% SSE 8% SPW 6% EDF 7% IPR 5% DRX 4% CNA 3% INT 14% OTH |
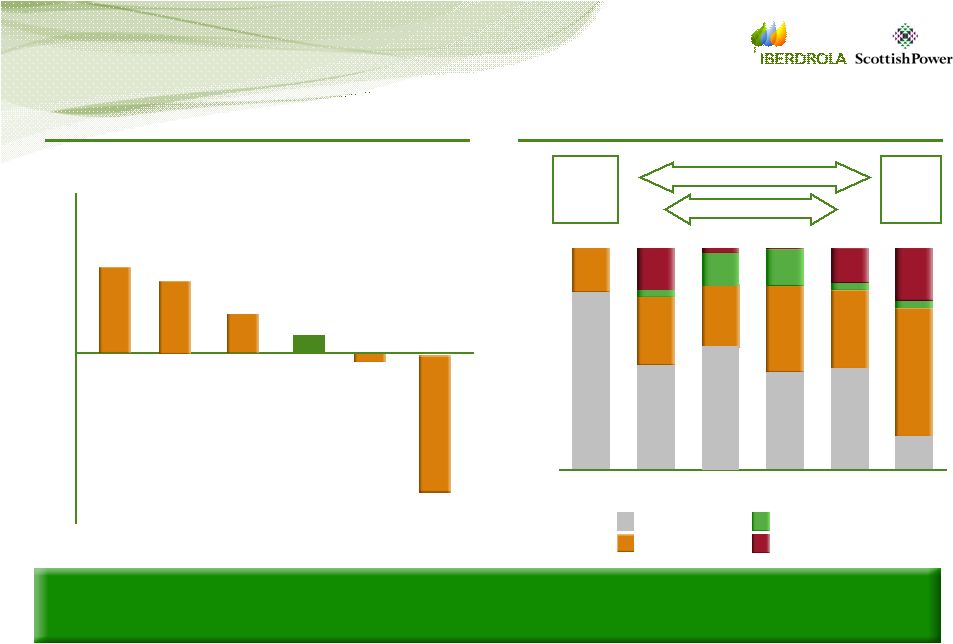 21 … have different strategic positions Note: (1) ScottishPower estimates (2) Estimates based on UK installed capacity Source: company web sites ScottishPower has a balanced portfolio in terms of upstream downstream position and fuel mix RWE E.ON SPW CEN 20 10 0 -10 -20 TWh Upstream / downstream positioning (1) Fuel mix (2) Wind and hydro Other Coal Gas 15% 44% 46% 46% 80% 58% 40% 38% 31% 20% 3% 15% 2% 24% 1% 14% 21% 20% 40% 60% 80% 100% EDF RWE E.ON SSE CEN Coal heavy Gas heavy Balanced mix SSE EDF 54% 30% 14% 2% SPW Renewables 2% |
 22 ScottishPower - ScottishPower - Generation Generation Agenda Market overview Market overview UK Conventional Generation UK Conventional Generation UK Supply UK Supply Integrated Generation and Supply Integrated Generation and Supply |
 23 ScottishPower’s generation fleet - A well balanced generation mix 6,380 Coal Coal CCGT & CHP CCGT & CHP Wind Wind Hydro Hydro 2007 generation mix (MW) Installed Capacity (MW) Plant 2,304 1,152 800 715 Longannet (LCPD opt-in) Cockenzie (LCPD opt-out) Damhead Creek Rye House 400 Brighton 440 Cruachan (pump storage) 106 17 Galloway Scheme Lanark Scheme 32% 54% 9% |
 24 Operational highlights - coal Production (TWh) Production (TWh) 3.9 6.8 H1 05/06 H1 06/07 Availability (%) Availability (%) 58% 61% H1 05/06 H1 06/07 FY 05/06 12.9 65% FY 05/06 Strong spreads incentivise maximum running and support FGD investment Investing in improving availability Low sulphur coal strategy Load factors lower summer than winter – lower spreads, outage schedules Significant value in coal generation in the UK |
 25 Operational highlights - gas Production (TWh) Production (TWh) 5.2 2.9 H1 05/06 H1 06/07 Availability (%) Availability (%) 77% 47% H1 05/06 H1 06/07 FY 05/06 9.8 83% FY 05/06 Plant run on economics rather than to meet demand Low baseload spreads put emphasis on flexibility / 2 shifting to capture peaks Rye House one of top 2 shifting gas plants in UK Spark spreads now improving but not yet at LRMC Flexing gas plant running to capture peak prices |
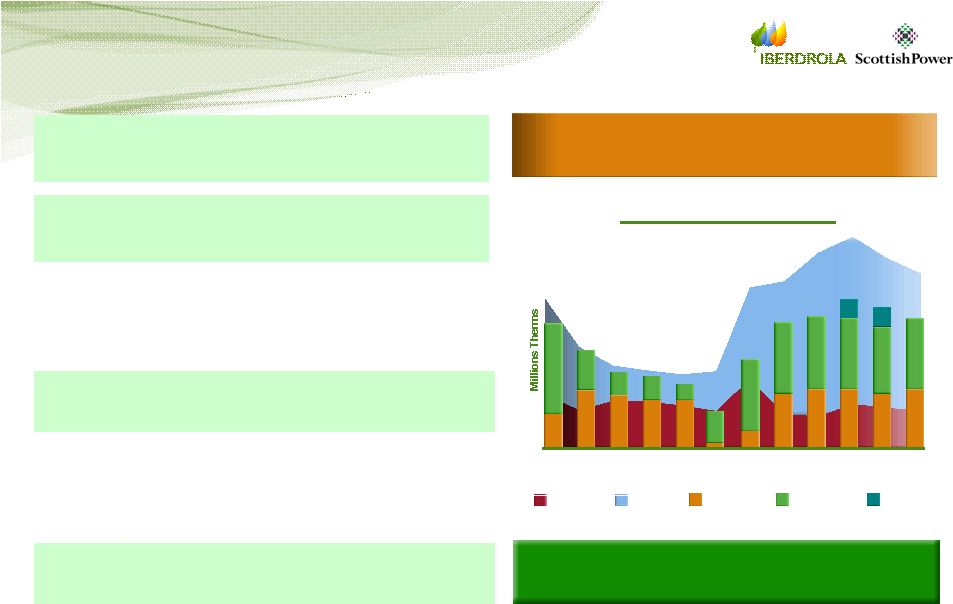  26 UK markets function effectively Both UK power and gas markets relatively liquid on year ahead basis Able to operate gas generation on a spread basis • long-term contract base with swing (~0.32 bcm) • own gas storage at Hatfield (~0.06 bcm) LT contracts have delivered substantial value to ScottishPower Steady buying strategy for domestic gas customers dampens wholesale movements: • buying for customers stretches into medium term • significant cost advantage 2005/06, 2006/07 • in line with industry / competitor approach • sell power, buy fuel when in money • buy back power, sell fuel when out of money • churn position repeatedly to delivery Gas portfolio: Gas demand cover Apr 07 May 07 Jun 07 Jul 07 Aug 07 Sep 07 Oct 07 Nov 07 Dec 07 Jan 08 Feb 08 Mar 08 Generation Domestic LT Contracts Net Contracts Storage ScottishPower gas hedging position |
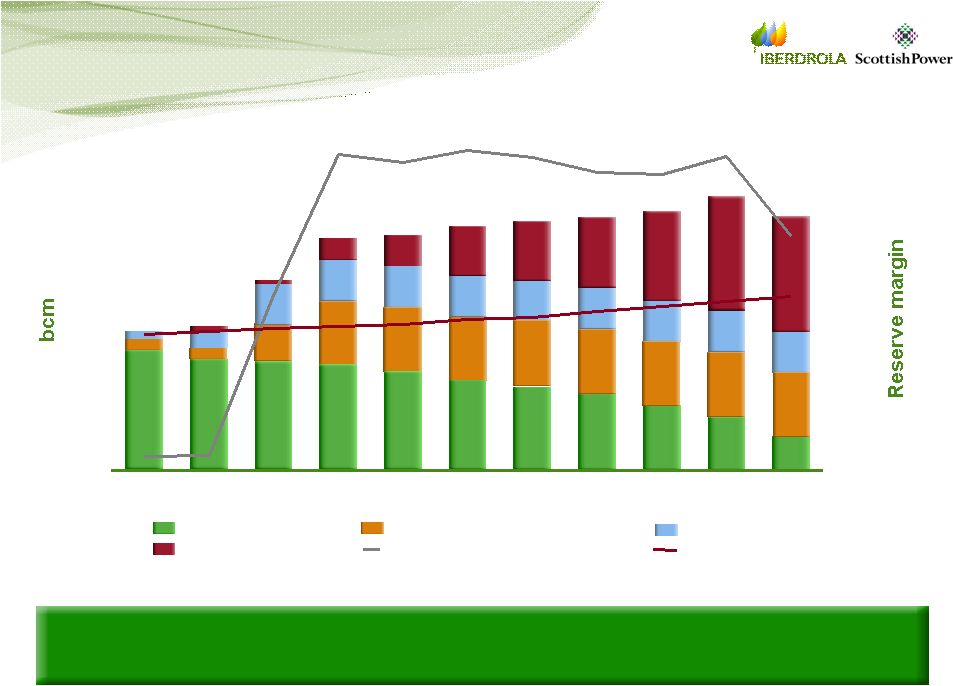 27 LNG offers attractive gas opportunities By 2015 the majority of UK gas will be sourced from abroad and therefore LNG growth will present an opportunity for Iberdrola’s energy business 0 50 100 150 200 2005 2006 2007 2008 2009 2010 2011 2012 2013 2014 2015 0% 10% 20% 30% 40% 50% 60% 70% UKCS Norway Continent LNG Margin (RHS) Demand Source: National Grid 7 Year Statement |
  28 Generation and trading capability Turning good assets and opportunities into “best in class” returns Commercial and trading • Highly capable and experienced trading desk covering power/gas/coal/environmental • International coal and biomass logistics • Strong analytical capabilities • Benchmark favourably to EU peers (McKinsey) • Diverse portfolio: coal, gas, storage, hydro, wind • Optimising through availability and flexibility • Top performer in Balancing Mechanism • Benchmarked operations and safety Generation Supply Incremental trading Schedule plant to optimise value Capture maximum spread opportunity Competitive commodity cost Manage wholesale price risks Aggregate annual incremental contribution: approximately Eur 100MM Capturing value across full chain Asset operation |
 29 UK generation: key economic drivers ScottishPower generation volumes Load factors: Coal 45-50%, CCGT 45-65%, Hydro 30% Maintenance schedules / outages Captured load-to-baseload premium Clean dark and spark spreads Attractive returns can be earned from UK generation Baseload price Ancillary services / balancing market flexibility O&M costs R E V E N U E EBITDA margin |
 30 Conclusion ScottishPower • Balanced portfolio • Attractive locations • Strong operational performance • Trading capability • Investment opportunities • Tightening reserve margins • Market based solutions • Competitive market with no dominant player • Customers provide robust hedge Generation players UK market ScottishPower offers one of the best balanced generation mixes in the attractive UK generation market |
 31 ScottishPower – ScottishPower – Supply Supply Agenda Market overview Market overview UK Conventional Generation UK Conventional Generation UK Supply UK Supply Integrated Generation and Supply Integrated Generation and Supply |
 32 Key messages Recently improving margins Recently improving margins Business drivers Business drivers • • Customer mix, responsiveness to wholesale prices Customer mix, responsiveness to wholesale prices • • Customer retention / growth or margin Customer retention / growth or margin Competition reduced to six majors Competition reduced to six majors ScottishPower has an attractive portfolio of gas and ScottishPower has an attractive portfolio of gas and electricity customers electricity customers • • Electricity hedge from generation business Electricity hedge from generation business |
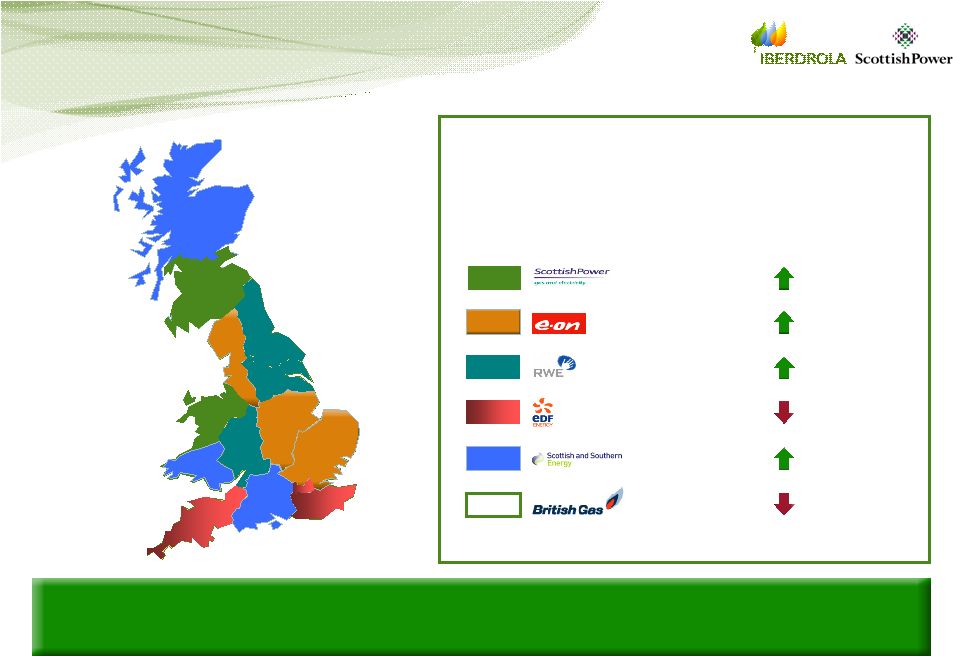    33 …with ScottishPower demonstrating excellent performance in the competitive market The UK has six major energy suppliers … Domestic Retail Energy Accounts (MM) TOTAL (1) 5.1 (3) 7.5 6.0 4.6 6.7 15.7 Electricity market Share (2) 13% 20% 15% 13% 16% 22% (1) Internal estimates (2) Source: Ofgem, Mar 2006 (3) Excludes Industrial/Commercial and small business customers Change from Deregulation 70% 1% 7% 11% 63% 21% Gas market share (2) 9% 13% 10% 6% 10% 52% |
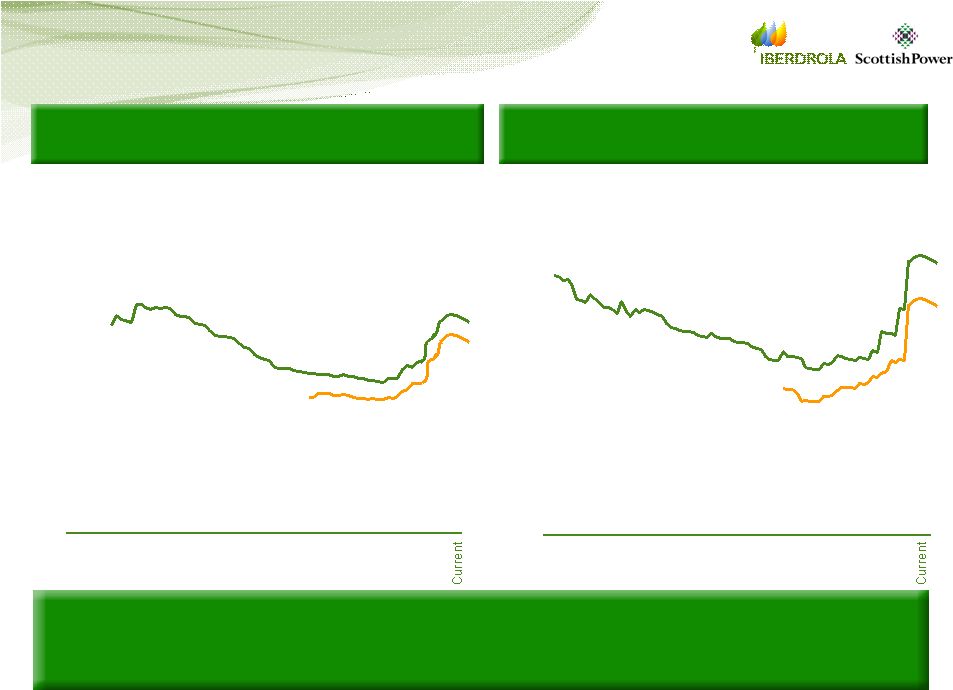 34 Supply competition has reduced customer bills in real terms … Recently real energy bills have risen on the back of all time high wholesale prices Gas Annual bill (Eur) Annual bill (Eur) Electricity 200 400 600 800 1000 Q286 Q289 Q291 Q293 Q295 Q297 Q299 Q201 Q203 Q205 Incumbent Best offer 200 400 600 800 Q189 Q191 Q193 Q195 Q197 Q199 Q101 Q103 Q105 Incumbent Best offer Q205 Source: Ofgem |
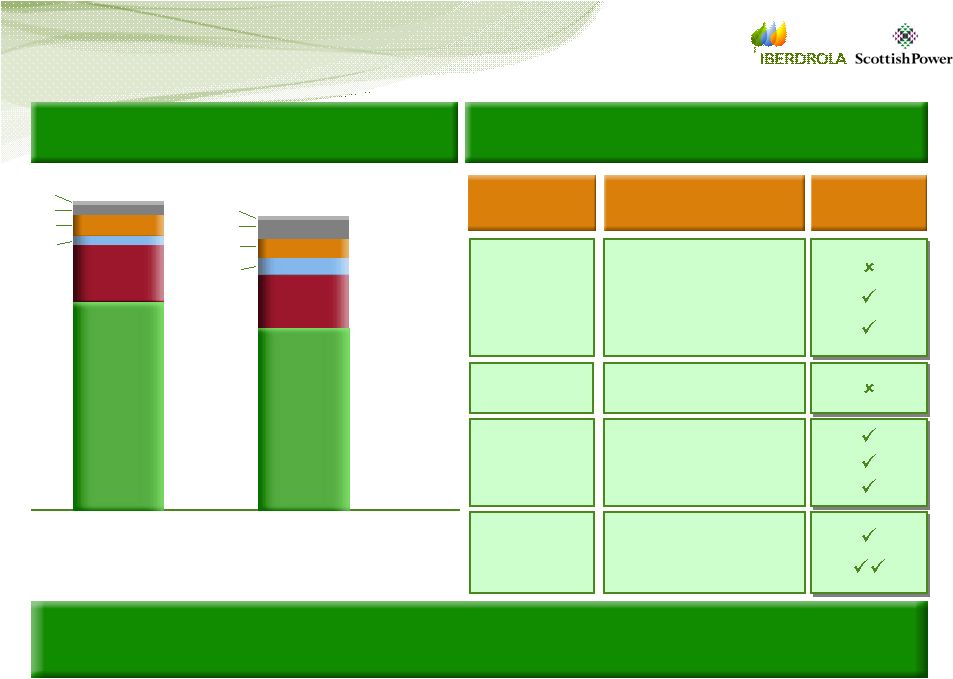  35 … with retail margins driven by mainly controllable parameters Value drivers Average UK residential energy bill Margin targets set through customer mix and wholesale/retail price management Eur 851 Gas Eur 530 Electricity Transmission Energy, supply costs and margin Distribution 16% 74% 5% 2% 2% 1% 17% 70% 5% 4% VAT Environmental Meter provision Component Value drivers Controllable by management • Oil price and other commodity prices • Environmental (ROCs) • Contracted position / owned upstream • Various distribution and transmission charges • Sales and marketing • Quality of service • Metering, billing and debt management • Customer mix • Tariff strategy: margin vs. volume Wholesale procurement Transportation Cost to serve (CTS) Margin Source: Ofgem, Datamonitor 5% 0% |
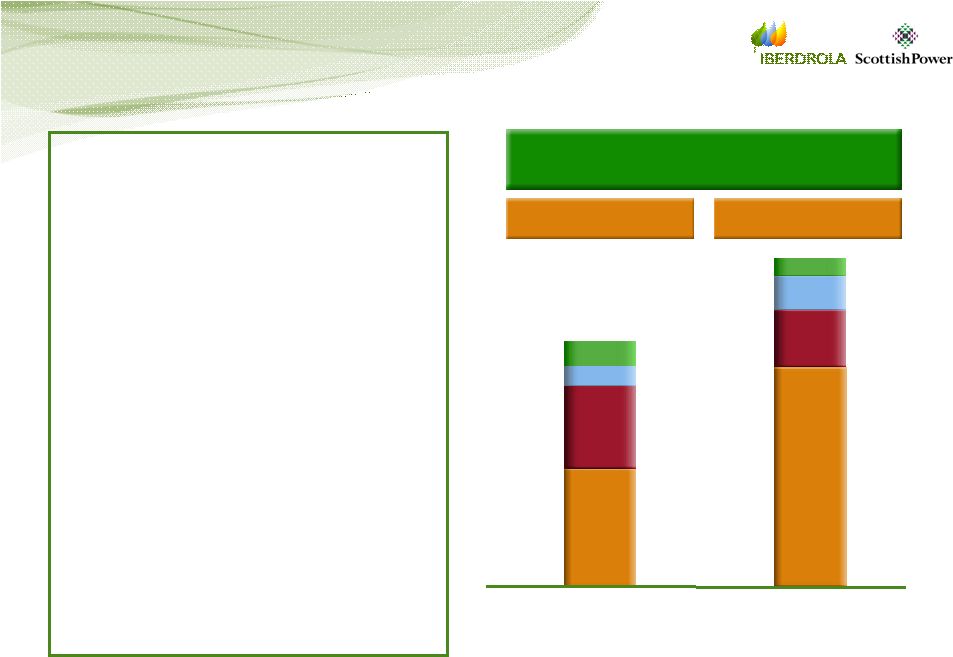 36 Supply economics improving Average customer bill Electricity • Retail tariffs tend to lag wholesale prices • Series of tariff increases throughout 2005 and 2006 • Fall in wholesale prices since summer 2006 peak • Competition for customers intensifying as economics improve • Tariff proposals under continual review Indicative Energy Energy Pipes T&D CTS CTS Net Profit WACOE Net Profit WACOG Gas |
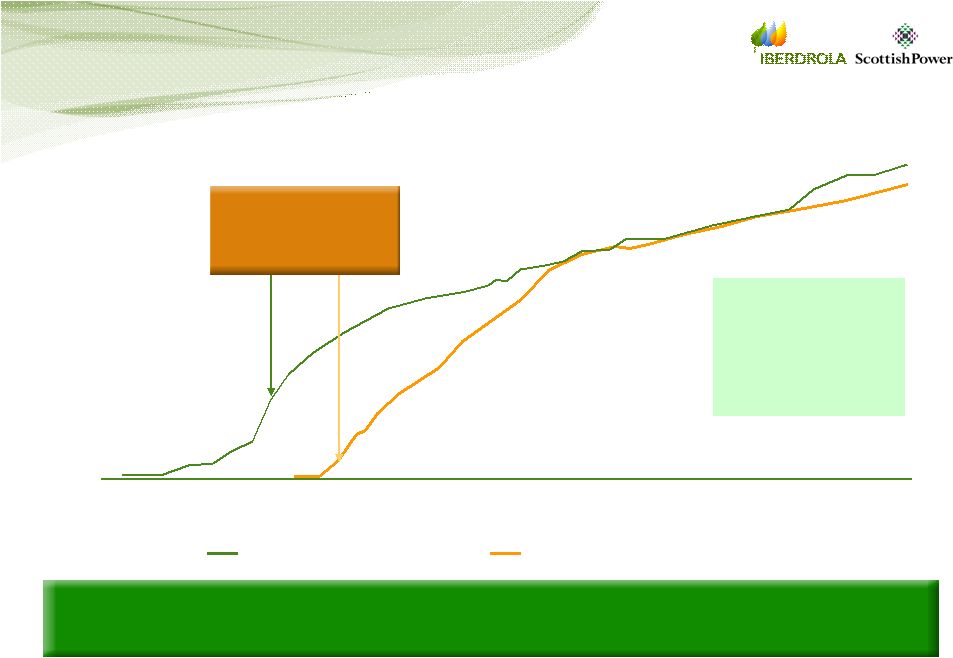 37 Market share of new entrants has slowly developed since opening … Gas out-of-area market share Electricity out-of-area market share Full national domestic competition 10% 20% 30% 40% 50% Apr-96 Apr-97 Apr-98 Apr-99 Apr-00 Apr-01 Apr-02 Apr-03 Apr-04 Apr-05 0% Source: Ofgem … driven by price, increased marketing spend and customer service Some switching in 2006 as prices rose Incumbent market shares now less than 50% for E.ON, RWE and Centrica |
 38 Agenda ScottishPower – ScottishPower – Supply Supply Market overview Market overview UK Conventional Generation UK Conventional Generation UK Supply UK Supply Integrated Generation and Supply Integrated Generation and Supply |
 39 Customer base of ScottishPower has increased … 3.0 3.5 4.0 4.5 5.0 5.5 3.10 1998 3.30 1999 3.50 2000 3.50 2001 3.50 2002 3.65 2003 4.25 2004 5.00 2005 5.25 2006 MM Deregulatio n Early Early growth growth Billing Billing migration and migration and reshaping reshaping Accelerated Accelerated growth growth Customer numbers have increased by over 70% since deregulation 2007 5.35 |
 40 … with clear initiatives to increase value per customer … Maximising value from the customer base 2002 2002 2007 2007 Gas Solus DD Dual Fuel 295k 213k 678k 2,512k Electricity Solus 1,724k 1,551k RCQ Dual Fuel 367k 565k Prepayment 474k 516k 2002 2007 2002 2007 2002 2007 Key drivers of value: • Margin • Churn • Cost-to-serve • Debt |
 41 Customer collections Sales and marketing … and ScottishPower has key strengths in the retail gas and electricity market Operations Continuous operational improvement Customer services Source:(1) Uswitch survey (2) Datamonitor (3) Energywatch, March 2007 (4) 2007 European Six Sigma Awards • 1 st for on-line services (1) • Proven and flexible sales resource • Product innovation and speed to market • Highest customer Direct Debit penetration in industry • 2 nd overall for customer satisfaction (1) • 73% reduction in year on year complaint levels (3) • 75% first contact resolution • World class telephony and support system • 1 st for metering and billing services (1) • Top UK performer in bill quality • Lowest cost-to-serve in industry (2) • Award winning Six Sigma and Operational Excellence programme (4) • 13% working capital reduction over 2 yrs • Lower quartile bad debt write off levels • Leading debt management systems |
 42 Further opportunities to enhance the value of the business Customer growth when economic conditions are right Reshaping customer base towards secure/direct debit payment Cost-to-serve reductions through increased self service and focus on ‘getting it right, first time’ Smart metering: lower cost-to-serve and debt through consumption aligned with bill and payment Competitive edge through differentiated customer service - optimise industry leading on-line capability Optimise output from Energy Review: grow and develop, where appropriate, the energy efficiency business model and capability Continual operational improvement |
 43 UK supply: key economic drivers Retail customer growth Recently improving margins in UK supply are supported by levelling off of wholesale power and gas prices EBIT margins Current / short-term Long term Energy use per customer SP averages: gas 600-700 thm and electricity 4,500-5,000 kWh per annum Energy purchase costs Market Weighted average cost Average customer bill Other costs: cost-to-serve, T&D |
 44 Conclusion ScottishPower • Attractive mix of gas and electricity customers • Balanced portfolio • Increase in dual fuel customer base • Improving conditions in retail • Balance between margins and customers • “Major six” • Competition to achieve economies Supply players UK market ScottishPower has been a successful player in the supply market since deregulation |
 45 Agenda Appendix Appendix |
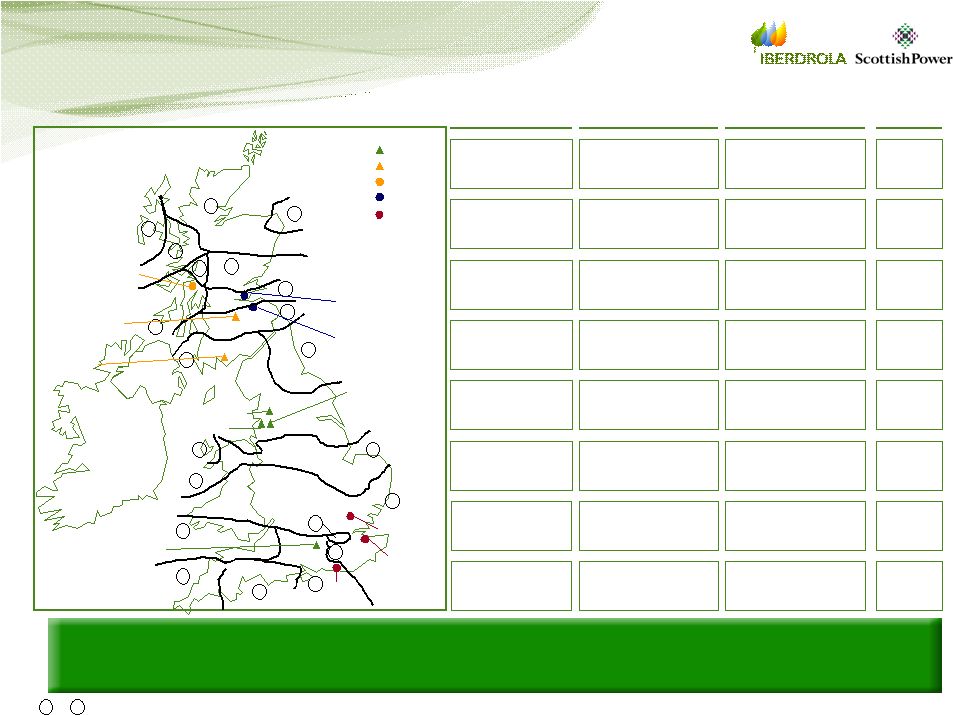 46 ScottishPower’s conventional generation assets … Installed Capacity (MW) Fuel Age Plant 2,304 1,152 800 715 Coal Coal CCGT CCGT 440 Hydro 37 40 7 14 41 Longannet (LCPD opt-in) Cockenzie (LCPD opt-out) Damhead Creek Rye House Cruachan (pump storage) 106 17 Hydro Hydro 70* 80 Galloway Scheme Lanark Scheme * Approximation, plants range from 1935-1985 opening years CHP Hydro CCGT Pumped Cruachan Longannet Cockenzie Lanark Galloway Ravenshead Sappi Rye House NHHT Basingstoke Brighton Pearsons Damhead Creek 1 2 3 5 6 7 8 9 10 11 12 13 14 15 16 17 18 19 20 21 Coal 4 1 21 Transmission Network Use of System charge zones - … represent a balanced generation mix to 400 CCGT 7 Brighton |
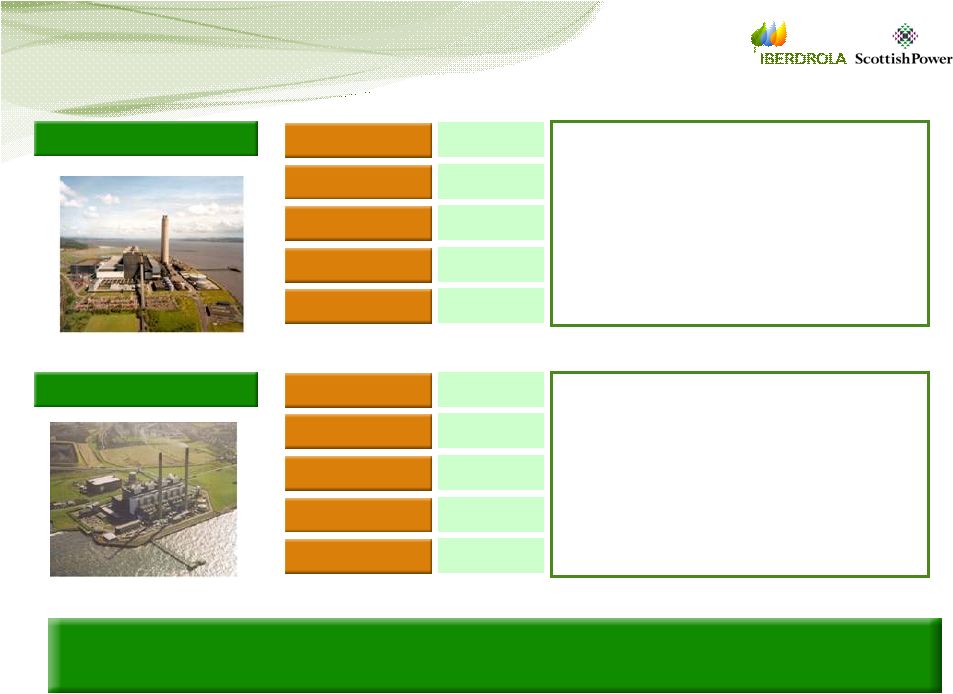 47 … include coal generation … Operational date No of units Installed capacity 1970 4 x 576 MW 2,304 MW Location Fife Employees 320 Operational date No of units Installed capacity 1967 4 x 288 MW 1,152 MW Location Edinburgh Employees 150 • Opted in LCPD - £170m investment secures plant to 2015 • Turbine blade upgrade • Developing blueprint for supercritical retrofit (carbon capture ready) • First UK plant to burn biomass / WDF • 20MW dedicated biomass planned for site • Benchmarked operational performance • Opted out LCPD • Exploring potential for supercritical retrofit • Burning biomass up to 5% • Flexibility in Balancing Market Longannet Cockenzie Strong dark spreads drive investment in coal plant to maintain operations for next 20 years |
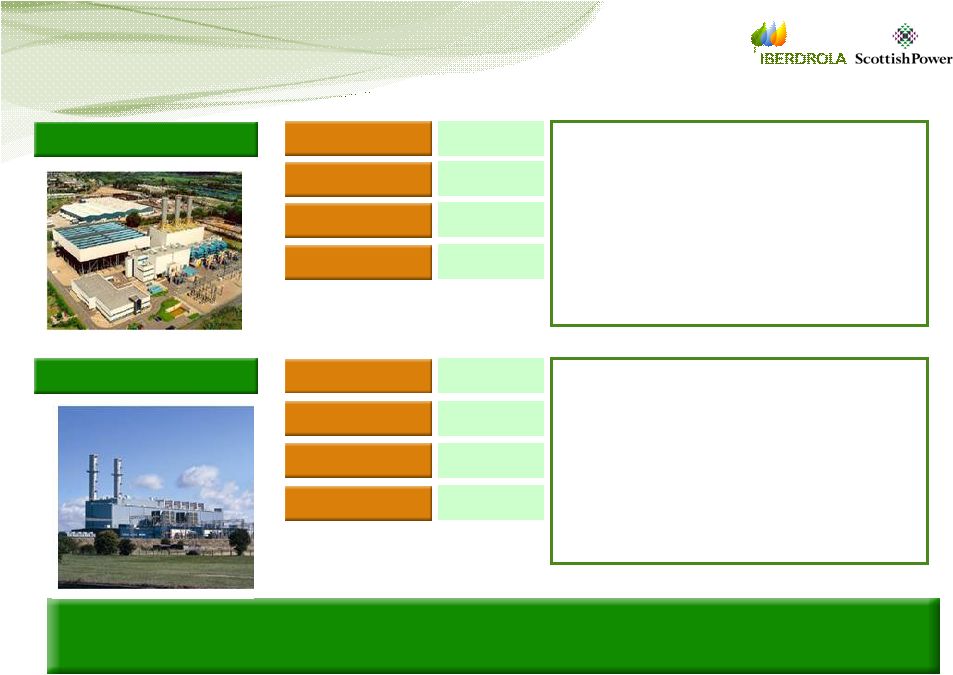 48 … gas generation … Operational date Installed capacity 2000 800 MW Location Kent Employees 40 Operational date Installed capacity 1993 715 MW Location Hertfordshire Employees 40 • Modern, efficient plant • Acquired by ScottishPower in 2004 • Damhead Creek’s prime location in Southern England enables it to benefit from relatively favourable transmission charges • Valuable gas contract Damhead Creek Rye House • Converted from baseload to one of the most flexible CCGTs in UK – <5 p.a. pre acquisition – up to 200 starts p.a. currently • Control systems and valves replaced to optimise performance. Improved monitoring • Transferring best practice to other assets Rye House is one of most flexible CCGTs in the UK |
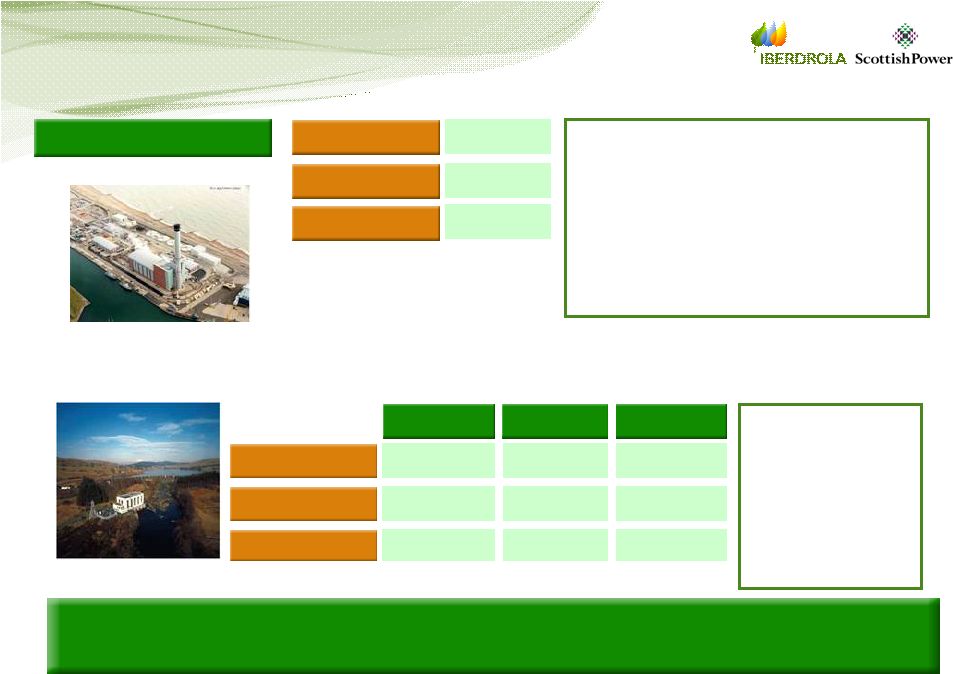 49 Operational date Installed capacity 1965 440MW Location Argyll & Bute Cruachan Galloway 1930s/1985 106MW Galloway Lanark 1920s 17MW Lanarkshire Operational date Installed capacity 2000 400MW Location Sussex Brighton … and hydro generation • American Electric Power (parent company to SEEBOARD) and ScottishPower built Brighton together in 2001, each holding a 50% stake in the plant • In October 2004 ScottishPower bought out the remaining 50% it did not already own • Plant offline until late summer 2007 for station transformer repair • In 2004 Cruachan upgraded to increase power output by 10 per cent • Flexibility for SO • Sub 20MW hydro secures ROCs Hydro assets were recently upgraded to increase output by 10% |
 50 End of Technical End of Technical Session II Session II Introduction to Introduction to ScottishPower ScottishPower & its markets & its markets |
 Technical Session III Technical Session III ScottishPower ScottishPower UK Wind generation UK Wind generation Exhibit 99.8 |
 2 Legal Note IMPORTANT INFORMATION This communication does not constitute an offer to purchase, sell or exchange or the solicitation of an offer to purchase, sell or exchange any securities. The shares of Iberdrola, S.A. may not be offered or sold in the United States of America except pursuant to an effective registration statement under the Securities Act or pursuant to a valid exemption from registration. FORWARD-LOOKING STATEMENTS This communication contains forward-looking information and statements about Iberdrola, S.A. and otherwise, including financial projections and estimates and their underlying assumptions, statements regarding plans, objectives and expectations with respect to future operations, capital expenditures, synergies, products and services, and statements regarding future performance. Forward-looking statements are statements that are not historical facts and are generally identified by the words “expects,” “anticipates,” “believes,” “intends,” “estimates” and similar expressions. Although Iberdrola, S.A. believes that the expectations reflected in such forward-looking statements are reasonable, investors and holders of Iberdrola, S.A. shares are cautioned that forward-looking information and statements are subject to various risks and uncertainties, many of which are difficult to predict and generally beyond the control of Iberdrola, S.A., that could cause actual results and developments to differ materially from those expressed in, or implied or projected by, the forward-looking information and statements. These risks and uncertainties include those discussed or identified in the public documents sent by Iberdrola, S.A. to the Comisión Nacional del Mercado de Valores. Forward-looking statements are not guarantees of future performance. They have not been reviewed by the auditors of Iberdrola, S.A. You are cautioned not to place undue reliance on the forward-looking statements, which speak only as of the date they were made. All subsequent oral or written forward-looking statements attributable to Iberdrola, S.A. or any of its members, directors, officers, employees or any persons acting on its behalf are expressly qualified in their entirety by the cautionary statement above. All forward-looking statements included herein are based on information available to Iberdrola, S.A. on the date hereof. Except as required by applicable law, Iberdrola, S.A. does not undertake any obligation to publicly update or revise any forward-looking statements, whether as a result of new information, future events or otherwise. |
 3 Key messages UK is a significant wind power market UK is a significant wind power market Attractive wind resource Attractive wind resource Traded certificate (ROC) structure Traded certificate (ROC) structure • • Provides attractive economics Provides attractive economics • • ROC scheme in place until 2027 ROC scheme in place until 2027 UK has adopted ambitious targets for renewables UK has adopted ambitious targets for renewables ScottishPower is UK’s onshore market leader with a ScottishPower is UK’s onshore market leader with a strong pipeline of future projects strong pipeline of future projects |
 4 Agenda ScottishPower ScottishPower – – UK UK Wind Wind Market overview Market overview |
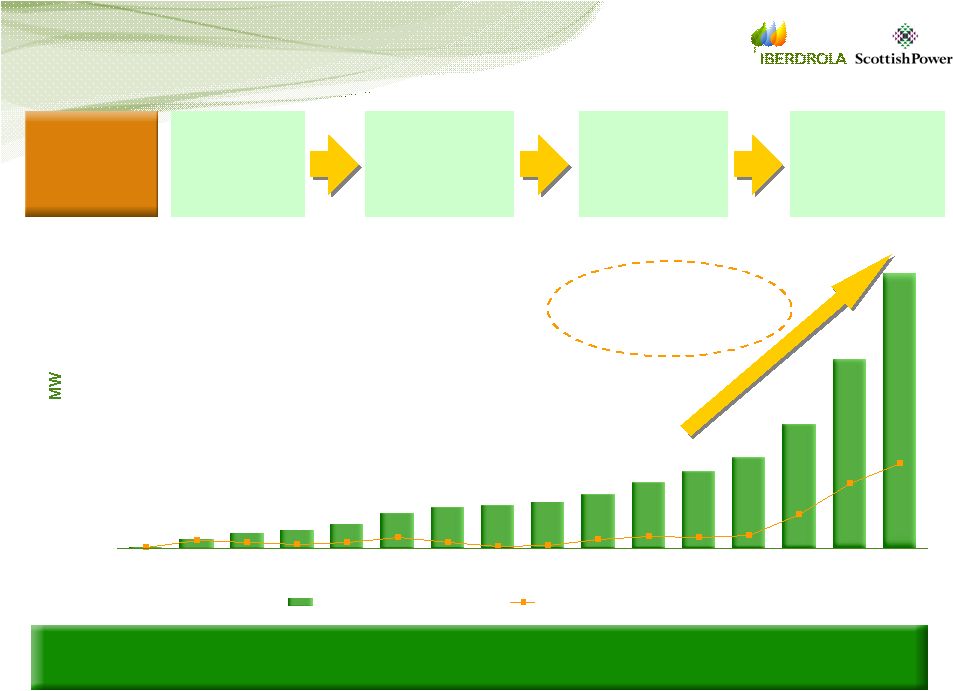 5 The UK wind market has experienced rapid growth in recent years … 1990 – First Non Fossil Fuel Obligation 2001 – Introduction of the Climate Change Levy 2002 – Introduction of the Renewables Obligation 2007 – UK becomes 7th country worldwide to install over 2GW of Wind Energy The UK Wind market has experienced strong growth since 2002 fuelled by the introduction of the Renewables Obligation framework Source: BWEA Total installed capacity Annual capacity installed Average growth 2002 -2006 37% 200 400 600 800 1,000 1,200 1,400 1,600 1,800 2,000 1991 1992 1993 1994 1995 1996 1997 1998 1999 2000 2001 2002 2003 2004 2005 2006 Regulatory support: |
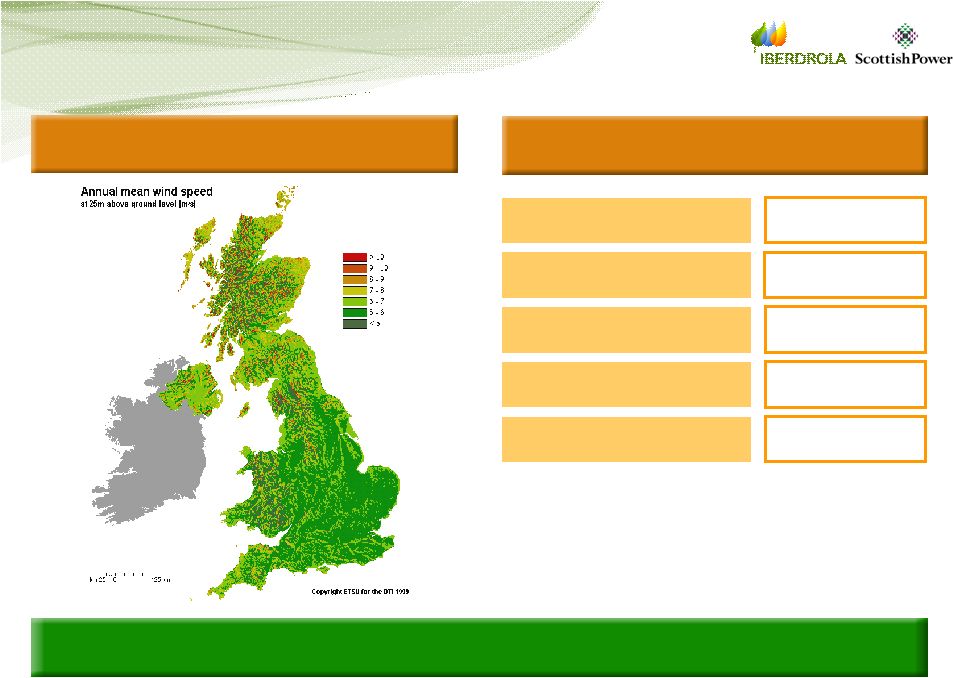 6 … becoming an attractive market for wind energy … UK wind velocity UK wind market (MW) The UK is one of the windiest regions in Europe Approved Under construction Operational 3,777 3,777 1,275 1,275 2,066 2,066 Planned 10,770 10,770 Total 17,888 Source: BWEA statistics April 2007 |
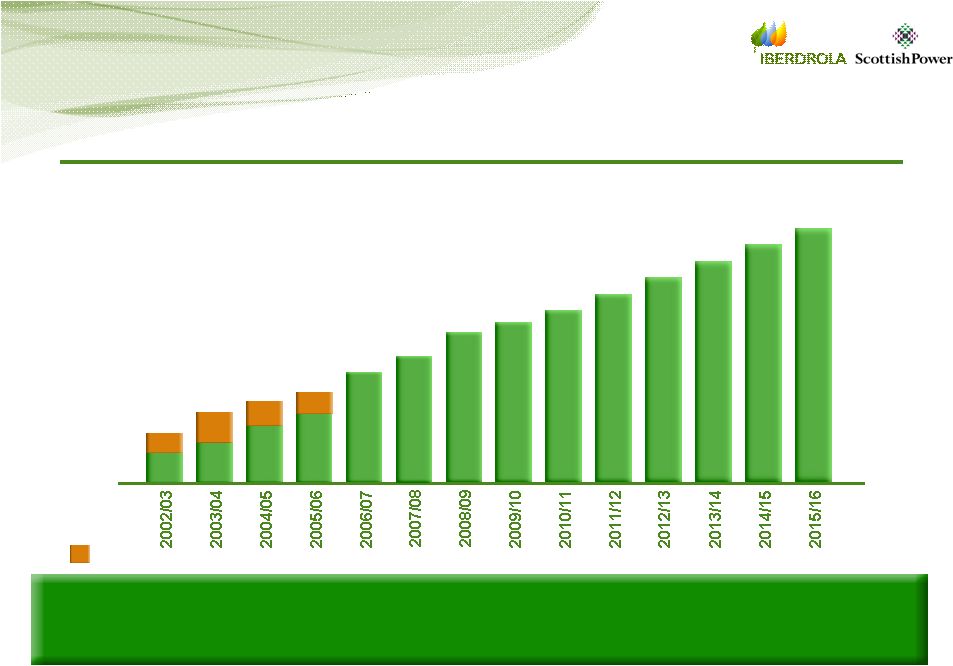 7 …with committed targets for renewables… 3.0 4.3 4.9 5.5 6.7 7.9 9.1 9.7 10.4 11.4 12.4 13.4 14.4 15.4 Compliance shortfall Compliance shortfall creates further value creates further value opportunities opportunities Source: Department of Trade and Industry By 2015 obligation to supply over 15% of electricity from renewable sources – may rise to 20% Obligatory % of supply from renewable sources Obligatory % of supply from renewable sources Shortfall |
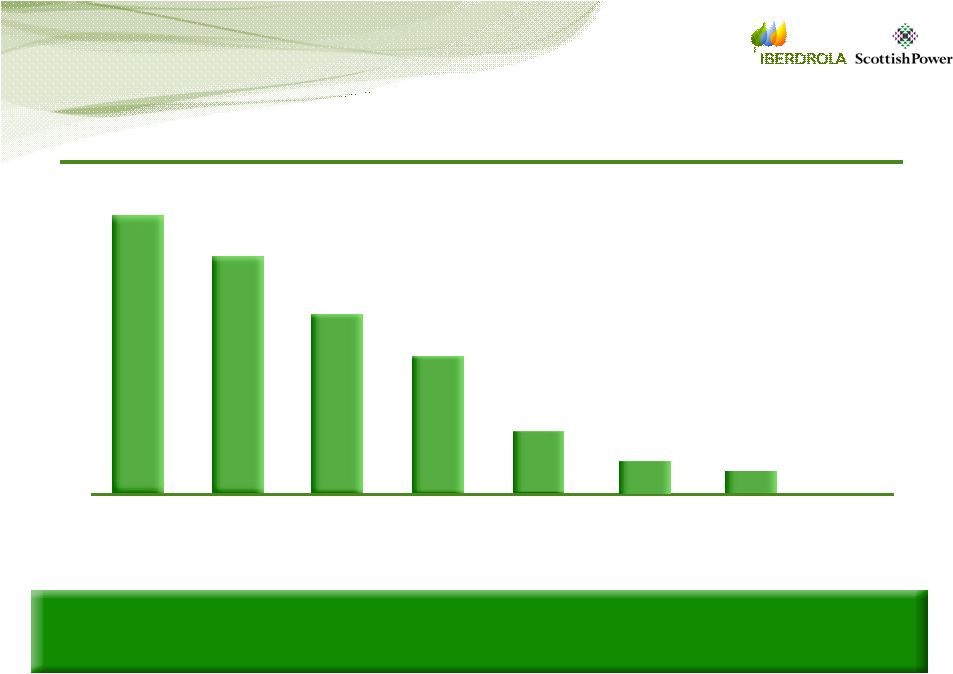  8 …which will require significant new build 2005/06 ROCs 2005/06 ROCs issued by technology issued by technology Source: OFGEM Renewables Obligation: Annual report 2005 – 2006, February 2007 16.5 GW needs to be built to meet the 2015/16 target – with onshore and offshore wind key technologies 2% 7% 19% 25% 29% Landfill gas Co-firing Onshore wind Biomass Sewage gas 0.1% Other 4% Offshore wind 14% Hydro |
 9 Facing usual market development issues Process slow although reform underway Political will varies between local authorities Successful planning knowledge and stakeholder relations is key Planning timescales Grid infrastructure Turbine supply Capacity is available to early projects Later projects face delays Some “queue” reform underway UK lacks incumbent suppliers, exposed to worldwide shortage The UK faces the same issues for wind development as most European wind energy markets |
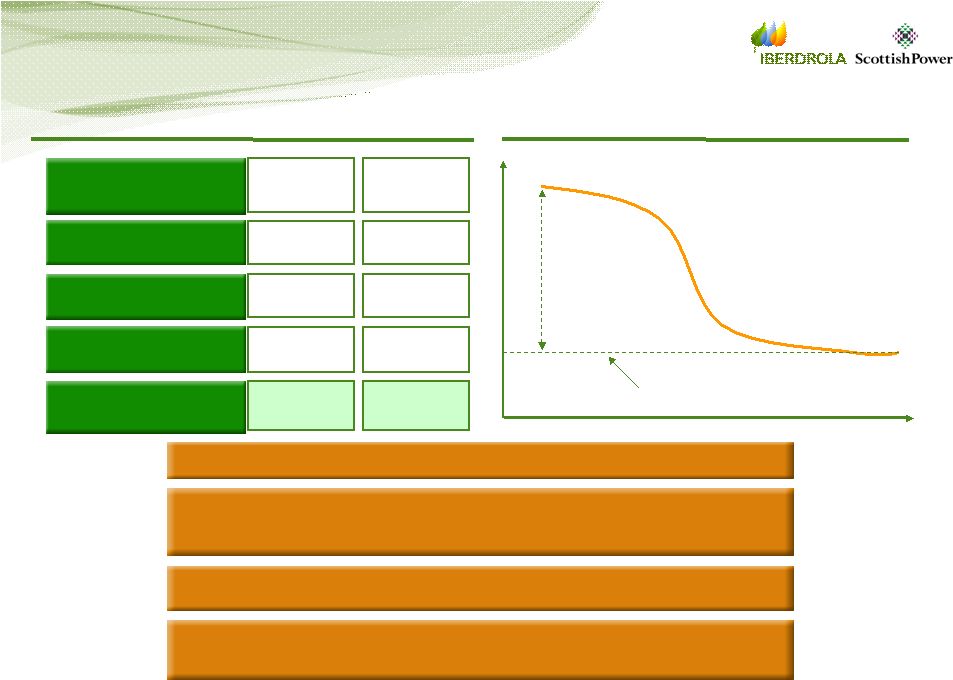 10 ROC pricing Time Buyout price Recycle Current month ahead wholesale baseload (1) Total £35.18 Buy-out price (2) Climate change levy (2) £34.30 £86.06 Recycle price (3) £12.93 Sources: (1) Heron, (2) Ofgem, (3) Implied for the purpose of this example, (4) Levy Exemption Certificates £3.65 Renewables Obligation Certificates (ROC) Illustrative revenues for UK wind per MWh Supply and demand based Projects earn ROCs = base price (buyout) plus shared element of suppliers’ non-compliance fines (recycle) Plus price of power and LECs (4) As compliance is met, recycle falls – price moves towards buyout Eur 51.91 Eur 50.61 Eur 126.98 Eur 19.08 Eur 5.39 |
 11 Agenda ScottishPower ScottishPower – – UK UK Wind Wind Market Market overview overview and dynamics and dynamics |
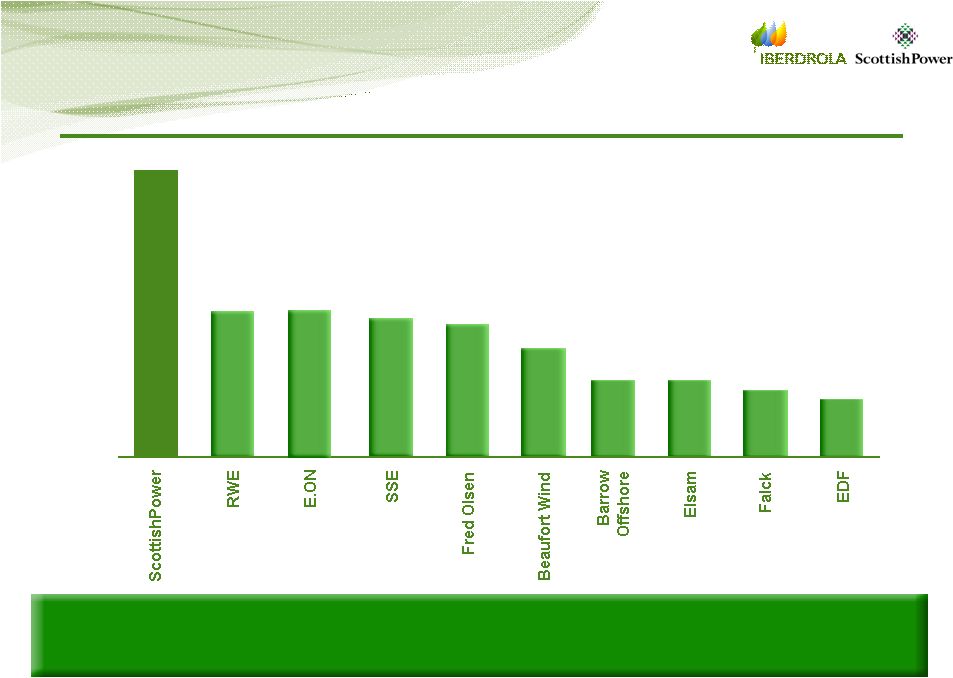 12 Market leading onshore developer … … with c.17% installed capacity in a fragmented market Note: latest available data Wind installed capacity (MW) Wind installed capacity (MW) 50 100 150 200 250 300 350 |
  13 … with minor interests maintained in offshore while policy/economics evolve Clear potential to increase offshore development UK Offshore Wind market (MW) Approved Under construction Operational 2,196 474 304 Planned 2,625 Total 5,599 • Two planned wind farms: – West of Duddon Sands – 167 MW – Shell Flats – 35 MW • 1,000 MW offshore factored into ScottishPower’s ‘Pre-Planning and Feasibility’ capacity Sizeable opportunity… … which ScottishPower is ideally placed to rapidly exploit ScottishPower’s net offshore interests Source: BWEA |
 14 ScottishPower’s UK wind farms ScottishPower wind farms are mostly located in Scotland where the best wind sites in the UK are located • Leading onshore developer • 344 MW operating capacity • 474 MW construction programme including: – Whitelee 322 MW among largest in Europe • 772 MW in planning • 3,628 MW in pre-planning and feasibility Beinn Tharsuinn Cruach Mhor Whitelee Black Law Shell Flats Dun Law & Extension Hare Hill Hagshaw Hill & Extension Coal Clough P&L CarlandCross Barnesmore Elliots Rigged Hill Beinn an Tuirc & Extension Corkey Operational Under construction or consented In planning Wether Hill Ewe Hill Harestanes Greenknowes Dersalloch Coldham Callagheen West of Duddon Arecleoch Lynemouth Wolf Bog |
 15 • Benefits from early mover in onshore wind: - site selection, high wind yields • Strength of in-house development team: - environment impact, project design, risk assessment, technology • Seen as a responsible developer: - public consultation, partnerships - relationships with key stakeholders - Queens Award for Sustainable Development - Vision in Business for Environment Scotland Award - three Green Energy Awards • Strong in-house renewables operational and trading skills ScottishPower has market leading wind capabilities … Successfully built on rapid market entry |
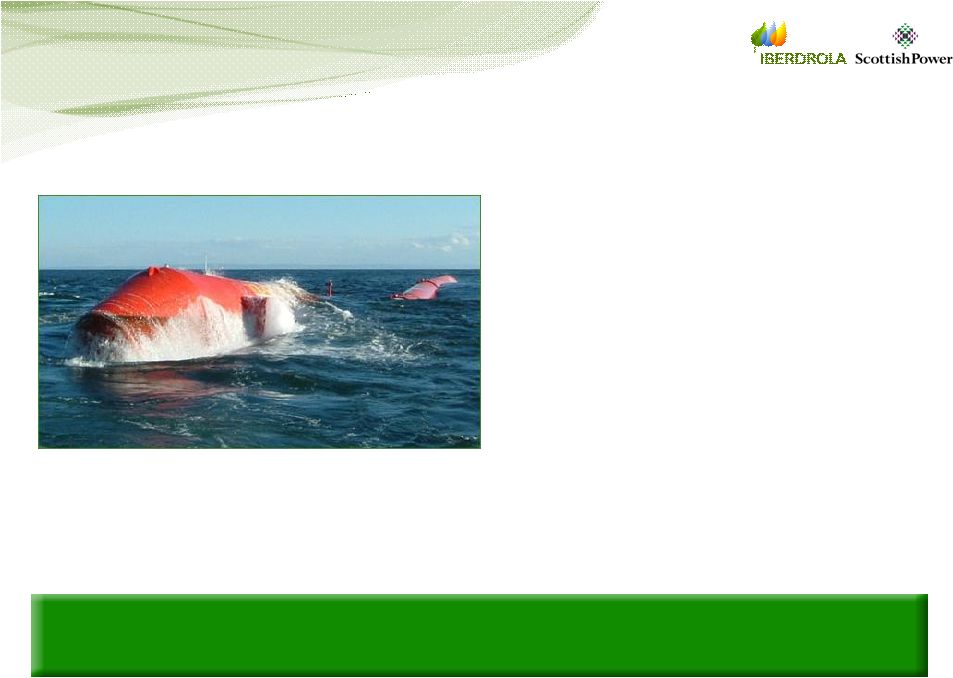 16 • Scotland well positioned to exploit wave and tidal resources • Wave power demonstration project to be established (3 MW) • OPD Pelamis technology • Accelerate commercialisation • Strong support from Scottish Executive … as well as developing marine renewables strength Growth potential over a wide range of renewable technologies |
 17 UK wind: key economic drivers High load factors 2,300 – 2,800 hrs on average Attractive economic incentives Stable regulatory framework Potential returns in the UK are more attractive than those available in several other wind markets in Europe Opex 40 – 50 £/kW per annum Capex 1,000 – 1,200 £/kW |
 18 ScottishPower • Currently #1 onshore operator • Strong development pipeline • High quality sites • Options in offshore, marine • Long term and stable regulatory framework (until 2027) • Increasing ROC demand Market environment • 15% of generation to be sourced from renewable sources by 2015 • Attractive economic incentives Conclusions Government commitment |
 19 Agenda Appendix Appendix |
 20 Detailed UK wind farm overview Name Installed capacity (MW) Operational Barnesmore 15 1997 Beinn an Tuirc 30 2002 Black Law I 97 2005 Callagheen 17 2006 Carland Cross (45% owned) 3 1992 Coal Clough (45% owned) 4 1992 Operational 344 Coldham 16 2005 Corkey 5 1994 Cruach Mhor 30 2004 Dun Law 17 2000 Elliots Hill 5 1995 Hagshaw Hill 16 1995 Hare Hill 13 2000 P&L (50% owned) 15 1992 Rigged Hill 5 1994 Black Law II 27 2006 Beinn Tharsuinn 29 2006 Source: As at April 2007. (1) Average load factor Load Factor 33% 35% 30% 32% 28% 26% 29% 37% 22% 26% 37% 30% 41% 24% 37% 25% 29% 30%¹ |
 21 Detailed UK wind farm overview (2) Name Installed capacity (MW) Operational Beinn an Tuirc 2 38 Post 2010 Greenknowes 30 2008 Hagshaw Hill Extension 26 2008 Dun Law Extension 30 2008 Wether Hill 18 2007 Whitelee 322 2008 Arecleoch 180 2009 Black Law Phase 3 18 2009 Dersalloch 78 2010 Ewe Hill 51 2010 Harestanes 213 2010 Lynemouth 30 2010 Under construction / consented 474 (818 incl. operational) Total (Operational and Pipeline) Pre-Planning and Feasibility In Planning 772 Load Factor 32% 32% 32% 27% 34% 29% 27% 27% 31% 28% 28% 28% Wolf Bog 10 2008 35% 3,628 5,218 West of Duddon Sands Offshore 167 2013 40% Shell Flats Offshore 35 2012 40% 31%¹ 30%¹ Source: As at April 2007. (1) Average load factor Onshore 2,628 / offshore 1,000 |
 22 End of Technical End of Technical Session III Session III ScottishPower ScottishPower UK Wind generation UK Wind generation |
 Technical Session IV Technical Session IV ScottishPower ScottishPower UK Regulated businesses: UK Regulated businesses: Transmission & Transmission & Distribution Distribution Exhibit 99.9 |
 2 Legal Note IMPORTANT INFORMATION This communication does not constitute an offer to purchase, sell or exchange or the solicitation of an offer to purchase, sell or exchange any securities. The shares of Iberdrola, S.A. may not be offered or sold in the United States of America except pursuant to an effective registration statement under the Securities Act or pursuant to a valid exemption from registration. FORWARD-LOOKING STATEMENTS This communication contains forward-looking information and statements about Iberdrola, S.A. and otherwise, including financial projections and estimates and their underlying assumptions, statements regarding plans, objectives and expectations with respect to future operations, capital expenditures, synergies, products and services, and statements regarding future performance. Forward-looking statements are statements that are not historical facts and are generally identified by the words “expects,” “anticipates,” “believes,” “intends,” “estimates” and similar expressions. Although Iberdrola, S.A. believes that the expectations reflected in such forward-looking statements are reasonable, investors and holders of Iberdrola, S.A. shares are cautioned that forward-looking information and statements are subject to various risks and uncertainties, many of which are difficult to predict and generally beyond the control of Iberdrola, S.A., that could cause actual results and developments to differ materially from those expressed in, or implied or projected by, the forward-looking information and statements. These risks and uncertainties include those discussed or identified in the public documents sent by Iberdrola, S.A. to the Comisión Nacional del Mercado de Valores. Forward-looking statements are not guarantees of future performance. They have not been reviewed by the auditors of Iberdrola, S.A. You are cautioned not to place undue reliance on the forward-looking statements, which speak only as of the date they were made. All subsequent oral or written forward-looking statements attributable to Iberdrola, S.A. or any of its members, directors, officers, employees or any persons acting on its behalf are expressly qualified in their entirety by the cautionary statement above. All forward-looking statements included herein are based on information available to Iberdrola, S.A. on the date hereof. Except as required by applicable law, Iberdrola, S.A. does not undertake any obligation to publicly update or revise any forward-looking statements, whether as a result of new information, future events or otherwise. |
 3 Key messages Value creation based on regulatory out-performance of Value creation based on regulatory out-performance of allowances and incentive targets allowances and incentive targets Attractive, increasingly incentive based, RPI-X regulatory Attractive, increasingly incentive based, RPI-X regulatory framework framework Clear value creation potential for distribution (opex) and Clear value creation potential for distribution (opex) and transmission (capex) transmission (capex) Attractive asset mix Attractive asset mix • • English and Scottish Distribution English and Scottish Distribution • • Scottish Transmission Scottish Transmission |
 4 Market overview Market overview Agenda ScottishPower – ScottishPower – T&D T&D a. a. General General b. b. Transmission Transmission c. c. Distribution Distribution |
 5 Ofgem regulates the UK electricity and gas markets … Regulation based on price cap (RPI-X) methodology Ofgem is the regulator of the Gas and Electricity Markets Authority. Northern Ireland’s Regulator is Ofreg Cost of transmission and distribution: 25-30% of average domestic electricity bill Ofgem protects consumers by promoting competition and ensuring effective regulation of “wires and gas pipes” Regulation of the “wires” businesses has lead to cost reductions and has been successful |
 6 … through a price-setting mechanism … Current distribution price control mechanism (2005-2010) will be in place until 2010 and transmission until 2012 Five year price control period Operator base revenue allowances linked to revenue driver – equally weighted function of units distributed and number of customers Regulatory revenue also linked to incentive mechanisms, for example relating to Losses and Quality of Service Pass-through for costs of business rates on network assets, licence fees, transmission charges and other specified non-controllable costs Correction mechanism adjusts price control for previous over/under recovery of revenue |
  7 Source: Ofgem … that allows generation of minimum returns In the UK the price setting mechanism allows T&D companies to earn regulated target returns on their investment Electricity distribution Electricity transmission (Scotland, England & Wales) Gas distribution Gas transmission Water and sewerage 4.80% 4.40% 4.38% 4.40% 5.10% 2008 WACC real post tax Business activity |
 8 Although revenue requirement is fixed by Ofgem, the return can be improved by beating opex and capex / depreciation allowances REGULATION Eur 500 MM Eur 208 MM Eur 150 MM Eur 138 MM 6.9% This is fixed subject to incentives Beat the opex target Beat the capex target Increased realised return Allowed revenue Allowed opex Allowed capex / dep Allowed return (pre tax) RAB Eur 2,000 MM Example (5 year) Price-setting mechanism – example |
 9 Agenda Market overview Market overview ScottishPower – ScottishPower – T&D T&D a. a. General General b. b. Transmission Transmission c. c. Distribution Distribution |
 10 • In England and Wales, National Grid (“NG”) is the owner of the single transmission network (excluding 132kV network) • In Scotland, ScottishPower and Scottish and Southern Energy own two separate transmission networks, and are responsible for planning, constructing and maintaining the network (including 132kV network) • NG is the system operator for the whole GB region (under BETTA) • NG’s subsidiary, Elexon, manages the governance and settlement of trading arrangements UK transmission network split between National Grid, Scottish & Southern and ScottishPower … UK geographic coverage Description SSE SPW NG Source: Ofgem, company web sites and annual reports ScottishPower is one of three transmission network owners in the UK |
 11 … dominated in scale by National Grid … with ScottishPower comprising 12% total UK RAB Source: Ofgem Note: (1) 2004/05 prices. 5-year allowances are 2007/08 to 2011/12 inclusive Revenue allowance Opex allowance Capex allowance Total circuit length (km) 5 year (cumulative) price control elements (1) SPW NG SSE 4,028km 14,664km 4,938km Number of substations 119 445 89 System maximum demand (MW) 4,300 56,700 1,700 Regulated asset base (2006/7) £764MM £5,416MM £288MM % total regulated asset base 12% 84% 4% £780MM £5,465MM £250MM £143MM £1,289MM £46MM £608MM £2,997MM £181MM |
 12 The Transmission Price Control Review (TPCR) is reviewed every 5 years … Total opex allowance • Eur 3.3bn over next 5 years • Assumes further efficiency improvements of 3% per annum Expect increasing investment and thus rising transmission charges continuing beyond 2012 Total capex allowance • Eur 6.9bn (in 2004/5 prices) over next 5 years • Eur 8.0bn including renewable generation under TIRG (up 170% for electricity transmission companies) Total revenue allowance • 2007/8 - Eur 2,501 MM; 2011/12 - Eur 2,646 MM • Initial rise of 7.8% against 2006/07 and then 2% above retail price index (RPI) for each year thereafter Final outcome occurred during Iberdrola’s offer for ScottishPower with favourable impact Source: Ofgem |
 13 … and provides scheduling, balancing as well as some other mandatory and commercial services • Generators schedule plants • Generators inform NG of expected levels • NG balances one hour prior to start by: – trading in the forward market when generation insufficient or excessive – accepting bids and offers from generators and consumers – using ancillary services contracts, negotiated in advance • NG recovers cost through the Balancing Services Use of System charge (BSUOS) – based on costs incurred per half hour – pro-rated by generation and consumption volumes during that period Real time Balancing Services Ancillary services • Mandatory services – Reactive power – Frequency response • Black start and Fast start • Commercial services – Maximum Generation Service – Enhanced Reactive Service – Commercial Frequency Response – Fast Reserve – Standing Reserve – Warming – Emergency Assistance • Other services NG provides real time balancing services and ancillary services apart from being the largest transmission network owner in the UK |
 14 Interconnection • Main transmission flows are north to south • Interconnection with Scotland limited at c.2,200 MW – key for further renewables development in Scotland – upgrade of interconnector to 2,800 MW by 2010 underway – funding for increase to 3,200 MW by 2012 agreed with Ofgem • 2002: new 500 MW interconnector between Scotland and Northern Ireland was commissioned 10.3 / 0.8 TWh 1,988 MW 1,988 MW -1.6 TWh 120 MW 330 MW Interconnectors (2004) Import Capacity Export Capacity Imports/Exports (net) Maximum import 2,330 MW Maximum export 2,120 MW UK geographic coverage Description Further plans for interconnection with the Netherlands and Norway of c.800 MW each Source: CERA 1,000 MW 7.0 TWh 500 MW 80 MW 3.0 TWh 2,200 MW 0.6 TWh 0.0 TWh |
 15 Agenda Market overview Market overview ScottishPower – ScottishPower – T&D T&D a. a. General General b. b. Transmission Transmission c. c. Distribution Distribution |
 16 Introduction – Distribution At privatisation, the UK was separated into 14 regions (12 in England/ Wales and 2 in Scotland) After consolidation, 7 groups of Distribution Network Operators (DNOs) remain Networks are ‘passively managed’ with balancing done by National Grid (NG) |
         17 After privatisation and consolidation seven groups of distribution companies remain … Eastern Midlands Southern Electric Norweb Manweb Scottish Power Northern SWALEC SWEB Seeboard Yorkshire East Midlands Scottish Hydro Pre-privatisation London Privatisation introduced some consolidation, but also introduced foreign ownership of distribution (E.ON, EDF, MA and PPL) in the UK Eastern (EDF) Southern Electric (SSE) United Utilities Manweb (SPW) Scottish Power (SPW) Northern (MidAmerican) SWALEC (PPL) SWEB (PPL) South East (EDF) Yorkshire (MidAmerican) East Midlands (E.ON) Scottish Hydro (SSE) Midlands (E.ON) London (EDF) Post-privatisation |
 18 … each representing in excess of 8% of the network ScottishPower is the third largest distributor measured by regulated asset base Source: Ofgem Note: (1) 2004/5. RAB figures are in 2002/3 prices 8% 21% 17% 16% 16% 12% 10% EDF SSE SPW E.ON MidAmerican PPL United Utilities 9% 12% 12% 28% 8% EDF SSE SPW PPL United Utilities 17% E.ON 13% MidAmerican Regulated asset base (£ MM) and % of total (1) Points of supply (MM) and % of total 2,689 1,913 2,078 1,401 1,969 1,269 920 7.6 3.4 4.7 3.3 3.7 2.5 2.3 |
 19 The Distribution Price Control Review (DPCR) sets allowed revenue, opex and capex for a 5 yr period Set by regulator based on the upper quartile of proposals submitted by each company Source: Electricity Distribution Price Control Review: Final Proposals Office of Gas and Electricity Markets (November 2004) Allowed revenue Allowed controllable opex 2005 - 2010 Eur 4,601 MM Eur 1,138 MM Reducing 1.5% pa Allowed capex Eur 8,601 MM Allowed return 6.9% pre tax real (4.8% post tax real) Agreed subject to changes in incentives Beat the opex target Beat the capex target … leads to improved realised return |
 20 Agenda Market overview Market overview ScottishPower – ScottishPower – T&D T&D a. a. General General b. b. Transmission Transmission c. c. Distribution Distribution |
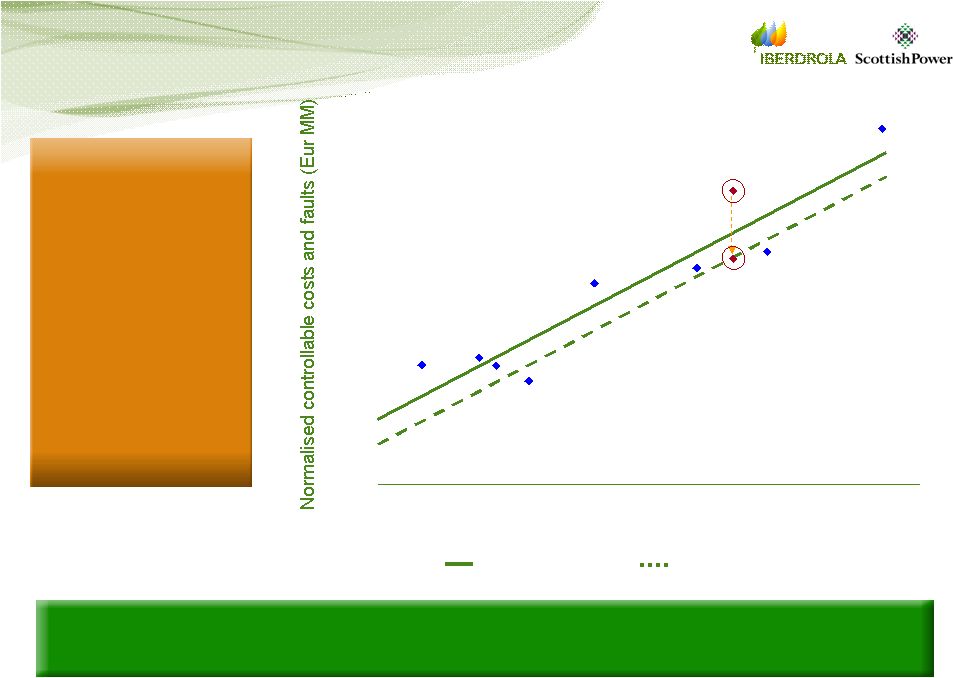 21 Different players have varying degrees of success … Source: Ofgem, Distribution Price Control Review, Final Proposals EDF LPN & EPN 210 180 150 120 90 60 15 20 25 30 35 40 50 EDF-SPN UU CN-West CN-East WPD CE Electric SPW (current) SSE SPW (potential) Based on Ofgem’s cost efficiency analysis ScottishPower is less efficient than a number of its peers taking size, network length, customers, etc into consideration Regression line Upper quartile Composite scale variable (network length, customer numbers, units distributed, etc) Relative to peers ScottishPower has significant scope for cost reduction which leaves room for higher returns |
 22 Eur 733MM … with ScottishPower offering cost improvements Revenue Opex (1) Allowed Capex Return Annual average for 5 years Eur 208MM Eur 286MM Continuous drive for capital efficiencies Note: (1) Opex includes allocation of corporate costs Room for improvement in network performance Levers to deliver improvement • Mobile information technology • Satellite navigation • Network control centre at Kirkintilloch • Innovative design • Smart procurement Improved operating practices 6.9% • Programme of network automation Striving for improved performance Ongoing dialogue with Ofgem to ensure allowed returns encourage continued investment in the networks |
 23 Conclusions • 112,000 system km and around 40,000 GWh distributed per year (growing historically at ca 1%) • Further growth driven by high levels of renewables development • Established expertise in asset ownership, regulatory management and operational service provision Attractive mix of transmission and distribution assets • Proven track record major project delivery (e.g. interconnector upgrade) • Strong Transmission and Distribution design teams with ability maximise investment value • Dedicated operational training centres focussed on training and underlining safety across the business • Ranked by the Ofgem’s Asset Management Survey as top quartile • Well defined Asset Risk Assessment process recognised by regulatory consultants • Leading player in Ofgem Innovation initiative • Process underway to achieve PASS 55 accreditation Strong asset management processes Highly skilled engineering and frontline workforce |
 24 Agenda Appendix Appendix |
 25 UK electricity distributors: key figures ScottishPower is the third largest distributor measured by regulated asset base Revenue allowance Opex allowance (2) Capex allowance (2) Network length (‘000km) 5 year (cumulative) price control elements (1) EDF SSE SPW 172 129 122 Points of supply (MM) 7.6 4.7 3.4 % total points of supply 28% 17% 12% Units distributed (GWh) 84.5 56.2 41.3 Minutes lost per cust. 67 min 92 min 76 min Reg. asset base (04/05) £2,689MM £1,913MM £2,078MM % total asset base 21% 16% 17% £3,488MM £2,466MM £2,562MM £1,642MM £1,154MM £1,239MM £1,789MM £1,101MM £858MM E.ON 91 3.7 13% 41.3 69 min £1,401MM 12% £1,826MM £898MM £724MM MA 113 3.3 12% 39.1 68 min £1,969MM 16% £2,352MM £991MM £859MM PPL 82 2.5 9% 28.0 56 min £1,269MM 10% £1,644MM £817MM £537MM UU 59 2.3 8% 25.4 57 min £920MM 8% £1,149MM £526MM £513MM Source: Ofgem 1. 2002/03 prices. 5-year allowances are 2005/06 to 2009/10 inclusive 2. Capex excludes entire pension cost allowance; Opex includes entire pension cost allowance, tax and incentives |
 End of Technical End of Technical Session IV Session IV ScottishPower ScottishPower UK Regulated businesses: UK Regulated businesses: Transmission & Transmission & Distribution Distribution |
 Technical Session V Technical Session V ScottishPower ScottishPower North-American businesses: North-American businesses: PPM PPM Exhibit 99.10 |
 2 Legal Note IMPORTANT INFORMATION This communication does not constitute an offer to purchase, sell or exchange or the solicitation of an offer to purchase, sell or exchange any securities. The shares of Iberdrola, S.A. may not be offered or sold in the United States of America except pursuant to an effective registration statement under the Securities Act or pursuant to a valid exemption from registration. FORWARD-LOOKING STATEMENTS This communication contains forward-looking information and statements about Iberdrola, S.A. and otherwise, including financial projections and estimates and their underlying assumptions, statements regarding plans, objectives and expectations with respect to future operations, capital expenditures, synergies, products and services, and statements regarding future performance. Forward-looking statements are statements that are not historical facts and are generally identified by the words “expects,” “anticipates,” “believes,” “intends,” “estimates” and similar expressions. Although Iberdrola, S.A. believes that the expectations reflected in such forward-looking statements are reasonable, investors and holders of Iberdrola, S.A. shares are cautioned that forward-looking information and statements are subject to various risks and uncertainties, many of which are difficult to predict and generally beyond the control of Iberdrola, S.A., that could cause actual results and developments to differ materially from those expressed in, or implied or projected by, the forward-looking information and statements. These risks and uncertainties include those discussed or identified in the public documents sent by Iberdrola, S.A. to the Comisión Nacional del Mercado de Valores. Forward-looking statements are not guarantees of future performance. They have not been reviewed by the auditors of Iberdrola, S.A. You are cautioned not to place undue reliance on the forward-looking statements, which speak only as of the date they were made. All subsequent oral or written forward-looking statements attributable to Iberdrola, S.A. or any of its members, directors, officers, employees or any persons acting on its behalf are expressly qualified in their entirety by the cautionary statement above. All forward-looking statements included herein are based on information available to Iberdrola, S.A. on the date hereof. Except as required by applicable law, Iberdrola, S.A. does not undertake any obligation to publicly update or revise any forward-looking statements, whether as a result of new information, future events or otherwise. |
 3 PPM is a world class renewables player with substantial gas storage assets PPM structure Wind Thermal Enstor Energy Management Owned gas storage 1.4 bcm 538 MW (1) Contracted wind 606 MW Owned wind 1,060 MW Marketing alliances and transport contracts Contracted gas storage 1.3 bcm Optimise PPM assets and contracts Shared Support Services Note: (1) Reflects 47% ownership of Klamath (506 MW total) |
   4 75% of new investments in wind energy Eur MM FY03 Energy Management FY04 FY05 FY06 Thermal Enstor Wind Eur MM • Wind, gas storage and energy management has grown significantly since 2003 • Thermal assets are providing a strong, stable base of profits • PPM had invested Eur 1.35bn by 2006 Note: (1) Financials are based on the exchange rate of USD 1 : Eur 0.75; (2) Wind includes pre-tax value of production tax credits Equivalent EBIT (1) Cumulative capex (1) EBIT historically driven by growth in gas storage, however future investment focused on wind 34 53 143 89 Thermal Enstor Wind (2) FY03 FY04 FY05 FY06 435 600 698 1,350 Growth A&G, other |
 5 Agenda US wind US wind US energy management US energy management US gas storage US gas storage US thermal US thermal |
 6 US Wind power installed capacity started to grow significantly around 2000 Source: US Department of Energy, AWEA 2,000 4,000 6,000 8,000 10,000 12,000 14,000 1,525 1990 1,575 1991 1,584 1992 1,617 1993 1,656 1994 1,697 1995 1,698 1996 1,706 1997 1,848 1998 2,511 1999 2,578 2000 4,275 2001 4,686 2002 6,353 2003 6,725 2004 9,149 2005 11,603 2006 MW CAGR 2000-2006: 28% |
 7 Key market drivers are positive in the US • Higher and more volatile fuel prices for competing generation • Federal and state policies • Economic development • Green power • Energy security • Siting and permitting: avian, noise, visual, federal land • Transmission: FERC rules, access, RTO formation, new lines • Operational impacts: intermittency, ancillary services, allocation of costs Drivers for wind power Key issues for wind power US wind remains a very attractive market as a result of increased cost competitiveness and a positive regulatory framework |
 8 Very strong regulatory support for wind energy • State level policy mandating the state to generate a percentage of its electricity from renewable sources • The exact details of the policy varies depending on state. Basic structure involves giving renewable energy source targets to suppliers, with fines imposed in some cases if targets are not met Renewables Portfolio Standard (RPS) • An income tax credit is allowed for the production of electricity from qualified wind energy facilities and other sources of renewable energy • Eur 15/MWh for 10 years; indexed to inflation; locked-in at plant completion • Current legislation expires 31/12/08 Production Tax Credit Extension • Allows investment to be depreciated over five years • 20-25% of project value • Available continuously since 1987 Modified Accelerated Cost Recovery System (MACRS) |
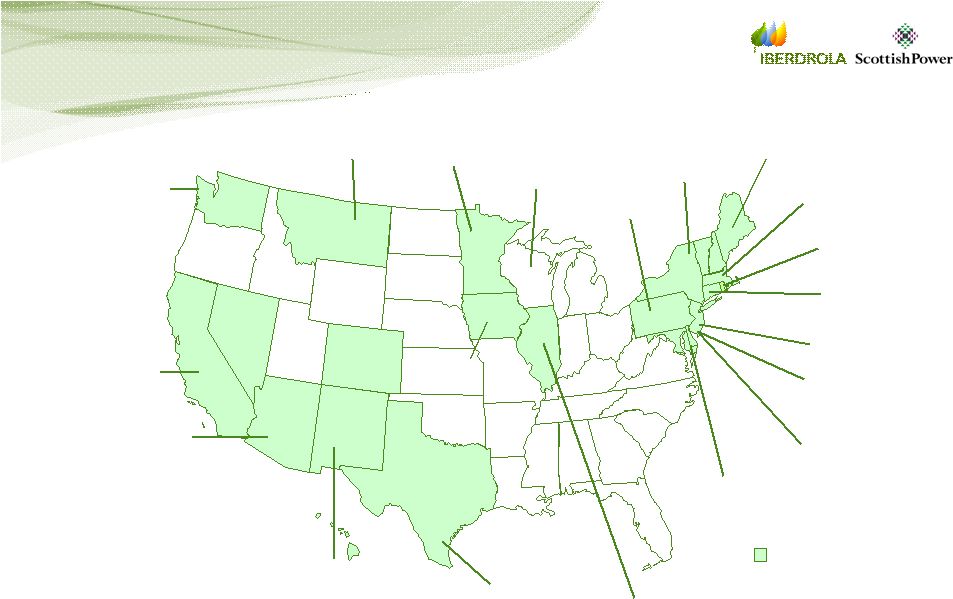 9 Renewable Portfolio Standards are set by most states States with RPS Minnesota 15% by 2015 Hawaii 20% by 2020 Texas 5,880 MW by 2015 New Mexico 10% by 2011 Arizona 15% by 2025 Nevada 20% by 2015 California 20% by 2017 Montana 15% by 2015 Iowa 105 MW Wisconsin 10% by 2011 Pennsylvania 8% by 2020 Illinois Voluntary 8% by 2013 Maryland 7.5% by 2019 Delaware 10% by 2019 D.C. 11% by 2022 New Jersey 20% by 2020 Connecticut 7% by 2010 Rhode Island 16% by 2020 New York 24% by 2013 Maine 30% by 2000 Massachusetts 4% by 2009 Washington 15% by 2020 Colorado 20% by 2020 |
 10 US wind price setting mechanism is backed by the PTC system and MACRS After-tax value of wind generation = • Output typically contracted at Eur 38 – Eur 45 / MWh • The Production Tax Credit (“PTC”) is a per kilowatt-hour tax credit for wind-generated electricity • Current PTC of Eur 15 / MWh • Available during the first 10 years of operation and locked-in at construction date, and adjusted annually for inflation • Current legislation expires on 31 Dec 2008 Contracted price PTC + Government support is expected to continue to be reflected in a PTC or PTC-like mechanism and MACRS benefit MACRS + • Depreciating asset over five years creates substantial economic value |
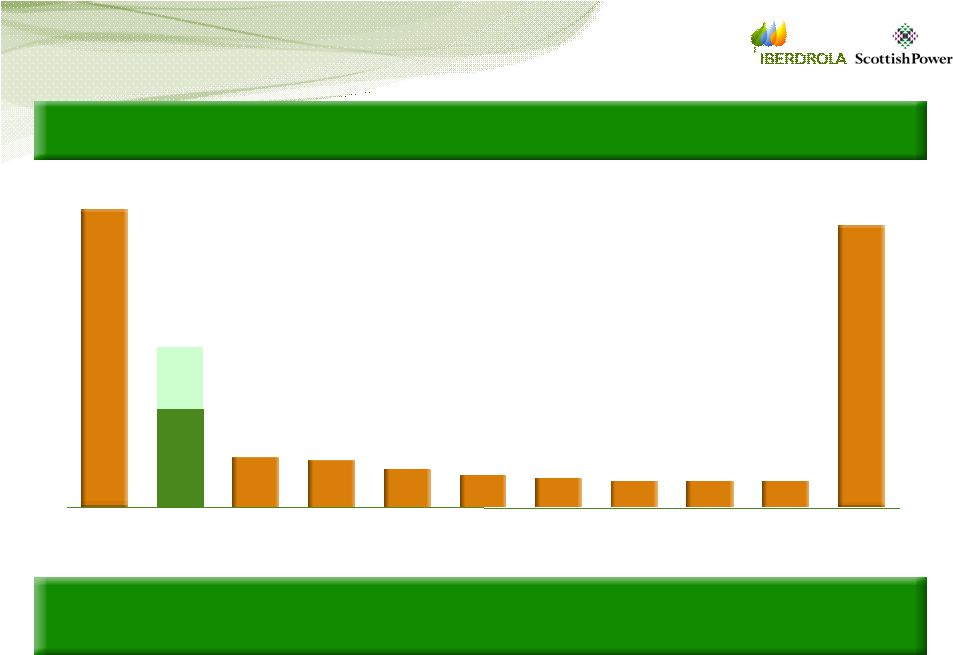 11 Ten key players account for three quarters of the activity (1) As at 31 December 2006 (2) Adjusted for 606 MW of contracted capacity provided to PPM by FPL Source: AWEA PPM has grown rapidly to be the second largest wind farm developer in the US 29% (2) 14% (2) 5% 5% 4% 3% 3% 3% 3% 3% 27% FPL PPM Energy Mid American Babcock & Brown Horizon Puget Sound Energy Caithness Shell AEP enXco Other contracted owned % installed capacity (1) |
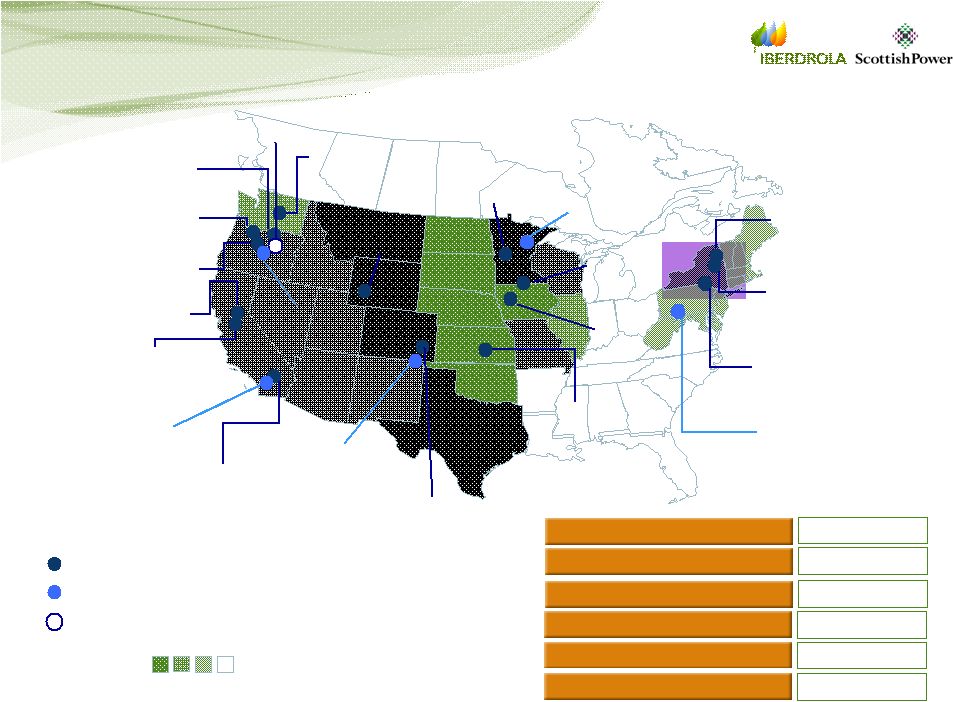                              12 PPM has a unique pan-US platform … 2007 approved / construction 526 MW 2010 goal 3,500 MW Operating assets - owned 1,060 MW Windiest region Least windy region Build to Sell (BTS) 101 MW Operating assets - PPA 606 MW Operating wind projects Wind projects approved/under construction Build to Sell (BTS) Operating assets - total 1,666 MW CO Green Windfarm 81 MW Owned (162 MW Project) West Region Mid-Continent Region MV III & Phoenix 24 MW Owned Shiloh 150 MW Owned High Winds 162 MW PPA Klondike II 75 MW Owned Klondike III 221 MW Owned Klondike 24 MW Owned Stateline 300 MW PPA Big Horn 200 MW Owned SW Wyoming 144 MW PPA Twin Buttes 75 MW Owned Elk River 150 MW Owned Flying Cloud 44 MW Owned Trimont 100 MW Owned MinnDakota 150 MW Owned Moraine 51 MW Owned Maple Ridge II 45.4 MW Owned (91 MW Project) Maple Ridge Ia 16.5 MW Owned (33 MW Project) Maple Ridge I 99 MW Owned (198 MW Project) Leaning Juniper 101 MW BTS Northeast Region Casselman 35 MW Owned Dillon 45 MW Owned (pending final approvals) |
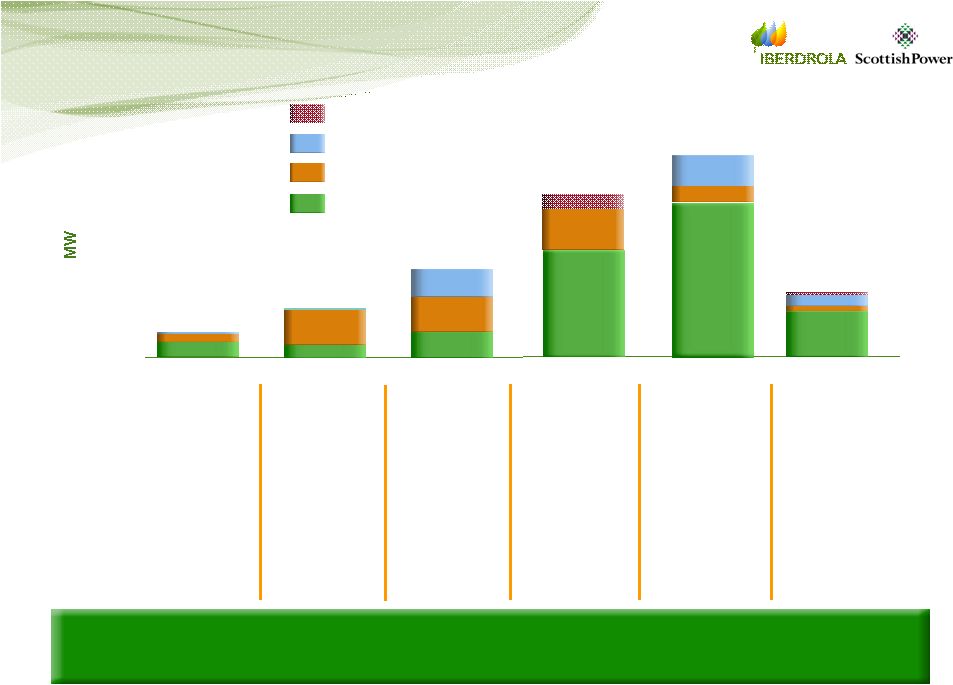   13 … and an impressive wind pipeline Probability of completion: PPM’s criteria for Tier: 0 500 1000 1500 2000 2500 3000 3500 4000 4500 Canada East Midwest West Under Const 100% • Board approvals received • Constructio n underway PPM controls a significant 11,200 MW pipeline Holding 0-10% • Projects that currently have transmission, land, permitting or marketing concerns or are awaiting verification of wind resource Tier IV 10-15% • Opportunity under assessment, some with initial land control Tier III 25% • Full land control • 1 yr wind data Tier II 50% • Proven CF • Permitting and TX plan • >50% probability of 2-300bps > WACC Tier I 80% • PPA sale, marketing plan, and/or permits • High probability of 2-300bps > WACC |
  14 US wind: key economic drivers Attractive load factor range: 2,600 – 3,500 hrs Capex before synergies: 1,500 - 1,700 $/kW PPM’s wind business is a leading US developer and operator O&M before synergies: 25 $/kW pa Attractive all-in tariff Strong government support through Renewable Portfolio Standards (49GW in newbuild by 2015) Pipeline: volume and delivery |
 15 Agenda US wind US wind US energy management US energy management US gas storage US gas storage US thermal US thermal |
 16 US gas storage key messages Attractive fundamentals in gas storage Attractive fundamentals in gas storage PPM has demonstrated track record PPM has demonstrated track record Well positioned for continued strong growth and premium Well positioned for continued strong growth and premium returns returns |
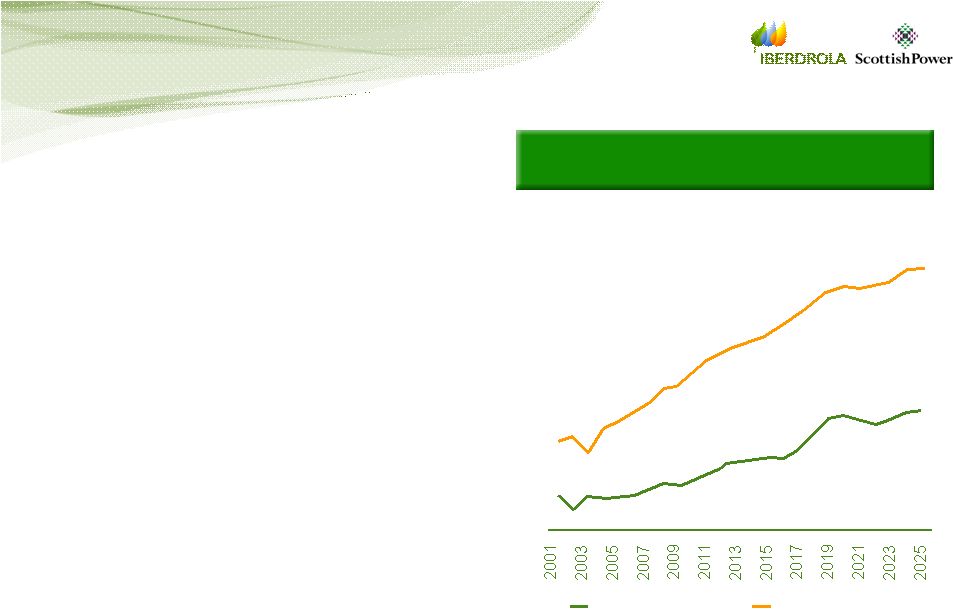 17 Supply shortfall driving sustained high gas prices and volatility • Continued demand growth • Supply lags demand, with growing imbalance • Shortfall met by Canadian imports and LNG • Increasing long-haul gas, with potential geopolitical risks, drives high gas prices and volatility EIA US supply / demand forecast Total US demand Domestic production 18 20 22 24 26 28 30 32 tcf |
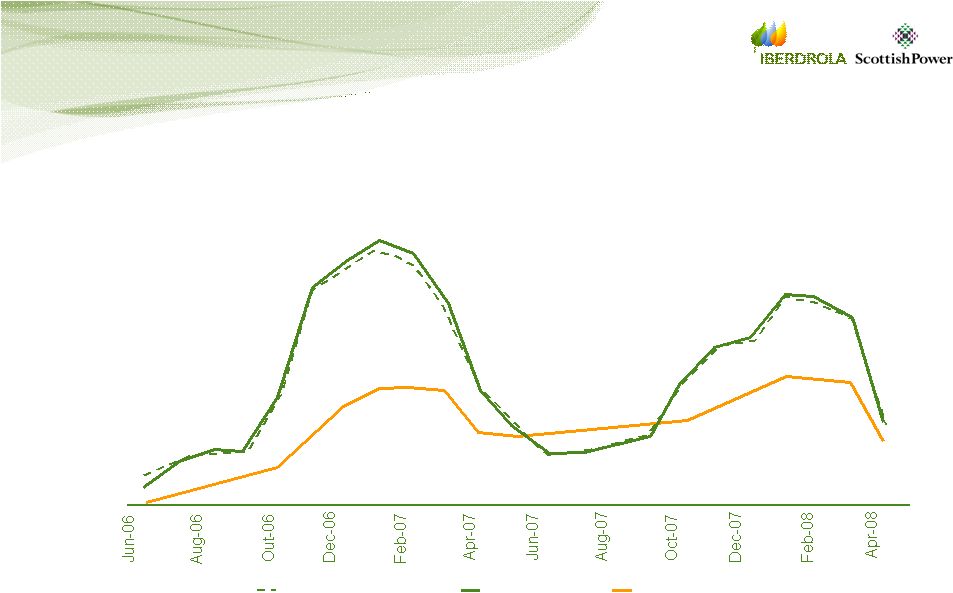 18 Potential for increased summer/winter spread NYMEX Zeebrugge 4.5 6.0 7.5 9.0 10.5 12.0 13.5 NBP 15.0 Eur |
 19 North American Gas Storage has significant barriers to entry People and pipeline are key Business model • Traditional business model offers limited earnings growth Construction • Limited storage construction management expertise Site availability • Scarcity of high-quality development sites Permitting • Patchwork regulatory structure (FERC, regional, state-level in US) Technical requirements • Limited pool of qualified geologists, engineers, etc Development cycle • Long-term development cycle requires stable funding source |
 20 PPM pursues innovative business model Business model • Asset based service company • Key trading locations • Offer simple, quality services Business advantages • Minimal credit risk • Minimal working capital • Service based business LDCs Marketers Pipelines End Users Producers Gas Storage Hub Enstor Services • Firm storage • Parking and loaning |
 21 PPM has grown by 0.3 bcm p.a. 2001 2002 2003 2004 2005 2006 2007 2008 Enstor Development Acquired Acquisition of initial share of Alberta Hub Acquisition of Katy Hub Acquisition of additional share of Alberta Hub Construction of Waha started Acquisition of Grama Ridge Construction of Houston Hub target start Waha Phase I target completion Furthermore, there is 0.9 bcm ongoing development and construction at Waha (0.3 bcm), Grama Ridge (0.2 bcm) and Houston Hub (0.4 bcm) Development of Houston Hub started |
  22 PPM a market leader in independent gas storage • #3 in North America for independent storage • ~10% of independent gas storage market • Independent storage represents ~12% of total gas storage market Cycled Gas Capacity Chevron (8.7%) Carlyle (11.7%) 0 5 10 15 20 25 30 Total cycled gas capacity 32.3 bcm PPM (10.4%) 35 Duke (27.5%) PPM well placed in expanding market |
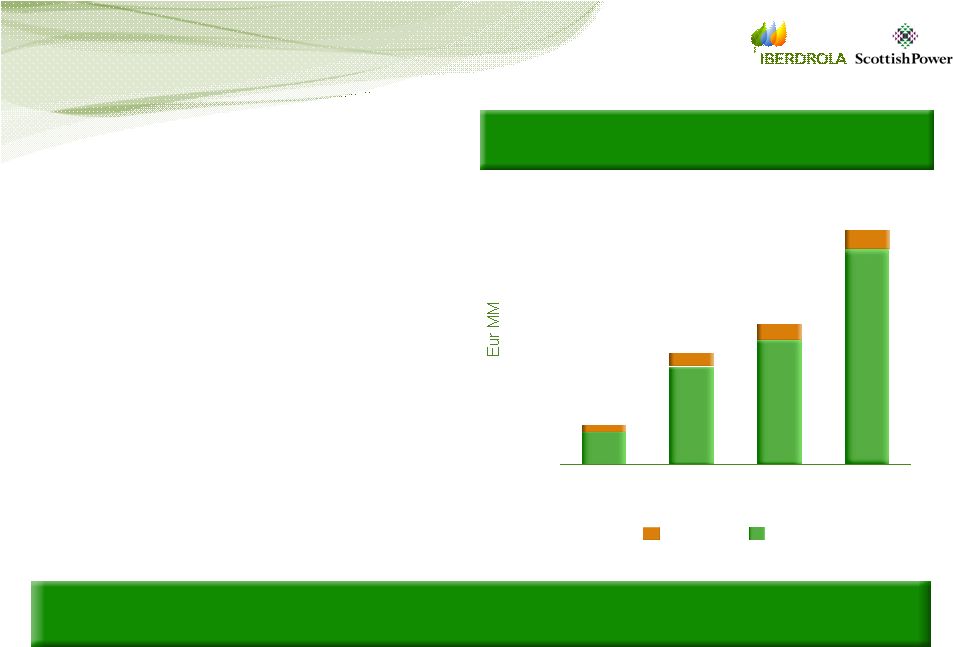 23 PPM’s gas storage operations have delivered strong profit growth • Robust EBITDA growth • 1.4 bcm of operating storage (Eur 188 MM invested capital) • Excellent returns • Minimal working capital and credit risk • 0.9 bcm under development • Further 1.2 bcm organic growth and acquisitions planned to 2010 EBIT and EBITDA (1,2) 7.5 22.5 29.0 50.0 54.0 32.3 25.5 9.0 7.5 15.0 22.5 30.0 37.5 45.0 52.5 60.0 02/03 03/04 04/05 05/06 EBITDA EBIT Note: (1) Financials are based on the exchange rate of USD 1 : Eur 0.75 (2) 02/03 and 03/04 under UK GAAP excluding goodwill amortisation; 04/05 and 05/06 under IAS excluding IAS39 and exceptionals Successful development track record |
 24 US gas storage: key economic drivers Contracted storage (Reservoir) 1.3 bcm third party in operation New build (Salt Storage) 0.9 bcm construction / permitting Further 1.2 bcm pipeline Owned storage (Reservoir) 1.4 bcm in operation US storage highly attractive with recent transaction multiples up to 600 $/bcm Revenue – Low Cycle : $1.80 – 2.30 O&M costs : $0.30 - 0.30 EBITDA : $1.50 – 2.00 Revenue – Low Cycle : $1.50 – 2.30 Lease payments : $0.70 – 0.90 Inventory carry costs : $0.15 – 0.25 EBITDA : $0.80 – 1.60 Per MM BTU Revenue – High Cycle : $2.60 – 3.50 Development Cost : $13.00 – 18.00 EBITDA : $2.30 – 3.20 |
 25 Agenda US wind US wind US energy management US energy management US gas storage US gas storage US thermal US thermal |
 26 US Energy Management key messages Provides service to PPM’s Provides service to PPM’s existing asset-based business existing asset-based business Trading, a natural extension of PPM’s Trading, a natural extension of PPM’s activity, creates activity, creates additional value additional value Delivers market knowledge, skills and system integration Delivers market knowledge, skills and system integration Well positioned for continued strong growth and Well positioned for continued strong growth and premium returns premium returns |
 27 Energy Management’s role • Builds upon PPM’s existing asset- based businesses • Optimises value from core assets • Minimises risk by forward hedging and balancing asset positions • Creates value through expansion into closely related activities: • Portfolio optimisation • Storage • Transportation / marketing alliances • Demonstrated business model based on reputation and capabilities • Embedded risk management culture Risk Management and Credit Pricing, Structuring and Origination PPM's Core Assets Forward and Operational Trading Storage, Transport and Marketing Alliances Combination of asset management and trading skills |
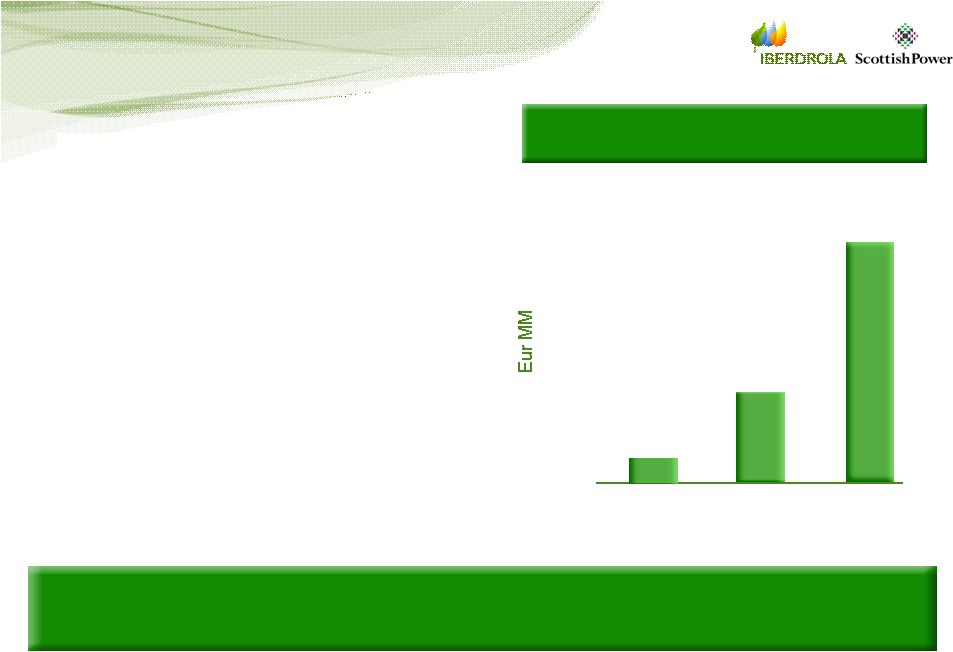 28 Energy Management delivering strong profit growth • Strong growth in EBITDA • Solid base of contracted gas storage capacity • Significant growth potential from transport contracts and marketing alliances • Expanding PPM’s geographic footprint across North America Note : For Energy Management EBIT equates to EBITDA. 02/03 and 03/04 under UK GAAP excluding goodwill amortisation; 04/05 and 05/06 under IAS excluding IAS39 and exceptionals EBIT and EBITDA 1.5 7.5 15.0 22.5 30.0 03/04 04/05 05/06 9.8 27.8 0.0 Stable and growing trading related earnings |
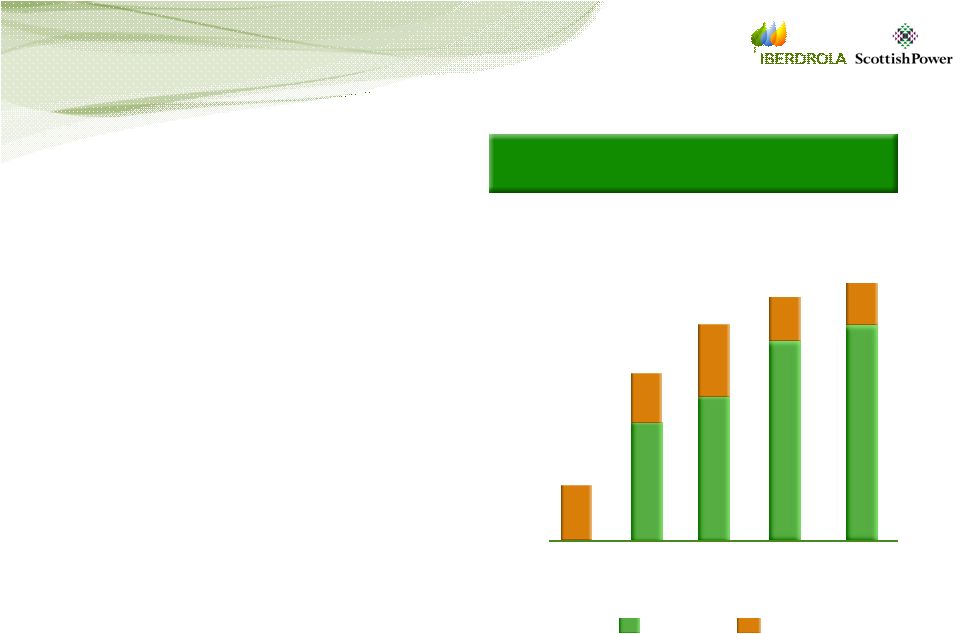 29 bcm 3rd party Enstor (2) Note: (1) For years ending 31 March (2) Contracted from Enstor by Energy Management • Strategically located storage • Capitalised on low cost storage in FY04/05 • 1.6 bcm currently • 0.3 bcm from Enstor • 1.3 bcm from 3 rd parties • Supportive market fundamentals • Further growth targeted Contract Storage - a building block for growth Contracted storage capacity (1) 0 0.3 0.6 0.9 1.2 1.5 1.8 04/05 03/04 05/06 06/07 07/08 outlook |
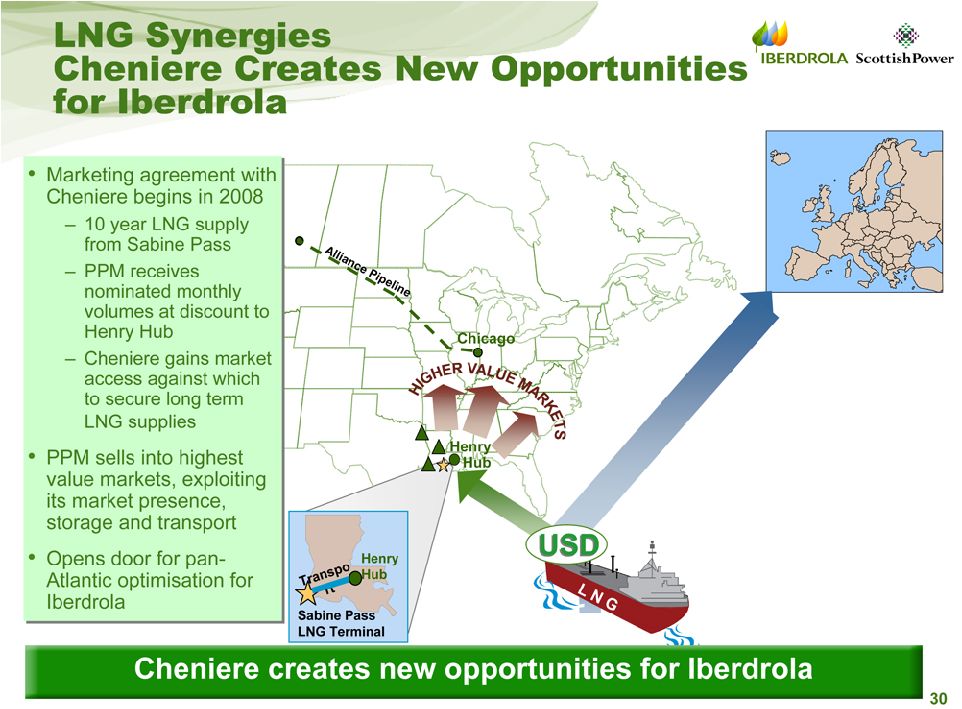 |
 32 Agenda US wind US wind US energy management US energy management US gas storage US gas storage US thermal US thermal |
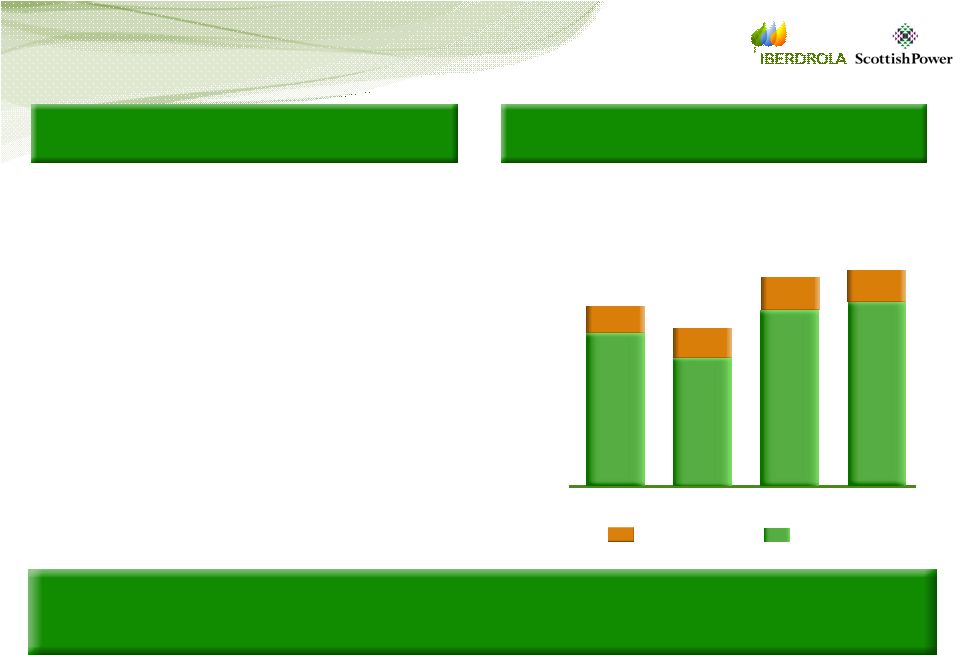     32 US thermal generation: fully contracted through mid-term at robust margins EBIT and EBITDA • Portfolio of generating assets • Klamath Cogeneration (506 MW 1 ) • Klamath Generation (100 MW) • West Valley (200 MW) • Klamath plants fully contracted at robust margins over mid term • West Valley leased and operated by PacifiCorp through June 2008 • Steady earnings stream Description Note: 1. 47% owned 2. Financials are based on the exchange rate of USD 1 : Eur 0.75 7.5 15.0 22.5 30.0 37.5 45.0 52.5 60.0 67.5 Eur MM EBIT EBITDA 2003 50 43 2004 44 36 2005 59 50 2006 61 52 Growth in renewables creating increased demand for dispatchable resources |
 33 PPM Key messages Leading positions in attractive high growth market Leading positions in attractive high growth market segments in North America segments in North America Experienced leadership team with excellent track Experienced leadership team with excellent track record of delivery record of delivery Delivering strong returns well ahead of cost of capital Delivering strong returns well ahead of cost of capital Significant future growth potential with high quality Significant future growth potential with high quality pipelines in Wind and Gas Storage pipelines in Wind and Gas Storage |
 34 Agenda Appendix Appendix |
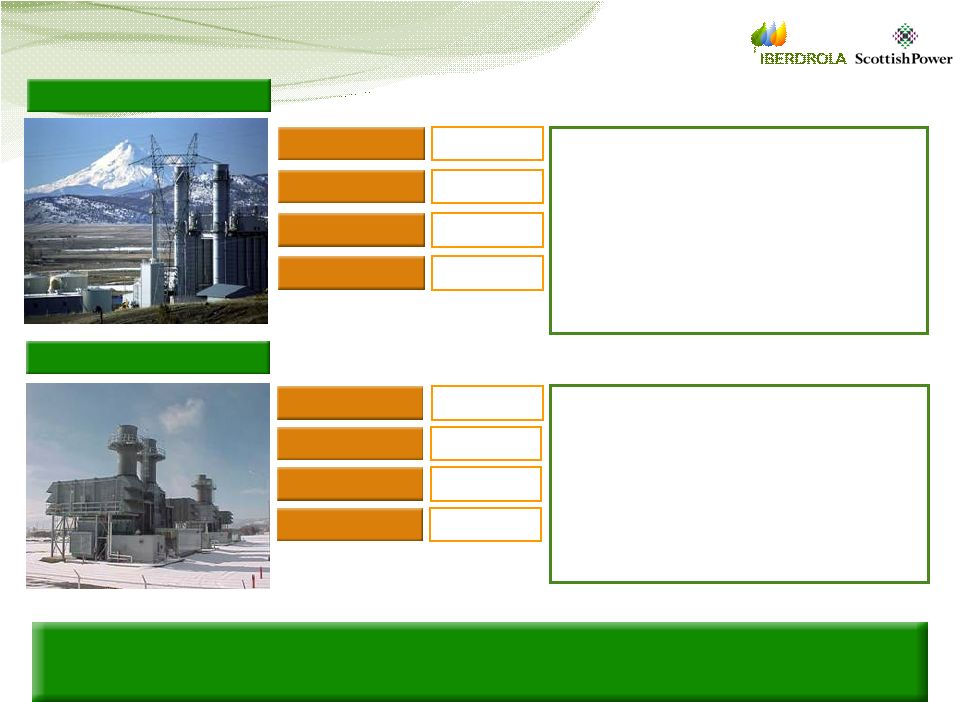 35 US thermal generation Operational date Installed capacity 2001 2001 506 MW 506 MW Location Oregon Oregon Employees 23 23 Overview • State-of-the-art CCGT owned by the City of Klamath Falls • PPM owns 47% of plant output; sold forward under mid-term contracts to California utilities • PPM is fuel supplier and brokers City’s output • Operated by PPM subsidiary Pacific Klamath Energy Klamath Cogeneration Overview • Gas turbine peaking facility owned by PPM • Operated by Klamath Cogeneration staff • Summer and Winter capacity sold forward under mid-term contracts • PPM owns development rights for fully permitted 550 MW CCGT on adjacent site 100 MW 100 MW 2002 2002 Oregon Oregon Installed capacity Operational date Location n/a n/a Employees Klamath Generation Growth in renewables creating increased demand for dispatchable resources |
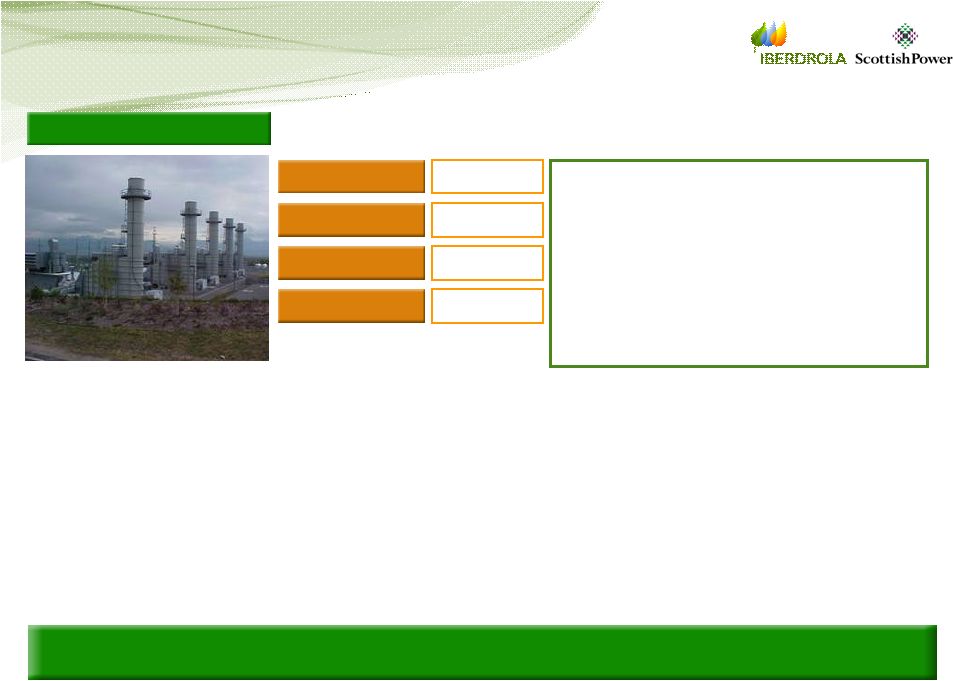 36 US thermal generation Operational date Installed capacity 2002 2002 200 MW 200 MW Location Utah Utah Overview • Gas turbine peaking facility owned by PPM • Currently leased to and operated by PacifiCorp, who has given notice of lease termination effective June 2008 • Lease termination may be rescinded by July 2007 or equipment can be re-deployed in higher value California marketplace West Valley 13 13 Employees Located in high-demand markets |
 37 End of Technical End of Technical Session V Session V ScottishPower ScottishPower North-American businesses: North-American businesses: PPM PPM |
 Technical Session VI Technical Session VI ScottishPower ScottishPower Strategic Fit & Valuation Strategic Fit & Valuation Considerations Considerations Exhibit 99.11 |
 2 Legal Note IMPORTANT INFORMATION This communication does not constitute an offer to purchase, sell or exchange or the solicitation of an offer to purchase, sell or exchange any securities. The shares of Iberdrola, S.A. may not be offered or sold in the United States of America except pursuant to an effective registration statement under the Securities Act or pursuant to a valid exemption from registration. FORWARD-LOOKING STATEMENTS This communication contains forward-looking information and statements about Iberdrola, S.A. and otherwise, including financial projections and estimates and their underlying assumptions, statements regarding plans, objectives and expectations with respect to future operations, capital expenditures, synergies, products and services, and statements regarding future performance. Forward-looking statements are statements that are not historical facts and are generally identified by the words “expects,” “anticipates,” “believes,” “intends,” “estimates” and similar expressions. Although Iberdrola, S.A. believes that the expectations reflected in such forward-looking statements are reasonable, investors and holders of Iberdrola, S.A. shares are cautioned that forward-looking information and statements are subject to various risks and uncertainties, many of which are difficult to predict and generally beyond the control of Iberdrola, S.A., that could cause actual results and developments to differ materially from those expressed in, or implied or projected by, the forward-looking information and statements. These risks and uncertainties include those discussed or identified in the public documents sent by Iberdrola, S.A. to the Comisión Nacional del Mercado de Valores. Forward-looking statements are not guarantees of future performance. They have not been reviewed by the auditors of Iberdrola, S.A. You are cautioned not to place undue reliance on the forward-looking statements, which speak only as of the date they were made. All subsequent oral or written forward-looking statements attributable to Iberdrola, S.A. or any of its members, directors, officers, employees or any persons acting on its behalf are expressly qualified in their entirety by the cautionary statement above. All forward-looking statements included herein are based on information available to Iberdrola, S.A. on the date hereof. Except as required by applicable law, Iberdrola, S.A. does not undertake any obligation to publicly update or revise any forward-looking statements, whether as a result of new information, future events or otherwise. |
 3 Agenda Valuation Considerations Valuation Considerations Strategic Fit Strategic Fit Conclusions Conclusions - - Synergies & efficiency Synergies & efficiency |
  4 Combination with ScottishPower is creating a leading global utility … Traditional generation (MW) Renewable energies (3) (MW) Total capacity (MW) Points of supply (MM) Production (2) (GWh) 124,670 32,524 6,562 39,086 21.9 Note: (1) Nota de Valores pro forma financials based on Iberdrola results for 12m ended 31 Dec 2006 and ScottishPower results for 12m ended 30 Sept 2006. Excludes synergies (2) Production for 12 months ended 31 Mar 2007 (3) Renewable energies includes wind power and mini-hydro (4) Does not include procurement for use in gas fired generation (5) Capex based on Iberdrola results for 12 months ended 31 Dec 2006 and ScottishPower results for 12 months ended 30 Sept 2006; rating: S&P Immediate and significant growth achieved Gas supply (4) (bcm) 4.2 Gas storage (bcm) 2.8 Key financials (Eur MM) (Nota de Valores) (1) Enlarged Iberdrola as at 31 Mar 2007 EBITDA EBIT Net profit Revenue 20,232 5,841 3,851 1,969 Rating A - Capex 4,277 Other key financials (Eur MM) (5) |
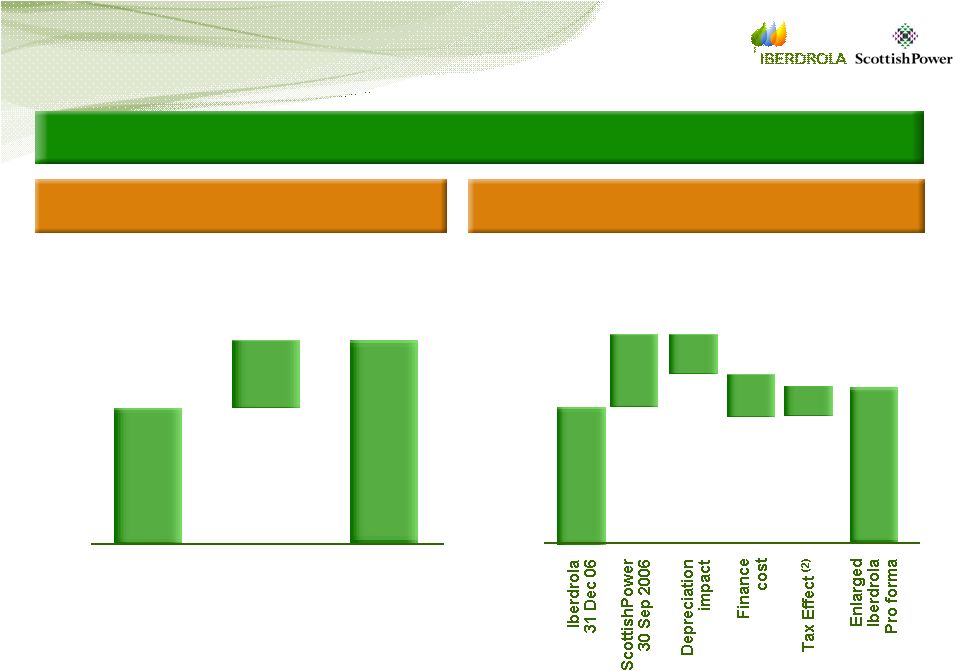  5 … with a material contribution from ScottishPower … Note: (1) Nota de Valores pro forma financials based on Iberdrola results for 12m ended 31 Dec 2006 and ScottishPower results for 12m ended 30 Sept 2006. Excludes synergies (2) Tax effect of depreciation and finance cost adjustments Key financials (Nota de Valores) (1) Pro forma net profit before synergies Pro forma EBITDA before synergies EUR MM EUR MM 3,889 1,952 5,841 1,000 3,000 5,000 7,000 Iberdrola 31 Dec 2006 ScottishPower 30 Sep 2006 Enlarged Iberdrola Pro forma 1,660 887 373 488 283 1,969 500 1,000 1,500 2,000 2,500 3,000 |
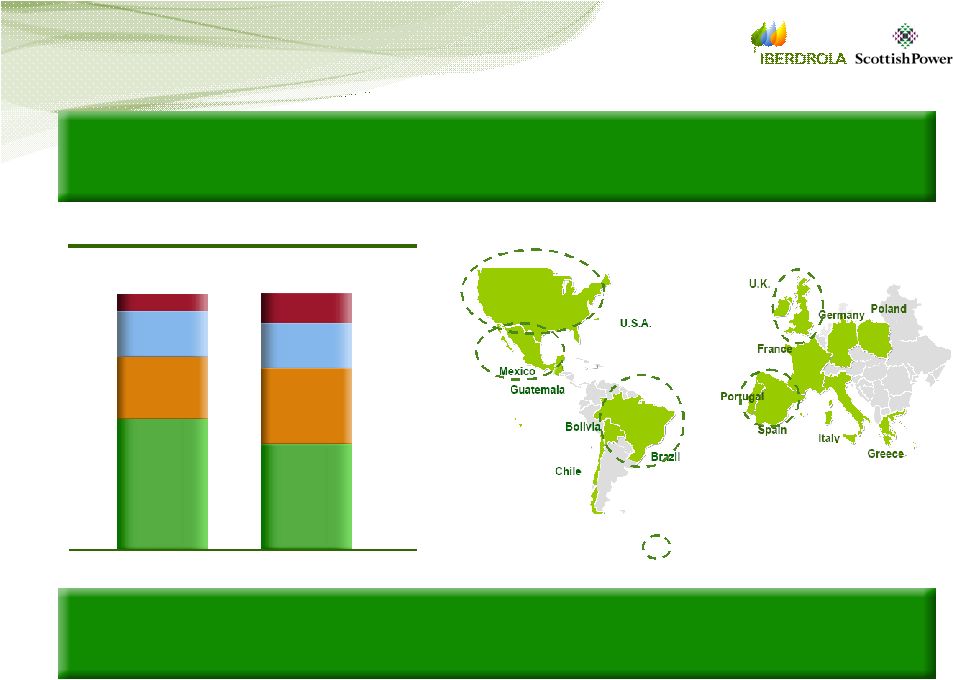   6 Major global presence … … and balanced exposure to liberalised and regulated businesses Pro forma EBITDA Pro forma EBITDA (1) (1) USA 3% 57% 29% UK 11% LatAm Spain 9% 48% Others 32% Regulated OECD businesses 11% LatAm businesses Liberalised OECD businesses Enlarged Iberdrola … and with uniquely diverse geographic and business exposure … By region By region By business By business Key markets Note: (1) Nota de Valores pro forma EBITDA based on Iberdrola results for 12m ended 31 Dec 2006 and ScottishPower results for 12m ended 30 Sept 2006. Excludes synergies |
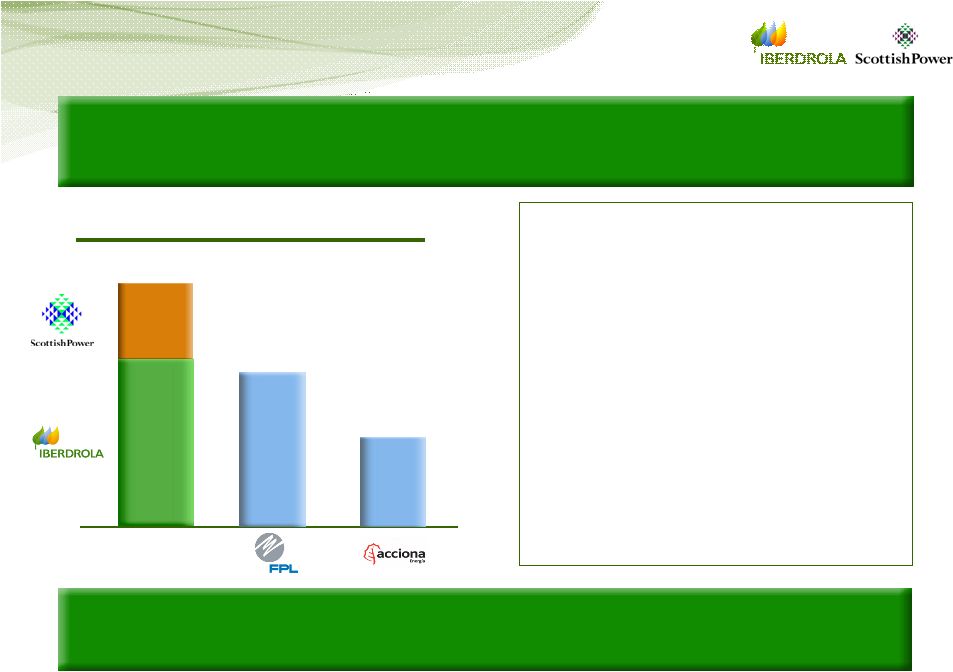    7 Installed capacity (MW) Installed capacity (MW) Significant growth opportunities … … with unrivalled scale and expertise • Leading expertise in site selection, procurement, construction and marketing • Significant scale benefits – turbine procurement – specialist skills • Unparalleled pipeline for future development • Increased diversification of wind portfolio reducing risk • Strong US demand driven by Renewable Portfolio Standards 2,443 4,163 6,562 … an extended lead in renewables … 2,010 Note: (1) Iberdrola and ScottishPower installed capacity as at 31 Mar 2007 (2) FPL as at 31 Mar 2007, Acciona as at 31 Dec 2006 (source: company websites/presentations) Enlarged Iberdrola 4,552 |
 8 … and scale to compete with peers Iberdrola emerges as a leading European utility player EBITDA Net Profit Production (GWh) (1) IBE (1) 124,670 Renewables capacity (MW) 6,562 Total capacity (MW) 39,086 Electricity customers (MM) 21.9 RWE 330,000 1,374 43,434 19.9 7,861 2,509 Enel 131,000 964 50,776 32.4 8,019 3,036 Source: E.ON 2006 Annual Report, E.ON Strategy and Key Figures 2006, EDF 2005 Annual Report, EDF 2006 Results Presentation, Enel 2006 Annual Report, Enel 2006 Results Presentation, Enel 2005 Environmental Report, RWE 2006 Annual Report Note: (1) Operational data as at March 2007; EBITDA, net profit and net debt from pro forma financial information included in the Nota de Valores, which exclude synergies (2) Based on share prices as at 23 April 2007 and last reported balance sheet figures Financials, Eur MM EDF 640,000 596 130,776 40.2 13,930 4,227 E.ON 230,300 435 53,542 28.6 11,353 4,386 Enterprise Value (2) 5,841 1,969 70,735 39,697 64,121 130,198 77,973 |
 9 Iberdrola / SPW Gas Natural / Endesa EON / Endesa Gaz de France / Suez 5 mo. COMPLETED • Potential acquisition of asset portfolio 18 mo. after initial bid • Withdrawal from process 17 mo. after initial bid Enel-Acciona / Endesa • Outcome not yet predictable • Potential acquisition 11 mo. after Acciona’s 10% share purchase > 18 mo. 17 mo. 18 mo. (2) 11 mo. (1) FPL / Constellation • Cancelled 10 mo. Exelon / PSEG • Cancelled > 21 mo. Note: (1) Assumes start of transaction with stake purchase by Acciona and closing of acquisition at the beginning of September 2007 (2) Assumes that asset sale to Endesa takes place in the beginning of September 2007 Source: Company press releases, Mergermarket … becoming the only major acquisition in the last 18 months completed according to announced timetable The transaction was successfully completed in record time … |
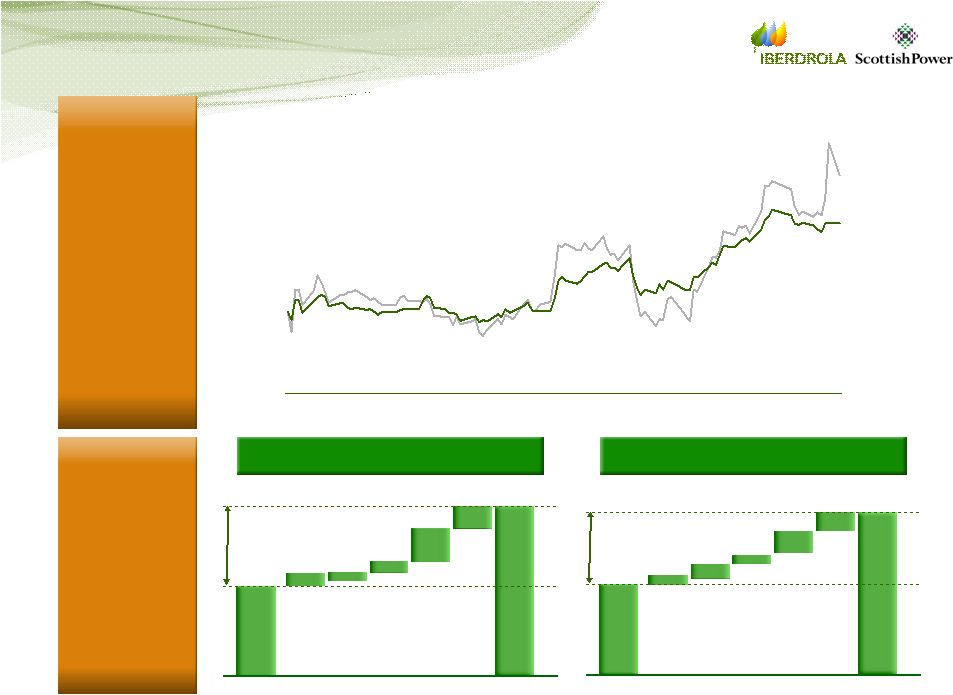  10 30.00 31.00 32.00 33.00 34.00 35.00 36.00 37.00 38.00 39.00 27-Nov-06 18-Dec-06 08-Jan-07 29-Jan-07 19-Feb-07 12-Mar-07 02-Apr-07 23-Apr-07 27 Nov Dec Jan Feb Mar Apr 23 April 29,526 33,682 + €4,156MM 334 -288 334 2,001 1,776 Value creation (Eur MM) (from 27 Nov 06) Share price performance (from 27 Nov 06) 27 Nov Dec Jan Feb Mar Apr 23 April 16,144 17,607 + € 137 222 147 648 309 1,462MM Source: Datastream Eur GBp Iberdrola ScottishPower 700 720 740 760 780 800 820 840 860 880 Iberdrola 14.1% SPW 9.1% … and is creating value for shareholders … 680 |
 11 Iberdrola-ScottishPower: a combination aligned with the principles of Iberdrola’s Strategic Plan Accelerates projected growth Diversifies risk Provides new business opportunities Creates one of the largest electrical power companies in the world Increases net profit whilst maintaining financial stability … all of which is in line with the 2007-2009 Strategic Plan |
  12 The combination of Iberdrola and ScottishPower leverages the strengths of the individual companies Enlarged Iberdrola is well positioned for new business opportunities Opportunity to optimise LNG trading and gas procurement contracts UK Other US Wind Generation Wind Gas storage Supply Gas Ability to apply experience in managing liberalised supply businesses to other markets Strong gas storage pipeline in the US Growth potential of US renewables based on experience / pipeline of both companies Identified opportunities: CCGT, FGD and Biomass Possible UK nuclear programme Growth potential of UK renewables pipeline Well positioned for further global M&A opportunities M&A |
 13 Agenda Valuation Considerations Valuation Considerations Strategic Fit Strategic Fit Conclusions Conclusions - - Synergies & efficiency Synergies & efficiency |
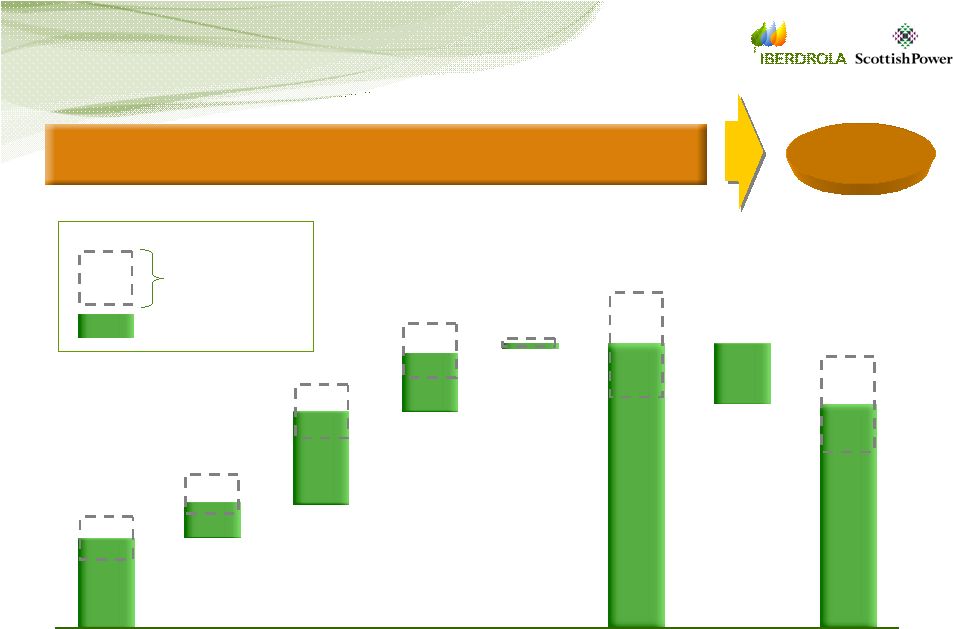 14 ScottishPower’s standalone SOTP valuation – pre-announcement Source: Selected broker research (May – November 2006) Note: (1) Determined as average of selected broker estimates (2) Total shares outstanding used 1,489 MM, net debt of GBP 2,284 MM as at Sep 2006, exchange rate GBP 1:Eur 1.4738 Generation Supply PPM T&D Others Enterprise Value Net Debt (2) Equity Value 227p 297p 57p 106p 114p 184p 222p 249p 3p 34p 623p 870p 470p 717p (153)p ~ 600p Broker estimates (1) High Low Broker estimate range (GBp per share) |
  15 • Increase the value of residential customers to Eur 502 per account • Value supported by transaction multiples up to value per customer of Eur 472 (Yorkshire Electricity purchase by Innogy) • Recognition of circa 2 GW of PPM pipeline wind projects (operational by 2010)... • …with US wind business’ pipeline to 2010 valued at Eur 1,101MM (equivalent to Eur 300/kW) • A 30% premium is applied to RAB for the UK T&D assets based on current transactions… • …with LBO valuation at a possible 1.3x exit multiple to March 2007 RAB, equivalent to Eur 5,830 MM Recognition of improving G&S fundamentals, attractive US pipeline and increasing T&D premia contributed to upgraded valuations Supply Renewables T&D Traditional Generation • Longannet to be valued in line with Drax, after deducting Eur 207 MM capex not yet spent on FGD, reflecting wider dark spreads • Reflecting spark spreads and asset multiples, CCGT to be valued up to Eur 871/kW Post-announcement changes to brokers’ views on ScottishPower’s valuation … Source: Selected broker research (November 2006) Specific comments from analysts post announcement |
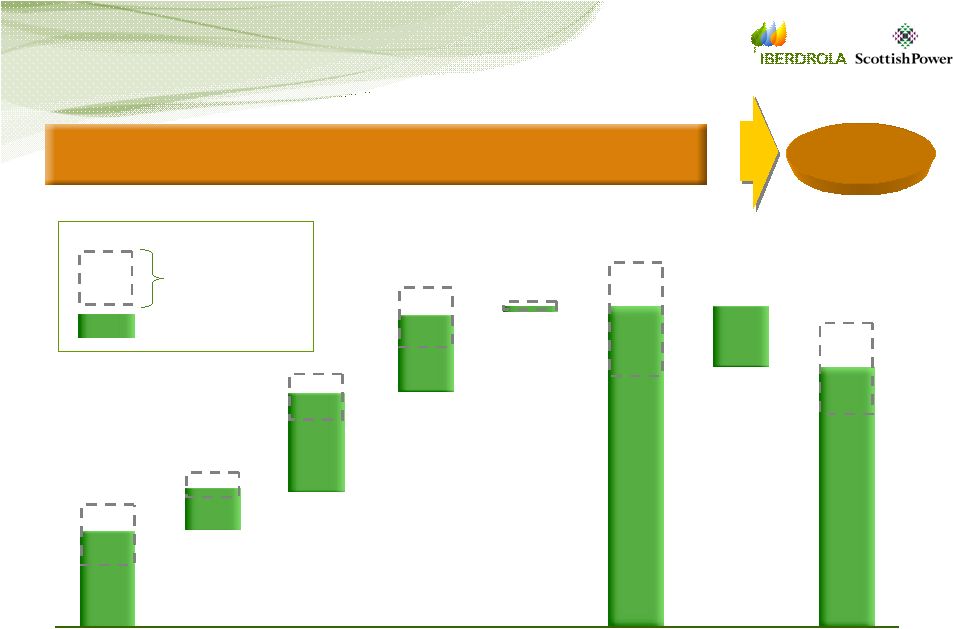 16 … has led to higher post-announcement brokers’ standalone SOTPs … 230p 297p 99p 115p 138p 235p 224p 277p (9)p 19p 682p 943p 529p 790p (153)p High Low Broker estimate range (GBp per share) Generation Supply PPM T&D Others Enterprise Value Net Debt (2) Equity Value Broker estimates (1) ~ 700p Source: Selected broker research (November 2006) Note: (1) Determined as average of selected broker estimates (2) Total shares outstanding used 1,489 MM, net debt of GBP 2,284 MM as at Sep 2006, exchange rate GBP 1:Eur 1.4738 |
  17 • ScottishPower’s industry-leading trading capabilities are not specifically recognised, including significant ancillary services revenue and recurring UK balancing market revenues (Eur 60 MM per year in the UK) • Value not specifically allocated to certain ScottishPower businesses including UK CHP, UK gas storage assets, contracts, metering and connections, SME energy supply and Industrial/Commercial energy supply … in addition to synergy value and tax benefits Other … and some themes require further explanation Trading Significant further standalone value to be recognised … • Value is not being ascribed to the majority of PPM’s 10,700 MW and the UK’s 4,400 MW wind pipelines despite recent impressive track record Renewables pipeline • Significant pipeline (planned investments of over Eur 500 MM to 2010, with attractive returns targeting WACC + 300bp) not fully recognised US gas storage asset/contracts Energy contract portfolio • Value is often still not specifically allocated to ScottishPower’s in-the- money energy contracts whilst valuing the assets on a merchant basis |
 18 Supply • Supply margin adjusting to falling wholesale prices • Value creation through integration with generation and trading Significant value from this activity Renewables • Highly attractive UK regulatory environment • Pipeline: significant growth requirement for UK wind • Unique synergies with Iberdrola’s existing global wind business Benefits of global scale and large pipeline T&D • Cost reduction opportunity due to ScottishPower’s cost position • Very significant current market multiples • Attractive regulatory returns Well understood and low-risk Combination of low risk, visible cash flows with high growth and upside opportunities Generation • Gas price and spark/dark spread evolution • Declining reserve margin leading to new capacity pricing Attractive market economics driven by new build requirement Potential approach to fundamental DCF valuation – summary |
 19 UK generation: DCF parameters Load factors Captured load-to- baseload premium Clean dark and spark spreads Attractive returns in UK generation supported by tightening supply and demand balance Baseload price Ancillary services Note: (1) For 2008 contract, sourced from Heren; (2) Sourced from Platts; (3) Based on modern CCGT plant with thermal efficiency of 53% (LHV); (4) DTI Coal (FGD) : 45 - 50 % CCGT : 55 - 65 % Hydro : 30 % Spot : 18.6 £/MWh Forward : 36.9 £/MWh (1) Coal : 11.9 £/MWh (3) CCGT : 6.1 £/MWh (3) Newbuild : 10.0 £/MWh (3) UK peak-to-baseload premium : ~ 30% (2) Recurring revenue : £ 20 – 40 MM pa and balancing market flexibility O&M costs Coal (FGD) : 25 £/kW pa (4) CCGT : 7 £/kW pa (4) |
 20 UK supply: DCF parameters Customer breakdown Recently improving margins in UK supply are supported by levelling off of wholesale power and gas prices EBIT margins Electricity residential : 3.2 MM Gas residential : 1.9 MM Other : 0.2 MM (1) Total customers today : 5.4 MM (2) Note: (1) Industrial and commercial and small business; (2) Electricity and gas; (3) Average of Direct Debit and Standard, sourced from Energywatch; (4) Ofgem; (5) Datamonitor; (6) Market consensus Long run average : 5 - 7% (6) Energy use per customer Gas (average) : 600 – 700 thm pa Electricity (average) : 4,500 – 5,000 kWh pa Average bill per customer Gas (average) : £590 pa (3) Electricity (average) : £374 pa (3) Other costs Cost-to-serve : 21 £/cust. pa (5) Energy purchase cost (market) UK spot wholesale gas : 16.2p / thm UK spot wholesale electricity : 1.9p / kWh External costs as % of revenue : gas 26%, elec. 30% (4) |
 21 UK T&D: DCF parameters The regulator has set reasonable returns in UK T&D to create incentive for the necessary investments REGULATION Eur 500 MM Eur 208 MM Eur 150 MM Eur 138 MM 6.9% This is fixed subject to incentives Beat the opex target Beat the capex target Increased realised return Allowed revenue Allowed opex Allowed capex / dep Allowed return (pre tax) RAB Eur 2,000MM Example (5 year) |
 22 UK wind: DCF parameters High load factors Attractive economic incentives Stable regulatory framework Potential returns in the UK are more attractive than those available in several other wind markets in Europe Opex Capex Pipeline Average load factor : 2,300 – 2,800 hrs Current revenue : 85 £/MWh Opex before synergies : 40 - 50 £/kW pa Capex before synergies : 1,000 - 1,200 £/kW Construction : 474 MW In planning : 772 MW Pre-planning and feasibility : 3,628 MW |
 23 US wind: DCF parameters Attractive all-in tariff Strong government support Attractive load factor range Opex Capex Pipeline Renewable Portfolio Standards : 49GW build by 2015 Opex before synergies : 25 $/kW pa Capex before synergies : 1,500 - 1,700 $/kW Construction : 526 MW Target by 2010 : 3,500 MW Pre-planning and feasibility : 7,700 MW Load factor range : 2,600 – 3,500 hrs Tariff : 68 – 77 $ / MWh Plus accelerated depreciation benefit PPM’s wind business is a leading US developer and operator |
 24 US storage highly attractive with recent transaction multiples up to 600 $/bcm US gas storage: DCF parameters Contracted storage (Reservoir) 1.3 bcm third party in operation New build (Salt Storage) 0.9 bcm construction / permitting Further 1.2 bcm pipeline Owned storage (Reservoir) 1.4 bcm in operation Revenue – Low Cycle : $1.80 – 2.30 O&M costs : $0.30 - 0.30 EBITDA : $1.50 – 2.00 Revenue – Low Cycle : $1.50 – 2.30 Lease payments : $0.70 – 0.90 Inventory carry costs : $0.15 – 0.25 EBITDA : $0.80 – 1.60 Per MM BTU Revenue – High Cycle : $2.60 – 3.50 Development Cost : $13.00 – 18.00 EBITDA : $2.30 – 3.20 |
 25 Note (1) Broker estimates for asset values Observable benchmark provided by asset transaction multiples … UK conventional generation UK T&D US gas storage UK supply 6,036 MW Eur 4,499MM (Mar 07 RAB) 4.8 bcm 5.1 MM cust. 779– 1,002 (Eur/kW) 1.25x– 1.30x (Eur/RAB) 164 – 301 (Eur/bcm) 480 – 502 (Eur/cust.) US conventional generation 538 MW 424 – 525 (Eur/kW) Transaction asset multiple range (1) Wind pipeline 15,108 MW 74 – 221 (Eur/kW) • Weighted average asset multiple • RAB of transmission and distribution (average of broker estimates) • Includes pipeline and storage under management • Residential electricity and gas customers • PPM’s thermal generation business Comment • 4,400 MW for UK and 10,708 MW for US Other NA NA • Value of Energy contracts, UK gas storage, Metering & connections, SME and I&C energy supply UK wind 818 MW 1,827 – 2,220 (Eur/kW) • Operational and under construction US wind 2,158 MW 807 – 1,098 (Eur/kW) • Operational and under construction |
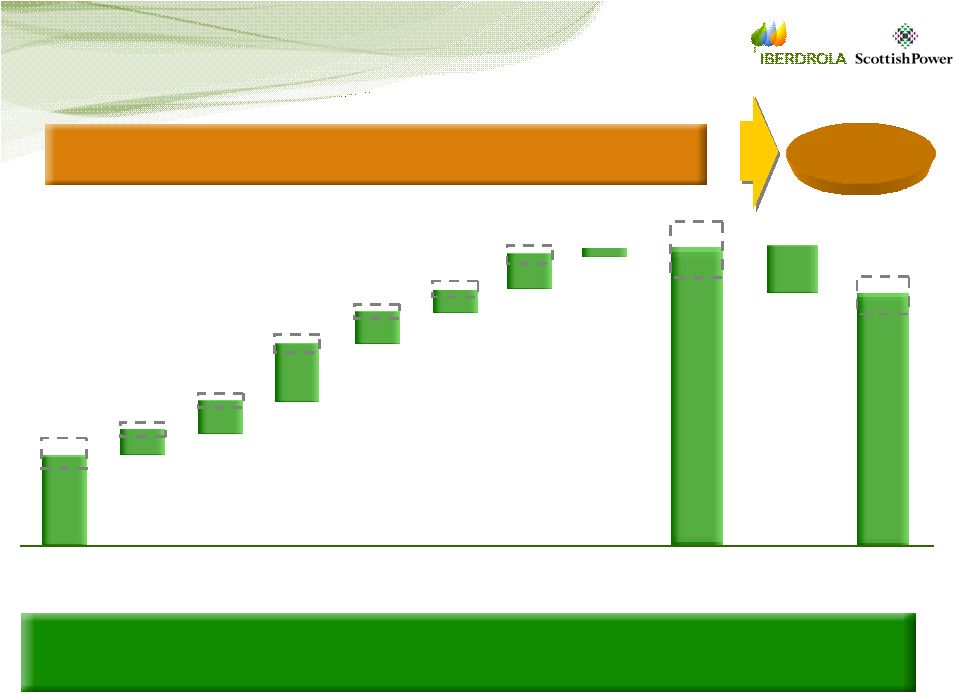 26 … and if applied to ScottishPower’s assets implies 724 – 1007p value range Net debt Equity Value 1,007p UK conv. gen. 276p 214p UK supply 117p 112p UK T&D 276p 252p US other 79p 46p Wind pipeline 152p 51p Enterprise Value 1,161p 878p 724p (153)p Reflects further upside potential in wind pipeline and PPM storage Other 71p 83p 68p UK wind US wind 108p 79p 55p Note: Total shares outstanding used 1,489MM, net debt of GBP 2,284 MM as at 30 Sep 2006, exchange rate used GBP 1: Eur 1.4738 Midpoint of range ~ 850p |
 27 Agenda Valuation Considerations Valuation Considerations Strategic Fit Strategic Fit Conclusions Conclusions - - Synergies & efficiency Synergies & efficiency |
 28 Opex synergies Yr 1 Eur 40 MM Yr 2 Eur 90 MM Yr 3+ Eur 130 MM Capex savings in near term Additional synergies not quantified Annual Savings (Eur MM) 31 p.a. • Corporate centre – efficiency improvement • Total 5 year savings from wind/CCGT • Recurring annual distribution/supply savings • Option of new nuclear plant / LNG entrance • Loss reduction in supply business contracts • Efficiency in generation and processes Dedicated integration team already working towards on- schedule delivery of targets 5 p.a. 67 p.a. 130 p.a. 27 p.a. 192 total 6 p.a. • Shared services – optimisation, IT, purchasing • Wind US – efficiency improvement • Generation/Supply – procurement/efficiency Total < 5% combined group expense Synergies identified across a range of functions |
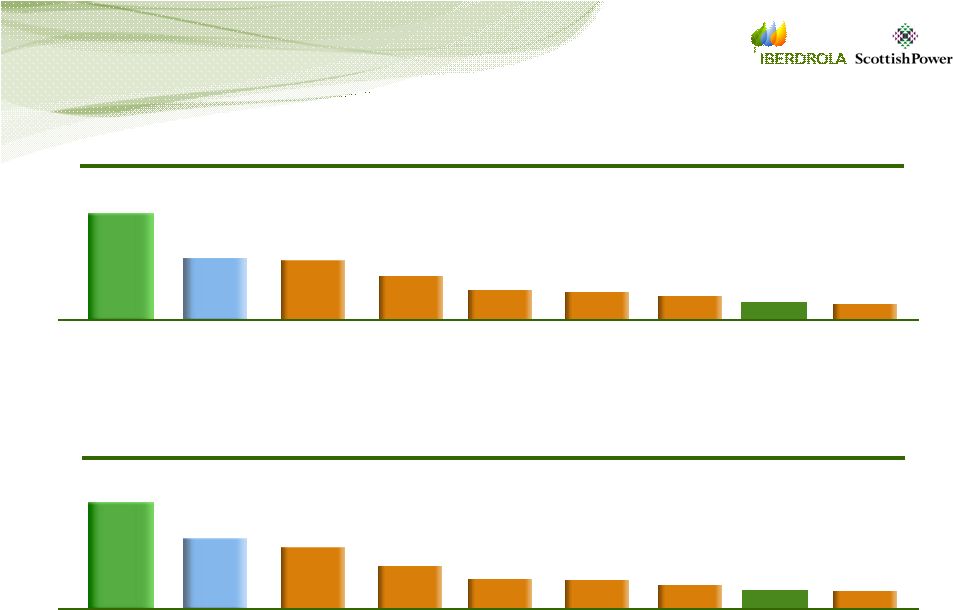 29 MW/employee (home market) MW/employee (home market) GWh distribution/employee (home market) GWh distribution/employee (home market) SPW 0.7 Portugal 1.3 Rest of Spain 1.9 Iberdrola + SPW 3.2 UK 0.8 France 0.9 Italy 1.0 Germany 0.6 1.8 Iberdrola Rest of Spain Iberdrola + SPW 4.3 6.7 8.2 12.2 4.4 4.8 5.5 4.0 8.2 SPW Portugal UK France Italy Germany Iberdrola Significant opportunity to share best practice and extract synergies |
 30 Agenda Valuation Considerations Valuation Considerations Strategic Fit Strategic Fit Conclusions Conclusions - - Synergies & efficiency Synergies & efficiency |
 31 Conclusions Transaction creates global leader in utilities sector Transaction creates global leader in utilities sector Shareholder value significantly increased through Shareholder value significantly increased through transaction structure transaction structure Group well positioned for further development in core Group well positioned for further development in core markets markets Pre-eminent example of non-organic growth in utility Pre-eminent example of non-organic growth in utility markets markets Significant synergies and opportunity for exchange of Significant synergies and opportunity for exchange of best practice best practice New group Strategic Plan in Q4 to reflect full New group Strategic Plan in Q4 to reflect full combination potential combination potential |
 32 End of Technical End of Technical Session VI Session VI ScottishPower ScottishPower Strategic Fit & Valuation Strategic Fit & Valuation Considerations Considerations |
Exhibit 99.12
ANNEX EXPLAINING SIGNIFICANT FACTS OR EVENTS
E - 3. Other significant increases or reductions of fixed assets (holdings of over 10% in unlisted companies, significant investments or divestments of fixed assets, etc).
Increase in the share capital of the company KORINTHOS POWER, S.A. Following this operation the direct interest of IBERDROLA S.A. in the aforementioned company remains unchanged.
Ancillary contribution (“prestación accesoria”) in IBERDROLA PORTUGAL ELECTRICIDAD E GAS, S.A. (100% owned by IBERDROLA, S.A.). Following this operation the indirect interest of IBERDROLA, S.A. in the aforementioned company remains unchanged.
Establishment, by TELTRONIC, (50% owned by CORPORACION IBV, PARTICIPACIONES EMPRESARIALES, S.A. and IBERDROLA, S.A.) of 100% of the company TELTRONIC REDES Y SERVICIOS, with the indirect interest of IBERDROLA S.A. in the aforementioned company remaining at 50%.
Acquisition of IBERDROLA ENERGIA, S.A., by IBERDROLA INMOBILIARIA, S.A. (100% owned by IBERDROLA, S.A.) of 100% of the company DESARROLLOS INMOBILIARIOS LAGUNA DEL MAR, S.A. de C.V., with the indirect interest of IBERDROLA, S.A. in the aforementioned company remaining at 100%.
Acquisition, by IBERDROLA, S.A., of 4.21% of shares in the company MEDGAZ. Following this operation the direct interest of IBERDROLA, S.A. in the aforementioned company is 20%.
Increase in the share capital of the Italian company IBERDROLA ENERGIE RINNOVABILI, SPA (100% owned by IBERDROLA ENERGÍA RENOVABLES S.A., in turn 100% owned by IBERDROLA, S.A.). Following this operation the indirect interest of IBERDROLA, S.A. in the aforementioned company remains unchanged.
Increase in the share capital of the American company IBERDROLA RENEWABLE ENERGIES USA LIMITED (100% owned by IBERDROLA ENERGÍA RENOVABLES S.A., in turn 100% owned by IBERDROLA, S.A.). Following this operation the indirect interest of IBERDROLA, S.A. in the aforementioned company remains unchanged.
Increase in the share capital of the Brazilian company ENERBRASIL (100% owned by IBERDROLA ENERGÍA RENOVABLES S.A., in turn 100% owned by IBERDROLA, S.A.). Following this operation the indirect interest of IBERDROLA, S.A. in the aforementioned company remains unchanged.
Acquisition, by IBERDROLA ENERGÍA RENOVABLES, S.A. (100% owned by IBERDROLA, S.A), of the Hungarian company MAGELLAN INVESTMENT VAGYONKEZELO, KFT, whereby the indirect interest of IBERDROLA in the aforementioned company is 100%.
Increase in the share capital of the company ENERGIAS EOLICAS DE CUENCA, S.A. (62.5% owned by IBERDROLA ENERGÍA RENOVABLES DE CASTILLA-LA MANCHA, S.A., owned 100% by IBERDROLA ENERGÍA RENOVABLES, S.A., in turn 100% owned by IBERDROLA, S.A.). Following this operation the indirect interest of IBERDROLA, S.A. in the aforementioned company remains unchanged.
Acquisition, by IBERDROLA ENERGÍA RENOVABLES, S.A. (100% owned by IBERDROLA, S.A), of 10% of the company BIOVENT HOLDING. Following this operation the direct interest of IBERDROLA, S.A. in the aforementioned company is 95%.
Increase in the share capital of VILLARDEFRADES EOLICAS, S.L. (80% owned by BIOVENT HOLDING., in turn 95% owned by IBERDROLA ENERGIA RENOVABLES, S.A., 100% owned by IBERDROLA, S.A.), subscribed by BIOVENT HOLDING. Following this operation the direct interest of IBERDROLA, S.A. in the aforementioned company is 76%.
1
Acquisition by BIOVENT HOLDING (95% owned by IBERDROLA ENERGIA RENOVABLES, S.A., in turn 100% owned by IBERDROLA, S.A.), of 40% of the company ENERGIA GLOBAL CASTELLANA, S.A., whereby BIOVENT HOLDING holds 100% of this company and the indirect interest of IBERDROLA is 95%.
Increase in share capital of the company PARQUES EOLICOS LOS COLLADOS, S.L., 100% owned by VILLARDEFRADES EOLICAS, S.L. (80% owned by BIOVENT HOLDING., in turn 95% owned by IBERDROLA ENERGIA RENOVABLES, S.A., 100% owned by IBERDROLA, S.A.). Following this operation the indirect interest of IBERDROLA, S.A. in the aforementioned company is 76%.
Increase in share capital of the company PARQUES EOLICOS FUENTE SALADA, S.L., 100% owned by VILLARDEFRADES EOLICAS, S.L. (80% owned by BIOVENT HOLDING., in turn 95% owned by IBERDROLA ENERGIA RENOVABLES, S.A., 100% owned by IBERDROLA, S.A.). Following this operation the indirect interest of IBERDROLA, S.A. in the aforementioned company is 76%.
Increase in share capital of the company PARQUES EOLICOS CRUZ DEL CARRUTERO, S.L., 80% owned by VILLARDEFRADES EOLICAS, S.L. (80% owned by BIOVENT HOLDING., in turn 95% owned by IBERDROLA ENERGIA RENOVABLES, S.A., 100% owned by IBERDROLA, S.A.). Following this operation the indirect interest of IBERDROLA, S.A. in the aforementioned company is 60.80%.
Acquisition by IBERDROLA ENERGIAS RENOVAVEIS, S.A. (100% owned by IBERDROLA ENERGÍA RENOVABLES, S.A. in turn 100% owned by IBERDROLA, S.A.), of 100% of the Portuguese company EONERGI ENERGIA EOLICA, S.A., whereby the indirect interest of IBERDROLA S.A. in the aforementioned company is 100%.
Acquisition, by PERFECT WIND, owned 100% by the French company IBERDROLA ENERGIA RENOUVELABLES, SAS (100% owned by IBERDROLA ENERGÍA RENOVABLES, S.A., in turn 100% owned by IBERDROLA, S.A.), of 100% of the company SDEVEF, SAS, whereby the indirect interest of IBERDROLA S.A. in the aforementioned company is 100%.
Establishment, by IBERDROLA ENERGIAS RRENOVABLES DE CASTILLA-LA MANCHA (100% owned by IBERDROLA ENERGIA RENOVABLES, S.A., in turn 100% owned by IBERDROLA, S.A.), of 90% of the company IBERDROLA ENERGIA SOLAR DE PUERTOLLANO, S.A., whereby the indirect interest of IBERDROLA S.A. in the aforementioned company is 90%.
Acquisition, by IBERDROLA ENERGIAS RENOVABLES, SAU (100% owned by IBERDROLA, S.A.), of 2.8% of the company ROKAS S.A., whereby the indirect interest of IBERDROLA, S.A. in the aforementioned company increases from 49.9% to 52.7%.
Acquisition, by PERFECT WIND, owned 100% by the French company IBERDROLA ENERGIA RENOUVELABLES, SAS (100% owned by IBERDROLA ENERGÍA RENOVABLES, SAU, in turn 100% owned by IBERDROLA, S.A.), of 100% of the company PELESTE, SAS, whereby the indirect interest of IBERDROLA S.A. in the aforementioned company is 100%.
Increase in the share capital of the Estonian company OUSAÜHING RAISNER (80% owned by IBERDROLA ENERGÍA RENOVABLES S.A., in turn 100% owned by IBERDROLA, S.A.). Following this operation the indirect interest of IBERDROLA, S.A. in the aforementioned company remains unchanged.
Establishment, by IBERDROLA ENERGIA, S.A., (100% owned by IBERDROLA, S.A.), of the company DESARROLLOS INMOBILIARIOS LAGUNA DEL MAR, S.A. DE C.V., with a holding of 100%. Following this operation the indirect interest of IBERDROLA, S.A. in the aforementioned company is 100%.
2
E - 5. Issues, redemptions or cancellations of debentures and notes.
ISSUE | DATE | REDEMPTION DATE | NOMINAL AMOUNT REDEEMED (€) | ||||
IB I. May 57 | 31.05.57 | 02.01.07 | 82,337.00 | (R) | |||
IB I. Apr 58 | 20.04.58 | 02.01.07 | 92,554.00 | (D) |
(D): Draw.
(R): Remainder.
E - 9 Changes in the institutional regulation of the sector that significantly affect the economic or financial situation of the Company or Group
Up to 31 March 2007 the following regulations have been published which could be of some relevance to activity in the electricity and gas sector:
ELECTRICITY INDUSTRY
| • | ORDER ITC/400/2007, of 26 February, regulating the bilateral contracts between distribution companies for tariff supplies within the peninsula. |
The purpose of this Order is to regulate the bilateral contracting of electricity with physical delivery by the companies responsible for tariff supplies within the peninsula.
The Order will apply to the purchase of electricity by the distribution companies (in future, from the last-resort retailers.).
Contracts may be signed with the distribution companies by the following market operators who will act as sellers: electricity producers, both ordinary and special regime, retailers, external agents, consumers acting directly in the market, and their respective representatives.
The energy to be supplied by each seller will be assigned by an auction process in which, starting from an amount of energy to be supplied for the distribution companies as a whole and from an initial price, the price will be progressively lowered until a balance is reached between energy supply and demand.
Once the results are published, and before 72 hours have elapsed, sellers and distribution companies will be obliged to formalise their commitments by signing bilateral contracts undertaking the obligation of physical delivery in their corresponding amounts.
| • | ORDER ITC 446/2007, of 27 February, regulating grants for autochthonous coal transport between coalfields for the years 2006 and 2007. |
The purpose of the grants is to compensate for the cost of transporting between coalfields. These grants may be applied for by electricity companies that transport during the years 2006 and 2007 the maximum quantities set out in this Order.
| • | ORDER ITC 447/2007, of 27 February, regulating the grants for financing power-station coal stocks in excess of the necessary amounts to cover seven hundred and twenty hours’ operation for the years 2006 and 2007. |
The purpose of the grants regulated under this order is to compensate for the financing of power-station coal stores (anthracite, soft coal and lignites) in excess of the necessary amounts to cover seven hundred and twenty hours’ full-load operation and wastage.
| • | ORDER ITC 843/2007, of 28 March, modifying ORDER ITC/4112/2005, of 30 December, stipulating the applicable regime for intra-community and international electricity exchange. |
This Order regulates the management mechanism of the Spain-Portugal connection. The mechanism consists of two complementary processes: one is based on the assignation of physical rights of capacity by means of explicit auctions at different times, and the other, short-term process is based on a “market separation” mechanism, known in the
3
literature as “market splitting”, managed by the Iberian Energy Market Operator and, formerly, by the Iberian Energy Market-Spanish Pole Operator.
A similar adaptation is made in the management mechanism of the Spain-France connection whereas the current system for managing the connection between Spain and Morocco is maintained, now coming under specific consideration.
| • | Royal Decree 47/2007, of 19 January, approving the basic Procedure for energy-efficiency certification of new construction. |
The purpose of the basic Procedure for certifying the energy efficiency of buildings is to determine the method of calculating the energy efficiency classification, with which the certification process commences, taking into consideration the factors that most affect the energy consumption in newly -built buildings or those undergoing a certain degree of alteration or refurbishing; to establish the technical and administrative conditions for the energy efficiency certification of the projects and the finished buildings; and to approve a nationwide logo called the energy efficiency label.
The aim of approving this basic Procedure is to promote energy efficiency by providing objective mandatory information to buyers and users in relation to the energy characteristics of buildings, in the form of an energy efficiency certificate that serves to appraise and compare the different features.
GAS INDUSTRY
No regulations have been published that are of any relevance to gas industry.
4
Exhibit 99.13
COMISIÓN NACIONALDEL MERCADODE VALORES
Mr. Rodrigo Buenaventura
Market Area Director
Pode la Castellana no 19
28046 Madrid
Bilbao, April 26 2007
COMISIÓN NACIONALDEL MERCADODE VALORES – Other communications
Dear Sir,
On April 18, 2007, IBERDROLA, S.A. (hereinafter “Iberdrola”) reported to that Commission, through a communication filed with registry number 23250, that, as a consequence of the increase of its stake in the share capital of MEDGAZ, S.A. (“Medgaz”) by 8% (hereinafter, the “Acquisition”) the COMISIÓN NACIONAL DE ENERGÍA (hereinafter the “CNE”) had filed three requests to Iberdrola in order for this to apply for the granting of the authorisation of the Acquisition before the CNE, in accordance with the Additional Provision eleventh, Third 1, function fourteenth of the Hidrocarbures Sector Law according to the drafting given to the same by the Royal Law Decree 4/2006, February 24th, by virtue of which the functions of the CNE have been modified (hereinafter “Function 14”), conditioning the effectiveness of the Acquisition to the granting of the aforementioned authorisation. In said communication Iberdrola further reported that the CNE has ordered to initiate an administrative sanctioning proceeding based on the failure to comply with Function 14.
In this respect, Iberdrola hereby informs that, on April 24, 2007, it has had access to the proposal of resolution prepared by the Board of the CNE within the sanctioning proceeding referred to above, in which, for the first time, a mention is made to the reasons for which the CNE considers that the Acquisition is subject to Function 14, as, in its opinion, said Acquisition grants to Iberdrola a “significant influence” in Medgaz.
In this regard, once the CNE has made explicit the reasons for its position, and despite the discrepancy with the same, Iberdrola has considered appropriate to request from the CNE, with subsidiary character, the granting of said administrative authorisation for the case where, notwithstanding the assertions of Iberdrola, the CNE still considers compulsory its granting for the validity of the Acquisition.
IMPORTANT INFORMATION
This communication does not constitute an offer to purchase, sell or exchange or the solicitation of an offer to purchase, sell or exchange any securities. The shares of IBERDROLA S.A. may not be offered or sold in the United States except pursuant to an effective registration statement under theSecurities Act or pursuant to a valid exemption from registration.