Exhibit 99.2 |
Table of Contents 2 Company Overview Company Information 3 Current Period Highlights 4 Company Snapshot and Financial Highlights 6 Financial Information Condensed Consolidated Balance Sheets 7 Condensed Consolidated Statements of Operations 8 Funds From Operations (FFO), Normalized Funds From Operations (Normalized FFO) and Normalized Funds Available for Distribution (Normalized FAD) 9 Net Operating Income and Same Property Data 10 Market Capitalization and Debt Composition 11 Year to Date and Historical Acquisition Activity 12 Portfolio Information Portfolio Key Markets and In House Property Management 13 Portfolio Diversification by Type and Campus Proximity 14 Portfolio Lease Expirations and Historical Occupancy 15 Twenty Largest Tenants 16 Reporting Definitions 17 Certain statements contained in this report constitute forward-looking statements within the meaning of Section 27A of the Securities Act of 1933, as amended, or the Securities Act, and Section 21E of the Securities Exchange Act of 1934, as amended, or the Exchange Act. Such statements include, in particular, statements about our plans, strategies and prospects and estimates regarding future medical office market performance. Such statements are subject to certain risks and uncertainties, as well as known and unknown risks, which could cause actual results to differ materially from those projected or anticipated. Therefore, such statements are not intended to be a guarantee of our performance in future periods. Forward- looking statements are generally identifiable by use of the terms such as “expect,” “project,” “may,” “will,” “should,” “could,” “would,” “intend,” “plan,” “anticipate,” “estimate,” “believe,” “continue,” “predict,” “potential,” “pro forma” or the negative of such terms and other comparable terminology. Readers are cautioned not to place undue reliance on these forward-looking statements. Forward looking statements speak only as of the date made and we do not intend to publicly update or revise any forward-looking statements, whether as a result of new information, future events, or otherwise, except as required by law. Any such forward-looking statements reflect our current views about future events, are subject to unknown risks, uncertainties, and other factors, and are based on a number of assumptions involving judgments with respect to, among other things, future economic, competitive, and market conditions, all of which are difficult or impossible to predict accurately. To the extent that our assumptions differ from actual results, our ability to meet such forward-looking statements, including our ability to generate positive cash flow from operations, provide dividends to stockholders, and maintain the value of our real estate properties, may be significantly hindered. These risks and uncertainties should be considered in evaluating forward-looking statements and undue reliance should not be placed on such statements. Additional information concerning us and our business, including additional factors that could materially affect our financial results, is included herein and in our other filings with the SEC. Forward-Looking Statements: |
3 Senior Management Scott D. Peters Kellie S. Pruitt Chairman, Chief Executive Officer, Chief Financial Officer, Secretary, and President and Treasurer Mark D. Engstrom Amanda L. Houghton Robert A. Milligan Executive Vice President- Executive Vice President- Director of Finance Acquisitions Asset Management Other Information Corporate Headquarters Indianapolis Regional Office Charleston Regional Office 16435 North Scottsdale Road 201 N. Pennsylvania Parkway 463 King Street Suite 320 Suite 201 Suite B Scottsdale, AZ 85254 Indianapolis, IN 46280 Charleston, SC 29403 (480) 998-3478 (317) 550-2800 (843) 623-3751 Transfer Agent Financial Contact Investor Relations DST Systems, Inc. Kellie S. Pruitt Robert A. Milligan 430 West 7th Street Chief Financial Officer Director of Finance Kansas City, MO 64105 16435 North Scottsdale Road 16435 North Scottsdale Road (888) 801-0107 Suite 320 Suite 320 Scottsdale, AZ 85254 Scottsdale, AZ 85254 (480) 258-6637 (480) 998-3478 Email: kelliepruitt@htareit.com Email: robertmilligan@htareit.com Healthcare Trust of America, Inc. is a fully integrated, self-administered and self-managed real estate investment trust. On June 6, 2012, HTA listed its common stock on the New York Stock Exchange (“NYSE”) under the ticker symbol “HTA”. Since its formation in 2006, HTA has invested $2.5 billion in its portfolio comprised of 12.4 million square feet of gross leasable area (“GLA”). HTA’s portfolio is geographically diverse, with properties located in 26 states. With overall portfolio occupancy of ninety-one percent, fifty-six percent of HTA’s annualized base rent comes from credit rated tenants. Ninety-six percent of HTA’s portfolio is strategically located on-campus or aligned with recognized healthcare systems. |
Overview 4 Healthcare Trust of America (HTA), a publicly traded real estate investment trust, is a fully-integrated, leading owner of medical office buildings. HTA continues to take steps to maximize stockholder value and on June 6, 2012, HTA listed its common stock on the New York Stock Exchange (“NYSE”) under the ticker symbol “HTA.” This listing on the NYSE was an important step for HTA which allows HTA to highlight, for the public capital markets and institutional investor community, its $2.5 billion in investments focused on medical office buildings and provides access to the public markets and a lower cost of capital. Current Period Highlights Subsequent Events • Normalized FFO: Increased $6.5 million, or 22.2%, to $35.7 million, or $0.16 per share, as compared to 2011. Normalized FFO excludes listing and transitional costs and represents our ongoing operations as a publicly traded REIT. • Normalized FAD: Increased $5.3 million, or 20.9% to $30.6 million, or $0.13 per share from $25.3 million, or $0.11 per share in 2011. • Normalized FFO Run Rate: Based upon the scheduled closing of the Rush transaction and the completion of the tender offer in the third quarter, combined with our ongoing G&A and interest savings, the run rate for normalized FFO is anticipated to be $0.16 per share on a quarterly basis and $0.64 on an annualized basis. • NOI: Increased by 11.2%, or $5.2 million to $51.5 million from $46.3 million in 2011. Same property cash NOI increased 2.7% compared to 2011. • Revenues: Total revenues increased by 12.0% to $76.3 million as compared to 2011. • Listing Shares on the NYSE: Listed the Company’s Class A common stock on the New York Stock Exchange (“NYSE”) under the symbol “HTA” (the “Listing”). • Balance Sheet: As of June 30, 2012, the Company had total assets of $2.4 billion, cash and cash equivalents of $24.0 million, $575.0 million available on the unsecured revolving credit facility and a leverage ratio of total debt to total capitalization of 27.4%. • Paid down secured debt: The Company utilized proceeds from its $300.0 million unsecured term loan with an interest rate fixed at 2.95% per annum to repay four mortgage notes payable totaling $75.3 million with a weighted average interest rate of 6.0% per annum. • Occupancy & Tenant Retention: The occupancy rate of the Company’s portfolio remains stable at approximately 91% and its tenant retention for the quarter was 83%. • Transitioned Property Management: Transitioned 1.2 million square feet from third party property management companies to our in-house property management platform. • Credit Rated Tenants: Investment grade rated tenants as a percent of annualized base rent was 39% as of June 30, 2012 and 56% of the Company’s annualized base rent derived from tenants that have (or whose parent companies have) a credit rating from a nationally recognized rating agency. • Completed Tender Offer: Completed a $150.0 million tender offer on July 25, 2012 reducing the total outstanding shares to approximately 215 million. • Closed on 7-Year term loan: Closed on a $155.0 million term loan priced at LIBOR plus 200 bps and swapped $50.0 million of the principal to a fixed rate of 3.4% per annum at closing. Should the remaining amount be swapped at the same rate, HTA’s weighted average borrowing cost would be reduced to 4.2% from 5.05% per annum at the end of 2011. • Acquisitions: Entered into an agreement to purchase $54.0 million on-campus Rush MOB by converting existing mortgage note at 2010 cap rates. • Stock Repurchase Plan: Approved a stock repurchase program to purchase up to $100.0 million of the Company’s Class A common stock over a 2-year period. |
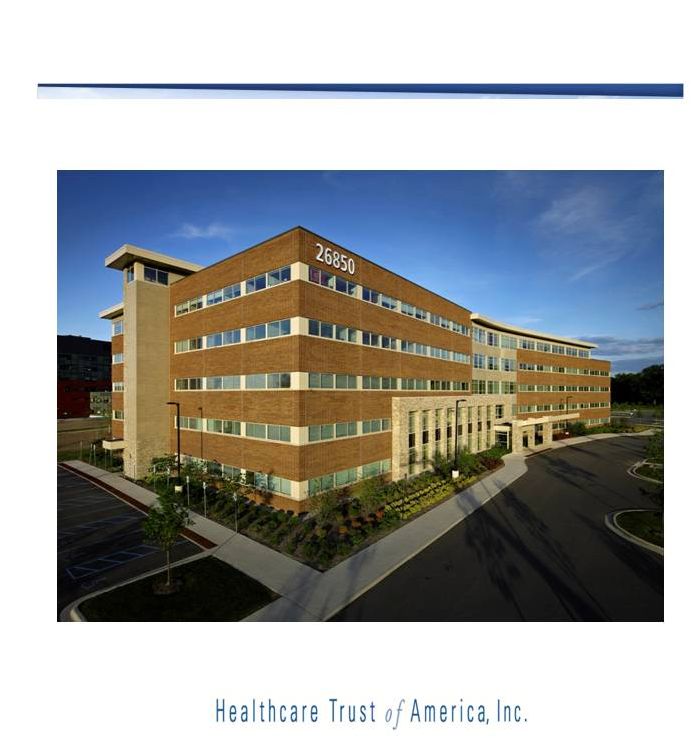
Current Period Highlights (continued) HTA continues to roll out its in house property management platform to additional markets. The Company believes this platform allows it to improve tenant satisfaction and reduce fees. Today approximately 57% of total portfolio GLA is managed by HTA’s in house management platform compared to 31% as of December 31, 2010. 5 Acquisition Activity Value Enhancement Since September 2006, HTA has acquired more than $2.5 billion in properties based on purchase price. The majority of these assets were purchased during 2008, 2009 and 2010 when HTA was raising capital while other real estate investors were focusing internally on their balance sheets as a result of the economic downturn. This unique opportunity allowed HTA to assemble a portfolio that we believe would be difficult to re-create in today’s markets. Since January 1, 2012, HTA has completed three new acquisitions and expanded one of its existing portfolios through the purchase of an additional medical office building for an aggregate purchase price of $214 million. The Company has also announced the pending acquisition of an additional MOB for $54 million. • Rush MOB (Oak Park, IL) - In July 2012, HTA announced it had reached an agreement to purchase the Rush MOB for $54 million. The Rush MOB is a 135 thousand square foot, on-campus medical office building that is 100% leased to Rush University Medical Center (Rated A2). • Steward Health System MOB’s (Boston Area) - In March 2012, HTA announced the acquisition of 13 MOBs totaling approximately 372 thousand square feet, which are 100% leased to Steward Health System. Total purchase price was $100 million. • Penn Ave (Pittsburgh, PA) - In March 2012, HTA acquired an approximately 558 thousand square foot office building aligned with Highmark/West Penn Allegheny Health System (Rated A) for approximately $54 million. • St John Providence MOB (Novi, MI) - In January 2012, HTA acquired an approximately 203 thousand square foot, on-campus medical office building for $51 million. • Camp Creek MOB (Atlanta, GA) - In January 2012, HTA acquired an additional building on our Camp Creek campus for $9 million. |
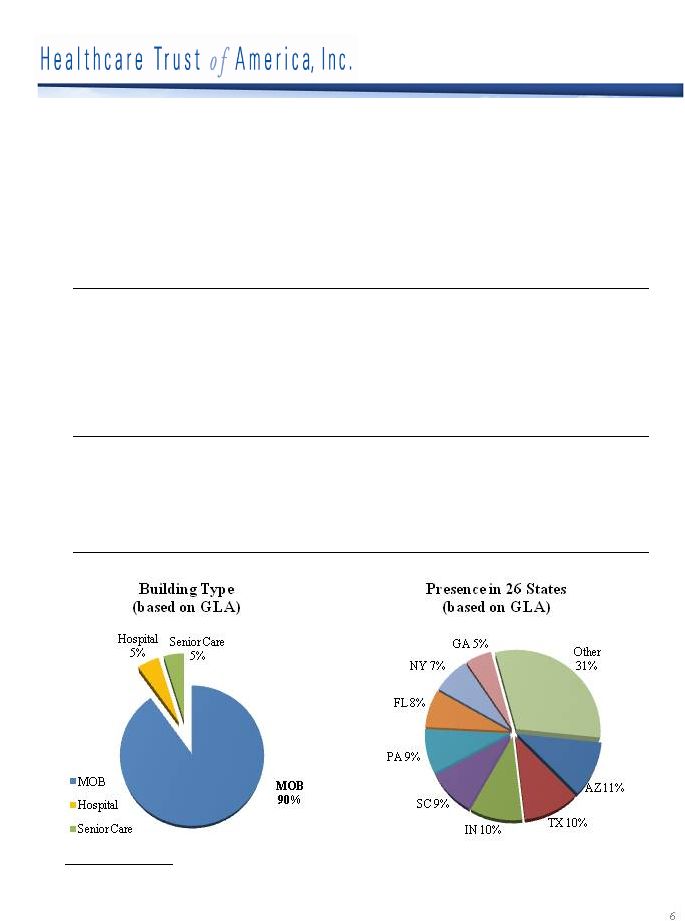
6 Company Snapshot & Financial Highlights as of June 30, 2012 Gross real estate investments (billions) $2.5 Total buildings 264 Occupancy at June 30, 2012 91.0% Portfolio lease renewal rate 83.1% Total portfolio gross leasable area (GLA) (millions) 12.4 Investment grade tenants (based on annualized base rent) 39.3% Credit rated tenants (based on annualized rent) 56.2% % of portfolio on or adjacent to campus/affiliated 95.7% Average remaining lease term for all buildings (years) 6.5 Average remaining lease term for single-tenant buildings (years) 8.0 Average remaining lease term for multi-tenant buildings (years) 5.6 Credit ratings Baa3/BBB- Cash at June 30, 2012 (millions) $24.0 Total debt to undepreciated assets at June 30, 2012 31.3% 4.4% (1) Includes the impact of interest rate derivative swaps. Weighted average interest rate per annum on portfolio debt at June 30, 2012 (1) |
7 Condensed Consolidated Balance Sheets (unaudited and in thousands, except share and per share data) June 30, 2012 December 31, 2011 ASSETS Real estate investments, net 2,001,932 1,806,471 Real estate notes receivable, net 20,000 57,459 Cash and cash equivalents 23,977 69,491 Accounts and other receivables, net 11,297 12,658 Restricted cash and escrow deposits 16,649 16,718 Identified intangible assets, net 295,665 272,390 Other assets, net 67,347 56,442 Total assets 2,436,867 2,291,629 Liabilities: Debt, net 859,318 639,149 Accounts payable and accrued liabilities 59,217 47,801 Derivative financial instruments-interest rate swaps 6,998 1,792 Security deposits, prepaid rent and other liabilities 20,404 19,930 Identified intangible liabilities, net 12,284 11,832 Total liabilities 958,221 720,504 Commitments and Contingencies Redeemable noncontrolling interest of limited partners 3,641 3,785 Stockholders' Equity: Preferred stock, $0.01 par value; 200,000,000 shares authorized; none issued and outstanding - - Common stock, $0.01 par value; 1,000,000,000 shares authorized; 228,491,312 issued and outstanding as of December 31, 2011 - 2,284 Class A common stock, $0.01 par value; 700,000,000 shares - authorized, 57,379,033 issued and outstanding as of June 30, 2012 573 - Class B common stock, $0.01 par value; 300,000,000 shares authorized, 171,845,262 issued and outstanding as of June 30, 2012 1,718 - Additional paid-in capital 2,039,925 2,032,305 Accumulated deficit (567,211) (467,249) Total stockholders' equity 1,475,005 1,567,340 2,436,867 2,291,629 LIABILITIES AND STOCKHOLDERS’ EQUITY $ $ $ $ $ $ $ $ Total liabilities and stockholders’ equity |
8 Condensed Consolidated Statements of Operations (unaudited and in thousands, except per share data) Three Months Ended June 30, Six Months Ended June 30, 2012 2011 2012 2011 Revenue: Rental income $ 74,953 $ 66,426 $ 144,888 $ 135,669 Interest income from mortgage notes receivable and other income 1,308 1,648 2,616 3,297 Total revenue 76,261 68,074 147,504 138,966 Expenses: Rental expenses 24,730 21,724 47,445 45,582 General and administrative expenses 4,908 5,331 10,915 10,668 Acquisition - related expenses 2,970 361 5,292 1,423 Depreciation and amortization 30,964 26,701 58,321 53,451 Listing expenses 12,544 - 12,544 - Non-traded REIT expenses 1,704 1,424 3,847 3,395 Total expenses: 77,820 55,541 138,364 114,519 (Loss) income before other income (expense) (1,559) 12,533 9,140 24,447 Other income (expense): Interest expense (including amortization of deferred financing costs and debt premium/ discount): Interest expense related to debt (10,498) (9,953) (20,731) (19,939) Interest expense related to derivative financial instruments and net change in fair value of derivative financial instruments (5,434) (1,444) (6,234) (1,300) Debt extinguishment costs (1,886) - (1,886) - Interest and dividend income 63 26 91 144 Net (loss) income: $ (19,314) $ 1,162 $ (19,620) $ 3,352 Less: net income (loss) attributable to noncontrolling interest of limited partners (8) 9 (16) (31) Net loss (income) attributable to controlling interest $ (19,322) $ 1,171 $ (19,636) $ 3,321 Net (loss) income per share attributable to controlling interest on distributed and undistributed earnings-basic and diluted $ (0.08) $ 0.01 $ (0.09) $ 0.01 Weighted average number of shares outstanding Basic 229,436 228,341 229,159 221,607 Diluted 229,436 228,801 229,159 222,067 Distributions declared per common share $ 0.17 $ 0.18 $ 0.35 $ 0.36 |
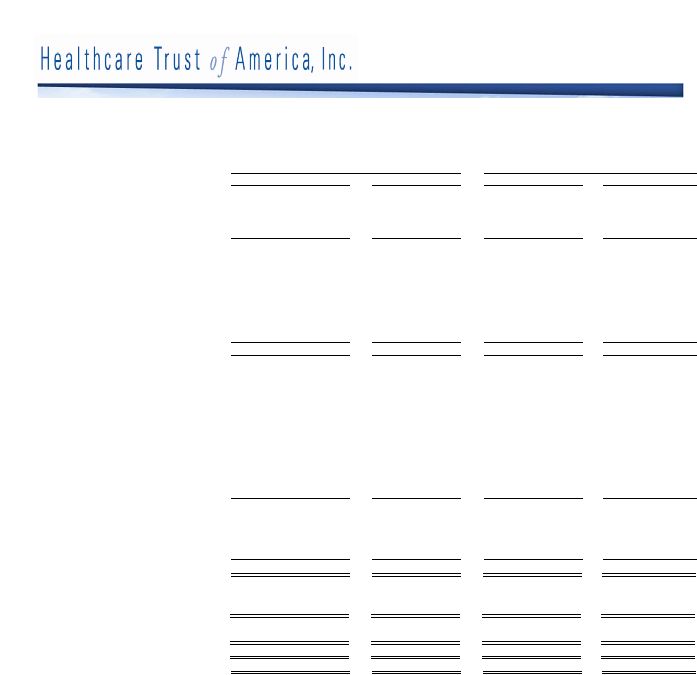
Three Months Ended June 30, Six Months Ended June 30, 2012 2011 2012 2011 Reconciliation of Net (Loss) Income to Funds From Operations (FFO): Net (loss) income (19,314) 1,162 (19,620) 3,352 Depreciation and amortization Funds from operations (FFO) 11,650 27,863 38,701 56,803 Funds from operations (FFO) per share - basic 0.05 0.12 0.17 0.26 Funds from operations (FFO) per share - diluted 0.05 0.12 0.17 0.26 Reconciliation of Funds From Operations (FFO) to Normalized Funds From Operations, excluding non-recurring items: FFO: 11,650 27,863 38,701 56,803 Add (Deduct): Acquisition-related expenses 2,970 361 5,292 1,423 Net change in fair value of derivative financial instruments 4,787 1,078 5,295 574 Listing expenses 12,544 - 12,544 - Transitional expenses 1,704 1,704 Debt extinguishment costs 1,886 - 1,886 - Other normalizing items 135 (111) 200 (1,417) Normalized FFO excluding non-recurring items 35,676 29,191 65,622 57,383 Normalized FFO per share - basic 0.16 0.13 0.29 0.26 Normalized FFO per share - diluted 0.16 0.13 0.29 0.26 Three Months Ended June 30, Six Months Ended June 30, 2012 2011 2012 2011 Reconciliation of Normalized FFO to Normalized Funds Available for Distribution (FAD): Normalized FFO excluding non-recurring items 35,676 29,191 65,622 57,383 Interest and dividend income (63) (26) (91) (144) Non-cash compensation expense (20) 645 982 1,542 Straight-line rent adjustments, net (2,119) (2,131) (4,564) (4,221) Amortization of acquired below- and above-market leases 427 660 1,022 1,338 Deferred revenue - tenant improvement related (106) (157) (266) (574) Amortization of interest rate contracts, loan premiums and prepaid financings 953 707 1,646 1,634 Recurring capital expenditures, tenant improvements and leasing commissions (4,116) (3,561) (5,873) (6,643) Normalized FAD excluding non-recurring items 30,632 25,328 58,478 50,315 Normalized FAD per share - basic 0.13 0.11 0.26 0.23 Normalized FAD per share - diluted 0.13 0.11 0.25 0.23 Weighted average number of shares outstanding Basic 229,436 228,341 229,159 221,607 Diluted 229,614 228,801 229,336 222,067 9 Funds From Operations (FFO), (unaudited and in thousands, except per share data) Normalized Funds From Operations (Normalized FFO) & Normalized Funds Available for Distribution (Normalized FAD) 30,964 26,701 58,321 53,451 $ $ $ $ $ $ $ $ $ $ $ $ $ $ $ $ $ $ $ $ $ $ $ $ $ $ $ $ $ $ $ $ $ $ $ $ $ $ $ $ $ $ $ $ $ $ $ $ |
Net Operating Income and Same Property Data 10 (unaudited and in thousands) Three Months Ended June 30, Six Months Ended June 30, Reconciliation of Net (Loss) income to Net Operating Income (NOI): Net (loss) income $ (19,314) 1,162 $ (19,620) $ 3,352 Add: General and administrative expenses 4,908 5,331 10,915 10,668 Acquisition-related expenses 2,970 361 5,292 1,423 Depreciation and amortization 30,964 26,701 58,321 53,451 Listing expenses 12,544 - 12,544 - Non-traded REIT expenses 1,704 1,424 3,847 3,395 Interest expense and net change in fair value of derivative financial instruments 15,932 11,397 26,965 21,239 Debt extinguishment costs 1,886 - 1,886 - Less: Interest and dividend income 63 26 91 144 Net operating income (NOI): $ 51,531 $ 46,350 $ 100,059 $ 93,384 NOI Growth 11.2% 7.1% Reconciliation of Net Operating Income (NOI) to Cash Net Operating Income (NOI): Net operating income (NOI) $ 51,531 $ 46,350 $ 100,059 $ 93,384 Straight-line rent adjustments, net (2,119) (2,131) (4,564) (4,221) Amortization of acquired below- and above-market leases 427 660 1,022 1,338 Other non-cash and normalizing items 370 (972) 233 (2,767) Cash Net Operating Income (NOI): $ 50,209 $ 43,907 $ 96,750 $ 87,734 Cash NOI Growth 14.4% 10.3% Same Property Net Operating Income Reconciliation Same property cash revenue 63,839 62,939 126,242 127,423 Same property cash expense 20,651 20,880 40,799 42,754 Cash same property net operating income $ 43,188 $ 42,059 $ 85,443 $ 84,669 Cash Same Property NOI Growth 2.7% 0.9% $ 2012 2011 2012 2011 |
11 Market Capitalization & Debt Composition Market Capitalization (unaudited and in thousands) (1) Includes the impact of interest rate derivative swaps. (2) Incorporates all available extension options. (3) All interest rates are per annum rates. (4) The $125,500 secured term loan excludes two 1-year extension options. The $300,000 unsecured term loan excludes a 1-year extension option. Debt Composition (3) Fixed rate Variable Rate Year Debt Rate Debt Rate Total Debt 2012 5.9% $ 38,377 3.7% 2013 31,518 5.8% 125,500 (4) 3.1% 157,018 2014 13,393 6.4% - - 13,393 2015 72,625 4.1% - - 72,625 2016 104,696 6.0% 300,000 (4) 3.0% 404,696 Thereafter 167,336 6.1% - - 167,336 Subtotal/weighted average 5.9% $ 463,877 3.1% Discounts and premiums 2,535 - 2,535 Total $ 463,877 Weighted Average Weighted Average as of June 30, 2012 Amount Interest Rate (1) Maturity in Years (2) Secured Debt 559,318 Fixed Rate Debt $ 395,441 5.9% 4.6 Unsecured Term Loans 300,000 Variable Rate Debt 463,877 3.1% 3.8 Unsecured Credit Facility - Total Debt $ 859,318 4.4% 4.2 Total Debt 859,318 Equity Market Capitalization Stock Price (as of June 29, 2012) 9.92 Shares Outstanding 229,224 Equity Market Capitalization 2,273,899 Total Capitalization 3,133,217 Total Undepreciated Assets 2,748,000 Total Debt / Total Capitalization 27.4% Total Debt / Total Undepreciated Assets 31.3% Total Debt / Annualized Adjusted EBITDA 4.7x $ as of June 30, 2012 $ $ $ $ $ 3,338 $ 392,906 $ 395,441 $ 41,715 $ 856,783 $ 859,318 $ |
12 (1) Includes a net $37,135,000 mortgage loan receivable collateralized by the Rush medical office building, or Rush. We have entered into a put option agreement with the borrower of the loan receivable and in June 2012, the borrower exercised the put option and we effectively became the primary beneficiary of the building. As of June 30, 2012, we have consolidated the operations of Rush and expect to close on the acquisition of Rush for $54,000,000 during the third quarter of 2012. 2012 Acquisition Activity Property Date Property Location Acquired Purchase Price GLA St. John Providence MOB Novi, MI 1/13/2012 $ 51,320,000 203,000 Camp Creek 3 Atlanta, GA 1/31/2012 8,867,000 30,000 Penn Avenue Place Pittsburgh, PA 3/1/2012 54,000,000 558,000 Steward Portfolio Boston, MA 3/29/2012 100,000,000 372,000 Total $ 214,187,000 1,163,000 Historical Acquisition Activity Purchase Price % of Total GLA % of Total 2007 $ 413,150,000 16.2% 2,240,000 18.1% 2008 542,976,000 21.3% 2,916,000 23.5% 2009 455,950,000 17.9% 2,250,000 18.2% 2010 802,148,000 31.5% 3,512,000 28.4% 2011 68,314,000 2.7% 306,000 2.4% 2012 214,187,000 8.4% 1,163,000 9.4% Subtotal $ 2,496,725,000 98.0% 12,387,000 100.0% Mortgage notes receivable (1) 52,135,000 2.0% N/A N/A Total $ 2,548,860,000 100.0% 12,387,000 100.0% |
13 Midwest Indianapolis, IN GLA: 2.4mm SF East Charleston, SC GLA: 6.1mm SF South/ Southwest Scottsdale, AZ GLA: 3.9mm SF Portfolio Key Markets & In House Property Management as of June 30, 2012 In House Property Management & Regional Offices Key Market Concentration Market GLA % of Portfolio Phoenix, AZ 1,152,000 9.3% Pittsburgh, PA 978,000 7.9% Greenville, SC 965,000 7.8% Indianapolis, IN 820,000 6.6% Albany, NY 741,000 6.0% Houston, TX 692,000 5.6% Atlanta, GA 574,000 4.6% Dallas, TX 393,000 3.1% Boston, MA 372,000 3.0% Raleigh, NC 242,000 2.0% Oklahoma City, OK 186,000 1.5% Total key market concentration 7,115,000 57.4% |
14 Portfolio Diversification & Campus Proximity as of June 30, 2012 Portfolio Diversification by Type Campus Proximity # of Buildings GLA % of Total GLA Number of States Medical office buildings: Single-tenant, net lease 71 2,784,000 22.5% 9 Single-tenant, gross lease 4 215,000 1.7% 3 Multi-tenant, net lease 72 3,362,000 27.1% 20 Multi-tenant, gross lease 98 4,804,000 38.8% 15 Other facilities that serve the healthcare industry: Hospitals, single -tenant, net lease 10 641,000 5.2% 4 Seniors housing, single -tenant net lease 9 581,000 4.7% 3 Total 264 12,387,000 100.0% 26 Year-Over-Year Comparison Sequential Quarter Comparison June 30, 2012 June 30, 2011 June 30, 2012 March 31, 2012 On-campus / aligned 95.7% 95.2% 95.7% 95.7% Off-campus 4.3% 4.8% 4.3% 4.3% Total 100.0% 100.0% 100.0% 100.0% |
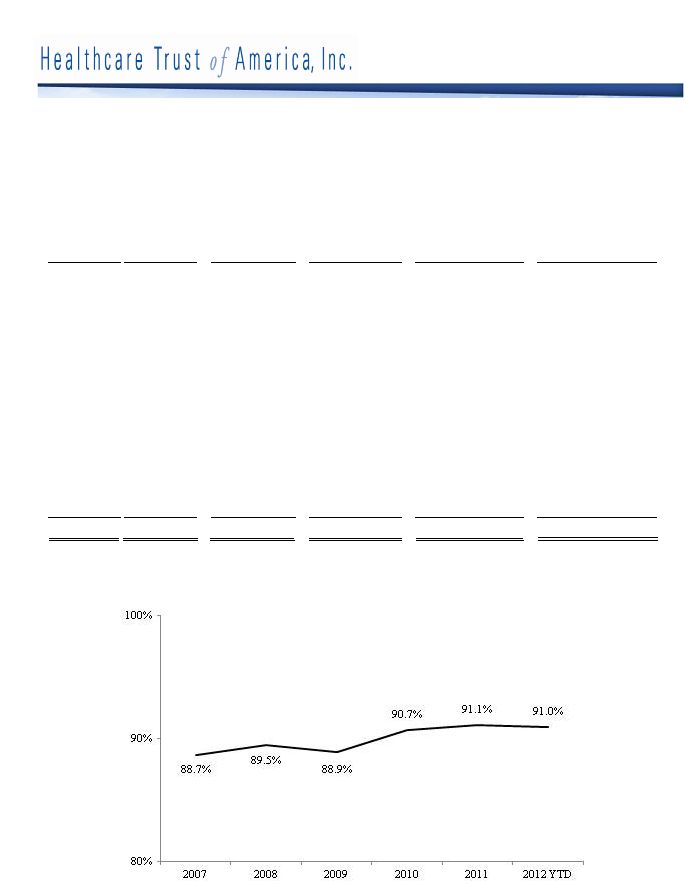
15 Tenant Lease Expirations as of June 30, 2012 Historical Occupancy Percent Percent of Annualized of Total Total Area Base Annualized Number of GLA Represented Rent Under Base Rent Year Ending Leases of Expiring by Expiring Expiring Represented by December 31, Expiring Leases Leases Leases Expiring Leases 2012 231 591,000 5.2% $11,357,000 4.9% 2013 274 1,061,000 9.4% 20,788,000 9.1% 2014 209 964,000 8.6% 16,835,000 7.3% 2015 216 838,000 7.4% 17,490,000 7.6% 2016 188 1,056,000 9.4% 20,608,000 9.0% 2017 192 890,000 7.9% 18,588,000 8.1% 2018 122 757,000 6.7% 15,223,000 6.6% 2019 78 534,000 4.7% 11,681,000 5.1% 2020 80 463,000 4.2% 9,473,000 4.2% 2021 82 969,000 8.6% 17,807,000 7.8% Thereafter 173 3,146,000 27.9% 69,615,000 30.3% Total 1,845 11,269,000 100.0% $229,465,000 100.0% Portfolio Lease Expirations & Historical Occupancy |
16 Number Weighted Average Total Percent of Annualized Percent of of Remaining Credit Leased Leased Base Annualized Tenant Buildings Lease Term Rating GLA GLA Rent Base Rent Greenville Hospital System 16 11 A1 761,000 6.8% $13,297,000 5.8% Highmark 2 9 A 573,000 5.1% 9,148,000 4.0% Steward Health Care System 13 12 NR 372,000 3.3% 7,429,000 3.2% Institute for Senior Living of Florida 3 2 NR 355,000 3.2% 4,633,000 2.0% Aurora Health Care 6 12 A 315,000 2.8% 6,684,000 2.9% Indiana University Health 16 4 A1 309,000 2.7% 5,555,000 2.4% Community Health Systems 7 6 B1 299,000 2.7% 6,459,000 2.8% West Penn Allegheny Health System 2 10 B2 275,000 2.4% 6,227,000 2.7% Kindred Healthcare 4 6 B1 268,000 2.4% 7,581,000 3.3% Deaconess Health System 6 11 NR 264,000 2.3% 3,885,000 1.7% Select Medical Corp 6 10 B 261,000 2.3% 10,420,000 4.5% Banner Health 12 3 AA- 233,000 2.1% 4,943,000 2.2% Hospital Corp of America 7 4 B1 228,000 2.0% 5,019,000 2.2% Cap Dist Phys Health Plan 2 4 NR 200,000 1.8% 3,031,000 1.3% Southwest LTC 4 4 NR 155,000 1.4% 2,817,000 1.2% Catholic Health Partners 7 2 A1 154,000 1.4% 2,267,000 1.0% Wellmont Health System 11 10 BBB+ 152,000 1.3% 2,466,000 1.1% Sisters of Mercy Health System 2 14 Aa3 134,000 1.2% 3,594,000 1.6% US Government 2 9 AA+ 113,000 1.0% 2,760,000 1.2% Ascension Health 3 7 Aa1 112,000 1.0% 2,710,000 1.2% Total 131 5,533,000 49.2% $110,925,000 48.3% Twenty Largest Tenants as of June 30, 2012 |
Acquisition-Related Expenses: Prior to 2009, acquisition-related expenses were capitalized and have historically been added back to FFO over time through depreciation; however, beginning in 2009, acquisition-related expenses related to business combinations are expensed. We believe by excluding expensed acquisition-related expenses, Normalized FFO provides useful supplemental information that is comparable for our real estate investments. Adjusted Earnings Before Interest Taxes, Depreciation and Amortization (Adjusted EBITDA): Is presented on an assumed annualized basis. We define Adjusted EBITDA for HTA as net (loss) income attributable to controlling interest computed in accordance with GAAP plus interest, depreciation, amortization, stock based compensation, change in fair value of derivatives, acquisition expenses, debt extinguishment costs, and listing expenses. We consider Adjusted EBITDA an important measure because it provides additional information to allow management, investors, and our current and potential creditors to evaluate and compare our core operating results and our ability to service debt. The following is a reconciliation of our net income (loss) attributable to controlling interest, the most directly comparable GAAP financial measure, to Adjusted EBITDA. Annualized Base Rent: Annualized base rent is calculated by multiplying contractual base rent for June 2012 by 12 (but excluding the impact of renewals, future step-ups in rent, abatements, concessions, and straight-line rent). Credit Ratings: Credit ratings of our tenants or their parent companies. Funds from Operations (FFO): We define FFO, a non-GAAP measure, as net income or loss computed in accordance with GAAP, excluding gains or losses from sales of property and impairment write downs of depreciable assets, plus depreciation and amortization, and after adjustments for unconsolidated partnerships and joint ventures. We present FFO because we consider it an important supplemental measure of our operating performance and believe it is frequently used by securities analysts, investors and other interested parties in the evaluation of REITs, many of which present FFO when reporting their results. FFO is intended to exclude GAAP historical cost depreciation and amortization of real estate and related assets, which assumes that the value of real estate diminishes ratably over time. Historically, however, real estate values have risen or fallen with market conditions. Because FFO excludes depreciation and amortization unique to real estate, gains and losses from property dispositions and extraordinary items, it provides a performance measure that, when compared year over year, reflects the impact to operations from trends in occupancy rates, rental rates, operating costs, development activities and interest costs, providing perspective not immediately apparent from net income. We compute FFO in accordance with the current standards established by the Board of Governors of the National Association of Real Estate Investment Trusts, or NAREIT, which may differ from the methodology for calculating FFO utilized by other equity REITs and, accordingly, may not be comparable to such other REITs. The NAREIT reporting guidance directs companies, for the computation of NAREIT FFO, to exclude impairments of depreciable real estate and impairments to investments in affiliates when write-downs are driven by measurable decreases in the fair value of depreciable real estate held by the affiliate. FFO does not represent amounts available for management's discretionary use because of needed capital replacement or expansion, debt service obligations or other commitments and uncertainties. FFO should not be considered as an alternative to net income (computed in accordance with GAAP) as an indicator of our financial performance or to cash flow from operating activities (computed in accordance with GAAP) as an indicator of our liquidity, nor is it indicative of funds available to fund our cash needs, including our ability to pay distributions. 17 Reporting Definitions Three Months Ended June 30, 2012 Adjusted EBITDA: Net (loss) income attributable to controlling interest (19,322) Add: Depreciation and amortization 30,964 Interest expense, net 15,869 EBITDA 27,511 Acquisition -related expenses 2,970 Debt extinguishment costs 1,886 Listing expenses 12,544 Stock based compensation 505 Adjusted EBITDA 45,416 Adjusted EBITDA Annualized 181,664 $ $ $ $ |
Gross Leasable Area (GLA): Gross leasable area (in square feet). Gross Real Estate Investments: Based on acquisition price and includes two portfolios of real estate notes receivable. Net Operating Income (NOI): NOI is a non-GAAP financial measure that is defined as net income or loss, computed in accordance with GAAP, generated from HTA’s total portfolio of properties before general and administrative expenses, acquisition-related expenses, depreciation and amortization, listing expenses, non-traded REIT expenses, interest expense and net change in the fair value of derivative financial instruments, debt extinguishment costs and interest and dividend income. HTA believes that NOI provides an accurate measure of the operating performance of its operating assets because NOI excludes certain items that are not associated with management of the properties. Additionally, HTA believes that NOI is a widely accepted measure of comparative operating performance in the real estate community. However, HTA’s use of the term NOI may not be comparable to that of other real estate companies as they may have different methodologies for computing this amount. Net Operating Income (NOI) (Cash): NOI (Cash) is a non-GAAP financial measure that is defined as NOI excluding GAAP revenue items including straight line rent and adjustments recorded to reflect above and below market leases. We believe that NOI (Cash) provides an accurate measure of the operating performance of our operating assets because NOI (Cash) excludes certain items that are not associated with management of the properties. Additionally, we believe that NOI (Cash) is a widely accepted measure of comparative operating performance in the real estate community. However, our use of the term NOI (Cash) may not be comparable to that of other real estate companies as they may have different methodologies for computing this amount. Normalized Funds Available for Distribution (Normalized FAD): We define Normalized FAD as Normalized FFO excluding the impact of the following: amortization of acquired above/below market lease intangibles; amortization of deferred compensation expense; amortization of deferred financing costs; straight-line rents; and deferred revenues. Further, Normalized FAD is computed after deducting recurring capital expenditures. Other REITs or real estate companies may use different methodologies for calculating Normalized FAD, and accordingly, our Normalized FAD may not be comparable to those reported by other REITs. Although our Normalized FAD computation may not be comparable to that of other REITs, management believes Normalized FAD provides a meaningful supplemental measure of our ability to fund its ongoing dividend payments. In addition, management believes that in order to further understand and analyze our liquidity, Normalized FAD should be compared with cash flows as determined in accordance with GAAP and presented in its consolidated financial statements. Normalized FAD does not represent cash generated from operating activities determined in accordance with GAAP, and Normalized FAD should not be considered as an alternative to net income (determined in accordance with GAAP) as an indication of our performance, as an alternative to net cash flows from operating activities (determined in accordance with GAAP), or as a measure of our liquidity. Normalized Funds from Operations (Normalized FFO): Changes in the accounting and reporting rules under GAAP have prompted a significant increase in the amount of non-operating items included in FFO, as defined. Therefore, we use normalized funds from operations, or Normalized FFO, which excludes from FFO acquisition-related expenses, net change in fair value of derivative financial instruments, listing expenses, transitional expenses, debt extinguishment costs, other normalizing items, the write-off of unamortized deferred financing costs or prepayment penalties and lease termination revenue . Normalized FFO should not be considered as an alternative to net income or to cash flows from operating activities and is not intended to be used as a liquidity measure indicative of cash flow available to fund our cash needs, including our ability to make distributions. Normalized FFO should be reviewed in connection with other GAAP measurements. Occupancy: Occupancy represents the percentage of total gross leasable area that is leased and occupied, including month-to- month leases and leases signed but not yet commenced, as of the date reported. Off-Campus: A building or portfolio that is not located on or adjacent to key hospital based-campuses and is not aligned with recognized healthcare systems. 18 Reporting Definitions (continued) |
On-Campus / Health System Aligned: On-campus refers to refer to a property that is located on or adjacent to (within ¼ mile) a healthcare system. Aligned refers to a property that is not on the campus of a healthcare system and located greater than ¼ mile from such a campus, but leased 50% or more to a healthcare system. Recurring Capital Expenditures, Tenant Improvements, Leasing Commissions: Represents amounts paid for 1) recurring capital expenditures required to maintain and re-tenant our properties, 2) second generation tenant improvements, and 3) leasing commissions paid to third party leasing agents to secure new tenants. Retention: Tenant Renewal Ratio is defined as the sum of the total GLA of tenants that renew an expiring lease over the total GLA of expiring leases. Same Property Cash Net Operating Income: To facilitate a comparison of NOI between periods, we calculate comparable amounts for a subset of our owned properties referred to as our “same properties.” Same property amounts are calculated as the amounts attributable to properties which have been owned and operated by us, and reported in our consolidated results, during the entire span of both periods compared. Therefore, any properties either acquired after the first day of the earlier comparison period or sold, contributed or otherwise removed from our consolidated financial statements before the last day of the later comparison period are excluded from same properties. 19 Reporting Definitions (continued) |
St. John Providence MOB Novi, MI |