
JULY 2013 Healthcare Trust of America, Inc. (HTA) Annual Meeting

Leading owner of Medical Office Buildings FORWARD LOOKING STATEMENTS This document contains both historical and forward‐looking statements. Forward‐looking statements are based on current expectations, plans, estimates, assumptions and beliefs, including expectations, plans, estimates, assumptions and beliefs about our company, the real estate industry and the debt and equity capital markets. All statements other than statements of historical fact are, or may be deemed to be, forward‐looking statements within the meaning of Section 27A of the Securities Act of 1933, as amended, and Section 21E of the Securities Exchange Act of 1934, as amended. Forward‐looking statements include information concerning possible or assumed future results of operations of our company. The forward‐looking statements included in this document are subject to numerous risks and uncertainties that could cause actual results to differ materially from those expressed or implied in the forward‐looking statements. Assumptions relating to the foregoing involve judgments with respect to, among other things, future economic, competitive and market conditions and future business decisions, all of which are difficult or impossible to predict accurately and many of which are beyond our control. Although we believe that the expectations reflected in such forward‐looking statements are based on reasonable assumptions, our actual results and performance could differ materially from those set forth in the forward‐looking statements. Factors which could have a material adverse effect on our operations and future prospects include, but are not limited to: changes in economic conditions affecting the healthcare property sector, the commercial real estate market and the credit market; competition for acquisition of medical office buildings and other facilities that serve the healthcare industry; economic fluctuations in certain states in which our property investments are geographically concentrated; retention of our senior management team; financial stability and solvency of our tenants; supply and demand for operating properties in the market areas in which we operate; our ability to acquire properties, and to successfully operate those properties once acquired; changes in property taxes; legislative and regulatory changes, including changes to laws governing the taxation of REITs and changes to laws governing the healthcare industry; fluctuations in reimbursements from third party payors such as Medicare and Medicaid; changes in interest rates; the availability of capital and financing; restrictive covenants in our credit facilities; changes in our credit ratings; our ability to remain qualified as a REIT; and the risk factors set forth in our 2012 Annual Report on Form 10‐K and our quarterly report on Form 10‐Q for the quarter ended March 31, 2013. Forward‐looking statements speak only as of the date made. Except as otherwise required by the federal securities laws, we undertake no obligation to update any forward‐looking statements to reflect the events or circumstances arising after the date as of which they are made. As a result of these risks and uncertainties, readers are cautioned not to place undue reliance on the forward looking statements included in this document or that may be made elsewhere from time to time by, or on behalf of, us. For definitions of terms and reconciliations for certain financial measures disclosed herein, including, but not limited to, funds from operations (FFO), normalized funds from operations (normalized FFO), funds available for distribution (FAD), normalized funds available for distribution (normalized FAD), annualized base rents, net operating income (NOI), cash net operating income (cash NOI), same‐property cash NOI, adjusted earnings before interest, taxes, depreciation and amortization (adjusted EBITDA), on‐campus/aligned, and tenant retention, please see our company’s earnings press release issued on May 7, 2013 and our company’s Supplemental Financial Package for the quarter ended March 31, 2013, each of which is available in the investor relations section of our company’s website located at www.htareit.com. 1

Leading owner of Medical Office Buildings HTA – Year in Review • Listed on the New York Stock Exchange in June 2012 o First to list on the NYSE without raising equity o No shareholder dilution at unattractive price o 75% of original shares are now eligible to trade • Expanded shareholder base and offered liquidity o Significant investor outreach to institutional investors o Added to multiple indexes including the MSCI US REIT Index (RMZ) and the Russell 1000 o Coverage by 7 equity analysts from leading research firms • Leading owner of Medical Office Building s (MOBs) o Completed internal asset management platform ‐ 87% of GLA1 o Achieved same store growth of 3%+ over last 2 quarters o 15% asset expansion ‐ Acquired $383mm in high quality, on‐ campus medical office buildings in 2012/ 1Q13 • Competitive access to capital – strong balance sheet o Implemented equity ATM program – raising capital at NAV premiums o Issued first 10 year public bond ‐ $300mm at 3.7% coupon o Conservative leverage ‐ 30.1% of total capitalization1 21 As of 3/31/2013

Leading owner of Medical Office Buildings Investor Returns • Total return of 76% from Jan 1, 2007 to July 3, 2013 ($11.001), inclusive of fees • Annualized Return of 9.1% over that time period • Significantly outperformed the S&P 500 and MSCI US REIT Index (RMS) • Dividend currently at $0.575/ share on an annualized basis 3 ‐75% ‐50% ‐25% 0% 25% 50% 75% 100% 125% 2007 2008 2009 2010 2011 2012 2013 HTA Total Returns HTA MSCI US REIT (RMS) S&P 500 1 Based on an assumed post‐closing price of $11.00 at 7/3/2013

Leading owner of Medical Office Buildings Shareholder Base 4 Locked Shares Locked Shares At Listing – June 6, 2012 June 30, 2013 Retail: 100% Retail: 55% Institutional: 45%1 Free Float Free Float Top Holders1 Institutional Investor Shares The Vanguard Group 10,483,152 Cohen & Steers Capital Mgmt 9,440,186 CBRE Clarion Securities 2,557,000 Visium Asset Mgmt 2,308,112 Invesco Advisers 1,807,857 Goldman Sachs Asset Mgmt 1,479,787 Renaissance Technologies 1,439,744 BlackRock Fund Advisors 1,178,674 Adelante Capital Mgmt 1,064,484 D.E. Shaw & Company 853,451 1 Institutional holders based on 13‐F filings and free float as of 3/31/13 2 As of 4/19/2013, select retail holders based on custodian of record at 4/19/2013 3 Director and Executive Officer ownership includes beneficial ownership of vested LTIP units as of 4/19/2013, as outlined in HTA’s proxy statement dated 4/30/2013. HTA Executive Team and HTA Directors exclude Chairman and CEO Scott D. Peters Retail / Insider Investor2 Shares LPL Financial 33,544,256 Charles Schwab 7,128,699 TD Ameritrade 6,202,711 Stern Agee 2,018,537 HTA CEO ‐ Scott D. Peters3 1,570,283 HTA Executive Team3 873,591 HTA Directors3 778,553

1 As of 7/3/2013 2 Total Capitalization as of 3/31/2013. Refer to HTA’s Q1 2013 Supplemental for additional information 3 1Q13 EBITDA is presented on an assumed annualized basis as if 1Q13acquisitions closed on 1/1/13. The assumed annualized number may exceed actual results Company Summary Portfolio Metrics Balance Sheet Strength $3.5 Billion Estimated Enterprise Value1 $2.7 Billion of Invested Assets 12.8 Million Sq Ft of GLA 91% Occupancy 96% On Campus / Aligned with Major Healthcare Systems 58% of Base Rent from Credit Rated Tenants 87% of Properties Managed Internally Investment Grade Credit Ratings 30.1% Debt to Total Capitalization2 5.4x Debt to 1Q13 Annualized EBITDA3 $650 Million Unsecured Revolving Line of Credit Available $755 Million Unsecured Long Term Debt Limited Debt Maturities through 2016 Balance Sheet Flexibility with $771 million of available liquidity 5

Leading owner of Medical Office Buildings Company HTA –MOB Specialist Positioned for the Future • Dedicated MOB operator • Core critical locations – barriers to entry • Fortress balance sheet • Investment grade • Leverage: 30%1 • Stability: 91% Occupied • Dividend Yield: 5.2%2 Growth Sector Tailwinds • Occupancy: 91% ‐ 94% • Potential for market rent growth • Institutional asset management • Targeted acquisitions = meaningful growth • Liquidity of $771mm • $500mm+ runway to 40% leverage • Affordable Care Act • Healthcare GDP growth • Healthcare employment trends 6 1 Total debt to total capitalization as of 3/31/13 2 Yield as of the closing price at 7/3/13
Medical Office Tailwinds 7 • Affordable Care Act • Healthcare Employment is Strong • Healthcare Expenditures Increasing • Increasing Outpatient Care • Aging Population • Constrained Market Rents • Fragmented • Limited New Supply

$0 $1 $2 $3 $4 $5 Trillions Healthcare Expenditures and Employment 8 Strong Healthcare Employment ProjectedAnnual Healthcare Expenditures Sources: Centers for Medicare & Medicaid Services, Bureau of Labor Statistics, Rosen Consulting Group • Healthcare was the only major sector with employment growth over last 5 years • Healthcare employment is projected to grow 70% faster than overall U.S. employment through 2020 • Increasing demand for non‐physician practitioners (nurses, technicians, etc.) • Healthcare expenditures projected to grow at a 5.5% CAGR through 2020 • Healthcare projected to account for ~20% of GDP by 2020 • Increasing expenditures and technology are pushing patients to lower cost settings 33% 30% 26% 26% 26% 24% 14% 0% 10% 20% 30% 40% Therapists Physician Assistants Registered Nurses Healthcare Techs Total Healthcare Physicians and Surgeons All Occupations ‐ Total U.S. Projected U.S. Employment Growth (2010‐2020 Est)
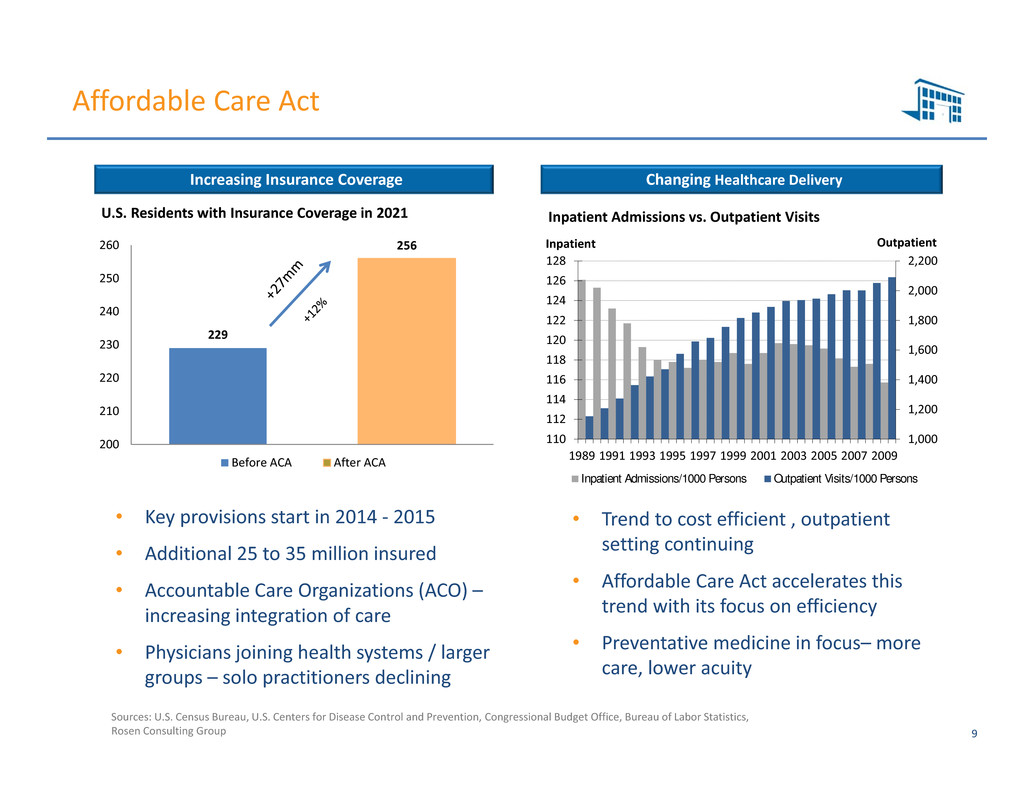
Affordable Care Act 9 Changing Healthcare DeliveryIncreasing Insurance Coverage Sources: U.S. Census Bureau, U.S. Centers for Disease Control and Prevention, Congressional Budget Office, Bureau of Labor Statistics, Rosen Consulting Group 229 256 200 210 220 230 240 250 260 '21Before ACA After ACA U.S. Residents with Insurance Coverage in 2021 • Key provisions start in 2014 ‐ 2015 • Additional 25 to 35 million insured • Accountable Care Organizations (ACO) – increasing integration of care • Physicians joining health systems / larger groups – solo practitioners declining 1,000 1,200 1,400 1,600 1,800 2,000 2,200 110 112 114 116 118 120 122 124 126 128 1989 1991 1993 1995 1997 1999 2001 2003 2005 2007 2009 OutpatientInpatient Inpatient Admissions vs. Outpatient Visits Inpatient Admissions/1000 Persons Outpatient Visits/1000 Persons • Trend to cost efficient , outpatient setting continuing • Affordable Care Act accelerates this trend with its focus on efficiency • Preventative medicine in focus– more care, lower acuity
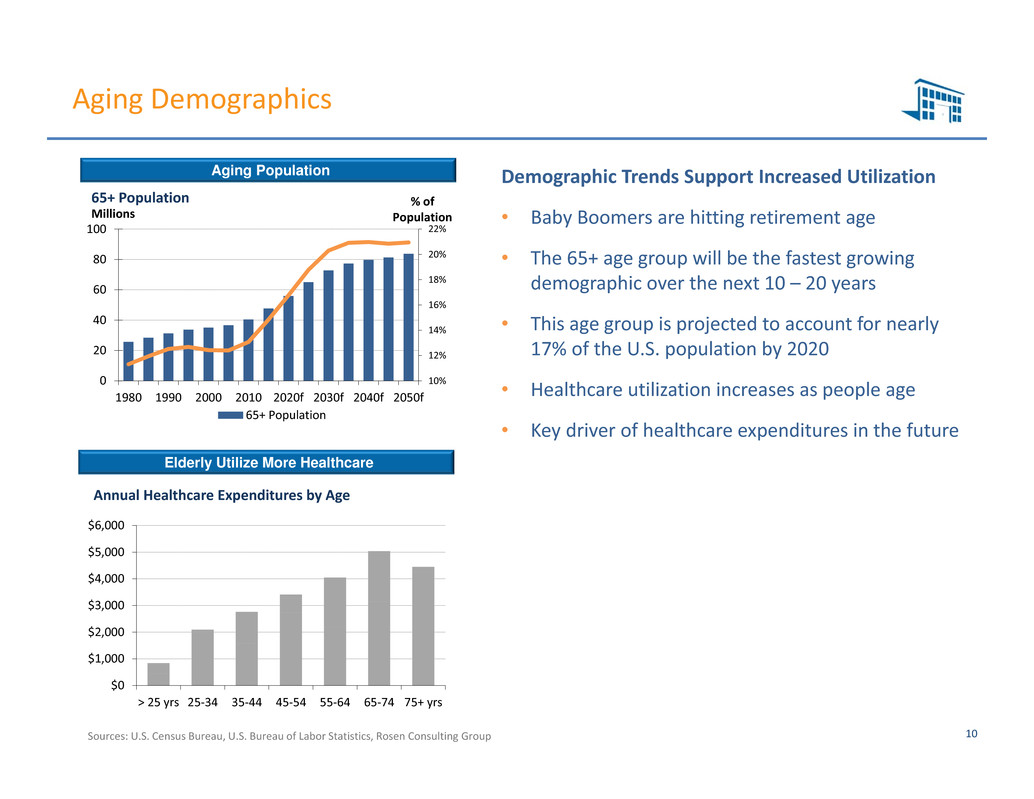
Aging Demographics 10 Demographic Trends Support Increased Utilization • Baby Boomers are hitting retirement age • The 65+ age group will be the fastest growing demographic over the next 10 – 20 years • This age group is projected to account for nearly 17% of the U.S. population by 2020 • Healthcare utilization increases as people age • Key driver of healthcare expenditures in the future Elderly Utilize More Healthcare Aging Population Sources: U.S. Census Bureau, U.S. Bureau of Labor Statistics, Rosen Consulting Group $0 $1,000 $2,000 $3,000 $4,000 $5,000 $6,000 > 25 yrs 25‐34 35‐44 45‐54 55‐64 65‐74 75+ yrs Annual Healthcare Expenditures by Age 10% 12% 14% 16% 18% 20% 22% 0 20 40 60 80 100 1980 1990 2000 2010 2020f 2030f 2040f 2050f % of PopulationMillions 65+ Population 65+ Population
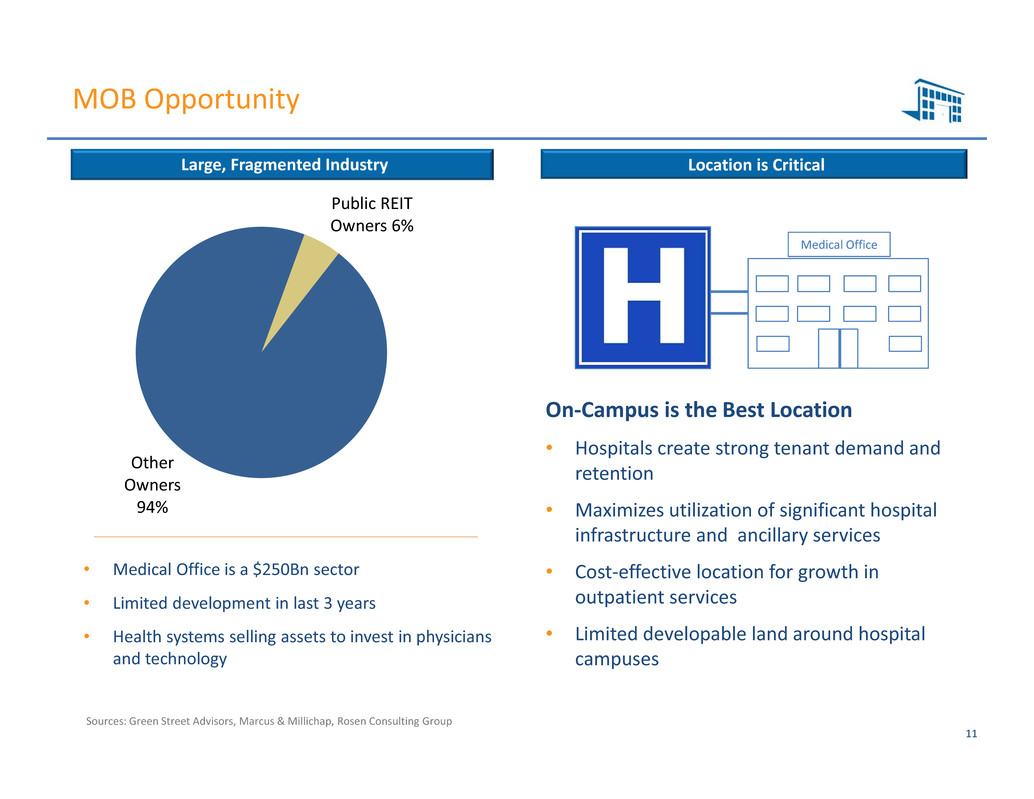
MOB Opportunity Sources: Green Street Advisors, Marcus & Millichap, Rosen Consulting Group 11 Public REIT Owners 6% Other Owners 94% Large, Fragmented Industry On‐Campus is the Best Location • Hospitals create strong tenant demand and retention • Maximizes utilization of significant hospital infrastructure and ancillary services • Cost‐effective location for growth in outpatient services • Limited developable land around hospital campuses • Medical Office is a $250Bn sector • Limited development in last 3 years • Health systems selling assets to invest in physicians and technology Location is Critical Medical Office

MOB Supply and Demand Sources: Marcus & Millichap, Rosen Consulting Group 12 Limited New Supply • Rental rates are still below 2008 levels • Rates are now experiencing positive growth • Supply and demand could have favorable impact on rates in the future • Barriers to entry for On‐Campus MOBs • Recovery in traditional office could positively impact tenant comparisons Constrained Rents 0 5 10 15 20 25 30 2008 2009 2010 2011 2012e SF, Millions Medical Office Construction Completions ‐4% ‐3% ‐2% ‐1% 0% 1% 2% 3% 4% 5% 6% $20 $21 $22 $23 $24 $25 $26 $27 2008 2009 2010 2011 2012e 2013f 2014f 2015f 2016f Annual Growth$/SF per Year Medical Office Asking Rental Rate Rental Rate YoY Rent Growth • Medical office development has declined by 70% since 2008 • Near term development is expected to remain limited • Limited new supply, despite expected increase in healthcare utilization
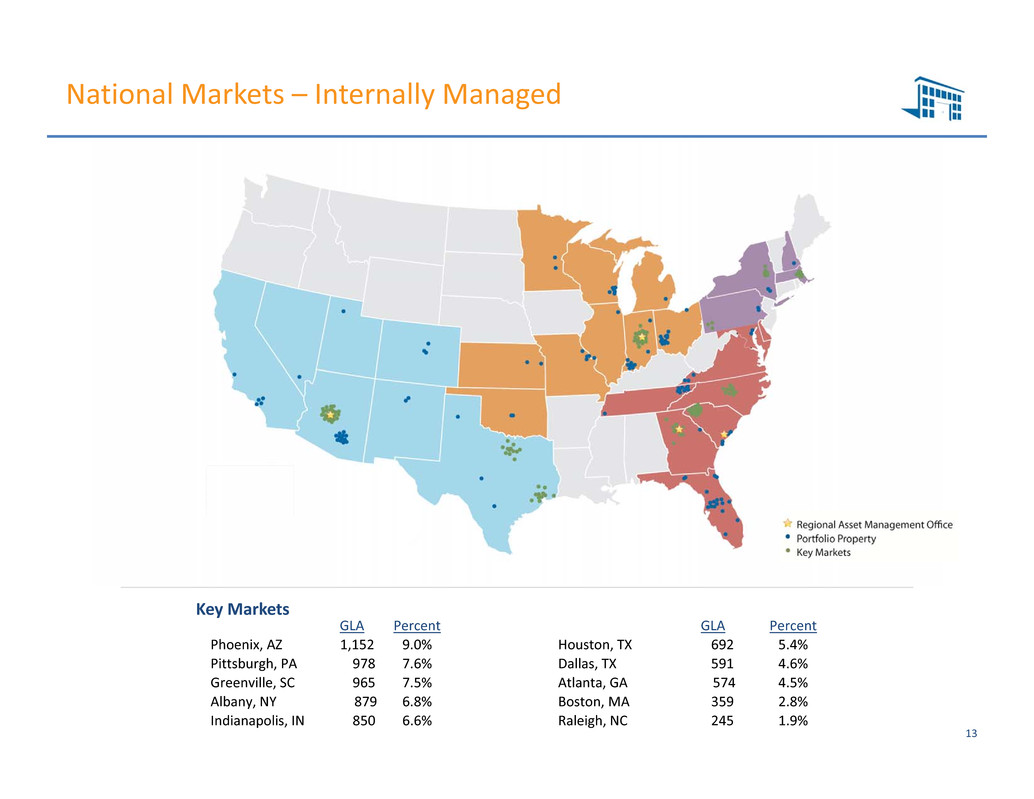
Leading owner of Medical Office Buildings National Markets – Internally Managed 13 GLA Percent GLA Percent Phoenix, AZ 1,152 9.0% Houston, TX 692 5.4% Pittsburgh, PA 978 7.6% Dallas, TX 591 4.6% Greenville, SC 965 7.5% Atlanta, GA 574 4.5% Albany, NY 879 6.8% Boston, MA 359 2.8% Indianapolis, IN 850 6.6% Raleigh, NC 245 1.9% Key Markets
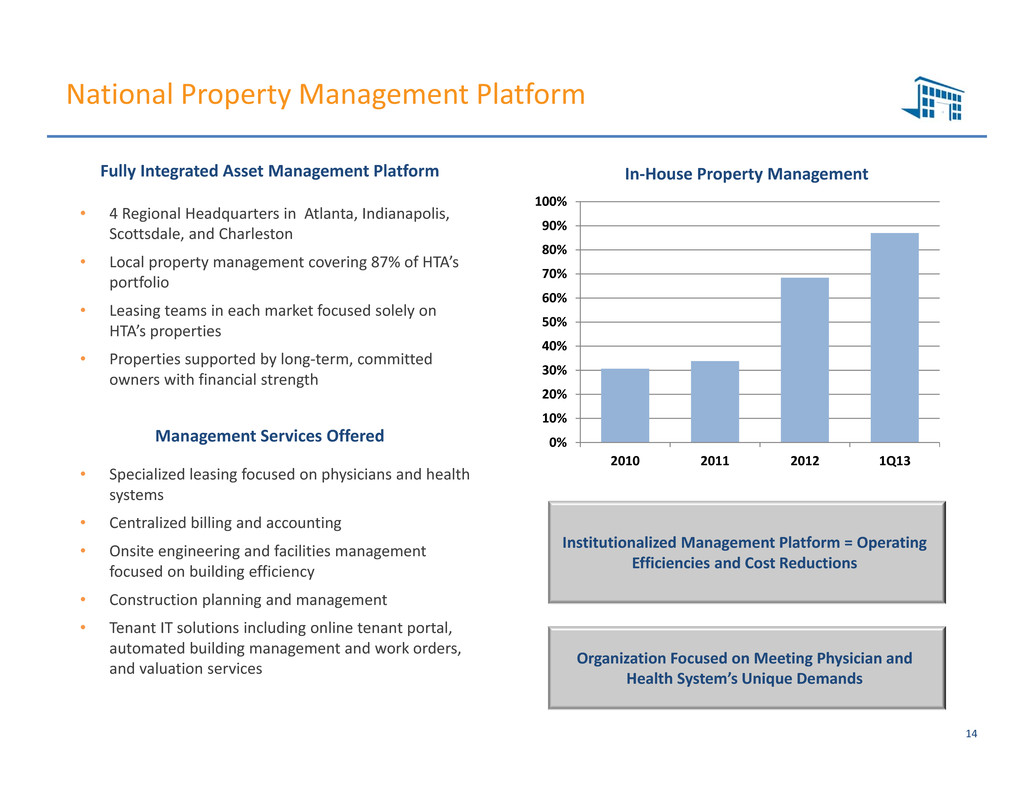
Leading owner of Medical Office Buildings In‐House Property ManagementFully Integrated Asset Management Platform National Property Management Platform • 4 Regional Headquarters in Atlanta, Indianapolis, Scottsdale, and Charleston • Local property management covering 87% of HTA’s portfolio • Leasing teams in each market focused solely on HTA’s properties • Properties supported by long‐term, committed owners with financial strength 14 Organization Focused on Meeting Physician and Health System’s Unique Demands Institutionalized Management Platform = Operating Efficiencies and Cost Reductions 0% 10% 20% 30% 40% 50% 60% 70% 80% 90% 100% 2010 2011 2012 1Q13 Management Services Offered • Specialized leasing focused on physicians and health systems • Centralized billing and accounting • Onsite engineering and facilities management focused on building efficiency • Construction planning and management • Tenant IT solutions including online tenant portal, automated building management and work orders, and valuation services

Portfolio Characteristics 15 Healthcare System Relationships Tenant Mix (by Annual Base Rent) 58% 42% Credit Tenants Not Rated • Strong mix of single and multi‐tenant buildings • Multi‐tenanted buildings have weighted average remaining lease term of 5.5 years; mix of Gross and NNN leases • Single‐tenanted buildings have weighted average remaining lease term of 8.9 years; predominantly NNN leases 66% 34% Multi‐ Tenant Single Tenant • 58% credit‐rated tenants (mainly larger heath systems) • 42% investment grade • 42% non‐rated tenants (mainly independent physicians) Building Mix (by GLA)

Leading owner of Medical Office Buildings • HTA has developed and maintains extensive industry relationships • Dedicated buyer focused only on MOB space • Acquired $1.8 Bn of properties in 2008 ‐ 2010 o HTA was a cash buyer during the economic recession o Limited competition o Attractive pricing • Developers and Health Systems are primary source of acquisition opportunities o ~70% of transactions1 2009‐present sourced through these relationships Acquisition Sourcing Acquisition Strategy 16 1 Transactions measured by acquisition price Acquisition Criteria • On‐Campus MOBs – core, critical real estate • Affiliated with dominant health system • Significant ongoing investment by health system in the adjacent campus • Ability to service with HTA’s in‐house property management platform • Stabilized occupancy • Generally $25 to $75 million in size – meaningful to HTA • Accretive to cost of capital

Leading owner of Medical Office Buildings No Takeover Limits – HTA’s Board is committed to pursuing shareholder’s best interest in a takeover situation. To that end, HTA does not have any stockholder rights plans (poison pill) and has opted out of Maryland anti‐takeover provisions1 Shareholder Focus 17 Strong Corporate Governance Annual election of all board members – no staggered board Independent directors ‐ 5 of 6 independent directors, all have served continuously for last 5 years 1 Includes Maryland Law “Business and Combination Provision” (Section 3‐602) and “Control Share Acquisition” (Sections 3‐701 through 3‐710) Board / Executive Investment – Board and insiders have purchased 169,500 shares since listing on June 6, 2012 Proactive Governance – Directors have taken shareholder friendly actions including (i) moving to self management in 2009 and (ii) eliminating the internalization fee
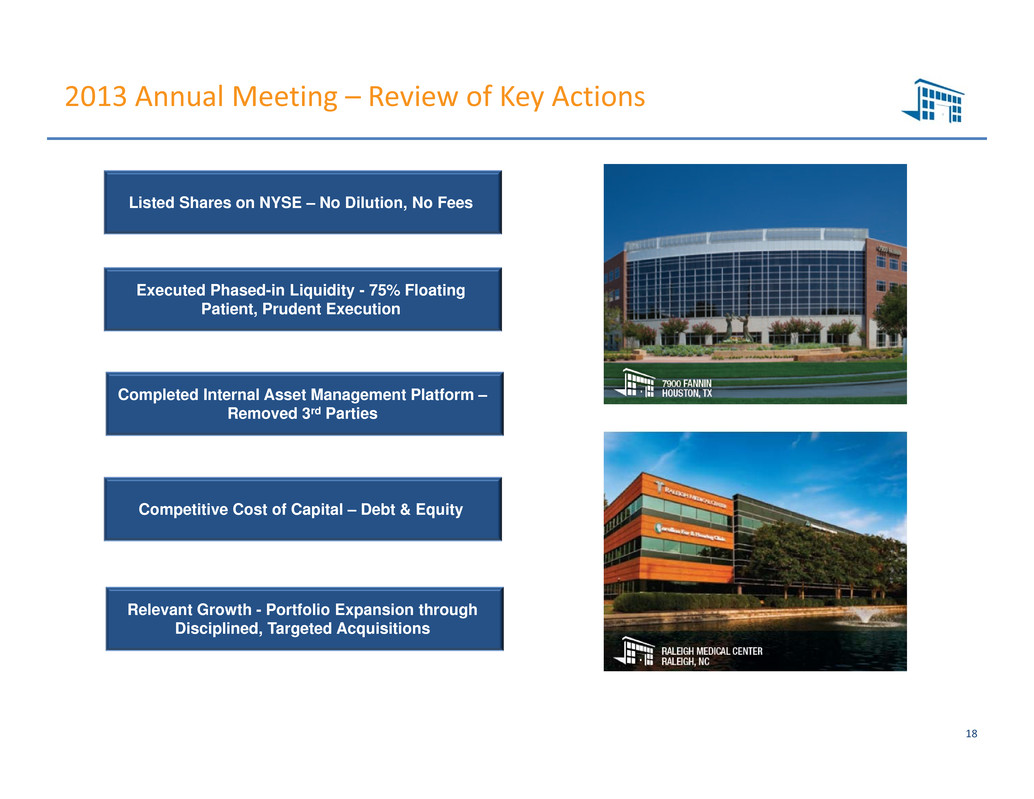
2013 Annual Meeting – Review of Key Actions Listed Shares on NYSE – No Dilution, No Fees Completed Internal Asset Management Platform – Removed 3rd Parties Competitive Cost of Capital – Debt & Equity Executed Phased-in Liquidity - 75% Floating Patient, Prudent Execution 18 Relevant Growth - Portfolio Expansion through Disciplined, Targeted Acquisitions