| | |
| 3Q2022 |
| Supplemental Information |
| FURNISHED AS OF NOVEMBER 9, 2022 - UNAUDITED |
|
|
| | |
| FORWARD LOOKING STATEMENTS & RISK FACTORS |
|
This Supplemental Information report contains disclosures that are “forward-looking statements” as defined in Section 27A of the Securities Act of 1933, as amended, and Section 21E of the Securities Exchange Act of 1934, as amended. Forward-looking statements include all statements that do not relate solely to historical or current facts and can be identified by the use of words and phrases such as “can,” “may,” “payable,” “indicative,” "predictive," “annualized,” “expect,” “expected,” “range of expectations,” "would have been," "budget," and other comparable terms in this report, and include, but are not limited to, statements related to the merger between Healthcare Realty Trust Incorporated (“Legacy HR” and, after the closing of the merger, the “Company”) and Healthcare Trust of America, Inc. (“Legacy HTA”) that closed on July 20, 2022 (the “Merger”). These forward-looking statements are made as of the date of this report and are not guarantees of future performance. These statements are based on the current plans and expectations of Company management and are subject to a number of unknown risks, uncertainties, assumptions and other factors that could cause actual results to differ materially from those described in this release or implied by such forward-looking statements. Such risks and uncertainties include, among other things, the following: risks related to the Merger diverting the attention the Company's management from ongoing business operations; failure to realize the expected benefits of the Merger; the risk that the Company’s and Legacy HTA’s respective businesses will not be integrated successfully or that such integration may be more difficult, time-consuming or costly than expected; risks related to future opportunities and plans for the Company, including the uncertainty of expected future financial performance and results of the Company; the possibility that, if the Company does not achieve the perceived benefits of the Merger as rapidly or to the extent anticipated by financial analysts or investors, the market price of the Company’s common stock could decline; pandemics or other health crises, such as COVID-19; increases in interest rates; the availability and cost of capital at expected rates; competition for quality assets; negative developments in the operating results or financial condition of the Company's tenants, including, but not limited to, their ability to pay rent; the Company's ability to reposition or sell facilities with profitable results; the Company's ability to release space at similar rates as vacancies occur; the Company's ability to renew expiring leases; government regulations affecting tenants' Medicare and Medicaid reimbursement rates and operational requirements; unanticipated difficulties and/or expenditures relating to future acquisitions and developments; changes in rules or practices governing the Company's financial reporting; the Company may be required under purchase options to sell properties and may not be able to reinvest the proceeds from such sales at rates of return equal to the return received on the properties sold; uninsured or underinsured losses related to casualty or liability; the incurrence of impairment charges on its real estate properties or other assets; and other legal and operational matters. Other risks, uncertainties and factors that could cause actual results to differ materially from those projected are detailed under the heading “Risk Factors,” in the Legacy HR’s and Legacy HTA’s Annual Reports on Form 10-K filed with the Securities and Exchange Commission (“SEC”) for the year ended December 31, 2021, under the heading "Risk Factors" and other risks described from time to time thereafter in the Legacy HR’s. Legacy HTA’s, and the Company's SEC filings. The Company undertakes no obligation to publicly update or revise any forward-looking statements, whether as a result of new information, future events or otherwise.
| | | | | |
| Highlights |
| Salient Facts |
| Corporate Information |
| Balance Sheet |
| Statements of Income |
| FFO, Normalized FFO, & FAD |
| Capital Funding & Commitments |
| Debt Metrics |
| Debt Covenants & Liquidity |
| Investment Activity |
| Re/development Activity |
| Portfolio |
| Health Systems |
| MOB Proximity to Hospital |
| Lease Maturity & Occupancy |
| Leasing Statistics |
| NOI Performance |
| NOI Reconciliations |
| 24 | EBITDA Reconciliations |
| 25 | Components of Net Asset Value |
| |
Copies of this report may be obtained at www.healthcarerealty.com or by contacting Investor Relations at 615.269.8175 or communications@healthcarerealty.com.
| | | | | |
| |
HEALTHCARE REALTY | 3Q 2022 SUPPLEMENTAL INFORMATION 3 |
•The Company completed the merger with Healthcare Trust of America, Inc. on July 20, 2022. Legacy HR was the accounting acquirer in the reverse merger structure. Unless otherwise noted, all financial information prior to the completion of the merger relates to Legacy HR.
•Net income attributable to common stockholders for the three months ended September 30, 2022 was $28.3 million or $0.08 per diluted common share.
•Normalized FFO per share totaled $0.39. With the full quarter pro-forma and run-rate adjustments as outlined below, expected run-rate normalized FFO is $0.40 per share. These quarterly amounts include the negative effect of non-cash, merger-related fair value debt adjustments of $0.03 per share. See the section below for a reconciliation of these items.
•Same store cash NOI for the third quarter increased 2.8% over the prior year. For the trailing twelve months ended September 30, 2022, same store cash NOI grew 2.4%. The same store portfolio includes 589 properties from combined Legacy HR and HTA, comprising 83% of total cash NOI.
•Predictive growth measures in the same store portfolio include:
◦Average in-place rent increases of 2.64%
◦Future annual contractual increases of 2.8% for leases commencing in the quarter
◦Weighted average cash leasing spreads of 2.9% on 634,000 square feet renewed:
▪10% (<0% spread)
▪26% (0-3%)
▪43% (3-4%)
▪22% (>4%)
◦Tenant retention of 79.1%
•Portfolio leasing activity in the third quarter totaled 1,086,000 square feet related to 317 leases:
◦694,000 square feet of renewals
◦392,000 square feet of new and expansion leases
•In the third quarter, the Company realized $16.4 million of annualized synergies, or nearly half of the projected $33-$36 million of annual G&A synergies. The Company expects to realize approximately $18 million of remaining annual G&A savings evenly over the next three quarters. This equates to an incremental $1.5 million of G&A savings for each of the next three quarters.
•Associated with the merger, the Company has closed $922 million in joint ventures and asset sale transactions at a weighted average cap rate of 4.6%. Transactions totaling $105 million are under contract and expected to close in November. In December, the Company expects to complete the remaining sales that will bring the total to over $1.1 billion at an expected weighted average cap rate of 4.8%.
•Since the end of the second quarter, the Company acquired nine medical office buildings totaling 249,000 square feet for $94.9 million. The properties are all located in existing markets and expand clusters in high growth markets, including Atlanta, Nashville and Raleigh.
•Since the end of the third quarter, the Company entered into new interest rate swaps totaling $250 million, bringing fixed rate debt to 86% of total debt, excluding the remaining balance on the asset sale term loan.
•Run-rate net debt to adjusted EBITDA on a full quarter proforma basis was 6.3 times at the end of the quarter. For a reconciliation to expected run-rate amounts, see the section below.
•A dividend of $0.31 per share will be paid on November 30, 2022 to stockholders of record on November 15, 2022.
| | | | | |
| |
HEALTHCARE REALTY | 3Q 2022 SUPPLEMENTAL INFORMATION 4 |
| | |
| RUN-RATE ADJUSTED EBITDA, NORMALIZED FFO AND FAD |
|
The following table provides a reconciliation of the current quarter full proforma normalized FFO, FAD and Adjusted EBITDA to an expected quarterly run-rate. The expected run-rates do not adjust for future changes in interest rates, portfolio NOI growth, or external investment activity. The expected run-rates also do not include any dispositions beyond those expected to repay the $1.125 billion asset sale term loan.
| | | | | | | | | | | | | | | | | | | | | | | | | | | | |
| | | | | | | | | | | | | | | | | | |
| NORMALIZED FFO | FAD | ADJUSTED EBITDA | NET DEBT | | | | | | | | | | | | | | |
| Q3 2022 proforma full quarter | $150,884 | $118,835 | $212,759 | $5,840,802 | | | | | | | | | | | | | | |
NOI adjustments for asset sales: 1 | | | | | | | | | | | | | | | | | | |
Q3 NOI recognized on assets sold during the quarter 2 | (3,997) | (3,944) | — | — | | | | | | | | | | | | | | |
| October asset sales completed | (1,625) | (1,600) | (1,625) | (136,000) | | | | | | | | | | | | | | |
| Expected November asset sales | (1,400) | (1,300) | (1,400) | (105,000) | | | | | | | | | | | | | | |
| Expected December asset sales | (3,000) | (2,875) | (3,000) | (182,000) | | | | | | | | | | | | | | |
Q3 acquisition timing 2 | 918 | 865 | — | — | | | | | | | | | | | | | | |
| Q3 recognized interest expense on the asset sale term loan | 5,419 | 5,151 | — | — | | | | | | | | | | | | | | |
| Reversal of Q3 seasonal utilities | 2,500 | 2,500 | 2,500 | — | | | | | | | | | | | | | | |
Remaining expected G&A synergies 3 | 4,500 | 4,500 | 4,500 | — | | | | | | | | | | | | | | |
Normalized maintenance capex 4 | — | 4,500 | — | — | | | | | | | | | | | | | | |
| Adjusted run-rate | $154,199 | $126,632 | $213,734 | $5,417,802 | | | | | | | | | | | | | | |
| Per share | $0.40 | $0.33 | | | | | | | | | | | | | | | |
| Net debt to adjusted EBITDA | | | | 6.3x | | | | | | | | | | | | | | |
FFO wtd avg common shares outstanding - diluted | 384,615 | 384,615 | | | | | | | | | | | | | | | | |
| Merger-related fair value debt adjustment | $11,844 | | | | | | | | | | | | | | | | | |
| Per share | $0.03 | | | | | | | | | | | | | | | | | |
1FFO and EBITDA includes the impact of straight-line rent.
2Adjustments to reflect quarterly NOI/EBITDA from properties acquired or disposed of in the quarter.
3The Company expects to realize $1.5 million per quarter in incremental G&A savings over each of the next three quarters.
4Quarterly maintenance capex as a percentage of NOI was 17.6%. The Company expects a run rate of 16% of run-rate adjusted cash NOI.
| | | | | |
| |
HEALTHCARE REALTY | 3Q 2022 SUPPLEMENTAL INFORMATION 5 |
| | |
Salient Facts 1 |
| AS OF SEPTEMBER 30, 2022 |
| | | | | | | | | | | |
| Properties | | |
| | |
| 728 properties totaling 42.6M SF | |
| 71 markets in 35 states | |
| 38.9M SF managed by Healthcare Realty | |
| 91.8% medical office and outpatient | |
| 60% of NOI in Top Markets | |
| | |
| | |
| Capitalization | |
| | |
| $13.8B enterprise value as of 9/30/22 | |
| $7.9B market capitalization as of 9/30/22 | |
| 384.6M shares outstanding (including OP units) | |
| $0.31 quarterly dividend per share | |
| BBB/Baa2/BBB S&P/Moody's/Fitch | |
| 42.4% net debt to enterprise value at 9/30/22 | |
| 6.3x proforma net debt to adjusted EBITDA | |
| | |
1 Includes properties held in joint ventures.
| | | | | |
| |
HEALTHCARE REALTY | 3Q 2022 SUPPLEMENTAL INFORMATION 6 |
Healthcare Realty Trust is a real estate investment trust that integrates owning, managing, financing and developing income-producing real estate properties associated primarily with the delivery of outpatient healthcare services throughout the United States. As of September 30, 2022, the Company was invested in 728 real estate properties in 35 states totaling 42.6 million square feet and had an enterprise value of approximately $13.8 billion, defined as equity market capitalization plus the principal amount of debt less cash. The Company provided leasing and property management services to 38.9 million square feet nationwide.
| | |
| EXECUTIVE OFFICERS |
|
| Todd J. Meredith |
| President and Chief Executive Officer |
|
| John M. Bryant, Jr. |
| Executive Vice President and General Counsel |
|
| J. Christopher Douglas |
| Executive Vice President and Chief Financial Officer |
|
| Robert E. Hull |
| Executive Vice President - Investments |
|
| Julie F. Wilson |
| Executive Vice President - Operations |
|
|
|
|
|
|
|
| | | | | |
| ANALYST COVERAGE |
| |
| BMO Capital Markets |
| BTIG, LLC |
| CapitalOne Securities, Inc. |
| Citi Research |
| Credit Suisse Securities (USA) LLC |
| Green Street Advisors, Inc. |
| J.P. Morgan Securities LLC |
| Jefferies LLC |
| KeyBanc Capital Markets Inc. |
| Raymond James & Associates |
| Scotiabank |
| SMBC Nikko Securities America, Inc. |
| Stifel, Nicolaus & Company, Inc. |
| |
| |
J. Knox Singleton
Chairman, Healthcare Realty Trust Incorporated
Retired Chief Executive Officer, Inova Health System
W. Bradley Blair, II
Vice Chairman, Healthcare Realty Trust Incorporated
Retired Chairman, Healthcare Trust of America
Todd J. Meredith
President and Chief Executive Officer
Healthcare Realty Trust Incorporated
John V. Abbott
Retired Chief Executive Officer
Aviation Asset Management Group, General Electric Company
Nancy H. Agee
President and Chief Executive Officer
Carilion Clinic
Vicki U. Booth
President and Board Chair
Ueberroth Family Foundation
Edward H. Braman
Retired Audit Partner
Ernst & Young LLP
Ajay Gupta
Chief Executive Officer
Physician Rehabilitation Network
James J. Kilroy
President and Portfolio Manager
Willis Investment Counsel
Jay P. Leupp
Managing Partner and Senior Portfolio Manager
Terra Firma Asset Management, LLC
Peter F. Lyle
Executive Vice President
Medical Management Associates, Inc.
Constance B. Moore
Retired President and CEO
BRE Properties, Inc.
Christann M. Vasquez
Executive Vice President and Chief Operating Officer
Ascension Texas
David R. Emery (1944-2019)
Chairman Emeritus
Healthcare Realty Trust Incorporated
| | | | | |
| |
HEALTHCARE REALTY | 3Q 2022 SUPPLEMENTAL INFORMATION 7 |
| | |
| Balance Sheet |
| AMOUNTS IN THOUSANDS, EXCEPT PER SHARE DATA |
|
| | | | | | | | | | | | | | | | | |
| ASSETS | | | | | | | |
| | 2Q 2022 | |
| 3Q 2022 | Combined | Legacy HR | | | Legacy HTA | |
| Real estate properties | | | | | | | |
| Land | $1,449,550 | | $1,104,700 | | $456,306 | | | | $648,394 | | |
| Buildings and improvements | 11,439,797 | | 11,447,844 | | 4,673,026 | | | | 6,774,818 | | |
| Lease intangibles | 968,914 | | 382,738 | | — | | | | 382,738 | | |
| Personal property | 11,680 | | 11,799 | | 11,799 | | | | — | | |
| Investment in financing receivables, net | 118,919 | | 118,446 | | 118,446 | | | | — | | |
| Financing lease right-of-use assets | 79,950 | | 71,632 | | 71,632 | | | | — | | |
| Construction in progress | 43,148 | | 31,980 | | 16,728 | | | | 15,252 | | |
| Land held for development | 73,321 | | 22,952 | | 22,952 | | | | — | | |
| Total real estate investments | 14,185,279 | | 13,192,091 | | 5,370,889 | | | | 7,821,202 | | |
| Less accumulated depreciation and amortization | (1,468,736) | | (3,102,055) | | (1,402,509) | | | | (1,699,546) | | |
| Total real estate investments, net | 12,716,543 | | 10,090,036 | | 3,968,380 | | | | 6,121,656 | | |
| Cash and cash equivalents | 57,583 | | 64,026 | | 34,312 | | | | 29,714 | | |
| Restricted cash | — | | 4,559 | | — | | | | 4,559 | | |
| Assets held for sale, net | 185,074 | | — | | — | | | | — | | |
| Operating lease right-of-use assets | 321,365 | | 353,807 | | 126,204 | | | | 227,603 | | |
| Investments in unconsolidated joint ventures | 327,752 | | 272,851 | | 210,781 | | | | 62,070 | | |
| Other assets, net and goodwill | 587,126 | | 578,948 | | 209,200 | | | | 369,748 | | |
| Total assets | $14,195,443 | | $11,364,227 | | $4,548,877 | | | | $6,815,350 | | |
| | | | | | | |
| LIABILITIES AND STOCKHOLDERS' EQUITY | | | | | | | |
| | 2Q 2022 | |
| 3Q 2022 | Combined | Legacy HR | | | Legacy HTA | |
| Liabilities | | | | | | | |
| Notes and bonds payable | $5,570,139 | | $5,158,398 | | $2,063,755 | | | | $3,094,643 | | |
| Accounts payable and accrued liabilities | 231,018 | | 255,883 | | 84,210 | | | | 171,673 | | |
| Liabilities of properties held for sale | 10,644 | | — | | — | | | | — | | |
| Operating lease liabilities | 268,840 | | 291,739 | | 94,748 | | | | 196,991 | | |
| Financing lease liabilities | 72,378 | | 62,195 | | 62,195 | | | | — | | |
| Other liabilities | 203,398 | | 176,844 | | 66,102 | | | | 110,742 | | |
| Total liabilities | 6,356,417 | | 5,945,059 | | 2,371,010 | | | | 3,574,049 | | |
| | | | | | | |
| Stockholders' equity | | | | | | | |
| Preferred stock, $0.01 par value; 200,000 shares authorized | — | | — | | — | | | | — | | |
| Common stock, $0.01 par value; 1,000,000 shares authorized | 3,806 | | 3,807 | | 1,516 | | | | 2,291 | | |
| Additional paid-in capital | 9,586,556 | | 9,185,292 | | 4,002,526 | | | | 5,182,766 | | |
| Accumulated other comprehensive income/(loss) | 5,524 | | 4,536 | | (1,250) | | | | 5,786 | | |
| Cumulative net income attributable to common stockholders | 1,342,819 | | 1,314,515 | | 1,314,515 | | | | — | | |
Cumulative dividends 1 | (3,211,492) | | (5,171,621) | | (3,139,440) | | | | (2,032,181) | | |
| Total stockholders' equity | 7,727,213 | | 5,336,529 | | 2,177,867 | | | | 3,158,662 | | |
| Non-controlling interest | 111,813 | | 82,639 | | — | | | | 82,639 | | |
| Total Equity | 7,839,026 | | 5,419,168 | | 2,177,867 | | | | 3,241,301 | | |
| Total liabilities and stockholders' equity | $ | 14,195,443 | | $ | 11,364,227 | | $ | 4,548,877 | | | | $ | 6,815,350 | | |
1Includes Legacy HTA's cumulative dividends in excess of earnings.
| | | | | |
| |
HEALTHCARE REALTY | 3Q 2022 SUPPLEMENTAL INFORMATION 8 |
| | |
Statements of Income1 |
| DOLLARS IN THOUSANDS |
|
| | | | | | | | | | | | | | | | | | | | | | | | | |
| | | | | | | | | | | | | |
| 3Q 2022 | 2Q 2022 | | | | | | | | |
| AS REPORTED | PROFORMA FULL QUARTER | COMBINED | LEGACY HR | LEGACY HTA | | | | | | | | |
| Revenues | | | | | | | | | | | | | |
| Rental income | 298,931 | | 344,251 | 338,916 | | 140,632 | | 198,284 | | | | | | | | | |
| Interest income | 3,366 | | 3,750 | 1,957 | | 1,957 | | — | | | | | | | | | |
| Other operating | 4,057 | | 4,057 | 4,587 | | 2,738 | | 1,849 | | | | | | | | | |
| 306,354 | | 352,058 | 345,460 | | 145,327 | | 200,133 | | | | | | | | | |
| Expenses | | | | | | | | | | | | | |
| Property operating | 112,473 | | 127,172 | 120,383 | | 57,010 | | 63,373 | | | | | | | | | |
| General and administrative | 16,741 | | 18,956 | 24,783 | | 10,540 | | 14,243 | | | | | | | | | |
Acquisition and pursuit costs 2 | 482 | | 482 | 1,449 | | 1,352 | | 97 | | | | | | | | | |
| Merger-related costs | 79,402 | | 79,402 | 12,192 | | 7,085 | | 5,107 | | | | | | | | | |
| Depreciation and amortization | 158,117 | | 186,643 | 130,782 | | 55,731 | | 75,051 | | | | | | | | | |
| 367,215 | | 412,655 | 289,589 | | 131,718 | | 157,871 | | | | | | | | | |
| Other income (expense) | | | | | | | | | | | | | |
| Interest expense before merger-related fair value | ($43,775) | | ($48,547) | | ($40,303) | | ($15,543) | | ($24,760) | | | | | | | | | |
| Merger-related fair value adjustment | (9,269) | | (11,844) | — | | — | | — | | | | | | | | | |
| Interest expense | (53,044) | | (60,391) | (40,303) | | (15,543) | | (24,760) | | | | | | | | | |
| Gain on sales of real estate properties | 143,908 | | 143,908 | 8,496 | | 8,496 | | — | | | | | | | | | |
| Loss on extinguishment of debt | (1,091) | | (1,091) | (3,615) | | — | | (3,615) | | | | | | | | | |
| | | | | | | | | | | | | |
| Equity loss from unconsolidated joint ventures | (124) | | (124) | 94 | | (307) | | 401 | | | | | | | | | |
| Interest and other income (expense), net | (172) | | (172) | 9 | | (125) | | 134 | | | | | | | | | |
| 89,477 | | 82,130 | (35,319) | | (7,479) | | (27,840) | | | | | | | | | |
| Net income | $28,616 | | $21,533 | $20,552 | | $6,130 | | $14,422 | | | | | | | | | |
| Net income attributable to non-controlling interests | (312) | | (316) | (254) | | — | | (254) | | | | | | | | | |
| Net income attributable to common stockholders | $28,304 | | $21,217 | $20,298 | | $6,130 | | $14,168 | | | | | | | | | |
| | | | | | | | | | | | | |
| | | | | | | | | | | | | |
| MERGER-RELATED NON-CASH FAIR VALUE DEBT ADJUSTMENT | | | | | | | | | | | | | |
| | PROFORMA FULL QUARTER | PER SHARE | | | | | | | | | | |
| Merger-related non-cash fair value debt adjustment | | $(11,844) | ($0.031) | | | | | | | | | | | |
| | | | | | | | | | | | | |
| G&A SYNERGIES | | | | | | | | | | | | | |
| | QUARTERLY AMOUNT | PER SHARE | | | | | | | | | | |
| Q2 2022 combined | | $24,783 | | | | | | | | | | | |
| Legacy HTA normalizing adjustments | | (1,700) | | | | | | | | | | | | |
| Q2 2022 normalized combined | | 23,083 | | | | | | | | | | | | |
| Q3 2022 realized synergies | | (4,127) | | ($0.011) | | | | | | | | | | | |
| Q3 2022 proforma full quarter | | 18,956 | | | | | | | | | | | | |
| Remaining expected synergies | | (4,500) | | ($0.012) | | | | | | | | | | | |
1On July 20, 2022, Legacy HR and Legacy HTA closed the merger of the two companies, in which Legacy HR was the acquirer under GAAP. Accordingly, the historic financial statements of the combined company are those of Legacy HR. Unless otherwise noted, third quarter data is for the combined company, whether on an actual or pro forma basis.
2Includes third party and travel costs related to the pursuit of acquisitions and developments.
| | | | | |
| |
HEALTHCARE REALTY | 3Q 2022 SUPPLEMENTAL INFORMATION 9 |
| | |
FFO, Normalized FFO, & FAD 1,2,3 |
| DOLLARS IN THOUSANDS, EXCEPT PER SHARE DATA |
|
| | | | | | | | | | | | | | | | | | | | | | | | | | | | | | | |
| | | | | | | | | | | | | | | | | | | |
| 3Q 2022 | 2Q 2022 | | | | | | | | | | | | | | |
| AS REPORTED | PROFORMA FULL QUARTER | COMBINED | LEGACY HR | LEGACY HTA9 | | | | | | | | | | | | | | |
| Net income attributable to common stockholders | $28,304 | $21,217 | $20,298 | $6,130 | $14,168 | | | | | | | | | | | | | | |
| Gain on sales of real estate assets | (143,908) | (143,908) | (8,496) | (8,496) | — | | | | | | | | | | | | | | |
| | | | | | | | | | | | | | | | | | | |
| Real estate depreciation and amortization | 159,643 | 188,131 | 131,778 | 57,334 | 74,444 | | | | | | | | | | | | | | |
| Non-controlling income from partnership units | 377 | 316 | 254 | — | 254 | | | | | | | | | | | | | | |
| Unconsolidated JV depreciation and amortization | 3,526 | 3,526 | 3,295 | 2,807 | 488 | | | | | | | | | | | | | | |
| FFO | $47,942 | $69,282 | $147,129 | $57,775 | $89,354 | | | | | | | | | | | | | | |
Acquisition and pursuit costs 4 | 482 | 482 | 1,449 | 1,352 | 97 | | | | | | | | | | | | | | |
Merger-related costs | 79,402 | | 79,402 | 12,192 | 7,085 | 5,107 | | | | | | | | | | | | | | |
| Lease intangible amortization | (2) | 127 | 815 | 584 | 231 | | | | | | | | | | | | | | |
| | | | | | | | | | | | | | | | | | | |
Non-routine legal costs/forfeited earnest money received 5 | 346 | 346 | 1,842 | 140 | 1,702 | | | | | | | | | | | | | | |
| Debt financing costs | 1,091 | 1,091 | 4,716 | — | 4,716 | | | | | | | | | | | | | | |
Unconsolidated JV normalizing items 6 | 154 | 154 | 83 | 83 | — | | | | | | | | | | | | | | |
| Normalized FFO | $129,415 | $150,884 | $168,226 | $67,019 | $101,207 | | | | | | | | | | | | | | |
| Non-real estate depreciation and amortization | 577 | 577 | 1,780 | 556 | 1,224 | | | | | | | | | | | | | | |
Non-cash interest amortization 7 | 8,924 | 11,499 | 747 | 747 | — | | | | | | | | | | | | | | |
| Provision for bad debt, net | 457 | 457 | 16 | 16 | — | | | | | | | | | | | | | | |
| Straight-line rent income, net | (7,715) | (9,908) | (3,743) | (1,327) | (2,416) | | | | | | | | | | | | | | |
| Stock-based compensation | 3,666 | 3,666 | 5,547 | 3,356 | 2,191 | | | | | | | | | | | | | | |
Unconsolidated JV non-cash items 8 | (377) | (377) | (242) | (242) | — | | | | | | | | | | | | | | |
| Normalized FFO adjusted for non-cash items | 134,947 | 156,798 | 172,331 | 70,125 | 102,206 | | | | | | | | | | | | | | |
| 2nd generation TI | (10,147) | (11,763) | (13,635) | (5,051) | (8,584) | | | | | | | | | | | | | | |
| Leasing commissions paid | (8,283) | (8,739) | (7,251) | (3,475) | (3,776) | | | | | | | | | | | | | | |
| Capital expenditures | (16,067) | (17,461) | (11,726) | (4,557) | (7,169) | | | | | | | | | | | | | | |
| Total maintenance capex | (34,497) | (37,963) | (32,612) | (13,083) | (19,529) | | | | | | | | | | | | | | |
| FAD | $100,450 | $118,835 | $139,719 | $57,042 | $82,677 | | | | | | | | | | | | | | |
Quarterly dividends 9 | $103,174 | $119,194 | $122,862 | $47,097 | $75,765 | | | | | | | | | | | | | | |
| FFO per common share - diluted | $0.14 | $0.18 | $0.38 | $0.38 | $0.38 | | | | | | | | | | | | | | |
| Normalized FFO per common share - diluted | $0.39 | $0.39 | $0.44 | $0.45 | $0.43 | | | | | | | | | | | | | | |
FFO wtd avg common shares outstanding - diluted 10 | 332,819 | 384,615 | 383,670 | 150,545 | 233,125 | | | | | | | | | | | | | | |
1On July 20, 2022, Legacy HR and Legacy HTA closed the merger of the two companies, in which Legacy HR was the acquirer under GAAP. Accordingly, the historic financial statements of the combined company are those of Legacy HR. Unless otherwise noted, third quarter data is for the combined company, whether on an actual or pro forma basis.
2Funds from operations (“FFO”) and FFO per share are operating performance measures adopted by the National Association of Real Estate Investment Trusts, Inc. (“NAREIT”). NAREIT defines FFO as “net income (computed in accordance with GAAP) excluding depreciation and amortization related to real estate, gains and losses from the sale of certain real estate assets, gains and losses from change in control, and impairment write-downs of certain real assets and investments in entities when the impairment is directly attributable to decreases in the value of depreciable real estate held by the entity.”
3FFO, Normalized FFO and Funds Available for Distribution ("FAD") do not represent cash generated from operating activities determined in accordance with accounting principles generally accepted in the United States of America and is not necessarily indicative of cash available to fund cash needs. FFO, Normalized FFO and FAD should not be considered alternatives to net income attributable to common stockholders as indicators of the Company's operating performance or as alternatives to cash flow as measures of liquidity.
4Acquisition and pursuit costs include third party and travel costs related to the pursuit of acquisitions and developments.
5Non-routine legal costs include expenses related to two separate disputes: one with a contractor on a $60.6 million completed construction project and another with a tenant on a violation of use restrictions. Forfeited earnest money received related to a disposition that did not materialize.
6Includes the Company's proportionate share of normalizing items related to unconsolidated joint ventures such as lease intangibles and acquisition and pursuit costs.
7Includes the amortization of deferred financing costs, discounts and premiums, and non-cash financing receivable amortization.
8Includes the Company's proportionate share of straight-line rent, net and provision for bad debt, net related to unconsolidated joint ventures.
9Quarterly dividends for the third quarter represent dividends at the current rate of $0.31 per share multiplied by the weighted average shares outstanding. Actual dividends paid in the third quarter were $72.1 million.
10The Company utilizes the treasury stock method which includes the dilutive effect of nonvested share-based awards outstanding of 787,559 for the three months ended September 30, 2022.
| | | | | |
| |
HEALTHCARE REALTY | 3Q 2022 SUPPLEMENTAL INFORMATION 10 |
| | |
Capital Funding & Commitments 1 |
| DOLLARS IN THOUSANDS, EXCEPT PER SHARE DATA |
|
| | | | | | | | | | | | | | | | | | | | | | | |
| ACQUISITION AND RE/DEVELOPMENT FUNDING | | | | | | |
| PROFORMA 3Q 2022 | 2Q 2022 | 1Q 2022 | 4Q 2021 | 3Q 2021 | | | | | | |
Acquisitions 2 | $91,253 | $163,762 | $172,663 | $258,072 | $160,073 | | | | | | |
| Re/development | 31,546 | 9,387 | 7,664 | 11,767 | 6,594 | | | | | | |
1st generation TI & acquisition capex 3 | 12,596 | 8,103 | 7,473 | 7,596 | 4,675 | | | | | | |
| | | | | | | | | | | |
| MAINTENANCE CAPITAL EXPENDITURES FUNDING |
| PROFORMA 3Q 2022 | 2Q 2022 | 1Q 2022 | 4Q 2021 | 3Q 2021 | | | | | | |
| | | | | | | | | | | |
| 2nd generation TI | $11,763 | $5,051 | $4,899 | $10,207 | $6,219 | | | | | | |
| Leasing commissions paid | 8,739 | 3,475 | 3,767 | 2,214 | 4,531 | | | | | | |
| Capital expenditures | 17,461 | 4,557 | 2,620 | 6,043 | 5,443 | | | | | | |
| $37,963 | $13,083 | $11,286 | $18,464 | $16,193 | | | | | | |
| % of Cash NOI | | | | | | |
| 2nd generation TI | 5.5 | % | 5.6 | % | 5.6 | % | 12.1 | % | 7.6 | % | | | | | | |
| Leasing commissions paid | 4.1 | % | 3.9 | % | 4.3 | % | 2.6 | % | 5.6 | % | | | | | | |
| Capital expenditures | 8.1 | % | 5.1 | % | 3.0 | % | 7.2 | % | 6.7 | % | | | | | | |
| 17.6 | % | 14.5 | % | 13.0 | % | 22.0 | % | 19.9 | % | | | | | | |
| | | | | | | | | | | |
| LEASING COMMITMENTS |
| PROFORMA 3Q 2022 | 2Q 2022 | 1Q 2022 | 4Q 2021 | 3Q 2021 | | | | | | |
| Renewals | | | | | | | | | | | |
| Square feet | 632,690 | 205,400 | 260,202 | 332,819 | 360,302 | | | | | | |
| 2nd generation TI/square foot/lease year | $1.66 | $1.66 | $1.73 | $1.46 | $1.75 | | | | | | |
| Leasing commissions/square foot/lease year | $1.03 | $1.15 | $1.04 | $1.23 | $0.93 | | | | | | |
| Renewal commitments as a % of annual net rent | 10.5 | % | 11.4 | % | 11.0 | % | 11.4 | % | 11.4 | % | | | | | | |
WALT (in months) 4 | 50.1 | 39.7 | 42.9 | 46.4 | 45.0 | | | | | | |
| | | | | | | | | | | |
| New leases | | | | | | | | | | | |
| Square feet | 262,904 | 79,467 | 96,001 | 109,592 | 97,619 | | | | | | |
| 2nd generation TI/square foot/lease year | $4.84 | $7.07 | $5.93 | $5.44 | $4.74 | | | | | | |
| Leasing commissions/square foot/lease year | $1.39 | $1.65 | $1.90 | $1.84 | $1.62 | | | | | | |
| New lease commitments as a % of annual net rent | 28.1 | % | 40.6 | % | 32.2 | % | 34.2 | % | 30.7 | % | | | | | | |
WALT (in months) 4 | 87.1 | 77.4 | 76.9 | 77.2 | 80.0 | | | | | | |
| | | | | | | | | | | |
| All | | | | | | | | | | | |
| Square feet | 895,594 | 284,867 | 356,203 | 442,411 | 457,921 | | | | | | |
| | | | | | | | | | | |
| | | | | | | | | | | |
| Leasing commitments as a % of annual net rent | 16.9 | % | 22.6 | % | 19.2 | % | 18.8 | % | 16.8 | % | | | | | | |
WALT (in months) 4 | 61.0 | 50.2 | 52.1 | 54.0 | 52.5 | | | | | | |
| | | | | | | | | | | |
| | | | | | | | | | | |
1On July 20, 2022, Legacy HR and Legacy HTA closed the merger of the two companies, in which Legacy HR was the acquirer under GAAP. Accordingly, the historic financial statements of the combined company are those of Legacy HR. Unless otherwise noted, third quarter data is for the combined company, whether on an actual or pro forma basis.
2Acquisitions include properties acquired through joint ventures at the Company's ownership percentage.
3Acquisition capex includes near-term fundings underwritten as part of recent acquisitions.
4WALT = weighted average lease term.
| | | | | |
| |
HEALTHCARE REALTY | 3Q 2022 SUPPLEMENTAL INFORMATION 11 |
| | |
Debt Metrics1 |
| DOLLARS IN THOUSANDS |
| AS REPORTED |
| | | | | | | | | | | | | | | | | | | | | | | | | | | | | |
| SUMMARY OF INDEBTEDNESS AS OF SEPTEMBER 30, 2022 | |
| PRINCIPAL BALANCE | BALANCE 2 | MATURITY DATE | MONTHS TO MATURITY 3 | INTEREST EXPENSE | CONTRACTUAL INTEREST EXPENSE | CONTRACTUAL RATE | EFFECTIVE RATE | FAIR VALUE MERGER ADJUSTED |
| SENIOR NOTES | $250,000 | $249,025 | 5/1/2025 | 31 | | $2,470 | $2,422 | 3.88 | % | 4.12 | % | |
| 600,000 | 569,786 | 8/1/2026 | 46 | | 5,606 | 4,200 | 3.50 | % | 4.94 | % | Y |
| 500,000 | 478,541 | 7/1/2027 | 57 | | 4,541 | 3,750 | 3.75 | % | 4.76 | % | Y |
| 300,000 | 296,711 | 1/15/2028 | 64 | | 2,780 | 2,719 | 3.63 | % | 3.85 | % | |
| 650,000 | 562,974 | 2/15/2030 | 89 | | 5,867 | 3,974 | 3.10 | % | 5.30 | % | Y |
| 300,000 | 296,787 | 3/15/2030 | 90 | | 1,930 | 1,800 | 2.40 | % | 2.72 | % | |
| 300,000 | 295,424 | 3/15/2031 | 102 | | 1,591 | 1,537 | 2.05 | % | 2.25 | % | |
| 800,000 | 628,617 | 3/15/2031 | 102 | | 6,334 | 3,155 | 2.00 | % | 5.13 | % | Y |
| $3,700,000 | $3,377,865 | | 74 | | $31,119 | $23,557 | 2.97 | % | 4.42 | % | |
| TERM LOANS | $350,000 | $348,735 | 7/20/2025 | 34 | | $80 | $80 | SOFR + 1.05% | 4.10 | % | |
| 200,000 | 199,611 | 5/31/2026 | 44 | | 1,701 | 1,701 | SOFR + 1.05% | 3.51 | % | |
| 300,000 | 299,930 | 10/31/2026 | 49 | | 1,541 | 1,541 | SOFR + 1.05% | 2.47 | % | |
| 150,000 | 149,458 | 5/31/2026 | 44 | | 1,251 | 1,251 | SOFR + 1.05% | 3.32 | % | |
| 200,000 | 199,328 | 7/1/2027 | 57 | | 984 | 984 | SOFR + 1.05% | 2.27 | % | |
| 300,000 | 297,764 | 1/12/2028 | 63 | | 2,077 | 2,077 | SOFR + 1.05% | 3.56 | % | |
| $1,500,000 | $1,494,826 | | 48 | | $7,634 | $7,634 | | 3.26 | % | |
| $1.5B CREDIT FACILITY | $190,600 | $190,600 | 10/31/2027 | 61 | | $4,046 | $4,046 | SOFR + 0.95% | 3.99 | % | |
| $1.125B ASSET SALE TERM | $423,000 | $421,919 | 7/19/2024 | 22 | | $5,419 | $5,151 | SOFR + 1.05% | 4.07 | % | Y |
| MORTGAGES | $84,784 | $84,929 | various | 27 | | $803 | $867 | 4.07 | % | 3.97 | % | |
| $5,898,384 | $5,570,139 | | 62 | $49,021 | $41,255 | 3.17 | % | 4.06 | % | |
| | | | | | | | | |
| Interest cost capitalization | (703) | — | | | |
| Unsecured credit facility fee & deferred financing costs | 2,105 | 764 | | | |
| Fair value derivative amortization | 1,732 | — | | | |
| Financing right-of-use asset amortization | 889 | — | | | |
| | | | | $53,044 | $42,019 | | | |
| | | | | | | | | | | | | | | | | | | | | | | | | | | | | | |
| DEBT MATURITIES SCHEDULE AS OF SEPTEMBER 30, 2022 |
| | PRINCIPAL PAYMENTS | | WEIGHTED AVERAGE CONTRACTUAL RATE |
| | BANK
LOANS | SENIOR NOTES | MORTGAGE NOTES | TOTAL | | BANK LOANS | SENIOR NOTES | MORTGAGE NOTES | TOTAL |
| 2022 | | | | $661 | $661 | | — | % | — | % | 4.00 | % | 4.00 | % |
| 2023 | | | | 18,880 | 18,880 | | — | % | — | % | 3.83 | % | 3.83 | % |
| 2024 | | $423,000 | | 25,353 | 448,353 | | 4.07 | % | — | % | 4.41 | % | 4.09 | % |
| 2025 | | 350,000 | $250,000 | 16,250 | 616,250 | | 4.10 | % | 3.88 | % | 4.22 | % | 4.01 | % |
| 2026 | | 650,000 | 600,000 | 23,640 | 1,273,640 | | 2.98 | % | 3.50 | % | 3.81 | % | 3.24 | % |
| 2027 | | 390,600 | 500,000 | | 890,600 | | 3.11 | % | 3.75 | % | — | % | 3.47 | % |
| 2028 | | 300,000 | 300,000 | | 600,000 | | 3.56 | % | 3.63 | % | — | % | 3.59 | % |
| Thereafter | | | 2,050,000 | | 2,050,000 | | — | % | 2.41 | % | — | % | 2.41 | % |
| Total | | $2,113,600 | $3,700,000 | $84,784 | $5,898,384 | | 3.49 | % | 2.97 | % | 4.07 | % | 3.17 | % |
| Total excluding asset sale term loan | | $1,690,600 | $3,700,000 | $84,784 | $5,475,384 | | | | | |
Fixed rate debt balance 4 | | $675,000 | $3,700,000 | $84,784 | $4,459,784 | | | | | |
| | | | | | | | | | |
1On July 20, 2022, Legacy HR and Legacy HTA merged, in which Legacy HR was the acquirer under GAAP. Accordingly, the historic financial statements of the combined company are those of Legacy HR. Unless otherwise noted, third quarter data is for the combined company, whether on an actual or pro forma basis.
2Balances are reflected net of discounts, fair value adjustments, and deferred financing costs and include premiums.
3Includes extension options.
4Reflects $675.0 million of interest rate swaps.
| | | | | |
| |
HEALTHCARE REALTY | 3Q 2022 SUPPLEMENTAL INFORMATION 12 |
| | |
Debt Covenants & Liquidity1 |
| DOLLARS IN THOUSANDS |
|
| | | | | | | | | | | |
SELECTED FINANCIAL DEBT COVENANTS YEAR ENDED SEPTEMBER 30, 2022 2 | |
| CALCULATION | REQUIREMENT | PER DEBT COVENANTS |
| Revolving credit facility and term loan | | |
| Leverage ratio | Total debt/total capital | Not greater than 60% | 39.3 | % |
| Secured leverage ratio | Total secured debt/total capital | Not greater than 30% | 0.6 | % |
| Unencumbered leverage ratio | Unsecured debt/unsecured real estate | Not greater than 60% | 41.5 | % |
| Fixed charge coverage ratio | EBITDA/fixed charges | Not less than 1.50x | 4.2x |
| Unsecured coverage ratio | Unsecured EBITDA/unsecured interest | Not less than 1.75x | 4.3x |
| | | |
| | | |
| Asset investments | Unimproved land, JVs & mortgages/total assets | Not greater than 35% | 6.2 | % |
| | | |
Senior Notes due 2030 and 2031 3 | | | |
| Incurrence of total debt | Total debt/total assets | Not greater than 60% | 39.1 | % |
| Incurrence of debt secured by any lien | Secured debt/total assets | Not greater than 40% | 0.6 | % |
| Maintenance of total unsecured assets | Unencumbered assets/unsecured debt | Not less than 150% | 253.1 | % |
| Debt service coverage | EBITDA/interest expense | Not less than 1.5x | 3.5x |
| | | |
Other Senior Notes 4 | | | |
| Incurrence of total debt | Total debt/total assets | Not greater than 60% | 40.3 | % |
| Incurrence of debt secured by any lien | Secured debt/total assets | Not greater than 40% | 0.6 | % |
| Maintenance of total unsecured assets | Unencumbered assets/unsecured debt | Not less than 150% | 244.4 | % |
| Debt service coverage | EBITDA/interest expense | Not less than 1.5x | 3.4x |
| | | |
| Other | | | |
Net debt to adjusted EBITDA 5 | Net debt (debt less cash)/adjusted EBITDA | Not required | 6.3x |
Net debt to enterprise value 6 | Net debt/enterprise value | Not required | 42.4 | % |
| | | | | |
| LIQUIDITY SOURCES |
| |
| Cash | $57,583 |
| Unsecured credit facility availability | 1,309,400 |
Consolidated unencumbered assets (gross) 7 | 14,180,746 |
1On July 20, 2022, Legacy HR and Legacy HTA closed the merger of the two companies, in which Legacy HR was the acquirer under GAAP. Accordingly, the historic financial statements of the combined company are those of Legacy HR. Unless otherwise noted, third quarter data is for the combined company, whether on an actual or pro forma basis.
2Does not include all financial and non-financial covenants and restrictions that are required by the Company's various debt agreements. Financial measures include the Company's proportionate share of unconsolidated joint ventures, as applicable.
3The financial covenants for the Senior Note due 2030 exclude the impact of Topic 842, Lease Accounting from the financial covenant calculations.
4The senior note covenants calculations apply to the Senior Notes due 2025 and 2028. The Senior Notes due 2023 have similar covenants but contain a less restrictive definition of total assets.
5Adjusted EBITDA is based on the proforma full quarter results, annualized. See page 24 for a reconciliation of adjusted EBITDA. Proforma adjusted EBITDA and net debt includes run-rate adjustments highlighted on page 5.
6Based on the closing price of $20.85 on September 30, 2022 and 380,572,290 shares outstanding.
7Annualized third quarter 2022 unencumbered asset NOI was $819.2 million.
| | | | | |
| |
HEALTHCARE REALTY | 3Q 2022 SUPPLEMENTAL INFORMATION 13 |
| | |
| Investment Activity |
| DOLLARS IN THOUSANDS |
|
| | | | | | | | | | | | | | | | | | | | | | | |
| ACQUISITION ACTIVITY |
| MARKET | COUNT | | | | SQUARE
FEET | LEASED % | PURCHASE PRICE 1 | % OWNERSHIP | CAP
RATE |
| | | | | | | | | |
| | | | | | | | | |
| | | | | | | | | |
| | | | | | | | | |
| Q1 2022 total | 9 | | | | 398,520 | 87 | % | 223,150 | 77 | % | 4.7 | % |
| | | | | | | | | |
| | | | | | | | | |
| | | | | | | | | |
| | | | | | | | | |
| | | | | | | | | |
| | | | | | | | | |
| | | | | | | | | |
| | | | | | | | | |
| | | | | | | | | |
| Q2 2022 total | 13 | | | | 359,706 | 100 | % | 163,762 | 100 | % | 5.7 | % |
| | | | | | | | | |
| | | | | | | | | |
| | | | | | | | | |
| | | | | | | | | |
| | | | | | | | | |
| | | | | | | | | |
| | | | | | | | | |
| | | | | | | | | |
| Q3 2022 total | 8 | | | | 242,602 | 98 | % | 91,253 | 100 | % | 5.6 | % |
| YTD total | 30 | | | | 1,000,828 | 94 | % | $478,165 | 89 | % | 5.3 | % |
| JV Contribution | | | | | | | (50,488) | | |
| YTD total, net | | | | | | | $427,677 | | |
YTD average cap rate 2 | | | | | | | 5.3 | % | | |
| | | | | | | | | |
| | | | | | | | | | | | | | | | | | | | | | | | | | | |
| Q3 2022 ACQUISITION DETAIL |
| MARKET | COUNT | MILES TO CAMPUS | ASSOCIATED HEALTH SYSTEM/TENANCY | CLOSING | SQUARE
FEET | LEASED % | PURCHASE PRICE 1 | % OWNERSHIP | |
| | | | | | | | | |
| | | | | | | | | |
| | | | | | | | | |
| | | | | | | | | |
| | | | | | | | | |
| | | | | | | | | |
| | | | | | | | | |
| | | | | | | | | |
| | | | | | | | | |
| | | | | | | | | |
| | | | | | | | | |
| | | | | | | | | |
| | | | | | | | | |
| | | | | | | | | |
| | | | | | | | | |
| Seattle, WA | 1 | 0.24 | EvergreenHealth | 8/1/2022 | 10,593 | 100 | % | 4,850 | 100 | % | |
| Raleigh, NC | 1 | 0.24 | WakeMed | 8/9/2022 | 11,345 | 82 | % | 3,783 | 100 | % | |
| Jacksonville, FL | 1 | 0.03 | Ascension | 8/9/2022 | 34,133 | 100 | % | 18,195 | 100 | % | |
| Atlanta, GA | 1 | 0.11 | Wellstar | 8/10/2022 | 43,496 | 100 | % | 11,800 | 100 | % | |
| Denver, CO | 1 | 2.10 | Centura | 8/11/2022 | 34,785 | 100 | % | 14,800 | 100 | % | |
| Raleigh, NC | 1 | 0.19 | Duke | 8/18/2022 | 31,318 | 93 | % | 11,375 | 100 | % | |
| Nashville, TN | 1 | 0.80 | Ascension | 9/15/2022 | 61,932 | 100 | % | 21,000 | 100 | % | |
| Austin, TX | 1 | 0.03 | HCA | 9/29/2022 | 15,000 | 100 | % | 5,450 | 100 | % | |
| | | | | | | | | |
| | | | | | | | | |
| Q3 2022 total | 8 | | | | 242,602 | 98 | % | $91,253 | | |
| Subsequent activity | | | | | | | | | |
| Jacksonville, FL | 1 | 0.10 | Ascension | 10/12/2022 | 6,200 | 100 | % | 3,600 | 100 | % | |
| | | | | | | | | |
| | | | | | | | | | | | | | | | | | |
| DISPOSITION ACTIVITY | |
| LOCATION | COUNT | CLOSING | SQUARE FEET | LEASED % | SALE
PRICE | |
| Loveland, CO | 2 | 2/24/2022 | 150,291 | 82 | % | $84,950 | |
| San Antonio, TX | 2 | 4/15/2022 | 201,523 | 51 | % | 25,500 | |
Santa Fe, NM 5 | 1 | 7/18/2022 | 34,003 | 19 | % | 3,950 | |
| GA, FL, PA | 4 | 7/29/2022 | 316,739 | 100 | % | 133,100 | |
| GA, FL, TX | 6 | 8/4/2022 | 343,545 | 89 | % | 160,917 | |
Los Angeles, CA 3 | 4 | 8/5/2022 | 283,780 | 67 | % | 134,845 | |
Dallas, TX 4 | 6 | 8/30/2022 | 189,385 | 100 | % | 114,290 | |
| Indianapolis, IN | 5 | 8/31/2022 | 506,406 | 99 | % | 238,845 | |
| Dallas, TX | 2 | 10/4/2022 | 291,328 | 82 | % | 104,025 | |
| Houston, TX | 1 | 10/21/2022 | 134,910 | 71 | % | 32,000 | |
| | | | | | |
| | | | | | |
| YTD total | 33 | | 2,451,910 | 84 | % | $1,032,422 | |
YTD average cap rate 6 | | | | 4.6 | % | |
1Includes joint venture acquisitions at full acquisition price.
2For acquisitions, cap rate represents the forecasted first year NOI divided by purchase price. Does not include fees earned related to the unconsolidated joint venture.
3The Company sold 80% of these properties into an unconsolidated joint venture.
4The Company sold 60% of these properties into an unconsolidated joint venture.
5Legacy HTA asset that was sold prior to the merger in July.
6For dispositions, cap rate represents the in-place cash NOI divided by sales price.
| | | | | |
| |
HEALTHCARE REALTY | 3Q 2022 SUPPLEMENTAL INFORMATION 14 |
| | |
| Re/development Activity |
| DOLLARS IN THOUSANDS |
|
| | | | | | | | | | | | | | | | | | | | | | | | | | | |
| RE/DEVELOPMENT PROJECTS | | | |
| MARKET | ASSOCIATED HEALTH SYSTEM | | SQUARE
FEET | CURRENT LEASED % | BUDGET | COST TO COMPLETE | PROJECT START | ESTIMATED COMPLETION | |
| Active development | | | | | | | | |
| Nashville, TN | Ascension | | 106,194 | 50 | % | $44,000 | $28,656 | 2Q 2021 | 3Q 2023 | |
Orlando, FL 1 | Advent Health | | 156,566 | 74 | % | 65,000 | 54,403 | 1Q 2022 | 2Q 2024 | |
| Raleigh, NC | UNC REX Health | | 120,694 | — | % | 49,300 | 34,050 | 2Q 2022 | 4Q 2024 | |
| Total development | | 383,454 | 44 | % | $158,300 | $117,109 | | | |
| Projected stabilized yield - 6.5%-7.5% | | | | | |
| | | | | | | | | |
| Active redevelopment | | | | | | | | |
Seattle, WA 2 | MultiCare | | 56,000 | 100 | % | $12,500 | $2,198 | 1Q 2021 | 4Q 2022 | |
| Dallas, TX | Baylor Scott & White | | 217,114 | 61 | % | 17,500 | 6,394 | 4Q 2020 | 4Q 2023 | |
| Washington, DC | Inova Health | | 259,290 | 62 | % | 21,200 | 19,163 | 1Q 2022 | 2Q 2024 | |
| Total redevelopment | | 532,404 | 66 | % | $51,200 | $27,755 | | | |
| Projected stabilized yield - 8.0%-11.0% | | | | | |
| | | | | | | | | |
| Total active re/development projects | 915,858 | 57 | % | $209,500 | $144,864 | | | |
| | | | | | | | | |
| | | | | | | | | |
| | | | | | | | | |
| | | | | | | | | |
| | | | | | | | | |
| | | | | | | | | |
| | | | | | | | | |
| | | | | | | | | | | | | | | | | | | | |
| PROSPECTIVE RE/DEVELOPMENT |
| MARKET | TYPE | SQUARE FEET 3 | LEASED % 4 | BUDGET | EXPECTED START | PROJECT DESCRIPTION |
| Fort Worth, TX | Dev | 102,000 | 40 | % | $48,000 | 2H 2023 | New on-campus MOB |
| Orlando, FL | Dev | 45,000 | 100 | % | 25,900 | 2H 2023 | Phase one of a two phase development |
| Houston, TX | Dev | 112,000 | 60 | % | 53,200 | 2H 2024 | New on-campus MOB |
| Denver, CO | Dev | 230,000 | 100 | % | 150,000 | 2H 2024 | New surgical facility and MOB adjacent to campus |
| Houston, TX | Redev | 297,423 | 61 | % | 20,275 | 2H 2023 | Redevelopment of two on-campus MOBs |
| Chicago, IL | Redev | 73,657 | 55 | % | 10,962 | 2H 2023 | Redevelopment of an MOB in Chicago |
| Washington, DC | Redev | 57,323 | 79 | % | 10,078 | 2H 2023 | Off-campus MOB redevelopment |
| Total prospective re/development | 917,403 | 71 | % | $318,415 | | |
1Investment is a construction loan with purchase rights upon completion.
2Redevelopment project is a 23,000 square foot expansion to an existing medical office building. When complete, the building will be approximately 56,000 square feet.
3If project is identified as development (dev), then amount is projected building size. If project is a redevelopment (redev), then amount is existing building size.
4If project is identified as dev, then amount is expected preleasing percentage. If project is a redev, then amount is equal to current actual leased percentage.
| | | | | |
| |
HEALTHCARE REALTY | 3Q 2022 SUPPLEMENTAL INFORMATION 15 |
| | |
Portfolio 1,2,3 |
| DOLLARS IN THOUSANDS |
|
| | | | | | | | | | | | | | | | | | | | | | | | | | | | | | | | | | | | | | | | | | | |
| MARKETS | | | | |
| | | WHOLLY OWNED COUNT | | SQUARE FEET | WHOLLY OWNED |
| | | | | | | | | | |
| MARKET | MSA RANK | | | MOB | | | INPATIENT/SURGICAL | OFFICE | | WHOLLY OWNED | JOINT VENTURES | TOTAL | % OF NOI | CUMULATIVE % OF NOI |
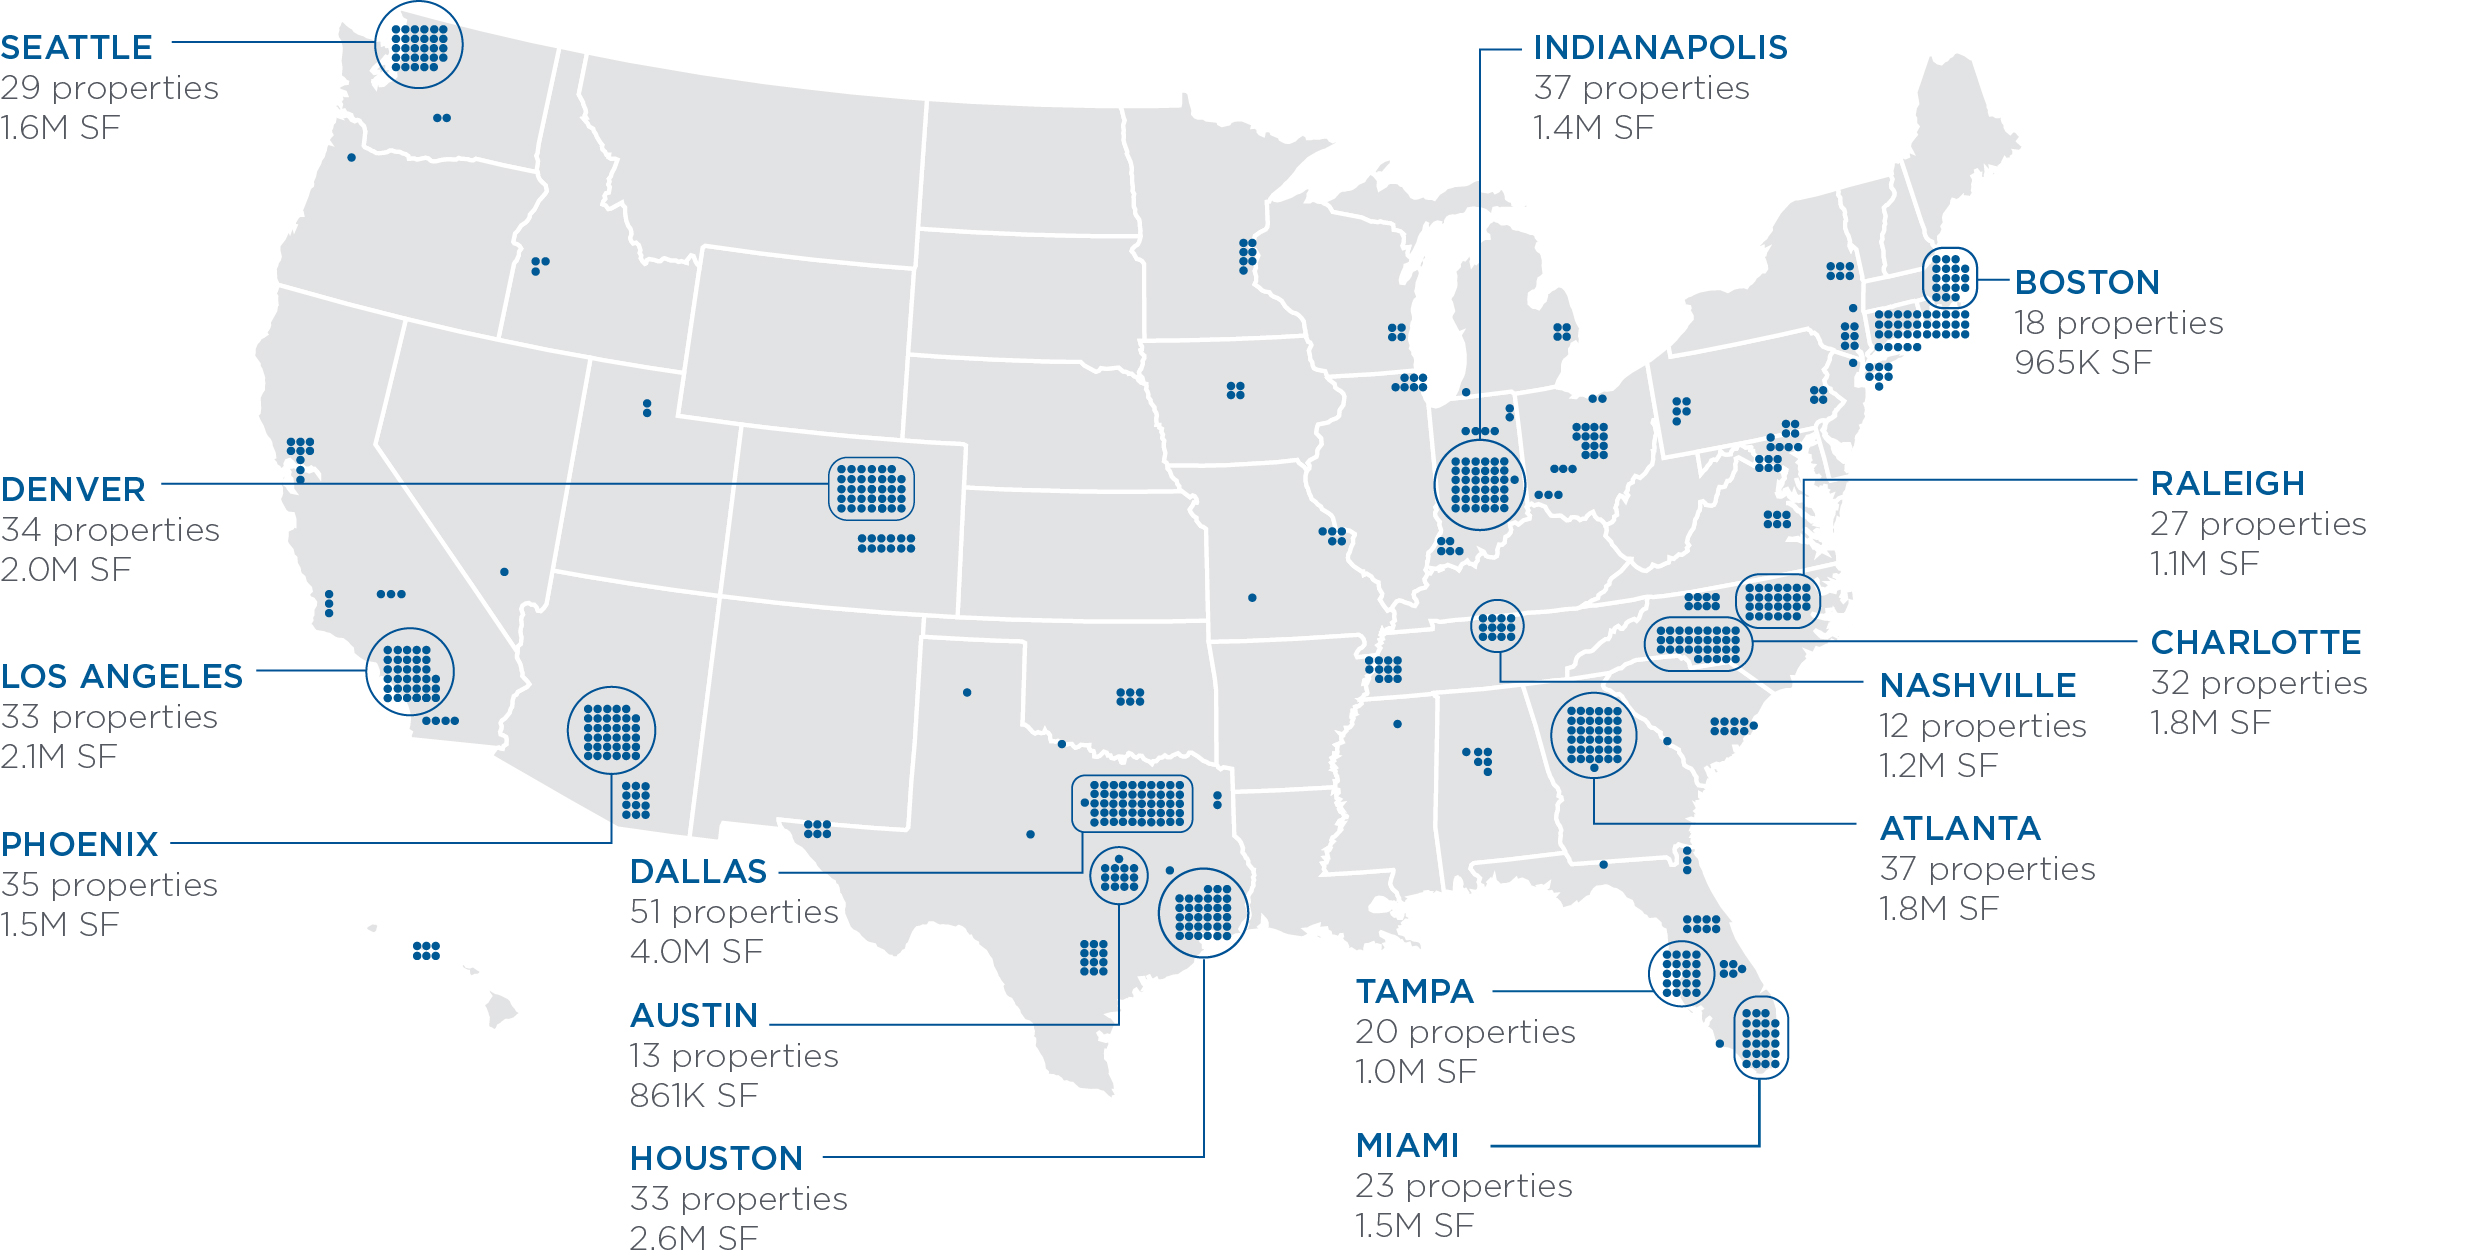
| Dallas, TX | 4 | | 45 | | 3,307,773 | | | 302,764 | 199,800 | | 3,810,337 | 189,385 | 3,999,722 | 9.6 | % | 9.6 | % |
| Seattle, WA | 15 | | 29 | | 1,569,388 | | | | | | 1,569,388 | | 1,569,388 | 5.7 | % | 15.3 | % |
| Houston, TX | 5 | | 33 | | 2,376,134 | | | 150,723 | 57,170 | | 2,584,027 | | 2,584,027 | 4.7 | % | 20.0 | % |
| Los Angeles, CA | 2 | | 23 | | 1,218,579 | | | 63,000 | 104,377 | | 1,385,956 | 702,453 | 2,088,409 | 4.7 | % | 24.7 | % |
| Atlanta, GA | 9 | | 37 | | 1,826,752 | | | | | | 1,826,752 | | 1,826,752 | 4.4 | % | 29.1 | % |
| Boston, MA | 11 | | 18 | | 964,945 | | | | | | 964,945 | | 964,945 | 4.3 | % | 33.4 | % |
| Charlotte, NC | 22 | | 32 | | 1,790,415 | | | | | | 1,790,415 | | 1,790,415 | 4.1 | % | 37.5 | % |
| Denver, CO | 19 | | 32 | | 1,741,127 | | | | 93,869 | | 1,834,996 | 116,616 | 1,951,612 | 4.1 | % | 41.6 | % |
| Miami, FL | 7 | | 23 | | 1,414,085 | | | 133,500 | | | 1,547,585 | | 1,547,585 | 3.8 | % | 45.4 | % |
| Phoenix, AZ | 10 | | 35 | | 1,512,304 | | | | | | 1,512,304 | | 1,512,304 | 2.7 | % | 48.1 | % |
| Tampa, FL | 18 | | 20 | | 1,012,094 | | | | | | 1,012,094 | | 1,012,094 | 2.7 | % | 50.8 | % |
| Raleigh, NC | 42 | | 27 | | 1,103,636 | | | | | | 1,103,636 | | 1,103,636 | 2.5 | % | 53.3 | % |
| Nashville, TN | 36 | | 12 | | 1,135,640 | | | | 108,691 | | 1,244,331 | | 1,244,331 | 2.4 | % | 55.7 | % |
| Austin, TX | 29 | | 13 | | 861,481 | | | | | | 861,481 | | 861,481 | 2.3 | % | 58.0 | % |
| Indianapolis, IN | 33 | | 36 | | 1,080,947 | | | 61,398 | | | 1,142,345 | 273,479 | 1,415,824 | 2.2 | % | 60.2 | % |
| Chicago, IL | 3 | | 7 | | 712,644 | | | | | | 712,644 | | 712,644 | 2.2 | % | 62.4 | % |
| Hartford, CT | 48 | | 30 | | 768,947 | | | | | | 768,947 | | 768,947 | 2.1 | % | 64.5 | % |
| New York, NY | 1 | | 14 | | 614,522 | | | | | | 614,522 | | 614,522 | 1.8 | % | 66.3 | % |
| Orlando, FL | 23 | | 8 | | 359,477 | | | 186,998 | | | 546,475 | | 546,475 | 1.8 | % | 68.1 | % |
| Washington, DC | 6 | | 9 | | 692,107 | | | | | | 692,107 | | 692,107 | 1.7 | % | 69.8 | % |
| Other (51 markets) | | | 212 | | 11,286,401 | | | 629,392 | 1,224,943 | | 13,140,736 | 630,776 | 13,771,512 | 30.2 | % | 100.0 | % |
| Total | | | 695 | | 37,349,398 | | | 1,527,775 | 1,788,850 | | 40,666,023 | 1,912,709 | 42,578,732 | 100.0 | % | |
| Number of properties | | | | 665 | | | 20 | 10 | | 695 | 33 | 728 | | |
| % of square feet | | | | | 91.8 | % | | | 3.8 | % | 4.4 | % | | 100.0 | % | | | | |
| % multi-tenant | | | | | 84.0 | % | | | — | % | 61.8 | % | | 81.6 | % | | | | |
Investment | | | | | $12,796,986 | | | $666,409 | $501,164 | | $13,964,559 | | | | |
Quarterly cash NOI 5 | | | | $184,560 | | | $12,105 | $7,249 | | $203,914 | | | | |
| % of cash NOI | | | | | 90.5 | % | | | 5.9 | % | 3.6 | % | | 100.0 | % | | | | |
| | | | | | | | | | | | | | | | | |
| BY BUILDING TYPE | | | | | |
| WHOLLY OWNED | | |
| MULTI-TENANT | SINGLE-TENANT | SUBTOTAL | JOINT VENTURE 5 | TOTAL |
| Number of properties | 547 | 148 | 695 | 33 | 728 |
| Square feet | 32,493,976 | 8,172,047 | 40,666,023 | 1,912,709 | 42,578,732 |
| % of square feet | 76.3 | % | 19.2 | % | 95.5 | % | 4.5 | % | 100.0 | % |
Investment 2 | $10,573,019 | $3,391,540 | $13,964,559 | $459,845 | $14,424,404 |
Quarterly cash NOI 2,4 | $151,048 | $52,866 | $203,914 | $3,922 | $207,836 |
| % of cash NOI | 72.7 | % | 25.4 | % | 98.1 | % | 1.9 | % | 100.0 | % |
1On July 20, 2022, Legacy HR and Legacy HTA closed the merger of the two companies, in which Legacy HR was the acquirer under GAAP. Accordingly, the historic financial statements of the combined company are those of Legacy HR. Unless otherwise noted, third quarter data is for the combined company, whether on an actual or pro forma basis.
2Gross investment and quarterly cash NOI are reflected at the Company's ownership percentage.
3Excludes assets held for sale, land held for development, construction in progress and corporate property.
4Includes Legacy HTA on a full quarter proforma basis.
5The Company's weighted average ownership percentage in its joint ventures was approximately 49%.
| | | | | |
| |
HEALTHCARE REALTY | 3Q 2022 SUPPLEMENTAL INFORMATION 16 |
| | | | | | | | | | | | | | | | | | | | | | | | | | |
| MOB PORTFOLIO | |
| | | BUILDING SQUARE FEET | | LEASED BY HEALTH SYSTEM | % OF LEASED SF |
| | | | | | |
| HEALTH SYSTEM | SYSTEM RANK 3 | CREDIT RATING | ON/ADJACENT 4 | OFF-CAMPUS AFFILIATED 5 | TOTAL | % OF NOI 6 |
| HCA Healthcare | 1 | BBB-/Baa3 | 2,431,873 | 734,759 | 3,166,632 | | 8.7 | % | 831,004 | 2.3 | % |
| CommonSpirit Health | 4 | A-/Baa1 | 1,906,957 | 593,550 | 2,500,507 | | 6.6 | % | 880,442 | 2.5 | % |
| Baylor Scott & White Health | 21 | AA-Aa3 | 2,570,180 | 66,376 | 2,636,556 | | 6.1 | % | 1,670,906 | 4.7 | % |
| Ascension Health | 3 | AA+/Aa2 | 2,147,950 | 97,551 | 2,245,501 | | 5.4 | % | 942,610 | 2.6 | % |
| Tenet Healthcare | 6 | B+/B2 | 1,525,855 | 414,278 | 1,940,133 | | 4.3 | % | 503,670 | 1.4 | % |
| Atrium Health | 16 | AA-/Aa3 | 682,654 | 348,792 | 1,031,446 | | 3.2 | % | 907,825 | 2.5 | % |
| Community Health Systems | 8 | CCC+/Caa2 | 1,024,527 | — | | 1,024,527 | | 3.0 | % | 391,827 | 1.1 | % |
| AdventHealth | 11 | AA/Aa2 | 797,587 | 118,585 | 916,172 | | 2.6 | % | 410,916 | 1.2 | % |
| Wellstar Health System | 75 | A/A2 | 896,773 | 23,088 | 919,861 | | 2.4 | % | 563,458 | 1.6 | % |
| UW Medicine (Seattle) | 91 | AA+/Aaa | 461,363 | 169,709 | 631,072 | | 2.4 | % | 292,712 | 0.8 | % |
| Trinity Health | 7 | AA-/Aa3 | 633,711 | 154,009 | 787,720 | | 2.0 | % | 493,502 | 1.4 | % |
| Baptist Memorial Health Care | 89 | BBB+/-- | 544,122 | 252,414 | 796,536 | | 1.9 | % | 439,510 | 1.2 | % |
| Providence St. Joseph Health | 5 | AA-/A1 | 330,287 | 31,601 | 361,888 | | 1.5 | % | 267,053 | 0.7 | % |
| Banner Health | 24 | AA-/-- | 749,075 | 31,039 | 780,114 | | 1.4 | % | 147,178 | 0.4 | % |
| Cedars-Sinai Health Systems | 51 | --/Aa3 | 199,701 | 90,607 | 290,308 | | 1.4 | % | 52,891 | 0.1 | % |
| Hawaii Pacific Health | 181 | --/A1 | 173,502 | 124,925 | 298,427 | | 1.3 | % | 97,735 | 0.3 | % |
| Overlake Health System | 291 | A/A2 | 230,710 | — | | 230,710 | | 1.2 | % | 73,676 | 0.2 | % |
| Medstar Health | 45 | A/A2 | 322,033 | — | | 322,033 | | 1.2 | % | 223,965 | 0.6 | % |
| Bon Secours Health System | 22 | A+/A1 | 405,945 | — | | 405,945 | | 1.1 | % | 236,637 | 0.7 | % |
| Wakemed | 185 | --/A2 | 368,046 | 101,597 | 469,643 | | 1.1 | % | 114,435 | 0.3 | % |
| Indiana University Health | 26 | AA/Aa2 | 175,499 | 269,320 | 444,819 | | 1.1 | % | 376,076 | 1.1 | % |
| Other (65 credit rated systems) | | | 6,516,945 | 2,993,071 | 9,510,016 | | 23.7 | % | 4,303,034 | 12.1 | % |
Subtotal - credit rated 7 | | | 25,095,295 | 6,615,271 | 31,710,566 | | 83.6 | % | 14,221,062 | 39.8 | % |
Other non-credit rated 8 | | | 1,162,849 | 404,076 | 1,566,925 | | 5.7 | % | 861,170 | 2.4 | % |
Off-campus non-affiliated 9 | | | — | 4,071,907 | 4,071,907 | | 10.7 | % | 49,919 | 0.1 | % |
| Wholly-owned | | | 26,258,144 | 11,091,254 | 37,349,398 | | 100.0 | % | 15,132,151 | 42.3 | % |
| Joint ventures | | | 1,143,456 | 579,868 | 1,723,324 | | | | |
| Total | | | 27,401,600 | 11,671,122 | 39,072,722 | | | | |
1On July 20, 2022, Legacy HR and Legacy HTA closed the merger of the two companies, in which Legacy HR was the acquirer under GAAP. Accordingly, the historic financial statements of the combined company are those of Legacy HR. Unless otherwise noted, third quarter data is for the combined company, whether on an actual or pro forma basis.
2Includes joint venture properties at total square feet. Excludes construction in progress and assets classified as held for sale.
3Ranked by revenue based on Modern Healthcare's Healthcare Systems Financials Database.
4The Company defines an adjacent property as being no more than 0.25 miles from a hospital campus.
5Includes off-campus buildings where health systems lease 20% or more of the property and are located within 2 miles from a hospital campus.
6Includes Legacy HTA on a full quarter proforma basis.
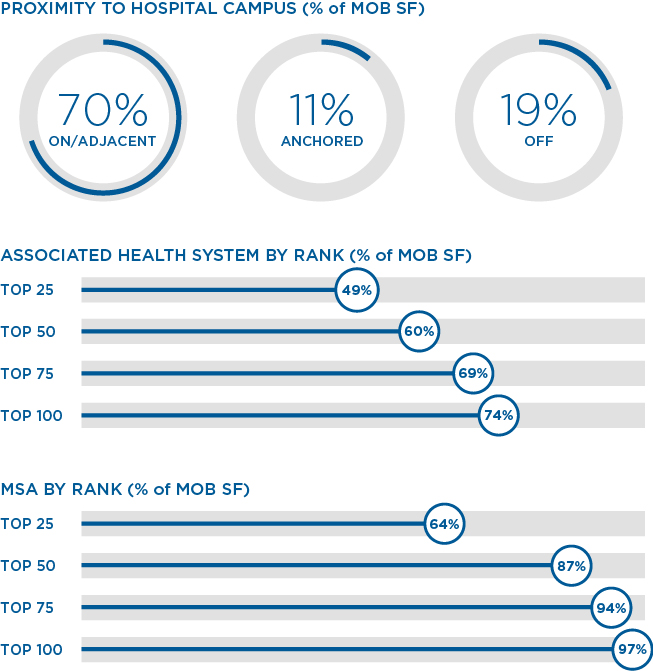
7Based on square footage, 76.4% is associated and 42.2% is leased by an investment-grade rated healthcare provider.
8Includes nine properties associated with a hospital system that is not credit rated.
9Includes off-campus buildings that are not anchored by a health system and are more than two miles from a hospital campus.
| | | | | |
| |
HEALTHCARE REALTY | 3Q 2022 SUPPLEMENTAL INFORMATION 17 |
| | |
MOB Proximity to Hospital 1,2 |
|
|
| | | | | | | | | | | | | | |
| MEDICAL OFFICE BUILDINGS BY LOCATION | | | | | | |
| | | | | | |
| | | WHOLLY-OWNED | JOINT VENTURE | TOTAL | |
| On campus | | | 45.6 | % | 55.8 | % | 46.0 | % | |
Adjacent to campus 3 | | | 24.7 | % | 10.6 | % | 24.1 | % | |
| Total on/adjacent | | | 70.3 | % | 66.4 | % | 70.1 | % | |
Off campus - anchored by health system 4 | | | 11.4 | % | 7.1 | % | 11.2 | % | |
| Off campus | | | 18.3 | % | 26.5 | % | 18.7 | % | |
| | | 100.0 | % | 100.0 | % | 100.0 | % | |
| Square feet | | | 37,349,398 | 1,723,324 | 39,072,722 | |
| % of total | | | 95.6 | % | 4.4 | % | 100.0 | % | |
| | | | | | | | | | | | | | | | | | | | | | | | | | | | | | |
| DISTANCE TO HOSPITAL CAMPUS |
| | | | | | | | GROUND LEASE PROPERTIES |
| GREATER THAN | LESS THAN OR EQUAL TO | CAMPUS PROXIMITY | # OF PROPERTIES | SQUARE FEET | % OF TOTAL | CUMULATIVE % | | # OF PROPERTIES | SQUARE FEET | % OF TOTAL |
| 0.00 | On campus | 231 | 17,990,046 | 46.0 | % | 46.0 | % | | 180 | 14,231,683 | 81.0 | % |
| 0.00 | 0.25 miles | Adjacent 3 | 205 | 9,411,554 | 24.1 | % | 70.1 | % | | 30 | 1,529,970 | 8.7 | % |
| 0.25 miles | 2.00 | Affiliated | 102 | 5,183,814 | 13.3 | % | 83.4 | % | | 12 | 824,896 | 4.7 | % |
| 2.00 | | Off campus | 154 | | 6,487,308 | 16.6 | % | 100.0 | % | 19 | | 980,809 | 5.6 | % |
| Totals | | 692 | | 39,072,722 | 100.0 | % | | | 241 | | 17,567,358 | 100.0 | % |
| Wholly-owned | | 665 | | 37,349,398 | | | | | | |
| Joint ventures | | 27 | | 1,723,324 | | | | | | |
1Includes joint venture properties and excludes construction in progress and assets classified as held for sale.
2Proximity to hospital campus includes acute care hospitals with inpatient beds. The Company does not consider inpatient rehab hospitals (IRFs), skilled nursing facilities (SNFs) or long-term acute care hospitals (LTACHs) to be hospital campuses for distance calculations.
3The Company defines an adjacent property as being no more than 0.25 miles from a hospital campus.
4Includes buildings where health systems lease 20% or more of the property.
| | | | | |
| |
HEALTHCARE REALTY | 3Q 2022 SUPPLEMENTAL INFORMATION 18 |
| | |
Lease Maturity & Occupancy1 |
|
|
| | | | | | | | | | | | | | | | | | | | | | | |
| LEASE MATURITY SCHEDULE | | | |
| | MULTI-TENANT 2 | SINGLE-TENANT | TOTAL |
| | # OF LEASES | SQUARE FEET | # OF LEASES | SQUARE FEET | # OF LEASES | SQUARE FEET | % OF LEASED SQUARE FEET |
| 2022 | 475 | 1,184,604 | 2 | | 107,886 | 477 | 1,292,490 | 3.6 | % |
| 2023 | 1,237 | 3,875,183 | 12 | | 725,347 | 1,249 | 4,600,530 | 12.9 | % |
| 2024 | 1,146 | 4,239,202 | 18 | | 914,693 | 1,164 | 5,153,895 | 14.4 | % |
| 2025 | 981 | 3,465,089 | 16 | | 863,089 | 997 | 4,328,178 | 12.1 | % |
| 2026 | 805 | 3,120,939 | 9 | | 485,445 | 814 | 3,606,384 | 10.1 | % |
| 2027 | 746 | 3,083,335 | 23 | | 1,364,498 | 769 | 4,447,833 | 12.5 | % |
| 2028 | 389 | 1,719,074 | 15 | | 662,660 | 404 | 2,381,734 | 6.7 | % |
| 2029 | 358 | 1,664,703 | 15 | | 752,632 | 373 | 2,417,335 | 6.8 | % |
| 2030 | 267 | 1,539,505 | 13 | | 625,890 | 280 | 2,165,395 | 6.1 | % |
| 2031 | 223 | 964,498 | 3 | | 229,223 | 226 | 1,193,721 | 3.3 | % |
| Thereafter | 422 | 2,842,656 | 21 | | 1,270,835 | 443 | 4,113,491 | 11.5 | % |
| Total leased | 7,049 | 27,698,788 | 147 | | 8,002,198 | 7,196 | 35,700,986 | 87.8 | % |
| Total building | | 32,493,976 | | 8,172,047 | | 40,666,023 | |
| Occupancy | | 85.2 | % | | 97.9 | % | | 87.8 | % | |
WALTR (months) 3 | 50.6 | | 71.7 | | 55.3 | |
WALT (months) 3 | 95.3 | | 146.7 | | 106.8 | |
| | | | | | | | | | | | | | | | | | | | | | | |
| PORTFOLIO OCCUPANCY AND ABSORPTION | | | |
| | | OCCUPANCY % | ABSORPTION |
| # OF PROPERTIES | SQUARE FEET | Q3 2022 | Q2 2022 | Q3 2021 | SEQUENTIAL | Y-O-Y |
| Same store multi-tenant | 456 | 27,316,594 | 86.2 | % | 86.2 | % | 85.5 | % | 2 | 196 |
| Same store single-tenant | 133 | 7,414,773 | 99.5 | % | 99.5 | % | 99.9 | % | — | (29) |
| Total same store properties | 589 | 34,731,367 | 89.1 | % | 89.1 | % | 88.6 | % | 2 | 167 |
| Acquisitions | 85 | 4,234,607 | 89.3 | % | 89.6 | % | 88.2 | % | (14) | 29 |
| Development completions | 6 | 409,801 | 86.8 | % | 82.6 | % | 79.8 | % | 17 | 29 |
| Re/development | 11 | 1,067,458 | 58.4 | % | 63.9 | % | 76.3 | % | (59) | (191) |
| Planned dispositions | 4 | 222,790 | 2.4 | % | 25.1 | % | 26.5 | % | (51) | (54) |
| Wholly-owned | 695 | 40,666,023 | 87.8 | % | 88.0 | % | 87.8 | % | (105) | (20) |
| Joint ventures | 33 | 1,912,709 | 85.5 | % | 87.2 | % | 88.5 | % | 8 | 6 |
| Total | 728 | 42,578,732 | 87.7 | % | 88.0 | % | 87.8 | % | (97) | (14) |
1Excludes joint ventures land held for development, construction in progress, corporate property and assets classified as held for sale.
2The average lease size in the multi-tenant portfolio is 3,929 square feet.
3WALTR = weighted average lease term remaining; WALT = weighted average lease term.
| | | | | |
| |
HEALTHCARE REALTY | 3Q 2022 SUPPLEMENTAL INFORMATION 19 |
| | |
Leasing Statistics 1 |
|
| REFLECTS COMBINED COMPANY RESULTS FOR ALL PERIODS |
| | | | | | | | | | |
| SAME STORE 3Q 2022 RENEWALS |
| Q3 2022 | TTM | | |
| | | | |
| Cash leasing spreads | 2.9 | % | 2.3 | % | | |
| | | | |
| Cash leasing spreads distribution | | | |
| < 0% spread | 10.1 | % | 12.7 | % | | |
| 0-3% spread | 25.7 | % | 24.4 | % | | |
| 3-4% spread | 42.5 | % | 42.6 | % | | |
| > 4% spread | 21.7 | % | 20.3 | % | | |
| Total | 100.0 | % | 100.0 | % | | |
| | | | |
| Tenant retention rate | 79.1 | % | 80.2 | % | | |
| | | | |
| | | | |
| | | | | | | | | | | | | | | | | | | | | | | | | | |
AVERAGE IN-PLACE CONTRACTUAL INCREASES 2 |
| MULTI-TENANT | SINGLE-TENANT | TOTAL |
| % INCREASE | % OF
BASE RENT | | % INCREASE | % OF
BASE RENT | | % INCREASE | % OF
BASE RENT |
| Same store | 2.75 | % | 63.0 | % | | 2.28 | % | 19.4 | % | | 2.64 | % | 82.4 | % |
| Acquisitions | 2.40 | % | 10.6 | % | | 2.59 | % | 1.9 | % | | 2.43 | % | 12.6 | % |
Other 3 | 2.52 | % | 4.0 | % | | 1.23 | % | 1.0 | % | | 2.24 | % | 5.0 | % |
| Total | 2.69 | % | 77.6 | % | | 2.25 | % | 22.4 | % | | 2.60 | % | 100.0 | % |
| Escalator type | | | | | | | | |
| Fixed | 2.73 | % | 96.6 | % | | 2.38 | % | 84.6 | % | | 2.66 | % | 93.9 | % |
| CPI | 1.78 | % | 3.4 | % | | 1.57 | % | 15.4 | % | | 1.66 | % | 6.1 | % |
| | | | | | | | | | | | | | |
| TYPE AND OWNERSHIP STRUCTURE |
| MULTI-TENANT | SINGLE-TENANT | | TOTAL |
| Tenant type | | | | |
| Hospital | 44.9 | % | 74.0 | % | | 51.4 | % |
| Physician and other | 55.1 | % | 26.0 | % | | 48.6 | % |
| | | | |
| Lease structure | | | | |
| Gross | 8.6 | % | 6.4 | % | | 8.1 | % |
| Modified gross | 32.2 | % | 9.3 | % | | 27.0 | % |
| Net | 59.2 | % | 53.2 | % | | 57.9 | % |
Absolute net 4 | — | % | 31.1 | % | | 7.0 | % |
| | | | |
| Ownership type | | | | |
| Ground lease | 45.0 | % | 31.1 | % | | 42.2 | % |
| Fee simple | 55.0 | % | 68.9 | % | | 57.8 | % |
| | | | | | | | |
| # OF LEASES BY SIZE |
| LEASED SQUARE FEET | MULTI-TENANT | SINGLE-TENANT |
| 0 - 2,500 | 3,760 | | — | |
| 2,501 - 5,000 | 1,765 | | 2 | |
| 5,001 - 7,500 | 615 | | 5 | |
| 7,501 - 10,000 | 321 | | 6 | |
| 10,001 + | 588 | | 134 | |
| Total Leases | 7,049 | | 147 | |
| | |
| | |
| | |
| | |
| | |
| | |
1Excludes recently acquired or disposed properties, construction in progress, land held for development, corporate property, planned dispositions and assets classified as held for sale.
2Excludes leases with lease terms of one year or less.
3Includes redevelopment properties, development completions, and joint ventures.
4Tenant is typically responsible for operating expenses and capital obligations.
| | | | | |
| |
HEALTHCARE REALTY | 3Q 2022 SUPPLEMENTAL INFORMATION 20 |
| | |
NOI Performance 1 |
| DOLLARS IN THOUSANDS, EXCEPT PER SQUARE FOOT DATA |
| REFLECTS COMBINED COMPANY RESULTS FOR ALL PERIODS |
| | | | | | | | | | | | | | | | | | | | | | | | | | | | | | | | | | | | | | | | | |
| SAME STORE CASH NOI |
| TTM 2022 | | 3Q 2022 | 2Q 2022 | 1Q 2022 | 4Q 2021 | | TTM 2021 | | 3Q 2021 | 2Q 2021 | 1Q 2021 | 4Q 2020 |
| | | | | | | | | | | | | |
| | | | | | | | | | | | | |
| | | | | | | | | | | | | |
| | | | | | | | | | | | | |
| | | | | | | | | | | | | |
| | | | | | | | | | | | | |
| | | | | | | | | | | | | |
| | | | | | | | | | | | | |
| | | | | | | | | | | | | |
| | | | | | | | | | | | | |
| | | | | | | | | | | | | |
| | | | | | | | | | | | | |
| | | | | | | | | | | | | |
| | | | | | | | | | | | | |
| | | | | | | | | | | | | |
| | | | | | | | | | | | | |
| Base revenue | $846,256 | | $214,096 | $211,551 | $211,481 | $209,128 | | $824,435 | | $207,385 | $205,798 | $204,970 | $206,282 |
| Operating expense recoveries | 246,903 | | 64,710 | 61,215 | 62,724 | 58,254 | | 231,516 | | 58,316 | 57,961 | 58,896 | 56,343 |
| Revenues | $1,093,159 | | $278,806 | $272,766 | $274,205 | $267,382 | | $1,055,951 | | $265,701 | $263,759 | $263,866 | $262,625 |
| Expenses | 379,253 | | 99,978 | 92,983 | 96,672 | 89,620 | | 358,624 | | 91,750 | 88,514 | 89,967 | 88,393 |
| Cash NOI | $713,906 | | $178,828 | $179,783 | $177,533 | $177,762 | | $697,327 | | $173,951 | $175,245 | $173,899 | $174,232 |
Revenue per occ SF 2 | $35.43 | | $36.05 | $35.33 | $35.58 | $34.73 | | $34.16 | | $34.54 | $34.24 | $34.11 | $33.78 |
| Margin | 65.3 | % | | 64.1 | % | 65.9 | % | 64.7 | % | 66.5 | % | | 66.0 | % | | 65.5 | % | 66.4 | % | 65.9 | % | 66.3 | % |
| Average occupancy | 88.8 | % | | 89.1 | % | 88.9 | % | 88.8 | % | 88.7 | % | | 89.0 | % | | 88.6 | % | 88.7 | % | 89.1 | % | 89.5 | % |
| Period end occupancy | 89.1 | % | | 89.1 | % | 89.1 | % | 88.8 | % | 88.8 | % | | 88.6 | % | | 88.6 | % | 88.6 | % | 88.8 | % | 89.4 | % |
| Number of properties | 589 | | 589 | 589 | 589 | 589 | | 589 | | 589 | 589 | 589 | 589 |
| | | | | | | | | | | | | | | | | | | |
| SAME STORE GROWTH | |
| | YEAR-OVER-YEAR | |
| TTM 2022 | | 3Q 2022 | 2Q 2022 | 1Q 2022 | 4Q 2021 | |
| | | | | | | |
| | | | | | | |
| | | | | | | |
| | | | | | | |
| | | | | | | |
| | | | | | | |
| | | | | | | |
| | | | | | | |
| | | | | | | |
Revenue per occ SF 2 | 3.7 | % | | 4.4 | % | 3.2 | % | 4.3 | % | 2.8 | % | |
| Avg occupancy (bps) | -20 | | +50 | +20 | -30 | -80 | |
| Revenues | 3.5 | % | | 4.9 | % | 3.4 | % | 3.9 | % | 1.8 | % | |
| Base revenue | 2.6 | % | | 3.2 | % | 2.8 | % | 3.2 | % | 1.4 | % | |
| Exp recoveries | 6.6 | % | | 11.0 | % | 5.6 | % | 6.5 | % | 3.4 | % | |
| Expenses | 5.8 | % | | 9.0 | % | 5.0 | % | 7.5 | % | 1.4 | % | |
| Cash NOI | 2.4 | % | | 2.8 | % | 2.6 | % | 2.1 | % | 2.0 | % | |
| | | | | | | |
| | | | | | | | | | | | | | | | | | | | | | | |
| TOTAL CASH NOI |
| 3Q 2022 | 3Q 2021 | % CHANGE | | TTM 2022 | TTM 2021 | % CHANGE |
| Same store cash NOI | $178,828 | | $173,951 | | 2.8 | % | | $713,906 | | $697,327 | | 2.4 | % |
| Same store joint ventures | 1,152 | | 1,062 | | 8.5 | % | | 4,512 | | 4,398 | | 2.6 | % |
| 179,980 | | 175,013 | | 2.8 | % | | 718,418 | | 701,725 | | 2.4 | % |
| Redevelopment | 2,792 | | 4,765 | | (41.4 | %) | | 12,214 | | 17,943 | | (31.9 | %) |
| Acquisitions/development completions | 22,815 | | 9,623 | | 137.1 | % | | 76,836 | | 21,686 | | 254.3 | % |
| Dispositions/assets held for sale/other | 7,033 | | 16,368 | | (57.0 | %) | | 49,819 | | 73,407 | | (32.1 | %) |
| Joint venture property cash NOI | 2,770 | | 1,170 | | 136.8 | % | | 8,640 | | 2,746 | | 214.6 | % |
| Cash NOI | $215,390 | | $206,939 | | 4.1 | % | | $865,927 | | $817,507 | | 5.9 | % |
| | | | | | | |
1Excludes recently acquired or disposed properties, development completions, construction in progress, land held for development, corporate property, reposition properties and assets classified as held for sale.
2Revenue per occ SF is calculated by dividing revenue by the average of the occupied SF for the period provided. Quarterly revenue per occ SF is annualized.
| | | | | |
| |
HEALTHCARE REALTY | 3Q 2022 SUPPLEMENTAL INFORMATION 21 |
| | |
| NOI Reconciliations |
| DOLLARS IN THOUSANDS |
|
| | | | | | | | | | | | | | | | | | | | | | | | | | | | | | | | | | | | | |
| BOTTOM UP RECONCILIATION | | | | | | | | | | | | | | | | | |
| 3Q 2022 | 2Q 2022 | 1Q 2022 | 4Q 2021 | | | | 3Q 2021 | 2Q 2021 | 1Q 2021 | 4Q 2020 | | | | | | |
| Net income (loss) | $28,304 | | $6,130 | | $42,227 | | $21,607 | | | | | ($2,066) | | $23,096 | | $24,022 | | ($15,863) | | | | | | | |
| | | | | | | | | | | | | | | | | |
| | | | | | | | | | | | | | | | | |
| Non-controlling interests | 312 | | — | | — | | — | | | | | — | | — | | — | | — | | | | | | | |
| Other income (expense) | (89,477) | | 7,479 | | (29,293) | | (468) | | | | | 23,000 | | (2,223) | | (5,220) | | 35,284 | | | | | | | |
| General and administrative expense | 16,741 | | 10,540 | | 11,036 | | 8,901 | | | | | 8,207 | | 8,545 | | 8,499 | | 7,206 | | | | | | | |
| Depreciation and amortization expense | 158,117 | | 55,731 | | 54,041 | | 51,810 | | | | | 50,999 | | 49,826 | | 50,079 | | 48,104 | | | | | | | |
Other expenses 1 | 82,659 | | 11,034 | | 9,929 | | 3,850 | | | | | 3,193 | | 2,840 | | 2,783 | | 2,919 | | | | | | | |
| Straight-line rent expense | 1,260 | | 378 | | 378 | | 382 | | | | | 380 | | 369 | | 367 | | 369 | | | | | | | |
| Straight-line rent revenue | (8,975) | | (1,705) | | (1,587) | | (1,227) | | | | | (1,550) | | (1,563) | | (1,461) | | (1,013) | | | | | | | |
Other revenue 2 | (5,242) | | (1,961) | | (2,044) | | (2,134) | | | | | (2,043) | | (2,075) | | (1,865) | | (2,145) | | | | | | | |
| Joint venture property cash NOI | 3,922 | | 2,551 | | 2,052 | | 1,331 | | | | | 1,210 | | 1,035 | | 465 | | 135 | | | | | | | |
| Cash NOI | $187,621 | | $90,177 | | $86,739 | | $84,052 | | | | | $81,330 | | $79,850 | | $77,669 | | $74,996 | | | | | | | |
| Pre-merger Legacy HTA NOI | 27,769 | | 130,788 | | 129,476 | | 129,305 | | | | | 125,609 | | 126,311 | | 126,278 | | 125,464 | | | | | | | |
| Proforma Cash NOI | $215,390 | | $220,965 | | $216,215 | | $213,357 | | | | | $206,939 | | $206,161 | | $203,947 | | $200,460 | | | | | | | |
| Acquisitions/development completions | (22,815) | | (22,026) | | (18,027) | | (13,968) | | | | | (9,623) | | (6,467) | | (4,747) | | (849) | | | | | | | |
| Dispositions/assets held for sale/other | (7,033) | | (12,968) | | (14,114) | | (15,704) | | | | | (16,368) | | (17,749) | | (19,348) | | (19,943) | | | | | | | |
| Joint venture property cash NOI | (3,922) | | (3,648) | | (3,158) | | (2,424) | | | | | (2,232) | | (2,183) | | (1,542) | | (1,186) | | | | | | | |
| Redevelopment | (2,792) | | (2,540) | | (3,383) | | (3,499) | | | | | (4,765) | | (4,517) | | (4,411) | | (4,250) | | | | | | | |
| Proforma Same store cash NOI | $178,828 | | $179,783 | | $177,533 | | $177,762 | | | | | $173,951 | | $175,245 | | $173,899 | | $174,232 | | | | | | | |
| | | | | | | | | | | | | | | | | |
| TOP DOWN RECONCILIATION | | | | | | | | | | | | | | | | | |
| 3Q 2022 | 2Q 2022 | 1Q 2022 | 4Q 2021 | | | | 3Q 2021 | 2Q 2021 | 1Q 2021 | 4Q 2020 | | | | | | |
| Rental income before rent concessions | $301,692 | | $142,073 | | $139,775 | | $132,853 | | | | | $132,971 | | $129,609 | | $129,466 | | $124,537 | | | | | | | |
| Rent concessions | (2,761) | | (1,441) | | (1,286) | | (1,139) | | | | | (1,225) | | (1,123) | | (1,077) | | (660) | | | | | | | |
| Rental income | 298,931 | | 140,632 | | 138,489 | | 131,714 | | | | | 131,746 | | 128,486 | | 128,389 | | 123,877 | | | | | | | |
| | | | | | | | | | | | | | | | | |
| Parking income | 2,428 | | 1,919 | | 1,753 | | 2,134 | | | | | 2,187 | | 1,880 | | 1,658 | | 1,678 | | | | | | | |
| Interest from financing receivable, net | 2,034 | | 1,957 | | 1,930 | | 1,766 | | | | | 1,917 | | 510 | | — | | — | | | | | | | |
| Exclude straight-line rent revenue | (8,975) | | (1,705) | | (1,587) | | (1,227) | | | | | (1,550) | | (1,563) | | (1,461) | | (1,013) | | | | | | | |
Exclude other non-cash revenue 3 | (2,280) | | (1,142) | | (1,322) | | (1,325) | | | | | (1,261) | | (1,528) | | (1,573) | | (1,820) | | | | | | | |
| Cash revenue | 292,138 | | 141,661 | | 139,263 | | 133,062 | | | | | 133,039 | | 127,785 | | 127,013 | | 122,722 | | | | | | | |
| Property operating expense | (112,473) | | (57,010) | | (57,464) | | (53,032) | | | | | (55,518) | | (51,509) | | (52,215) | | (50,210) | | | | | | | |
Exclude non-cash expenses 4 | 4,034 | | 2,975 | | 2,888 | | 2,691 | | | | | 2,599 | | 2,539 | | 2,406 | | 2,349 | | | | | | | |
| Joint venture property cash NOI | 3,922 | | 2,551 | | 2,052 | | 1,331 | | | | | 1,210 | | 1,035 | | 465 | | 135 | | | | | | | |
| Cash NOI | $187,621 | | $90,177 | | $86,739 | | $84,052 | | | | | $81,330 | | $79,850 | | $77,669 | | $74,996 | | | | | | | |
| Pre-merger Legacy HTA NOI | 27,769 | | 130,788 | | 129,476 | | 129,305 | | | | | 125,609 | | 126,311 | | 126,278 | | 125,464 | | | | | | | |
| Proforma Cash NOI | $215,390 | | $220,965 | | $216,215 | | $213,357 | | | | | $206,939 | | $206,161 | | $203,947 | | $200,460 | | | | | | | |
| Acquisitions/development completions | (22,815) | | (22,026) | | (18,027) | | (13,968) | | | | | (9,623) | | (6,467) | | (4,747) | | (849) | | | | | | | |
| Dispositions/assets held for sale/other | (7,033) | | (12,968) | | (14,114) | | (15,704) | | | | | (16,368) | | (17,749) | | (19,348) | | (19,943) | | | | | | | |
| Joint venture property cash NOI | (3,922) | | (3,648) | | (3,158) | | (2,424) | | | | | (2,232) | | (2,183) | | (1,542) | | (1,186) | | | | | | | |
| Redevelopment | (2,792) | | (2,540) | | (3,383) | | (3,499) | | | | | (4,765) | | (4,517) | | (4,411) | | (4,250) | | | | | | | |
| Proforma Same store cash NOI | $178,828 | | $179,783 | | $177,533 | | $177,762 | | | | | $173,951 | | $175,245 | | $173,899 | | $174,232 | | | | | | | |
1Includes acquisition and pursuit costs, merger-related costs, bad debt, above and below market ground lease intangible amortization, leasing commission amortization, non-cash adjustments for financing receivables, and ground lease straight-line rent.
2Includes management fee income, interest, above and below market lease intangible amortization, lease inducement amortization, lease termination fees, deferred financing cost amortization and principle related to investment in financing receivable, and tenant improvement overage amortization.
3Includes above and below market lease intangibles, lease inducements, lease termination fees, deferred financing cost amortization, financing receivable adjustments, and TI amortization.
4Includes above and below market ground lease intangible amortization, leasing commission amortization, and ground lease straight-line rent.
| | | | | |
| |
HEALTHCARE REALTY | 3Q 2022 SUPPLEMENTAL INFORMATION 22 |
| | |
| NOI Reconciliations |
| DOLLARS IN THOUSANDS |
|
| | | | | | | | | | | | | | | | | | | | | | | | | | | | | | | |
| RECONCILIATION OF NOI TO PROFORMA FULL QUARTER FFO AND NORMALIZED FFO | | | | | | | |
| PROFORMA 3Q 2022 | 2Q 2022 | 1Q 2022 | 4Q 2021 | | | | 3Q 2021 | 2Q 2021 | 1Q 2021 | 4Q 2020 |
| Cash NOI | $215,390 | | $90,177 | | $86,739 | | $84,052 | | | | | $81,330 | | $79,850 | | $77,669 | | $74,996 | |
| General and administrative expense | (18,956) | | (10,540) | | (11,036) | | (8,901) | | | | | (8,207) | | (8,545) | | (8,499) | | (7,206) | |
| Straight-line rent | 11,456 | | 1,705 | | 1,587 | | 1,227 | | | | | 1,550 | | 1,563 | | 1,461 | | 1,013 | |
| Interest and other income (expense), net | (172) | | (125) | | (81) | | (250) | | | | | — | | (262) | | 500 | | 140 | |
| Management fees and other income | 397 | | 819 | | 722 | | 809 | | | | | 782 | | 547 | | 292 | | 325 | |
| Note receivable interest income | 1,332 | | — | | — | | — | | | | | — | | — | | — | | — | |
Other non-cash revenue 1 | 2,781 | | 1,142 | | 1,322 | | 1,325 | | | | | 1,261 | | 1,528 | | 1,573 | | 1,820 | |
Other non-cash expenses 2 | (4,289) | | (2,975) | | (2,888) | | (2,691) | | | | | (2,599) | | (2,539) | | (2,406) | | (2,349) | |
| Pre-merger Legacy HTA NOI | 1,741 | | — | | — | | — | | | | | — | | — | | — | | — | |
| Unconsolidated JV adjustments | (520) | (51) | | 6 | | 131 | | | | | 167 | | 181 | | 276 | | (73) | |
| Debt Covenant EBITDA | $209,160 | | $80,152 | | $76,371 | | $75,702 | | | | | $74,284 | | $72,323 | | $70,866 | | $68,666 | |
| Interest expense | (60,391) | | (15,543) | | (13,661) | | (13,266) | | | | | (13,334) | | (13,261) | | (13,262) | | (13,618) | |
| Loss on extinguishment of debt | (1,091) | | — | | (1,429) | | — | | | | | — | | — | | — | | (21,503) | |
| Acquisition and pursuit costs | (482) | | (1,352) | | (1,303) | | (1,152) | | | | | (974) | | (670) | | (744) | | (939) | |
| Merger-related costs | (79,402) | | (7,085) | | (6,116) | | (389) | | | | | — | | — | | — | | — | |
Leasing commission amortization 3 | 2,731 | | 2,683 | | 2,600 | | 2,382 | | | | | 2,294 | | 2,258 | | 2,111 | | 2,033 | |
| Non-real estate depreciation and amortization | (1,243) | | (1,080) | | (983) | | (937) | | | | | (903) | | (885) | | (879) | | (886) | |
| Unconsolidated JV adjustments | — | — | | (34) | | (37) | | | | | (2) | | (8) | | (2) | | (8) | |
| FFO | $69,282 | | $57,775 | | $55,445 | | $62,303 | | | | | $61,365 | | $59,757 | | $58,090 | | $33,745 | |
| Acquisition and pursuit costs | 482 | | 1,352 | | 1,303 | | 1,152 | | | | | 974 | | 670 | | 744 | | 939 | |
| Merger-related costs | 79,402 | | 7,085 | | 6,116 | | 389 | | | | | — | | — | | — | | — | |
| Lease intangible amortization | 127 | 584 | | 309 | | 192 | | | | | 48 | | (6) | | (72) | | (4) | |
| | | | | | | | | | | |
| Significant non-recurring legal fees/forfeited earnest money received | 346 | 140 | | 91 | | 465 | | | | | — | | — | | (500) | | — | |
| Debt financing costs | 1,091 | — | | 1,429 | | — | | | | | — | | 283 | | — | | 21,920 | |
| Unconsolidated JV normalizing items | 154 | 83 | | 95 | | 90 | | | | | 54 | | 55 | | 27 | | 16 | |
| Normalized FFO | $150,884 | | $67,019 | | $64,788 | | $64,591 | | | | | $62,441 | | $60,759 | | $58,289 | | $56,616 | |
1Includes above and below market lease intangibles, interest income related to sales-type leases, lease inducements, lease termination fees, deferred financing cost amortization, and principle related to investment in financing receivable and TI amortization.
2Includes above and below market ground lease intangible amortization, leasing commission amortization, and ground lease straight-line rent.
3Leasing commission amortization is included in the real estate depreciation and amortization add-back for FFO.
| | | | | |
| |
HEALTHCARE REALTY | 3Q 2022 SUPPLEMENTAL INFORMATION 23 |
| | |
| EBITDA Reconciliations |
| DOLLARS IN THOUSANDS |
| REFLECTS COMBINED COMPANY RESULTS FOR ALL PERIODS |
| | | | | | | | | | | | | | | | | |
| RECONCILIATION OF EBITDA | | | | | |
| 3Q 2022 | 2Q 2022 |
| AS REPORTED | PROFORMA FULL QUARTER | Combined | Legacy HR | Legacy HTA |
| Net income | $28,615 | | $21,533 | | $20,552 | | $6,130 | | $14,422 | |
| Interest expense | 53,044 | | 60,391 | | 40,303 | | 15,543 | | 24,760 | |
| Depreciation and amortization | 158,117 | | 186,643 | | 130,782 | | 55,731 | | 75,051 | |
| Unconsolidated JV depreciation and amortization | 3,526 | | 3,526 | | 3,295 | | 2,807 | | 488 | |
| EBITDA | $243,302 | | $272,093 | | $194,932 | | $80,211 | | $114,721 | |
| Leasing commission amortization | 2,731 | | 2,731 | | 2,683 | | 2,683 | | — | |
| Gain on sales of real estate properties | (143,908) | | (143,908) | | (8,496) | | (8,496) | | — | |
| | | | | |
EBITDAre 1 | $102,125 | | $130,916 | | $189,119 | | $74,398 | | $114,721 | |
| EBITDA | $243,302 | | $272,093 | | $194,932 | | $80,211 | | $114,721 | |
| Acquisition and pursuit costs | 482 | | 482 | | 1,449 | | 1,352 | | 97 | |
| Merger-related costs | 79,402 | | 79,402 | | 12,192 | | 7,085 | | 5,107 | |
| Gain on sales of real estate properties | (143,908) | | (143,908) | | (8,496) | | (8,496) | | — | |
| | | | | |
| Loss on extinguishment of debt | 1,091 | | 1,091 | | 3,615 | | — | | 3,615 | |
| | | | | |
| Debt Covenant EBITDA | $180,369 | | $209,160 | | $203,692 | | $80,152 | | $123,540 | |
| Leasing commission amortization | 2,731 | | 2,731 | | 2,683 | | 2,683 | | — | |
| Lease intangible amortization | (2) | | 127 | | 584 | | 584 | | — | |
Acquisition/disposition timing impact 2 | (1,155) | | (3,079) | | 2,337 | | 2,243 | | 94 | |
| Stock based compensation | 3,666 | | 3,666 | | 5,547 | | 3,356 | | 2,191 | |
Other normalizing adjustments 3 | — | | — | | 1,702 | | — | | 1,702 | |
| Unconsolidated JV adjustments | 154 | | 154 | | 83 | | 83 | | — | |
| Adjusted EBITDA | $185,763 | | $212,759 | | $216,628 | | $89,101 | | $127,527 | |
| Run-rate adjustments | | | | | |
October asset sales 5 | | (1,625) | | | | |
Expected November asset sales 6 | | (1,400) | | | | |
Expected December asset sales 7 | | (3,000) | | | | |
| Seasonal utilities | | 2,500 | | | | |
| Expected G&A synergies | | 4,500 | | | | |
| Total run-rate adjustments | | $975 | | | | |
| Run-rate adjusted EBITDA | | $213,734 | | | | |
| | | | | |
1Earnings before interest, taxes, depreciation and amortization for real estate ("EBITDAre") is an operating performance measure adopted by NAREIT. NAREIT defines EBITDAre equal to “net income (computed in accordance with GAAP) plus interest expense, income tax expense, depreciation and amortization, impairments and minus gains on the disposition of depreciated property.”
2Adjusted to reflect quarterly EBITDA from properties acquired or disposed in the quarter.
3For the three months ended June 30, 2022, other normalizing adjustments for Legacy HTA include the following: (i) legal and professional fees related to the whistleblower investigation and other audit committee matters of $1.0 million; and (ii) net costs related to nonrecurring legal and tenant matters of $0.7 million. For the six months ended June 30, 2022, other normalizing adjustments include the following: (i) legal and professional fees related to the whistleblower investigation and other audit committee matters of $1.1 million; (ii) net costs related to nonrecurring legal and tenant matters of $0.8 million; (iii) additional board meeting fees of $0.2 million; and (iv) professional fees related to strategic review matters of $0.1 million.
4FFO and EBITDA includes the impact of straight-line rent.
5Reflects NOI loss related to dispositions of $136.0 million that occurred in October.
6Reflects NOI loss related to dispositions of $105.0 million that are expected to occur in November.
7Reflects NOI loss related to dispositions of $182.0 million that are expected to occur in December.
| | | | | |
| |
HEALTHCARE REALTY | 3Q 2022 SUPPLEMENTAL INFORMATION 24 |
| | |
| Components of Net Asset Value |
| DOLLARS IN THOUSANDS, EXCEPT PER SHARE DATA |
| REFLECTS COMBINED COMPANY RESULTS |
| | | | | | | | | | | | | | | | | | | | | | | | | | |
| CASH NOI BY PROPERTY TYPE |
| 3Q 2022 | |
| ASSET TYPE | SAME STORE 1 | ACQ./DEV. COMPLETIONS 2 | JOINT VENTURE | REDEVELOPMENT | TIMING/OTHER ADJUSTMENTS 3 | ADJUSTED CASH NOI | | ANNUALIZED ADJUSTED NOI |
| MOB/outpatient | $159,106 | | $22,815 | | $3,663 | | $2,792 | | $3,586 | | $191,962 | | | $767,848 | |
| Inpatient/Surgical | 12,473 | | — | | 259 | | — | | — | | 12,732 | | | 50,928 | |
| Office | 7,249 | | — | | — | | — | | — | | 7,249 | | | 28,996 | |
| Total Cash NOI | $178,828 | | $22,815 | | $3,922 | | $2,792 | | $3,586 | | $211,943 | | | $847,772 | |
| | | | | | | | | | | | | | | | | | | | |
| DEVELOPMENT PROPERTIES | | | TOTAL SHARES OUTSTANDING |
| Land held for development | $73,321 | | | As of November 4, 2022 8 | 384,615,283 |
| Re/development budget | 209,500 | | | | | | |
| $282,821 | | | IMPLIED CAP RATE |
| | | | | STOCK PRICE | IMPLIED CAP RATE |
| | | As of November 4, 2022 8 | $20.23 | 6.5 | % |
| OTHER ASSETS | | | MERGER CLOSE TO SEPTEMBER 30, 2022: | |
Assets held for sale 4 | $329,187 | | | High | $26.84 | 5.4 | % |
Unstabilized properties 5 | 78,426 | | | Low | $20.58 | 6.4 | % |
Cash and other assets 6 | 304,911 | | | | | | |
| $712,524 | | | | | | |
| | | | | | |
| DEBT | | | | | | |
| Unsecured credit facility | $190,600 | | | | | | |
| Asset sale term loan | 423,000 | | | | | | |
| Unsecured term loans | 1,500,000 | | | | | | |
| Senior notes | 3,700,000 | | | | | | |
| Mortgage notes payable | 84,784 | | | | | | |
| Remaining re/development funding | 144,864 | | | | | | |
Other liabilities 7 | 255,012 | | | | | | |
| $6,298,260 | | | | | | |
1See NOI Performance schedule on page 21 for details on same store NOI. 2Adjusted to reflect quarterly NOI from properties acquired or stabilized re/developments completed during the full eight quarter period that are not included in same store NOI.
3Timing adjustments include current quarter acquisitions of $0.9 million as well as re/development completion adjustments of $0.5 million and seasonal expenses of $2.5 million to reflect full quarterly stabilized NOI. This is slightly offset by $0.3 million of negative NOI for unstabilized properties.
4Represents estimated gross purchase for six held for sale properties and four properties that the Company has identified for future disposition.
5Includes 12 properties comprising 353,000 square feet that generated negative NOI of $0.3 million at gross book value.
6Includes cash of $57.6 million, prepaid assets of $88.1 million, notes receivable of $79.0 million, accounts receivable of $39.8 million, prepaid ground leases of $19.3 million, and other investments of $6.0 million. In addition, includes the Company's occupied portion of its corporate headquarters in Nashville and Charleston of $15.1 million.
7Includes only liabilities that are expected to reduce future cash or NOI and that are currently producing non-cash benefits to NOI. Included are accounts payable and accrued liabilities of $225.7 million, security deposits of $28.7 million, and deferred operating expense reimbursements of $0.6 million.
8Total shares outstanding includes OP units and does not reflect the shares associated with forward equity contracts. As of September 30, 2022, the Company had no remaining shares to be settled under forward equity contracts.
| | | | | |
| |
HEALTHCARE REALTY | 3Q 2022 SUPPLEMENTAL INFORMATION 25 |