| | |
| 4Q2023 |
| Supplemental Information |
| FURNISHED AS OF FEBRUARY 16, 2024 - UNAUDITED |
|
|
| | |
| FORWARD LOOKING STATEMENTS & RISK FACTORS |
|
This Supplemental Information report contains disclosures that are “forward-looking statements” as defined in Section 27A of the Securities Act of 1933, as amended, and Section 21E of the Securities Exchange Act of 1934, as amended. Forward-looking statements include all statements that do not relate solely to historical or current facts and can be identified by the use of words and phrases such as “can,” “may,” “payable,” “indicative,” "predictive," “annualized,” “expect,” “expected,” “range of expectations,” "would have been," "budget," and other comparable terms in this report, and include, but are not limited to, statements related to the merger between Healthcare Realty Trust Incorporated (“Legacy HR” and, after the closing of the merger, the “Company” or "HR") and Healthcare Trust of America, Inc. (“HTA”) that closed on July 20, 2022 (the “Merger”). These forward-looking statements are made as of the date of this report and are not necessarily indicative of future performance. These statements are based on the current plans and expectations of Company management and are subject to a number of unknown risks, uncertainties, assumptions and other factors that could cause actual results to differ materially from those described in this release or implied by such forward-looking statements. Such risks and uncertainties include, among other things, the following: the Company’s expected results may not be achieved; failure to realize the expected benefits of the Merger; the risk that the Company’s and HTA’s respective businesses will not be integrated successfully or that such integration may be more difficult, time-consuming or costly than expected; risks related to future opportunities and plans for the Company, including the uncertainty of expected future financial performance and results of the Company; the possibility that, if the Company does not achieve the perceived benefits of the Merger as rapidly or to the extent anticipated by financial analysts or investors, the market price of the Company’s common stock could decline; pandemics or other health crises, such as COVID-19; increases in interest rates; the availability and cost of capital at expected rates; competition for quality assets; negative developments in the operating results or financial condition of the Company's tenants, including, but not limited to, their ability to pay rent; the Company's ability to reposition or sell facilities with profitable results; the Company's ability to release space at similar rates as vacancies occur; the Company's ability to renew expiring leases; government regulations affecting tenants' Medicare and Medicaid reimbursement rates and operational requirements; unanticipated difficulties and/or expenditures relating to future acquisitions and developments; changes in rules or practices governing the Company's financial reporting; the Company may be required under purchase options to sell properties and may not be able to reinvest the proceeds from such sales at rates of return equal to the return received on the properties sold; uninsured or underinsured losses related to casualty or liability; the incurrence of impairment charges on its real estate properties or other assets; and other legal and operational matters. Other risks, uncertainties and factors that could cause actual results to differ materially from those projected are detailed under the heading “Risk Factors,” in the Annual Report on Form 10-K filed with the Securities and Exchange Commission (“SEC”) for the year ended December 31, 2023, under the heading "Risk Factors" and other risks described from time to time thereafter in the Company's SEC filings. The Company undertakes no obligation to publicly update or revise any forward-looking statements, whether as a result of new information, future events or otherwise.
| | | | | |
| Highlights |
| Salient Facts |
| Corporate Information |
| Balance Sheet |
| Statements of Income |
| FFO, Normalized FFO, & FAD |
| Capital Funding & Commitments |
| Debt Metrics |
| Debt Covenants & Liquidity |
| Investment Activity |
| Re/development Activity |
| Portfolio |
| Health Systems |
| MOB Proximity to Hospital |
| Lease Maturity & Occupancy |
| Leasing Statistics |
| Merger Combined Same Store |
| NOI Reconciliations |
| EBITDA Reconciliations |
| Components of Net Asset Value |
| Components of Expected FFO |
| | | | | |
| |
HEALTHCARE REALTY | 4Q 2023 SUPPLEMENTAL INFORMATION 3 |
The following applies to all same store disclosures reported in this supplemental report. Subsequent to its merger with Healthcare Trust of America ("Legacy HTA") on July 20, 2022, the Company began reporting combined same store results in the third quarter of 2022, which are now referred to as Merger Combined Same Store. Merger Combined Same Store includes the Company’s same store properties, including Legacy HTA properties, that were owned for the full comparative period, and that meet all elements of the Company’s same store criteria. The Company presents the combined companies’ same store portfolios to provide an understanding of the operating performance and growth potential of the combined company.
| | | | | | | | | | | | | | |
| NET INCOME AND NORMALIZED FFO |
•Net (loss) income attributable to common stockholders for the three months ended December 31, 2023 was $(40.5) million or $(0.11) per diluted common share. Net (loss) income attributable to common stockholders for the year ended December 31, 2023 was $(278.3) million or $(0.74) per diluted common share.
•Normalized FFO per share totaled $0.39 and $1.57 for the three months and year ended December 31, 2023, respectively.
| | | | | | | | | | | | | | |
| MERGER COMBINED SAME STORE | | | |
•Merger Combined Same Store cash NOI for the fourth quarter increased 2.7% over the prior year, and 2.8% for the year ended December 31, 2023.
•Fourth quarter predictive growth measures in the Merger Combined Same Store portfolio include:
◦Average in-place rent increases of 2.8%
◦Future annual contractual increases of 2.9% for leases commencing in the quarter.
◦Weighted average MOB cash leasing spreads of 3.3% on 607,000 square feet renewed:
▪3% (<0% spread)
▪6% (0-3%)
▪76% (3-4%)
▪16% (>4%)
◦Tenant retention of 78.2%
| | | | | | | | | | | | | | |
| MULTI-TENANT OCCUPANCY AND ABSORPTION | | | |
•During the quarter, the multi-tenant portfolio had sequential occupancy improvement of 175,000 square feet, or 53 basis points.
| | | | | | | | | |
| 4Q 2023 |
| (in thousands, except % and bps) | NOVEMBER 2023 PROJECTION | ACTUAL | |
| Total multi-tenant SF | 33,552 | 33,371 | |
| Starting occupancy | 85.1 | % | 84.7 | % | |
| Absorption (SF) | 120-180 | 175 | |
| Ending occupancy | 85.4-85.6% | 85.2 | % | |
| Change in occupancy (bps) | + 30-50 | + 53 | |
•Total multi-tenant square feet changes from the November 2023 projection to 4Q 2023 actual include the sale of properties comprising 287,000 square feet offset by a 106,000 square feet development completion.
•The multi-tenant portfolio leased percentage was 87.3% at December 31, which was 210 basis points greater than occupancy.
◦The multi-tenant Legacy HTA portfolio leased percentage was 85.5%, which was 230 basis points greater than occupancy.
•An updated multi-tenant occupancy and NOI bridge can be found on page 21 of the Investor Presentation.
| | | | | |
| |
HEALTHCARE REALTY | 4Q 2023 SUPPLEMENTAL INFORMATION 4 |
•Portfolio leasing activity that commenced in the fourth quarter totaled 1,224,000 square feet related to 340 leases:
◦703,000 square feet of renewals
◦508,000 square feet of new and 13,000 square feet of expansion leases
•The Company executed new leases totaling 425,000 square feet in the quarter that will commence in future periods.
•During the fourth quarter, the Company sold 27 properties totaling $338 million.
•Additional dispositions in 2023 totaled 36 properties for $656 million at an average cap rate of 6.6%. These dispositions generated proceeds of $597 million and $59 million of seller financing.
•The 2023 additional dispositions do not include the January 2023 dispositions of $112 million to repay the balance on the asset sale term loan.
•The 2023 total dispositions improved the quality and growth profile of the portfolio as seen through the following characteristics:
◦34% non-MOB
◦54% off campus MOB
◦63% single-tenant
◦1.9% average in-place escalators
•Net debt to adjusted EBITDA was 6.4 times at the end of the quarter.
•During the fourth quarter, the Company executed interest rate swaps totaling $275 million. In January 2024, $200 million of interest rate swaps expired.
•As of December 31, 2023, including the effect of the expiration of the January 2024 interest rate swap, variable rate debt was 8%. This reflects an improvement from 13% as of December 31, 2022.
•As of December 31, 2023, the Company's line of credit balance was fully repaid.
•A dividend of $0.31 per share was paid in November 2023. A dividend of $0.31 per share will be paid on March 14, 2024 to stockholders and OP unitholders of record on February 26, 2024.
•On Friday, February 16, 2024, at 11:00 a.m. Eastern Time, Healthcare Realty Trust has scheduled a conference call to discuss earnings results, quarterly activities, general operations of the Company and industry trends.
•Simultaneously, a webcast of the conference call will be available to interested parties at https://investors.healthcarerealty.com/corporate-profile/webcasts under the Investor Relations section. A webcast replay will be available following the call at the same address.
•Live Conference Call Access Details:
◦Domestic Dial-In Number: +1 404-975-4839 access code 926364;
◦All Other Locations: +1 833-470-1428 access code 926364.
•Replay Information:
◦Domestic Dial-In Number: +1 929-458-6194 access code 512784;
◦All Other Locations: +1 866-813-9403 access code 512784.
| | | | | |
| |
HEALTHCARE REALTY | 4Q 2023 SUPPLEMENTAL INFORMATION 5 |
•The Company's 2024 guidance range represents the in-place portfolio as of February 16, 2024, and does not include any assumptions for prospective acquisitions, joint venture seed portfolios or other related balance sheet activities that have not closed unless otherwise noted. The 2024 guidance range expectations are as follows:
| | | | | | | | | | | | | | | | | | | | | | | | | | | | | |
| | ACTUAL | | EXPECTED 1Q 2024 | | EXPECTED 2024 | |
| | 4Q 2023 | 2023 | | LOW | HIGH | | LOW | HIGH | | |
| Earnings per share | | $(0.11) | $(0.74) | | $(0.12) | $(0.11) | | $(0.60) | $(0.10) | | |
| NAREIT FFO per share | | $0.36 | $1.43 | | $0.35 | $0.36 | | $1.42 | $1.48 | | |
| Normalized FFO per share | | $0.39 | $1.57 | | $0.38 | $0.39 | | $1.52 | $1.58 | | |
| | | | | | | | | | | |
| | | | | | | | | | | |
| | | | | | | | | | | |
| | | | | | | | | | | |
| | | | | | | | | | | |
| | | | | | | | | | | |
| | | | | | | | | | | |
| | | | | | | | | | | |
| | | | | | | | | | | |
| | | | | | | | | | | |
•The 2024 annual guidance above includes the following significant changes from 2023 results (dollars in thousands, except per share data). Refer to page 28 for additional guidance detail including operating metrics and capital funding expectations.
| | | | | | | | | | | | | | | | | | | | | | |
| 4Q 2023 RUN-RATE NORMALIZED FFO RECONCILIATION | | | | | | | | | 4Q 2023 | DESCRIPTION | | |
| 4Q 2023 normalized FFO | | | | | | | | | $150,730 | | | |
| Non-recurring items | | | | | | | (4,730) | | Property tax appeals/reductions and refunds |
| 4Q 2023 run-rate normalized FFO | | | | | | | $146,000 | | | |
| | | | | | | | | | | | |
| | | | | | | | EXPECTED 2024 | | | |
| SIGNIFICANT YEAR-OVER-YEAR CHANGES | | | | | | | | LOW | HIGH | DESCRIPTION | | |
| Annualized 4Q 2023 run-rate normalized FFO | | | | | | | | $584,000 | $584,000 | | | |
| Multi-tenant cash NOI | | | | | | | | 21,000 | | 29,000 | | 3.5% to 4.75% growth | | |
| Single-tenant cash NOI | | | | | | | | 1,000 | | 3,000 | | 0.5% to 1.5% growth | | |
| Straight-line rent | | | | | | | | (2,000) | | 2,000 | | | | |
| Performance based compensation | | | | | | | | (5,500) | | (3,500) | | Return to run-rate | | |
| Interest rate swap maturity | | | | | | | | (6,500) | | (6,500) | | January 2024 expiration of 1.21% | | |
| Re/development and other capital funding | | | | | | | | (7,500) | | (5,500) | | $150-$250 million of dispositions | | |
| Other | | | | | | | | — | | 1,500 | | | | |
| Expected normalized FFO | | | | | | | | $584,500 | $604,000 | | | |
| Expected normalized FFO per share | | | | | | $1.52 | $1.58 | | | |
The 2024 annual guidance range reflects the Company's view of current and future market conditions, including assumptions with respect to rental rates, occupancy levels, interest rates, and operating and general and administrative expenses. The Company's guidance does not contemplate impacts from gains or losses from
dispositions, potential impairments, or debt extinguishment costs, if any. There can be no assurance that the Company's actual results will not be materially higher or lower than these expectations. If actual results vary from these assumptions, the Company's expectations may change.
| | | | | |
| |
HEALTHCARE REALTY | 4Q 2023 SUPPLEMENTAL INFORMATION 6 |
| | |
Salient Facts 1 |
| AS OF DECEMBER 31, 2023 |
| | | | | | | | | | | |
| Properties | | |
| | |
| 688 properties totaling 40.3M SF | |
| 69 markets in 35 states | |
| 93% managed by Healthcare Realty | |
| 93% outpatient medical facilities | |
| 60% of NOI in Top 15 Markets | |
| | |
| | |
| Capitalization | |
| | |
| $11.9B enterprise value as of 12/31/23 | |
| $6.6B market capitalization as of 12/31/23 | |
| 384.8M shares outstanding (including OP units) | |
| $0.31 quarterly dividend per share | |
| BBB/Baa2 S&P/Moody's | |
| 44.2% net debt to enterprise value at 12/31/23 | |
| 6.4x net debt to adjusted EBITDA | |
| | |
1 Includes properties held in joint ventures.
| | | | | |
| |
HEALTHCARE REALTY | 4Q 2023 SUPPLEMENTAL INFORMATION 7 |
Healthcare Realty (NYSE: HR) is a real estate investment trust (REIT) that owns and operates medical outpatient buildings primarily located around market-leading hospital campuses. The Company selectively grows its portfolio through property acquisition and development. As of December 31, 2023, the Company was invested in 688 real estate properties in 35 states totaling 40.3 million square feet and had an enterprise value of approximately $11.9 billion, defined as equity market capitalization plus the principal amount of debt less cash. The Company provided leasing and property management services to 93% of its portfolio.
| | |
| EXECUTIVE OFFICERS |
|
| Todd J. Meredith |
| President and Chief Executive Officer |
|
| John M. Bryant, Jr. |
| Executive Vice President and General Counsel |
|
| J. Christopher Douglas |
| Executive Vice President and Chief Financial Officer |
|
| Robert E. Hull |
| Executive Vice President - Investments |
|
| Julie F. Wilson |
| Executive Vice President - Operations |
|
|
|
|
|
|
|
| | | | | |
| ANALYST COVERAGE |
| |
| BMO Capital Markets |
| BTIG, LLC |
| Citi Research |
| Deutsche Bank Securities |
| Green Street Advisors, Inc. |
| J.P. Morgan Securities LLC |
| Jefferies LLC |
| KeyBanc Capital Markets Inc. |
| Raymond James & Associates |
| Scotiabank |
| Stifel, Nicolaus & Company, Inc. |
| Wedbush Securities |
| Wells Fargo Securities, LLC |
| |
J. Knox Singleton
Chairman, Healthcare Realty Trust Incorporated
Retired Chief Executive Officer, Inova Health System
W. Bradley Blair, II
Vice Chairman, Healthcare Realty Trust Incorporated
Retired Chairman, Healthcare Trust of America
Todd J. Meredith
President and Chief Executive Officer
Healthcare Realty Trust Incorporated
John V. Abbott
Retired Chief Executive Officer
Aviation Asset Management Group, General Electric Company
Nancy H. Agee
President and Chief Executive Officer
Carilion Clinic
Vicki U. Booth
President and Board Chair
Ueberroth Family Foundation
Edward H. Braman
Retired Audit Partner
Ernst & Young LLP
Ajay Gupta
Chief Executive Officer
Physician Rehabilitation Network
James J. Kilroy
President and Portfolio Manager
Willis Investment Counsel
Jay P. Leupp
Managing Partner and Senior Portfolio Manager
Terra Firma Asset Management, LLC
Peter F. Lyle
Executive Vice President
Medical Management Associates, Inc.
Constance B. Moore
Retired President and CEO
BRE Properties, Inc.
Christann M. Vasquez
Retired Healthcare Executive
David R. Emery (1944-2019)
Chairman Emeritus
Healthcare Realty Trust Incorporated
| | | | | |
| |
HEALTHCARE REALTY | 4Q 2023 SUPPLEMENTAL INFORMATION 8 |
| | |
| Balance Sheet |
| AMOUNTS IN THOUSANDS, EXCEPT PER SHARE DATA |
|
| | | | | | | | | | | | | | | | | | | |
| ASSETS | | | | | | | |
| | | | | |
| 4Q 2023 | 3Q 2023 | 2Q 2023 | 1Q 2023 | 4Q 2022 | | |
| Real estate properties | | | | | | | |
| Land | $1,343,265 | | $1,387,821 | | $1,424,453 | | $1,412,805 | | $1,439,798 | | | |
| Buildings and improvements | 10,881,373 | | 11,004,195 | | 11,188,821 | | 11,196,297 | | 11,332,037 | | | |
| Lease intangibles | 836,302 | | 890,273 | | 922,029 | | 929,008 | | 959,998 | | | |
| Personal property | 12,718 | | 12,686 | | 12,615 | | 11,945 | | 11,907 | | | |
| Investment in financing receivables, net | 122,602 | | 120,975 | | 121,315 | | 120,692 | | 120,236 | | | |
| Financing lease right-of-use assets | 82,209 | | 82,613 | | 83,016 | | 83,420 | | 83,824 | | | |
| Construction in progress | 60,727 | | 85,644 | | 53,311 | | 42,615 | | 35,560 | | | |
| Land held for development | 59,871 | | 59,871 | | 78,411 | | 69,575 | | 74,265 | | | |
| Total real estate investments | 13,399,067 | | 13,644,078 | | 13,883,971 | | 13,866,357 | | 14,057,625 | | | |
| Less accumulated depreciation and amortization | (2,226,853) | | (2,093,952) | | (1,983,944) | | (1,810,093) | | (1,645,271) | | | |
| Total real estate investments, net | 11,172,214 | | 11,550,126 | | 11,900,027 | | 12,056,264 | | 12,412,354 | | | |
| Cash and cash equivalents | 25,699 | | 24,668 | | 35,904 | | 49,941 | | 60,961 | | | |
| | | | | | | |
| Assets held for sale, net | 8,834 | | 57,638 | | 151 | | 3,579 | | 18,893 | | | |
| Operating lease right-of-use assets | 275,975 | | 323,759 | | 333,224 | | 336,112 | | 336,983 | | | |
| Investments in unconsolidated joint ventures | 311,511 | | 325,453 | | 327,245 | | 327,746 | | 327,248 | | | |
| Other assets, net and goodwill | 842,898 | | 822,084 | | 797,796 | | 795,242 | | 693,192 | | | |
| Total assets | $12,637,131 | | $13,103,728 | | $13,394,347 | | $13,568,884 | | $13,849,631 | | | |
| | | | | | | |
| LIABILITIES AND STOCKHOLDERS' EQUITY | | | | | | | |
| | | | | |
| 4Q 2023 | 3Q 2023 | 2Q 2023 | 1Q 2023 | 4Q 2022 | | |
| Liabilities | | | | | | | |
| Notes and bonds payable | $4,994,859 | | $5,227,413 | | $5,340,272 | | $5,361,699 | | $5,351,827 | | | |
| Accounts payable and accrued liabilities | 211,994 | | 204,947 | | 196,147 | | 155,210 | | 244,033 | | | |
| Liabilities of properties held for sale | 295 | | 3,814 | | 222 | | 277 | | 437 | | | |
| Operating lease liabilities | 229,714 | | 273,319 | | 278,479 | | 279,637 | | 279,895 | | | |
| Financing lease liabilities | 74,503 | | 74,087 | | 73,629 | | 73,193 | | 72,939 | | | |
| Other liabilities | 202,984 | | 211,365 | | 219,694 | | 232,029 | | 218,668 | | | |
| Total liabilities | 5,714,349 | | 5,994,945 | | 6,108,443 | | 6,102,045 | | 6,167,799 | | | |
| | | | | | | |
| | | | | | | |
| Redeemable non-controlling interests | 3,868 | | 3,195 | | 2,487 | | 2,000 | | 2,014 | | | |
| | | | | | | |
| Stockholders' equity | | | | | | | |
| Preferred stock, $0.01 par value; 200,000 shares authorized | — | | — | | — | | — | | — | | | |
| Common stock, $0.01 par value; 1,000,000 shares authorized | 3,810 | | 3,809 | | 3,808 | | 3,808 | | 3,806 | | | |
| Additional paid-in capital | 9,602,592 | | 9,597,629 | | 9,595,033 | | 9,591,194 | | 9,587,637 | | | |
| Accumulated other comprehensive (loss) income | (10,741) | | 17,079 | | 9,328 | | (8,554) | | 2,140 | | | |
| Cumulative net income attributable to common stockholders | 1,028,794 | | 1,069,327 | | 1,137,171 | | 1,219,930 | | 1,307,055 | | | |
| Cumulative dividends | (3,801,793) | | (3,684,144) | | (3,565,941) | | (3,447,750) | | (3,329,562) | | | |
| Total stockholders' equity | 6,822,662 | | 7,003,700 | | 7,179,399 | | 7,358,628 | | 7,571,076 | | | |
| Non-controlling interest | 96,252 | | 101,888 | | 104,018 | | 106,211 | | 108,742 | | | |
| Total equity | 6,918,914 | | 7,105,588 | | 7,283,417 | | 7,464,839 | | 7,679,818 | | | |
| Total liabilities and stockholders' equity | $12,637,131 | | $13,103,728 | | $13,394,347 | $13,568,884 | $13,849,631 | | |
| | | | | |
| |
HEALTHCARE REALTY | 4Q 2023 SUPPLEMENTAL INFORMATION 9 |
| | |
| Statements of Income |
| DOLLARS IN THOUSANDS |
|
| | | | | | | | | | | | | | | | | | | | | | | | | | | | |
| | | | | | | | | | | | | | | | |
| | | | | | | | | | | | | | | |
| 4Q 2023 | 3Q 2023 | 2Q 2023 | 1Q 2023 | 4Q 2022 | | | | | | | | | | | |
| Revenues | | | | | | | | | | | | | | | | |
| Rental income | $322,076 | $333,335 | $329,680 | $324,093 | $329,399 | | | | | | | | | | | |
| Interest income | 4,422 | 4,264 | 4,233 | 4,214 | 4,227 | | | | | | | | | | | |
| Other operating | 3,943 | 4,661 | 4,230 | 4,618 | 4,436 | | | | | | | | | | | |
| 330,441 | 342,260 | 338,143 | 332,925 | 338,062 | | | | | | | | | | | |
| Expenses | | | | | | | | | | | | | | | | |
| Property operating | 121,362 | 131,639 | 125,395 | 122,040 | 117,009 | | | | | | | | | | | |
| General and administrative | 14,609 | 13,396 | 15,464 | 14,935 | 14,417 | | | | | | | | | | | |
Normalizing items 1 | (1,445) | — | (275) | — | — | | | | | | | | | | | |
| Normalized general and administrative | 13,164 | 13,396 | 15,189 | 14,935 | 14,417 | | | | | | | | | | | |
Acquisition and pursuit costs 2 | 301 | 769 | 669 | 287 | 92 | | | | | | | | | | | |
| Merger-related costs | 1,414 | 7,450 | (15,670) | 4,855 | 10,777 | | | | | | | | | | | |
| Depreciation and amortization | 180,049 | 182,989 | 183,193 | 184,479 | 185,275 | | | | | | | | | | | |
| 317,735 | 336,243 | 309,051 | 326,596 | 327,570 | | | | | | | | | | | |
| Other income (expense) | | | | | | | | | | | | | | | | |
| Interest expense before merger-related fair value | (52,387) | (55,637) | (54,780) | (52,895) | (52,464) | | | | | | | | | | | |
| Merger-related fair value adjustment | (10,800) | (10,667) | (10,554) | (10,864) | (11,979) | | | | | | | | | | | |
| Interest expense | (63,187) | (66,304) | (65,334) | (63,759) | (64,443) | | | | | | | | | | | |
| Gain on sales of real estate properties | 20,573 | 48,811 | 7,156 | 1,007 | 73,083 | | | | | | | | | | | |
| Gain on extinguishment of debt | — | 62 | — | — | 119 | | | | | | | | | | | |
| Impairment of real estate assets and credit loss reserves | (11,403) | (56,873) | (55,215) | (31,422) | (54,452) | | | | | | | | | | | |
| Equity (loss) gain from unconsolidated joint ventures | (430) | (456) | (17) | (780) | 89 | | | | | | | | | | | |
| Interest and other income (expense), net | 65 | 139 | 592 | 547 | (1,168) | | | | | | | | | | | |
| (54,382) | (74,621) | (112,818) | (94,407) | (46,772) | | | | | | | | | | | |
| Net (loss) income | $(41,676) | $(68,604) | $(83,726) | $(88,078) | $(36,280) | | | | | | | | | | | |
| Net loss (income) attributable to non-controlling interests | 1,143 | 760 | 967 | 953 | 516 | | | | | | | | | | | |
| Net (loss) income attributable to common stockholders | $(40,533) | $(67,844) | $(82,759) | $(87,125) | $(35,764) | | | | | | | | | | | |
| | | | | | | | | | | | | | | | |
| Basic earnings per common share | $(0.11) | $(0.18) | $(0.22) | $(0.23) | $(0.10) | | | | | | | | | | | |
| Diluted earnings per common share | $(0.11) | $(0.18) | $(0.22) | $(0.23) | $(0.10) | | | | | | | | | | | |
| | | | | | | | | | | | | | | | |
| Weighted average common shares outstanding - basic | 379,044 | 378,925 | 378,897 | 378,840 | 378,617 | | | | | | | | | | | |
Weighted average common shares outstanding - diluted 3 | 379,044 | 378,925 | 378,897 | 378,840 | 378,617 | | | | | | | | | | | |
| | | | | | | | | | | | | | | | |
| | | | | | | | | | | | | | | | |
| | | | | | | | | | | | | | | | |
| | | | | | | | | | | | | | | | |
| | | | | | | | | | | | | | | | |
| | | | | | | | | | | | | | | | |
| | | | | | | | | | | | | | | | |
| | | | | | | | | | | | | | | | |
| | | | | | | | | | | | | | | | | | | | | | | | | | | | |
| STATEMENTS OF INCOME SUPPLEMENTAL INFORMATION | | | | | | | | | | | | | | | | |
| | | | | | | | | | | | | | | |
| 4Q 2023 | 3Q 2023 | 2Q 2023 | 1Q 2023 | 4Q 2022 | | | | | | | | | | | |
| Interest income | | | | | | | | | | | | | | | | |
| Financing receivables | $2,132 | $2,002 | $2,053 | $2,144 | $2,203 | | | | | | | | | | | |
| Interest on mortgage and mezzanine loans | 2,290 | 2,262 | 2,180 | 2,070 | 2,024 | | | | | | | | | | | |
| Total | $4,422 | $4,264 | $4,233 | $4,214 | $4,227 | | | | | | | | | | | |
| | | | | | | | | | | | | | | | |
| Other operating income | | | | | | | | | | | | | | | | |
| Parking income | $2,392 | $2,751 | $2,370 | $2,391 | $2,413 | | | | | | | | | | | |
| Management fee and miscellaneous income | 1,551 | 1,910 | 1,860 | 2,227 | 2,023 | | | | | | | | | | | |
| Total | $3,943 | $4,661 | $4,230 | $4,618 | $4,436 | | | | | | | | | | | |
14Q 2023 normalizing items include severance costs and 2Q 2023 includes non-routine legal costs.
2Includes third party and travel costs related to the pursuit of acquisitions and developments.
3Potential common shares are not included in the computation of diluted earnings per share when a loss exists, as the effect would be an antidilutive per share amount. As a result, the Company's OP totaling 3,966,365 units was not included.
| | | | | |
| |
HEALTHCARE REALTY | 4Q 2023 SUPPLEMENTAL INFORMATION 10 |
| | |
FFO, Normalized FFO, & FAD 1,2,3 |
| DOLLARS IN THOUSANDS, EXCEPT PER SHARE DATA |
|
| | | | | | | | | | | | | | | | | | | | | | | | | | | | | | | | |
| | | | | | | | | | | | | | | | | | | | |
| | | | | | | | | | | | | | | | | | | | |
| 4Q 2023 | 3Q 2023 | 2Q 2023 | 1Q 2023 | 4Q 2022 | | | | | | | | | | | | | | | |
| Net (loss) income attributable to common stockholders | $(40,533) | $(67,844) | $(82,759) | $(87,125) | $(35,764) | | | | | | | | | | | | | | | |
Net loss attributable to common stockholders per diluted share 3 | $(0.11) | $(0.18) | $(0.22) | $(0.23) | $(0.10) | | | | | | | | | | | | | | | |
| | | | | | | | | | | | | | | | | | | | |
| Gain on sales of real estate assets | $(20,573) | $(48,811) | $(7,156) | $(1,007) | (73,083) | | | | | | | | | | | | | | | | |
| Impairments of real estate assets | 11,403 | | 56,873 | | 55,215 | | 26,227 | | 54,452 | | | | | | | | | | | | | | | | |
| Real estate depreciation and amortization | 182,272 | | 185,143 | | 185,003 | | 186,109 | | 186,658 | | | | | | | | | | | | | | | | |
| Non-controlling loss from partnership units | (491) | | (841) | | (1,027) | | (1,067) | | (382) | | | | | | | | | | | | | | | | |
| Unconsolidated JV depreciation and amortization | 4,442 | 4,421 | 4,412 | 4,841 | 4,020 | | | | | | | | | | | | | | | |
| FFO adjustments | $177,053 | $196,785 | $236,447 | $215,103 | $171,665 | | | | | | | | | | | | | | | |
| FFO adjustments per common share - diluted | $0.46 | $0.51 | $0.62 | $0.56 | $0.45 | | | | | | | | | | | | | | | |
| FFO | $136,520 | $128,941 | $153,688 | $127,978 | $135,901 | | | | | | | | | | | | | | | |
| FFO per common share - diluted | $0.36 | $0.34 | $0.40 | $0.33 | $0.35 | | | | | | | | | | | | | | | |
| | | | | | | | | | | | | | | | | | | | |
| Acquisition and pursuit costs | 301 | 769 | 669 | 287 | 92 | | | | | | | | | | | | | | | |
Merger-related costs | 1,414 | 7,450 | (15,670) | 4,855 | 10,777 | | | | | | | | | | | | | | | |
| Lease intangible amortization | 261 | | 213 | | 240 | 146 | 137 | | | | | | | | | | | | | | | |
| | | | | | | | | | | | | | | | | | | | |
| Non-routine legal costs/forfeited earnest money received | (100) | | — | 275 | — | 194 | | | | | | | | | | | | | | | |
| Debt financing costs | — | (62) | — | — | 625 | | | | | | | | | | | | | | | |
| Severance costs | 1,445 | — | — | — | — | | | | | | | | | | | | | | | |
Allowance for credit losses 4 | — | — | — | 8,599 | — | | | | | | | | | | | | | | | |
| Merger-related fair value adjustment | 10,800 | 10,667 | 10,554 | 10,864 | 11,979 | | | | | | | | | | | | | | | |
Unconsolidated JV normalizing items 5 | 89 | 90 | 93 | 117 | 96 | | | | | | | | | | | | | | | |
| Normalized FFO adjustments | $14,210 | $19,127 | $(3,839) | $24,868 | $23,900 | | | | | | | | | | | | | | | |
| Normalized FFO adjustments per common share - diluted | $0.04 | $0.05 | $(0.01) | $0.06 | $0.06 | | | | | | | | | | | | | | | |
| Normalized FFO | $150,730 | $148,068 | $149,849 | $152,846 | $159,801 | | | | | | | | | | | | | | | |
| Normalized FFO per common share - diluted | $0.39 | $0.39 | $0.39 | $0.40 | $0.42 | | | | | | | | | | | | | | | |
| | | | | | | | | | | | | | | | | | | | |
| Non-real estate depreciation and amortization | 685 | 475 | 802 | 604 | 624 | | | | | | | | | | | | | | | |
Non-cash interest amortization, net 6 | 1,265 | 1,402 | 1,618 | 682 | 2,284 | | | | | | | | | | | | | | | |
| Rent reserves, net | 1,404 | 442 | (54) | 1,371 | (100) | | | | | | | | | | | | | | | |
| Straight-line rent income, net | (7,872) | (8,470) | (8,005) | (8,246) | (9,873) | | | | | | | | | | | | | | | |
| Stock-based compensation | 3,566 | 2,556 | 3,924 | 3,745 | 3,573 | | | | | | | | | | | | | | | |
Unconsolidated JV non-cash items 7 | (206) | (231) | (316) | (227) | (316) | | | | | | | | | | | | | | | |
| Normalized FFO adjusted for non-cash items | 149,572 | 144,242 | 147,818 | 150,775 | 155,993 | | | | | | | | | | | | | | | |
| 2nd generation TI | (18,715) | (21,248) | (17,236) | (8,882) | (13,523) | | | | | | | | | | | | | | | |
| Leasing commissions paid | (14,978) | (8,907) | (5,493) | (7,013) | (7,404) | | | | | | | | | | | | | | | |
| Capital expenditures | (17,393) | (14,354) | (8,649) | (8,946) | (25,669) | | | | | | | | | | | | | | | |
| Total maintenance capex | (51,086) | (44,509) | (31,378) | (24,841) | (46,596) | | | | | | | | | | | | | | | |
| FAD | $98,486 | $99,733 | $116,440 | $125,934 | $109,397 | | | | | | | | | | | | | | | |
| Quarterly dividends and OP distributions | $118,897 | $119,456 | $119,444 | $119,442 | $119,323 | | | | | | | | | | | | | | | |
FFO wtd avg common shares outstanding - diluted 8 | 383,326 | 383,428 | 383,409 | 383,335 | 383,228 | | | | | | | | | | | | | | | |
1Funds from operations (“FFO”) and FFO per share are operating performance measures adopted by NAREIT. NAREIT defines FFO as “net income (computed in accordance with GAAP) excluding depreciation and amortization related to real estate, gains and losses from the sale of certain real estate assets, gains and losses from change in control, and impairment write-downs of certain real assets and investments in entities when the impairment is directly attributable to decreases in the value of depreciable real estate held by the entity.”
2FFO, Normalized FFO and Funds Available for Distribution ("FAD") do not represent cash generated from operating activities determined in accordance with GAAP and is not necessarily indicative of cash available to fund cash needs. FFO, Normalized FFO and FAD should not be considered alternatives to net income attributable to common stockholders as indicators of the Company's operating performance or as alternatives to cash flow as measures of liquidity.
3Potential common shares are not included in the computation of diluted earnings per share when a loss exists, as the effect would be an antidilutive per share amount.
4In Q1 2023, allowance for credit losses included a $5.2 million credit allowance for a mezzanine loan included in "Impairment of real estate and credit loss reserves" on the Statement of Income and $3.4 million reserve included in “Rental Income” on the Statement of Income for previously deferred rent and straight line rent for three skilled nursing facilities.
5Includes the Company's proportionate share of normalizing items related to unconsolidated joint ventures such as lease intangibles and acquisition and pursuit costs.
6Includes the amortization of deferred financing costs, discounts and premiums, and non-cash financing receivable amortization.
7Includes the Company's proportionate share of straight-line rent, net and rent reserves, net related to unconsolidated joint ventures.
8The Company utilizes the treasury stock method, which includes the dilutive effect of nonvested share-based awards outstanding of 308,389 for the three months ended December 31, 2023. Also includes the diluted impact of 3,966,365 OP units outstanding.
| | | | | |
| |
HEALTHCARE REALTY | 4Q 2023 SUPPLEMENTAL INFORMATION 11 |
| | |
| Capital Funding & Commitments |
| DOLLARS IN THOUSANDS, EXCEPT PER SHARE DATA |
|
| | | | | | | | | | | | | | | | | | | | | | | | | | | |
| ACQUISITION AND RE/DEVELOPMENT FUNDING | | | | | | |
| 4Q 2023 | 3Q 2023 | 2Q 2023 | 1Q 2023 | 4Q 2022 | | | | | | | | | | |
Acquisitions 1 | $— | $11,450 | $— | $31,500 | $26,388 | | | | | | | | | | |
Re/development 2 | 32,272 | 30,945 | 32,068 | 16,928 | 23,372 | | | | | | | | | | |
1st generation TI & acquisition capex 3 | 7,632 | 9,013 | 10,258 | 11,870 | 21,218 | | | | | | | | | | |
| | | | | | | | | | | | | | | |
| MAINTENANCE CAPITAL EXPENDITURES FUNDING |
| 4Q 2023 | 3Q 2023 | 2Q 2023 | 1Q 2023 | 4Q 2022 | | | | | | | | | | |
| | | | | | | | | | | | | | | |
| 2nd generation TI | $18,715 | $21,248 | $17,236 | $8,882 | $13,523 | | | | | | | | | | |
| Leasing commissions paid | 14,978 | 8,907 | 5,493 | 7,013 | 7,404 | | | | | | | | | | |
| Capital expenditures | 17,393 | 14,354 | 8,649 | 8,946 | 25,669 | | | | | | | | | | |
| $51,086 | $44,509 | $31,378 | $24,841 | $46,596 | | | | | | | | | | |
| % of Cash NOI | | | | | | |
| 2nd generation TI | 9.2 | % | 10.4 | % | 8.3 | % | 4.2 | % | 6.4 | % | | | | | | | | | | |
| Leasing commissions paid | 7.3 | % | 4.4 | % | 2.6 | % | 3.3 | % | 3.5 | % | | | | | | | | | | |
| Capital expenditures | 8.5 | % | 7.0 | % | 4.2 | % | 4.3 | % | 12.1 | % | | | | | | | | | | |
| 25.0 | % | 21.8 | % | 15.1 | % | 11.8 | % | 22.0 | % | | | | | | | | | | |
| | | | | | | | | | | | | | | |
LEASING COMMITMENTS 4 |
| 4Q 2023 | 3Q 2023 | 2Q 2023 | 1Q 2023 | 4Q 2022 | | | | | | | | | | |
| Renewals | | | | | | | | | | | | | | | |
| Square feet | 582,239 | 625,762 | 638,587 | 949,285 | 623,363 | | | | | | | | | | |
| 2nd generation TI/square foot/lease year | $1.89 | $1.76 | $1.64 | $1.84 | $1.90 | | | | | | | | | | |
| Leasing commissions/square foot/lease year | $1.66 | $1.48 | $1.19 | $0.87 | $0.78 | | | | | | | | | | |
| Renewal commitments as a % of annual net rent | 12.7 | % | 13.1 | % | 12.8 | % | 11.5 | % | 11.7 | % | | | | | | | | | | |
WALT (in months) 5 | 43.1 | 42.1 | 56.7 | 56.8 | 51.7 | | | | | | | | | | |
| | | | | | | | | | | | | | | |
| New leases | | | | | | | | | | | | | | | |
| Square feet | 315,243 | 344,524 | 205,565 | 274,344 | 297,340 | | | | | | | | | | |
| 2nd generation TI/square foot/lease year | $5.98 | $5.57 | $7.11 | $4.44 | $6.25 | | | | | | | | | | |
| Leasing commissions/square foot/lease year | $1.72 | $1.81 | $1.40 | $0.83 | $1.49 | | | | | | | | | | |
| New lease commitments as a % of annual net rent | 33.4 | % | 32.1 | % | 45.0 | % | 21.6 | % | 36.2 | % | | | | | | | | | | |
WALT (in months) 5 | 90.2 | 85.8 | 81.3 | 84.7 | 72.7 | | | | | | | | | | |
| | | | | | | | | | | | | | | |
| All | | | | | | | | | | | | | | | |
| Square feet | 897,482 | 970,286 | 844,152 | 1,223,629 | 920,703 | | | | | | | | | | |
| | | | | | | | | | | | | | | |
| | | | | | | | | | | | | | | |
| Leasing commitments as a % of annual net rent | 21.9 | % | 22.6 | % | 21.7 | % | 14.7 | % | 21.0 | % | | | | | | | | | | |
WALT (in months) 5 | 59.6 | 57.6 | 62.7 | 63.1 | 58.4 | | | | | | | | | | |
| | | | | | | | | | | | | | | |
| | | | | | | | | | | | | | | |
1Acquisitions include properties acquired through joint ventures at the Company's ownership percentage.
2Re/development funding includes capital spend on re/developments, development completions and unstabilized properties.
3Acquisition capex includes near-term fundings underwritten as part of recent acquisitions.
4Reflects leases commencing in the quarter. Excludes recently acquired or disposed properties, development completions, construction in progress, land held for development, corporate property, redevelopment properties, unstabilized properties, planned dispositions and assets classified as held for sale.
5WALT = weighted average lease term.
| | | | | |
| |
HEALTHCARE REALTY | 4Q 2023 SUPPLEMENTAL INFORMATION 12 |
| | |
Debt Metrics1 |
| DOLLARS IN THOUSANDS |
|
| | | | | | | | | | | | | | | | | | | | | | | | | | | | | |
| SUMMARY OF INDEBTEDNESS AS OF DECEMBER 31, 2023 | |
| PRINCIPAL BALANCE | BALANCE 1 | MATURITY DATE | MONTHS TO MATURITY 2 | INTEREST EXPENSE | CONTRACTUAL INTEREST EXPENSE | CONTRACTUAL RATE | EFFECTIVE RATE | FAIR VALUE MERGER ADJUSTED |
| SENIOR NOTES | $250,000 | $249,484 | 5/1/2025 | 16 | | $2,470 | $2,422 | 3.88 | % | 4.12 | % | |
| 600,000 | 579,017 | 8/1/2026 | 31 | | 7,142 | 5,250 | 3.50 | % | 4.94 | % | Y |
| 500,000 | 483,727 | 7/1/2027 | 42 | | 5,750 | 4,688 | 3.75 | % | 4.76 | % | Y |
| 300,000 | 297,429 | 1/15/2028 | 49 | | 2,783 | 2,719 | 3.63 | % | 3.85 | % | |
| 650,000 | 575,443 | 2/15/2030 | 74 | | 7,598 | 5,037 | 3.10 | % | 5.30 | % | Y |
| 299,500 | 296,780 | 3/15/2030 | 75 | | 1,928 | 1,797 | 2.40 | % | 2.72 | % | |
| 299,785 | 295,832 | 3/15/2031 | 87 | | 1,591 | 1,535 | 2.05 | % | 2.25 | % | |
| 800,000 | 649,521 | 3/15/2031 | 87 | | 8,288 | 4,000 | 2.00 | % | 5.13 | % | Y |
| $3,699,285 | $3,427,233 | | 59 | | $37,550 | $27,448 | 2.97 | % | 4.43 | % | |
| TERM LOANS | $350,000 | $349,798 | 7/20/2025 | 19 | | $5,703 | $5,703 | SOFR + 1.05% | 6.39 | % | |
| 200,000 | 199,903 | 5/31/2026 | 29 | | 3,259 | 3,259 | SOFR + 1.05% | 6.39 | % | |
| 150,000 | 149,643 | 6/1/2026 | 29 | | 2,445 | 2,445 | SOFR + 1.05% | 6.39 | % | |
| 300,000 | 299,958 | 10/31/2026 | 34 | | 4,888 | 4,888 | SOFR + 1.05% | 6.39 | % | |
| 200,000 | 199,502 | 7/20/2027 | 42 | | 3,259 | 3,259 | SOFR + 1.05% | 6.39 | % | |
| 300,000 | 298,288 | 1/20/2028 | 48 | | 4,888 | 4,888 | SOFR + 1.05% | 6.39 | % | |
| $1,500,000 | $1,497,092 | | 33 | | $24,442 | $24,442 | | 6.39 | % | |
| $1.5B CREDIT FACILITY | $0 | $0 | 10/31/2027 | 46 | | $3,892 | $3,892 | SOFR + 0.95% | 6.31 | % | |
| | | | | | | | | |
| MORTGAGES | $70,752 | $70,534 | various | 19 | | $754 | $791 | 4.17 | % | 4.15 | % | |
| $5,270,037 | $4,994,859 | | 49 | $66,638 | $56,573 | 3.96 | % | 5.02 | % | $2,550,000 |
| Interest rate swaps | (5,763) | (5,763) | | | |
| Interest cost capitalization | (884) | — | | | |
| Unsecured credit facility fee & deferred financing costs | 1,265 | 946 | | | |
| Amortization of fair value of swap maturing January 2024 | 997 | — | 1.21 | % | 3.21 | % | Y |
| Financing right-of-use asset amortization | 934 | — | | | |
| | | | | $63,187 | $51,756 | | | |
| | | | | | | | | | | | | | | | | | | | | |
| DEBT MATURITIES SCHEDULE AS OF DECEMBER 31, 2023 |
| | PRINCIPAL PAYMENTS | | |
| | BANK
LOANS | SENIOR NOTES | MORTGAGE NOTES | TOTAL | | WA RATE |
| 2024 | | | | $25,473 | $25,473 | | 4.39 | % |
| 2025 | | $350,000 | $250,000 | 16,375 | 616,375 | | 5.31 | % |
| 2026 | | $650,000 | $600,000 | 28,904 | 1,278,904 | | 4.96 | % |
| 2027 | | 200,000 | 500,000 | | 700,000 | | 4.51 | % |
| 2028 | | 300,000 | 300,000 | | 600,000 | | 5.01 | % |
| | | | | | | |
| Thereafter | | | 2,049,285 | | 2,049,285 | | 2.41 | % |
| Total | | $1,500,000 | $3,699,285 | $70,752 | $5,270,037 | | 3.96 | % |
Fixed rate debt balance 3 | | $1,075,000 | $3,699,285 | $70,752 | $4,845,037 | | |
% fixed rate debt to net debt 3 | | 92.4 | % | | |
| Company share of JV net debt | | $24,284 | | | |
| | | | | | | |
| | | | | | | |
| | | | | | | | |
| INTEREST RATE SWAPS |
| MATURITY | AMOUNT | FIXED SOFR RATE |
| January 2024 | 200,000 | | 1.21 | % |
| May 2026 | 275,000 | | 3.74 | % |
| June 2026 | 150,000 | | 3.83 | % |
| December 2026 | 150,000 | | 3.84 | % |
| June 2027 | 200,000 | | 4.27 | % |
| December 2027 | 300,000 | | 3.93 | % |
| As of 12/31/2023 | $1,275,000 | 3.49 | % |
| Subsequent activity: | | |
| Expiring Jan 2024 | (200,000) | | (1.21 | %) |
| As of 2/1/2024 | $1,075,000 | 3.92 | % |
| | |
| | |
1Balances are reflected net of discounts, fair value adjustments, and deferred financing costs and include premiums.
2Includes extension options.
3Fixed rate debt balance includes the impact of the January 2024 expiring interest rate swap.
| | | | | |
| |
HEALTHCARE REALTY | 4Q 2023 SUPPLEMENTAL INFORMATION 13 |
| | |
| Debt Covenants & Liquidity |
| DOLLARS IN THOUSANDS |
|
| | | | | | | | | | | |
SELECTED FINANCIAL DEBT COVENANTS YEAR ENDED DECEMBER 31, 2023 1 | |
| CALCULATION | REQUIREMENT | PER DEBT COVENANTS |
| Revolving credit facility and term loan | | |
| Leverage ratio | Total debt/total capital | Not greater than 60% | 37.5 | % |
| Secured leverage ratio | Total secured debt/total capital | Not greater than 30% | 0.5 | % |
| Unencumbered leverage ratio | Unsecured debt/unsecured real estate | Not greater than 60% | 40.0 | % |
| Fixed charge coverage ratio | EBITDA/fixed charges | Not less than 1.50x | 3.1x |
| Unsecured coverage ratio | Unsecured EBITDA/unsecured interest | Not less than 1.75x | 3.1x |
| | | |
| | | |
| Asset investments | Unimproved land, JVs & mortgages/total assets | Not greater than 35% | 8.3 | % |
| | | |
| Senior Notes | | | |
| Incurrence of total debt | Total debt/total assets | Not greater than 60% | 37.5 | % |
| Incurrence of debt secured by any lien | Secured debt/total assets | Not greater than 40% | 0.5 | % |
| Maintenance of total unsecured assets | Unencumbered assets/unsecured debt | Not less than 150% | 263.9 | % |
| Debt service coverage | EBITDA/interest expense | Not less than 1.5x | 3.2x |
| | | |
| Other | | | |
Net debt to adjusted EBITDA 2 | Net debt (debt less cash)/adjusted EBITDA | Not required | 6.4x |
| | | |
Net debt to enterprise value 3 | Net debt/enterprise value | Not required | 44.2 | % |
| | | | | |
| LIQUIDITY SOURCES |
| |
| Cash | $25,699 |
| Unsecured credit facility availability | 1,500,000 |
Consolidated unencumbered assets (gross) 4 | 13,216,513 |
1Does not include all financial and non-financial covenants and restrictions that are required by the Company's various debt agreements. Financial measures include the Company's proportionate share of unconsolidated joint ventures, as applicable.
2Net debt includes the Company's share of unconsolidated JV net debt. See page 25 for a reconciliation of adjusted EBITDA.
3Based on the closing price of $17.23 on December 29, 2023 and 384,816,882 shares outstanding including outstanding OP units.
4Annualized fourth quarter 2023 unencumbered asset NOI was $797.1 million.
| | | | | |
| |
HEALTHCARE REALTY | 4Q 2023 SUPPLEMENTAL INFORMATION 14 |
| | |
| Investment Activity |
| DOLLARS IN THOUSANDS |
|
| | | | | | | | | | | | | | | | | | | | | | | | | | | |
| MOB ACQUISITION ACTIVITY |
| MARKET | COUNT | MILES TO CAMPUS | ASSOCIATED HEALTH SYSTEM | CLOSING | SQUARE
FEET | LEASED % | PURCHASE PRICE 1 | % OWNERSHIP | |
| Tampa, FL | 1 | 0.06 | BayCare Health | 3/10/2023 | 115,867 | 98 | % | $31,500 | 100 | % | |
| Colorado Springs, CO | 1 | 1.30 | UC Health | 7/28/2023 | 42,770 | 94 | % | 11,450 | 100 | % | |
| | | | | | | | | |
| Total | 2 | | | | 158,637 | 97 | % | $42,950 | 100 | % | |
Average cap rate 2 | | | | | | 6.5 | % | | |
| | | | | | | | | | | | | | | | | | | |
| DISPOSITIONS TO REPAY ASSET SALE TERM LOAN | |
| LOCATION | | TYPE | CLOSING | SQUARE FEET | LEASED % | SALE
PRICE | |
Tampa, FL & Miami, FL 3 | | MOB | 1/12/2023 | 224,037 | 100 | % | $93,250 | |
Dallas, TX 4 | | INPATIENT | 1/30/2023 | 36,691 | 100 | % | 19,210 | |
| Total | | | | 260,728 | 100 | % | $112,460 | |
| | | | | | |
| ADDITIONAL DISPOSITION ACTIVITY | |
| LOCATION | | TYPE | CLOSING | SQUARE FEET | LEASED % | SALE
PRICE | |
| St. Louis, MO | | MOB | 2/10/2023 | 6,500 | 100 | % | $350 | |
| Los Angeles, CA | | MOB | 3/23/2023 | 37,165 | 100 | % | 21,000 | |
Los Angeles, CA 5 | | MOB | 3/30/2023 | 147,078 | 99 | % | 75,000 | |
Los Angeles, CA 6 | | LAND | 5/12/2023 | - | — | % | 3,300 | |
| Albany, NY | | MOB | 6/30/2023 | 40,870 | 96 | % | 10,000 | |
| Houston, TX | | OFFICE | 8/2/2023 | 57,170 | 88 | % | 8,320 | |
| Atlanta, GA | | MOB | 8/22/2023 | 55,195 | 100 | % | 25,140 | |
| Dallas, TX | | INPATIENT | 9/15/2023 | 161,264 | 100 | % | 115,000 | |
| Houston, TX | | MOB | 9/18/2023 | 52,040 | — | % | 250 | |
| Chicago, IL | | MOB | 9/27/2023 | 104,912 | 100 | % | 59,950 | |
Evansville, IN 7 | | MOB | 11/13/2023 | 260,520 | 100 | % | 18,550 | |
| Houston, TX | | HOSPITAL | 12/1/2023 | 83,223 | — | % | 3,900 | |
Charleston, SC 8 | | OFFICE | 12/15/2023 | 15,014 | 100 | % | 5,760 | |
| Dallas, TX | | MOB | 12/20/2023 | 77,827 | 100 | % | 41,640 | |
| Los Angeles, CA | | OFFICE | 12/21/2023 | 104,377 | — | % | 17,830 | |
Tucson, AZ 9,10 | | MOB | 12/22/2023 | 215,471 | 72 | % | 38,990 | |
| Miami, FL | | MOB | 12/22/2023 | 48,000 | 91 | % | 17,330 | |
| Sebring, FL | | MOB | 12/27/2023 | 38,949 | 100 | % | 9,420 | |
| Boston, MA | | MOB | 12/28/2023 | 161,254 | 100 | % | 114,770 | |
Jacksonville/Orlando/Miami, FL 11,12 | | SNF | 12/29/2023 | 354,500 | 100 | % | 69,730 | |
| Total | | | | 2,021,329 | 84 | % | $656,230 | |
| | | | | | | |
| | | | | | |
Average cap rate 13 | | | | | 6.6 | % | |
1Includes joint venture acquisitions at full acquisition price.
2For acquisitions, cap rate represents the forecasted first year NOI divided by purchase price. Does not include fees earned related to the unconsolidated joint venture.
3Includes two properties, sold in two separate transactions to the same buyer on the same date.
4Values and square feet are represented at 100%. The Company retained a 40% ownership interest in the joint venture that purchased this property.
5The Company entered into a mortgage note agreement with the buyer for $45.0 million.
6The Company sold a land parcel totaling 0.34 acres.
7Includes five properties, sold in three separate transactions to the same buyer on the same date.
8The Company sold a corporate office in Charleston, SC that was 100% leased by the Company.
9Includes 12 properties, sold in one transaction to the same buyer.
10The Company entered into a mortgage note agreement with the buyer for $6.0 million.
11Includes three properties, sold in one transaction to the same buyer.
12The Company entered into a mortgage note agreement with the buyer for $7.7 million.
13For dispositions, cap rate represents the in-place cash NOI divided by sales price.
| | | | | |
| |
HEALTHCARE REALTY | 4Q 2023 SUPPLEMENTAL INFORMATION 15 |
| | |
| Re/development Activity |
| DOLLARS IN THOUSANDS |
|
| | | | | | | | | | | | | | | | | | | | | | |
| RE/DEVELOPMENT PROJECTS | | |
| MARKET | ASSOCIATED HEALTH SYSTEM | | SQUARE
FEET | CURRENT LEASED % | BUDGET | COST TO COMPLETE | | ESTIMATED COMPLETION/INITIAL LEASE COMMENCEMENT |
| Active development | | | | | | | |
| Nashville, TN | Ascension | | 106,194 | 50 | % | $44,000 | $6,670 | | 3Q 2023 |
Orlando, FL 1 | Advent Health | | 156,566 | 78 | % | 65,000 | 32,320 | | 2Q 2025 |
| Raleigh, NC | UNC REX Health | | 120,694 | 42 | % | 52,600 | 19,208 | | 4Q 2024 |
| Phoenix, AZ | HonorHealth | | 101,000 | 80 | % | 54,000 | 32,659 | | 4Q 2024 |
| Total development | | 484,454 | 63 | % | $215,600 | $90,857 | | |
| Projected stabilized yield - 6.5%-8.0% | | | |
| Estimated stabilization period post completion - 12 - 36 months | | | |
| | | | | | | | |
| Active redevelopment | | | | | | | |
| Washington, DC | Inova Health | | 259,290 | 85 | % | $21,200 | $10,424 | | 2Q 2024 |
| Houston, TX | HCA | | 314,861 | 61 | % | 30,000 | 24,317 | | 4Q 2025 |
| Charlotte, NC | Novant Health | | 169,135 | 54 | % | 18,700 | 14,810 | | 1Q 2026 |
| Washington, DC | Inova Health | | 57,323 | 67 | % | 10,078 | 5,295 | | 1Q 2026 |
| Total redevelopment | | 800,609 | 68 | % | $79,978 | $54,846 | | |
| Occupied % | | | | 63 | % | | | | |
| Projected stabilized yield - 9.0%-12.0% | | | |
| Estimated stabilization period post completion - 12 - 36 months | | | |
| | | | | | | | |
| Total active re/development projects | 1,285,063 | 66 | % | $295,578 | $145,703 | | |
| | | | | | | | |
| | | | | | | | |
| | | | | | | | |
| | | | | | | | |
| | | | | | | | |
| | | | | | | | |
| | | | | | | | |
1Investment is a construction loan with purchase rights upon completion.
| | | | | |
| |
HEALTHCARE REALTY | 4Q 2023 SUPPLEMENTAL INFORMATION 16 |
| | |
Portfolio 1,2 |
| DOLLARS IN THOUSANDS |
|
| | | | | | | | | | | | | | | | | | | | | | | | | | | | | | | | | | | | | | | | | | | |
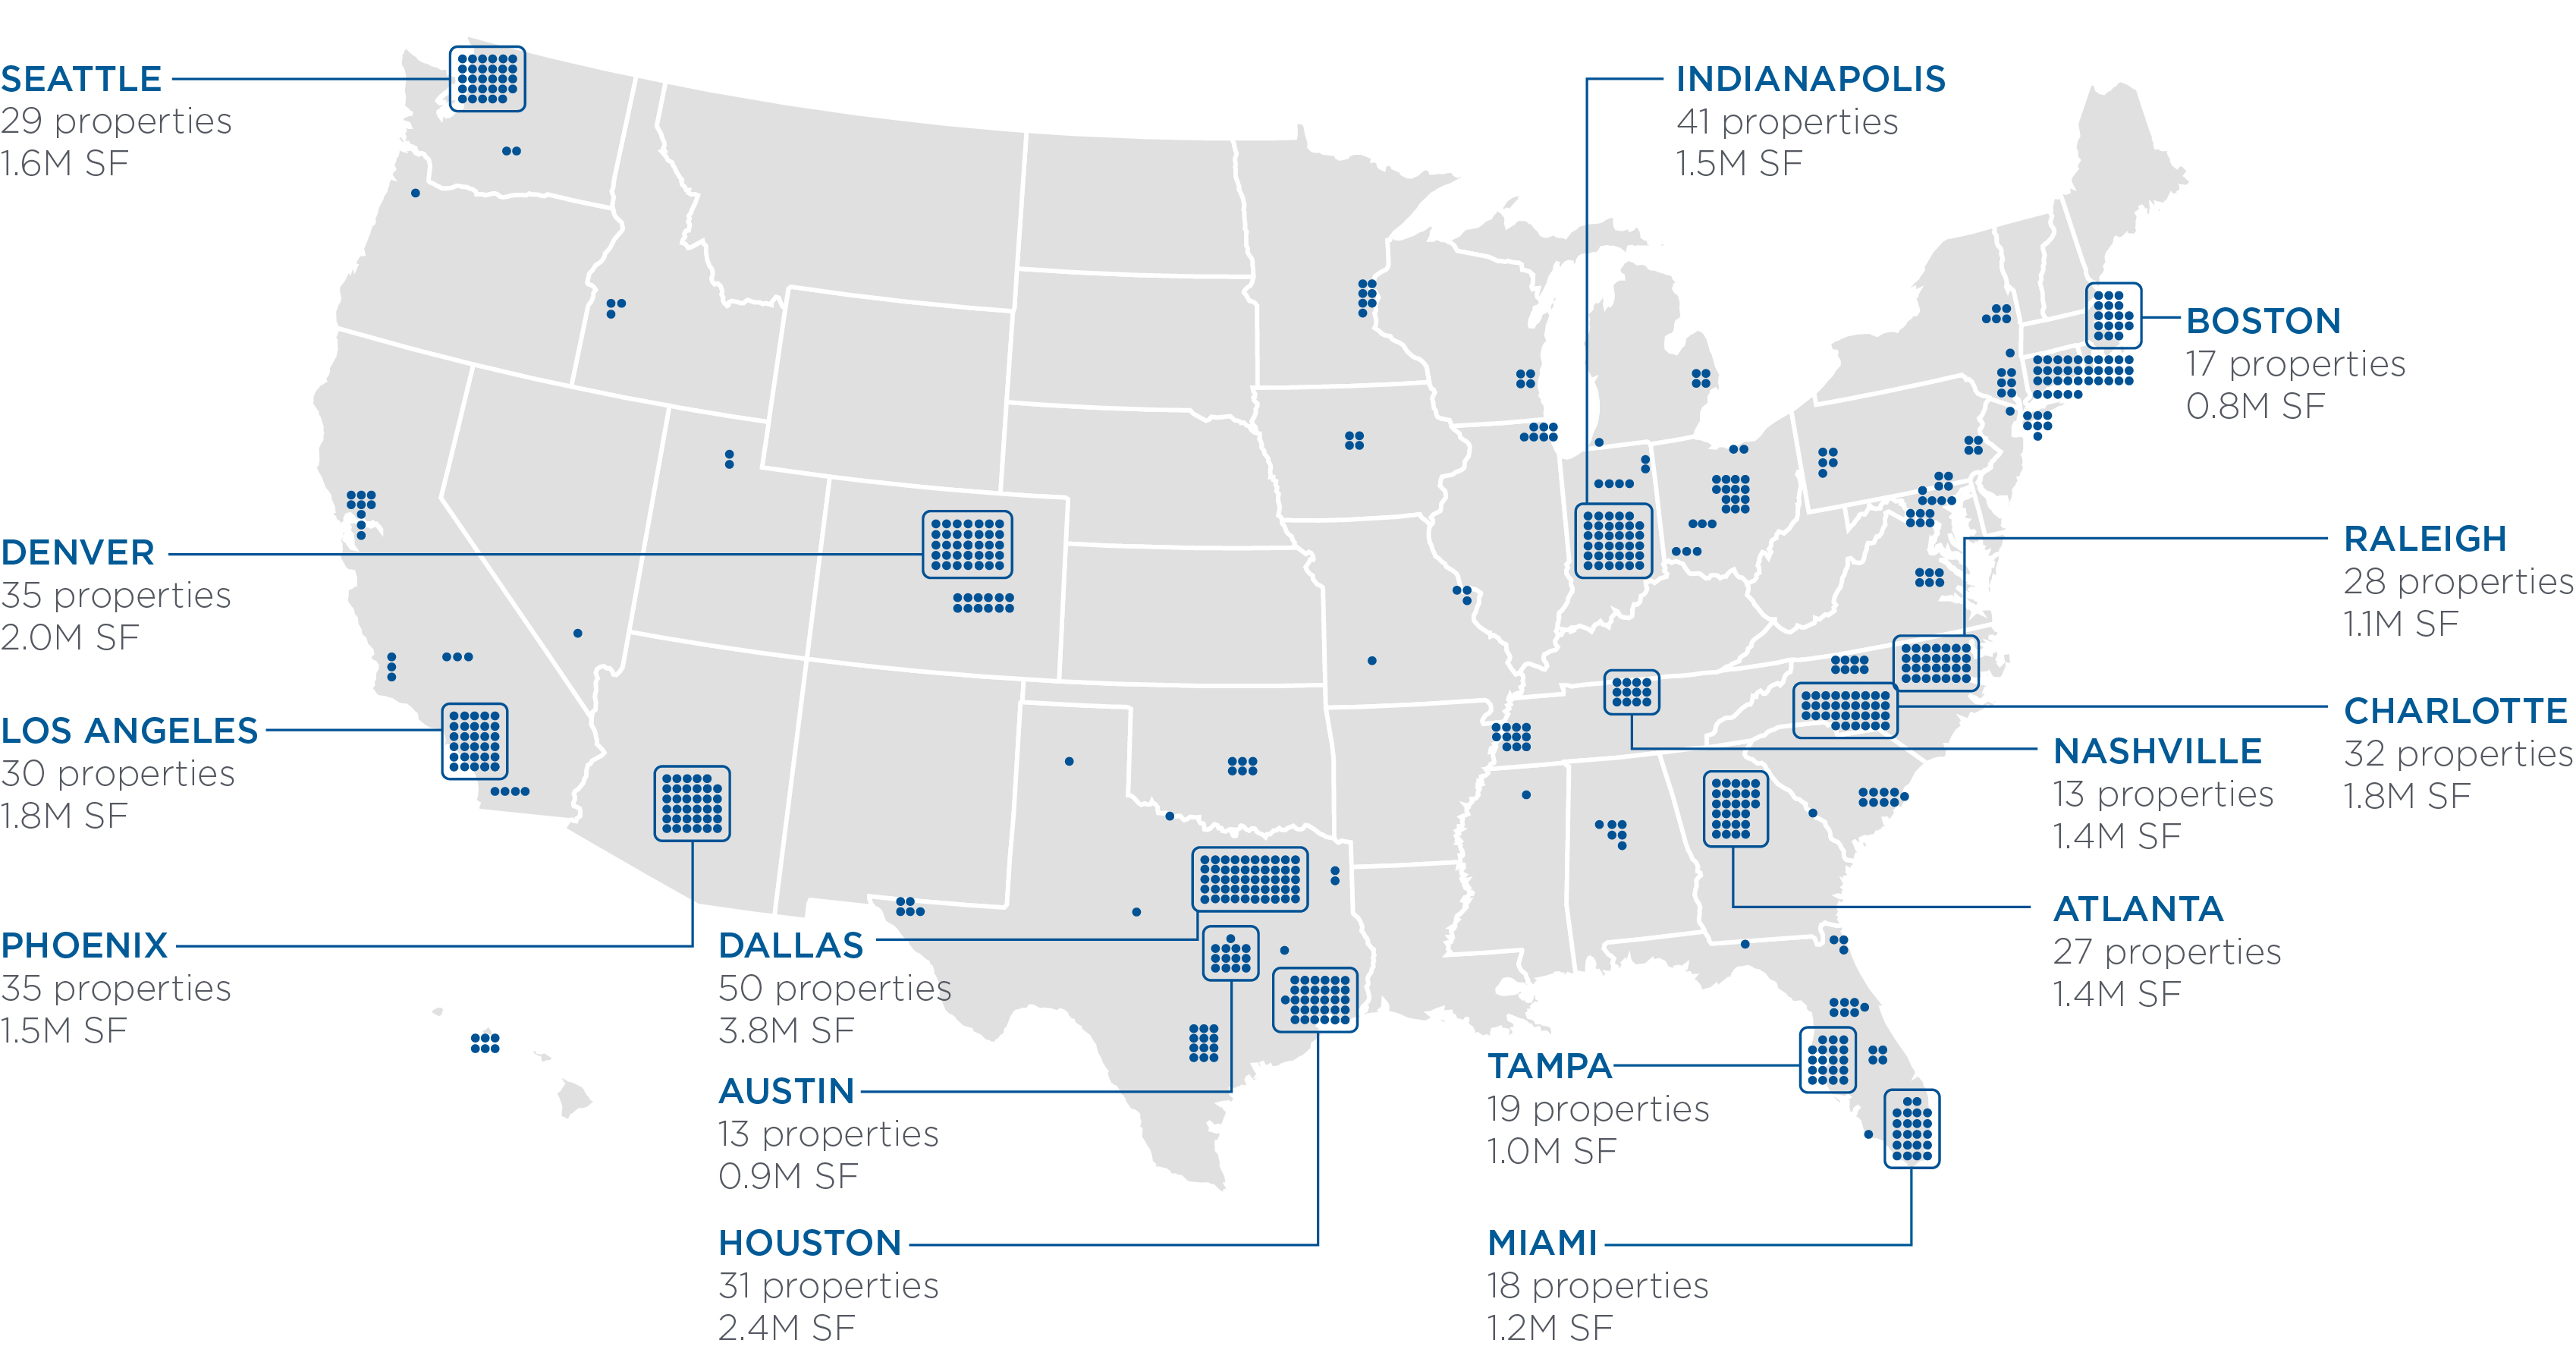
| MARKETS | | | | |
| | | WHOLLY OWNED COUNT | | SQUARE FEET | WHOLLY OWNED |
| | | | | | | | | | |
| MARKET | MSA RANK | | | MOB | | | INPATIENT | OFFICE | | WHOLLY OWNED | JOINT VENTURES3 | TOTAL | % OF NOI | CUMULATIVE % OF NOI |
| Dallas, TX | 4 | | 43 | | 3,230,488 | | | 146,519 | 199,800 | | 3,576,807 | 226,076 | 3,802,883 | 8.9 | % | 8.9 | % |
| Seattle, WA | 15 | | 29 | | 1,592,501 | | | | | | 1,592,501 | | 1,592,501 | 6.3 | % | 15.2 | % |
| Houston, TX | 5 | | 31 | | 2,351,135 | | | 67,500 | | | 2,418,635 | | 2,418,635 | 4.6 | % | 19.8 | % |
| Denver, CO | 19 | | 33 | | 1,780,819 | | | | 93,869 | | 1,874,688 | 116,616 | 1,991,304 | 4.4 | % | 24.2 | % |
| Charlotte, NC | 22 | | 32 | | 1,792,908 | | | | | | 1,792,908 | | 1,792,908 | 4.3 | % | 28.5 | % |
| Los Angeles, CA | 2 | | 20 | | 1,034,336 | | | 63,000 | | | 1,097,336 | 702,453 | 1,799,789 | 4.1 | % | 32.6 | % |
| Atlanta, GA | 9 | | 27 | | 1,423,141 | | | | | | 1,423,141 | | 1,423,141 | 3.9 | % | 36.5 | % |
| Boston, MA | 11 | | 17 | | 806,410 | | | | | | 806,410 | | 806,410 | 3.6 | % | 40.1 | % |
| Miami, FL | 7 | | 18 | | 1,196,531 | | | | | | 1,196,531 | | 1,196,531 | 3.2 | % | 43.3 | % |
| Nashville, TN | 36 | | 13 | | 1,241,872 | | | | 108,691 | | 1,350,563 | | 1,350,563 | 3.0 | % | 46.3 | % |
| Raleigh, NC | 42 | | 28 | | 1,109,582 | | | | | | 1,109,582 | | 1,109,582 | 2.9 | % | 49.2 | % |
| Phoenix, AZ | 10 | | 35 | | 1,512,304 | | | | | | 1,512,304 | | 1,512,304 | 2.9 | % | 52.1 | % |
| Austin, TX | 29 | | 13 | | 863,700 | | | | | | 863,700 | | 863,700 | 2.6 | % | 54.7 | % |
| Tampa. FL | 18 | | 19 | | 971,975 | | | | | | 971,975 | | 971,975 | 2.6 | % | 57.3 | % |
| Indianapolis, IN | 33 | | 40 | | 1,162,955 | | | 61,398 | | | 1,224,353 | 273,479 | 1,497,832 | 2.5 | % | 59.8 | % |
| New York, NY | 1 | | 15 | | 704,415 | | | | | | 704,415 | | 704,415 | 2.1 | % | 61.9 | % |
| San Francisco, CA | 12 | | 6 | | 452,666 | | | | | | 452,666 | 110,865 | 563,531 | 1.9 | % | 63.8 | % |
| Memphis, TN | 43 | | 11 | | 802,221 | | | 54,416 | | | 856,637 | | 856,637 | 1.9 | % | 65.7 | % |
| Chicago, IL | 3 | | 6 | | 607,845 | | | | | | 607,845 | | 607,845 | 1.9 | % | 67.6 | % |
| Honolulu, HI | 56 | | 6 | | 439,500 | | | | | | 439,500 | | 439,500 | 1.8 | % | 69.4 | % |
| Other (49 markets) | | | 212 | | 10,719,447 | | | 540,974 | 1,228,363 | | 12,488,784 | 519,911 | 13,008,695 | 30.6 | % | 100.0 | % |
| Total | | | 654 | | 35,796,751 | | | 933,807 | 1,630,723 | | 38,361,281 | 1,949,400 | 40,310,681 | 100.0 | % | |
| Number of properties | | | | 631 | | | 15 | 8 | | 654 | 34 | 688 | | |
| % of square feet | | | | | 93.3 | % | | | 2.4 | % | 4.3 | % | | 100.0 | % | | | | |
| % multi-tenant | | | | | 85.8 | % | | | — | % | 64.3 | % | | 82.8 | % | | | | |
Investment | | | | | $12,244,036 | | | $439,464 | $467,182 | | $13,150,683 | | | | |
Quarterly cash NOI 1 | | | | $179,830 | | | $8,181 | $6,442 | | $194,453 | | | | |
| % of cash NOI | | | | | 92.5 | % | | | 4.2 | % | 3.3 | % | | 100.0 | % | | | | |
| | | | | | | | | | | | | | | | | | |
| BY OWNERSHIP AND TENANT TYPE |
| WHOLLY OWNED | JOINT VENTURES3 | |
| MULTI-TENANT | SINGLE-TENANT | | MULTI-TENANT | SINGLE-TENANT | TOTAL |
| Number of properties | 528 | 126 | | 24 | 10 | 688 |
| Square feet | 31,776,412 | 6,584,869 | | 1,594,634 | 354,766 | 40,310,681 |
| % of square feet | 78.8 | % | 16.3 | % | | 4.0 | % | 0.9 | % | 100.0 | % |
Investment 1 | $10,407,242 | $2,743,441 | | $276,127 | $83,510 | $13,510,320 |
Quarterly cash NOI 1 | $151,160 | $43,292 | | $3,503 | $1,255 | $199,210 |
| % of cash NOI | 75.9 | % | 21.7 | % | | 1.8 | % | 0.6 | % | 100.0 | % |
1Gross investment and quarterly cash NOI are reflected at the Company's ownership percentage.
2Excludes assets held for sale, land held for development, construction in progress and corporate property.
3The Company's weighted average ownership percentage in its joint ventures was approximately 44%.
| | | | | |
| |
HEALTHCARE REALTY | 4Q 2023 SUPPLEMENTAL INFORMATION 17 |
| | | | | | | | | | | | | | | | | | | | | | | | | | | | | | | | |
| MOB PORTFOLIO | | |
| | | BUILDING SQUARE FEET | # OF BLDGS | | LEASED BY HEALTH SYSTEM | % OF LEASED SF | # OF LEASES |
| | | | | | |
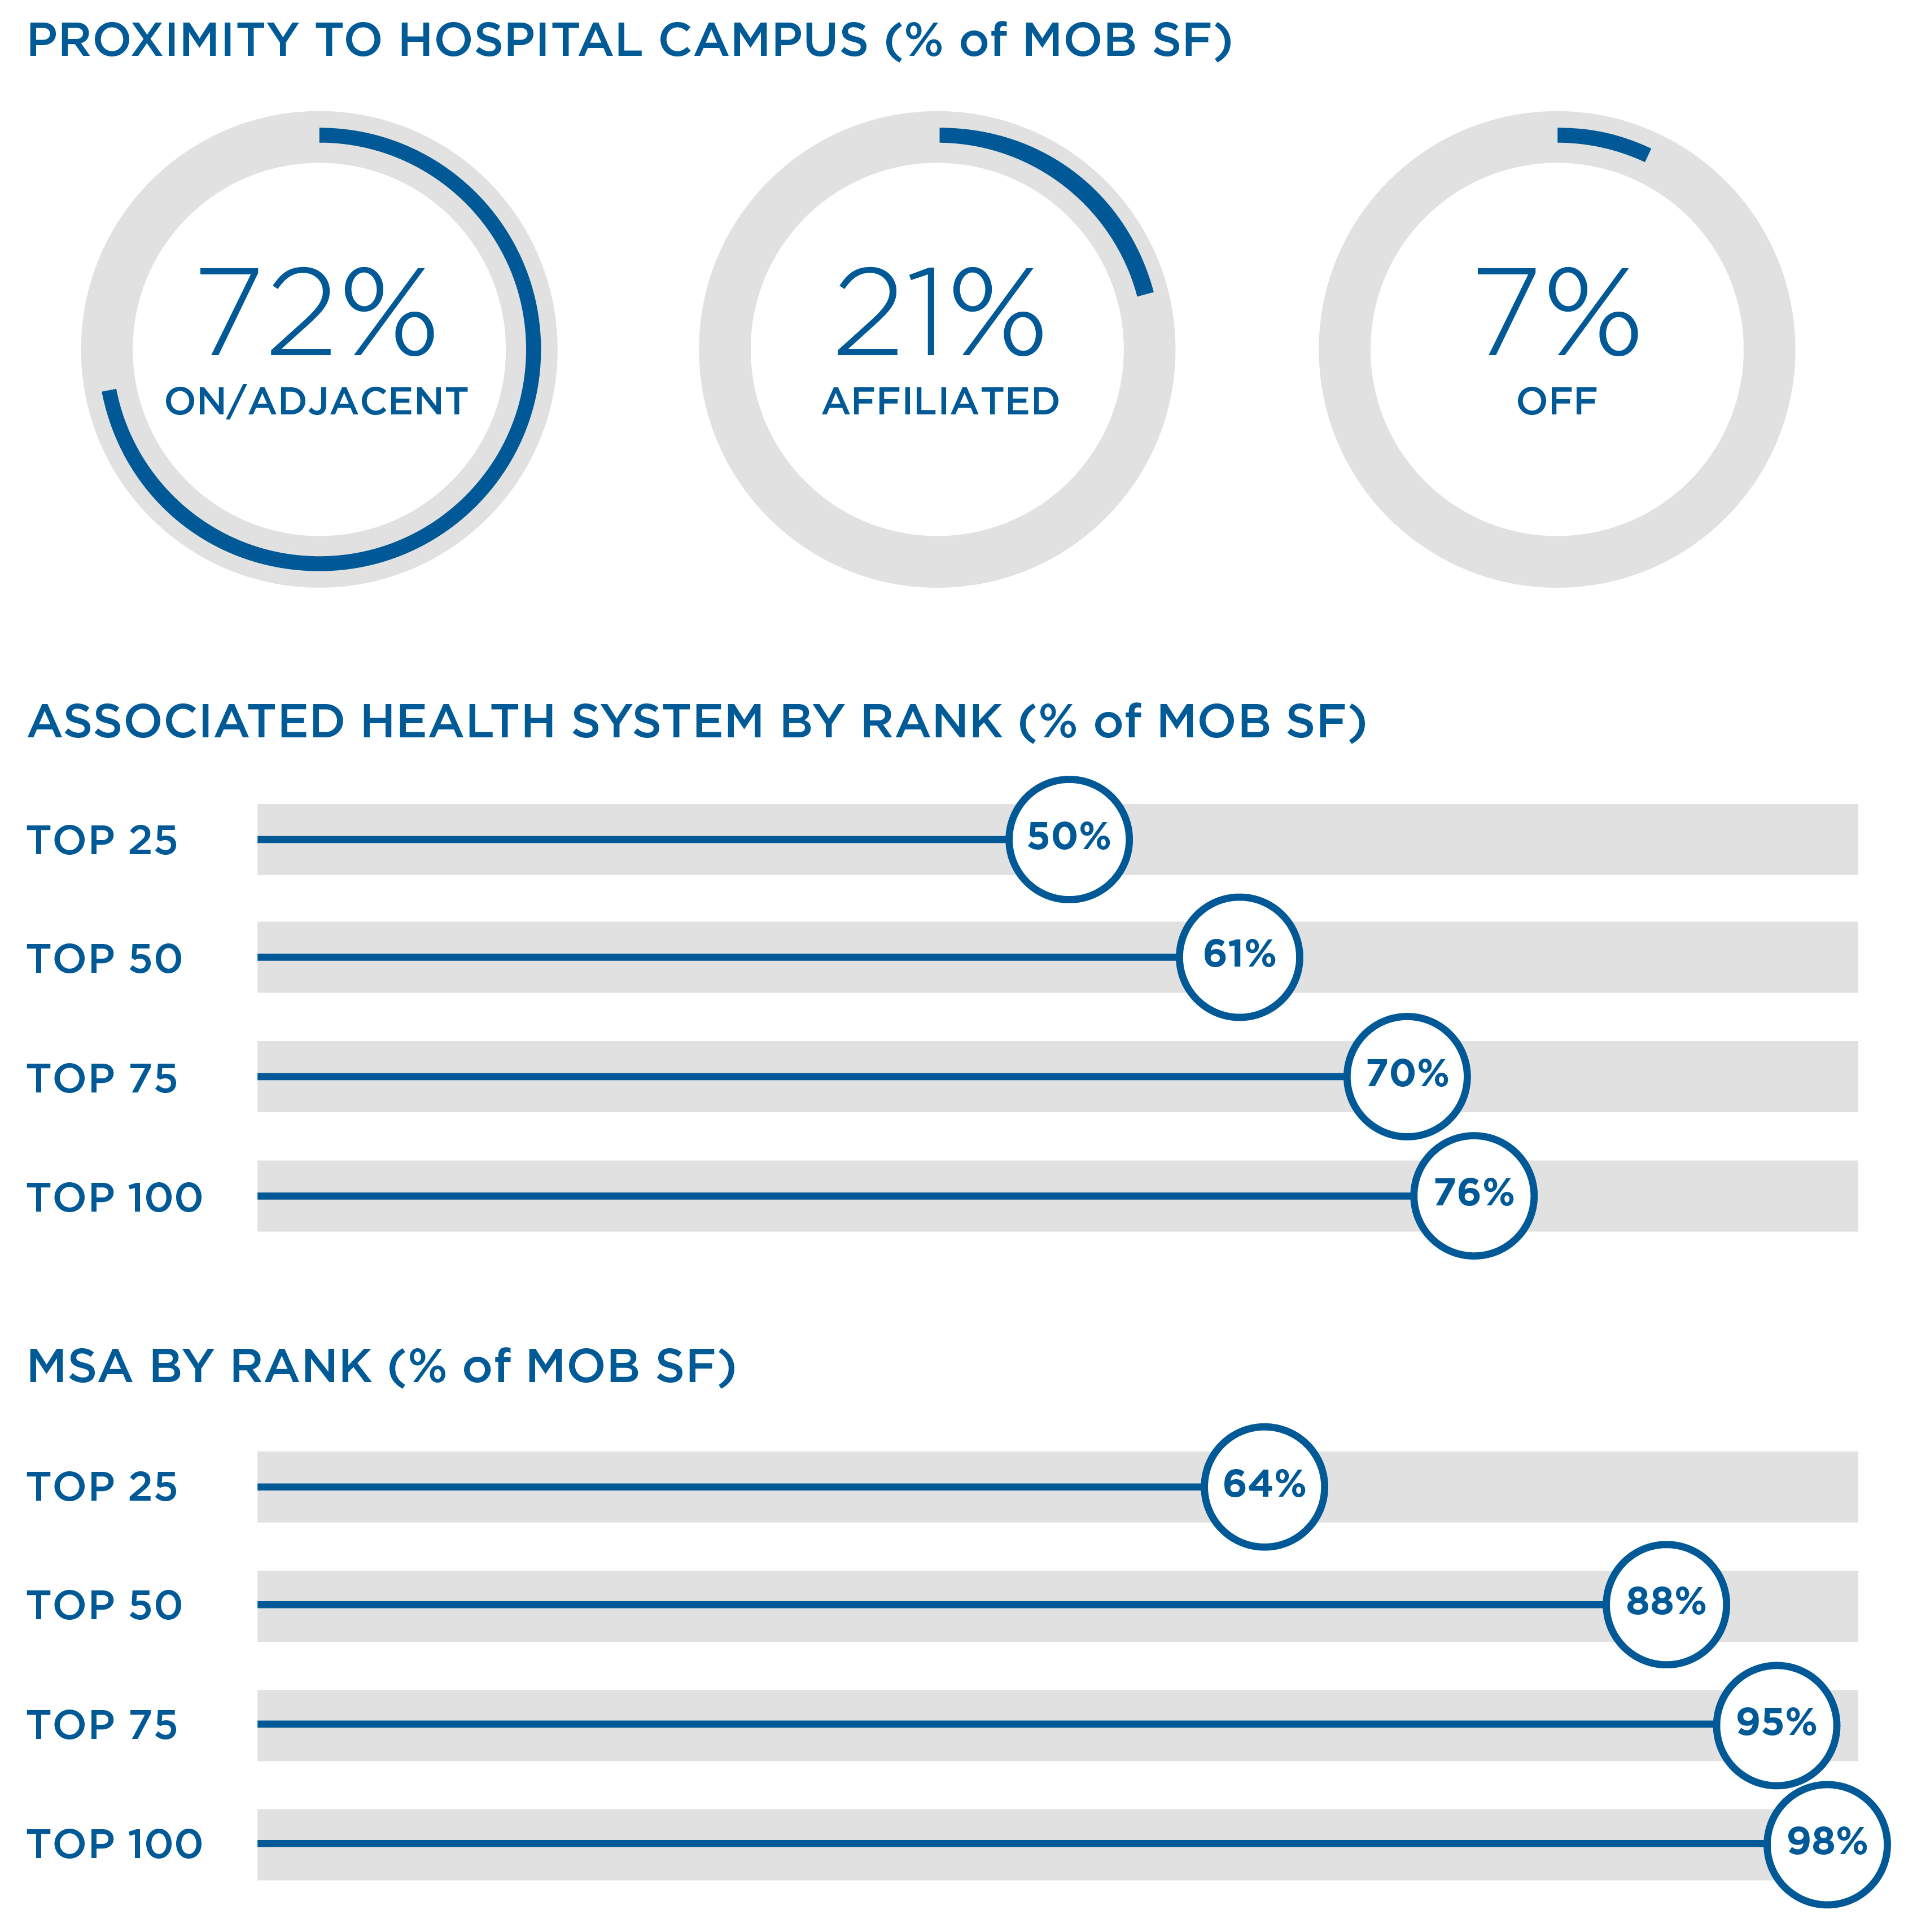
| HEALTH SYSTEM | SYSTEM RANK 2 | CREDIT RATING | ON/ADJACENT 3 | OFF-CAMPUS AFFILIATED 4 | TOTAL | % OF NOI |
| HCA | 1 | BBB-/Baa3 | 2,267,969 | 779,288 | 3,047,257 | | 46 | 8.9 | % | 786,142 | 2.5 | % | 133 |
| CommonSpirit | 4 | A-/Baa1 | 1,953,665 | 636,320 | 2,589,985 | | 45 | 7.1 | % | 909,512 | 2.9 | % | 164 |
| Baylor Scott & White | 21 | AA-/Aa3 | 2,570,180 | 66,376 | 2,636,556 | | 29 | 6.8 | % | 1,266,687 | 4.1 | % | 193 |
| Ascension Health | 3 | AA+/Aa2 | 2,262,563 | 97,551 | 2,360,114 | | 25 | 5.8 | % | 929,333 | 3.0 | % | 145 |
| Advocate Health | 14 | AA/Aa3 | 790,317 | 496,198 | 1,286,515 | | 20 | 4.1 | % | 1,128,837 | 3.6 | % | 96 |
| Tenet Healthcare Corporation | 6 | B+/B1 | 1,216,425 | 376,410 | 1,592,835 | | 26 | 3.7 | % | 396,589 | 1.3 | % | 83 |
| Wellstar Health System | 75 | A+/A2 | 896,773 | 23,088 | | 919,861 | | 18 | 2.8 | % | 582,754 | 1.9 | % | 81 |
| UW Medicine (Seattle) | 91 | AA+/Aaa | 461,363 | 169,709 | 631,072 | | 10 | 2.7 | % | 294,971 | 0.9 | % | 32 |
| AdventHealth | 11 | AA/Aa2 | 758,638 | 118,585 | | 877,223 | | 13 | 2.6 | % | 372,649 | 1.2 | % | 78 |
| Baptist Memorial Health Care | 89 | A-2/-- | 544,122 | 252,414 | | 796,536 | | 10 | 2.1 | % | 430,579 | 1.4 | % | 57 |
| Community Health Systems | 8 | CCC+/Caa2 | 785,169 | — | 785,169 | | 16 | 2.0 | % | 353,558 | 1.1 | % | 45 |
| Providence St. Joseph Health | 5 | A/A2 | 330,287 | 31,601 | 361,888 | | 8 | 1.7 | % | 137,032 | 0.4 | % | 25 |
| Cedars-Sinai Health Systems | 51 | AA-/Aa3 | 199,701 | 90,607 | 290,308 | | 5 | 1.6 | % | 65,278 | 0.2 | % | 21 |
| Trinity Health | 7 | AA-/Aa3 | 678,920 | 22,956 | 701,876 | | 11 | 1.6 | % | 354,279 | 1.1 | % | 54 |
| Hawaii Pacific Health | 181 | --/A1 | 173,502 | 124,925 | 298,427 | | 3 | 1.5 | % | 98,398 | 0.3 | % | 39 |
| Banner Health | 24 | AA-/-- | 749,075 | 31,039 | 780,114 | | 24 | 1.4 | % | 134,107 | 0.4 | % | 34 |
| WakeMed | 185 | --/A2 | 373,980 | 101,597 | | 475,577 | | 13 | 1.4 | % | 144,265 | 0.5 | % | 21 |
| Bon Secours Health System | 22 | A+/A2 | 405,945 | — | | 405,945 | | 6 | 1.3 | % | 242,817 | 0.8 | % | 50 |
| Overlake Health System | 291 | BBB+/Baa1 | 230,710 | — | | 230,710 | | 3 | 1.2 | % | 73,676 | 0.2 | % | 8 |
| UNC Health Care | 62 | A+/Aa3 | 273,186 | 84,886 | | 358,072 | | 8 | 1.1 | % | 219,400 | 0.7 | % | 27 |
| Sutter Health | 12 | A+/A1 | 175,591 | 76,507 | | 252,098 | | 3 | 1.1 | % | 93,229 | 0.3 | % | 19 |
| Other (70 credit rated) | | | 6,377,613 | 3,390,143 | 9,767,756 | | 191 | | 25.9 | % | 4,153,411 | 13.3 | % | |
Subtotal - credit rated 5 | | | 24,475,694 | 6,970,200 | 31,445,894 | | 533 | | 88.4 | % | 13,167,503 | 42.1 | % | |
Other non-credit rated 6 | | | 1,319,416 | 612,886 | 1,932,302 | | 39 | 6.5 | % | 860,198 | 2.8 | % | |
Off-campus non-affiliated 7 | | | — | 2,418,555 | 2,418,555 | | 59 | 5.1 | % | — | — | % | |
| Wholly-owned | | | 25,795,110 | 10,001,641 | 35,796,751 | | 631 | 100.0 | % | 14,027,701 | 44.9 | % | |
| Joint ventures | | | 1,143,456 | 579,868 | 1,723,324 | | | | | | |
| Total | | | 26,938,566 | 10,581,509 | 37,520,075 | | | | | | |
1Excludes construction in progress and assets classified as held for sale.
2Ranked by revenue based on Modern Healthcare's Healthcare Systems Financials Database.
3The Company defines an adjacent property as being no more than 0.25 miles from a hospital campus.
4Includes off-campus buildings where health systems lease 20% or more of the property and/or are located within 2 miles from a hospital campus.
5Based on square footage, 80% is associated and 40% is leased by an investment-grade rated healthcare provider.
6Includes 40 properties associated with hospital systems that are not credit rated.
7Includes off-campus buildings that are not 20% or more leased by a health system and are more than two miles from a hospital campus.
| | | | | |
| |
HEALTHCARE REALTY | 4Q 2023 SUPPLEMENTAL INFORMATION 18 |
| | |
MOB Proximity to Hospital 1,2 |
|
|
| | | | | | | | | | | | | | | |
| MOB BY LOCATION | | | | | |
| | | | | |
| # OF PROPERTIES | SQUARE FEET | TOTAL | % GROUND LEASED | |
| On campus | 235 | 18,176,920 | 48.4 | % | 37.3 | % | |
Adjacent to campus 3 | 186 | 8,761,646 | 23.4 | % | 3.5 | % | |
| Total on/adjacent | 421 | 26,938,566 | 71.8 | % | 40.8 | % | |
Off campus - affiliated 4 | 175 | 8,029,593 | 21.4 | % | 3.7 | % | |
| Off campus | 62 | 2,551,916 | 6.8 | % | 0.6 | % | |
| 658 | 37,520,075 | 100.0 | % | 45.1 | % | |
| Wholly-owned | 631 | 35,796,751 | | | |
| Joint ventures | 27 | 1,723,324 | | | |
| | | | | | | | | | | | | | | | | | | | | |
MOB BY CLUSTER 5 | |
| | | | | | | |
| TOTAL | HOSPITAL CENTRIC 6 | |
| # OF PROPERTIES | SQUARE FEET | % OF MOB SQUARE FEET | # OF PROPERTIES | SQUARE FEET | % OF MOB SQUARE FEET | |
| Clustered | 474 | 26,248,018 | 70.0 | % | 391 | 22,899,795 | 72.3 | % | |
| Non-clustered | 184 | 11,272,057 | 30.0 | % | 126 | 8,758,455 | 27.7 | % | |
| Total | 658 | 37,520,075 | 100.0 | % | 517 | 31,658,250 | 100.0 | % | |
1Includes joint venture properties and excludes construction in progress and assets classified as held for sale.
2Proximity to hospital campus includes acute care hospitals with inpatient beds. The Company does not consider inpatient rehab hospitals (IRFs), skilled nursing facilities (SNFs) or long-term acute care hospitals (LTACHs) to be hospital campuses for distance calculations.
3The Company defines an adjacent property as being no more than 0.25 miles from a hospital campus.
4Includes off-campus buildings where health systems lease 20% or more of the property and/or are located within 2 miles from a hospital campus.
5A cluster is defined as at least two properties within a geographic radius of two miles. The Company believes clusters provide operational efficiencies and greater local leasing knowledge that accelerate NOI growth.
6Includes buildings that are located within two miles of a hospital campus.
| | | | | |
| |
HEALTHCARE REALTY | 4Q 2023 SUPPLEMENTAL INFORMATION 19 |
| | |
Lease Maturity & Occupancy1 |
|
|
| | | | | | | | | | | | | | | | | | | | | | | | |
| LEASE MATURITY SCHEDULE | | | | | |
| | | SQUARE FEET | # OF WHOLLY-OWNED LEASES |
| | WHOLLY-OWNED AND JOINT VENTURE | | |
| | | MULTI-TENANT 2 | SINGLE-TENANT | TOTAL | % OF TOTAL | JOINT VENTURES | WHOLLY-OWNED |
| Month-to-month | | 412,192 | 3,589 | 415,781 | 1.2 | % | 24,104 | 391,677 | 188 |
| Q1 2024 | | 1,538,828 | 498,970 | 2,037,798 | 5.8 | % | 25,140 | 2,012,658 | 430 |
| Q2 2024 | | 1,068,131 | 78,584 | 1,146,715 | 3.3 | % | 55,305 | 1,091,410 | 348 |
| Q3 2024 | | 1,098,420 | 456,522 | 1,554,942 | 4.4 | % | 111,398 | 1,443,544 | 345 |
| Q4 2024 | | 1,044,123 | 104,517 | 1,148,640 | 3.3 | % | 28,977 | 1,119,663 | 296 |
| 2025 | | 3,807,315 | 956,710 | 4,764,025 | 13.5 | % | 179,899 | 4,584,126 | 1,097 |
| 2026 | | 3,898,898 | 304,579 | 4,203,477 | 11.9 | % | 122,587 | 4,080,890 | 1,059 |
| 2027 | | 3,346,972 | 999,428 | 4,346,400 | 12.3 | % | 152,639 | 4,193,761 | 853 |
| 2028 | | 3,128,365 | 709,194 | 3,837,559 | 10.9 | % | 106,363 | 3,731,196 | 834 |
| 2029 | | 1,767,614 | 616,449 | 2,384,063 | 6.8 | % | 342,627 | 2,041,436 | 400 |
| 2030 | | 1,859,314 | 756,694 | 2,616,008 | 7.4 | % | 87,788 | 2,528,220 | 366 |
| 2031 | | 1,090,010 | 137,827 | 1,227,837 | 3.5 | % | 29,760 | 1,198,077 | 252 |
| 2032 | | 1,840,390 | 361,573 | 2,201,963 | 6.2 | % | 62,415 | 2,139,548 | 295 |
| 2033 | | 955,127 | 207,370 | 1,162,497 | 3.3 | % | 40,812 | 1,121,685 | 202 |
| Thereafter | | 1,592,872 | 628,928 | 2,221,800 | 6.2 | % | 311,401 | 1,910,399 | 204 |
| Total occupied | | 28,448,571 | 6,820,934 | 35,269,505 | 87.5 | % | 1,681,215 | 33,588,290 | 7,169 |
| Total building | | 33,371,046 | 6,939,635 | 40,310,681 | | 1,949,400 | 38,361,281 | |
| Occupancy | | 85.2 | % | 98.3 | % | 87.5 | % | | 86.2 | % | 87.6 | % | |
| Leased % | | 87.3 | % | 98.3 | % | 89.2 | % | | 86.7 | % | 89.3 | % | |
WALTR (months) 3 | 49.3 | 62.6 | 51.9 | | | 50.5 | |
WALT (months) 3 | 95.7 | 137.2 | 103.7 | | | 102.0 | |
| | | | | | | | | |
| LEASING ACTIVITY |
| | Q4 2023 |
| | ABSORPTION ACTIVITY | SQUARE FEET |
| Occupied square feet, beginning of period | | | 35,929,113 | |
| | | |
| Dispositions | | | (837,582) | |
| Expirations and early vacates | | (1,045,118) | | |
| Renewals, amendments and extensions | | 702,550 | | |
| New lease commencements | | 520,542 | | |
| Absorption | | | 177,974 | |
| Occupied square feet, end of period | | | 35,269,505 | |
| | | |
1Excludes land held for development, construction in progress, corporate property and assets classified as held for sale, unless noted otherwise.
2The average lease size in the wholly-owned multi-tenant portfolio is 3,956 square feet.
3WALTR = weighted average lease term remaining; WALT = weighted average lease term.
| | | | | |
| |
HEALTHCARE REALTY | 4Q 2023 SUPPLEMENTAL INFORMATION 20 |
| | | | | | | | | | |
MERGER COMBINED SAME STORE RENEWALS 1 |
| Q4 2023 | TTM | | |
| | | | |
MOB cash leasing spreads 2 | 3.3 | % | 3.5 | % | | |
| | | | |
| MOB cash leasing spreads distribution | | | |
| < 0% spread | 3.0 | % | 4.7 | % | | |
| 0-3% spread | 5.5 | % | 12.9 | % | | |
| 3-4% spread | 75.6 | % | 64.9 | % | | |
| > 4% spread | 15.9 | % | 17.5 | % | | |
| Total | 100.0 | % | 100.0 | % | | |
| | | | |
| Tenant retention rate | 78.2 | % | 79.3 | % | | |
| | | | |
| | | | |
| | | | | | | | | | | | | | | | | | | | | | | | | | |
AVERAGE IN-PLACE CONTRACTUAL INCREASES 3 |
| MULTI-TENANT | SINGLE-TENANT | TOTAL |
| % INCREASE | % OF
BASE RENT | | % INCREASE | % OF
BASE RENT | | % INCREASE | % OF
BASE RENT |
Merger combined same store 1 | 2.88 | % | 70.3 | % | | 2.52 | % | 17.9 | % | | 2.81 | % | 88.3 | % |
| Acquisitions | 2.77 | % | 2.8 | % | | 4.19 | % | 0.5 | % | | 2.98 | % | 3.2 | % |
Other 4 | 2.74 | % | 7.0 | % | | 2.21 | % | 1.5 | % | | 2.65 | % | 8.5 | % |
| Total | 2.87 | % | 80.1 | % | | 2.54 | % | 19.9 | % | | 2.81 | % | 100.0 | % |
| Escalator type | | | | | | | | |
| Fixed | 2.82 | % | 96.7 | % | | 2.53 | % | 89.0 | % | | 2.76 | % | 95.2 | % |
| CPI | 4.27 | % | 3.3 | % | | 2.62 | % | 11.0 | % | | 3.52 | % | 4.8 | % |
| | | | | | | | | | | | | | |
TYPE AND OWNERSHIP STRUCTURE 1 |
| MULTI-TENANT | SINGLE-TENANT | | TOTAL |
| Tenant type | | | | |
| Hospital | 46.7 | % | 71.5 | % | | 51.7 | % |
| Physician and other | 53.3 | % | 28.5 | % | | 48.3 | % |
| | | | |
| Lease structure | | | | |
| Gross | 9.0 | % | 2.9 | % | | 7.8 | % |
| Modified gross | 31.5 | % | 11.2 | % | | 27.5 | % |
| Net | 59.5 | % | 63.7 | % | | 60.4 | % |
Absolute net 5 | — | % | 22.2 | % | | 4.3 | % |
| | | | |
| Ownership type | | | | |
| Ground lease | 44.1 | % | 38.7 | % | | 43.2 | % |
| Fee simple | 55.9 | % | 61.3 | % | | 56.8 | % |
| | | | | | | | | | | |
# OF LEASES BY SIZE 6 | |
| LEASED SQUARE FEET | # OF LEASES | WALT | WALTR |
| 0 - 2,500 | 3,653 | | 71.4 | | 36.4 | |
| 2,501 - 5,000 | 1,813 | | 82.7 | | 41.2 | |
| 5,001 - 7,500 | 633 | | 92.9 | | 46.5 | |
| 7,501 - 10,000 | 362 | | 97.9 | | 50.8 | |
| 10,001 + | 708 | | 121.4 | | 59.2 | |
| Total Leases | 7,169 | | 102.0 | | 50.5 | |
| | | |
| | | |
| | | |
|
| | | |
| | | |
1Excludes recently acquired or disposed properties, construction in progress, land held for development, corporate property, planned dispositions and assets classified as held for sale.
2Excludes non-MOB renewals of 44,000 square feet and 98,000 square feet for the fourth quarter and trailing twelve months, respectively.
3Excludes leases with lease terms of one year or less.
4Includes redevelopment properties, development completion, and joint ventures.
5Tenant is typically responsible for operating expenses and capital obligations.
6Excludes joint ventures, land held for development, construction in progress, corporate property and assets classified as held for sale.
| | | | | |
| |
HEALTHCARE REALTY | 4Q 2023 SUPPLEMENTAL INFORMATION 21 |
| | |
Merger Combined Same Store1 |
| DOLLARS IN THOUSANDS, EXCEPT PER SQUARE FOOT DATA |
| REFLECTS COMBINED COMPANY RESULTS FOR ALL PERIODS |
| | | | | | | | | | | | | | | | | | | | | | | | | | |
| TOTAL MERGER COMBINED CASH NOI |
| % of Total NOI | 4Q 2023 | 3Q 2023 | 4Q 2022 | Y-o-Y% CHANGE | 2023 | 2022 | % CHANGE |
| Multi-tenant | 70 | % | $ | 141,954 | | $ | 138,126 | | $ | 137,515 | | 3.2 | % | $ | 558,173 | | $ | 542,235 | | 2.9 | % |
| Single-tenant | 21 | % | 42,369 | | 42,542 | | 42,005 | | 0.9 | % | 168,401 | | 165,150 | | 2.0 | % |
| Joint venture | 2 | % | 3,082 | | 2,978 | | 2,921 | | 5.5 | % | 12,150 | | 11,523 | | 5.4 | % |
| Merger combined same store | 92 | % | $ | 187,405 | | $ | 183,646 | | $ | 182,441 | | 2.7 | % | $ | 738,724 | | $ | 718,908 | | 2.8 | % |
| Planned dispositions | — | % | 117 | | (101) | | 636 | | (81.6 | %) | 434 | | 3,616 | | (88.0 | %) |
| Re/development | 1 | % | 2,664 | | 2,116 | | 3,187 | | (16.4 | %) | 10,071 | | 14,254 | | (29.3 | %) |
| Wholly owned and joint venture acquisitions | 4 | % | 7,724 | | 8,478 | | 6,674 | | 15.7 | % | 31,925 | | 17,067 | | 87.1 | % |
| Development completions | 1 | % | 1,301 | | 1,257 | | 817 | | 59.2 | % | 4,438 | | 2,830 | | 56.8 | % |
| Completed dispositions & assets held for sale | 2 | % | 4,860 | | 9,327 | | 17,880 | | (72.8 | %) | 40,414 | | 101,663 | | (60.2 | %) |
| Merger combined total cash NOI | 100 | % | $204,071 | | $204,723 | | $211,635 | | (3.6 | %) | $826,006 | | $858,338 | | (3.8 | %) |
| | | | | | | | |
| | | | | | | | |
| | | | | | | | | | | | | | | | | | | | | | | | |
| PORTFOLIO OCCUPANCY AND ABSORPTION | | | |
| | | | OCCUPANCY % | ABSORPTION
(square feet in thousands) |
| COUNT | SQUARE FEET | | 4Q 2023 | 3Q 2023 | 4Q 2022 | SEQUENTIAL | Y-O-Y |
| Multi-tenant | 479 | 28,932,961 | | 86.9 | % | 86.7 | % | 86.7 | % | 77 | 66 |
| Single-tenant | 118 | 6,364,953 | | 99.6 | % | 99.6 | % | 99.4 | % | 3 | 15 |
| Joint venture | 18 | 1,225,320 | | 87.3 | % | 88.5 | % | 88.0 | % | (15) | (9) |
| Merger combined same store | 615 | 36,523,234 | | 89.2 | % | 89.0 | % | 89.0 | % | 65 | 72 |
| Planned dispositions | 5 | 227,686 | | 25.5 | % | 26.1 | % | 49.7 | % | (1) | (55) |
| Re/development | 16 | 1,368,720 | | 54.8 | % | 51.1 | % | 58.7 | % | 50 | (53) |
| Wholly owned and joint venture acquisitions | 47 | 1,788,173 | | 90.9 | % | 90.3 | % | 87.7 | % | 11 | 45 |
| Development completions | 5 | 402,868 | | 67.1 | % | 73.2 | % | 66.6 | % | 53 | 73 |
| Total portfolio | 688 | 40,310,681 | | 87.5 | % | 87.3 | % | 87.5 | % | 178 | 82 |
| Joint ventures | 34 | 1,949,400 | | 86.2 | % | 86.9 | % | 85.4 | % | (14) | 12 |
| Total wholly-owned | 654 | 38,361,281 | | 87.6 | % | 87.3 | % | 87.6 | % | 192 | 70 |
1Same store properties are properties that have been included in operations for the duration of the year-over-year comparison period presented. Accordingly, same store properties exclude properties that were recently acquired or disposed of, properties classified as held for sale or intended for sale, properties undergoing redevelopment, and newly redeveloped or developed properties. Legacy HTA properties that met the same store criteria are included in both periods shown as if they were owned by the Company for the full analysis period.
| | | | | |
| |
HEALTHCARE REALTY | 4Q 2023 SUPPLEMENTAL INFORMATION 22 |
| | |
Merger Combined Same Store1, 2 |
| DOLLARS IN THOUSANDS, EXCEPT PER SQUARE FOOT DATA |
| REFLECTS COMBINED COMPANY RESULTS FOR ALL PERIODS |
| | | | | | | | | | | | | | | | | | | | | | | |
| MERGER COMBINED SAME STORE CASH NOI |
| TOTAL |
| 4Q 2023 | 3Q 2023 | 2Q 2023 | 1Q 2023 | 4Q 2022 | 2023 | 2022 |
| Base revenue | $224,025 | $222,137 | $221,530 | $219,890 | $218,534 | $887,582 | $865,819 |
| Op. exp. recoveries | 68,843 | 73,739 | 68,626 | 69,063 | 65,256 | 280,271 | 264,682 |
| Revenues | $292,868 | $295,876 | $290,156 | $288,953 | $283,790 | $1,167,853 | $1,130,501 |
| Expenses | 105,463 | 112,230 | 105,709 | 105,727 | 101,349 | 429,129 | 411,593 |
| Cash NOI | $187,405 | $183,646 | $184,447 | $183,226 | $182,441 | $738,724 | $718,908 |
Revenue per occ SF 3 | $36.01 | $36.40 | $35.68 | $35.55 | $34.96 | $35.91 | $34.87 |
| Margin | 64.0 | % | 62.1 | % | 63.6 | % | 63.4 | % | 64.3 | % | 63.3 | % | 63.6 | % |
| Average occupancy | 89.1 | % | 89.0 | % | 89.1 | % | 89.0 | % | 88.9 | % | 89.1 | % | 88.8 | % |
| Period end occupancy | 89.2 | % | 89.0 | % | 89.1 | % | 89.1 | % | 89.0 | % | 89.2 | % | 89.0 | % |
| Number of properties | 615 | 615 | 615 | 615 | 615 | 615 | 615 |
| | | | | | | |
| Year-Over-Year Change | | | | | | | |
Revenue per occ SF 3 | 3.0 | % | | | | | 3.0 | % | |
| Avg occupancy (bps) | +20 | | | | | +30 | |
| Revenues | 3.2 | % | | | | | 3.3 | % | |
| Base revenue | 2.5 | % | | | | | 2.5 | % | |
| Exp recoveries | 5.5 | % | | | | | 5.9 | % | |
| Expenses | 4.1 | % | | | | | 4.3 | % | |
| Cash NOI | 2.7 | % | | | | | 2.8 | % | |
1Same store properties are properties that have been included in operations for the duration of the year-over-year comparison period presented. Accordingly, same store properties exclude properties that were recently acquired or disposed of, properties classified as held for sale or intended for sale, properties undergoing redevelopment, and newly redeveloped or developed properties. Legacy HTA properties that met the same store criteria are included in both periods shown as if they were owned by the Company for the full analysis period.
2Excludes recently acquired or disposed properties, development completions, construction in progress, land held for development, corporate property, redevelopment properties, planned dispositions and assets classified as held for sale.
3Revenue per occ SF is calculated by dividing revenue by the average of the occupied SF for the period provided. Quarterly revenue per occ SF is annualized.
| | | | | |
| |
HEALTHCARE REALTY | 4Q 2023 SUPPLEMENTAL INFORMATION 23 |
| | |
| NOI Reconciliations |
| DOLLARS IN THOUSANDS |
|
| | | | | | | | | | | | | | | | | | | | | | | | | | | | | | | | | | | | |
| BOTTOM UP RECONCILIATION | | | | | | | | | | | | | | | | |
| 4Q 2023 | 3Q 2023 | 2Q 2023 | 1Q 2023 | | 4Q 2022 | | 3Q 2022 | 2Q 2022 | 1Q 2022 | | | | | | |
| Net income (loss) attr. to common stockholders | ($40,533) | | ($67,844) | | ($82,759) | | ($87,125) | | | ($35,764) | | | $28,304 | | $6,130 | | $42,227 | | | | | | | |
| | | | | | | | | | | | | | | | |
| | | | | | | | | | | | | | | | |
| Other income (expense) | 54,382 | | 74,621 | | 112,818 | | 94,407 | | | 46,772 | | | (89,477) | | 7,479 | | (29,293) | | | | | | | |
| General and administrative expense | 14,609 | | 13,396 | | 15,464 | | 14,935 | | | 14,417 | | | 16,741 | | 10,540 | | 11,036 | | | | | | | |
| Depreciation and amortization expense | 180,049 | | 182,989 | | 183,193 | | 184,479 | | | 185,275 | | | 158,117 | | 55,731 | | 54,041 | | | | | | | |
Other expenses 1 | 4,899 | | 11,783 | | (11,969) | | 7,940 | | | 13,580 | | | 82,659 | | 11,034 | | 9,929 | | | | | | | |
| Straight-line rent expense | 1,484 | | 1,538 | | 1,525 | | 1,537 | | | 1,358 | | | 1,260 | | 378 | | 378 | | | | | | | |
| Straight-line rent revenue | (9,356) | | (10,008) | | (9,530) | | (9,782) | | | (11,231) | | | (8,975) | | (1,705) | | (1,587) | | | | | | | |
Other revenue 2 | (6,221) | | (6,446) | | (5,959) | | (1,686) | | | (7,330) | | | (5,242) | | (1,961) | | (2,044) | | | | | | | |
| Joint venture property cash NOI | 4,758 | | 4,692 | | 4,957 | | 4,769 | | | 4,579 | | | 3,877 | | 2,551 | | 2,052 | | | | | | | |
| Cash NOI | $204,071 | | $204,721 | | $207,740 | | $209,474 | | | $211,656 | | | $187,264 | | $90,177 | | $86,739 | | | | | | | |
| Pre-merger Legacy HTA NOI | — | | — | | — | | — | | | — | | | 27,114 | | 128,025 | | 127,363 | | | | | | | |
| Cash NOI including pre-merger Legacy HTA NOI | $204,071 | | $204,721 | | $207,740 | | $209,474 | | | $211,656 | | | $214,378 | | $218,202 | | $214,102 | | | | | | | |
| Planned dispositions | (117) | | 101 | | 126 | | (544) | | | (636) | | | (604) | | (1,144) | | (1,232) | | | | | | | |
| Redevelopment | (2,664) | | (2,116) | | (2,455) | | (2,836) | | | (3,187) | | | (3,510) | | (3,605) | | (3,952) | | | | | | | |
| Wholly owned and joint venture acquisitions | (7,724) | | (8,478) | | (8,146) | | (7,577) | | | (6,674) | | | (5,489) | | (4,210) | | (694) | | | | | | | |
| Development completions | (1,301) | | (1,257) | | (1,021) | | (859) | | | (817) | | | (682) | | (528) | | (803) | | | | | | | |
| Completed dispositions & assets held for sale | (4,860) | | (9,325) | | (11,797) | | (14,432) | | | (17,901) | | | (24,573) | | (28,584) | | (30,605) | | | | | | | |
| Merger combined same store cash NOI | $187,405 | | $183,646 | | $184,447 | | $183,226 | | | $182,441 | | | $179,520 | | $180,131 | | $176,816 | | | | | | | |
| Same store joint venture properties | (3,082) | | (2,978) | | (3,125) | | (2,965) | | | (2,921) | | | (2,777) | | (2,917) | | (2,908) | | | | | | | |
| Merger combined same store excluding JVs | $184,323 | | $180,668 | | $181,322 | | $180,261 | | | $179,520 | | | $176,743 | | $177,214 | | $173,908 | | | | | | | |
| | | | | | | | | | | | | | | | |
| TOP DOWN RECONCILIATION | | | | | | | | | | | | | | | | |
| 4Q 2023 | 3Q 2023 | 2Q 2023 | 1Q 2023 | | 4Q 2022 | | 3Q 2022 | 2Q 2022 | 1Q 2022 | | | | | | |
| Rental income before rent concessions | $325,772 | | $336,503 | | $332,992 | | $328,115 | | | $332,652 | | | $301,692 | | $142,073 | | $139,775 | | | | | | | |
| Rent concessions | (3,696) | | (3,168) | | (3,312) | | (4,022) | | | (3,253) | | | (2,761) | | (1,441) | | (1,286) | | | | | | | |
| Rental income | 322,076 | | 333,335 | | 329,680 | | 324,093 | | | 329,399 | | | 298,931 | | 140,632 | | 138,489 | | | | | | | |
| Parking income | 2,392 | | 2,751 | | 2,370 | | 2,391 | | | 2,413 | | | 2,428 | | 1,919 | | 1,753 | | | | | | | |
| Interest from financing receivable, net | 2,132 | | 2,002 | | 2,180 | | 2,227 | | | 2,284 | | | 2,034 | | 1,957 | | 1,930 | | | | | | | |
| Exclude straight-line rent revenue | (9,356) | | (10,008) | | (9,530) | | (9,782) | | | (11,231) | | | (8,975) | | (1,705) | | (1,587) | | | | | | | |
Exclude other non-cash revenue 3 | (1,513) | | (1,410) | | (1,018) | | 3,594 | | | (3,059) | | | (2,280) | | (1,142) | | (1,322) | | | | | | | |
| Cash revenue | 315,731 | | 326,670 | | 323,682 | | 322,523 | | | 319,806 | | | 292,138 | | 141,661 | | 139,263 | | | | | | | |
| Property operating expense | (121,362) | | (131,639) | | (125,395) | | (122,040) | | | (117,009) | | | (112,473) | | (57,010) | | (57,464) | | | | | | | |
Exclude non-cash expenses 4 | 4,668 | | 5,079 | | 4,556 | | 4,336 | | | 3,764 | | | 4,034 | | 2,975 | | 2,888 | | | | | | | |
| Non-controlling interest | 276 | | (81) | | (60) | | (114) | | | 516 | | | (312) | | — | | — | | | | | | | |
| Joint venture property cash NOI | 4,758 | | 4,692 | | 4,957 | | 4,769 | | | 4,579 | | | 3,877 | | 2,551 | | 2,052 | | | | | | | |
| Cash NOI | $204,071 | | $204,721 | | $207,740 | | $209,474 | | | $211,656 | | | $187,264 | | $90,177 | | $86,739 | | | | | | | |
| Pre-merger Legacy HTA NOI | — | | — | | — | | — | | | — | | | 27,114 | | 128,025 | | 127,363 | | | | | | | |
| Cash NOI including pre-merger Legacy HTA NOI | $204,071 | | $204,721 | | $207,740 | | $209,474 | | | $211,656 | | | $214,378 | | $218,202 | | $214,102 | | | | | | | |
| Planned dispositions | (117) | | 101 | | 126 | | (544) | | | (636) | | | (604) | | (1,144) | | (1,232) | | | | | | | |
| Redevelopment | (2,664) | | (2,116) | | (2,455) | | (2,836) | | | (3,187) | | | (3,510) | | (3,605) | | (3,952) | | | | | | | |
| Wholly owned and joint venture acquisitions | (7,724) | | (8,478) | | (8,146) | | (7,577) | | | (6,674) | | | (5,489) | | (4,210) | | (694) | | | | | | | |
| Development completions | (1,301) | | (1,257) | | (1,021) | | (859) | | | (817) | | | (682) | | (528) | | (803) | | | | | | | |
| Completed dispositions & assets held for sale | (4,860) | | (9,325) | | (11,797) | | (14,432) | | | (17,901) | | | (24,573) | | (28,584) | | (30,605) | | | | | | | |
| Merger combined same store cash NOI | $187,405 | | $183,646 | | $184,447 | | $183,226 | | | $182,441 | | | $179,520 | | $180,131 | | $176,816 | | | | | | | |
| Same store joint venture properties | (3,082) | | (2,978) | | (3,125) | | (2,965) | | | (2,921) | | | (2,777) | | (2,917) | | (2,908) | | | | | | | |
| Merger combined same store excluding JVs | $184,323 | | $180,668 | | $181,322 | | $180,261 | | | $179,520 | | | $176,743 | | $177,214 | | $173,908 | | | | | | | |
1Includes acquisition and pursuit costs, merger-related costs, rent reserves, above and below market ground lease intangible amortization, leasing commission amortization, non-cash adjustments for financing receivables, and ground lease straight-line rent.
2Includes management fee income, interest, above and below market lease intangible amortization, lease inducement amortization, lease termination fees, deferred financing cost amortization and principle related to investment in financing receivable, and tenant improvement overage amortization.
3Includes above and below market intangibles, lease inducements, lease termination fees, deferred financing cost amortization, financing receivable, and TI amortization.
4Includes above and below market ground lease intangible amortization, leasing commission amortization, and ground lease straight-line rent.
| | | | | |
| |
HEALTHCARE REALTY | 4Q 2023 SUPPLEMENTAL INFORMATION 24 |
| | |
| NOI Reconciliations |
| DOLLARS IN THOUSANDS |
|
| | | | | | | | | | | | | | | | | | | | | | | | | |
| RECONCILIATION OF NOI TO FULL QUARTER FFO AND NORMALIZED FFO | | | | | | | |
| 4Q 2023 | 3Q 2023 | 2Q 2023 | 1Q 2023 | 4Q 2022 | | | | | | | | |
| Cash NOI | $204,071 | | $204,721 | | $207,740 | | $209,474 | | $211,656 | | | | | | | | | |
| General and administrative expense | (14,609) | | (13,396) | | (15,464) | | (14,935) | | (14,417) | | | | | | | | | |
| Straight-line rent | 9,356 | | 10,008 | | 9,530 | | 9,782 | | 11,231 | | | | | | | | | |
| Interest and other income (expense), net | 65 | | 139 | | 592 | | 547 | | (1,168) | | | | | | | | | |
| Management fees and other income | 1,551 | | 1,910 | | 1,860 | | 2,227 | | 2,023 | | | | | | | | | |
| Note receivable interest income | 2,290 | | 2,262 | | 2,180 | | 1,987 | | 1,943 | | | | | | | | | |
Other non-cash revenue 1 | 2,380 | | 2,250 | | 1,918 | | (2,526) | | 3,059 | | | | | | | | | |
Other non-cash expenses 2 | (4,668) | | (5,079) | | (4,556) | | (4,336) | | (3,764) | | | | | | | | | |
| Non-real estate impairment | — | | — | | — | | (5,196) | | — | | | | | | | | | |
| | | | | | | | | | | | | |
| Unconsolidated JV adjustments | (352) | (337) | (185) | (357) | (143) | | | | | | | | | |
| Debt Covenant EBITDA | $200,084 | | $202,478 | | $203,615 | | $196,667 | | $210,420 | | | | | | | | | |
| Interest expense | (63,187) | | (66,304) | | (65,334) | | (63,759) | | (64,443) | | | | | | | | | |
| Gain on extinguishment of debt | — | | 62 | | — | | — | | 119 | | | | | | | | | |
| Acquisition and pursuit costs | (301) | | (769) | | (669) | | (287) | | (92) | | | | | | | | | |
| Merger-related costs | (1,414) | | (7,450) | | 15,670 | | (4,855) | | (10,777) | | | | | | | | | |
Leasing commission amortization 3 | 3,818 | | 3,663 | | 3,335 | | 3,002 | | 2,706 | | | | | | | | | |
| Non-real estate depreciation and amortization | (1,596) | | (1,509) | | (1,525) | | (1,372) | | (1,323) | | | | | | | | | |
| Non controlling interest | (491) | (841) | (1,027) | (1,067) | (382) | | | | | | | | | |
| Unconsolidated JV adjustments | (393) | (389) | (377) | (351) | (327) | | | | | | | | | |
| FFO | $136,520 | | $128,941 | | $153,688 | | $127,978 | | $135,901 | | | | | | | | | |
| Acquisition and pursuit costs | 301 | 769 | 669 | 287 | 92 | | | | | | | | |
| Merger-related costs | 1,414 | 7,450 | (15,670) | 4,855 | 10,777 | | | | | | | | |
| Lease intangible amortization | 261 | 213 | 240 | 146 | 137 | | | | | | | | |
| Significant non-recurring legal fees/forfeited earnest money received | (100) | — | 275 | — | 194 | | | | | | | | |
| Debt financing costs | — | (62) | — | — | 625 | | | | | | | | |
| Severance costs | 1,445 | — | — | — | — | | | | | | | | |
| Merger-related fair value adjustment | 10,800 | 10,667 | 10,554 | 10,864 | 11,979 | | | | | | | | |
| Allowance for credit losses | — | — | — | 8,599 | — | | | | | | | | |
| Unconsolidated JV normalizing items | 89 | 90 | 93 | 117 | 96 | | | | | | | | |
| Normalized FFO | $150,730 | | $148,068 | | $149,849 | | $152,846 | | $159,801 | | | | | | | | | |
1Includes above and below market lease intangibles, interest income related to sales-type leases, lease inducements, lease termination fees, deferred financing cost amortization, and principle related to investment in financing receivable and TI amortization.
2Includes above and below market ground lease intangible amortization, leasing commission amortization, and ground lease straight-line rent.
3Leasing commission amortization is included in the real estate depreciation and amortization add-back for FFO.
| | | | | |
| |
HEALTHCARE REALTY | 4Q 2023 SUPPLEMENTAL INFORMATION 25 |
| | |
| EBITDA Reconciliations |
| DOLLARS IN THOUSANDS |
|
| | | | | | | | | | | | | | | | | | | | |
| RECONCILIATION OF EBITDA | | | | | | | | |
| | | | | | | |
| 4Q 2023 | 3Q 2023 | 2Q 2023 | 1Q 2023 | 4Q 2022 | | | |
| Net (loss) income | ($40,533) | | ($67,844) | | ($82,759) | | ($87,125) | | ($35,764) | | | | |
| Interest expense | 63,187 | 66,304 | 65,334 | 63,759 | 64,443 | | | |
| Depreciation and amortization | 180,049 | 182,989 | 183,193 | 184,479 | 185,275 | | | |
| Unconsolidated JV depreciation,amortization,and interest | 4,836 | 4,810 | 4,789 | 5,192 | 4,339 | | | |
| EBITDA | $207,539 | $186,259 | $170,557 | $166,305 | $218,293 | | | |
| Leasing commission amortization | 3,818 | 3,663 | 3,335 | 3,002 | 2,706 | | | |
| Gain on sales of real estate properties | (20,573) | | (48,811) | | (7,156) | | (1,007) | | (73,083) | | | | |
| Impairments on real estate properties | 11,403 | 56,873 | 55,215 | 26,227 | 54,452 | | | |
EBITDAre 1 | $202,187 | $197,984 | $221,951 | $194,527 | $202,368 | | | |
| EBITDA | $207,539 | $186,259 | $170,557 | $166,305 | $218,293 | | | |
| Acquisition and pursuit costs | 301 | 769 | 669 | 287 | 92 | | | |
| Merger-related costs | 1,414 | | 7,450 | | (15,670) | | 4,855 | 10,777 | | | |
| Gain on sales of real estate properties | (20,573) | | (48,811) | | (7,156) | | (1,007) | | (73,083) | | | | |
| Impairments on real estate assets | 11,403 | 56,873 | 55,215 | 26,227 | 54,452 | | | |
| Gain on extinguishment of debt | — | | (62) | | — | — | (119) | | | | |
| Unconsolidated JV adjustments | — | — | — | — | 8 | | | |
| Debt Covenant EBITDA | $200,084 | $202,478 | $203,615 | $196,667 | $210,420 | | | |
| Leasing commission amortization | 3,818 | 3,663 | 3,335 | 3,002 | 2,706 | | | |
| Lease intangible amortization | 261 | 213 | 240 | 147 | 137 | | | |
Acquisition/disposition timing impact 2 | (4,155) | | (2,559) | | (184) | | (945) | | (1,704) | | | | |
| Stock based compensation | 3,566 | 2,556 | 3,924 | 3,745 | 3,573 | | | |
| | | | | | | | |
Allowance for credit losses 3 | — | — | — | 8,599 | — | | | |
| Rent reserves, net | 1,404 | | 442 | | (54) | | 1,371 | (100) | | | |
| Unconsolidated JV adjustments | 89 | 90 | 93 | 117 | 96 | | | |
| Adjusted EBITDA | $205,067 | $206,883 | $210,969 | $212,703 | $215,128 | | | |
| | | | | | | | |
| | | | | | | | |
| | | | | | | | |
| | | | | | | | |
1Earnings before interest, taxes, depreciation and amortization for real estate ("EBITDAre") is an operating performance measure adopted by NAREIT. NAREIT defines EBITDAre equal to “net income (computed in accordance with GAAP) plus interest expense, income tax expense, depreciation and amortization, impairments and minus gains on the disposition of depreciated property.”
2Adjusted to reflect quarterly EBITDA from properties acquired or disposed in the quarter.
3In Q1 2023, allowance for credit losses included a $5.2 million credit allowance for a mezzanine loan included in "Impairment of real estate and credit loss reserves" on the Statement of Income and $3.4 million reserve included in “Rental Income” on the Statement of Income for previously deferred rent and straight line rent for three skilled nursing facilities.
| | | | | |
| |
HEALTHCARE REALTY | 4Q 2023 SUPPLEMENTAL INFORMATION 26 |
| | |
| Components of Net Asset Value |
| DOLLARS IN THOUSANDS, EXCEPT PER SHARE DATA |
|
| | | | | | | | | | | | | | | | | | | | | | | | |
| CASH NOI BY PROPERTY TYPE |
| 4Q 2023 | |
| ASSET TYPE | MERGER COMBINED SAME STORE 1 | ACQ./DEV. COMPLETIONS 2 | | REDEVELOPMENT | TIMING/OTHER ADJUSTMENTS 3 | ADJUSTED CASH NOI | | ANNUALIZED ADJUSTED NOI |
| MOB/Outpatient | $172,831 | | $8,169 | | | $2,664 | | $753 | | $184,417 | | | $737,668 | |
| Inpatient/Surgical | 8,130 | | 856 | | | — | | — | | 8,986 | | | 35,944 | |
| Office | 6,441 | | — | | | | — | | 6,441 | | | 25,764 | |
| Total Cash NOI | $187,402 | | $9,025 | | | $2,664 | | $753 | | $199,844 | | | $799,376 | |
| | | | | | | | | | | | | | | | | | | | |
| DEVELOPMENT PROPERTIES | | | TOTAL SHARES OUTSTANDING |
| Land held for development | $59,871 | | | As of December 31, 2023 8 | 384,816,882 |
| Re/development budget | 295,578 | | | | | | |
| $355,449 | | | IMPLIED CAP RATE |
| | | | | STOCK PRICE | IMPLIED CAP RATE |
| | | As of December 31, 2023 | $17.23 | 7.2 | % |
| OTHER ASSETS | | | | |
Disposition pipeline 4 | $76,319 | | | 4Q 2023 High | $17.44 | 7.1 | % |
Unstabilized properties 5 | 286,617 | | | 4Q 2023 Low | $13.96 | 8.1 | % |
Cash and other assets 6 | 429,873 | | | | | | |
| $792,809 | | | | | | |
| | | | | | |
| DEBT | | | | | | |
| Unsecured credit facility | $— | | | | | | |
| | | | | | |
| Unsecured term loans | 1,500,000 | | | | | | |
| Senior notes | 3,699,285 | | | | | | |
| Mortgage notes payable | 70,752 | | | | | | |
| Company share of joint venture net debt | 24,284 | | | | | | |
| Remaining re/development funding | 145,703 | | | | | | |
Other liabilities 7 | 245,574 | | | | | | |
| $5,685,598 | | | | | | |
| | | | | | |
1See Merger Combined Same Store schedule on pages 22 - 23 for details on Merger Combined Same Store NOI. 2Adjusted to reflect quarterly NOI from properties acquired or stabilized re/developments completed during the full eight quarter period that are not included in merger combined same store NOI.
3Timing adjustments include and management fee income of $1.3 million, offset by $0.6 million of positive NOI for unstabilized properties, which are shown in other assets.
4Includes assets held for sale and planned dispositions.
5Includes 34 properties at their gross book value. These properties were comprised of 1.2 million square feet that generated positive NOI of $0.6 million.
6Includes cash of $25.7 million, notes receivable of $173.6 million, prepaid assets of $124.1 million, accounts receivable of $63.3 million, prepaid ground leases of $19.8 million, and other investments of $6.0 million. In addition, includes the Company's occupied portion of its corporate headquarters in Nashville of $17.4 million.
7Includes only liabilities that are expected to reduce future cash or NOI and that are currently producing non-cash benefits to NOI. Included are accounts payable and accrued liabilities of $212.0 million, security deposits of $30.2 million, and deferred operating expense reimbursements of $3.4 million.
8Total shares outstanding includes OP units.
| | | | | |
| |
HEALTHCARE REALTY | 4Q 2023 SUPPLEMENTAL INFORMATION 27 |
| | |
| Components of Expected FFO |
| DOLLARS IN THOUSANDS, EXCEPT PER SHARE DATA |
|
| | | | | | | | | | | | | | | | | | | | |
|
| | | ACTUAL | | EXPECTED 2024 | |
| | | | | 2023 | | LOW | HIGH | | |
| | | | | | | | | | |
| | | | | | | | | | |
| | | | | | | | | | |
| | | | | | | | | | |
| | | | | | | | | | |
| | | | | | | | | | |
| | | | | | | | | | |
| OPERATING METRICS | | | | | | | | | | |
| Multi-tenant absorption (bps) | | | | | 20 | | 100 | 150 | | |
| Multi-tenant portfolio cash NOI growth | | | | | 2.3 | % | | 3.50 | % | 4.75 | % | | |
| Single-tenant portfolio cash NOI growth | | | | | 0.7 | % | | 0.50 | % | 1.50 | % | | |
| | | | | | | | | | |
| Merger combined same store cash NOI growth, including Company's share of JVs | | | | | 2.8 | % | | 2.50 | % | 3.50 | % | | |
| | | | | | | | | | |
| Merger combined same store lease retention rate | | | | | 79.3 | % | | 75.0 | % | 85.0 | % | | |
| | | | | | | | | | |
| | | | | | | | | | |
| Normalized G&A | | | | | $56,684 | | $61,000 | $64,000 | | |
| Straight-line rent, net | | | | | 32,592 | | 30,000 | 34,000 | | |
| | | | | | | | | | |
| CAPITAL FUNDING | | | | | | | | | | |
| Acquisitions | | | | | $42,950 | | $0.00 | $0.00 | | |
| Dispositions | | | | | 768,690 | | 150,000 | 250,000 | | |
| | | | | | | | | | |
| | | | | | | | | | |
| Re/development | | | | | 112,213 | | 100,000 | 130,000 | | |
| 1st generation TI and acq. capex | | | | | 38,773 | | 30,000 | 40,000 | | |
| Maintenance capex | | | | | | | | | | |
| 2nd generation TI | | | | | 66,081 | | 60,000 | 70,000 | | |
| Leasing commissions paid | | | | | 36,391 | | 35,000 | 40,000 | | |
| Capital expenditures | | | | | 49,342 | | 45,000 | 50,000 | | |
| Total maintenance capex | | | | | 151,814 | | 140,000 | 160,000 | | |
| | | | | | | | | | |
| CASH YIELD | | | | | | | | | | |
| Acquisitions | | | | | 6.5 | % | | — | % | — | % | | |
| Dispositions | | | | | 6.5 | % | | 6.0 | % | 7.0 | % | | |
| Development (stabilized) | | | | | | | 6.5 | % | 8.0 | % | | |
| Redevelopment (stabilized) | | | | | | | 9.0 | % | 12.0 | % | | |
| | | | | | | | | | |
| | | | | | | | | | |
| EARNINGS AND LEVERAGE | | | | | | | | | | |
| Earnings per share | | | | | $(0.74) | | $(0.60) | $(0.10) | | |
| Normalized FFO per share | | | | | $1.57 | | $1.52 | $1.58 | | |
| Net debt to adjusted EBITDA | | | | | 6.4x | | 6.0x | 6.5x | | |
| | | | | |
| |
HEALTHCARE REALTY | 4Q 2023 SUPPLEMENTAL INFORMATION 28 |