
Strategic Merger: Joining Two High Performing Banks Feb 1, 2016

2 Forward – Looking Statements This presentation contains forward‐looking statements regarding the outlook and expectations of Chemical Financial Corporation (“Chemical” or “CHFC”) and Talmer Bancorp, Inc. (“Talmer” or “TLMR”) with respect to their planned strategic partnership, including the expected costs to be incurred and cost savings to be realized in connection with the transaction, the expected impact of the transaction on Chemical's future financial performance (including anticipated accretion to earnings per share, tangible book value earn‐back period and internal rate of return), the assumed purchase accounting adjustments, credit marks, and intangibles and other key transaction assumptions, anticipated regulatory cost, timing of closing of the transaction, and consequences of Talmer’s integration into Chemical. Words such as "anticipated," "estimated," "expected," "projected," "assumed," "approximately," "continued," "should," "will" and variations of such words and similar expressions are intended to identify such forward‐looking statements. The Pro forma financial information is not a guaranty of future results and is presented for informational purposes only. Forward‐looking statements are not guarantees of future financial performance and are subject to risks, uncertainties and assumptions ("risk factors") that are difficult to predict with regard to timing, extent, likelihood and degree of occurrence. Therefore, actual results and outcomes may materially differ from what may be expressed or forecasted in such forward‐looking statements. Neither Chemical nor Talmer undertakes any obligation to update, amend or clarify forward‐looking statements, whether as a result of new information, future events or otherwise. Risk factors relating both to the transaction and the integration of Talmer into Chemical after closing include, without limitation: • Completion of the transaction is dependent on, among other things, receipt of regulatory approvals and Talmer and Chemical shareholder approvals, the timing of which cannot be predicted with precision at this point and which may not be received at all. • The impact of the completion of the transaction on Chemical's and Talmer’s financial statements will be affected by the timing of the transaction. • The transaction may be more expensive to complete and the anticipated benefits, including anticipated cost savings and strategic gains, may be significantly harder or take longer to achieve than expected or may not be achieved in their entirety as a result of unexpected factors or events. • The integration of Talmer's business and operations into Chemical, which will include conversion of Talmer’s operating systems and procedures, may take longer than anticipated or be more costly than anticipated or have unanticipated adverse results relating to Talmer’s or Chemical's existing businesses. • Chemical’s ability to achieve anticipated results from the transaction is dependent on the state of the economic and financial markets going forward. Specifically, Chemical may incur more credit losses than expected and customer attrition may be greater than expected. In addition, risk factors include, but are not limited to, the risk factors described in Item 1A of each of Chemical's and Talmer’s Annual Report on Form 10‐K for the year ended December 31, 2014. These and other factors are representative of the risk factors that may emerge and could cause a difference between an ultimate actual outcome and a forward‐looking statement.

3 Additional Information Non‐GAAP Financial Measures This presentation may contain certain non‐GAAP financial disclosures that are not in accordance with U.S. generally accepted accounting principles (GAAP). Chemical and Talmer use certain non‐GAAP financial measures to provide meaningful, supplemental information regarding their operational results and to enhance investors’ overall understanding of Chemical’s and Talmer’s financial performance. The limitations associated with non‐GAAP financial measures include the risk that persons might disagree as to the appropriateness of items comprising these measures and that different companies might calculate these measures differently. These disclosures should not be considered an alternative to Chemical’s and Talmer’s GAAP results. Additional Information about the Transaction This communication is being made in respect of the merger involving Talmer and Chemical. This communication does not constitute an offer to sell or the solicitation of an offer to buy any securities or a solicitation of any vote or approval. Chemical will file a registration statement on Form S‐4 with the Securities and Exchange Commission (SEC) to register the securities that the Talmer shareholders will receive if the transaction is consummated. The registration statement will contain a prospectus for Chemical and a joint proxy statement to be used by Chemical and Talmer to solicit the required approvals of their respective shareholders of the merger and other relevant documents concerning the transaction. Chemical and Talmer may also file other documents with the SEC concerning the proposed merger. BEFORE MAKING AN INVESTMENT OR VOTING DECISION, INVESTORS AND SHAREHOLDERS OF CHEMICAL AND TALMER ARE URGED TO READ THE REGISTRATION STATEMENT, THE PROSPECTUS AND JOINT PROXY STATEMENT, AND ANY OTHER RELEVANT DOCUMENTS WHEN THEY BECOME AVAILABLE BECAUSE THEY WILL CONTAIN IMPORTANT INFORMATION ABOUT CHEMICAL, TALMER, AND THE TRANSACTION. Investors will be able to obtain these documents free of charge at the SEC’s website at www.sec.gov. Copies of the documents filed with the SEC in connection with the merger can also be obtained, when available, without charge, from Chemical’s website at http://www.chemicalbankmi.com (which website is not incorporated herein by reference), or by contacting Chemical Financial Corporation, 235 East Main Street, P.O. Box 569, Midland, MI 48640‐0569, Attention: Ms. Lori A. Gwizdala, Investor Relations, telephone 800‐867‐9757, or at Talmer’s website at http://www.talmerbank.com (which website is not incorporated herein by reference), or by contacting Talmer Bancorp, Inc., 2301 West Big Beaver Road, Suite 525, Troy, Michigan 48084, Attention: Mr. Brad Adams, Investor Relations, telephone 248‐498‐2862. Participants in the Merger Solicitation Chemical and Talmer, and their respective directors, executive officers, and certain other members of management and employees, may be soliciting proxies from Chemical and Talmer shareholders in favor of the transaction. Information regarding the persons who may, under the rules of the SEC, be considered participants in the solicitation of Chemical and Talmer shareholders in connection with the proposed transaction will be set forth in the prospectus and joint proxy statement when it is filed with the SEC. Free copies of this document may be obtained as described above. Information about Chemical’s directors and executive officers can be found in Chemical’s definitive proxy statement in connection with its 2015 annual meeting of shareholders, as filed with the SEC on March 6, 2015, and other documents subsequently filed by Chemical with the SEC. Information about Talmer’s directors and executive officers can be found in Talmer’s definitive proxy statement in connection with its 2015 annual meeting of shareholders, as filed with the SEC on April 27, 2015, and other documents subsequently filed by Talmer with the SEC. Additional information regarding the interests of such participants will be included in the prospectus and joint proxy statement and other relevant documents regarding the merger filed with the SEC when they become available.
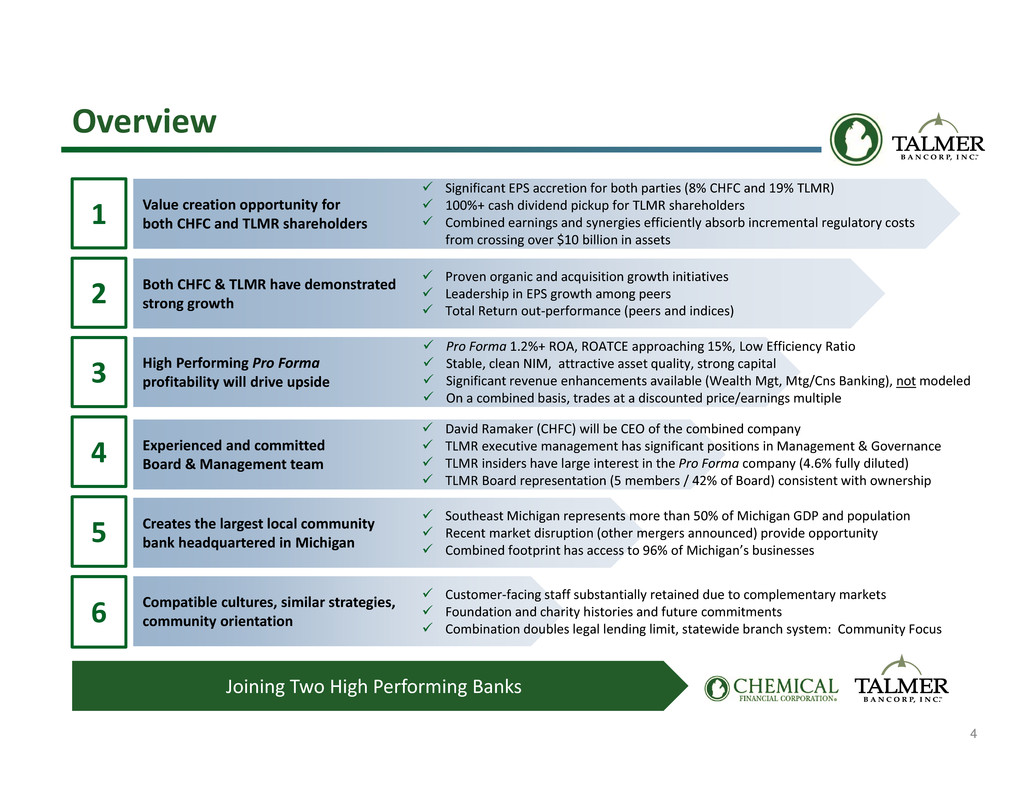
4 Overview Joining Two High Performing Banks Value creation opportunity for both CHFC and TLMR shareholders 5 6 4 1 Both CHFC & TLMR have demonstrated strong growth2 High Performing Pro Forma profitability will drive upside3 Experienced and committed Board & Management team Creates the largest local community bank headquartered in Michigan Compatible cultures, similar strategies, community orientation Significant EPS accretion for both parties (8% CHFC and 19% TLMR) 100%+ cash dividend pickup for TLMR shareholders Combined earnings and synergies efficiently absorb incremental regulatory costs from crossing over $10 billion in assets Customer‐facing staff substantially retained due to complementary markets Foundation and charity histories and future commitments Combination doubles legal lending limit, statewide branch system: Community Focus Proven organic and acquisition growth initiatives Leadership in EPS growth among peers Total Return out‐performance (peers and indices) Pro Forma 1.2%+ ROA, ROATCE approaching 15%, Low Efficiency Ratio Stable, clean NIM, attractive asset quality, strong capital Significant revenue enhancements available (Wealth Mgt, Mtg/Cns Banking), not modeled On a combined basis, trades at a discounted price/earnings multiple David Ramaker (CHFC) will be CEO of the combined company TLMR executive management has significant positions in Management & Governance TLMR insiders have large interest in the Pro Forma company (4.6% fully diluted) TLMR Board representation (5 members / 42% of Board) consistent with ownership Southeast Michigan represents more than 50% of Michigan GDP and population Recent market disruption (other mergers announced) provide opportunity Combined footprint has access to 96% of Michigan’s businesses

5 High Performing, Complementary Banks Source: SNL Financial and Company documents (1) Core efficiency ratio for CHFC excludes merger related expenses; core efficiency ratio for TLMR defined as noninterest expense divided by total revenue, adjusted for (expense)/benefit due to change in the fair value of loan servicing rights, FDIC loss sharing income, transaction and integration related costs and net loss on early termination of FDIC loss share and warrant agreements and bargain purchase gains (2) Includes impact of Durbin Amendment and other expenses associated with crossing $10 billion asset size threshold (3) For CHFC it is computed as reported earnings per share excluding acquisition transaction costs; for TLMR it is computed by starting with pre‐tax income, adjusting for items noted in footnote 1 and then assuming normalized tax rate on pre‐tax core earnings; calculations were provided by each management team (4) As of January 25th, 2016; date is 1 day prior to announcement of merger Creating a Preeminent Midwest Bank • Largest bank headquartered in Michigan • $16 billion in total assets • Largest MI headquartered branch distribution system • Leading market share in nearly all markets of operation • High Performing Pro Forma ROA, ROE, NIM and Efficiency (1)(2) Detroitt ittr itt it Pittsburghittittitt Clevelandl ll ll l Milwaukeeililil Chicagoiii IndianapolisI i liI i liI i li Columbuslll Chemical Talmer ● $6.6 billion bank holding company ‐ Headquartered in Troy, MI (Greater Detroit MSA) ● A high performing Midwest Bank ‐ Built through organic growth & successful acquisitions ● Recapitalized and retooled banking platforms after the distress of the previous credit crisis ‐ Completed 8 acquisitions since 2010 ‐ (~$6.1 billion in assets acquired) ● Strong mortgage banking platform producing $1.4 billion in originations in 2015 ● Strong operating performance ‐ Attractive NIM (ex. Excess Accretable Yield) ‐ Core efficiency ratio of 59.5%(1) in 4Q’15 ‐ Low cost deposit funding ● 3yr Core EPS growth: 58% (3) ● 12.2% YoY net loan growth ($524 million) ● Total return since IPO( 4): 23.6% ● $9.2 billion financial holding company ‐ Headquartered in Midland, MI ● Preeminent MI franchise outside of Detroit MSA ‐ Capitalizing on and contributing to Michigan’s vibrant economy ‐ Recent strategic acquisitions have enhanced organization’s market presence, lending capacity and earnings power ● Proven ability to increase market share in core markets through: ‐ Strong organic loan growth ($1.5 billion) over prior 3 years ‐ Approximately $3.1 billion in assets acquired through open bank M&A since 2010 ● Significant trust and wealth management operations (AUM of $4.6 billion) ● Strong operating performance history through cycles, including ‐ Attractive NIM ‐ Core efficiency ratio of 57.1%(1) in 4Q’15 ‐ Low cost deposit funding ‐ Strong asset quality through cycles ● 3yr Core EPS growth: 10% (3) ● 8% YoY organic loan growth ($476 million) ● 3yr Total Return(4) : 35.5% (vs. KRX: 26.7%)
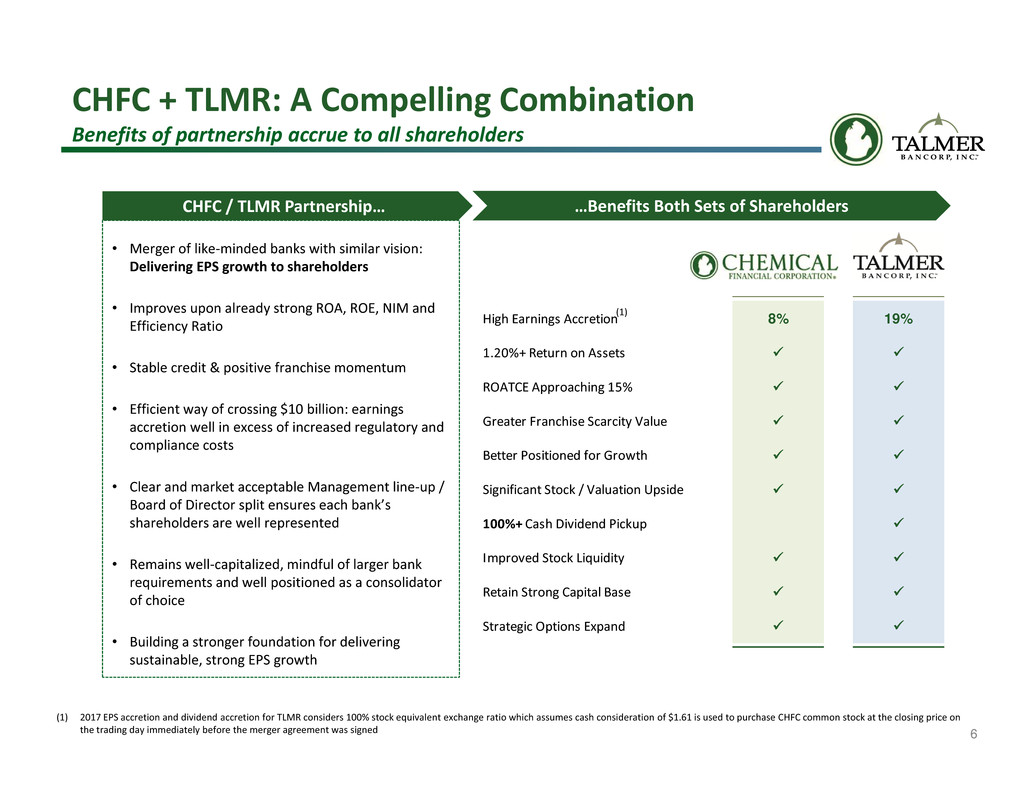
6 • Merger of like‐minded banks with similar vision: Delivering EPS growth to shareholders • Improves upon already strong ROA, ROE, NIM and Efficiency Ratio • Stable credit & positive franchise momentum • Efficient way of crossing $10 billion: earnings accretion well in excess of increased regulatory and compliance costs • Clear and market acceptable Management line‐up / Board of Director split ensures each bank’s shareholders are well represented • Remains well‐capitalized, mindful of larger bank requirements and well positioned as a consolidator of choice • Building a stronger foundation for delivering sustainable, strong EPS growth …Benefits Both Sets of ShareholdersCHFC / TLMR Partnership… CHFC + TLMR: A Compelling Combination Benefits of partnership accrue to all shareholders High Earnings Accretion 8% 19% 1.20%+ Return on Assets ROATCE Approaching 15% Greater Franchise Scarcity Value Better Positioned for Growth Significant Stock / Valuation Upside 100%+ Cash Dividend Pickup Improved Stock Liquidity Retain Strong Capital Base Strategic Options Expand (1) (1) 2017 EPS accretion and dividend accretion for TLMR considers 100% stock equivalent exchange ratio which assumes cash consideration of $1.61 is used to purchase CHFC common stock at the closing price on the trading day immediately before the merger agreement was signed
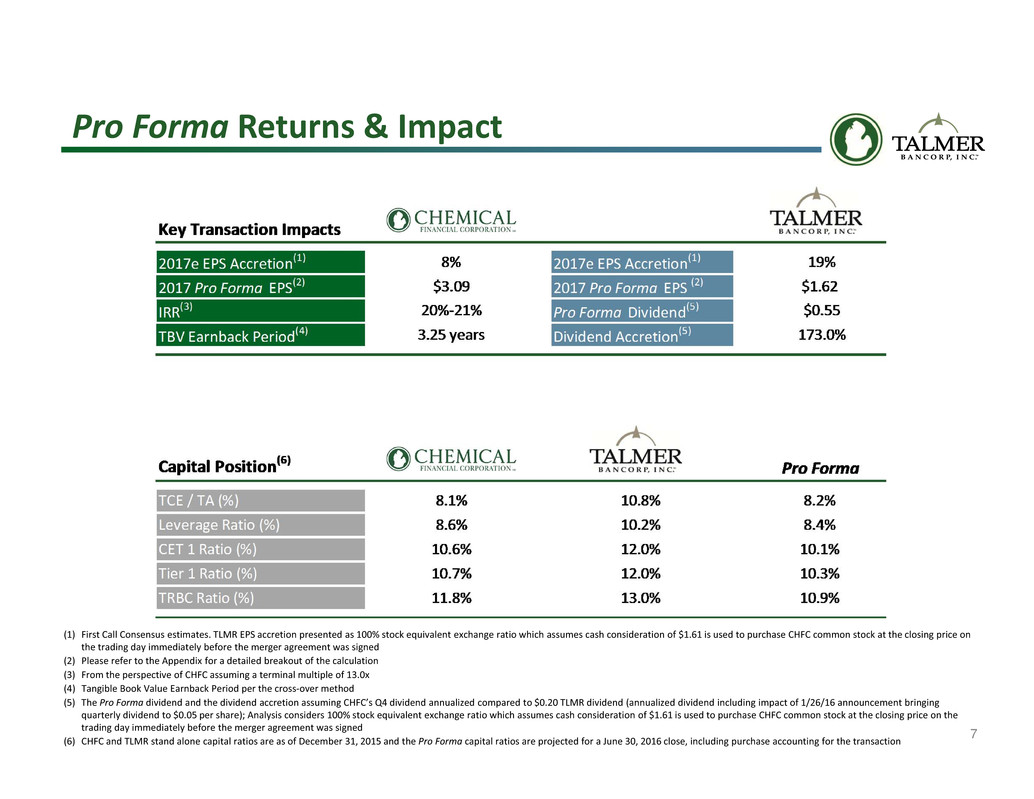
7 (1) First Call Consensus estimates. TLMR EPS accretion presented as 100% stock equivalent exchange ratio which assumes cash consideration of $1.61 is used to purchase CHFC common stock at the closing price on the trading day immediately before the merger agreement was signed (2) Please refer to the Appendix for a detailed breakout of the calculation (3) From the perspective of CHFC assuming a terminal multiple of 13.0x (4) Tangible Book Value Earnback Period per the cross‐over method (5) The Pro Forma dividend and the dividend accretion assuming CHFC’s Q4 dividend annualized compared to $0.20 TLMR dividend (annualized dividend including impact of 1/26/16 announcement bringing quarterly dividend to $0.05 per share); Analysis considers 100% stock equivalent exchange ratio which assumes cash consideration of $1.61 is used to purchase CHFC common stock at the closing price on the trading day immediately before the merger agreement was signed (6) CHFC and TLMR stand alone capital ratios are as of December 31, 2015 and the Pro Forma capital ratios are projected for a June 30, 2016 close, including purchase accounting for the transaction Pro Forma Returns & Impact
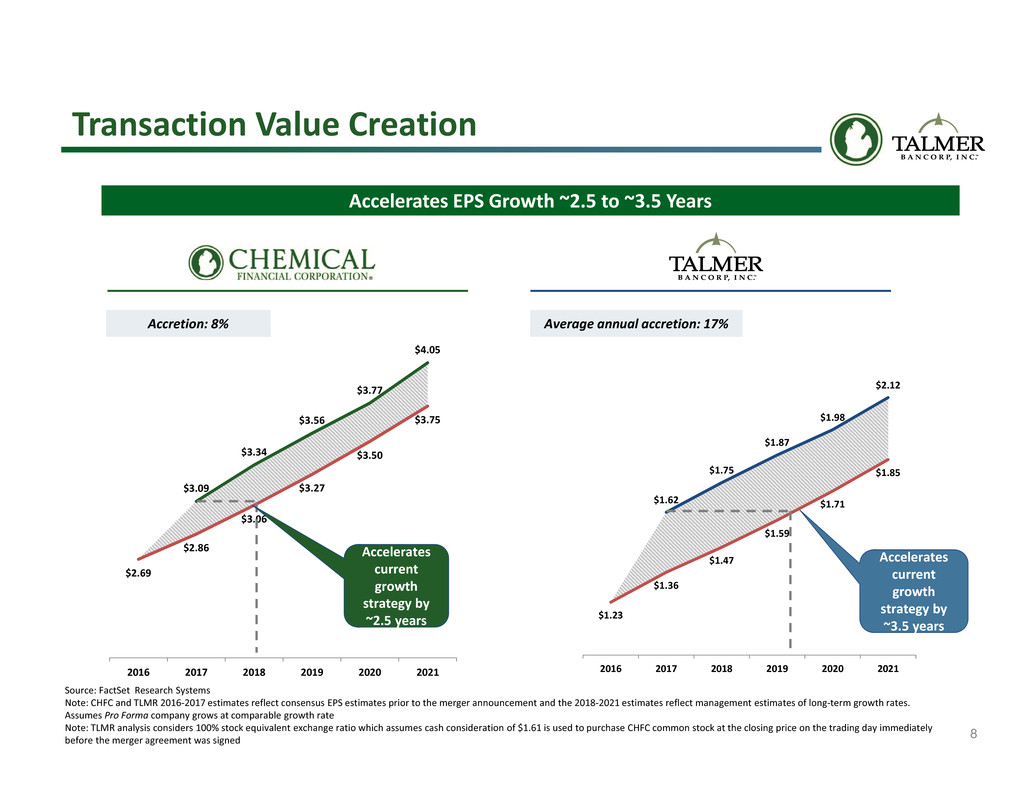
8 $1.23 $1.36 $1.47 $1.59 $1.71 $1.85 $1.62 $1.75 $1.87 $1.98 $2.12 2016 2017 2018 2019 2020 2021 $2.69 $2.86 $3.06 $3.27 $3.50 $3.75 $3.09 $3.34 $3.56 $3.77 $4.05 2016 2017 2018 2019 2020 2021 Accelerates EPS Growth ~2.5 to ~3.5 Years Accelerates current growth strategy by ~3.5 years Accelerates current growth strategy by ~2.5 years Accretion: 8% Average annual accretion: 17% Transaction Value Creation Source: FactSet Research Systems Note: CHFC and TLMR 2016‐2017 estimates reflect consensus EPS estimates prior to the merger announcement and the 2018‐2021 estimates reflect management estimates of long‐term growth rates. Assumes Pro Forma company grows at comparable growth rate Note: TLMR analysis considers 100% stock equivalent exchange ratio which assumes cash consideration of $1.61 is used to purchase CHFC common stock at the closing price on the trading day immediately before the merger agreement was signed
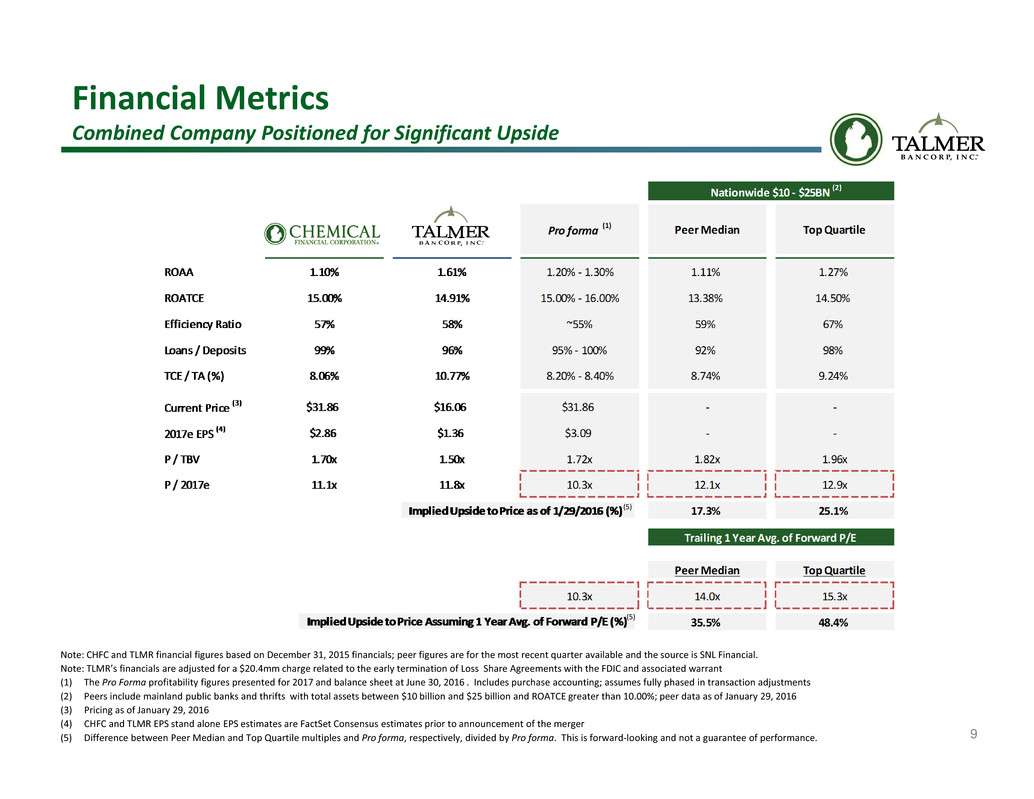
9 Financial Metrics Combined Company Positioned for Significant Upside Note: CHFC and TLMR financial figures based on December 31, 2015 financials; peer figures are for the most recent quarter available and the source is SNL Financial. Note: TLMR’s financials are adjusted for a $20.4mm charge related to the early termination of Loss Share Agreements with the FDIC and associated warrant (1) The Pro Forma profitability figures presented for 2017 and balance sheet at June 30, 2016 . Includes purchase accounting; assumes fully phased in transaction adjustments (2) Peers include mainland public banks and thrifts with total assets between $10 billion and $25 billion and ROATCE greater than 10.00%; peer data as of January 29, 2016 (3) Pricing as of January 29, 2016 (4) CHFC and TLMR EPS stand alone EPS estimates are FactSet Consensus estimates prior to announcement of the merger (5) Difference between Peer Median and Top Quartile multiples and Pro forma, respectively, divided by Pro forma. This is forward‐looking and not a guarantee of performance. (5) (5)
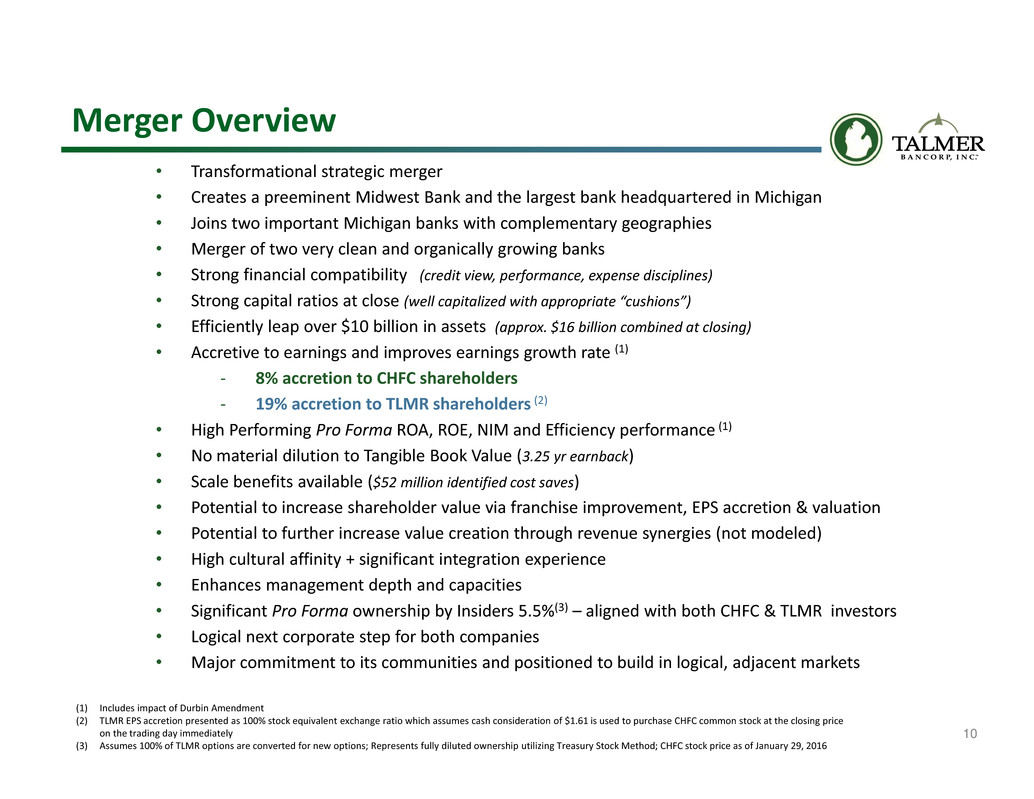
10 Merger Overview • Transformational strategic merger • Creates a preeminent Midwest Bank and the largest bank headquartered in Michigan • Joins two important Michigan banks with complementary geographies • Merger of two very clean and organically growing banks • Strong financial compatibility (credit view, performance, expense disciplines) • Strong capital ratios at close (well capitalized with appropriate “cushions”) • Efficiently leap over $10 billion in assets (approx. $16 billion combined at closing) • Accretive to earnings and improves earnings growth rate (1) ‐ 8% accretion to CHFC shareholders ‐ 19% accretion to TLMR shareholders (2) • High Performing Pro Forma ROA, ROE, NIM and Efficiency performance (1) • No material dilution to Tangible Book Value (3.25 yr earnback) • Scale benefits available ($52 million identified cost saves) • Potential to increase shareholder value via franchise improvement, EPS accretion & valuation • Potential to further increase value creation through revenue synergies (not modeled) • High cultural affinity + significant integration experience • Enhances management depth and capacities • Significant Pro Forma ownership by Insiders 5.5%(3) – aligned with both CHFC & TLMR investors • Logical next corporate step for both companies • Major commitment to its communities and positioned to build in logical, adjacent markets (1) Includes impact of Durbin Amendment (2) TLMR EPS accretion presented as 100% stock equivalent exchange ratio which assumes cash consideration of $1.61 is used to purchase CHFC common stock at the closing price on the trading day immediately (3) Assumes 100% of TLMR options are converted for new options; Represents fully diluted ownership utilizing Treasury Stock Method; CHFC stock price as of January 29, 2016
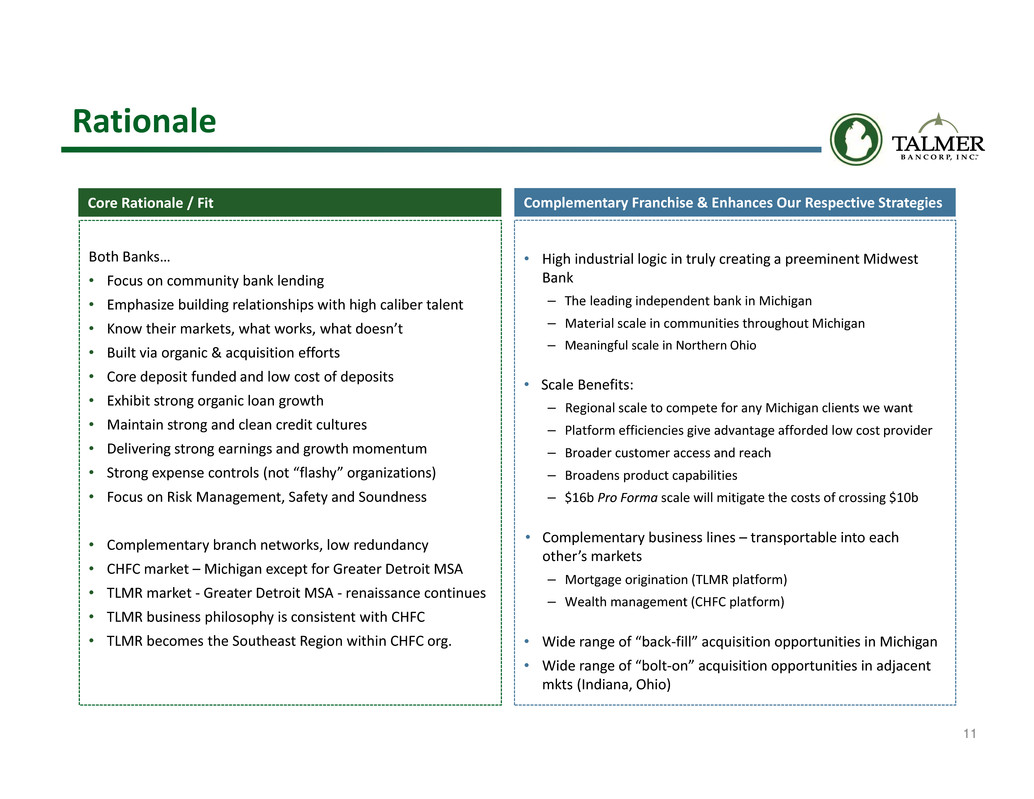
11 Rationale Both Banks… • Focus on community bank lending • Emphasize building relationships with high caliber talent • Know their markets, what works, what doesn’t • Built via organic & acquisition efforts • Core deposit funded and low cost of deposits • Exhibit strong organic loan growth • Maintain strong and clean credit cultures • Delivering strong earnings and growth momentum • Strong expense controls (not “flashy” organizations) • Focus on Risk Management, Safety and Soundness • Complementary branch networks, low redundancy • CHFC market – Michigan except for Greater Detroit MSA • TLMR market ‐ Greater Detroit MSA ‐ renaissance continues • TLMR business philosophy is consistent with CHFC • TLMR becomes the Southeast Region within CHFC org. Core Rationale / Fit Complementary Franchise & Enhances Our Respective Strategies • High industrial logic in truly creating a preeminent Midwest Bank – The leading independent bank in Michigan – Material scale in communities throughout Michigan – Meaningful scale in Northern Ohio • Scale Benefits: – Regional scale to compete for any Michigan clients we want – Platform efficiencies give advantage afforded low cost provider – Broader customer access and reach – Broadens product capabilities – $16b Pro Forma scale will mitigate the costs of crossing $10b • Complementary business lines – transportable into each other’s markets – Mortgage origination (TLMR platform) – Wealth management (CHFC platform) • Wide range of “back‐fill” acquisition opportunities in Michigan • Wide range of “bolt‐on” acquisition opportunities in adjacent mkts (Indiana, Ohio)
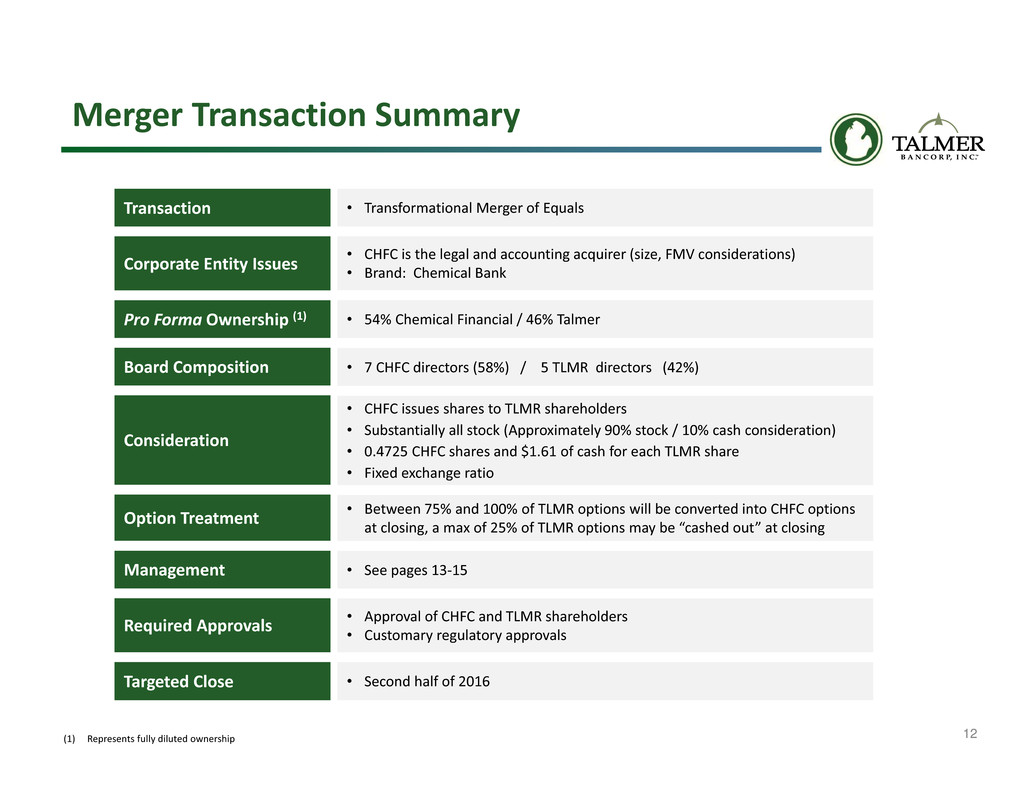
12 Merger Transaction Summary Corporate Entity Issues Consideration Management Board Composition Required Approvals Targeted Close • Second half of 2016 • Approval of CHFC and TLMR shareholders • Customary regulatory approvals • 7 CHFC directors (58%) / 5 TLMR directors (42%) • See pages 13‐15 Option Treatment • Between 75% and 100% of TLMR options will be converted into CHFC options at closing, a max of 25% of TLMR options may be “cashed out” at closing • CHFC issues shares to TLMR shareholders • Substantially all stock (Approximately 90% stock / 10% cash consideration) • 0.4725 CHFC shares and $1.61 of cash for each TLMR share • Fixed exchange ratio • CHFC is the legal and accounting acquirer (size, FMV considerations) • Brand: Chemical Bank (1) Represents fully diluted ownership Transaction • Transformational Merger of Equals Pro Forma Ownership (1) • 54% Chemical Financial / 46% Talmer
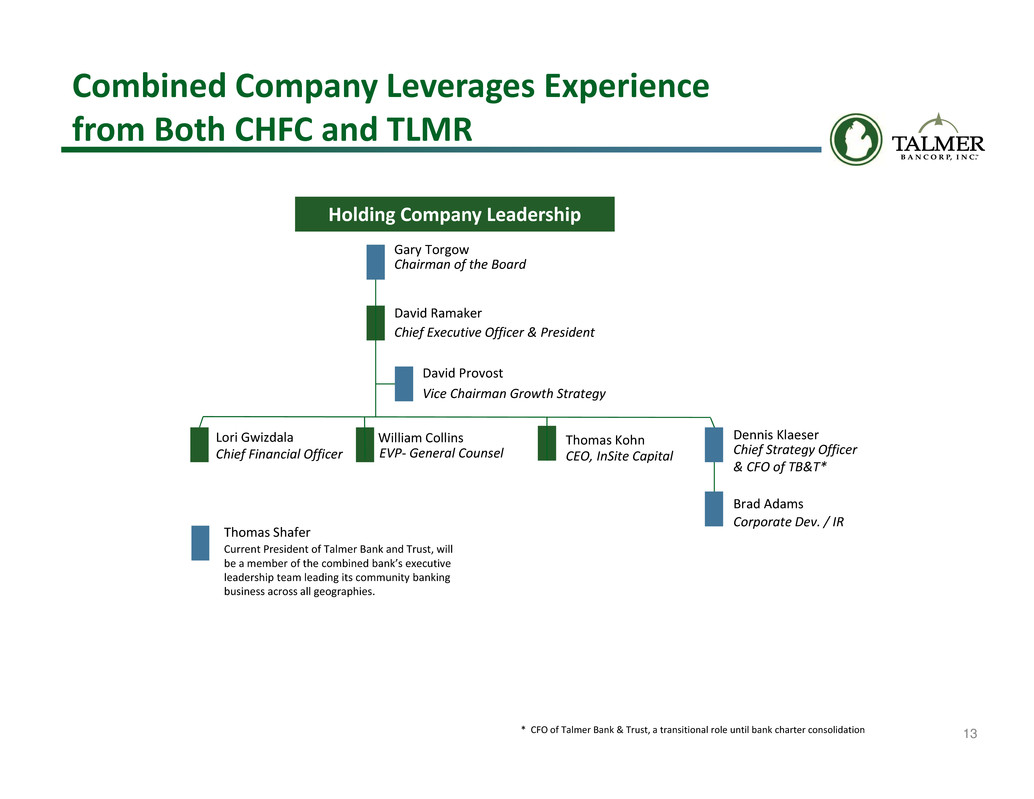
13 Chief Financial Officer Combined Company Leverages Experience from Both CHFC and TLMR Holding Company Leadership Gary Torgow Chairman of the Board Lori Gwizdala David Provost Vice Chairman Growth Strategy David Ramaker Chief Executive Officer & President * CFO of Talmer Bank & Trust, a transitional role until bank charter consolidation Dennis Klaeser Chief Strategy Officer & CFO of TB&T* EVP‐ General Counsel William Collins Brad Adams Corporate Dev. / IR CEO, InSite Capital Thomas Kohn Thomas Shafer Current President of Talmer Bank and Trust, will be a member of the combined bank’s executive leadership team leading its community banking business across all geographies.
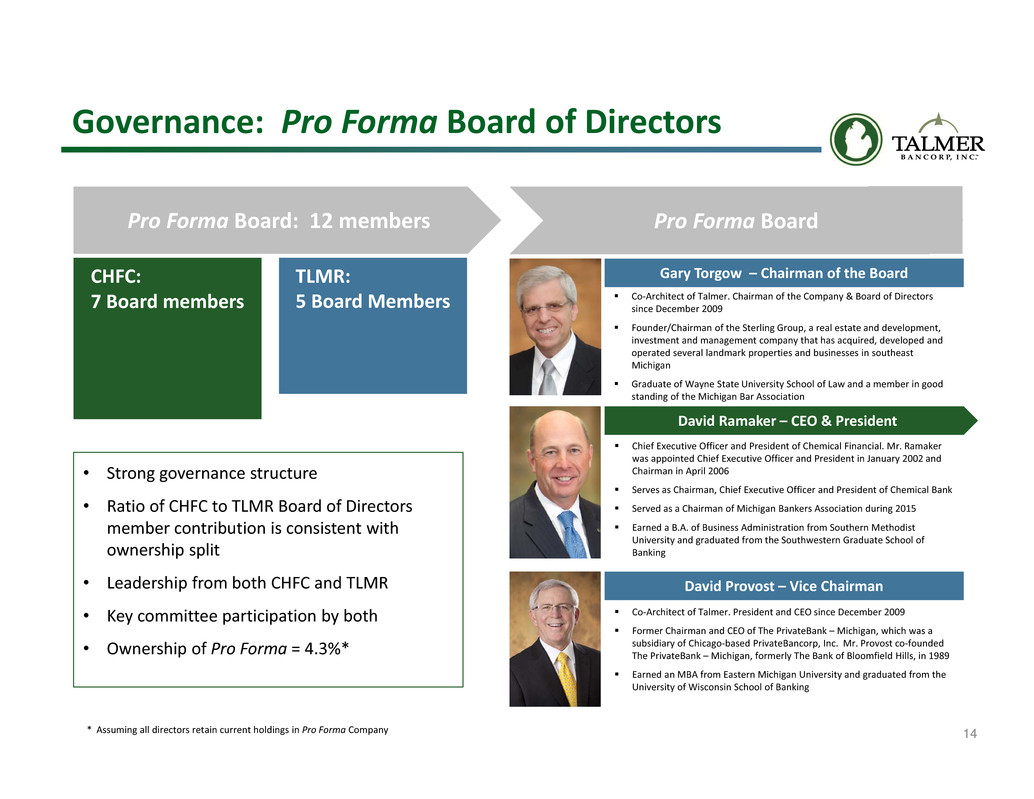
14 Chief Executive Officer and President of Chemical Financial. Mr. Ramaker was appointed Chief Executive Officer and President in January 2002 and Chairman in April 2006 Serves as Chairman, Chief Executive Officer and President of Chemical Bank Served as a Chairman of Michigan Bankers Association during 2015 Earned a B.A. of Business Administration from Southern Methodist University and graduated from the Southwestern Graduate School of Banking Pro Forma Board: 12 members Co‐Architect of Talmer. President and CEO since December 2009 Former Chairman and CEO of The PrivateBank – Michigan, which was a subsidiary of Chicago‐based PrivateBancorp, Inc. Mr. Provost co‐founded The PrivateBank – Michigan, formerly The Bank of Bloomfield Hills, in 1989 Earned an MBA from Eastern Michigan University and graduated from the University of Wisconsin School of Banking Governance: Pro Forma Board of Directors Gary Torgow – Chairman of the Board Pro Forma Board David Provost – Vice Chairman CHFC: 7 Board members TLMR: 5 Board Members David Ramaker – CEO & President Co‐Architect of Talmer. Chairman of the Company & Board of Directors since December 2009 Founder/Chairman of the Sterling Group, a real estate and development, investment and management company that has acquired, developed and operated several landmark properties and businesses in southeast Michigan Graduate of Wayne State University School of Law and a member in good standing of the Michigan Bar Association • Strong governance structure • Ratio of CHFC to TLMR Board of Directors member contribution is consistent with ownership split • Leadership from both CHFC and TLMR • Key committee participation by both • Ownership of Pro Forma = 4.3%* * Assuming all directors retain current holdings in Pro Forma Company

15 CEO Leadership • Chairman, Chief Executive Officer and President of Chemical Financial Corporation (“CHFC”) • Appointed Chairman in April 2006 • Appointed as Chief Executive Officer and President of Chemical in January 2002 • Serves as Chairman, Chief Executive Officer and President of Chemical Bank • President of Chemical Bank Key State in October 1993 • Joined Chemical Bank as Vice President on November 29, 1989 Earnings GrowthAsset Growth Cycles Stock Performance Bank Acquisitions David B. Ramaker Year Target Assets ($b) 2015 Lake Michigan Financial Corporation $1.2 2015 Monarch Community Bancorp, Inc. $0.2 2014 Northwestern Bancorp $0.9 2010 O.A.K. Financial Corporation $0.8 2003 Caledonia Financial Corporation $0.2 * CHFC had positive annual earnings during the most recent credit crisis and continued to pay a dividend. * Peer Michigan Banks >$500 million in assets averaged a net loss of $72million (median loss $16 million) in 2009, while CHFC had net income of $10 million. $3,569 $4,251 $9,189 2002 2009 2015 Assets ($mm) * $54.9 $10.0 $86.8 2002 2009 2015 Net Income ($mm) / EPS ($) $2.20 $0.42 $2.39 24.0% 96.1% (80%) (45%) (10%) 25% 60% 95% 130% 12/31/2001 12/31/2008 12/31/2015 MI Peers >$500m (+24.0%) CHFC (+96.1%) (1) Pricing as of January 29, 2016 (1) 0.20% 1.18% 0.13% 0.23% 2.97% 0.10% 2002 2009 2015 NCOs / Avg. Loans (%) CHFC Peers
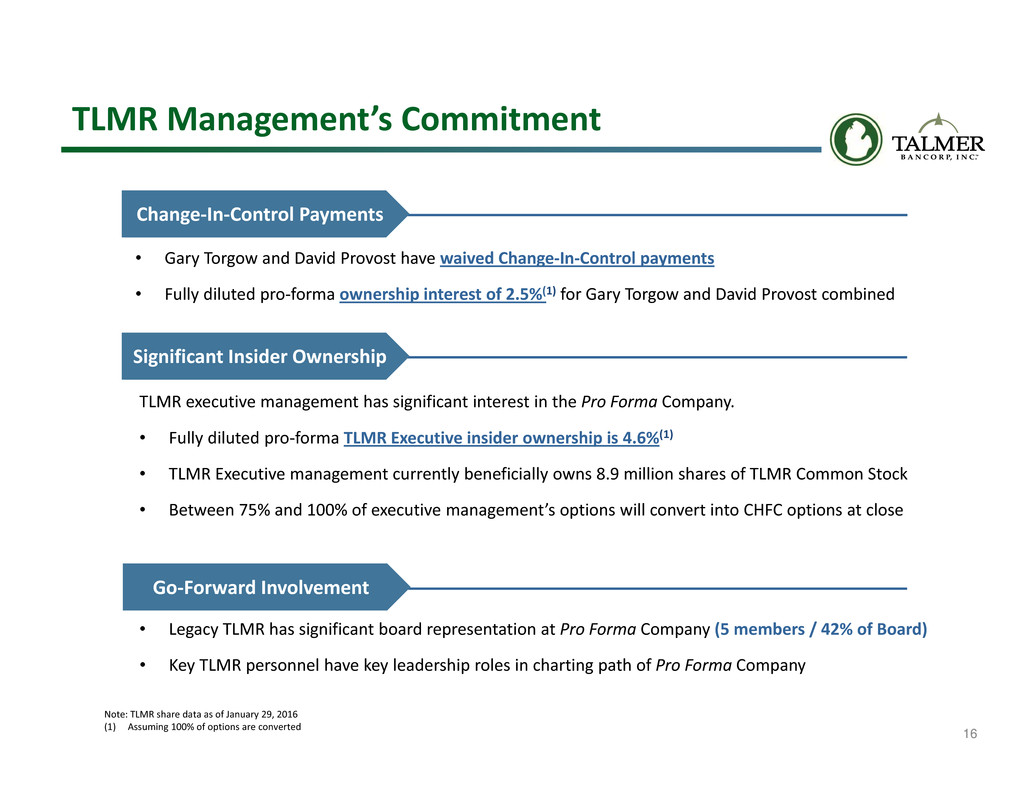
16 TLMR Management’s Commitment • Legacy TLMR has significant board representation at Pro Forma Company (5 members / 42% of Board) • Key TLMR personnel have key leadership roles in charting path of Pro Forma Company Significant Insider Ownership TLMR executive management has significant interest in the Pro Forma Company. • Fully diluted pro‐forma TLMR Executive insider ownership is 4.6%(1) • TLMR Executive management currently beneficially owns 8.9 million shares of TLMR Common Stock • Between 75% and 100% of executive management’s options will convert into CHFC options at close Change‐In‐Control Payments • Gary Torgow and David Provost have waived Change‐In‐Control payments • Fully diluted pro‐forma ownership interest of 2.5%(1) for Gary Torgow and David Provost combined Note: TLMR share data as of January 29, 2016 (1) Assuming 100% of options are converted Go‐Forward Involvement

17 Vision: Creating a Preeminent Midwest Bank Pro Forma Entity is Largest MI‐Headquartered Bank Pro Forma CHFC Operating Markets Source: SNL Financial. Deposit data as of 6/30/2015. Note: The two branches in Indiana are not included in the Southwest Michigan region. (1) Local is defined as banks headquartered in Michigan (2) Does not take into account ~$1 billion of announced divestitures Upper Michigan Southeast Michigan Southwest Michigan CHFC TLMR Central Michigan Northern Ohio Deposit Market Share Rank Number of Branches Deposits in Market ($000) Market Share (%) Central Michigan 1 65 2,625,086 18.5% Upper Michigan 1 61 2,106,867 18.0% Southwest Michigan 2 79 3,334,883 9.5% Southeast Michigan 9 31 2,783,862 2.2% Northern Ohio 13 27 1,095,608 1.1% Rank "Local" Rank (1) Institution (ST) Branches Deposits ($mm) Market Share (%) 1 JPMorgan Chase & Co. (NY) 249 39,108 20.5% 2 Comerica Inc. (TX) 216 27,494 14.4% 3 PNC Financial Services Group (PA) 212 16,347 8.6% 4 Bank of America Corp. (NC) 127 15,677 8.2% 5 Fifth Third Bancorp (OH) 243 15,162 8.0% 6 Pro Forma HBAN / FMER (2) 367 14,597 7.7% 7 1 Pro Forma CHFC / TLMR 236 10,851 5.7% 8 2 Flagstar Bancorp Inc. (MI) 99 7,837 4.1% Chemical Financial Corp. (MI) 185 7,304 3.8% 9 Citizens Financial Group Inc. (RI) 98 4,951 2.6% Talmer Bancorp Inc. (MI) 51 3,546 1.9% 10 Wells Fargo & Co. (CA) 18 2,691 1.4% 11 TCF Financial Corp. (MN) 54 2,600 1.4% 12 3 Mercantile Bank Corp. (MI) 54 2,281 1.2% 13 4 Independent Bank Corp. (MI) 64 1,985 1.0% 14 Old National Bancorp (IN) 36 1,333 0.7% 15 5 Macatawa Bank Corp. (MI) 30 1,333 0.7% Totals (1‐128) 2,766 190,509 100.0%
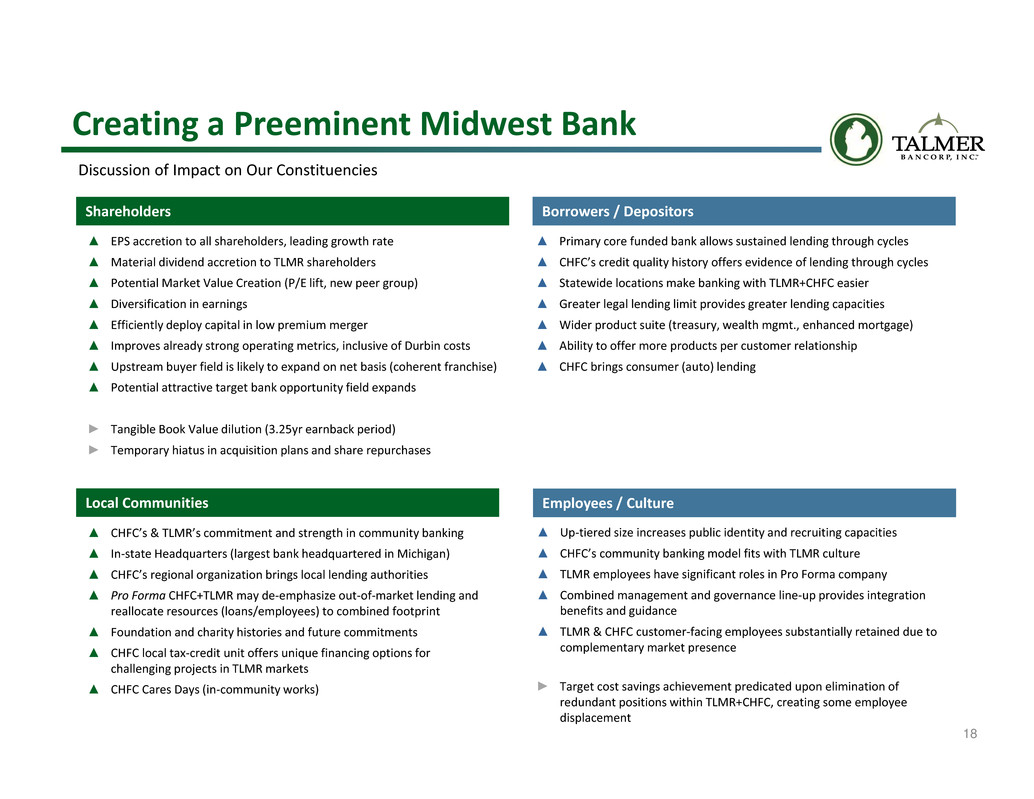
18 Discussion of Impact on Our Constituencies Creating a Preeminent Midwest Bank Shareholders Local Communities ▲ EPS accretion to all shareholders, leading growth rate ▲ Material dividend accretion to TLMR shareholders ▲ Potential Market Value Creation (P/E lift, new peer group) ▲ Diversification in earnings ▲ Efficiently deploy capital in low premium merger ▲ Improves already strong operating metrics, inclusive of Durbin costs ▲ Upstream buyer field is likely to expand on net basis (coherent franchise) ▲ Potential attractive target bank opportunity field expands ► Tangible Book Value dilution (3.25yr earnback period) ► Temporary hiatus in acquisition plans and share repurchases ▲ CHFC’s & TLMR’s commitment and strength in community banking ▲ In‐state Headquarters (largest bank headquartered in Michigan) ▲ CHFC’s regional organization brings local lending authorities ▲ Pro Forma CHFC+TLMR may de‐emphasize out‐of‐market lending and reallocate resources (loans/employees) to combined footprint ▲ Foundation and charity histories and future commitments ▲ CHFC local tax‐credit unit offers unique financing options for challenging projects in TLMR markets ▲ CHFC Cares Days (in‐community works) Borrowers / Depositors ▲ Primary core funded bank allows sustained lending through cycles ▲ CHFC’s credit quality history offers evidence of lending through cycles ▲ Statewide locations make banking with TLMR+CHFC easier ▲ Greater legal lending limit provides greater lending capacities ▲ Wider product suite (treasury, wealth mgmt., enhanced mortgage) ▲ Ability to offer more products per customer relationship ▲ CHFC brings consumer (auto) lending Employees / Culture ▲ Up‐tiered size increases public identity and recruiting capacities ▲ CHFC’s community banking model fits with TLMR culture ▲ TLMR employees have significant roles in Pro Forma company ▲ Combined management and governance line‐up provides integration benefits and guidance ▲ TLMR & CHFC customer‐facing employees substantially retained due to complementary market presence ► Target cost savings achievement predicated upon elimination of redundant positions within TLMR+CHFC, creating some employee displacement
Appendix

20 2017 Earnings Assets Loans Deposits Tang. Comm. Equity(4) F.D. Ownership 46.0% 58.2% 59.9% 59.8% 50.3% 53.8% 14.1% 39.8% 41.8% 40.1% 40.2% 49.7% 46.2% Contribution Analysis Note: F.D. Ownership based on 25% option cash out (1) Combined represents the sum of CHFC and TLMR data and is not reflective of any purchase accounting marks or merger adjustments (2) Based upon closing prices as of January 29, 2016 (3) Consensus mean estimates (4) CHFC tangible common equity adjusted for $14.9 million deferred tax credit Note: Financial data as of December 31, 2015 $52m PT Cost Savings 50% ($ in billions, unless otherwise noted) Combined (1) Assets $9.2 $6.6 $15.8 Loans $7.3 $4.8 $12.1 Deposits $7.5 $5.0 $12.5 Equity $1.0 $0.7 $1.7 Market Capitalization (2) $1.2 $1.1 $2.3 2017 Consensus Net Income ($ in millions) (3) $110 $95 $205 Branches 185 81 266
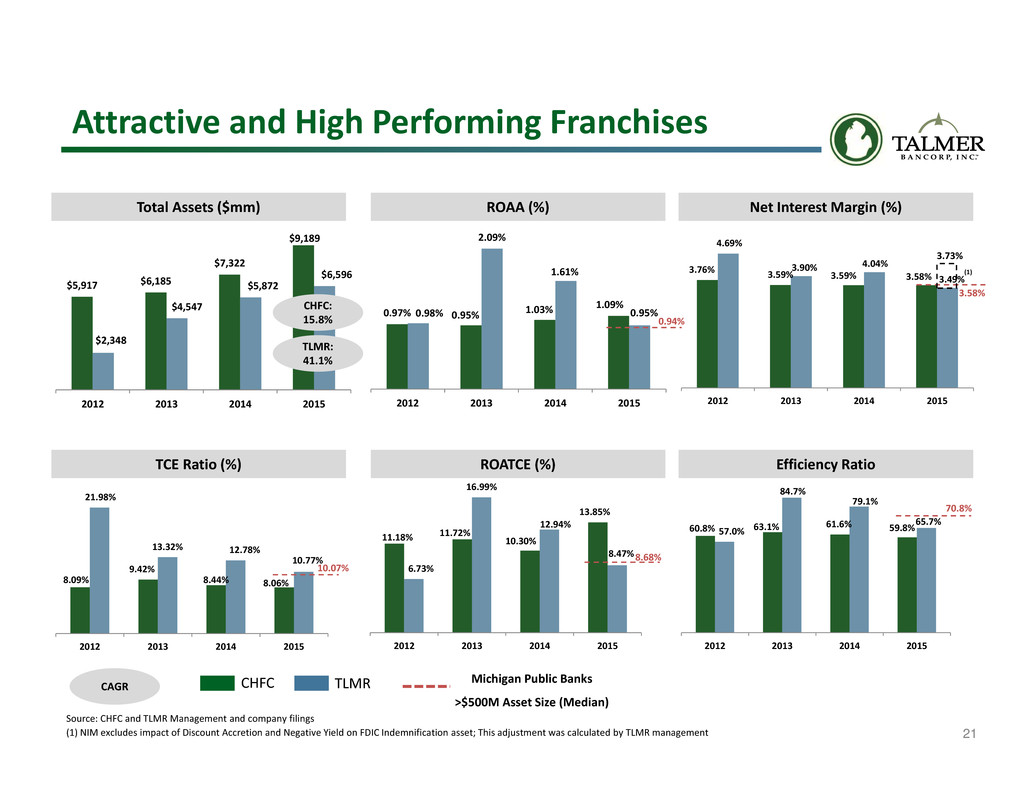
21 3.76% 3.59% 3.59% 3.58% 4.69% 3.90% 4.04% 3.49% 2012 2013 2014 2015 0.97% 0.95% 1.03% 1.09% 0.98% 2.09% 1.61% 0.95% 2012 2013 2014 2015 $5,917 $6,185 $7,322 $9,189 $2,348 $4,547 $5,872 $6,596 2012 2013 2014 2015 Total Assets ($mm) ROAA (%) ROATCE (%) CHFC: 15.8% CAGR Attractive and High Performing Franchises TLMR: 41.1% TCE Ratio (%) Efficiency Ratio 8.09% 9.42% 8.44% 8.06% 21.98% 13.32% 12.78% 10.77% 2012 2013 2014 2015 11.18% 11.72% 10.30% 13.85% 6.73% 16.99% 12.94% 8.47% 2012 2013 2014 2015 60.8% 63.1% 61.6% 59.8% 57.0% 84.7% 79.1% 65.7% 2012 2013 2014 2015 CHFC TLMR 0.94% 8.68% 10.07% 70.8% Michigan Public Banks >$500M Asset Size (Median) Source: CHFC and TLMR Management and company filings (1) NIM excludes impact of Discount Accretion and Negative Yield on FDIC Indemnification asset; This adjustment was calculated by TLMR management Net Interest Margin (%) 3.58% 3.73% (1)
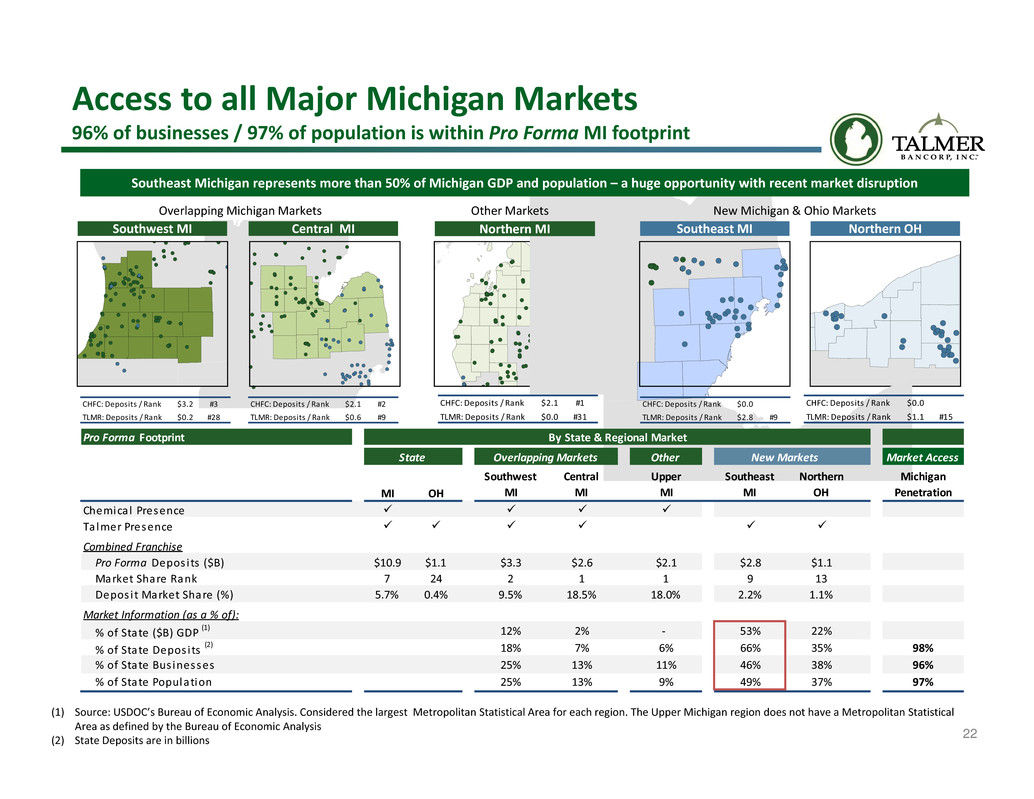
22 Access to all Major Michigan Markets 96% of businesses / 97% of population is within Pro Forma MI footprint Overlapping Michigan Markets New Michigan & Ohio MarketsOther Markets CHFC: Deposits / Rank $3.2 #3 TLMR: Deposits / Rank $0.2 #28 CHFC: Deposits / Rank $2.1 #2 TLMR: Deposits / Rank $0.6 #9 CHFC: Deposits / Rank $0.0 TLMR: Deposits / Rank $2.8 #9 CHFC: Deposits / Rank $0.0 TLMR: Deposits / Rank $1.1 #15 CHFC: Deposits / Rank $2.1 #1 TLMR: Deposits / Rank $0.0 #31 Southwest MI Central MI Southeast MI Northern OHNorthern MI Southeast Michigan represents more than 50% of Michigan GDP and population – a huge opportunity with recent market disruption (1) Source: USDOC’s Bureau of Economic Analysis. Considered the largest Metropolitan Statistical Area for each region. The Upper Michigan region does not have a Metropolitan Statistical Area as defined by the Bureau of Economic Analysis (2) State Deposits are in billions Pro Forma Footprint By State & Regional Market State Overlapping Markets Other New Markets Market Access MI OH Southwest MI Central MI Upper MI Southeast MI Northern OH Michigan Penetration Chemical Presence Talmer Presence Combined Franchise Pro Forma Depos its ($B) $10.9 $1.1 $3.3 $2.6 $2.1 $2.8 $1.1 Market Share Rank 7 24 2 1 1 9 13 Depos i t Market Share (%) 5.7% 0.4% 9.5% 18.5% 18.0% 2.2% 1.1% Market Information (as a % of): % of State ($B) GDP (1) 12% 2% ‐ 53% 22% % of State Depos its (2) 18% 7% 6% 66% 35% 98% % of State Bus inesses 25% 13% 11% 46% 38% 96% % of State Population 25% 13% 9% 49% 37% 97%
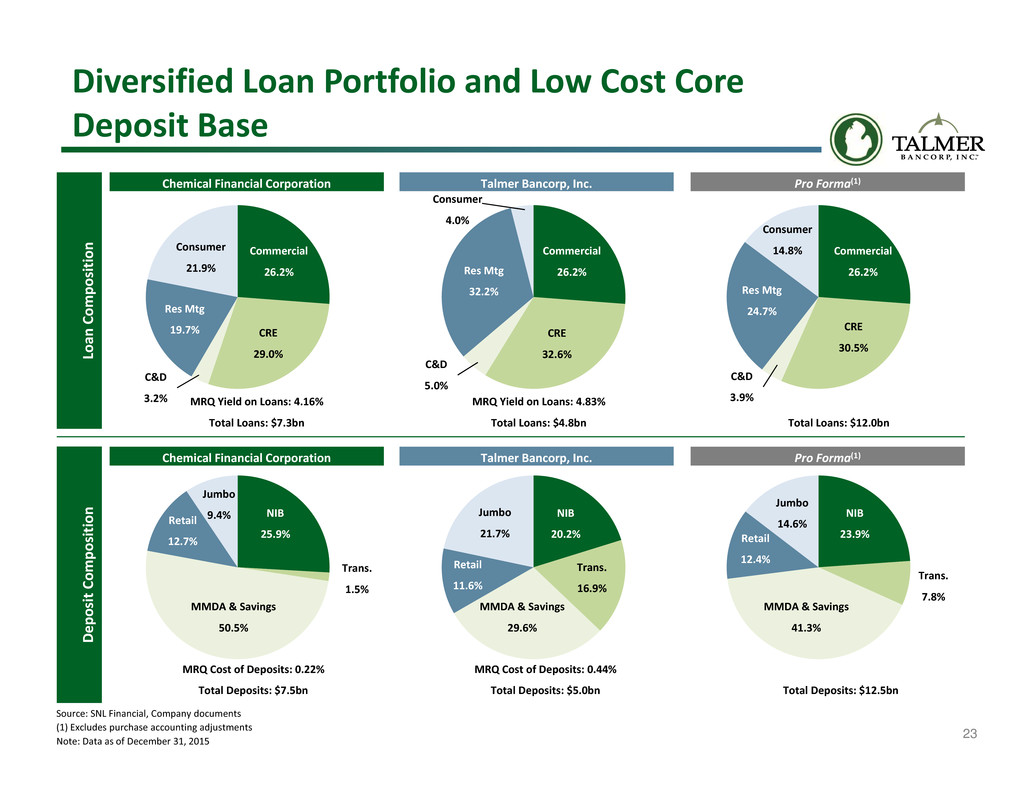
23 Diversified Loan Portfolio and Low Cost Core Deposit Base Source: SNL Financial, Company documents (1) Excludes purchase accounting adjustments Note: Data as of December 31, 2015 Commercial 26.2% CRE 32.6% C&D 5.0% Res Mtg 32.2% Jumbo 9.4% NIB 25.9% Trans. 1.5% MMDA & Savings 50.5% Retail 12.7% Jumbo 21.7% NIB 20.2% Trans. 16.9% MMDA & Savings 29.6% Retail 11.6% Jumbo 14.6% NIB 23.9% Trans. 7.8% MMDA & Savings 41.3% Retail 12.4% MRQ Yield on Loans: 4.16% Total Loans: $7.3bn MRQ Yield on Loans: 4.83% Total Loans: $4.8bn Total Loans: $12.0bn MRQ Cost of Deposits: 0.22% Total Deposits: $7.5bn MRQ Cost of Deposits: 0.44% Total Deposits: $5.0bn Total Deposits: $12.5bn Consumer 4.0% Commercial 26.2% CRE 29.0% C&D 3.2% Res Mtg 19.7% Consumer 21.9% Commercial 26.2% CRE 30.5% C&D 3.9% Res Mtg 24.7% Consumer 14.8% L o a n C o m p o s i t i o n Chemical Financial Corporation Talmer Bancorp, Inc. Pro Forma(1) D e p o s i t C o m p o s i t i o n Chemical Financial Corporation Talmer Bancorp, Inc. Pro Forma(1)
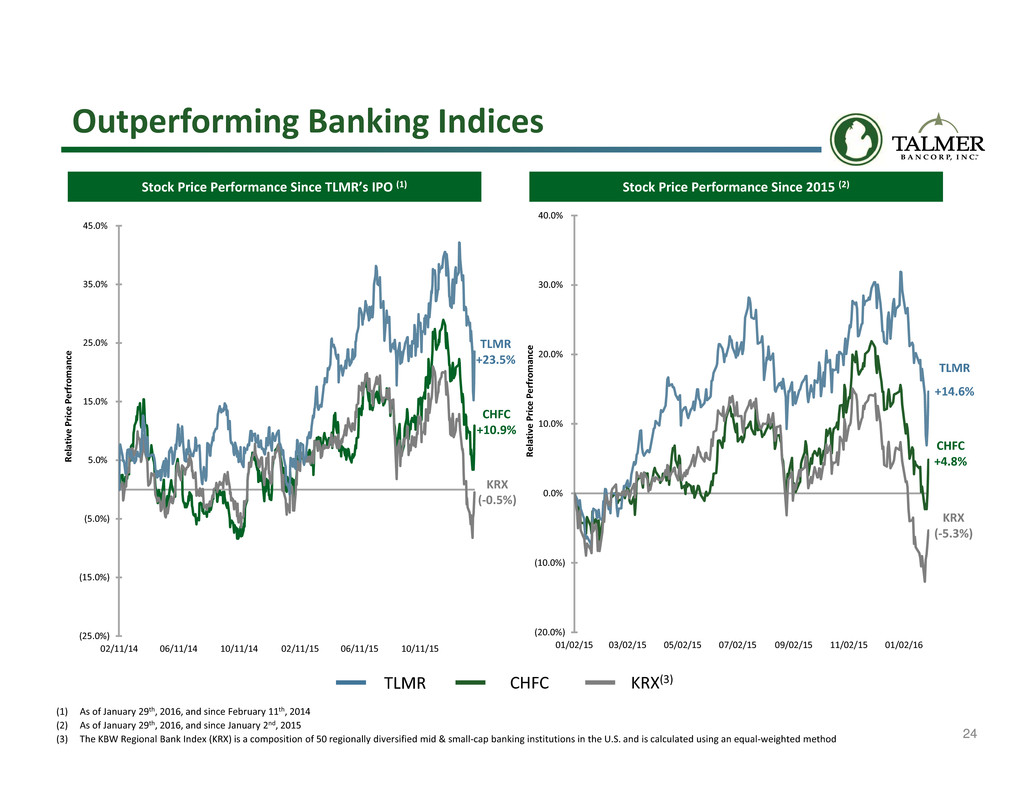
24 Outperforming Banking Indices (1) As of January 29th, 2016, and since February 11th, 2014 (2) As of January 29th, 2016, and since January 2nd, 2015 (3) The KBW Regional Bank Index (KRX) is a composition of 50 regionally diversified mid & small‐cap banking institutions in the U.S. and is calculated using an equal‐weighted method Stock Price Performance Since TLMR’s IPO (1) Stock Price Performance Since 2015 (2) TLMR CHFC KRX(3) CHFC +10.9% (25.0%) (15.0%) (5.0%) 5.0% 15.0% 25.0% 35.0% 45.0% 02/11/14 06/11/14 10/11/14 02/11/15 06/11/15 10/11/15 R e l a t i v e P r i c e P e r f r o m a n c e KRX (‐0.5%) (20.0%) (10.0%) 0.0% 10.0% 20.0% 30.0% 40.0% 01/02/15 03/02/15 05/02/15 07/02/15 09/02/15 11/02/15 01/02/16 R e l a t i v e P r i c e P e r f r o m a n c e CHFC +4.8% KRX (‐5.3%) TLMR +23.5% TLMR +14.6%

25 Key Merger Assumptions Option Treatment Merger & Integration Costs Other Adjustments Credit Mark • Estimated increase in the fair value of the loan portfolio of $10 million as part of the transaction • The total fair value discount of the loan portfolio is projected at 5% when considering the credit and interest marks already recorded, the current allowance for loan losses that will be reversed and recorded as part of the fair value discount • Core deposit intangible of 1.75% ($62 million) assumed on non‐time deposits, amortized over 10 years • Other purchase accounting fair value adjustments total approximately $22 million • Revenue enhancements identified but not modeled Regulatory Costs • Annual pre‐tax Durbin costs of $5 million and $10 million in 2017 and 2018+, respectively • Annual pre‐tax incremental cost of $2 million to comply with advanced supervisory requirements (FDIC insurance and stress testing) • Expected to be approximately $62 million pre‐tax and adjustments are fully phased into Pro Forma TBV computation • At least 75% of TLMR options are converted into CHFC options at closing, up to 25% of TLMR options may be cashed out at closing Transaction Consideration • Exchange ratio of 0.4725 CHFC shares and $1.61 of cash for each share of TLMR common stock • Approximately 90% stock / 10% cash consideration Cost Savings • Expected to be approximately $52 million (fully phased‐in) • Approximately 26% of Talmer’s noninterest expense, 12% of combined 2016 noninterest expense(1) (1) Based on mean consensus estimates
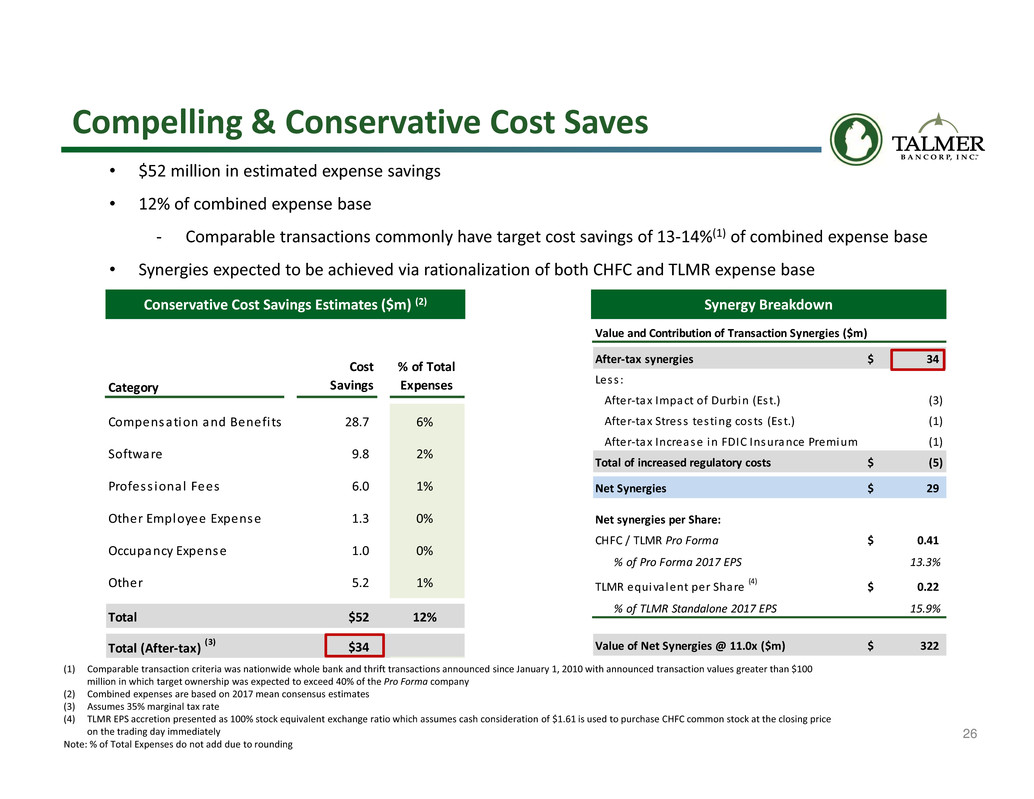
26 Category Cost Savings % of Total Expenses Compensation and Benefi ts 28.7 6% Software 9.8 2% Profess ional Fees 6.0 1% Other Employee Expense 1.3 0% Occupancy Expense 1.0 0% Other 5.2 1% Total $52 12% Total (After‐tax) (3) $34 Value and Contribution of Transaction Synergies ($m) After‐tax synergies 34$ Less : After‐tax Impact of Durbin (Est.) (3) After‐tax Stress testing costs (Est.) (1) After‐tax Increase in FDIC Insurance Premium (1) Total of increased regulatory costs (5)$ Net Synergies 29$ Net synergies per Share: CHFC / TLMR Pro Forma 0.41$ % of Pro Forma 2017 EPS 13.3% TLMR equiva lent per Share (4) 0.22$ % of TLMR Standalone 2017 EPS 15.9% Value of Net Synergies @ 11.0x ($m) 322$ • $52 million in estimated expense savings • 12% of combined expense base ‐ Comparable transactions commonly have target cost savings of 13‐14%(1) of combined expense base • Synergies expected to be achieved via rationalization of both CHFC and TLMR expense base Conservative Cost Savings Estimates ($m) (2) Synergy Breakdown Compelling & Conservative Cost Saves (1) Comparable transaction criteria was nationwide whole bank and thrift transactions announced since January 1, 2010 with announced transaction values greater than $100 million in which target ownership was expected to exceed 40% of the Pro Forma company (2) Combined expenses are based on 2017 mean consensus estimates (3) Assumes 35% marginal tax rate (4) TLMR EPS accretion presented as 100% stock equivalent exchange ratio which assumes cash consideration of $1.61 is used to purchase CHFC common stock at the closing price on the trading day immediately Note: % of Total Expenses do not add due to rounding
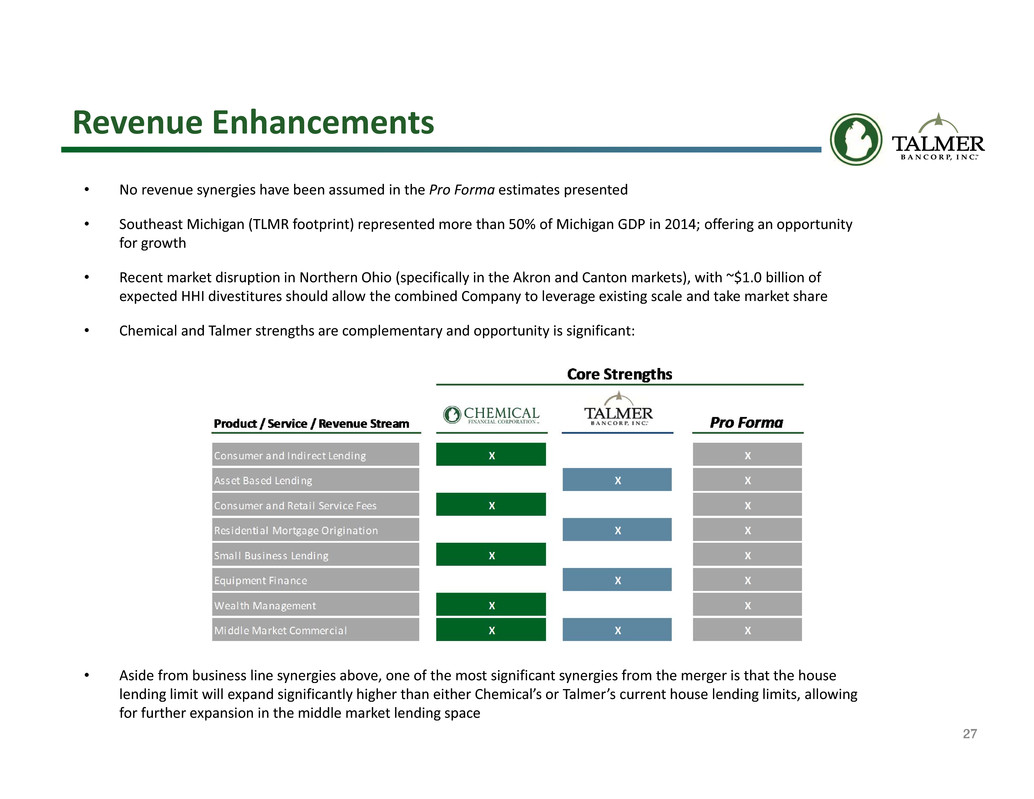
27 Revenue Enhancements • No revenue synergies have been assumed in the Pro Forma estimates presented • Southeast Michigan (TLMR footprint) represented more than 50% of Michigan GDP in 2014; offering an opportunity for growth • Recent market disruption in Northern Ohio (specifically in the Akron and Canton markets), with ~$1.0 billion of expected HHI divestitures should allow the combined Company to leverage existing scale and take market share • Chemical and Talmer strengths are complementary and opportunity is significant: • Aside from business line synergies above, one of the most significant synergies from the merger is that the house lending limit will expand significantly higher than either Chemical’s or Talmer’s current house lending limits, allowing for further expansion in the middle market lending space
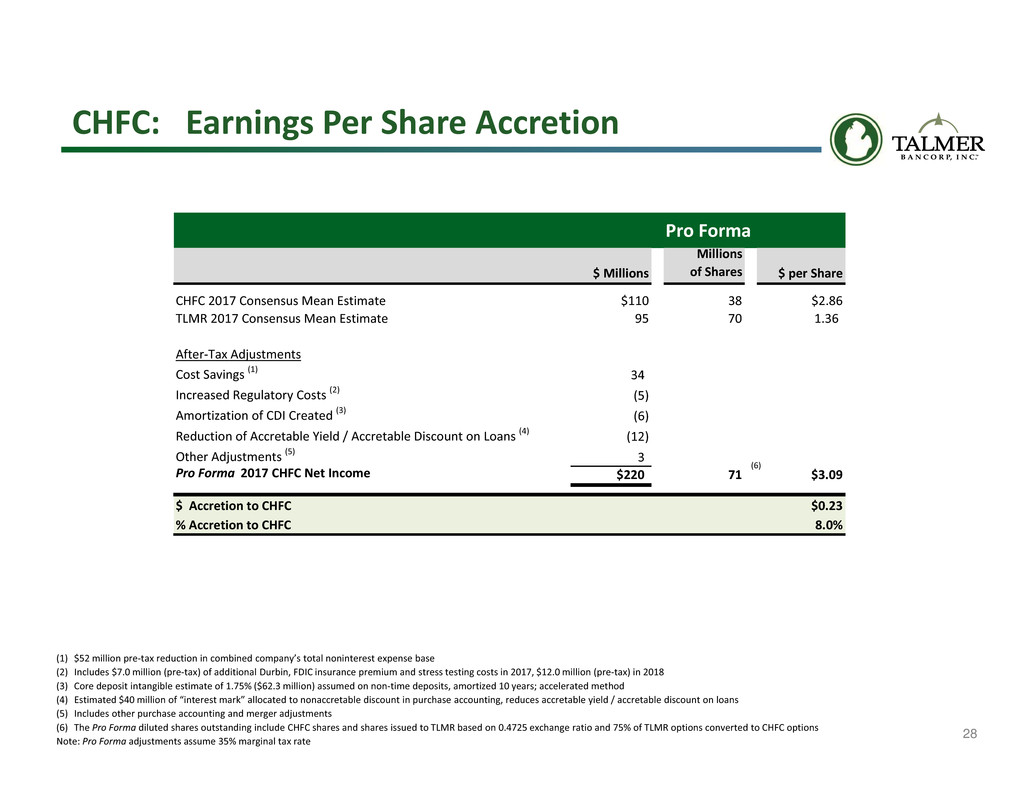
28 CHFC: Earnings Per Share Accretion (1) $52 million pre‐tax reduction in combined company’s total noninterest expense base (2) Includes $7.0 million (pre‐tax) of additional Durbin, FDIC insurance premium and stress testing costs in 2017, $12.0 million (pre‐tax) in 2018 (3) Core deposit intangible estimate of 1.75% ($62.3 million) assumed on non‐time deposits, amortized 10 years; accelerated method (4) Estimated $40 million of “interest mark” allocated to nonaccretable discount in purchase accounting, reduces accretable yield / accretable discount on loans (5) Includes other purchase accounting and merger adjustments (6) The Pro Forma diluted shares outstanding include CHFC shares and shares issued to TLMR based on 0.4725 exchange ratio and 75% of TLMR options converted to CHFC options Note: Pro Forma adjustments assume 35% marginal tax rate (6) Pro Forma $ Millions Millions of Shares $ per Share CHFC 2017 Consensus Mean Estimate $110 38 $2.86 TLMR 2017 Consensus Mean Estimate 95 70 1.36 After‐Tax Adjustments Cost Savings (1) 34 Increased Regulatory Costs (2) (5) Amortization of CDI Created (3) (6) Reduction of Accretable Yield / Accretable Discount on Loans (4) (12) Other Adjustments (5) 3 Pro Forma 2017 CHFC Net Income $220 71 $3.09 $ Accretion to CHFC $0.23 % Accretion to CHFC 8.0%

29 TLMR: Earnings Per Share Accretion (6) Note: After‐tax Adjustments have been multiplied by the 100% stock equivalent of the .4725x exchange ratio; analysis considers 100% stock equivalent exchange ratio which assumes cash consideration of $1.61 is used to purchase CHFC common stock at the closing price on the trading day immediately before the merger agreement was signed (1) $52 million pre‐tax reduction in combined company’s total noninterest expense base (2) Includes $7.0 million (pre‐tax) of additional Durbin, FDIC insurance premium and stress testing costs in 2017, $12.0 million (pre‐tax) in 2018 (3) Core deposit intangible estimate of 1.75% ($62.3 million) assumed on non‐time deposits, amortized 10 years; accelerated method (4) Estimated $40 million of “interest mark” allocated to nonaccretable discount in purchase accounting, reduces accretable yield / accretable discount on loans (5) Includes other purchase accounting and merger adjustments (6) The Pro Forma diluted shares outstanding include CHFC shares and shares issued to TLMR based on 0.4725 exchange ratio and 75% of TLMR options converted to CHFC options (7) The Pro Forma TLMR EPS is estimated using 100% stock equivalent exchange ratio which assumes cash consideration of $1.61 is used to purchase CHFC common stock at the closing price on the trading day immediately before the merger agreement was signed Note: Pro Forma adjustments assume 35% marginal tax rate (7) Pro Forma $ Millions Millions of Shares $ per Share CHFC 2017 Consensus Mean Estimate $110 38 $2.86 TLMR 2017 Consensus Mean Estimate 95 70 1.36 After‐Tax Adjustments Cost Savings (1) 34 Increased Regulatory Costs (2) (5) Amortization of CDI Created (3) (6) Reduction of Accretable Yield / Accretable Discount on Loans (4) (12) Other Adjustments (5) 3 Pro Forma 2017 CHFC Net Income $220 71 $3.09 Fixed Exchange Ratio 0.4725x Pro Forma 2017 TLMR EPS $1.62 $ Accretion to TLMR $0.26 % Accretion to TLMR 19%
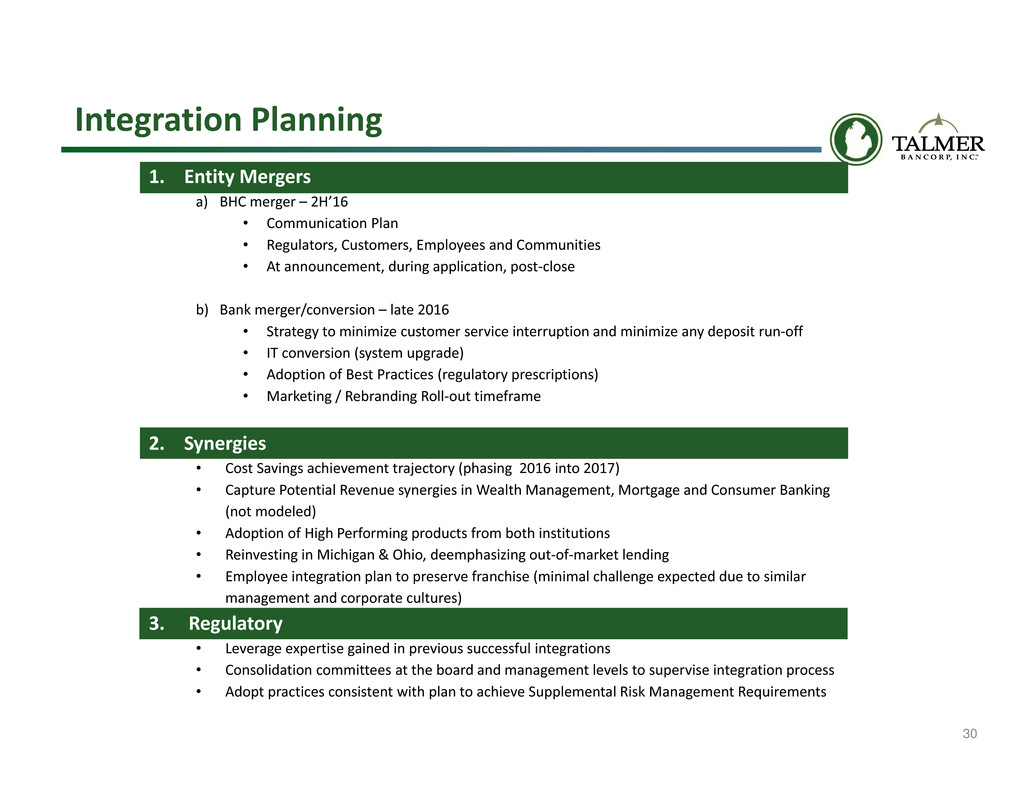
30 1. Entity Mergers a) BHC merger – 2H’16 • Communication Plan • Regulators, Customers, Employees and Communities • At announcement, during application, post‐close b) Bank merger/conversion – late 2016 • Strategy to minimize customer service interruption and minimize any deposit run‐off • IT conversion (system upgrade) • Adoption of Best Practices (regulatory prescriptions) • Marketing / Rebranding Roll‐out timeframe 2. Synergies • Cost Savings achievement trajectory (phasing 2016 into 2017) • Capture Potential Revenue synergies in Wealth Management, Mortgage and Consumer Banking (not modeled) • Adoption of High Performing products from both institutions • Reinvesting in Michigan & Ohio, deemphasizing out‐of‐market lending • Employee integration plan to preserve franchise (minimal challenge expected due to similar management and corporate cultures) 3. Regulatory • Leverage expertise gained in previous successful integrations • Consolidation committees at the board and management levels to supervise integration process • Adopt practices consistent with plan to achieve Supplemental Risk Management Requirements Integration Planning
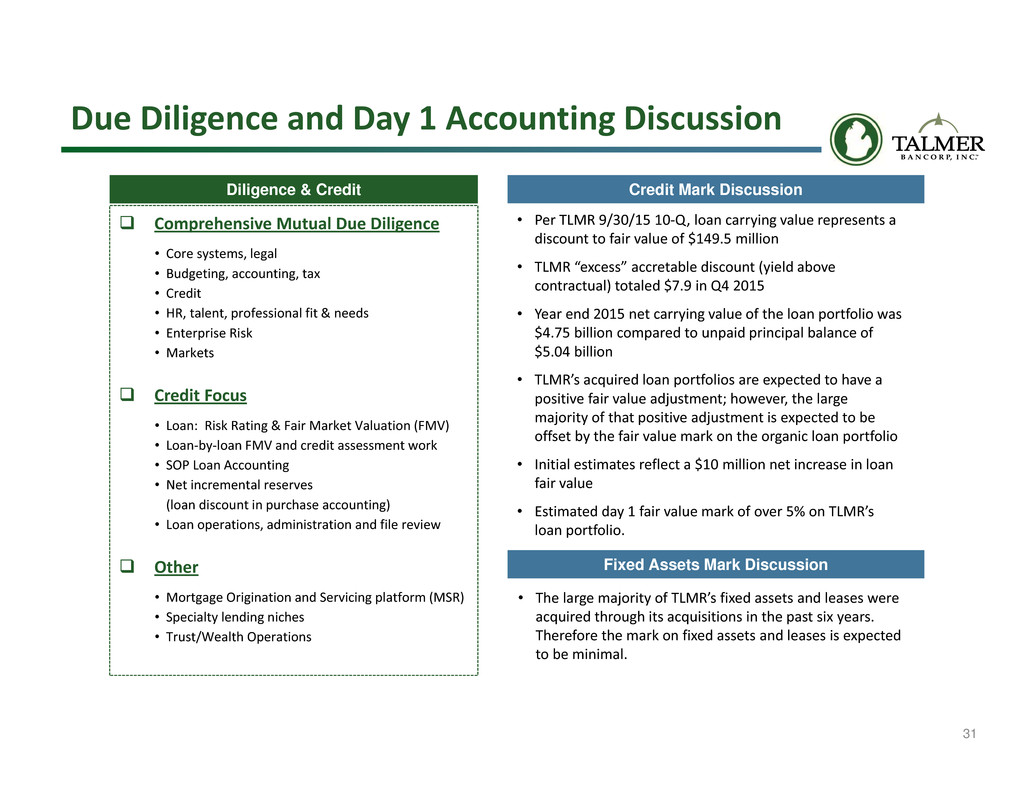
31 Due Diligence and Day 1 Accounting Discussion Diligence & Credit Credit Mark Discussion Comprehensive Mutual Due Diligence • Core systems, legal • Budgeting, accounting, tax • Credit • HR, talent, professional fit & needs • Enterprise Risk • Markets Credit Focus • Loan: Risk Rating & Fair Market Valuation (FMV) • Loan‐by‐loan FMV and credit assessment work • SOP Loan Accounting • Net incremental reserves (loan discount in purchase accounting) • Loan operations, administration and file review Other • Mortgage Origination and Servicing platform (MSR) • Specialty lending niches • Trust/Wealth Operations • Per TLMR 9/30/15 10‐Q, loan carrying value represents a discount to fair value of $149.5 million • TLMR “excess” accretable discount (yield above contractual) totaled $7.9 in Q4 2015 • Year end 2015 net carrying value of the loan portfolio was $4.75 billion compared to unpaid principal balance of $5.04 billion • TLMR’s acquired loan portfolios are expected to have a positive fair value adjustment; however, the large majority of that positive adjustment is expected to be offset by the fair value mark on the organic loan portfolio • Initial estimates reflect a $10 million net increase in loan fair value • Estimated day 1 fair value mark of over 5% on TLMR’s loan portfolio. Fixed Assets Mark Discussion • The large majority of TLMR’s fixed assets and leases were acquired through its acquisitions in the past six years. Therefore the mark on fixed assets and leases is expected to be minimal.

32 Calculation of Intangibles Created $ Millions Deal Value $1,097 TLMR TCE at Close (6) $749 (+) TLMR After‐Tax Acquisition Expenses (7) (22) (+) Net After‐tax Credit Mark 7 (+) Other Fair Value Adjustments (29) Adjusted Tangible Book Value $704 Excess over Adjusted TBV $393 (+) Core Deposit Intangible Created (62) (+) DTL on CDI 22 Goodwill Created $353 Intangibles Created $415 Purchase Accounting Summary (1) Based on 0.4725 shares of CHFC common stock for each TLMR common share outstanding (2) Assumes 75% of TLMR options are converted into CHFC options at closing (3) Based on expectations and assumptions as of announcement date; subject to change at transaction closing (4) Reflects acquisition expenses allocated to CHFC (5) Based on when Pro Forma tangible book value per share crosses over and begins to exceed projected standalone CHFC tangible book value per share (6) Estimated TLMR tangible common equity at close based on 1Q’16 and 2Q’16 consensus mean earnings and dividend estimates provided by TLMR management (7) Reflects acquisition expenses allocated to TLMR Note: Pro Forma adjustments assume 35% marginal tax rate Pro Forma $ Millions Millions of Shares $ per Share CHFC Standalone CHFC Tangible Book Value as of December 31, 2015 $717 38 Two Quarters of Consensus Mean Earnings Prior to Close 50 Two Quarters of $0.26 Per Share Common Dividends (20) Amortization of Existing Core Deposit Intangibles 2 Standalone CHFC Tangible Book Value at Close $749 38 $19.63 Pro Forma Standalone CHFC Tangible Book Value at Close $749 38 $19.63 Equity Consideration to TLMR (1) 928 31 TLMR Options Converted to CHFC Options (2) 47 Goodwill and Intangibles Created (3) (415) CHFC After‐Tax Acquisition Expenses (4) (22) Pro Forma CHFC Tangible Book Value at Close $1,287 69 $18.54 $ Dilution to CHFC ($1.09) % Dilution to CHFC (5.6%) Tangible Book Value Per Share Earnback (5) ~ 3.25 years


