 Lender Presentation Mitel Networks March 31, 2015 Exhibit 99.1 |
 | ©2015 Mitel. Proprietary and Confidential. SAFE HARBOR STATEMENT Forward Looking Statements 2 This presentation includes references to non-GAAP financial measures including adjusted EBITDA, non-GAAP net income and non-GAAP operating expenses. Non-GAAP financial measures do not have any standardized meaning and are therefore unlikely to be comparable to similar measures presented by other companies. We use these non-GAAP financial measures to assist management and investors in understanding our past financial performance and prospects for the future, including changes in our operating results, trends and marketplace performance, exclusive of unusual events or factors which do not directly affect what we consider to be our core operating performance. Non-GAAP measures are among the primary indicators management uses as a basis for our planning and forecasting of future periods. Investors are cautioned that non-GAAP financial measures should not be relied upon as a substitute for financial measures prepared in accordance with generally accepted accounting principles. Some of the statements in this presentation are forward-looking statements (or forward-looking information) within the meaning of applicable U.S. and Canadian securities laws. These include statements using the words believe, target, outlook, may, will, should, could, estimate, continue, expect, intend, plan, predict, potential, project and anticipate, and similar statements which do not describe the present or provide information about the past. There is no guarantee that the expected events or expected results will actually occur. Such statements reflect the current views of management of Mitel and are subject to a number of risks and uncertainties. These statements are based on many assumptions and factors, including general economic and market conditions, industry conditions, operational and other factors. Any changes in these assumptions or other factors could cause actual results to differ materially from current expectations. All forward-looking statements attributable to Mitel, or persons acting on its behalf, and are expressly qualified in their entirety by the cautionary statements set forth in this paragraph. Undue reliance should not be placed on such statements. In addition, material risks that could cause actual results to differ from forward- looking statements include: the inherent uncertainty associated with financial or other projections; the integration of Mavenir and the ability to recognize the anticipated benefits from the acquisition of Mavenir; the ability to obtain required regulatory approvals for the exchange offer and merger, the timing of obtaining such approvals and the risk that such approvals may result in the imposition of conditions that could adversely affect the expected benefits of the acquisition of Mavenir; the risk that the conditions to the exchange offer or merger are not satisfied on a timely basis or at all and the failure of the exchange offer or merger to close for any other reason; risks relating to the value of the Mitel common shares to be issued in connection with the exchange offer and merger; the anticipated size of the markets and continued demand for Mitel and Mavenir products and the impact of competitive products and pricing that could result from the announcement of the acquisition of Mavenir; access to available financing on a timely basis and on reasonable terms, including the refinancing of Mitel’s debt to fund the cash portion of the consideration in connection with the exchange offer and merger; Mitel's ability to achieve or sustain profitability in the future since its acquisition of Aastra; fluctuations in quarterly and annual revenues and operating results; fluctuations in foreign exchange rates; current and ongoing global economic instability, political unrest and related sanctions, particularly in connection with the Ukraine and the Middle East; intense competition; reliance on channel partners for a significant component of sales; dependence upon a small number of outside contract manufacturers to manufacture products; and, Mitel’s ability to implement and achieve its business strategies successfully. Additional risks are described under the heading "Risk Factors" in Mitel's Annual Report on Form 10-K for the year ended December 31, 2014, filed with the SEC on February 26, 2015, and in Mavenir’s Annual Report on Form 10-K for the year ended December 31, 2014, filed with the SEC on March 3, 2015. Forward-looking statements speak only as of the date they are made. Except as required by law, Mitel does not have any intention or obligation to update or to publicly announce the results of any revisions to any of the forward-looking statements to reflect actual results, future events or developments, changes in assumptions or changes in other factors affecting the forward-looking statements. Non-GAAP Financial Measurements |
 | ©2015 Mitel. Proprietary and Confidential. Presenters Mitel Steve Spooner Chief Financial Officer Richard McBee President, Chief Executive Officer and Member of the Board of Directors Mavenir Pardeep Kohli President, Chief Executive Officer and Member of the Board of Directors Terry Hungle Chief Financial Officer 3 |
 | ©2015 Mitel. Proprietary and Confidential. Agenda • Transaction Overview • Mitel Business Overview • Mavenir Business Overview • Transaction Rationale • Financial Overview • Key Credit Highlights • Syndication Overview 4 |
 | ©2015 Mitel. Proprietary and Confidential. Transaction Overview 5 |
 | ©2015 Mitel. Proprietary and Confidential. Transaction Overview • On March 2 nd , 2015, Mitel Networks Corporation (the “Company” or “Mitel”), announced it had entered into a definitive merger agreement to acquire the outstanding shares of Mavenir Systems, Inc. (the “Target” or “Mavenir”) • Acquisition valued at $559mm, or 4.3x FY 12/31/14 Mavenir sales of $130mm • Purchase consideration is a mix of $350mm in cash and $208mm in equity • Pro Forma shareholder ownership of 84% Mitel and 16% Mavenir • Combined company Pro Forma Adjusted EBITDA of $184mm • Combination creates a global leader in converged IP communications for enterprises, service providers and mobile operators • Upon closing, Mavenir will become the mobile business of Mitel, operating under the brand Mavenir • As part of this transaction, the Company will refinance Mitel’s existing Credit Facilities with the following Senior Secured Credit Facilities: • $50mm Senior Secured Revolving Credit Facility • $650mm Senior Secured Term Loan B • Expected net leverage at close of 3.2x 6 • The transaction is expected to close in late April |
 | ©2015 Mitel. Proprietary and Confidential. Sources & Uses and Pro Forma Capitalization Pro Forma Capitalization Sources and Uses 7 ($ in millions) Sources of Funds Amount Uses of Funds Amount New Revolver ($50 mm) $0.0 Mavenir Purchase Price $558.7 New First Lien Term Loan B 650.0 Repayment of Mavenir Debt 26.8 Cash From Balance Sheet 48.7 Refinance Existing Mitel Debt 279.1 Equity Issuance 208.4 Fees, Expenses & OID 42.4 Total Sources $907.0 Total Uses $907.0 Note: Mavenir purchase price calculation assumes Mitel stock price of $10.19 per share as of close on March 27, 2015. Pro Forma ($ in millions) Rating Maturity 12/31/2014 Cash CFR: B2 / B+ $71.7 Revolver ($50 mm) 5 years $0.0 New First Lien Term Loan B Ba3 / B+ (RR 3) 7 years 650.0 Total First Lien Debt $650.0 Capital Leases -- -- 13.1 Total Debt $663.1 PF Adj. EBITDA $184.0 Credit Statistics Total Debt / PF Adj. EBITDA 3.6x Net Debt / PF Adj. EBITDA 3.2x |
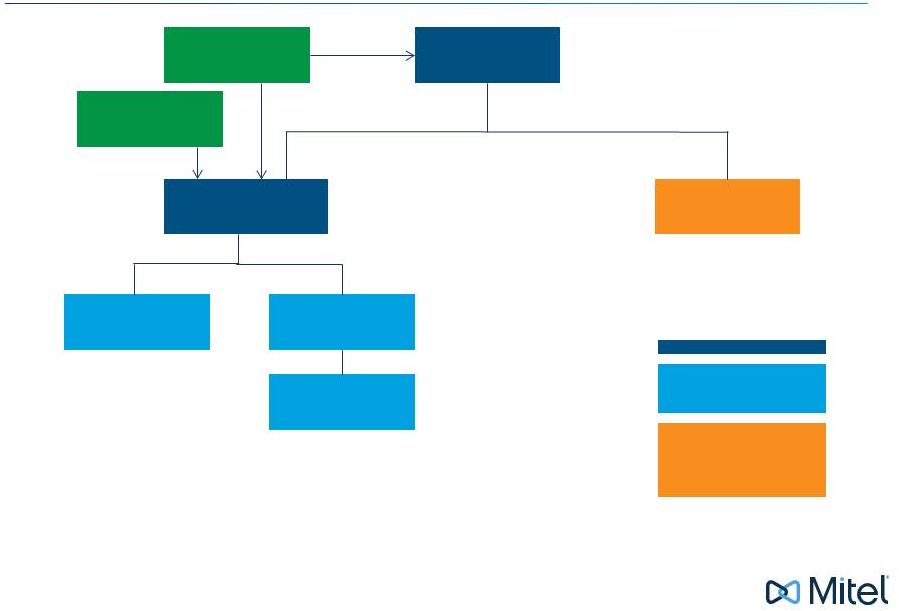 | ©2015 Mitel. Proprietary and Confidential. Pro Forma Corporate Structure (1) Mavenir U.S. Subsidiaries Mitel U.S. Subsidiaries Borrower Guarantor, subject to customary exclusions for immaterial subsidiaries, and customary “guaranty and security principles.” Guarantor, subject to customary exclusions for immaterial subsidiaries. (1) Simplified for illustrative purposes, and after giving effect to (i) the acquisition of Mavenir, (ii) the post-closing reorganization of certain Mavenir subsidiaries and (iii) post-closing delivery of certain non US and Canadian guarantees and collateral. 8 New $50M Revolving Credit Facility Mitel Networks Corporation (Canada) New $650M Senior Secured Term B Loan Mitel U.S. Holdings Inc. (USA) Mitel / Mavenir Non–U.S. Subsidiaries Mavenir Systems Inc. (USA) |
 | ©2015 Mitel. Proprietary and Confidential. Mitel Business Overview 9 |
 | ©2015 Mitel. Proprietary and Confidential. Mitel Today 10 |
 | ©2015 Mitel. Proprietary and Confidential. Mitel Overview Source: Mitel management. (1) Pro forma for Aastra acquisition. (2) Pro forma adjusted EBITDA for Mitel includes the results of Aastra from the date of acquisition of January 31, 2014 (11 months) and does not include Aastra's January 2014 results. Mitel Premise CY14 Revenue (mm): $1,024 % of Total Revenue: 90% Mitel Overall CY14 Revenue (mm): CY14 Revenue Growth: CY14 Gross Margin: CY14 Adjusted EBITDA (mm): Mitel Cloud CY14 Revenue (mm): $116 % of Total Revenue: 10% • MiVoice unified communications platforms addresses both small business and large enterprise needs, providing extensive communication features, robust call control, and support for a wide range of innovative desktop devices and applications • MiCollab offers an in-office experience regardless of location / device with tools such as presence, visual voice mail, conferencing, and more • MiContact Center offers solutions that improve employee productivity and control operational costs within businesses of all sizes • Compatibility with Mitel, third party PBX and Lync • Contact center annual revenue of $48 million (included in Premise) • MiCloud offers a pay-as-you-grow, cloud-based platform for all business communication needs • Cut hardware and IT costs, free up resources and gain new efficiencies • Leverage flexible deployment and migration 11 (2) (1) $1,140 (1%) 53% $167 |
 | ©2015 Mitel. Proprietary and Confidential. (1) As of December 31, 2014 (2) As of March 18, 2015 Mitel’s Financial Strength and Stability 12 Growing • $1.1 billion annual revenue • Global market share gains • #1 in Europe, Middle East & Africa • #3 in North America • #3 Globally (ex-Asia) Investing • $420 million in acquisitions since 2013 • $118 million in R&D annually • Cloud solutions – from small business to large enterprise • Contact Center expansion Strong • $167 million of Annual EBITDA (1) • $111 million cash balance (1) • $1,023 million market cap (2) Experienced • Management team with average of 25+ years experience in the industry including mobile sector • Track record of successful business integrations and strong cash flow generation |
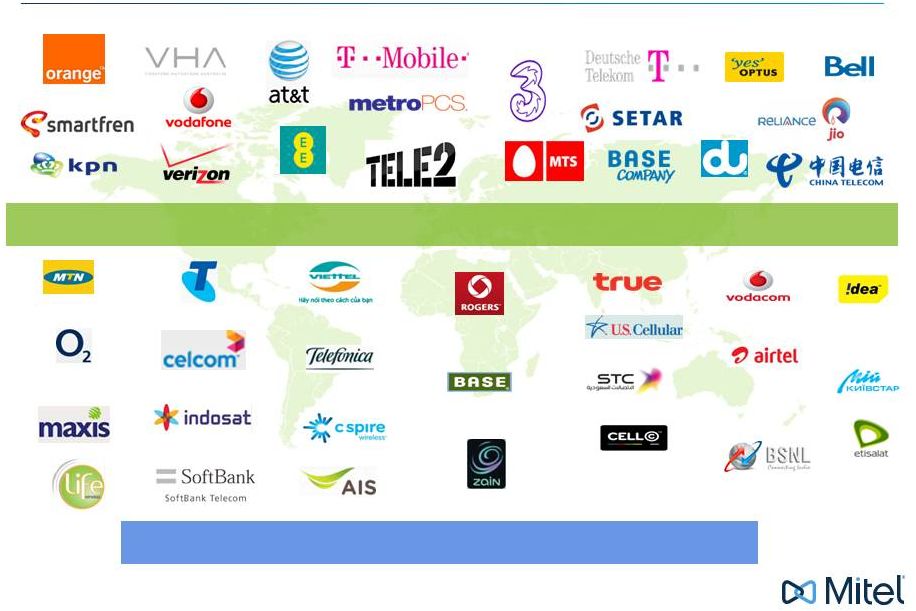
 | ©2015 Mitel. Proprietary and Confidential. Broad Customer / Partner Base Retail Professional Services Manufacturing Carriers Financial Services Education / Government 13 Health Care Hospitality Media & Entertainment |
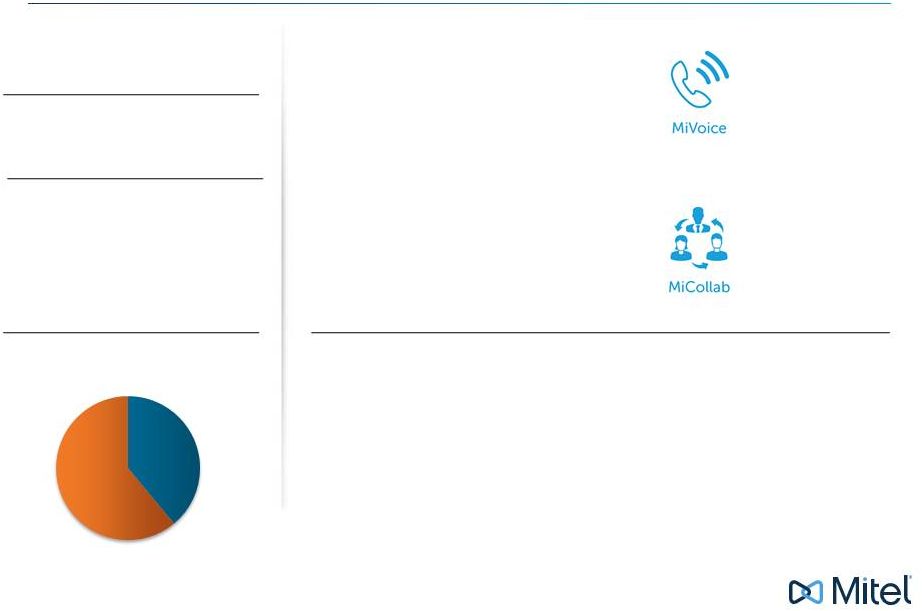 | ©2015 Mitel. Proprietary and Confidential. Mitel Premise: Large & Consolidating Market $6.8bn Market Size (1) ~2% Market Growth (1) ~$1bn Sales MiVoice Call routing software Communications endpoints Hardware gateways MiCollab Unified messaging UC & Mobile clients Web, Video & Audio conferencing Application & Mobility gateways Growth Drivers Int’l Americas Geographic Mix (1) Source: IDC and Mitel Management. 14 39% 61% 1. Growth of Market from TDM to IP PBX Transition 2. Proliferation of Enterprise Mobility, Voice and Collaboration 3. Leveraging Installed Base Post Acquisition 4. Growth of Software Assurance & Support Revenue 5. Strong Growth in Europe from Weak Competitors |
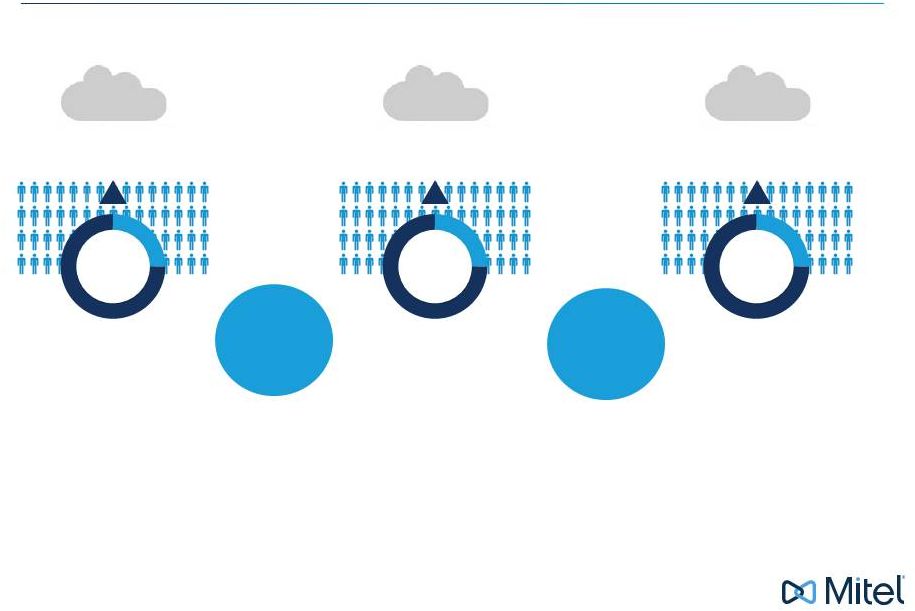
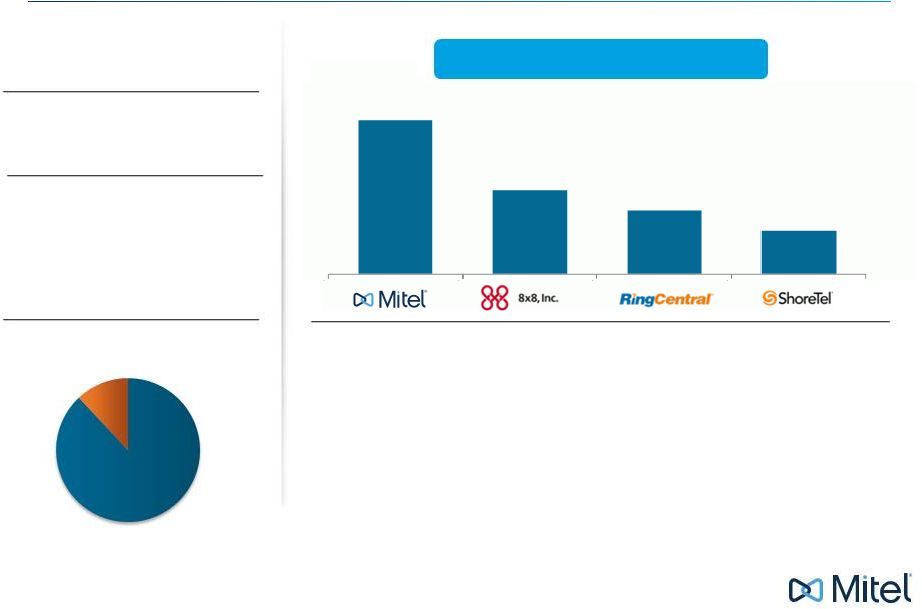 | ©2015 Mitel. Proprietary and Confidential. Mitel Cloud: Fulcrum of Growth $5.0bn Market Size (1) Market Growth (1) ~$100mm Sales Growth Drivers Geographic Mix 1. Growth of Public & Private Cloud 2. Transitioning from PBX to Cloud 3. Massive Scale - A leader in Cloud 4. Decoupling of Software from Proprietary Hardware 5. Large European Base Transitioning to Cloud Number of Cloud Seats (2) (1) Source: IDC. (2) Source: Synergy Research Group as of September 2014. 861 465 357 238 (in thousands) 12% 88% Int’l Americas ~15% 15 |
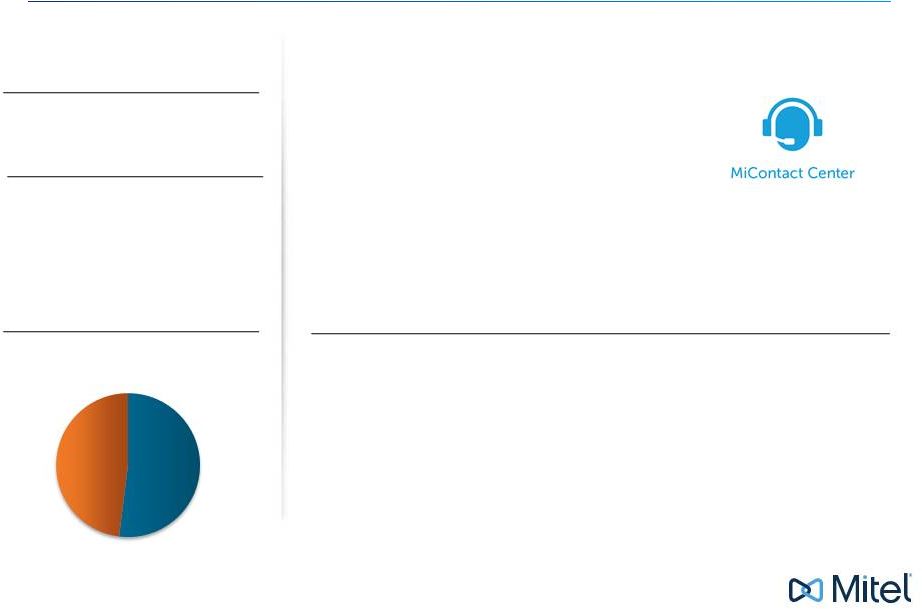 | ©2015 Mitel. Proprietary and Confidential. Mitel Contact Center: Growing Market $2.7bn Market Size (1) ~9% Market Growth (1) $42mm Sales Growth Drivers Geographic Mix 1. 2. 3. Multi-channel inbound/outbound routing Interactive Voice Response Historical, Real Time & Forecast Reports Workforce Optimization CRM integration Agent productivity suite Compatibility with Mitel, third party PBX and Lync Int’l Americas (1) Source: IDC. 48% 52% Offers for mid market (pre-packaged simplicity) and enterprise (scale) MiContact Center Growth of the Market and growth of ARPU Increase Contact Center Attachment to Mitel IPT Attachment of MiContact Center to Lync Enterprise Voice 16 |
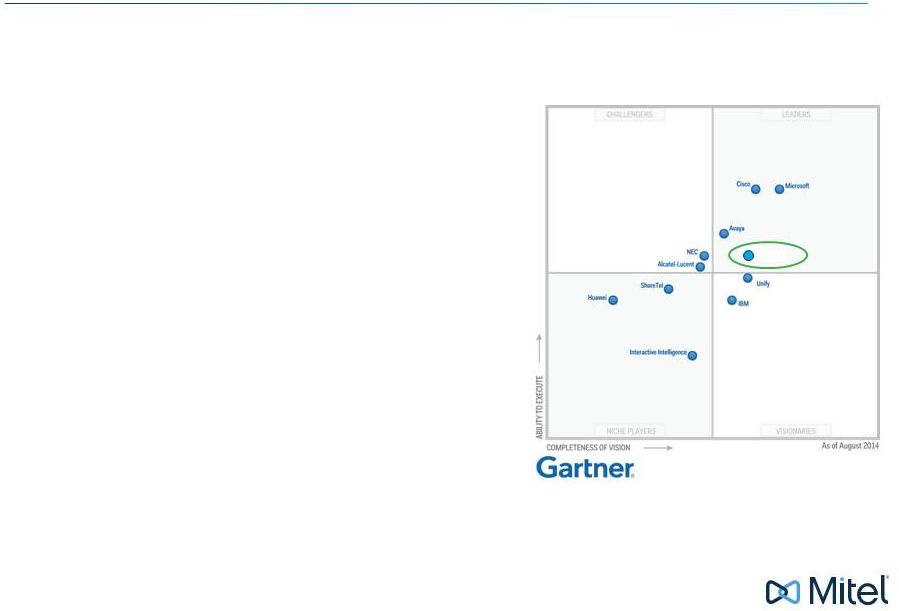 | ©2015 Mitel. Proprietary and Confidential. Mitel Portfolio Differentiation • “Best Path to the Cloud” provides intelligent migration for Mitel’s massive base and cloud selling options for the channel: public; private; and hybrid • Broadest portfolio in the industry comprising strong offers in all business size segments with broad regional strength • Strong capabilities in both public and private mobility provide opportunities for solution differentiation • A “Best of Breed” approach provides differentiation opportunities from “Walled Garden” vendors August 2014 Mitel 17 |
 | ©2015 Mitel. Proprietary and Confidential. Continued Strong Cloud Growth 18 Total Cloud Users – Consists of all cloud users, public or private, whether wholesale or retail, and either sold on a recurring revenue or via a perpetual license Recurring Cloud Users – Customers who purchase Mitel Unified Communications Software As a Service. That software is hosted and delivered directly from us or our global Service Provider partners CY14 $116mm Total Cloud Segment Revenues Recurring Cloud Revenue $85mm 269,000 1,000,000+ Total Seats Installed ~177,400 Q4 Seats Added Note: Pro forma for Aastra acquisition. UP 83% Y-o-Y UP 122% Y-o-Y As of December 2014 Recurring Cloud Seats |
 | ©2015 Mitel. Proprietary and Confidential. Mavenir Business Overview 19 |
 | ©2015 Mitel. Proprietary and Confidential. Mavenir Overview • Wireless pure-play networking solutions provider • A leading provider of mobile voice, messaging and video solutions • Capitalizing on two key network trends • 4G All-IP • Virtualized, scalable software • Customer relationships with 15 of the top 20 mobile global operators • 3 of the top 4 in the US • 3 of the top 4 in Europe • Positioned well to drive growth from transition to 4G/VoLTE • Strong financial profile • CY 2014 Revenue: $129.8 million, up 28.1% vs. CY13 • ~1,100 employees • Growing number of carrier footprint wins 20 |
 | ©2015 Mitel. Proprietary and Confidential. Mavenir – A Leader in Mobility Point S/W-based Solutions Complete S/W Portfolio 21 End to End (proprietary H/W) |
 | ©2015 Mitel. Proprietary and Confidential. Customer Highlights VoLTE/WiFi 17 RCS 17 CORE 23 Growing Roster of Blue Chip 4G Customers • 3 of top 4 operators in the US; 3 of top 4 operators in Europe Diversified 4G Customer Base • Geographically diverse, as well across product lines Strong 2G/3G Customer Base • 15 of top 20 operators globally 2G/3G/4G 130+ Based on Mavenir 2Q2014 data 22 |
 | ©2015 Mitel. Proprietary and Confidential. Strong/Diverse Customer Base 130+ Customers Globally with over 1bn Subscribers Growing Roster of Tier One Customers for Next Generation 4G Solutions 23 |
 | ©2015 Mitel. Proprietary and Confidential. Mavenir’s 4G Solutions Addressing the Opportunity OSS/BSS Billing NMS SLA CRM Voice & Video Telephony Server Enhanced Messaging IMS-PBX IMS Core Network Evolved Packet Core Network Access Network Rich Message Server Presence Server Session Control Session Border Control IMS Centralized Services GW Mobility Management Entity SAE Gateways Evolved Packet Date Gateway LTE Wi-Fi Fixed Cable 1 Best-in-Breed Wireless Applications & Services 2 Fully Virtualized Software Product Portfolio 3 High Performance Media Handling Architecture 4 Optimized E2E LTE Architecture for Voice (R4) 24 |
 | ©2015 Mitel. Proprietary and Confidential. Speed up to 15x faster Services more revenue Savings less cost Spectrum up to 10x better Why 4G LTE is a Necessity 25 |
 | ©2015 Mitel. Proprietary and Confidential. 4G LTE Progress Operators globally 1000+ 801 invested in LTE <5% 445 launched Connections on LTE Source: GSMA, February 2015 2014 – 59.6 million VoLTE subscriptions 2019 – 1.2 billion VoLTE subscriptions Source: ABI June 2014 26 |
 | ©2015 Mitel. Proprietary and Confidential. Reason Why Mavenir’s Business is Sticky Mobile operators typically don't change suppliers over the life of a single generation of technology Higher "stickiness" factor as supplier of application & services due to greater customization and integration with back office infrastructure Very long commercial tender and vendor selection processes (typically 12-18 months) make repeating the process cost prohibitive Mobile operators lack the resources to repeat very long lab validation and network integration cycles (typically up to 24 months) Mobile operator reluctance to admit making a mistake in a major decision such as choosing their 4G supplier 27 |
 Transaction Rationale 28 | ©2015 Mitel. Proprietary and Confidential. |
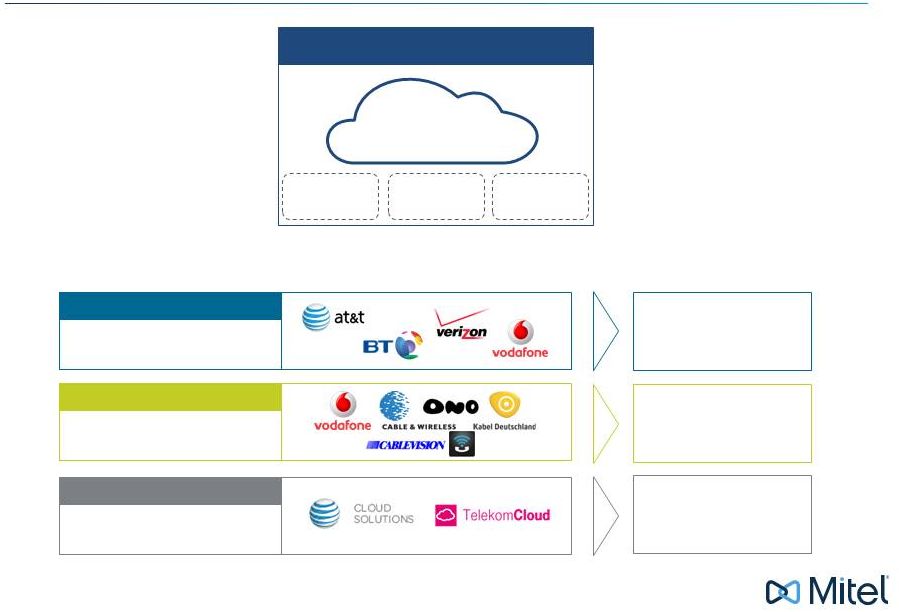
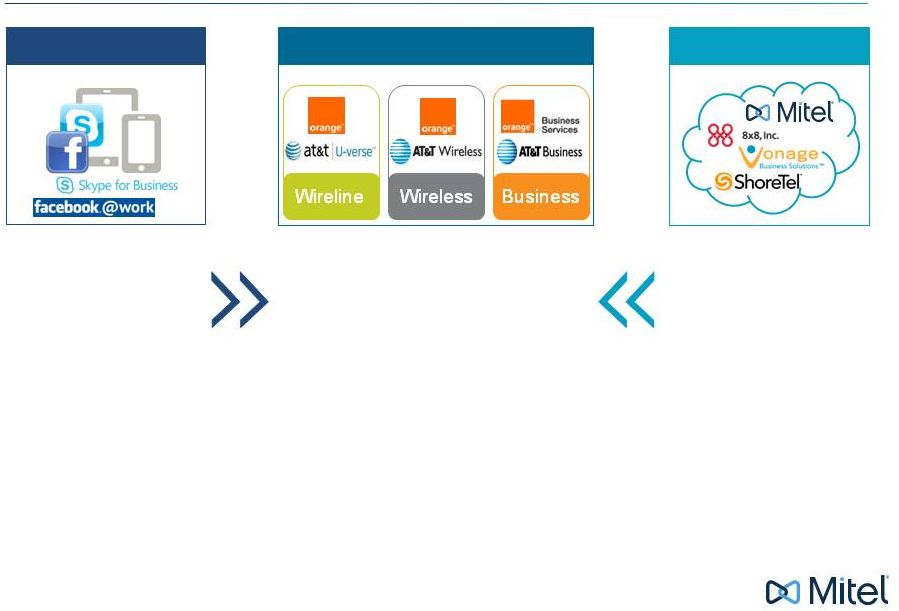  | ©2015 Mitel. Proprietary and Confidential. Market Dynamics Driving Change 29 Commoditization Price Pressure Segmentation New Service Providers Challenging Traditional Operators’ Business & Operating Model Rich services driving usage Expansion into enterprise Mobile apps supporting BYOD Pricing driving residential share Service ubiquity constraints Economy of scale challenges OTT Operators Cloud Telephony |
 | ©2015 Mitel. Proprietary and Confidential. Capitalizing on Two Major Trends 30 Operators are Transforming Cloud Convergence CONVERGENCE Operators Wireline Wireless Business Org Realignment Wireless and Business Units Consolidation New Business Models Network Consolidation Service Ubiquity Adjacency Expansion, Mergers, Technology Rationalization Cloud Virtualization, NFV, SDN, Telco Cloud |
 | ©2015 Mitel. Proprietary and Confidential. Convergence Creating Market Opportunity 31 Business Operator Enterprise #1 EMEA/#3 N.A. PBX/IP PBX #1 Business Cloud Communications GREATER THAN SUM OF ALL PARTS RELATIONSHIP VALUE TECHNOLOGY Valuable Business Features Enterprise Relationships Converged IP Network Incumbent at Operators Mass Market Scale Cloud Infrastructure Consumer #2 VoLTE/RCS Mobile Infrastructure Hosted Business Services Mobility UC Cloud Seats Premise Equipment |
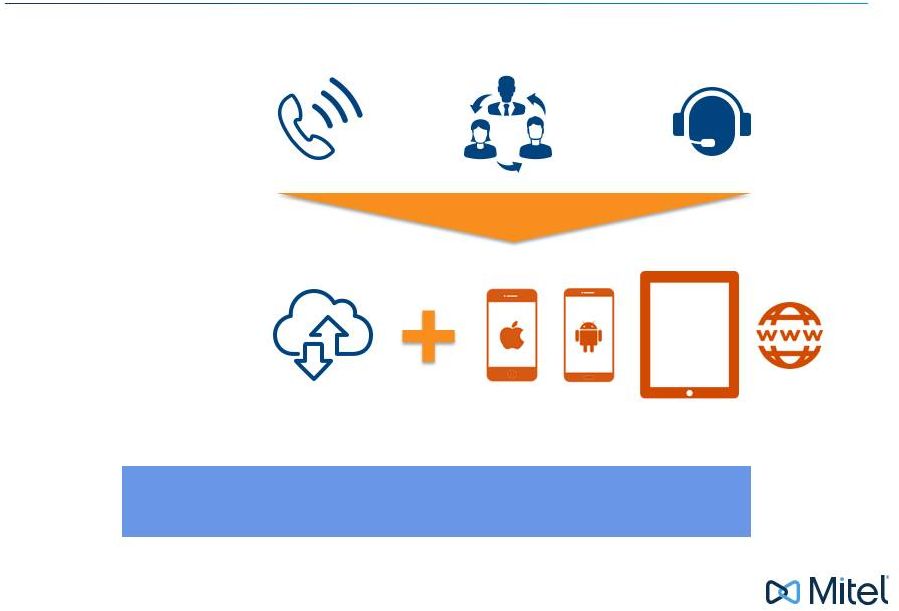 | ©2015 Mitel. Proprietary and Confidential. Mobilization of Unified Communications Collaboration Cloud/Hosted Contact Center Voice/Video SERVICES DELIVERY Mobile 32 Mobilization of Unified Communications Across Industry Verticals and Access Technologies |
 | ©2015 Mitel. Proprietary and Confidential. Mitel • Growth Creates three growth pillars with combined $300mm revenue growing at >20% YoY Cloud + Contact Center + Mobility Supply Operators directly in addition to Enterprises • TAM $14bn increase by 2018 • Portfolio Accelerates Mobile UC evolution Introduces highly scalable mobile platform Mavenir • Scale Grows and diversifies revenue sources ($1bn+) Growth in Sales and Operations to support increased business Expands global presence via Mitel channel partners • Portfolio Introduces feature rich business services Accelerates in-flight Mobile UC and differentiated end-to-end SIP Trunking offer Gains access to robust vertically integrated Enterprise solutions Transaction Benefits 33 |
 | ©2015 Mitel. Proprietary and Confidential. Source: Company filings and Wall Street research. (1) TAM growth includes new Business Services in 2015, which grows from $1.1bn in 2015 to $3.1bn in 2018 at a CAGR of 42%. Voice Expertise Operational Expertise • Differentiated and broadest business IP-voice portfolio in the industry for all business size segments with broad regional strength • Continually expanding margins and increasing profitability; history of successful synergies attainment • Management successfully integrated and realized synergies from multiple acquisitions Execution on Growing Market Mitel Skill Set Premise Cloud • Stable and profitable business • Provides strong cash flow to support high growth Cloud and Carrier Mobility growth • Hardware to software transition • $6.8bn TAM in 2014 growing at ~2% CAGR to $7.6bn in 2018 • Revenues growing at 24% and exceed 10% of quarterly revenue • Positioned to benefit from fast growing market • Public and private cloud • $5.0bn TAM in 2014 growing at ~15% CAGR to $8.7bn in 2018 Mobile Opportunities • Mavenir provides key strategic carrier relationships • Key personnel with expertise in mobile infrastructure • Strong technology and patents • Large and rapidly growing market: $2.6bn TAM in 2014 growing at ~52% CAGR to $14.0bn 2018 (1) • Mitel undergoing successful business transition to Cloud and Contact Center, two rapidly growing markets • Cloud and Contact Center to make up 16% of Mitel revenue in 2015; Contact Center outpacing market growth by 3x • Proven ability to grow faster than market Leveraging Mitel’s Core Skill Sets 34 |
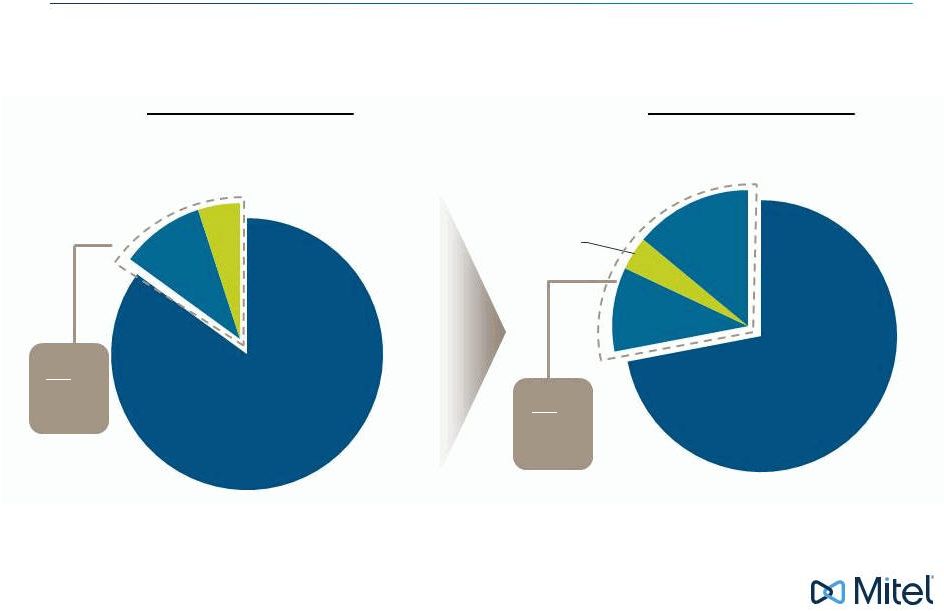
 | ©2015 Mitel. Proprietary and Confidential. Expanding the Market through Combination Source: Dell’Oro, Infonetics, MarketsandMarkets. 35 Additional TAM from Mavenir Mitel Existing TAM ($bn) TAM Expansion Mobility Contact Center Applications Hosted/Cloud Voice and UC Premise Based IP PBX 19% Pro Forma ‘14 – ’18 CAGR 6.8 7.6 5.0 8.7 2.7 3.9 2.6 14.0 $17.1 $34.2 2014 2018 |
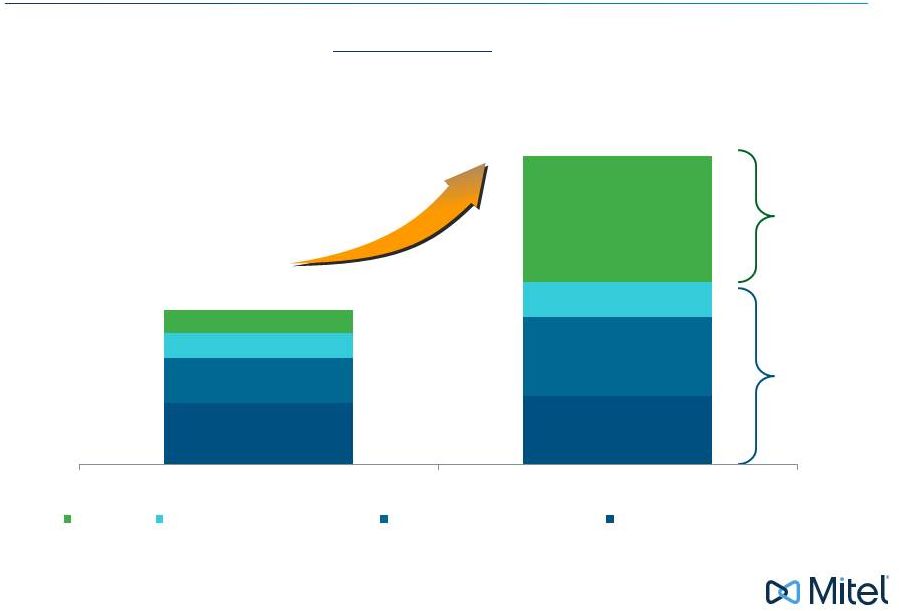
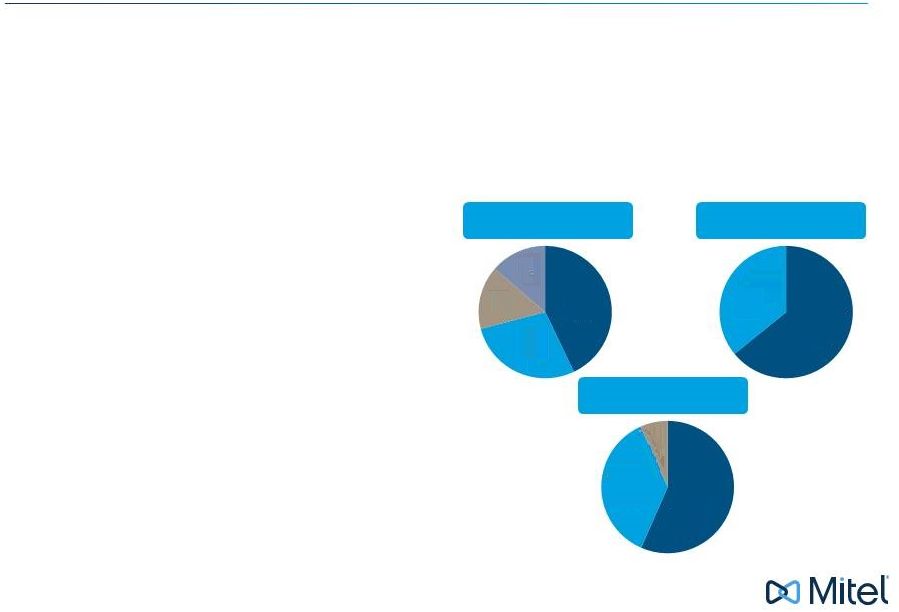
 | ©2015 Mitel. Proprietary and Confidential. Source: Mitel and Mavenir management estimates. Mitel’s Three Strategic Growth Pillars Mobile/Cloud/Contact Center Represent ~30% Rev Mix 36 2015 Before 2015 After Premise Growth Rate: (4%) Cloud + Contact Center Growth Rate >20% Premise Growth Rate: (4%) Cloud + Contact Center + Mobility Growth Rate >20% Contact Center 5% Premise 85% Represent 16% of Revenue in 2015 Represent 28% of Revenue in 2015 Contact Center 4% Premise 72% Cloud 10% Mobility 14% Cloud 10% |
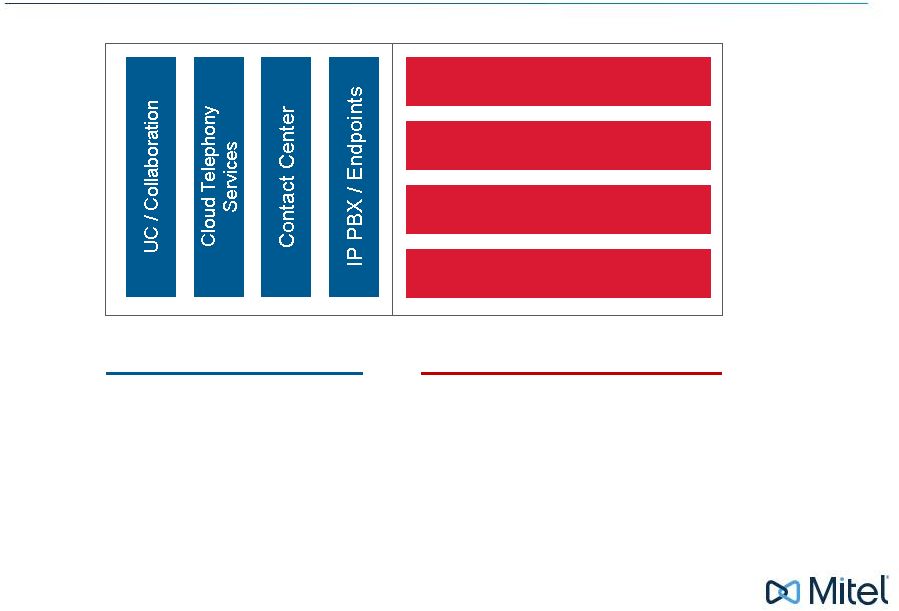 | ©2015 Mitel. Proprietary and Confidential. Mitel / Mavenir Portfolios Mobile 2G / 3G / 4G / Wi-Fi MMTEL & 3GPP Services Converged IP Core Mavenir Mitel • Highly Scalable Mobile Platform • Converged IP Core Network • Wireless & Fixed Network Services • Feature Rich Business Services • Leading Cloud Telephony Services • Broad Industry Vertical Solutions 37 |
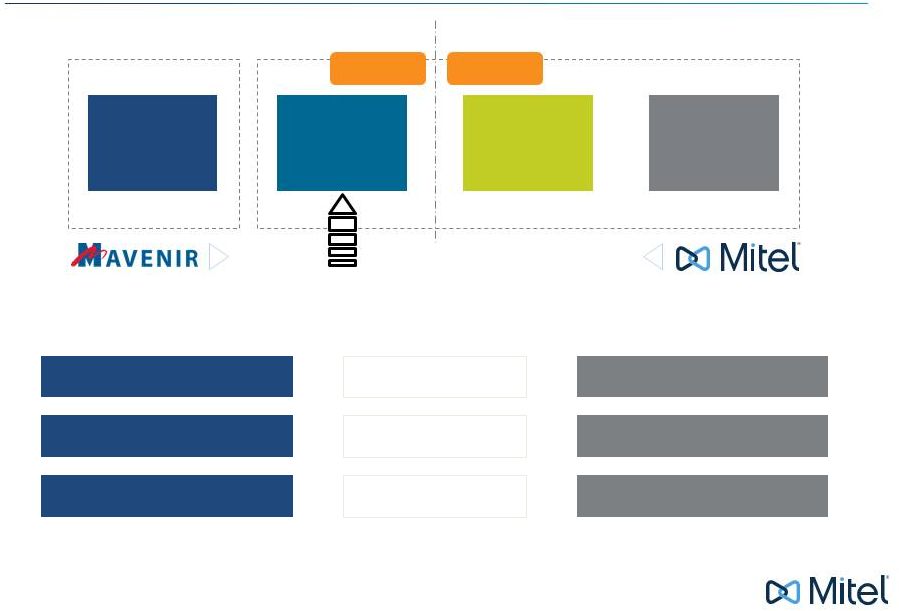
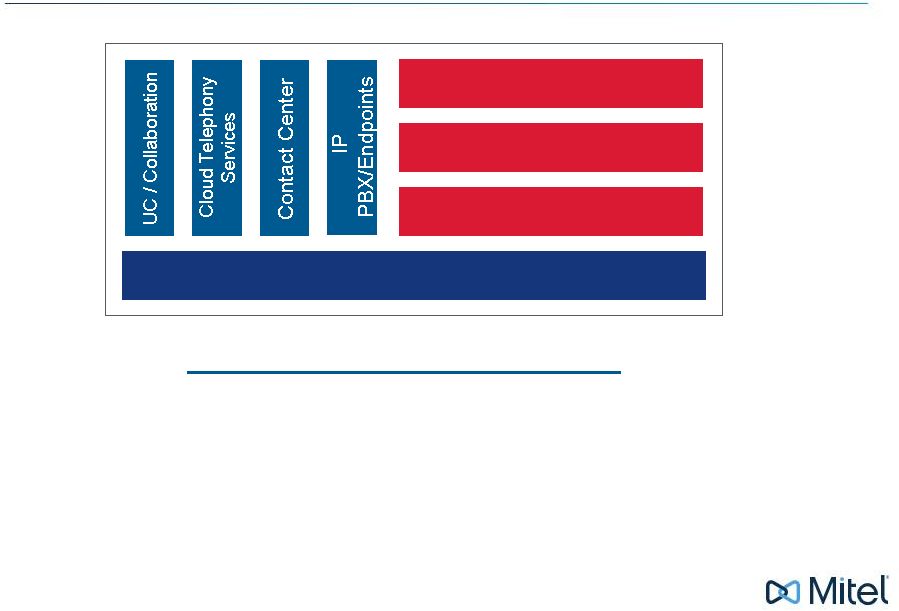 | ©2015 Mitel. Proprietary and Confidential. Mitel + Mavenir Portfolio Addresses Convergence Mobile / Cloud / Fixed 2G / 3G / 4G / Wi-Fi MMTEL & 3GPP Services Converged IP Core Mitel • Highly Scalable Converged Mobile & Fixed Platform • Broad Range of Fixed/Cloud Mobile Business Services • Suite of Converged IP Core Networking Solutions • Broad Industry Vertical Solutions 38 |
 | ©2015 Mitel. Proprietary and Confidential. Financial Overview 39 |
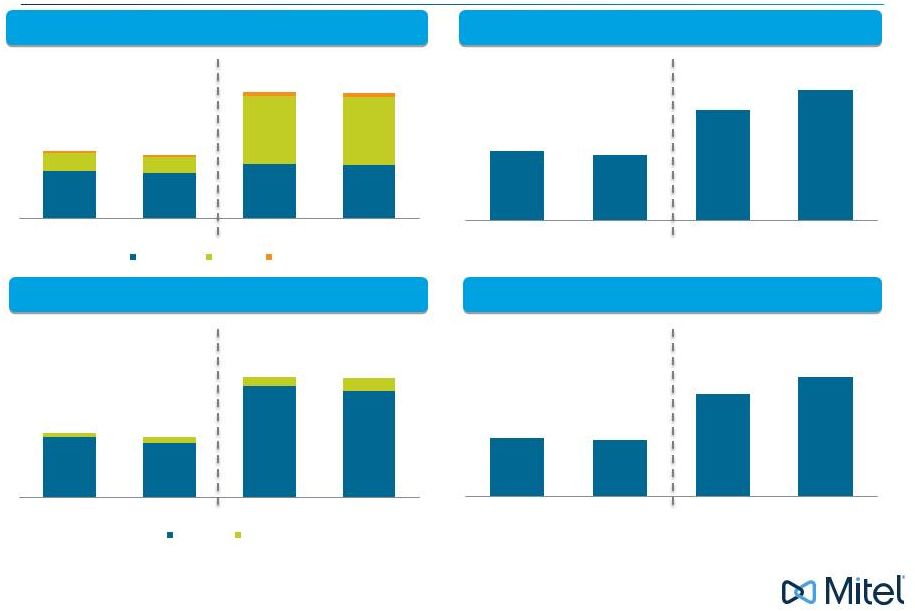 | ©2015 Mitel. Proprietary and Confidential. Note: On 3/31/2014, Mitel announced the changing of FYE from April 30 to December 31 . Numbers may not sum due to rounding. (1) CY 13 and CY 14 results are pro forma for Aastra acquisition. (2) Pro Forma adjusted EBITDA for Mitel includes the results of Aastra from the date of acquisition of January 31, 2014 (11 months) and does not include Aastra's January 2014 results. Mitel Historical Financial Overview $1,156 $1,140 $612 $577 $1,140 $612 ($ in millions) ($ in millions) ($ in millions) ($ in millions) $577 $1,156 (1) (1) (1) (1) (1) (1) 40 FY 12 FY 13 CY 13 CY 14 Americas EMEA APAC $429 $412 $498 $489 $163 $149 $621 $614 $20 $16 $36 $37 Revenue by Geography (1) (1) (2) $88 $84 $141 $167 FY 12 FY 13 CY 13 CY 14 Historical Adjusted EBITDA Revenue by Segment EBITDA Less Cash Capital Expenditures FY 12 FY 13 CY 13 CY 14 Premise Cloud $579 $524 $1,063 $1,024 $33 $53 $93 $116 $74 $72 $130 $153 FY 12 FY 13 CY 13 CY 14 th st |
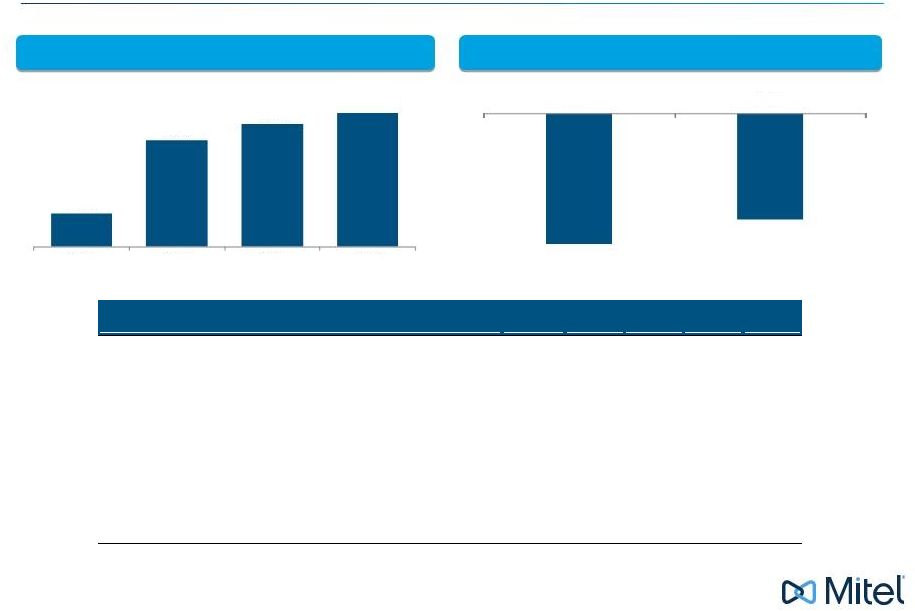
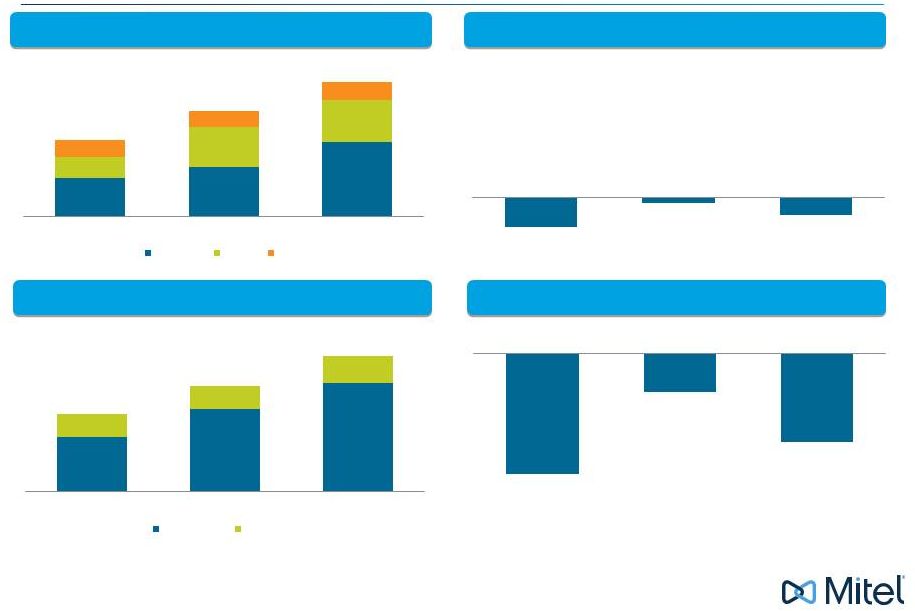 | ©2015 Mitel. Proprietary and Confidential. Mavenir Historical Financial Overview $74 $101 $130 $74 $101 $130 ($ in millions) ($ in millions) ($ in millions) ($ in millions) Note: Mavenir fiscal year ends December 31 st . Numbers may not sum due to rounding. 41 FY 2012 FY 2013 FY 2014 Americas EMEA APAC $37 $48 $71 $21 $38 $41 $16 $15 $18 FY 2012 FY 2013 FY 2014 ($10) ($2) ($6) Revenue by Geography Historical Adjusted EBITDA Revenue by Segment EBITDA Less Cash Capital Expenditures Software Maintenance $52 $79 $104 $21 $22 $26 FY 2012 FY 2013 FY 2014 ($15) ($5) ($11) FY 2012 FY 2013 FY 2014 |
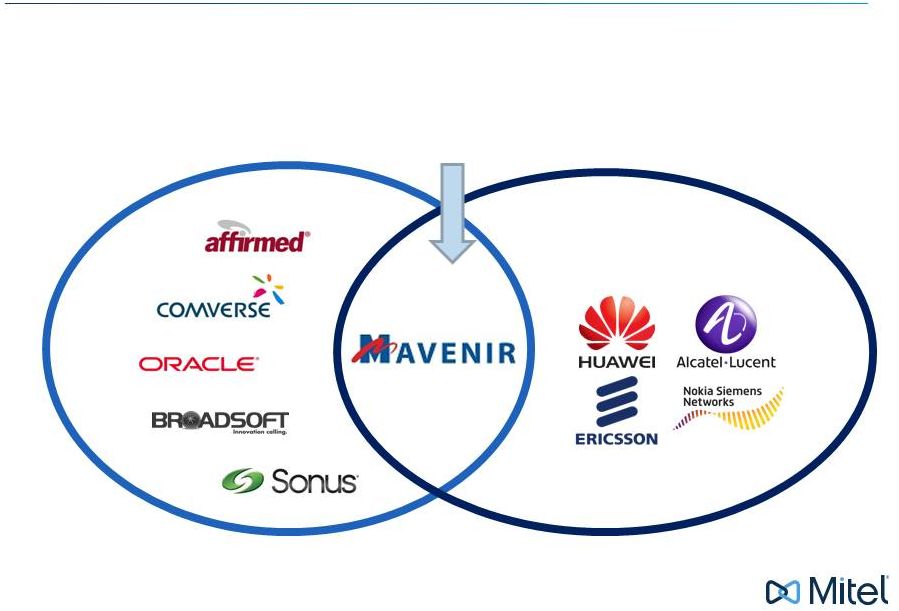
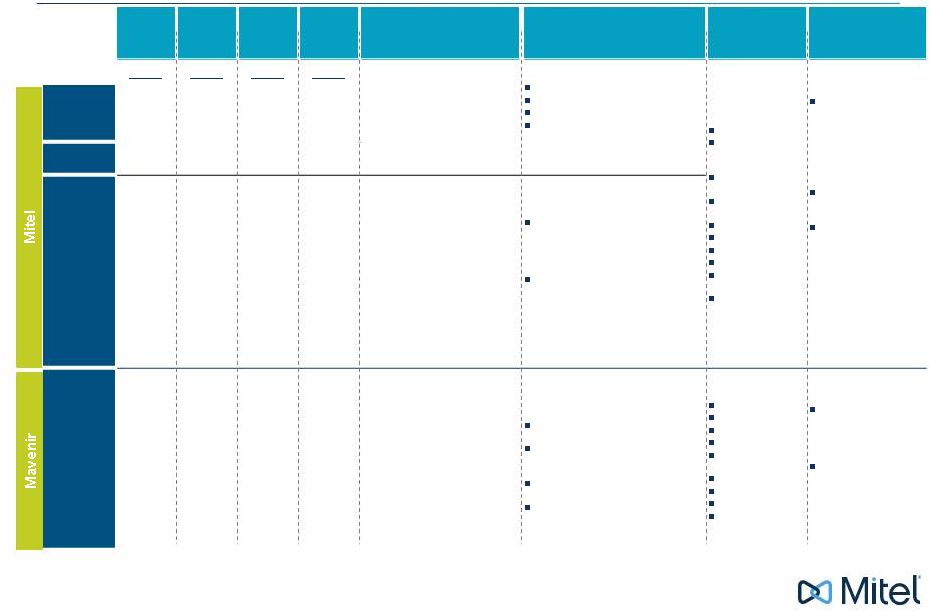 | ©2015 Mitel. Proprietary and Confidential. Revenue ($mm) % of Revenues Gross Margin % of Gross Margin Outlook Description Customers Competitors CY 14 CY 14 CY 14 CY 14 Premise Based IP PBX 2014 TAM: $6.8B ’14-’18 CAGR: ~2% Contact Center Applications 2014 TAM: $2.7B 14-’18 CAGR: ~9% Premise-based IP platforms TDM telephony platforms Desktop devices Unified communications and collaboration and contact center applications Allstate Department of Foreign Affairs, Canada NYC Department of Education Iowa State University Marks & Spencer Operation Smile Rimini Street Team Sport United States Postal Service United Way Traditional IP Communications Vendors: Avaya, Cisco Systems, Alcatel-Lucent, NEC, Panasonic, ShoreTel, Unify (Siemens Enterprise Networks), Toshiba Software Vendors (UCC Market): Microsoft, Google Cloud Vendors: AT&T, Avaya, Broadsoft, CBeyond, Cisco Systems, 8X8, J2 Global, Ring Central, Sprint Nextel, ShoreTel, Unify, U.S. Telepacific, Verizon, Vonage, West IP Communications, XO Holding Premise Based IP PBX $1023.8 80.6% 53.3% 80.7% Contact Center Hosted /Cloud Voice and UC $116.1 9.1% 50.3% 8.6% Hosted /Cloud Voice and UC 2014 TAM: $5.0B ’14-’18 CAGR: ~15% MiCloud – Retail Cloud Offering: Hosted cloud & related services, UCC applications, voice & data telecommunications and desktop devices Powered by Mitel – Wholesale Offering: PBX, voice & video calling, SIP Trunking, voicemail, call center, audio conferencing and video & web collaboration services Mobility $129.8 10.2% 55.7% 10.7% Mobility 2014 TAM: $2.6B ’14-’18 CAGR: ~52% Rich communications and cloud-based services: Carrier-grade, integrated communication services IP-based voice, video, rich communications and enhanced messaging services Single identity across multiple devices and services Interworking with legacy SMS AT&T Deutsche Telekom H3 MTS MetroPCS / T- Mobile Orange Tele2 Telestra Vodafone Network Infrastructure Providers: Alcatel- Lucent, Ericsson, Nokia Siemens Networks, Huawei Specialty Solution Providers: Acme Packet, Broadsoft, Sonus Networks, Metaswitch, Comverse, Acision 42 Combined Company Overview (1) CY 14 is pro forma for Aastra acquisition. (2) Source: IDC. (2) (2) (2) (1) (1) (1) (1) |
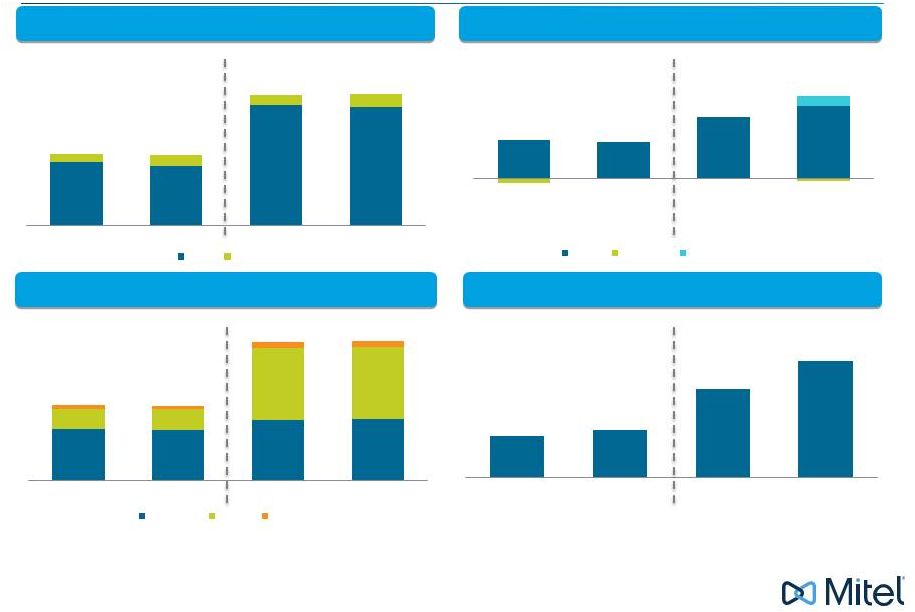 | ©2015 Mitel. Proprietary and Confidential. (1) FY 13 and FY 14 Mitel results are for the 12 months ended April 30 th and Mavenir results are for the 12 months ended December 31 st . (2) CY 13 and CY 14 Mitel results are pro forma for Aastra acquisition. (3) Pro forma adjusted EBITDA for Mitel includes the results of Aastra from the date of acquisition of January 31, 2014 (11 months) and does not include Aastra's January 2014 results. (4) Pro forma for purchase price accounting adjustment related to the fair value of deferred revenue. Pro Forma Historical Financial Overview Historical Adjusted EBITDA Revenue by Geography Revenue by Company EBITDA Less Cash Capital Expenditures $1,257 $1,266 $686 $678 $1,266 $686 ($ in millions) ($ in millions) ($ in millions) ($ in millions) $678 $1,257 $78 $82 $139 $184 (2) (2) (2) (2) (2) (2) (2) (2) (1) (1) (1) (1) (1) (1) (1) (1) (4) (4) (3) 43 $88 $84 $141 $167 $(10) $(2) $(2) $(6) $23 FY 12 FY 13 CY 13 CY 14 Mitel Mavenir Synergies Adjustment $ 59 $ 67 $ 125 $ 165 FY 12 FY 13 CY 13 CY 14 $466 $460 $547 $556 $184 $187 $660 $655 $36 $31 $51 $54 FY 12 FY 13 CY 13 CY 14 Americas EMEA APAC $612 $577 $1,156 $1,140 $74 $101 $101 $126 FY 12 FY 13 CY 13 CY 14 Mitel Mavenir Note: On 3/31/2014, Mitel announced the changing of FYE from April 30 th to December 31 st . Mavenir fiscal year ends December 31 st . Numbers may not sum due to rounding. |
 | ©2015 Mitel. Proprietary and Confidential. Synergy Realization from Mavenir 44 ($ in millions) ($ in millions) ($ in millions) Synergy P&L Item 2015 2016 2017 2018 Replace Sonus SBC used in Mitel Cloud data centers with Mavenir COGS $ 0.1 $ 0.3 $ 0.3 $ 0.3 3rd party product cost avoidance COGS - 2.0 3.0 5.0 G&A overlap G&A - 1.8 3.5 3.5 Eliminate duplicate public company costs G&A 0.2 0.4 0.4 0.4 Insource Mitel HCL and Wipro R&D in India R&D 0.5 3.3 3.3 3.3 Leverage low cost R&D capabilities in India R&D 2.5 4.8 4.8 4.8 Eliminate duplicate facility spend R&D 0.5 1.0 1.0 1.0 R&D cost avoidance re: mobile PBX (leverage Mitel's Telepo solution) R&D 2.0 5.0 5.0 5.0 Estimated Synergies $5.8 $18.7 $21.4 $23.4 Estimated Synergies Estimated Cost to Execute Synergies ($14.5) ($11.8) 2015 2016 $5.8 $18.7 $21.4 $23.4 2015 2016 2017 2018 |
 | ©2015 Mitel. Proprietary and Confidential. Aastra Synergy Update • Continually expanding margins and increasing profitability; history of successful synergy attainment • Management has successfully integrated and realized synergies from multiple acquisitions, including the January 2014 acquisition of Aastra • Disciplined approach to integration: • Integration Management Office (IMO) steering committee removes roadblocks, sets tone, ensures cultural mesh, and monitors for success • Weekly status calls including VP IMO and integration team leads ensures commitment timelines and synergy targets • Utilizes Bain toolset and best practices Synergy Realization for Aastra Acquisition • Initial estimate at time of acquisition in January 2014 was for $50M in synergies to be realized by 2016 • In May 2014 the initial synergy estimate was increased 50% to $75M • As of 12/31/14, Mitel had already actioned annualized synergies of $73mm Mitel Operational Excellence Total: $73mm Deleveraging Post Aastra Acquisition • As a result of the better than expected synergies and strong free cash flow, Mitel has repaid ~$75mm of the $355mm TLB raised in 2014 45 Note: Represents executed synergies and related costs for 2014 only. Synergies Breakdown by Department ($mm) Synergies Breakdown by Category ($mm) G&A $ 10 14% COGS $ 31 43% S&M $ 21 28% R&D $ 11 15% Cost to Execute Synergies: $62mm Non- Headcount $26 36% Headcount (HC) $47 64% Facility restructuring $ 4 7% Integration costs $ 23 37% Severance $ 35 56% |
 | ©2015 Mitel. Proprietary and Confidential. Key Credit Highlights 46 |
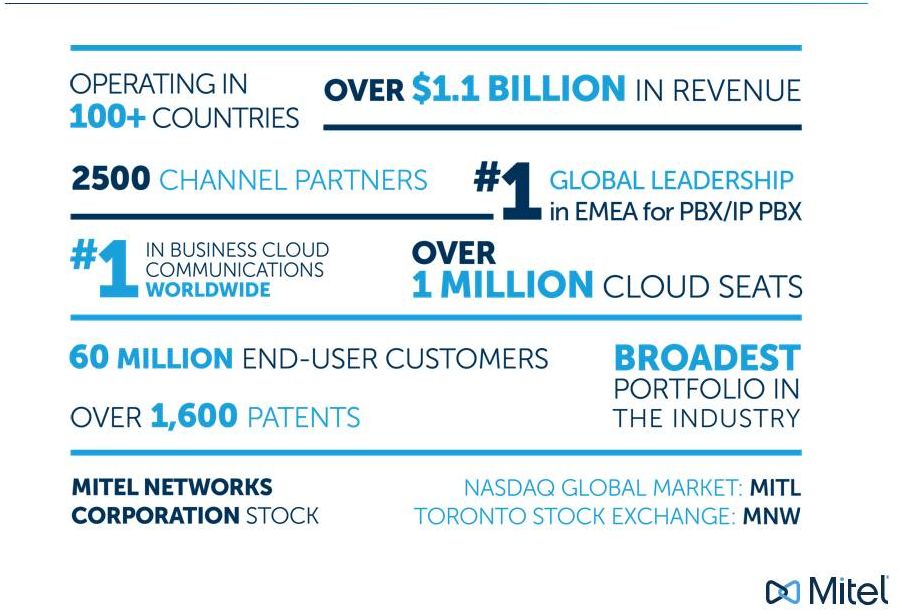
 | ©2015 Mitel. Proprietary and Confidential. Credit Highlights 47 Enhanced Scale Strong Technology Leadership Well Positioned to Address Convergence • Combined Company becomes a leader in next generation enterprise, mobile and cloud communications • Mitel – 1mm+ cloud seats, 2,500 channel partners, $1.1bn revenue, 60mm+ end-user customers • Mavenir – Partners with 3 of the top 4 operators in the US, 3 of the top 4 in Europe, and 15 of the top 20 globally, $130mm revenue growing at 30%, 130+ customers and over 1bn 4G subscribers under contract • Mitel's voice expertise • Differentiated and broadest enterprise IP-voice portfolio in the industry for all business size segments with broad regional strength; 1,600+ patents • Mavenir's mobile expertise • Best-in-breed wireless applications & services • Fully virtualized software product portfolio • High performance media handling architecture for SBC, EPC • Optimized E2E LTE architecture for VoLTE • Positioned to capitalize on the evolution in the service provider landscape through the convergence of enterprise and mobile communications and the evolution of software based networks • Mitel is #1 in Business Cloud Communications and #1 EMEA/#3 N.A./#3 Globally (ex-Asia) in PBX/IP PBX • Mavenir is a global leader in VoLTE/RCS |
 Credit Highlights (cont’d) Mitel Execution in Growing Markets • Mitel undergoing successful expansion into Cloud and Contact Center, two rapidly growing markets • Cloud and Contact Center expected to make up 16% of Mitel revenue in 2015; Contact Center outpacing market growth by 3x • Proven ability to grow faster than market Mitel / Mavenir Attractive End Markets • Premise: $6.8bn market in 2014 growing at ~2% CAGR to $7.6bn in 2018 • Cloud: $5.0bn market in 2014 growing at ~15% CAGR to $8.7bn in 2018 • Mobile: $2.6bn market in 2014 growing at ~52% CAGR to $14.0bn in 2018 (2) • Contact Center: $2.7bn TAM in 2014 growing at ~9% CAGR to $3.9bn in 2018 Mitel Operational Excellence • Strong track record of expanding margins and increasing profitability • Management successfully integrated and realized synergies from multiple acquisitions (e.g., Aastra) • Significant scale increase from LTM revenue of $580mm before Aastra acquisition to $1.1bn currently • Well received deleveraging through debt paydown: 2.6x at Aastra acquisition to current 1.5x (1) Source: IDC, Management Presentation, Company filings. (1) Indicates Debt/LTM EBITDA per 12/31/14 compliance certificate. (2) TAM growth includes new Business Services in 2015, which grows from $1.1bn in 2015 to $3.1bn in 2018 at a CAGR of 42%. 48 | ©2015 Mitel. Proprietary and Confidential. |
 | ©2015 Mitel. Proprietary and Confidential. Appendix 49 |
 | ©2015 Mitel. Proprietary and Confidential. Adjusted EBITDA Reconciliation (1) Pro forma adjusted EBITDA for Mitel includes the results of Aastra from the date of acquisition of January 31, 2014 (11 months) and does not include Aastra's January 2014 results. 50 ($ in millions) Fiscal Year Ended December 31, 2014 Mitel Mitel Net Income (Loss) $ (7.3) Interest expense 21.0 Income tax expense (recovery) (22.9) Foreign exchange loss (gain) (3.9) Debt and warrant retirement costs 16.2 Amortization and depreciation 75.9 EBITDA 79.0 Special charges and restructuring costs 72.7 Stock-based compensation 6.1 Acquisition accounting for deferred revenue 9.1 Mitel Adjusted EBITDA (1) $ 166.9 Mavenir Mavenir Net Income (Loss) $ (26.0) Interest expense 2.0 Income tax expense (recovery) 0.5 Amortization and depreciation 5.4 EBITDA (18.1) Loss on early extinguishment of debt 1.8 Foreign exchange loss (gain) 4.7 Stock-based compensation 4.6 Acquisition related transaction and restructuring costs 0.8 Mavenir Adjusted EBITDA $ (6.3) Pro Forma Combined Company Adjusted EBITDA before Synergies $ 160.6 Mavenir synergies adjustment 23.4 Adjusted EBITDA post Synergies $ 184.0 |