UNITED STATES
SECURITIES AND EXCHANGE COMMISSION
Washington, D.C. 20549
FORM N-CSR
CERTIFIED SHAREHOLDER REPORT OF REGISTERED
MANAGEMENT INVESTMENT COMPANIES
Investment Company Act file number | 811-21902 |
|
Cohen & Steers Institutional Global Realty Shares, Inc. |
(Exact name of registrant as specified in charter) |
|
280 Park Avenue, New York, NY | | 10017 |
(Address of principal executive offices) | | (Zip code) |
|
Tina M. Payne Cohen & Steers Capital Management, Inc. 280 Park Avenue New York, New York 10017 |
(Name and address of agent for service) |
|
Registrant’s telephone number, including area code: | (212) 832-3232 | |
|
Date of fiscal year end: | December 31 | |
|
Date of reporting period: | December 31, 2012 | |
| | | | | | | | |
Item 1. Reports to Stockholders.
COHEN & STEERS INSTITUTIONAL GLOBAL REALTY SHARES, INC.
To Our Shareholders:
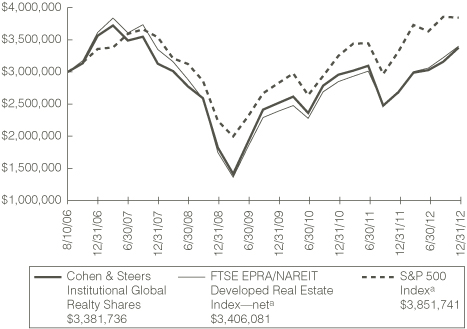
We would like to share with you our report for the year ended December 31, 2012. The net asset value (NAV) at that date was $22.28 per share.
The total returns, including income and change in NAV, for the Fund and its comparative benchmarks were:
| | | Six Months Ended
December 31, 2012 | | Year Ended
December 31, 2012 | |
Cohen & Steers Institutional Global Realty
Shares | | | 11.67 | % | | | 25.91 | % | |
FTSE EPRA/NAREIT Developed Real Estate
Index—neta | | | 11.25 | % | | | 27.73 | % | |
S&P 500 Indexa | | | 5.95 | % | | | 16.00 | % | |
The performance data quoted represent past performance. Past performance is no guarantee of future results. The investment return and the principal value of an investment will fluctuate and shares, if redeemed, may be worth more or less than their original cost. Current performance may be lower or higher than the performance data quoted. Current total returns of the Fund can be obtained by visiting our website at cohenandsteers.com. The Fund's returns assume the reinvestment of all dividends and distributions at NAV. Fund performance reflects fee waivers and/or expense reimbursements, without which the performance would have been lower. Index performance does not reflect the deduction of any fees, taxes or expenses. An investor cannot invest directly in an index. Performance figures for periods shorter than one year are not annualized.
The Fund implements fair value pricing when the daily change in a specific U.S. market index exceeds a predetermined percentage. Fair value pricing adjusts the valuation of certain non-U.S. holdings to account for such index change following the close of foreign markets. This standard practice has been adopted by a majority of the fund industry. In the event fair value pricing is implemented on the first and/or last day of a performance measurement period, the Fund's return may diverge from the relative performance of its benchmark index, which does not use fair value pricing.
Please note that distributions paid by the Fund to shareholders are subject to recharacterization for tax purposes and are taxable up to the amount of the Fund's investment company taxable income and net realized gains. Distributions in excess of the Fund's investment company taxable income and realized gains are a return of capital distributed from the Fund's assets.
a The FTSE EPRA/NAREIT Developed Real Estate Index is an unmanaged portfolio of approximately 295 constituents from 20 countries and is net of dividend withholding taxes. The S&P 500 Index is an unmanaged index of common stocks that is frequently used as a general measure of stock market performance.
1
COHEN & STEERS INSTITUTIONAL GLOBAL REALTY SHARES, INC.
Investment Review
Global real estate securities had an exceptional year in 2012. Markets in Asia Pacific and Europe saw sharp reversals from their losses in the previous year, while the United States continued to produce strong total returns. The category significantly outperformed global equity markets, as demand for real estate improved despite relatively meager economic growth. The trend of easing monetary policy was particularly beneficial to real estate companies: declining interest rates helped drive property prices higher, while the low cost of capital reduced interest expense and made acquisitions more attractive. Commercial real estate also saw a significant influx of capital from investors seeking the stability of high-quality, income-generating assets.
The year started with a sharp rally amid encouraging U.S. economic data and expectations of policy easing in China. Europe also offered positive news, as government and central bank authorities negotiated a restructuring of Greece's debt and provided liquidity to the region's banks. Markets turned volatile in the second quarter due to uncertainty surrounding the fate of Europe's currency union, but recovered as European Union officials took steps to ease the strain on sovereign balance sheets. As the global economy continued to languish, central banks stepped up their efforts to stimulate growth through lower interest rates and quantitative easing measures. The rally continued into the fourth quarter, as signs of economic stabilization in China mitigated one of the key risks to global growth.
North America continued to produce strong returns
U.S. REITs (18.1% total returnb) marked their fourth consecutive year of solid returns, benefiting from modest demand growth met with scant new supply creation. As the Federal Reserve kept interest rates low and expanded the monetary base, REITs' funding costs declined across the quality spectrum, creating a generally favorable operating environment.
All U.S. property sectors had positive returns, led by industrial (31.3%), regional mall (28.2%) and shopping center (25.0%) owners. These sectors benefited from strong demand from retailers as consumer spending improved, aided by early signs of a recovery in the housing market. In contrast, the apartment sector (6.9%) underperformed after a strong run in recent years, as investors took profits in anticipation that an improving housing market could lessen the demand for rental units. Despite these concerns, operating fundamentals for apartments continued at a solid pace, as continued job growth and climbing rent and occupancy levels drove strong revenue growth.
The office sector (14.2%) was restrained by a softer demand outlook, particularly in Washington, D.C., and New York, which were overshadowed by uncertainty in the government and financial sectors, respectively. These worries also weighed on Vornado Realty in the diversified property sector (12.2%), as the company owns offices in both markets.
Canada (16.8%c) exceeded its market-leading performance in 2011, helped by a relatively resilient economy and high relative dividend yields. However, concerns grew about its banking system amid
b U.S. country and sector returns as measured by the FTSE NAREIT Equity REIT Index.
c Country returns are in local currencies as measured by the FTSE EPRA/NAREIT Developed Real Estate Index.
2
COHEN & STEERS INSTITUTIONAL GLOBAL REALTY SHARES, INC.
fears of declining home prices and high consumer debt. The western provinces generally exhibited stronger demand across all property types due to the boom in natural resources.
Europe gained amid easing euro concerns
Within European markets, the U.K. (29.9%), France (36.0%) and Germany (38.8%) outperformed, due mostly to their better market liquidity and larger, higher-quality companies. Prime offices in London's West End and Paris's central business district saw strong tenant demand, which helped push rents to multi-year highs despite the broader economic gloom. Germany's residential sector was another area of impressive strength due to low unemployment, rising household formation and low relative rents. These companies also benefited from the growing demand for high-quality assets paying relatively high dividend yields.
Switzerland (13.0%) steadily underperformed throughout much of the year, as investors favored other markets with more attractive valuations. The Netherlands (8.9%) was also relatively subdued due to concerns about companies' exposure to southern Europe and secondary real estate. Scandinavian markets were somewhat more volatile from month to month, but ended with solid returns, as their economies were generally more resistant to the sovereign-debt crisis.
Asia Pacific rebounded as China's outlook improved
Coming into the year, fears of a sharp slowdown in China's economy weighed heavily on investor sentiment. But as the country's growth trends stabilized, markets throughout the region surged. In Hong Kong (43.4%), REITs benefited from investor demand for yield and expectations of improving office fundamentals. Among developers, valuations recovered from very depressed levels due to increased global liquidity, driven largely by the U.S. Federal Reserve's quantitative easing measures. Demand for residential properties was unrelenting, helping to drive earnings growth despite government efforts to restrain speculative home purchases.
Singapore (55.8%) also benefited from China's improving outlook. The country also saw its role grow as a financial hub, fueling demand for offices and industrial properties as foreign companies sought to grow their presence in the region. The recovery was most significant among development companies that demonstrated flexibility in adapting their businesses to shifts in government policy.
Japan (68.2%) led all developed property markets and dwarfed the returns of most other Japanese equities. Developers in particular benefited from growing political pressure for greater monetary and fiscal stimulus to deal with the country's persistent deflation problem. This movement culminated in a sweeping victory by the pro-business Liberal Democratic Party (LDP) in December, which was well-received by investors. J-REITs were a large part of the Bank of Japan's continuing asset purchase program, which provided further support to share prices.
Australia (32.2%) had been more reluctant to lower interest rates than many other developed countries, but relented during the year amid concerns over global demand for raw materials and sluggish growth in consumer spending. The interest-rate cuts were seen as most likely to benefit residential companies. Owners of industrial properties did well, while the office sector largely underperformed.
3
COHEN & STEERS INSTITUTIONAL GLOBAL REALTY SHARES, INC.
Fund performance
The Fund had a positive return for the year, but underperformed its benchmark, due mostly to unfavorable stock selection in Hong Kong. While our Hong Kong allocation had a strong return in absolute terms, we did not have enough exposure to the best performers. In addition, our overweight in Sun Hung Kai Properties (one of the world's largest real estate developers) hindered performance, as the shares were pressured after the company's co-chairmen were detained in March on suspicion of bribery. Other detractors included both stock selection and our underweights in Singapore and Australia.
Our underweight in Japan also hindered relative returns. However, the underweight provided a positive currency effect due to depreciation in the yen during the period. Our stock selection in the country also helped performance, as we generally favored developers over J-REITs. As a result, stock selection and currency factors more than offset the negative effect of our underweight. Our allocation to emerging markets, which are not included in the index, had a positive effect on absolute and relative returns, especially our positions in China and the Philippines.
Investment Outlook
Given the accommodative policies of nearly every central bank, along with what we expect to be modest expansion for the global economy, we believe real estate securities continue to offer potential for attractive total returns in 2013. We are finding opportunities in nearly every market, and continue to recommend a globally diversified approach to real estate allocations. Overall, we favor Asia Pacific based on relative value, while remaining more selective in North America.
We expect continued cash flow growth for U.S. REITs
U.S. REITs continue to exhibit strong access to capital, and have been using this access to issue equity and debt at historically low rates. We believe the combination of continued low financing costs and very limited new supply will enable companies to see continued cash flow growth, as long as the economy continues on its path of modest expansion.
With most U.S. REITs trading near parity to NAV, our focus is on companies with valuations that, in our view, do not reflect their strong cash flow growth potential. Among property sectors, we continue to like Class A malls, self storage, well-positioned industrial assets and offices on the West Coast. We have also added incrementally to companies that we believe are likely to benefit from the housing recovery and potential cap-rate compression. Furthermore, we retain a favorable outlook on apartment REITs, as we believe new-home construction will not be strong enough to absorb the increasing demand for rental units, provided that job creation and household formation continue to improve.
Canada remains our largest underweight by country despite its relatively stable economy, as valuations appear full relative to our muted cash flow and dividend growth estimates. This view is based on our expectation of slowing investment volumes, reduced leverage and payout ratios, diminishing benefits from refinancing activity and acceleration in new development.
Our focus in Europe remains on high-quality assets
Despite what is likely to be a very difficult economic climate in the coming year, we continue to find attractive opportunities in Europe, as valuations for many property companies remain at discounts to
4
COHEN & STEERS INSTITUTIONAL GLOBAL REALTY SHARES, INC.
underlying NAVs. Furthermore, we believe interest rates are likely to stay at historically low levels for the foreseeable future and could go even lower with additional quantitative easing. On the other hand, real estate finance remains constrained, as most banks must reduce the size of their balance sheets and refinance sizeable debt maturities. We are also cognizant of further downside risks to economic growth.
Given this difficult environment, we continue to focus on companies that own high-quality real estate portfolios, as we expect the growing polarization between prime and secondary assets to be a meaningful driver in returns. From a regional perspective, we continue to favor prime office and retail assets in London, particularly in the West End, where rents are rising and supply is limited. We also like owners of high-quality pan-European retail portfolios. We continue to see opportunities in Scandinavia given its generally healthier economic growth, better fiscal outlook and more-active lending environment. Finally, we remain positive on the German residential market, as fundamentals continue to be very strong.
China recovery likely to drive Asia Pacific markets
While valuations are no longer at the extreme discounts seen at the end of 2011, we believe Asia Pacific (ex Japan) remains compelling, with little risk of a return to tighter policies, in our view, due to continued global economic uncertainty and generally modest inflation. We have become more positive on Japan, but we remain cautious on valuations following the recent run-up.
We believe Hong Kong office and retail landlords continue to offer some of the most attractive opportunities on a relative-value basis. We continue to see value in office landlords due to tight supply conditions, improving demand, reasonable valuations and the prospect of higher occupancy rates. Developers continue to face the risk of new residential policy tightening, but we expect the group to continue to benefit from strong sales activity and low, stable mortgage spreads. Growth in the retail sector has declined over the past year, but we believe improving conditions in China will help tourist spending recover.
In Singapore, we continue to focus on sectors such as offices and hotels. Office supply is expected to expand materially over the next few years, but strong demand from foreign tenants has absorbed much of the new supply, with rents significantly below comparable Hong Kong rates. We also like Singapore-based companies with meaningful operations in China.
We have become more positive on Australia due to the potential for further cuts in interest rates and improving growth in China. We also expect property values to see continued support from foreign capital seeking quality commercial assets in a relatively stable economy. We view residential companies as more attractive on a relative basis, as we believe they will eventually return to more-profitable development over the next few quarters.
Japan is likely to see GDP growth accelerate in the second half of 2013, in our view, driven by increased fiscal stimulus and quantitative easing. However, we believe any potential upside from this trend should be viewed with caution given the market's substantial gains over the past year. Our focus remains on the larger developers, which we believe are more likely to benefit from macroeconomic improvement. Demand for prime offices in Tokyo appears to be improving, and we are seeing more demand from institutional investors, which could drive a large increase in commercial real estate transactions this year, potentially boosting valuations.
5
COHEN & STEERS INSTITUTIONAL GLOBAL REALTY SHARES, INC.
Sincerely,
| | | | | 
| | 
| |
| | | | | MARTIN COHEN | | ROBERT H. STEERS | |
| | | | | Co-chairman | | Co-chairman | |
| | | | | 
| | 
| |
| | | | | JOSEPH M. HARVEY | | JON CHEIGH | |
| | | | | Portfolio Manager | | Portfolio Manager | |
| | | | | 
| | 
| |
| | | | | GERIOS J.M. ROVERS | | CHARLES J. MCKINLEY | |
| | | | | Portfolio Manager | | Portfolio Manager | |
| | | | | 
| | 
| |
| | | | | LUKE SULLIVAN | | ROGIER QUIRIJNS | |
| | | | | Portfolio Manager | | Portfolio Manager | |

WILLIAM LEUNG
Portfolio Manager
The views and opinions in the preceding commentary are subject to change and are as of the date of publication. There is no guarantee that any market forecast set forth in the commentary will be realized. This material represents an assessment of the market environment at a specific point in time, should not be relied upon as investment advice and is not intended to predict or depict performance of any investment.
Visit Cohen & Steers online at cohenandsteers.com
For more information about any of our funds, visit cohenandsteers.com, where you will find daily net asset values, fund fact sheets and portfolio highlights. You can also access newsletters, education tools and market updates covering the global real estate, commodities, global natural resource equities, listed infrastructure, utilities, large cap value and preferred securities sectors.
In addition, our website contains comprehensive information about our firm, including our most recent press releases, profiles of our senior investment professionals and an overview of our investment approach.
6
COHEN & STEERS INSTITUTIONAL GLOBAL REALTY SHARES, INC.
Performance Review (Unaudited)
Growth of a $3,000,000 Investment
Average Annual Total Returns—For Periods Ended December 31, 2012
| | | 1 Year | | 5 Years | | Since Inceptionb | |
Fund | | | 25.91 | % | | | 1.56 | % | | | 1.89 | % | |
The performance data quoted represent past performance. Past performance is no guarantee of future results. The investment return and principal value of an investment will fluctuate and shares, if redeemed, may be worth more or less than their original cost. Current performance may be lower or higher than the performance data quoted. Performance information current to the most recent month end can be obtained by visiting our website at cohenandsteers.com. Total return assumes the reinvestment of all dividends and distributions at NAV. The performance graph and table do not reflect the deduction of taxes that a shareholder would pay on Fund distributions or the redemption of Fund shares. During the periods presented above, the advisor waived fees and/or reimbursed expenses. Without this arrangement, performance would have been lower.
The annualized gross and net expense ratios were 1.03% and 1.00%, respectively, as disclosed in the May 1, 2012 prospectus. The advisor has contractually agreed to waive its fee and/or reimburse the Fund for expenses incurred to the extent necessary to maintain the Fund's total annual operating expenses (excluding brokerage fees and commissions, taxes and, upon approval of the Board of Directors, extraordinary expenses) as a percentage of average net assets at 1.00%. This commitment will remain in place for the life of the Fund.
a The comparative indexes are not adjusted to reflect expenses or other fees that the SEC requires to be reflected in the Fund's performance. An investor cannot invest directly in an index. The Fund's performance assumes the reinvestment of all dividends and distributions at NAV. For more information, including charges and expenses, please read the prospectus carefully before you invest.
b Inception date of August 10, 2006.
7
COHEN & STEERS INSTITUTIONAL GLOBAL REALTY SHARES, INC.
Expense Example
(Unaudited)
As a shareholder of the Fund, you incur two types of costs: (1) transaction costs, and (2) ongoing costs including management fees and other Fund expenses. This example is intended to help you understand your ongoing costs (in dollars) of investing in the Fund and to compare these costs with the ongoing costs of investing in other mutual funds.
The example is based on an investment of $1,000 invested at the beginning of the period and held for the entire period July 1, 2012—December 31, 2012.
Actual Expenses
The first line of the following table provides information about actual account values and expenses. You may use the information in this line, together with the amount you invested, to estimate the expenses that you paid over the period. Simply divide your account value by $1,000 (for example, an $8,600 account value divided by $1,000 = 8.6), then multiply the result by the number in the first line under the heading entitled "Expenses Paid During Period" to estimate the expenses you paid on your account during this period.
Hypothetical Example for Comparison Purposes
The second line of the following table provides information about hypothetical account values and hypothetical expenses based on the Fund's actual expense ratio and an assumed rate of return of 5% per year before expenses, which is not the Fund's actual return. The hypothetical account values and expenses may not be used to estimate the actual ending account balance or expenses you paid for the period. You may use this information to compare the ongoing cost of investing in the Fund and other funds. To do so, compare this 5% hypothetical example with the 5% hypothetical examples that appear in the shareholder reports of other funds.
Please note that the expenses shown in the table are meant to highlight your ongoing costs only and do not reflect any transaction costs. Therefore, the second line of the table is useful in comparing ongoing costs only, and will not help you determine the relative total costs of owning different funds. In addition, if these transaction costs were included, your costs would have been higher.
| | | Beginning
Account Value
July 1, 2012 | | Ending
Account Value
December 31, 2012 | | Expenses Paid
During Perioda
July 1, 2012–
December 31, 2012 | |
Actual (11.67% return) | | $ | 1,000.00 | | | $ | 1,116.70 | | | $ | 5.32 | | |
Hypothetical (5% annual return
before expenses) | | $ | 1,000.00 | | | $ | 1,020.11 | | | $ | 5.08 | | |
a Expenses are equal to the Fund's annualized expense ratio of 1.00% multiplied by the average account value over the period, multiplied by 184/366 (to reflect the one-half year period). If the Fund had borne all of its expenses that were assumed by the advisor, the annualized expense ratio would have been 1.02%.
8
COHEN & STEERS INSTITUTIONAL GLOBAL REALTY SHARES, INC.
December 31, 2012
Top Ten Holdings
(Unaudited)
Security | | Value | | % of
Net
Assets | |
Simon Property Group | | $ | 28,605,911 | | | | 5.7 | | |
Sun Hung Kai Properties Ltd. | | | 17,972,073 | | | | 3.6 | | |
Mitsubishi Estate Co., Ltd. | | | 16,590,903 | | | | 3.3 | | |
Westfield Group | | | 15,411,311 | | | | 3.0 | | |
Hongkong Land Holdings Ltd. (USD) | | | 12,809,208 | | | | 2.5 | | |
Vornado Realty Trust | | | 11,695,764 | | | | 2.3 | | |
Ventas | | | 11,685,196 | | | | 2.3 | | |
Unibail-Rodamco | | | 11,681,130 | | | | 2.3 | | |
Equity Residential | | | 10,989,900 | | | | 2.2 | | |
Prologis | | | 9,499,806 | | | | 1.9 | | |
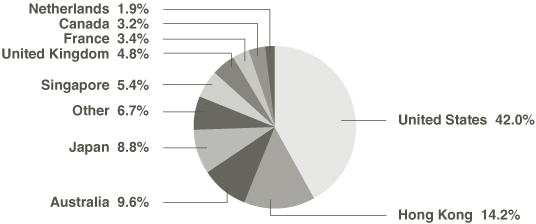
Country Breakdown
(Based on Net Assets)
(Unaudited)
9
COHEN & STEERS INSTITUTIONAL GLOBAL REALTY SHARES, INC.
SCHEDULE OF INVESTMENTS
December 31, 2012
| | | | | Number
of Shares | | Value | |
COMMON STOCK | | 98.1% | | | | | | | | | |
AUSTRALIA | | 9.6% | | | | | | | | | |
REAL ESTATE | | | | | | | | | | | |
DIVERSIFIED | | 5.1% | | | | | | | | | |
BGP Holdings PLC (EUR)a,b,c | | | | | 7,741,744 | | | $ | 0 | | |
Dexus Property Groupb | | | | | 4,986,326 | | | | 5,295,994 | | |
Goodman Groupb | | | | | 862,582 | | | | 3,930,395 | | |
GPT Groupb | | | | | 1,419,976 | | | | 5,465,750 | | |
Mirvac Groupb | | | | | 4,098,684 | | | | 6,378,533 | | |
Stocklandb | | | | | 1,294,287 | | | | 4,785,647 | | |
| | | | | | | | 25,856,319 | | |
RETAIL | | 4.5% | | | | | | | | | |
Centro Retail Australiab | | | | | 2,029,081 | | | | 4,803,508 | | |
Charter Hall Retail REITb | | | | | 660,543 | | | | 2,590,521 | | |
Westfield Groupb | | | | | 1,395,465 | | | | 15,411,311 | | |
| | | | | | | | 22,805,340 | | |
TOTAL AUSTRALIA | | | | | | | 48,661,659 | | |
BERMUDA | | 0.9% | | | | | | | | | |
REAL ESTATE—HOTEL | | | | | | | | | | | |
Orient-Express Hotels Ltd., Class A (USD)c | | | | | 369,415 | | | | 4,318,461 | | |
CANADA | | 3.2% | | | | | | | | | |
REAL ESTATE | |
OFFICE | | 1.6% | | | | | | | | | |
Brookfield Office Properties (USD) | | | | | 493,329 | | | | 8,391,526 | | |
RETAIL | | 1.6% | | | | | | | | | |
Primaris Retail REIT | | | | | 106,764 | | | | 2,887,254 | | |
RioCan REIT | | | | | 182,232 | | | | 5,049,074 | | |
| | | | | | | | 7,936,328 | | |
TOTAL CANADA | | | | | | | 16,327,854 | | |
CHINA | | 0.3% | | | | | | | | | |
REAL ESTATE—DIVERSIFIED | |
Guangzhou R&F Properties Co., Ltd. Class H (HKD)b | | | | | 840,398 | | | | 1,424,311 | | |
See accompanying notes to financial statements.
10
COHEN & STEERS INSTITUTIONAL GLOBAL REALTY SHARES, INC.
SCHEDULE OF INVESTMENTS—(Continued)
December 31, 2012
| | | | | Number
of Shares | | Value | |
FRANCE | | 3.4% | | | | | | | | | |
REAL ESTATE—RETAIL | |
Klepierreb | | | | | 140,221 | | | $ | 5,604,530 | | |
Unibail-Rodamcob | | | | | 48,169 | | | | 11,681,130 | | |
| | | | | | | | 17,285,660 | | |
GERMANY | | 0.7% | | | | | | | | | |
REAL ESTATE—RESIDENTIAL | |
Deutsche Wohnen AGb | | | | | 197,353 | | | | 3,663,862 | | |
HONG KONG | | 14.2% | | | | | | | | | |
REAL ESTATE | |
DIVERSIFIED | | 9.7% | | | | | | | | | |
Agile Property Holdings Ltd.b | | | | | 1,793,000 | | | | 2,574,158 | | |
Hang Lung Properties Ltd.b | | | | | 1,125,007 | | | | 4,527,495 | | |
Henderson Land Development Co., Ltd.b | | | | | 714,000 | | | | 5,111,672 | | |
Hysan Development Co., Ltd.b | | | | | 1,030,874 | | | | 5,019,695 | | |
New World Development Co., Ltd.b | | | | | 809,000 | | | | 1,282,920 | | |
Sino Land Co., Ltd.b | | | | | 2,250,800 | | | | 4,097,883 | | |
Sun Hung Kai Properties Ltd.b | | | | | 1,181,019 | | | | 17,972,073 | | |
Swire Properties Ltd.b | | | | | 737,200 | | | | 2,482,899 | | |
Wharf Holdings Ltd.b | | | | | 749,051 | | | | 5,974,654 | | |
| | | | | | | | 49,043,449 | | |
HOTEL | | 0.4% | | | | | | | | | |
Shangri-La Asia Ltd.b | | | | | 1,049,992 | | | | 2,115,136 | | |
OFFICE | | 2.5% | | | | | | | | | |
Hongkong Land Holdings Ltd. (USD)b | | | | | 1,813,600 | | | | 12,809,208 | | |
RESIDENTIAL | | 0.8% | | | | | | | | | |
Country Garden Holdings Co.b,c | | | | | 6,966,200 | | | | 3,721,772 | | |
RETAIL | | 0.8% | | | | | | | | | |
Link REITb | | | | | 799,000 | | | | 4,006,645 | | |
TOTAL HONG KONG | | | | | | | 71,696,210 | | |
See accompanying notes to financial statements.
11
COHEN & STEERS INSTITUTIONAL GLOBAL REALTY SHARES, INC.
SCHEDULE OF INVESTMENTS—(Continued)
December 31, 2012
| | | | | Number
of Shares | | Value | |
JAPAN | | 8.8% | | | | | | | | | |
REAL ESTATE | |
DIVERSIFIED | | 6.9% | | | | | | | | | |
Activia Propertiesb | | | | | 365 | | | $ | 2,288,766 | | |
Mitsubishi Estate Co., Ltd.b | | | | | 693,000 | | | | 16,590,903 | | |
Mitsui Fudosan Co., Ltd.b | | | | | 299,334 | | | | 7,322,629 | | |
NTT Urban Development Corp.b | | | | | 1,158 | | | | 1,123,178 | | |
Sumitomo Realty & Development Co., Ltd.b | | | | | 144,000 | | | | 4,797,196 | | |
Tokyo Tatemono Co., Ltd.b | | | | | 540,766 | | | | 2,785,509 | | |
| | | | | | | | 34,908,181 | | |
INDUSTRIALS | | 0.5% | | | | | | | | | |
GLP J-REITc | | | | | 3,277 | | | | 2,504,039 | | |
OFFICE | | 0.7% | | | | | | | | | |
Japan Real Estate Investment Corp.b | | | | | 338 | | | | 3,330,020 | | |
RESIDENTIAL | | 0.3% | | | | | | | | | |
Advance Residence Investmentb | | | | | 859 | | | | 1,760,667 | | |
RETAIL | | 0.4% | | | | | | | | | |
Japan Retail Fund Investment Corp.b | | | | | 977 | | | | 1,795,984 | | |
TOTAL JAPAN | | | | | | | 44,298,891 | | |
NETHERLANDS | | 1.9% | | | | | | | | | |
REAL ESTATE—RETAIL | |
Corio NVb | | | | | 143,529 | | | | 6,581,683 | | |
Eurocommercial Properties NVb | | | | | 70,734 | | | | 2,843,088 | | |
| | | | | | | | 9,424,771 | | |
NORWAY | | 0.7% | | | | | | | | | |
REAL ESTATE—OFFICE | |
Norwegian Property ASAb | | | | | 2,281,043 | | | | 3,531,479 | | |
PHILIPPINES | | 0.9% | | | | | | | | | |
REAL ESTATE—RETAIL | |
SM Prime Holdingsb | | | | | 10,743,042 | | | | 4,330,463 | | |
SINGAPORE | | 5.4% | | | | | | | | | |
REAL ESTATE | |
DIVERSIFIED | | 1.5% | | | | | | | | | |
Capitaland Ltd.b | | | | | 2,401,000 | | | | 7,390,542 | | |
See accompanying notes to financial statements.
12
COHEN & STEERS INSTITUTIONAL GLOBAL REALTY SHARES, INC.
SCHEDULE OF INVESTMENTS—(Continued)
December 31, 2012
| | | | | Number
of Shares | | Value | |
HOTEL | | 0.9% | | | | | | | | | |
City Developments Ltd.b | | | | | 426,000 | | | $ | 4,556,061 | | |
INDUSTRIALS | | 1.5% | | | | | | | | | |
Ascendas REITb | | | | | 528,000 | | | | 1,033,254 | | |
Global Logistic Properties Ltd.b | | | | | 2,797,000 | | | | 6,468,657 | | |
| | | | | | | | 7,501,911 | | |
RETAIL | | 1.5% | | | | | | | | | |
CapitaMall Trustb | | | | | 2,122,008 | | | | 3,728,942 | | |
CapitaMalls Asia Ltd.b | | | | | 1,688,999 | | | | 2,720,220 | | |
Suntec Real Estate Investment Trustb | | | | | 872,000 | | | | 1,201,391 | | |
| | | | | | | | 7,650,553 | | |
TOTAL SINGAPORE | | | | | | | 27,099,067 | | |
SWEDEN | | 0.6% | | | | | | | | | |
REAL ESTATE—OFFICE | |
Fabege ABb | | | | | 306,928 | | | | 3,111,920 | | |
SWITZERLAND | | 0.7% | | | | | | | | | |
REAL ESTATE—OFFICE | |
PSP Swiss Property AGb,c | | | | | 37,234 | | | | 3,524,163 | | |
UNITED KINGDOM | | 4.8% | | | | | | | | | |
REAL ESTATE | |
DIVERSIFIED | | 2.9% | | | | | | | | | |
Hammerson PLCb | | | | | 670,333 | | | | 5,375,213 | | |
Land Securities Group PLCb | | | | | 700,249 | | | | 9,342,028 | | |
| | | | | | | | 14,717,241 | | |
OFFICE | | 1.9% | | | | | | | | | |
Derwent London PLCb | | | | | 187,062 | | | | 6,474,162 | | |
Great Portland Estates PLCb | | | | | 392,166 | | | | 3,153,044 | | |
| | | | | | | | 9,627,206 | | |
TOTAL UNITED KINGDOM | | | | | | | 24,344,447 | | |
UNITED STATES | | 42.0% | | | | | | | | | |
COMMUNICATIONS—TOWERS | | 0.7% | | | | | | | | | |
American Tower Corp. | | | | | 49,213 | | | | 3,802,689 | | |
See accompanying notes to financial statements.
13
COHEN & STEERS INSTITUTIONAL GLOBAL REALTY SHARES, INC.
SCHEDULE OF INVESTMENTS—(Continued)
December 31, 2012
| | | | | Number
of Shares | | Value | |
REAL ESTATE | | 41.3% | | | | | | | | | |
DIVERSIFIED | | 3.6% | | | | | | | | | |
American Assets Trust | | | | | 123,649 | | | $ | 3,453,517 | | |
Forest City Enterprises, Class Ac | | | | | 201,922 | | | | 3,261,040 | | |
Vornado Realty Trust | | | | | 146,051 | | | | 11,695,764 | | |
| | | | | | | | 18,410,321 | | |
HEALTH CARE | | 3.3% | | | | | | | | | |
HCP | | | | | 109,479 | | | | 4,946,261 | | |
Ventas | | | | | 180,550 | | | | 11,685,196 | | |
| | | | | | | | 16,631,457 | | |
HOTEL | | 2.1% | | | | | | | | | |
Hersha Hospitality Trust | | | | | 636,552 | | | | 3,182,760 | | |
Hyatt Hotels Corp., Class Ac | | | | | 120,604 | | | | 4,651,696 | | |
Strategic Hotels & Resorts Worldwidec | | | | | 447,932 | | | | 2,866,765 | | |
| | | | | | | | 10,701,221 | | |
INDUSTRIALS | | 2.9% | | | | | | | | | |
DCT Industrial Trust | | | | | 744,285 | | | | 4,830,410 | | |
First Potomac Realty Trust | | | | | 26,711 | | | | 330,148 | | |
Prologis | | | | | 260,340 | | | | 9,499,806 | | |
| | | | | | | | 14,660,364 | | |
OFFICE | | 6.2% | | | | | | | | | |
CommonWealth REIT | | | | | 177,368 | | | | 2,809,509 | | |
Corporate Office Properties Trust | | | | | 202,361 | | | | 5,054,978 | | |
Douglas Emmett | | | | | 152,372 | | | | 3,550,267 | | |
Highwoods Properties | | | | | 146,883 | | | | 4,913,236 | | |
Liberty Property Trust | | | | | 90,931 | | | | 3,252,602 | | |
Mack-Cali Realty Corp. | | | | | 124,425 | | | | 3,248,737 | | |
SL Green Realty Corp. | | | | | 53,203 | | | | 4,078,010 | | |
Washington REIT | | | | | 166,021 | | | | 4,341,449 | | |
| | | | | | | | 31,248,788 | | |
See accompanying notes to financial statements.
14
COHEN & STEERS INSTITUTIONAL GLOBAL REALTY SHARES, INC.
SCHEDULE OF INVESTMENTS—(Continued)
December 31, 2012
| | | | | Number
of Shares | | Value | |
RESIDENTIAL | | 8.8% | | | | | | | | | |
APARTMENT | | 8.0% | | | | | | | | | |
Apartment Investment & Management Co. | | | | | 270,125 | | | $ | 7,309,582 | | |
| BRE Properties | | | | | 41,500 | | | | 2,109,445 | | |
Colonial Properties Trust | | | | | 190,152 | | | | 4,063,548 | | |
Education Realty Trust | | | | | 215,709 | | | | 2,295,144 | | |
Equity Residential | | | | | 193,928 | | | | 10,989,900 | | |
Home Properties | | | | | 63,633 | | | | 3,901,339 | | |
Mid-America Apartment Communities | | | | | 55,789 | | | | 3,612,338 | | |
UDR | | | | | 265,133 | | | | 6,304,863 | | |
| | | | | | | | 40,586,159 | | |
MANUFACTURED HOME | | 0.8% | | | | | | | | | |
Equity Lifestyle Properties | | | | | 55,937 | | | | 3,764,001 | | |
TOTAL RESIDENTIAL | | | | | | | 44,350,160 | | |
SELF STORAGE | | 3.3% | | | | | | | | | |
CubeSmart | | | | | 225,583 | | | | 3,286,744 | | |
Extra Space Storage | | | | | 134,078 | | | | 4,879,099 | | |
Public Storage | | | | | 58,324 | | | | 8,454,647 | | |
| | | | | | | | 16,620,490 | | |
SHOPPING CENTERS | | 10.1% | | | | | | | | | |
COMMUNITY CENTER | | 3.5% | | | | | | | | | |
DDR Corp. | | | | | 497,332 | | | | 7,788,219 | | |
Kimco Realty Corp. | | | | | 296,197 | | | | 5,722,526 | | |
Regency Centers Corp. | | | | | 73,723 | | | | 3,473,828 | | |
Tanger Factory Outlet Centers | | | | | 25,820 | | | | 883,044 | | |
| | | | | | | | 17,867,617 | | |
REGIONAL MALL | | 6.6% | | | | | | | | | |
General Growth Properties | | | | | 240,330 | | | | 4,770,551 | | |
Simon Property Group | | | | | 180,947 | | | | 28,605,911 | | |
| | | | | | | | 33,376,462 | | |
TOTAL SHOPPING CENTERS | | | | | | | 51,244,079 | | |
See accompanying notes to financial statements.
15
COHEN & STEERS INSTITUTIONAL GLOBAL REALTY SHARES, INC.
SCHEDULE OF INVESTMENTS—(Continued)
December 31, 2012
| | | | | Number
of Shares | | Value | |
SPECIALTY | | | 1.0% | | | | | | | | | | |
Digital Realty Trust | | | | | 33,500 | | | $ | 2,274,315 | | |
DuPont Fabros Technology | | | | | 103,176 | | | | 2,492,732 | | |
| | | | | | | | 4,767,047 | | |
TOTAL REAL ESTATE | | | | | | | 208,633,927 | | |
TOTAL UNITED STATES | | | | | | | 212,436,616 | | |
TOTAL COMMON STOCK
(Identified cost—$385,535,575) | | | | | | | 495,479,834 | | |
SHORT-TERM INVESTMENTS | | | 1.4% | | | | | | | | | | |
MONEY MARKET FUNDS | |
BlackRock Liquidity Funds: FedFund, 0.01%d | | | | | 3,600,000 | | | | 3,600,000 | | |
Federated Government Obligations Fund, 0.01%d | | | | | 3,600,000 | | | | 3,600,000 | | |
TOTAL SHORT-TERM INVESTMENTS
(Identified cost—$7,200,000) | | | | | | | 7,200,000 | | |
TOTAL INVESTMENTS
(Identified cost—$392,735,575) | | | 99.5 | % | | | | | | | 502,679,834 | | |
OTHER ASSETS IN EXCESS OF LIABILITIES | | | 0.5 | | | | | | | | 2,721,016 | | |
NET ASSETS (Equivalent to $22.28 per share
based on 22,681,384 shares of common
stock outstanding) | | | 100.0 | % | | | | | | $ | 505,400,850 | | |
See accompanying notes to financial statements.
16
COHEN & STEERS INSTITUTIONAL GLOBAL REALTY SHARES, INC.
SCHEDULE OF INVESTMENTS—(Continued)
December 31, 2012
Glossary of Portfolio Abbreviations
EUR Euro Currency
HKD Hong Kong Dollar
REIT Real Estate Investment Trust
USD United States Dollar
Sector Summary | | % of
Net Assets | |
Diversified | | | 30.0 | | |
Office | | | 14.9 | | |
Retail | | | 15.0 | | |
Residential | | | 10.6 | | |
Shopping Centers | | | 10.1 | | |
Industrials | | | 4.9 | | |
Hotel | | | 4.3 | | |
Health Care | | | 3.3 | | |
Self Storage | | | 3.3 | | |
Other | | | 1.9 | | |
Specialty | | | 1.0 | | |
Towers | | | 0.7 | | |
| | | | 100.0 | | |
Note: Percentages indicated are based on the net assets of the Fund.
a Illiquid security. Aggregate holdings equal 0.0% of the net assets of the Fund.
b Fair valued security. This security has been valued at its fair value as determined in good faith under procedures established by and under the general supervision of the Fund's Board of Directors. Aggregate fair valued securities represent 51.4% of the net assets of the Fund, all of which have been fair valued pursuant to foreign equity fair value pricing procedures approved by the Board of Directors.
c Non-income producing security.
d Rate quoted represents the seven-day yield of the fund.
See accompanying notes to financial statements.
17
COHEN & STEERS INSTITUTIONAL GLOBAL REALTY SHARES, INC.
STATEMENT OF ASSETS AND LIABILITIES
December 31, 2012
ASSETS: | |
Investments in securities, at value (Identified cost—$392,735,575) | | $ | 502,679,834 | | |
Cash | | | 81,753 | | |
Foreign currency, at value (Identified cost—$29,225) | | | 29,225 | | |
Receivable for: | |
Fund shares sold | | | 1,630,055 | | |
Dividends | | | 1,406,218 | | |
Investment securities sold | | | 1,306,678 | | |
Other assets | | | 7,119 | | |
Total Assets | | | 507,140,882 | | |
LIABILITIES: | |
Payable for: | |
Investment securities purchased | | | 1,093,565 | | |
Investment management fees | | | 452,184 | | |
Fund shares redeemed | | | 169,869 | | |
Directors' fees | | | 748 | | |
Other liabilities | | | 23,666 | | |
Total Liabilities | | | 1,740,032 | | |
NET ASSETS applicable to 22,681,384 shares of $0.001 par value of common stock
outstanding | | $ | 505,400,850 | | |
NET ASSET VALUE PER SHARE: | |
($505,400,850 ÷ 22,681,384 shares outstanding) | | $ | 22.28 | | |
NET ASSETS consist of: | |
Paid-in capital | | $ | 537,189,936 | | |
Dividends in excess of net investment income | | | (13,515,116 | ) | |
Accumulated net realized loss | | | (128,214,103 | ) | |
| Net unrealized appreciation | | | 109,940,133 | | |
| | | $ | 505,400,850 | | |
See accompanying notes to financial statements.
18
COHEN & STEERS INSTITUTIONAL GLOBAL REALTY SHARES, INC.
STATEMENT OF OPERATIONS
For the Year Ended December 31, 2012
Investment Income: | |
Dividend income (net of $911,819 of foreign withholding tax) | | $ | 14,659,921 | | |
Expenses: | |
Investment management fees | | | 5,414,427 | | |
Registration and filing fees | | | 45,030 | | |
Directors' fees and expenses | | | 37,244 | | |
Line of credit fees | | | 26,314 | | |
Miscellaneous | | | 9,041 | | |
Total Expenses | | | 5,532,056 | | |
Reduction of Expenses (See Note 2) | | | (117,627 | ) | |
Net Expenses | | | 5,414,429 | | |
| Net Investment Income | | | 9,245,492 | | |
Net Realized and Unrealized Gain (Loss): | |
Net realized gain (loss) on: | |
| Investments (net of $10,794 of foreign capital gains tax) | | | 49,686,710 | | |
Foreign currency transactions | | | (223,820 | ) | |
| Net realized gain | | | 49,462,890 | | |
Net change in unrealized appreciation (depreciation) on: | |
| Investments | | | 64,254,315 | | |
Foreign currency translations | | | (9,439 | ) | |
| Net change in unrealized appreciation | | | 64,244,876 | | |
| Net realized and unrealized gain | | | 113,707,766 | | |
Net Increase in Net Assets Resulting from Operations | | $ | 122,953,258 | | |
See accompanying notes to financial statements.
19
COHEN & STEERS INSTITUTIONAL GLOBAL REALTY SHARES, INC.
STATEMENT OF CHANGES IN NET ASSETS
| | | For the
Year Ended
December 31, 2012 | | For the
Year Ended
December 31, 2011 | |
Change in Net Assets: | |
From Operations: | |
Net investment income | | $ | 9,245,492 | | | $ | 9,534,656 | | |
| Net realized gain (loss) | | | 49,462,890 | | | | (8,971,224 | ) | |
Net change in unrealized appreciation
(depreciation) | | | 64,244,876 | | | | (54,273,349 | ) | |
Net increase (decrease) in net assets
resulting from operations | | | 122,953,258 | | | | (53,709,917 | ) | |
Dividends and Distributions to Shareholders from: | | | | | | | | | |
Net investment income | | | (23,697,676 | ) | | | (7,205,657 | ) | |
Tax return of capital | | | — | | | | (1,956,287 | ) | |
Total dividends and distributions
to shareholders | | | (23,697,676 | ) | | | (9,161,944 | ) | |
Capital Stock Transactions: | | | | | | | | | |
Increase (decrease) in net assets from Fund
share transactions | | | (97,373,122 | ) | | | 40,626,776 | | |
Total increase (decrease) in net assets | | | 1,882,460 | | | | (22,245,085 | ) | |
Net Assets: | |
Beginning of year | | | 503,518,390 | | | | 525,763,475 | | |
End of yeara | | $ | 505,400,850 | | | $ | 503,518,390 | | |
a Includes dividends in excess of net investment income of $13,515,116 and $7,784,484, respectively.
See accompanying notes to financial statements.
20
COHEN & STEERS INSTITUTIONAL GLOBAL REALTY SHARES, INC.
FINANCIAL HIGHLIGHTS
The following table includes selected data for a share outstanding throughout each year and other performance information derived from the financial statements. It should be read in conjunction with the financial statements and notes thereto.
| | | For the Year Ended December 31, | |
Per Share Operating Performance: | | 2012 | | 2011 | | 2010 | | 2009 | | 2008 | |
Net asset value, beginning of year | | $ | 18.52 | | | $ | 20.72 | | | $ | 18.51 | | | $ | 14.23 | | | $ | 25.10 | | |
Income from investment operations: | |
| Net investment income | | | 0.35 | a | | | 0.56 | | | | 0.84 | b | | | 0.76 | | | | 0.55 | | |
| Net realized and unrealized gain (loss) | | | 4.40 | | | | (2.43 | ) | | | 2.33 | | | | 4.65 | | | | (11.02 | ) | |
Total from investment operations | | | 4.75 | | | | (1.87 | ) | | | 3.17 | | | | 5.41 | | | | (10.47 | ) | |
Less dividends and distributions to shareholders
from: | |
Net investment income | | | (0.99 | ) | | | (0.26 | ) | | | (0.96 | ) | | | (1.13 | ) | | | (0.35 | ) | |
Tax return of capital | | | — | | | | (0.07 | ) | | | — | | | | — | | | | (0.05 | ) | |
Total dividends and distributions to
shareholders | | | (0.99 | ) | | | (0.33 | ) | | | (0.96 | ) | | | (1.13 | ) | | | (0.40 | ) | |
Net increase (decrease) in net asset value | | | 3.76 | | | | (2.20 | ) | | | 2.21 | | | | 4.28 | | | | (10.87 | ) | |
Net asset value, end of year | | $ | 22.28 | | | $ | 18.52 | | | $ | 20.72 | | | $ | 18.51 | | | $ | 14.23 | | |
Total investment returnc | | | 25.91 | % | | | –9.15 | % | | | 17.56 | % | | | 38.68 | % | | | –42.05 | % | |
Ratios/Supplemental Data: | |
Net assets, end of year (in millions) | | $ | 505.4 | | | $ | 503.5 | | | $ | 525.8 | | | $ | 350.7 | | | $ | 233.6 | | |
Ratio of expenses to average daily net assets
(before expense reduction) | | | 1.02 | % | | | 1.03 | % | | | 1.03 | % | | | 1.04 | % | | | 1.04 | % | |
Ratio of expenses to average daily net assets
(net of expense reduction) | | | 1.00 | % | | | 1.00 | % | | | 1.00 | % | | | 1.00 | % | | | 1.00 | % | |
Ratio of net investment income to average daily
net assets (before expense reduction) | | | 1.69 | % | | | 1.68 | % | | | 2.07 | % | | | 2.38 | % | | | 2.36 | % | |
Ratio of net investment income to average daily
net assets (net of expense reduction) | | | 1.71 | % | | | 1.71 | % | | | 2.10 | % | | | 2.43 | % | | | 2.40 | % | |
Portfolio turnover rate | | | 100 | % | | | 101 | % | | | 111 | % | | | 186 | % | | | 126 | % | |
a Calculation based on average shares outstanding.
b 20.6% of gross income was attributable to dividends paid by Unibail-Rodamco.
c Return assumes the reinvestment of all dividends and distributions at NAV.
See accompanying notes to financial statements.
21
COHEN & STEERS INSTITUTIONAL GLOBAL REALTY SHARES, INC.
NOTES TO FINANCIAL STATEMENTS
Note 1. Significant Accounting Policies
Cohen & Steers Institutional Global Realty Shares, Inc. (the Fund) was incorporated under the laws of the State of Maryland on May 11, 2006 and is registered under the Investment Company Act of 1940, as amended, as a diversified, open-end management investment company. The Fund's investment objective is total return.
The following is a summary of significant accounting policies consistently followed by the Fund in the preparation of its financial statements. The policies are in conformity with accounting principles generally accepted in the United States of America (GAAP). The preparation of the financial statements in accordance with GAAP requires management to make estimates and assumptions that affect the reported amounts of assets and liabilities at the date of the financial statements and the reported amounts of income and expenses during the reporting period. Actual results could differ from those estimates.
Portfolio Valuation: Investments in securities that are listed on the New York Stock Exchange are valued, except as indicated below, at the last sale price reflected at the close of the New York Stock Exchange on the business day as of which such value is being determined. If there has been no sale on such day, the securities are valued at the mean of the closing bid and ask prices on such day or, if no ask price is available, at the bid price.
Securities not listed on the New York Stock Exchange but listed on other domestic or foreign securities exchanges are valued in a similar manner. Securities traded on more than one securities exchange are valued at the last sale price reflected at the close of the exchange representing the principal market for such securities on the business day as of which such value is being determined. If after the close of a foreign market, but prior to the close of business on the day the securities are being valued, market conditions change significantly, certain foreign securities may be fair valued pursuant to procedures established by the Board of Directors.
Readily marketable securities traded in the over-the-counter market, including listed securities whose primary market is believed by Cohen & Steers Capital Management, Inc. (the advisor) to be over-the-counter, are valued at the last sale price on the valuation date as reported by sources deemed appropriate by the Board of Directors to reflect their fair market value. If there has been no sale on such day, the securities are valued at the mean of the closing bid and ask prices on such day or, if no ask price is available, at the bid price.
Short-term debt securities with a maturity date of 60 days or less are valued at amortized cost, which approximates value. Investments in open-end mutual funds are valued at their closing net asset value.
The policies and procedures approved by the Fund's Board of Directors delegate authority to make fair value determinations to the advisor, subject to the oversight of the Board of Directors. The advisor has established a valuation committee (Valuation Committee) to administer, implement and oversee the fair valuation process according to the policies and procedures approved annually by the Board of Directors. Among other things, these procedures allow the Fund to utilize independent pricing
22
COHEN & STEERS INSTITUTIONAL GLOBAL REALTY SHARES, INC.
NOTES TO FINANCIAL STATEMENTS—(Continued)
services, quotations from securities and financial instrument dealers and other market sources to determine fair value.
Securities for which market prices are unavailable will be valued at fair value, as determined in good faith by the Valuation Committee, pursuant to procedures approved by the Fund's Board of Directors. Circumstances in which market prices may be unavailable include, but are not limited to, when trading in a security is suspended, the exchange on which the security is traded is subject to an unscheduled close or disruption or material events occur after the close of the exchange on which the security is principally traded. In these circumstances, the Fund determines fair value in a manner that fairly reflects the market value of the security on the valuation date based on consideration of any information or factors it deems appropriate. These may include, but are not limited to, recent transactions in comparable securities, information relating to the specific security and developments in the markets.
Foreign equity fair value pricing procedures utilized by the Fund may cause certain foreign securities to be fair valued on the basis of fair value factors provided by a pricing service to reflect any significant market movements between the time the Fund values such securities and the earlier closing of foreign markets.
The Fund's use of fair value pricing may cause the net asset value of Fund shares to differ from the net asset value that would be calculated using market quotations. Fair value pricing involves subjective judgments and it is possible that the fair value determined for a security may be materially different than the value that could be realized upon the sale of that security.
Fair value is defined as the price that the Fund would expect to receive upon the sale of an investment or expect to pay to transfer a liability in an orderly transaction with an independent buyer in the principal market or, in the absence of a principal market, the most advantageous market for the investment or liability. The hierarchy of inputs that are used in determining the fair value of the Fund's investments is summarized below.
• Level 1—quoted prices in active markets for identical investments
• Level 2—other significant observable inputs (including quoted prices for similar investments, interest rates, credit risk, etc.)
• Level 3—significant unobservable inputs (including the Fund's own assumptions in determining the fair value of investments)
The inputs or methodology used for valuing securities are not necessarily an indication of the risk associated with investing in those securities.
For movements between the levels within the fair value hierarchy, the Fund has adopted a policy of recognizing the transfer at the end of the period in which the underlying event causing the movement occurred. Changes in valuation techniques may result in transfers into or out of an assigned level within the disclosure hierarchy. As of December 31, 2012, there were $176,335,559 of securities transferred between Level 1 and Level 2, which resulted from foreign equity fair value pricing procedures utilized by the Fund as of December 31, 2012.
23
COHEN & STEERS INSTITUTIONAL GLOBAL REALTY SHARES, INC.
NOTES TO FINANCIAL STATEMENTS—(Continued)
The following is a summary of the inputs used as of December 31, 2012 in valuing the Fund's investments carried at value:
| | | Total | | Quoted Prices
In Active
Markets for
Identical
Investments
(Level 1) | | Other
Significant
Observable
Inputs
(Level 2) | | Significant
Unobservable
Inputs
(Level 3) | |
Common Stock—Bermuda | | $ | 4,318,461 | | | $ | 4,318,461 | | | $ | — | | | $ | — | | |
Common Stock—Canada | | | 16,327,854 | | | | 16,327,854 | | | | — | | | | — | | |
Common Stock—Japan | | | 44,298,891 | | | | 2,504,039 | | | | 41,794,852 | | | | — | | |
Common Stock—United States | | | 212,436,616 | | | | 212,436,616 | | | | — | | | | — | | |
Common Stock—Other Countries | | | 218,098,012 | | | | — | | | | 218,098,012 | | | | — | a | |
Money Market Funds | | | 7,200,000 | | | | — | | | | 7,200,000 | | | | — | | |
Total Investmentsb | | $ | 502,679,834 | | | $ | 235,586,970 | | | $ | 267,092,864 | | | $ | — | | |
a BGP Holdings PLC was acquired via a spinoff and has been fair valued, by the Valuation Committee, at zero pursuant to the Fund's fair value procedures and classified as a Level 3 security.
b Portfolio holdings are disclosed individually on the Schedule of Investments.
Security Transactions and Investment Income: Security transactions are recorded on trade date. Realized gains and losses on investments sold are recorded on the basis of identified cost. Interest income is recorded on the accrual basis. Discounts are accreted and premiums are amortized over the life of the respective securities. Dividend income is recorded on the ex-dividend date, except for certain dividends on foreign securities, which are recorded as soon as the Fund is informed after the ex-dividend date. Distributions from Real Estate Investment Trusts ("REITs") are recorded as ordinary income, net realized capital gain or return of capital based on information reported by the REITs and management's estimates of such amounts based on historical information. These estimates are adjusted when the actual source of distributions is disclosed by the REITs and actual amounts may differ from the estimated amounts.
Foreign Currency Translation: The books and records of the Fund are maintained in U.S. dollars. Investment securities and other assets and liabilities denominated in foreign currencies are translated into U.S. dollars based upon prevailing exchange rates on the date of valuation. Purchases and sales of investment securities and income and expense items denominated in foreign currencies are translated into U.S. dollars based upon prevailing exchange rates on the respective dates of such transactions. The Fund does not isolate that portion of the results of operations resulting from fluctuations in foreign exchange rates on investments from the fluctuations arising from changes in market prices of securities held. Such fluctuations are included with the net realized and unrealized gain or loss on investments.
Net realized foreign exchange gains or losses arise from sales of foreign currencies, including gains and losses on forward foreign currency exchange contracts, currency gains or losses realized
24
COHEN & STEERS INSTITUTIONAL GLOBAL REALTY SHARES, INC.
NOTES TO FINANCIAL STATEMENTS—(Continued)
between the trade and settlement dates on securities transactions, and the difference between the amounts of dividends, interest, and foreign withholding taxes recorded on the Fund's books and the U.S. dollar equivalent of the amounts actually received or paid. Net unrealized foreign exchange gains and losses arise from changes in the values of assets and liabilities, other than investments in securities, on the date of valuation, resulting from changes in exchange rates. Pursuant to U.S. federal income tax regulations, certain foreign currency gains/losses included in realized and unrealized gain/loss are included in or are a reduction of ordinary income for federal income tax purposes.
Foreign Securities: The Fund may directly purchase securities of foreign issuers. Investing in securities of foreign issuers involves special risks not typically associated with investing in securities of U.S. issuers. The risks include possible revaluation of currencies, the ability to repatriate funds, less complete financial information about companies and possible future adverse political and economic developments. Moreover, securities of many foreign issuers and their markets may be less liquid and their prices more volatile than securities of comparable U.S. issuers.
Dividends and Distributions to Shareholders: Dividends from net investment income and capital gain distributions are determined in accordance with U.S. federal income tax regulations, which may differ from GAAP. Dividends from net investment income, if any, are declared and paid semi-annually. Net realized capital gains, unless offset by any available capital loss carryforward, are typically distributed to shareholders at least annually. Dividends and distributions to shareholders are recorded on the ex-dividend date and are automatically reinvested in full and fractional shares of the Fund based on the net asset value per share at the close of business on the payable date unless the shareholder has elected to have them paid in cash. Distributions paid by the Fund are subject to recharacterization for tax purposes.
Income Taxes: It is the policy of the Fund to continue to qualify as a regulated investment company, if such qualification is in the best interest of the shareholders, by complying with the requirements of Subchapter M of the Internal Revenue Code applicable to regulated investment companies, and by distributing substantially all of its taxable earnings to its shareholders. Accordingly, no provision for federal income or excise tax is necessary. Dividend and interest income from holdings in non-U.S. securities is recorded net of non-U.S. taxes paid. Security and foreign currency transactions and any gains realized by the Fund on the sale of securities in certain non-U.S. markets are subject to non-U.S. taxes. The Fund records a liability based on any unrealized gains on securities held in these markets in order to estimate the potential non-U.S. taxes due upon the sale of these securities. Management has analyzed the Fund's tax positions taken on federal income tax returns as well as its tax positions in non-U.S. jurisdictions in which it trades for all open tax years and has concluded that as of December 31, 2012, no additional provisions for income tax are required in the Fund's financial statements. The Fund's tax positions for the tax years for which the applicable statutes of limitations have not expired are subject to examination by the Internal Revenue Service, state departments of revenue and by foreign tax authorities.
25
COHEN & STEERS INSTITUTIONAL GLOBAL REALTY SHARES, INC.
NOTES TO FINANCIAL STATEMENTS—(Continued)
Note 2. Investment Management Agreement and Other Transactions with Affiliates
Investment Management Fees: The advisor serves as the Fund's investment advisor pursuant to an investment management agreement (the investment management agreement). Under the terms of the investment management agreement, the advisor provides the Fund with day-to-day investment decisions and generally manages the Fund's investments in accordance with the stated policies of the Fund, subject to the supervision of the Board of Directors.
For the services provided to the Fund, the advisor receives a fee, accrued daily and paid monthly, at the annual rate of 1.00% of the average daily net assets of the Fund.
The advisor is also responsible, under the investment management agreement, for the performance of certain administrative functions for the Fund.
The advisor has contractually agreed to waive its fees and/or reimburse the Fund so that the Fund's total annual operating expenses (excluding brokerage fees and commissions, taxes and upon approval of the Board of Directors, extraordinary expenses) do not exceed 1.00% of the average daily net assets. This commitment will remain in place for the life of the Fund. For the year ended December 31, 2012, fees waived and/or expenses reimbursed totaled $117,627.
Under subadvisory agreements between the advisor and each of Cohen & Steers Asia Limited, Cohen & Steers UK Limited and Cohen & Steers Europe S.A. (collectively, the subadvisors), affiliates of the advisor, the subadvisors are responsible for managing the Fund's investments in certain non-U.S. real estate securities. For their services provided under the subadvisory agreements, the advisor (not the Fund) pays the subadvisors. The advisor allocates 50% of the investment management fee received from the Fund among itself and each subadvisor based on the portion of the Fund's average daily net assets managed by the advisor and each subadvisor. On December 11, 2012, the Board of Directors of the Fund approved the termination of the subadvisory agreement with Cohen & Steers Europe S.A. effective December 31, 2012.
Directors' and Officers' Fees: Certain directors and officers of the Fund are also directors, officers, and/or employees of the advisor. The Fund does not pay compensation to directors and officers affiliated with the advisor.
Note 3. Purchases and Sales of Securities
Purchases and sales of securities, excluding short-term investments, for the year ended December 31, 2012, totaled $531,269,618 and $673,305,521, respectively.
26
COHEN & STEERS INSTITUTIONAL GLOBAL REALTY SHARES, INC.
NOTES TO FINANCIAL STATEMENTS—(Continued)
Note 4. Income Tax Information
The tax character of dividends and distributions paid was as follows:
| | | For the Year Ended
December 31, | |
| | | 2012 | | 2011 | |
Ordinary income | | $ | 23,697,676 | | | $ | 7,205,657 | | |
| Tax return of capital | | | — | | | | 1,956,287 | | |
Total dividends and distributions | | $ | 23,697,676 | | | $ | 9,161,944 | | |
As of December 31, 2012, the tax-basis components of accumulated earnings and the federal tax cost were as follows:
Cost for federal income tax purposes | | $ | 430,841,200 | | |
Gross unrealized appreciation | | $ | 74,337,810 | | |
Gross unrealized depreciation | | | (2,499,176 | ) | |
Net unrealized appreciation | | $ | 71,838,634 | | |
Undistributed ordinary income | | $ | 393,994 | | |
As of December 31, 2012, the Fund had a net capital loss carryforward of $104,479,399 which may be used to offset future capital gains. These losses are a short-term capital loss carryover, of which $34,138,788 will expire on December 31, 2016 and $70,340,611 will expire on December 31, 2017.
During the year ended December 31, 2012, the Fund utilized net capital loss carryforwards of $29,320,099.
As of December 31, 2012, the Fund had temporary book/tax differences primarily attributable to wash sales on portfolio securities and unrealized appreciation on passive foreign investment companies and permanent book/tax differences primarily attributable to foreign currency transactions, sales of passive foreign investment companies and prior year REIT distribution adjustments. To reflect reclassifications arising from the permanent differences, paid-in capital was charged $43,680, accumulated net realized loss was charged $8,677,872 and dividends in excess of net investment income was credited $8,721,552. Net assets were not affected by this reclassification.
27
COHEN & STEERS INSTITUTIONAL GLOBAL REALTY SHARES, INC.
NOTES TO FINANCIAL STATEMENTS—(Continued)
Note 5. Capital Stock
The Fund is authorized to issue 100 million shares of capital stock, at a par value of $0.001 per share. The Board of Directors of the Fund may increase or decrease the aggregate number of shares of common stock that the Fund has authority to issue. Transactions in Fund shares were as follows:
| | | For the
Year Ended
December 31, 2012 | | For the
Year Ended
December 31, 2011 | |
| | | Shares | | Amount | | Shares | | Amount | |
Sold | | | 3,844,835 | | | $ | 79,539,544 | | | | 9,630,841 | | | $ | 195,028,076 | | |
Subscription in-kinda | | | 1,442,895 | | | | 30,921,235 | | | | — | | | | — | | |
Issued as reinvestment of
dividends and distributions | | | 1,016,050 | | | | 21,653,540 | | | | 414,107 | | | | 8,399,474 | | |
Redeemed | | | (10,815,264 | ) | | | (229,487,441 | ) | | | (8,226,739 | ) | | | (162,800,774 | ) | |
Net increase (decrease) | | | (4,511,484 | ) | | $ | (97,373,122 | ) | | | 1,818,209 | | | $ | 40,626,776 | | |
a Certain shareholders of the Fund were permitted to subscribe shares in-kind.
Note 6. Borrowings
The Fund, in conjunction with other Cohen & Steers funds, is a party to a $200,000,000 syndicated credit agreement (the credit agreement) with State Street Bank and Trust Company, as administrative agent and operations agent, and the lenders identified in the credit agreement, which expires January 25, 2013. For the period January 1, 2012 through January 27, 2012, the commitment fee was 0.125% per annum on the Fund's proportionate share of the unused portion of the credit agreement. After this period, the Fund pays a commitment fee of 0.10% per annum on its proportionate share of the unused portion of the credit agreement. Effective January 25, 2013, the credit agreement was renewed under similar terms and expires January 24, 2014.
During the year ended December 31, 2012, the Fund did not borrow under the credit agreement.
Note 7. Other
In the normal course of business, the Fund enters into contracts that provide general indemnifications. The Fund's maximum exposure under these arrangements is dependent on claims that may be made against the Fund in the future and, therefore, cannot be estimated; however, based on experience, the risk of material loss from such claims is considered remote.
Note 8. New Accounting Pronouncement
In December 2011, the Financial Accounting Standards Board ("FASB") issued an Accounting Standards Update No. 2011-11, "Balance Sheet (Topic 210)—Disclosures about Offsetting Assets and Liabilities requirements in U.S. GAAP and IFRSs" ("ASU 2011-11"). ASU 2011-11 requires additional
28
COHEN & STEERS INSTITUTIONAL GLOBAL REALTY SHARES, INC.
NOTES TO FINANCIAL STATEMENTS—(Continued)
disclosures on financial instruments and derivative instruments that are either offset in accordance with existing accounting guidance or are subject to an enforceable master netting arrangement or similar agreement. The new requirements do not change the accounting guidance on netting, but rather enhance the disclosures to more clearly show the impact of netting arrangements on a company's financial position.
Management is currently evaluating the impact the adoption of this pronouncement will have on the Fund's financial statements. ASU 2011-11 is effective for fiscal years and interim periods beginning after January 1, 2013.
Note 9. Subsequent Events
Management has evaluated events and transactions occurring after December 31, 2012 through the date that the financial statements were issued, and has determined that no additional disclosure in the financial statements is required.
29
COHEN & STEERS INSTITUTIONAL GLOBAL REALTY SHARES, INC.
REPORT OF INDEPENDENT REGISTERED PUBLIC ACCOUNTING FIRM
To the Board of Directors and Shareholders of
Cohen & Steers Institutional Global Realty Shares, Inc.
In our opinion, the accompanying statement of assets and liabilities, including the schedule of investments, and the related statements of operations and of changes in net assets and the financial highlights present fairly, in all material respects, the financial position of Cohen & Steers Institutional Global Realty Shares, Inc. (the "Fund") at December 31, 2012, the results of its operations for the year then ended, the changes in its net assets for each of the two years in the period then ended and the financial highlights for each of the five years in the period then ended, in conformity with accounting principles generally accepted in the United States of America. These financial statements and financial highlights (hereafter referred to as "financial statements") are the responsibility of the Fund's management. Our responsibility is to express an opinion on these financial statements based on our audits. We conducted our audits of these financial statements in accordance with the standards of the Public Company Accounting Oversight Board (United States). Those standards require that we plan and perform the audit to obtain reasonable assurance about whether the financial statements are free of material misstatement. An audit includes examining, on a test basis, evidence supporting the amounts and disclosures in the financial statements, assessing the accounting principles used and significant estimates made by management, and evaluating the overall financial statement presentation. We believe that our audits, which included confirmation of securities at December 31, 2012 by correspondence with the custodian and brokers, provide a reasonable basis for our opinion.
PricewaterhouseCoopers LLP
New York, New York
February 20, 2013
30
COHEN & STEERS INSTITUTIONAL GLOBAL REALTY SHARES, INC.
TAX INFORMATION—2012 (Unaudited)
Pursuant to the Jobs and Growth Relief Reconciliation Act of 2003, the Fund designates qualified dividend income of $4,027,139.
The Fund has elected, pursuant to section 853 of the Internal Revenue Code, to pass through foreign taxes of $751,305. The Fund generated net foreign source income of $10,848,598 with respect to this election.
OTHER INFORMATION
A description of the policies and procedures that the Fund uses to determine how to vote proxies relating to portfolio securities is available (i) without charge, upon request, by calling 800-330-7348, (ii) on our website at cohenandsteers.com or (iii) on the Securities and Exchange Commission's website at http://www.sec.gov. In addition, the Fund's proxy voting record for the most recent 12-month period ended June 30 is available by August 31 of each year (i) without charge, upon request, by calling 800-330-7348 or (ii) on the SEC's website at http://www.sec.gov.
The Fund files its complete schedule of portfolio holdings with the SEC for the first and third quarters of each fiscal year on Form N-Q. The Fund's Forms N-Q are available (i) without charge, upon request by calling 800-330-7348, or (ii) on the SEC's website at http://www.sec.gov. In addition, the Forms N-Q may be reviewed and copied at the SEC's Public Reference Room in Washington, DC. Information on the operation of the Public Reference Room may be obtained by calling 800-SEC-0330.
Please note that distributions paid by the Fund to shareholders are subject to recharacterization for tax purposes. The Fund may also pay distributions in excess of the Fund's net investment company taxable income and this excess could be a tax free return of capital distributed from the Fund's assets. The final tax treatment of all distributions is reported to shareholders on their 1099-DIV forms, which are mailed after the close of each calendar year.
31
COHEN & STEERS INSTITUTIONAL GLOBAL REALTY SHARES, INC.
MANAGEMENT OF THE FUND
The business and affairs of the Fund are managed under the direction of the Board of Directors. The Board of Directors approves all significant agreements between the Fund and persons or companies furnishing services to it, including the Fund's agreements with its advisor, administrator, co-administrator, custodian and transfer agent. The management of the Fund's day-to-day operations is delegated to its officers, the advisor, administrator and co-administrator, subject always to the investment objective and policies of the Fund and to the general supervision of the Board of Directors.
The Board of Directors and officers of the Fund and their principal occupations during at least the past five years are set forth below. The statement of additional information (SAI) includes additional information about fund directors and is available, without charge, upon request by calling 800-330-7348.
Name, Address1 and Age | | Position(s) Held
with Fund | | Term of
Office2 | | Principal Occupation
During At Least
The Past 5 Years
(Including Other
Directorships Held) | | Number of
Funds Within
Fund
Complex
Overseen by
Director
(Including
the Fund) | | Length
of Time
Served3 | |
Interested Director4 | |
Robert H. Steers
Age: 59 | | Director and Co-Chairman | | Until next election of directors | | Co-Chairman and Co-Chief Executive Officer of Cohen & Steers Capital Management, Inc. (the Advisor) since 2003 and its parent, Cohen & Steers, Inc. since 2004. Vice President of Cohen & Steers Securities, LLC. | | | 20 | | | 1991 to present | |
Martin Cohen
Age: 64 | | Director and Co-Chairman | | Until next election of directors | | Co-Chairman and Co-Chief Executive Officer of the Advisor since 2003 and Cohen & Steers, Inc. since 2004. Prior to that, President of the Advisor; Vice President of Cohen & Steers Securities, LLC. | | | 20 | | | 1991 to present | |
Disinterested Directors | |
Michael G. Clark
Age: 47 | | Director | | Until next election of directors | | From May 2006 to June 2011, President and Chief Executive Officer of DWS Funds and Managing Director of Deutsche Asset Management. | | | 20 | | | June 2011 to present | |
(table continued on next page)
32
COHEN & STEERS INSTITUTIONAL GLOBAL REALTY SHARES, INC.
(table continued from previous page)
Name, Address1 and Age | | Position(s) Held
with Fund | | Term of
Office2 | | Principal Occupation
During At Least
The Past 5 Years
(Including Other
Directorships Held) | | Number of
Funds Within
Fund
Complex
Overseen by
Director
(Including
the Fund) | | Length
of Time
Served3 | |
Bonnie Cohen5
Age: 70 | | Director | | Until next election of directors | | Consultant. Board Member, DC Public Library Foundation since 2012; Board Member, United States Department of Defense Business Board since 2010; Board Member, Teluride Mountain Film Festival since 2010; Advisory Board Member, Posse Foundation since 2004; Trustee, H. Rubenstein Foundation since 1996; Trustee, District of Columbia Public Libraries since 2004. | | | 20 | | | 2001 to present | |
George Grossman
Age: 59 | | Director | | Until next election of directors | | Attorney-at-law | | | 20 | | | 1993 to present | |
Richard E. Kroon
Age: 70 | | Director | | Until next election of directors | | Member of Investment Committee, Monmouth University since 2004; Former Director, Retired Chairman and Managing Partner of Sprout Group venture capital funds, then an affiliate of Donaldson, Lufkin and Jenrette Securities Corporation from 1981 to 2001. Former chairman of the National Venture Capital Association for the year 2000. | | | 20 | | | 2004 to present | |
(table continued on next page)
33
COHEN & STEERS INSTITUTIONAL GLOBAL REALTY SHARES, INC.
(table continued from previous page)
Name, Address1 and Age | | Position(s) Held
with Fund | | Term of
Office2 | | Principal Occupation
During At Least
The Past 5 Years
(Including Other
Directorships Held) | | Number of
Funds Within
Fund
Complex
Overseen by
Director
(Including
the Fund) | | Length
of Time
Served3 | |
Richard J. Norman
Age: 69 | | Director | | Until next election of directors | | Private Investor. Member, District of Columbia Department of Corrections Chaplains Corps from 2008 to February 2010; Member, Montgomery County, Maryland Department of Corrections Volunteer Corps since February 2010; Liaison for Business Leadership, Salvation Army World Service Organization (SAWSO) since 2010; Advisory Board Member, The Salvation Army since 1985; Financial Education Fund Chair, The Foundation Board of Maryland Public Television since 2009; Former President, Executive Committee, Chair of Investment Committee, The Foundation Board of Maryland Public Television from 1997 to 2008. Prior thereto, Investment Representative of Morgan Stanley Dean Witter from 1966 to 2000. | | | 20 | | | 2001 to present | |
Frank K. Ross
Age: 69 | | Director | | Until next election of directors | | Visiting Professor of Accounting, Howard University School of Business since 2004; Board member and Audit Committee Chair and Human Resources and Compensation Committee Member, Pepco Holdings, Inc. (electric utility) since 2004. Formerly, Midatlantic Area Managing Partner for Assurance Services at KPMG LLP and Managing Partner of its Washington, DC offices from 1977 to 2003. | | | 20 | | | 2004 to present | |
(table continued on next page)
34
COHEN & STEERS INSTITUTIONAL GLOBAL REALTY SHARES, INC.
(table continued from previous page)
Name, Address1 and Age | | Position(s) Held
with Fund | | Term of
Office2 | | Principal Occupation
During At Least
The Past 5 Years
(Including Other
Directorships Held) | | Number of
Funds Within
Fund
Complex
Overseen by
Director
(Including
the Fund) | | Length
of Time
Served3 | |
C. Edward Ward Jr.
Age: 66 | | Director | | Until next election of directors | | Member of The Board of Trustees of Manhattan College, Riverdale, New York since 2004. Formerly Director of closed-end fund management for the New York Stock Exchange, where he worked from 1979 to 2004. | | | 20 | | | 2004 to present | |
1 The address for each director is 280 Park Avenue, New York, NY 10017.
2 On March 12, 2008, the Board of Directors adopted a mandatory retirement policy stating a Director must retire from the Board on December 31st of the year in which he or she turns 75 years of age.
3 The length of time served represents the year in which the director was first elected or appointed to any fund in the Cohen & Steers fund complex.
4 "Interested person", as defined in the 1940 Act, of the fund because of affiliation with CSCM (Interested Directors).
5 Martin Cohen and Bonnie Cohen are not related.
35
COHEN & STEERS INSTITUTIONAL GLOBAL REALTY SHARES, INC.
The officers of the Fund (other than Messrs. Cohen and Steers, whose biographies are provided above), their address, their ages and their principal occupations for at least the past five years are set forth below.
Name, Address and Age1 | | Position(s) Held
with Fund | | Principal Occupation During At Least the Past 5 Years | | Length
of Time
Served2 | |
Adam M. Derechin
Age: 48 | | President and Chief Executive Officer | | Chief Operating Officer of CSCM (since 2003) and CNS (since 2004). Prior to that, Senior Vice President of CSCM and Vice President and Assistant Treasurer of the Cohen & Steers funds. | | Since 2005 | |
Joseph M. Harvey
Age: 49 | | Vice President | | President and Chief Investment Officer of CSCM (since 2003) and President of CNS (since 2004). Prior to that, Senior Vice President and Director of Investment Research of CSCM. | | Since 2004 | |
Jon Cheigh
Age: 40 | | Vice President | | Executive Vice President (since 2012). Prior to that, Senior Vice President of the Advisor. | | Since 2007 | |
Francis C. Poli
Age: 50 | | Secretary | | Executive Vice President, Secretary and General Counsel of CSCM and CNS since March 2007. Prior thereto, General Counsel of Allianz Global Investors of America LP. | | Since 2007 | |
James Giallanza
Age: 46 | | Treasurer and Chief Financial Officer | | Senior Vice President of CSCM since September 2006. Prior thereto, Deputy Head of the US Funds Administration and Treasurer & CFO of various mutual funds within the Legg Mason (formally Citigroup Asset Management) fund complex from August 2004 to September 2006. | | Since 2006 | |
Lisa D. Phelan
Age: 44 | | Chief Compliance Officer | | Senior Vice President and Director of Compliance of CSCM since 2007 and prior to that, Vice President since 2006. Chief Compliance Officer of CSSL since 2004. Prior to that, Compliance Officer of CSCM since 2004. Chief Compliance Officer, Avatar Associates & Overture Asset Managers, 2003-2004. | | Since 2006 | |
1 The address of each officer is 280 Park Avenue, New York, NY 10017.
2 Officers serve one-year terms. The length of time served represents the year in which the officer was first elected to that position in any fund in the Cohen & Steers fund complex. All of the officers listed above are officers of one or more of the other funds in the complex.
36
COHEN & STEERS INSTITUTIONAL GLOBAL REALTY SHARES, INC.
Cohen & Steers Privacy Policy
Facts | | What Does Cohen & Steers Do With Your Personal Information? | |
Why? | | Financial companies choose how they share your personal information. Federal law gives consumers the right to limit some but not all sharing. Federal law also requires us to tell you how we collect, share, and protect your personal information. Please read this notice carefully to understand what we do. | |
What? | | The types of personal information we collect and share depend on the product or service you have with us. This information can include:
• Social Security number and account balances
• Transaction history and account transactions
• Purchase history and wire transfer instructions | |
How? | | All financial companies need to share customers' personal information to run their everyday business. In the section below, we list the reasons financial companies can share their customers' personal information; the reasons Cohen & Steers chooses to share; and whether you can limit this sharing. | |
Reasons we can share your personal information | | Does Cohen & Steers
share? | | Can you limit this
sharing? | |
For our everyday business purposes—
such as to process your transactions, maintain your account(s), respond to court orders and legal investigations, or reports to credit bureaus | | Yes | | No | |
For our marketing purposes—
to offer our products and services to you | | Yes | | No | |
For joint marketing with other financial companies— | | No | | We don't share | |
For our affiliates' everyday business purposes—
information about your transactions and experiences | | No | | We don't share | |
For our affiliates' everyday business purposes—
information about your creditworthiness | | No | | We don't share | |
For our affiliates to market to you— | | No | | We don't share | |
For non-affiliates to market to you— | | No | | We don't share | |
Questions? Call 800-330-7348
37
COHEN & STEERS INSTITUTIONAL GLOBAL REALTY SHARES, INC.
Cohen & Steers Privacy Policy—(Continued)
Who we are | | | |
Who is providing this notice? | | Cohen & Steers Capital Management, Inc., Cohen & Steers Asia Limited, Cohen & Steers UK Limited, Cohen & Steers Europe SA, Cohen & Steers Securities, LLC, Cohen & Steers Private Funds and Cohen & Steers Open and Closed-End Funds (collectively, "Cohen & Steers"). | |
What we do | | | |
How does Cohen & Steers protect my personal information? | | To protect your personal information from unauthorized access and use, we use security measures that comply with federal law. These measures include computer safeguards and secured files and buildings. We restrict access to your information to those employees who need it to perform their jobs, and also require companies that provide services on our behalf to protect your information. | |
How does Cohen & Steers collect my personal information? | | We collect your personal information, for example, when you:
• Open an account or buy securities from us
• Provide account information or give us your contact information
• Make deposits or withdrawals from your account
We also collect your personal information from other companies. | |
Why can't I limit all sharing? | | Federal law gives you the right to limit only:
• sharing for affiliates' everyday business purposes—information about your creditworthiness
• affiliates from using your information to market to you
• sharing for non-affiliates to market to you
State law and individual companies may give you additional rights to limit sharing. | |
Definitions | | | |
Affiliates | | Companies related by common ownership or control. They can be financial and nonfinancial companies.
• Cohen & Steers does not share with affiliates. | |
Non-affiliates | | Companies not related by common ownership or control. They can be financial and nonfinancial companies.
• Cohen & Steers does not share with non-affiliates. | |
Joint marketing | | A formal agreement between non-affiliated financial companies that together market financial products or services to you.
• Cohen & Steers does not jointly market. | |
38
COHEN & STEERS INSTITUTIONAL GLOBAL REALTY SHARES, INC.
Cohen & Steers Investment Solutions
COHEN & STEERS GLOBAL REALTY SHARES
• Designed for investors seeking total return, investing primarily in global real estate securities
• Symbols: CSFAX, CSFBX*, CSFCX, CSSPX
COHEN & STEERS INSTITUTIONAL REALTY SHARES
• Designed for institutional investors seeking total return, investing primarily in U.S. real estate securities (REITs)
• Symbol: CSRIX
COHEN & STEERS REALTY INCOME FUND
• Designed for investors seeking total return, investing primarily in U.S. real estate securities (REITs)
• Symbols: CSEIX, CSBIX*, CSCIX, CSDIX
COHEN & STEERS INTERNATIONAL REALTY FUND
• Designed for investors seeking total return, investing primarily in international non-U.S. real estate securities
• Symbols: IRFAX, IRFCX, IRFIX
COHEN & STEERS
EMERGING MARKETS REAL ESTATE FUND
• Designed for investors seeking total return, investing primarily in emerging markets real estate securities
• Symbols: APFAX, APFCX, APFIX
COHEN & STEERS REALTY SHARES
• Designed for investors seeking total return, investing primarily in U.S. real estate securities (REITs)
• Symbol: CSRSX
COHEN & STEERS
INSTITUTIONAL GLOBAL REALTY SHARES
• Designed for institutional investors seeking total return, investing primarily in global real estate securities
• Symbol: GRSIX
COHEN & STEERS GLOBAL INFRASTRUCTURE FUND
• Designed for investors seeking total return, investing primarily in global infrastructure securities
• Symbols: CSUAX, CSUBX*, CSUCX, CSUIX
COHEN & STEERS DIVIDEND VALUE FUND
• Designed for investors seeking long-term growth of income and capital appreciation, investing primarily in dividend paying common stocks and preferred securities
• Symbols: DVFAX, DVFCX, DVFIX
COHEN & STEERS
PREFERRED SECURITIES AND INCOME FUND
• Designed for investors seeking total return, investing primarily in preferred and debt securities
• Symbols: CPXAX, CPXCX, CPXIX
COHEN & STEERS REAL ASSETS FUND
• Designed for investors seeking total return and the maximization of real returns during inflationary environments by investing primarily in real assets
• Symbols: RAPAX, RAPCX, RAPIX, RAPRX, RAPZX
Distributed by Cohen & Steers Securities, LLC.
COHEN & STEERS GLOBAL REALTY MAJORS ETF
• Designed for investors who seek a relatively low-cost "passive" approach for investing in a portfolio of real estate equity securities of companies in a specified index
• Symbol: GRI
Distributed by ALPS Distributors, Inc.
ISHARES COHEN & STEERS
REALTY MAJORS INDEX FUND
• Designed for investors who seek a relatively low-cost "passive" approach for investing in a portfolio of real estate equity securities of companies in a specified index
• Symbol: ICF
Distributed by BlackRock Investments, LLC
* Class B shares are no longer offered except through dividend reinvestment and permitted exchanges by existing Class B shareholders.
Please consider the investment objectives, risks, charges and expenses of the fund carefully before investing. A summary prospectus and prospectus containing this and other information can be obtained by calling 800-330-7348 or by visiting cohenandsteers.com. Please read the summary prospectus and prospectus carefully before investing.
39
COHEN & STEERS INSTITUTIONAL GLOBAL REALTY SHARES, INC.
OFFICERS AND DIRECTORS
Robert H. Steers
Director and co-chairman
Martin Cohen
Director and co-chairman
Michael G. Clark
Director
Bonnie Cohen
Director
George Grossman
Director
Richard E. Kroon
Director
Richard J. Norman
Director
Frank K. Ross
Director
C. Edward Ward, Jr.
Director
Adam M. Derechin
President and chief executive officer
Joseph M. Harvey
Vice president
Jon Cheigh
Vice president
Francis C. Poli
Secretary
James Giallanza
Treasurer and chief financial officer
Lisa D. Phelan
Chief compliance officer
KEY INFORMATION
Investment Advisor
Cohen & Steers Capital Management, Inc.
280 Park Avenue
New York, NY 10017
(212) 832-3232
Co-administrator and Custodian
State Street Bank and Trust Company
One Lincoln Street
Boston, MA 02111
Transfer Agent
Boston Financial Data Services, Inc.
30 Dan Road
Canton, MA 02021
(800) 437-9912
Legal Counsel
Ropes & Gray LLC
1211 Avenue of the Americas
New York, NY 10036
Distributor
Cohen & Steers Securities, LLC
280 Park Avenue
New York, NY 10017
Nasdaq Symbol: GRSIX
Website: cohenandsteers.com
This report is authorized for delivery only to shareholders of Cohen & Steers Institutional Global Realty Shares, Inc. unless accompanied or preceded by the delivery of a currently effective prospectus setting forth details of the Fund. Performance data quoted represents past performance. Past performance is no guarantee of future results and your investment may be worth more or less at the time you sell your shares.
40
COHEN & STEERS
INSTITUTIONAL GLOBAL REALTY SHARES
280 PARK AVENUE
NEW YORK, NY 10017
eDelivery NOW AVAILABLE
Stop traditional mail delivery; receive your shareholder reports and prospectus online.
Sign up at cohenandsteers.com

Annual Report December 31, 2012
Cohen & Steers Institutional Global Realty Shares
Item 2. Code of Ethics.
The Registrant has adopted an Amended and Restated Code of Ethics that applies to its Principal Executive Officer and Principal Financial Officer. The Code of Ethics was in effect during the reporting period. The Registrant has not amended the Code of Ethics as described in Form N-CSR during the reporting period. The Registrant has not granted any waiver, including an implicit waiver, from a provision of the Code of Ethics as described in Form N-CSR during the reporting period. Upon request, a copy of the Code of Ethics can be obtained free of charge by calling 800-330-7348 or writing to the Secretary of the Registrant, 280 Park Avenue, 10th floor, New York, NY 10017.
Item 3. Audit Committee Financial Expert.
The registrant’s board has determined that Michael G. Clark and Frank K. Ross, each a member of the board’s audit committee, are each an “audit committee financial expert”. Mr. Clark and Mr. Ross are each “independent,” as such term is defined in Form N-CSR.
Item 4. Principal Accountant Fees and Services.
(a) – (d) Aggregate fees billed to the registrant for the last two fiscal years for professional services rendered by the registrant’s principal accountant were as follows:
| | 2012 | | 2011 | |
Audit Fees | | $ | 48,410 | | $ | 47,000 | |
Audit-Related Fees | | $ | 0 | | $ | 0 | |
Tax Fees | | $ | 6,400 | | $ | 6,250 | |
All Other Fees | | $ | 0 | | $ | 0 | |
Tax fees were billed in connection with the preparation of tax returns, calculation and designation of dividends and other miscellaneous tax services.
(e)(1) The audit committee is required to pre-approve audit and non-audit services performed for the registrant by the principal accountant. The audit committee also is required to pre-approve non-audit services performed by the registrant’s principal accountant for the registrant’s investment advisor and any sub-advisor (not including any sub-advisor whose role is primarily portfolio management and is subcontracted with or overseen by another investment advisor) and/or to any entity controlling, controlled by or under common control with the registrant’s investment advisor that provides ongoing services to the registrant, if the engagement for services relates directly to the operations and financial reporting of the registrant.
The audit committee may delegate pre-approval authority to one or more of its members who are independent members of the board of directors of the registrant. The member or members to whom such authority is delegated shall report any pre-approval decisions to the audit committee at its next scheduled meeting. The audit committee may not delegate its responsibility to pre-approve services to be performed by the registrant’s principal accountant to the investment advisor.
(e) (2) No services included in (b) – (d) above were approved by the audit committee pursuant to paragraphs (c)(7)(i)(C) of Rule 2-01 of Regulation S-X.
(f) Not applicable.
(g) For the fiscal years ended December 31, 2012 and December 31, 2011, the aggregate fees billed by the registrant’s principal accountant for non-audit services rendered to the registrant and for non-audit services rendered to the registrant’s investment advisor (not including any sub-advisor whose role is primarily portfolio management and is subcontracted with or overseen by another investment advisor) and/or to any entity controlling, controlled by or under common control with the registrant’s investment advisor that provides ongoing services to the registrant were:
| | 2012 | | 2011 | |
| | | | | |
Registrant | | $ | 6,400 | | $ | 6,250 | |
Investment Advisor | | $ | 15,000 | | $ | 20,000 | |
(h) The registrant’s audit committee considered whether the provision of non-audit services that were rendered to the registrant’s investment advisor (not including any sub-advisor whose role is primarily portfolio management and is subcontracted with or overseen by another investment advisor) and/or to any entity controlling, controlled by or under common control with the registrant’s investment advisor that provides ongoing services to the registrant that were not required to be pre-approved pursuant to paragraph (c)(7)(ii) of Rule 2-01 of Regulation S-X was compatible with maintaining the principal accountant’s independence.
Item 5. Audit Committee of Listed Registrants.
Not applicable.
Item 6. Schedule of Investments.
Included in Item 1 above.
Item 7. Disclosure of Proxy Voting Policies and Procedures for Closed-End Management Investment Companies.
Not applicable.
Item 8. Portfolio Managers of Closed-End Investment Companies.
Not applicable.
Item 9. Purchases of Equity Securities by Closed-End Management Investment Company and Affiliated Purchasers.
Not applicable.
Item 10. Submission of Matters to a Vote of Security Holders.
Not applicable.
Item 11. Controls and Procedures.
(a) The registrant’s principal executive officer and principal financial officer have concluded that the registrant’s disclosure controls and procedures are reasonably designed to ensure that information required to be disclosed by the registrant in this Form N-CSR was recorded, processed, summarized and reported within the time periods specified in the Securities and Exchange Commission’s rules and forms, based upon such officers’ evaluation of these controls and procedures as of a date within 90 days of the filing date of this report.
(b) There were no changes in the registrant’s internal control over financial reporting that occurred during the second fiscal quarter of the period covered by this report that have materially affected, or are reasonably likely to materially affect, the registrant’s internal control over financial reporting.
Item 12. Exhibits.
(a)(1) Not Applicable.
(a) (2) Certifications of principal executive officer and principal financial officer as required by Rule 30a-2(a) under the Investment Company Act of 1940.
(b) Certifications of chief executive officer and chief financial officer as required by Rule 30a- 2(b) under the Investment Company Act of 1940.
SIGNATURES
Pursuant to the requirements of the Securities Exchange Act of 1934 and the Investment Company Act of 1940, the registrant has duly caused this report to be signed on its behalf by the undersigned, thereunto duly authorized.
COHEN & STEERS INSTITUTIONAL GLOBAL REALTY SHARES, INC.
| By: | /s/ Adam M. Derechin | | |
| | Name: Adam M. Derechin | | |
| | Title: President and Chief Executive Officer | | |
| | | |
| Date: March 1, 2013 | | |
| | | | | |
Pursuant to the requirements of the Securities Exchange Act of 1934 and the Investment Company Act of 1940, this report has been signed below by the following persons on behalf of the registrant and in the capacities and on the dates indicated.
| By: | /s/ Adam M. Derechin | | |
| | Name: | Adam M. Derechin | | |
| | Title: | President and Chief Executive Officer | | |
| | | (Principal Executive Officer) | | |
| | | |
| By: | /s/ James Giallanza | | |
| | Name: | James Giallanza | | |
| | Title: | Treasurer and Chief Financial Officer | | |
| | | (Principal Financial Officer) | | |
| | | |
| | | |
| Date: March 1, 2013 | | |
| | | | | | |