Exhibit 99.1
| Management Presentation June 2010 |
| Forward Looking Statement This presentation as well as oral statements made by officers or directors of Allegiant Travel Company, its advisors and affiliates (collectively or separately, the "Company“) will contain forward-looking statements that are only predictions and involve risks and uncertainties. Forward-looking statement s may include, among others, references to future performance and any comments about our strategic plans. There are many risk factors that could prevent us from achieving our goals and cause the underlying assumptions of these forward-looking statements, and our actual results, to differ materially from those expressed in, or implied by, our forward-looking statements. These risk factors and others are more fully discussed in the preliminary offering memorandum relating to the notes and our filings with the Securities and Exchange Commission. Any forward-looking statements are based on information available to us today and we undertake no obligation to update publicly any forward-looking statements, whether as a result of future events, new information or otherwise. The Company cautions users of this presentation not to place undue reliance on forward looking statements, which may be based on assumptions and anticipated events that do not materialize. |
| Highlights Highly resilient and profitable 19.2% LTM pre-tax margin Profitable last 29 quarters(1) $146mm LTM EBITDA(2) Very strong balance sheet $249mm cash; 43% LTM revenue LTM free cash flow $82mm(2) FCF positive since 2006 Management owns >20% 2006-2009 CAGR: 24% Revenue Pre-tax Profit EBITDA ($mm) Unique business model and results (1) Excluding non-cash mark to market hedge adjustments and 4Q06 one time adjustment (2) See GAAP reconciliation in Appendix Pre-tax Margin 14.1% 11.0% 21.6% 19.2% |
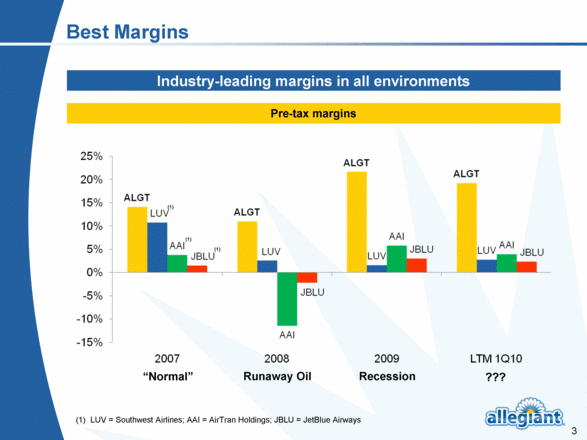
| Best Margins Pre-tax margins Industry-leading margins in all environments LUV = Southwest Airlines; AAI = AirTran Holdings; JBLU = JetBlue Airways (1) (1) (1) “Normal” Runaway Oil Recession ??? |
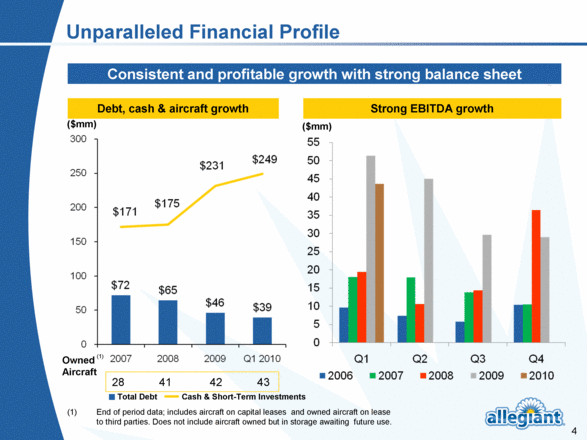
| End of period data; includes aircraft on capital leases and owned aircraft on lease to third parties. Does not include aircraft owned but in storage awaiting future use. Debt, cash & aircraft growth Consistent and profitable growth with strong balance sheet Total Debt Cash & Short-Term Investments Owned Aircraft 28 41 42 43 ($mm) Unparalleled Financial Profile (1) ($mm) Strong EBITDA growth |
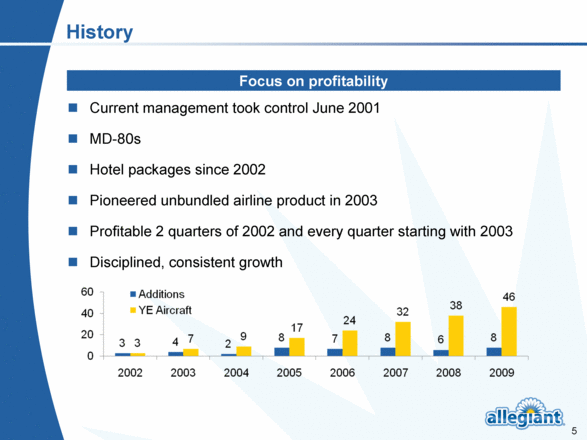
| History Current management took control June 2001 MD-80s Hotel packages since 2002 Pioneered unbundled airline product in 2003 Profitable 2 quarters of 2002 and every quarter starting with 2003 Disciplined, consistent growth Focus on profitability |
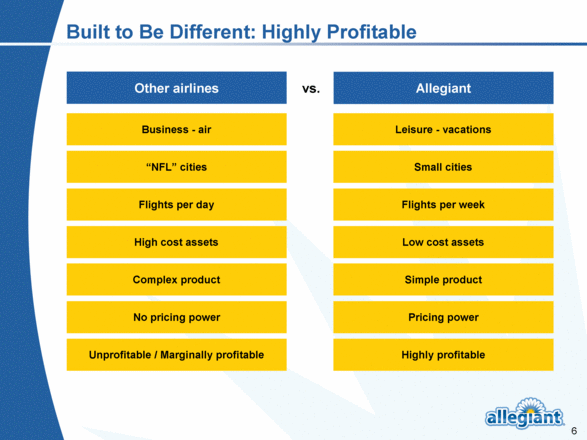
| Built to Be Different: Highly Profitable Other airlines Allegiant vs. Business - air Unprofitable / Marginally profitable Leisure - vacations Highly profitable “NFL” cities Small cities Flights per day Complex product No pricing power Flights per week Simple product Pricing power High cost assets Low cost assets |
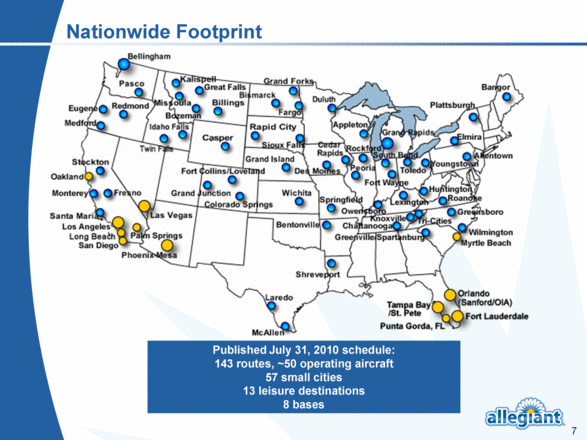
| Nationwide Footprint Published July 31, 2010 schedule: 143 routes, ~50 operating aircraft 57 small cities 13 leisure destinations 8 bases |
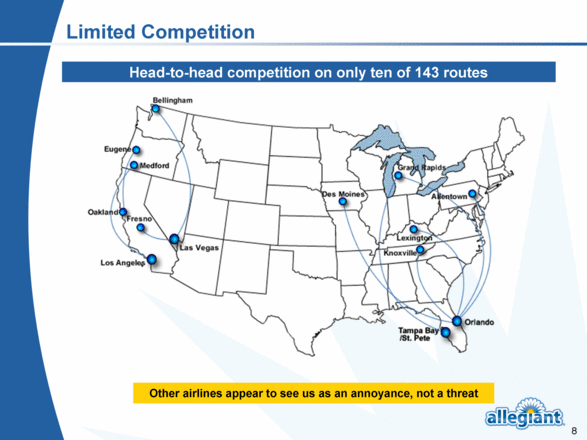
| Limited Competition Head-to-head competition on only ten of 143 routes Other airlines appear to see us as an annoyance, not a threat |
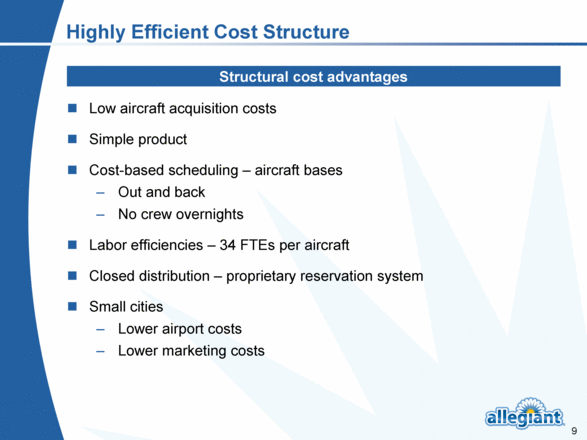
| Highly Efficient Cost Structure Structural cost advantages Low aircraft acquisition costs Simple product Cost-based scheduling – aircraft bases Out and back No crew overnights Labor efficiencies – 34 FTEs per aircraft Closed distribution – proprietary reservation system Small cities Lower airport costs Lower marketing costs |
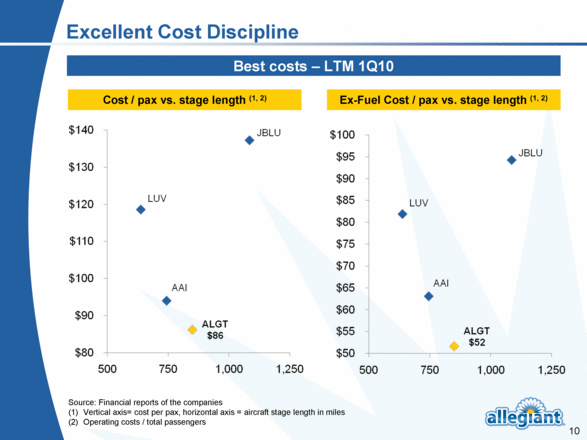
| Excellent Cost Discipline Best costs – LTM 1Q10 Cost / pax vs. stage length (1, 2) Source: Financial reports of the companies Vertical axis= cost per pax, horizontal axis = aircraft stage length in miles Operating costs / total passengers Ex-Fuel Cost / pax vs. stage length (1, 2) |
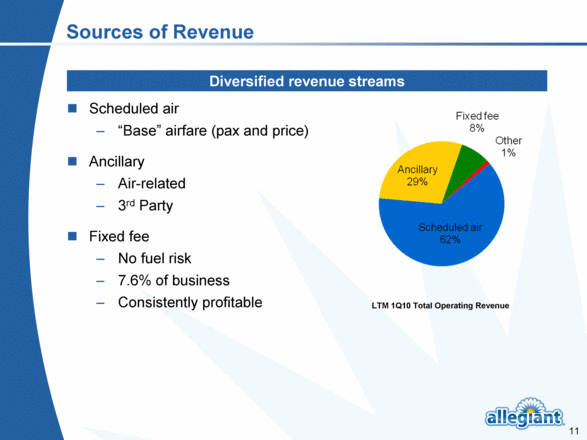
| Sources of Revenue Scheduled air “Base” airfare (pax and price) Ancillary Air-related 3rd Party Fixed fee No fuel risk 7.6% of business Consistently profitable Diversified revenue streams LTM 1Q10 Total Operating Revenue |
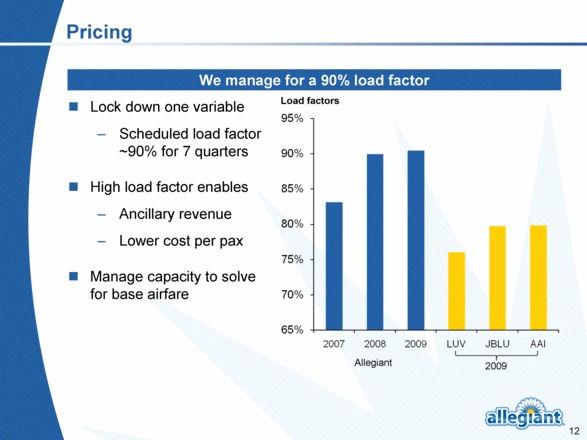
| Pricing Lock down one variable Scheduled load factor ~90% for 7 quarters High load factor enables Ancillary revenue Lower cost per pax Manage capacity to solve for base airfare We manage for a 90% load factor Load factors Allegiant 2009 |
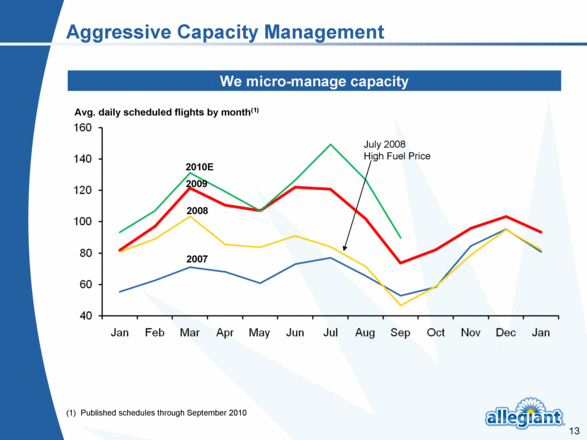
| We micro-manage capacity Aggressive Capacity Management 2008 2007 2009 July 2008 High Fuel Price (1) Published schedules through September 2010 2010E Avg. daily scheduled flights by month(1) |
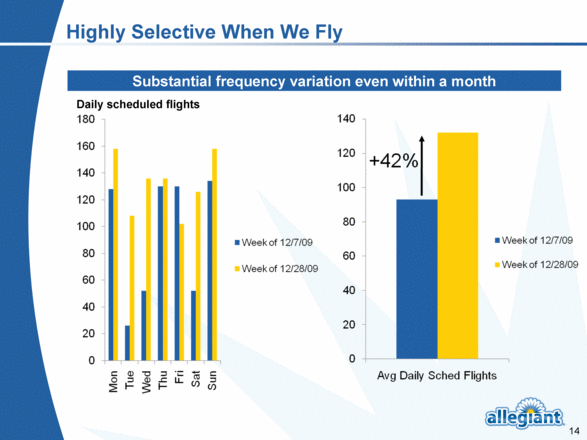
| Substantial frequency variation even within a month Highly Selective When We Fly Daily scheduled flights |
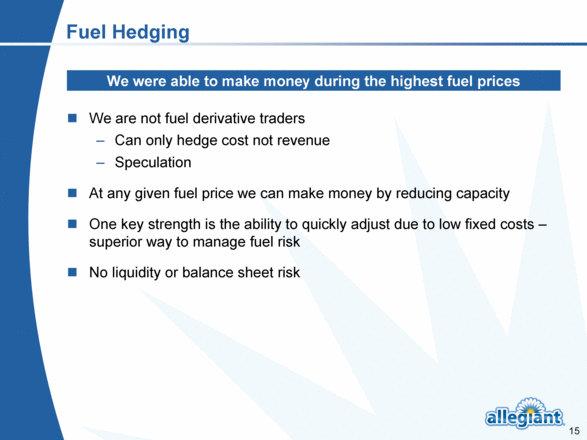
| Fuel Hedging We were able to make money during the highest fuel prices We are not fuel derivative traders Can only hedge cost not revenue Speculation At any given fuel price we can make money by reducing capacity One key strength is the ability to quickly adjust due to low fixed costs – superior way to manage fuel risk No liquidity o r balance sheet risk |
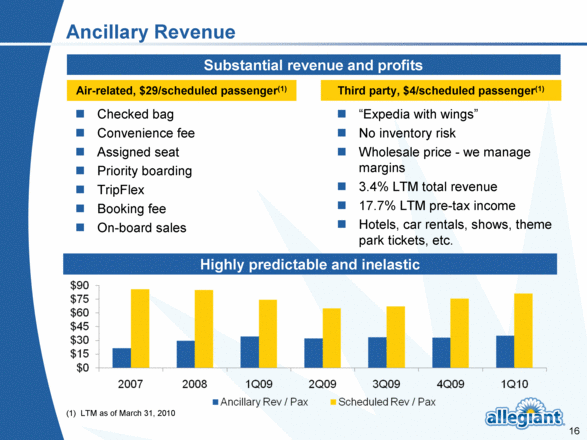
| Ancillary Revenue Highly predictable and inelastic Substantial revenue and profits Air-related, $29/scheduled passenger(1) Third party, $4/scheduled passenger(1) Checked bag Convenience fee Assigned seat Priority boarding TripFlex Booking fee On-board sales “Expedia with wings” No inventory risk Wholesale price - we manage margi ns 3.4% LTM total revenue 17.7% LTM pre-tax income Hotels, car rentals, shows, theme park tickets, etc. (1) LTM as of March 31, 2010 |
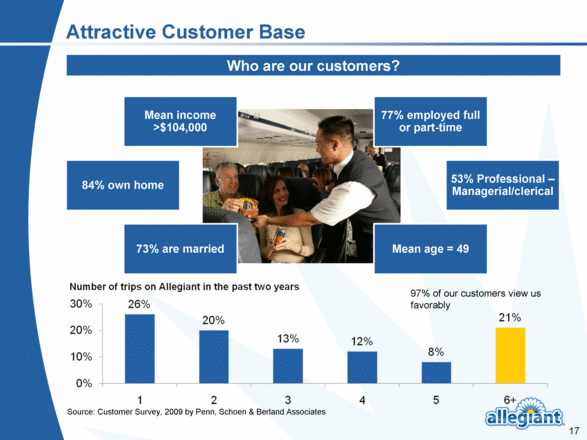
| 97% of our customers view us favorably Source: Customer Survey, 2009 by Penn, Schoen & Berland Associates Attractive Customer Base Who are our customers? Mean income >$104,000 73% are married Mean age = 49 84% own home 77% employed full or part-time 53% Professional – Managerial/clerical |
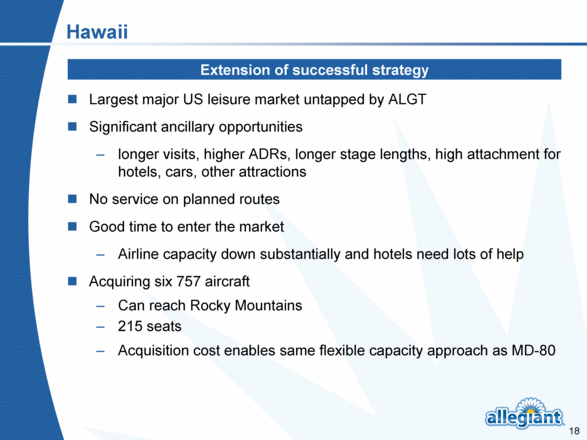
| Hawaii Largest major US leisure market untapped by ALGT Significant ancillary opportunities longer visits, higher ADRs, longer stage lengths, high attachment for hotels, cars, other attractions No service on planned routes Good time to enter the market Airline capacity down substantially and hotels need lots of help Acquiring six 757 airc raft Can reach Rocky Mountains 215 seats Acquisition cost enables same flexible capacity approach as MD-80 Extension of successful strategy |
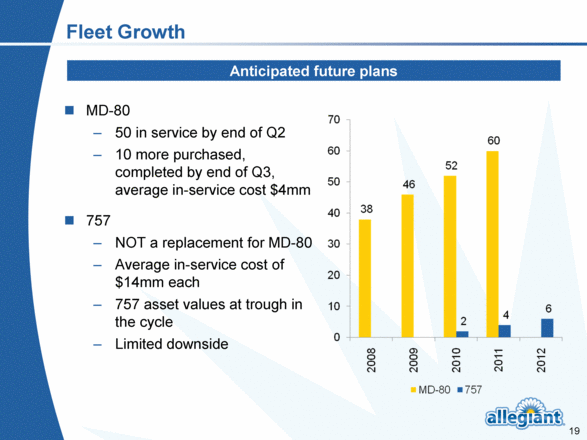
| Fleet Growth MD-80 50 in service by end of Q2 10 more purchased, completed by end of Q3, average in-service cost $4mm 757 NOT a replacement for MD-80 Average in-service cost of $14mm each 757 asset values at trough in the cycle Limited downside Anticipated future plans |
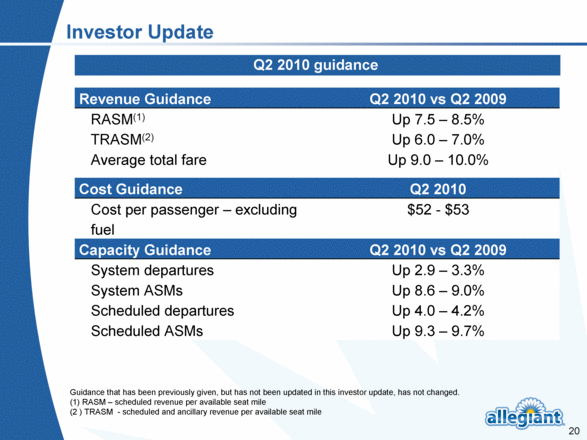
| Investor Update Revenue Guidance Q2 2010 vs Q2 2009 RASM(1) Up 7.5 – 8.5% TRASM(2) Up 6.0 – 7.0% Average total fare Up 9.0 – 10.0% Cost Guidance Q2 2010 Cost per passenger – excluding fuel $52 - $53 Capacity Guidance Q2 2010 vs Q2 2009 System departures Up 2.9 – 3.3% System ASMs Up 8.6 – 9.0% Scheduled depart ures Up 4.0 – 4.2% Scheduled ASMs Up 9.3 – 9.7% Q2 2010 guidance Guidance that has been previously given, but has not been updated in this investor update, has not changed. (1) RASM – scheduled revenue per available seat mile (2 ) TRASM - scheduled and ancillary revenue per available seat mile |
| Summary Superior results Sustained profitability Highly adaptable High growth Strong balance sheet Experienced management team Creating shareholder value |
| Appendix |
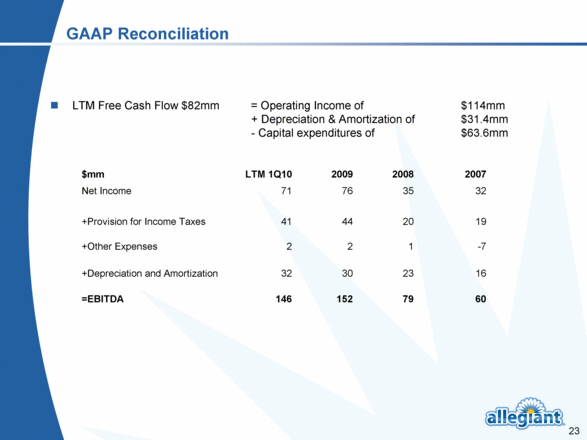
| GAAP Reconciliation LTM Free Cash Flow $82mm = Operating Income of $114mm + Depreciation & Amortization of $31.4mm - Capital expenditures of $63.6mm $mm LTM 1Q10 2009 2008 2007 Net Income 71 76 35 32 +Provision for Income Taxes 41 44 20 19 +Other Expenses 2 2 1 -7 +Depreciation and Amortization 32 30 23 16 =EBITDA 146 152 79 60 |
