
Allegiant Travel Company 2014 Investor day November 2014
Operations update Kris Bauer – Interim COO

Forward looking statements 3 This presentation as well as oral statements made by officers or directors of Allegiant Travel Company, its advisors and affiliates (collectively or separately, the "Company“) will contain forward- looking statements that are only predictions and involve risks and uncertainties. Forward-looking statements may include, among others, references to future performance and any comments about our strategic plans. There are many risk factors that could prevent us from achieving our goals and cause the underlying assumptions of these forward-looking statements, and our actual results, to differ materially from those expressed in, or implied by, our forward-looking statements. These risk factors and others are more fully discussed in our filings with the Securities and Exchange Commission. Any forward-looking statements are based on information available to us today and we undertake no obligation to update publicly any forward-looking statements, whether as a result of future events, new information or otherwise. The Company cautions users of this presentation not to place undue reliance on forward looking statements, which may be based on assumptions and anticipated events that do not materialize.
Pilot staffing – how did we get here? Government shutdown New fleet type Still operating a growing airline 4
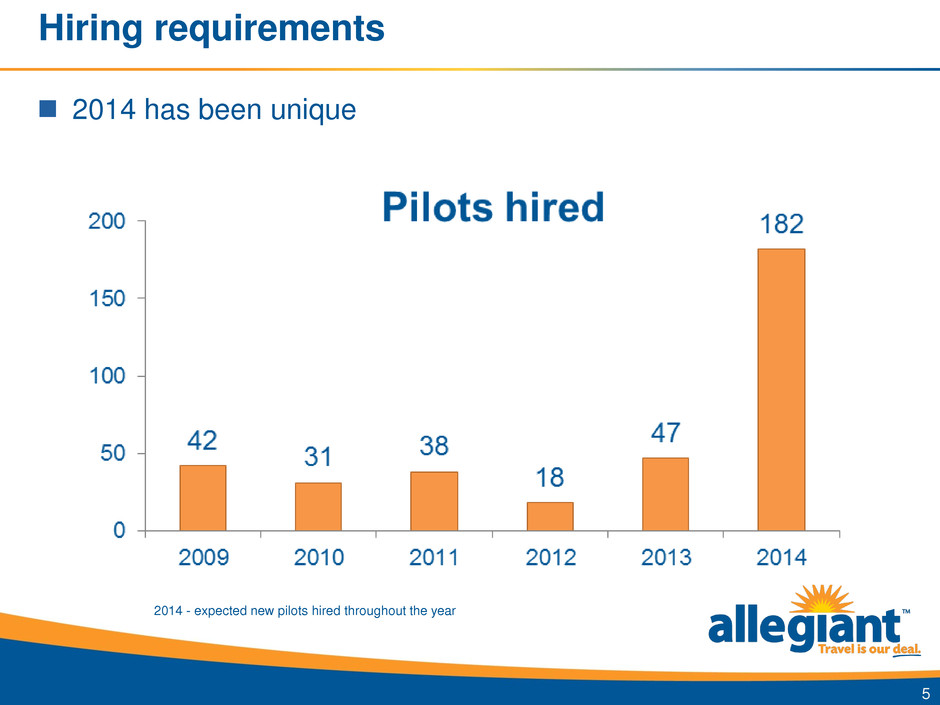
Hiring requirements 2014 has been unique 5 2014 - expected new pilots hired throughout the year
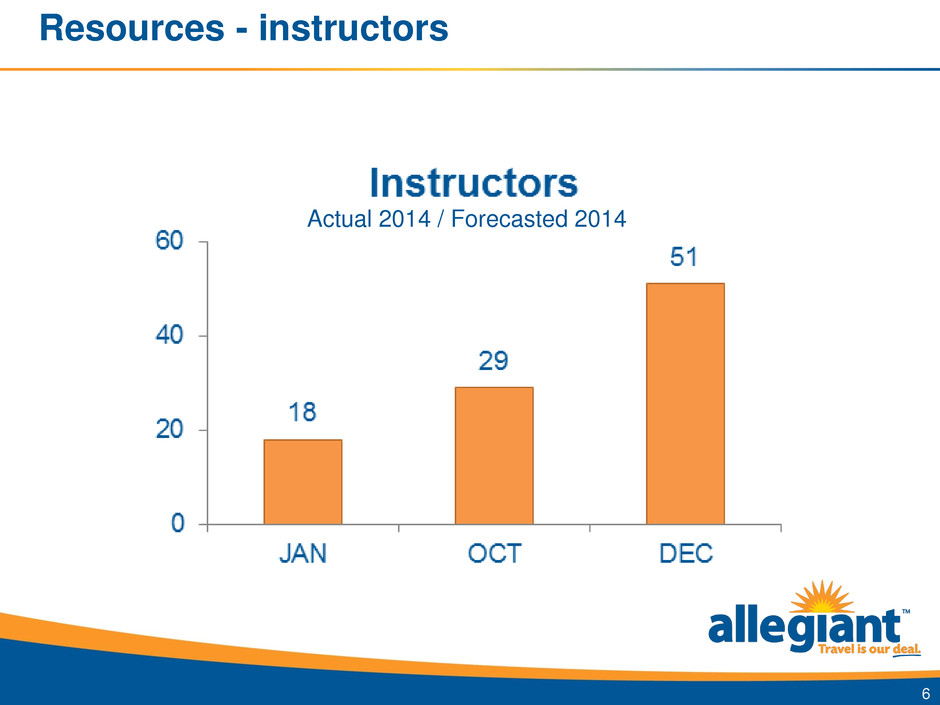
Resources - instructors 6 Actual 2014 / Forecasted 2014

Resources – simulators 7 Actual 2014 / Forecasted 2014
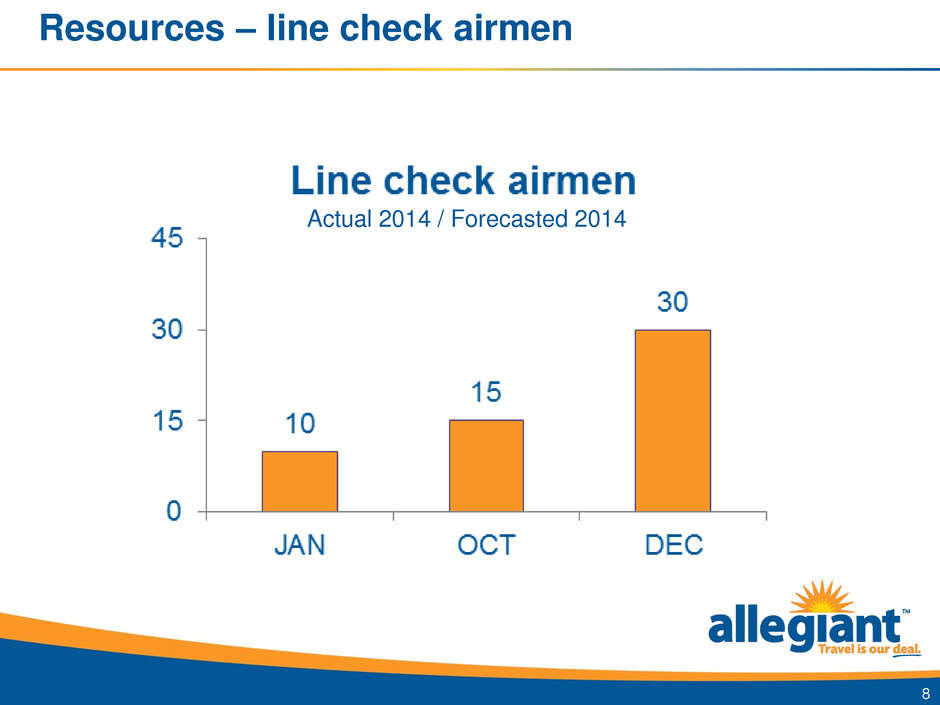
Resources – line check airmen 8 Actual 2014 / Forecasted 2014
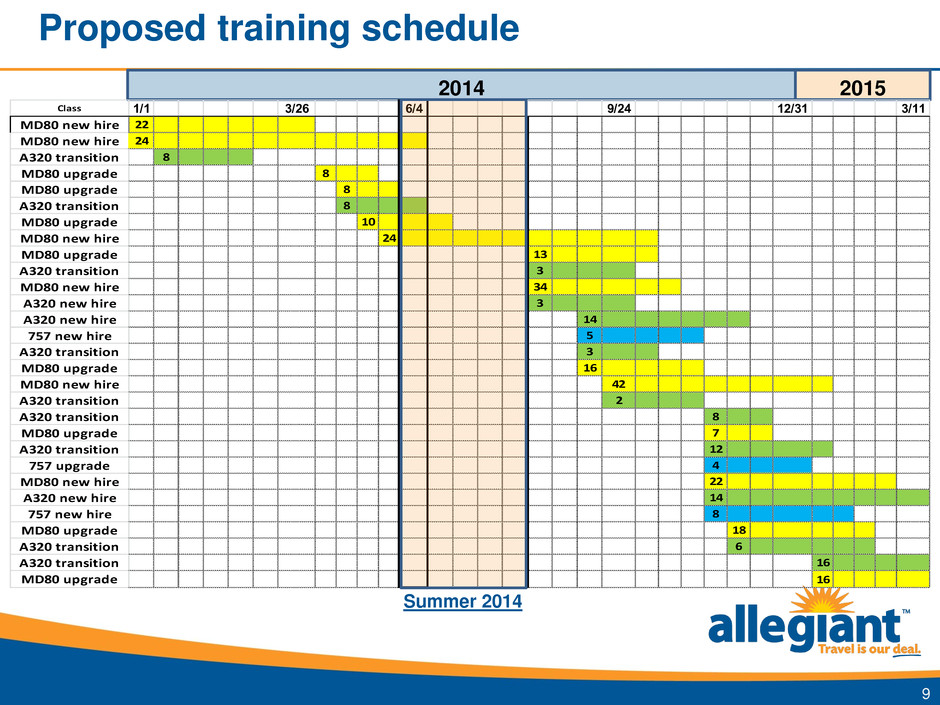
Proposed training schedule 9 Class 1/1 3/26 6/4 9/24 12/31 3/11 MD80 new hire 22 MD80 new hire 24 A320 transition 8 MD80 upgrade 8 MD80 upgrade 8 A320 transition 8 MD80 upgrade 10 MD80 new hire 24 MD80 upgrade 13 A320 transition 3 MD80 new hire 34 A320 new hire 3 A320 new hire 14 757 new hire 5 A320 transition 3 MD80 upgrade 16 MD80 new hire 42 A320 transition 2 A320 transition 8 MD80 upgrade 7 A320 transition 12 757 upgrade 4 MD80 new hire 22 A320 new hire 14 757 new hire 8 MD80 upgrade 18 A320 transition 6 A320 transition 16 MD80 upgrade 16 2014 2015 Summer 2014

MD-80 captain requirements 10 100 110 120 130 140 150 160 8/3/2014 9/3/2014 10/3/2014 11/3/2014 12/3/2014 1/3/2015 2/3/2015 3/3/2015 4/3/2015 5/3/2015 6/3/2015 MD-80 captains trained vs needed MD-80 Captains required MD-80 Captains trained Shaded area is forecasted

New hire pilot data Not having issues finding quality pilots – 11/14/2014 Class: average total flight time 5,741 hours – 10/14/2014 Class: average total flight time 5,462 hours – 09/19/2014 Class: average total flight time 5,528 hours – 09/05/2014 Class: average total flight time 6,613 hours 11

Network update Lukas Johnson – VP Network & Pricing

Forward looking statements 13 This presentation as well as oral statements made by officers or directors of Allegiant Travel Company, its advisors and affiliates (collectively or separately, the "Company“) will contain forward- looking statements that are only predictions and involve risks and uncertainties. Forward-looking statements may include, among others, references to future performance and any comments about our strategic plans. There are many risk factors that could prevent us from achieving our goals and cause the underlying assumptions of these forward-looking statements, and our actual results, to differ materially from those expressed in, or implied by, our forward-looking statements. These risk factors and others are more fully discussed in our filings with the Securities and Exchange Commission. Any forward-looking statements are based on information available to us today and we undertake no obligation to update publicly any forward-looking statements, whether as a result of future events, new information or otherwise. The Company cautions users of this presentation not to place undue reliance on forward looking statements, which may be based on assumptions and anticipated events that do not materialize.

Bio Responsible for: – Network – Revenue management – Air ancillary – Crew planning Joined Allegiant in 2010 Previously worked in actuarial consulting B.A. Math - Northwestern University 14
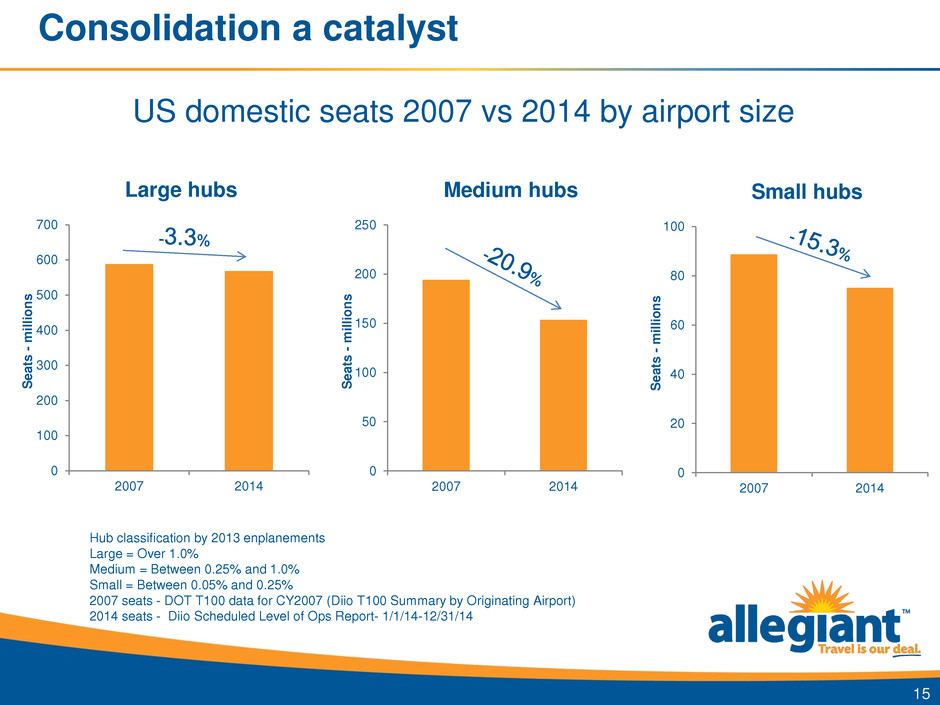
Consolidation a catalyst US domestic seats 2007 vs 2014 by airport size 15 0 100 200 300 400 500 600 700 2007 2014 S e a ts - millio n s Large hubs 0 50 100 150 200 250 2007 2014 S e a ts - m ill io n s Medium hubs 0 20 40 60 80 100 2007 2014 S e a ts - millio n s Small hubs Hub classification by 2013 enplanements Large = Over 1.0% Medium = Between 0.25% and 1.0% Small = Between 0.05% and 0.25% 2007 seats - DOT T100 data for CY2007 (Diio T100 Summary by Originating Airport) 2014 seats - Diio Scheduled Level of Ops Report- 1/1/14-12/31/14
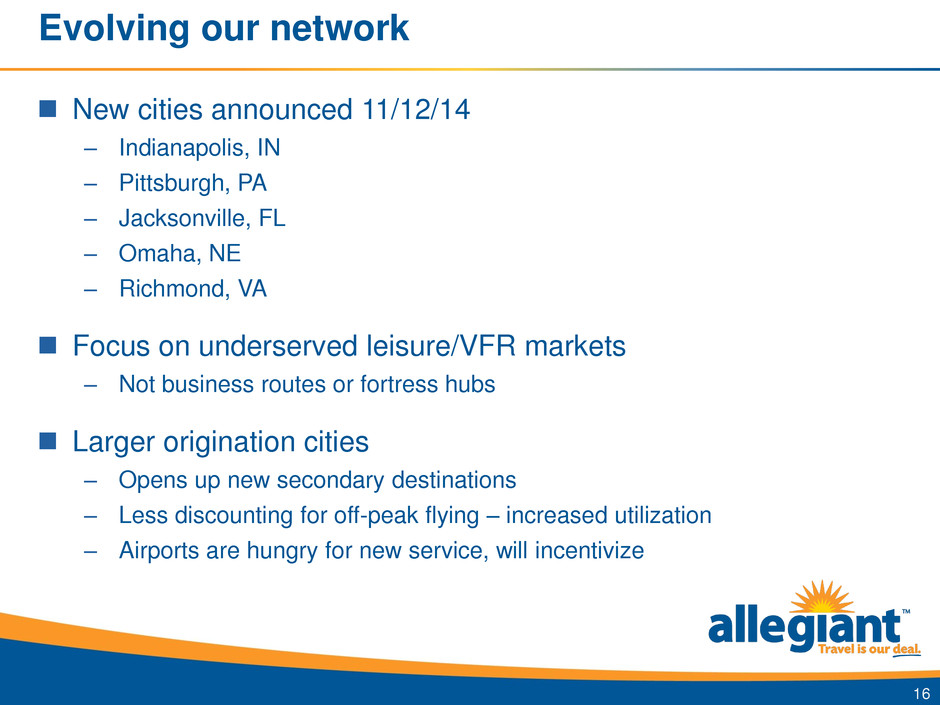
Evolving our network New cities announced 11/12/14 – Indianapolis, IN – Pittsburgh, PA – Jacksonville, FL – Omaha, NE – Richmond, VA Focus on underserved leisure/VFR markets – Not business routes or fortress hubs Larger origination cities – Opens up new secondary destinations – Less discounting for off-peak flying – increased utilization – Airports are hungry for new service, will incentivize 16
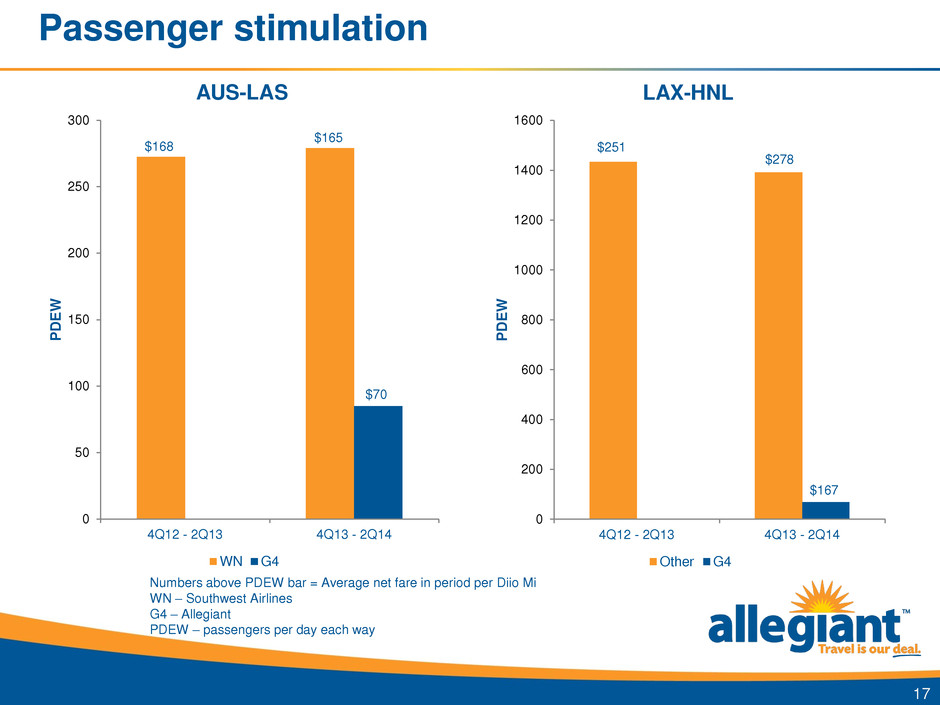
Passenger stimulation 17 0 50 100 150 200 250 300 4Q12 - 2Q13 4Q13 - 2Q14 P D E W AUS-LAS WN G4 $168 $165 $70 0 200 400 600 800 1000 1200 1400 1600 4Q12 - 2Q13 4Q13 - 2Q14 P D E W LAX-HNL Other G4 $251 $278 $167 Numbers above PDEW bar = Average net fare in period per Diio Mi WN – Southwest Airlines G4 – Allegiant PDEW – passengers per day each way

Airbus utilization Airbus aircraft allows previously marginal flying to be profitable – Longer routes (Bismarck, ND to Orlando) – Off-peak day flying (Columbus, OH to St. Pete Wed/Sat 2x weekly) – Off-peak season flying (Syracuse, NY to St. Pete in September) – Previously canceled markets (Ft. Wayne, IN to Phoenix) 18 2014 Utilization by A/C type Peak Off-Peak Total Airbus 9.9 5.3 7.9 Non-Airbus 7.1 1.9 4.9 All Aircraft 7.5 2.4 5.3
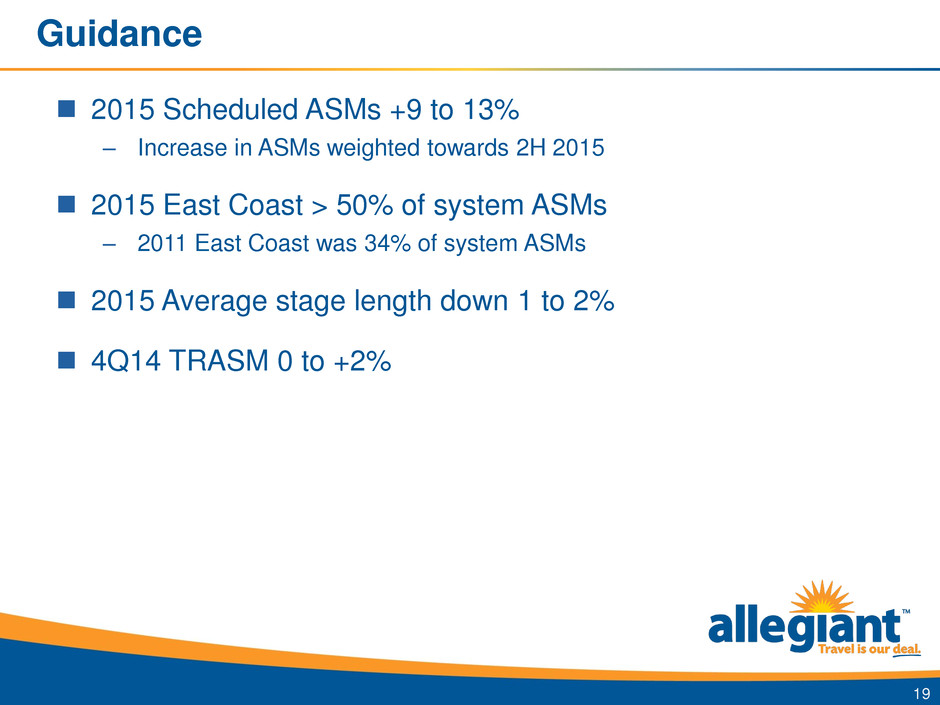
2015 Scheduled ASMs +9 to 13% – Increase in ASMs weighted towards 2H 2015 2015 East Coast > 50% of system ASMs – 2011 East Coast was 34% of system ASMs 2015 Average stage length down 1 to 2% 4Q14 TRASM 0 to +2% Guidance 19
Cost update Trent Porter – VP Financial Planning & Analysis

Forward looking statements 21 This presentation as well as oral statements made by officers or directors of Allegiant Travel Company, its advisors and affiliates (collectively or separately, the "Company“) will contain forward- looking statements that are only predictions and involve risks and uncertainties. Forward-looking statements may include, among others, references to future performance and any comments about our strategic plans. There are many risk factors that could prevent us from achieving our goals and cause the underlying assumptions of these forward-looking statements, and our actual results, to differ materially from those expressed in, or implied by, our forward-looking statements. These risk factors and others are more fully discussed in our filings with the Securities and Exchange Commission. Any forward-looking statements are based on information available to us today and we undertake no obligation to update publicly any forward-looking statements, whether as a result of future events, new information or otherwise. The Company cautions users of this presentation not to place undue reliance on forward looking statements, which may be based on assumptions and anticipated events that do not materialize.
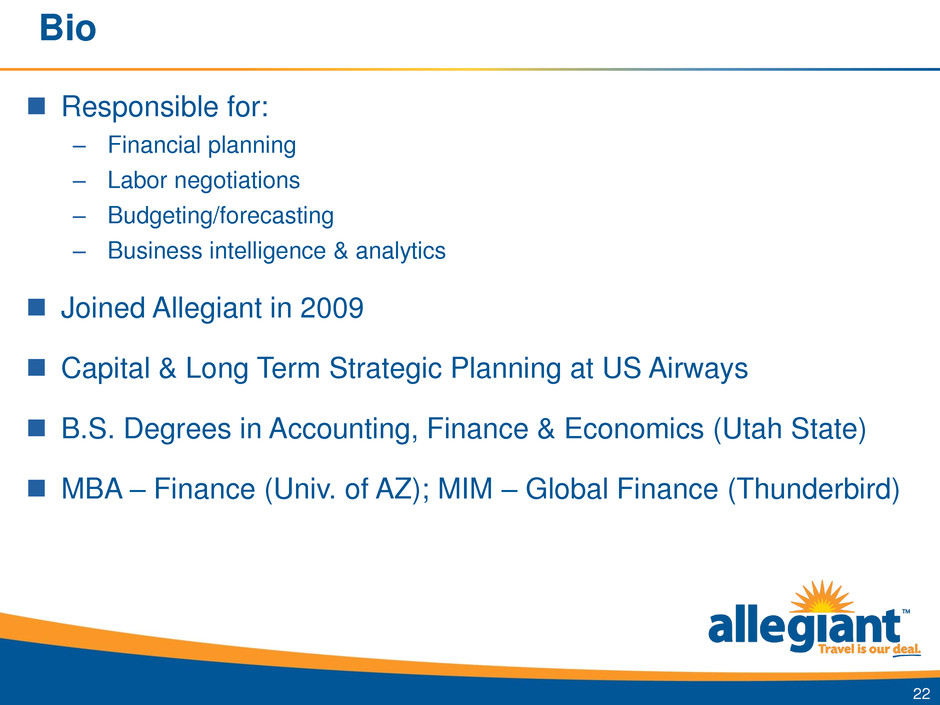
Bio Responsible for: – Financial planning – Labor negotiations – Budgeting/forecasting – Business intelligence & analytics Joined Allegiant in 2009 Capital & Long Term Strategic Planning at US Airways B.S. Degrees in Accounting, Finance & Economics (Utah State) MBA – Finance (Univ. of AZ); MIM – Global Finance (Thunderbird) 22

2014 CASM ex-Fuel 23 *Non-Core includes Teesnap, Game Plane, GMS Racing Levy payout is associated with accelerated vesting of equity grants upon Andrew Levy’s departure from the company 5.60 0.10 0.05 0.03 0.01 0.08 0.12 0.04 0.07 5.40 5.50 5.60 5.70 5.80 5.90 6.00 6.10 6.20 6.30 '13 CASM ex Heavy Mtx IT Non-Core* FA Buyout Levy Payout Subservice Training/Prod AC on Lease Dep '14 CASM ex +9.5 - 10.5% Original 2014 Guidance (4Q13): +4% - 7%

Fuel 2015 Expectations 24 Airbus AC 14% 21% 2014 2015 Airbus Block Hours 20% 32% 2014 2015 26 16 14 12 - 5 10 15 20 25 30 B757 MD80 A319 A320 Gallons/Pax Salaries & Benefits – Realization of efficiencies from multi-fleet overhead investments – Build back Pilot & Flight Attendant Productivity 70.7% 62.5% 64.6% 83.1% 79.8% 83.7% 0.0% 50.0% 100.0% 2013 2014E 2015E Crew Productivity Pilot Productivity Flight Attendant Productivity Productivity is measured as block hours / paid hours
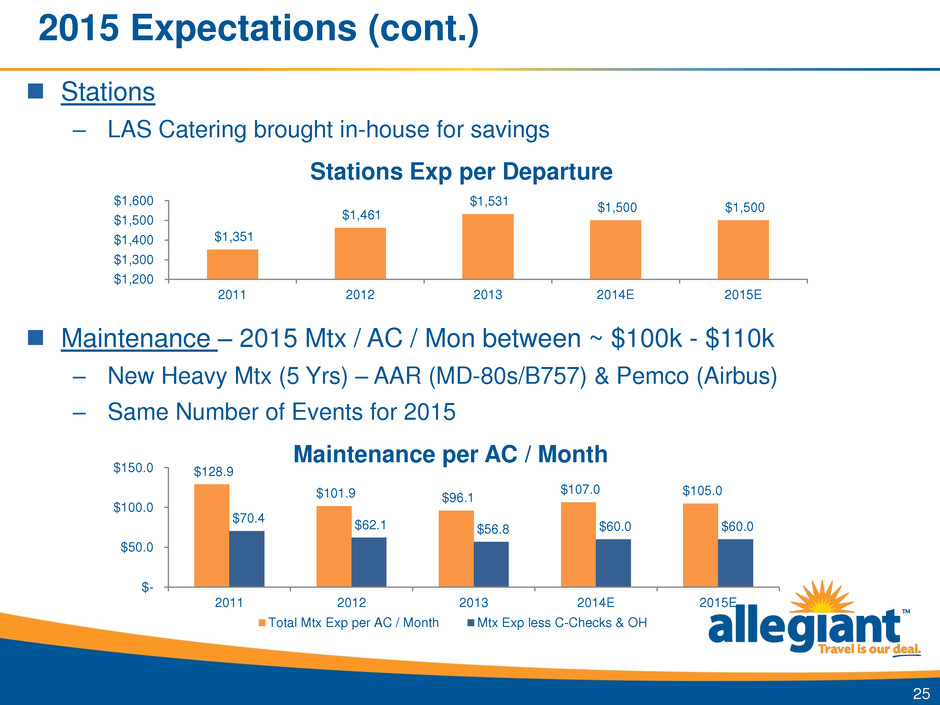
2015 Expectations (cont.) Maintenance – 2015 Mtx / AC / Mon between ~ $100k - $110k – New Heavy Mtx (5 Yrs) – AAR (MD-80s/B757) & Pemco (Airbus) – Same Number of Events for 2015 25 $128.9 $101.9 $96.1 $107.0 $105.0 $70.4 $62.1 $56.8 $60.0 $60.0 $- $50.0 $100.0 $150.0 2011 2012 2013 2014E 2015E Maintenance per AC / Month Total Mtx Exp per AC / Month Mtx Exp less C-Checks & OH Stations – LAS Catering brought in-house for savings $1,351 $1,461 $1,531 $1,500 $1,500 $1,200 $1,300 $1,400 $1,500 $1,600 2011 2012 2013 2014E 2015E Stations Exp per Departure
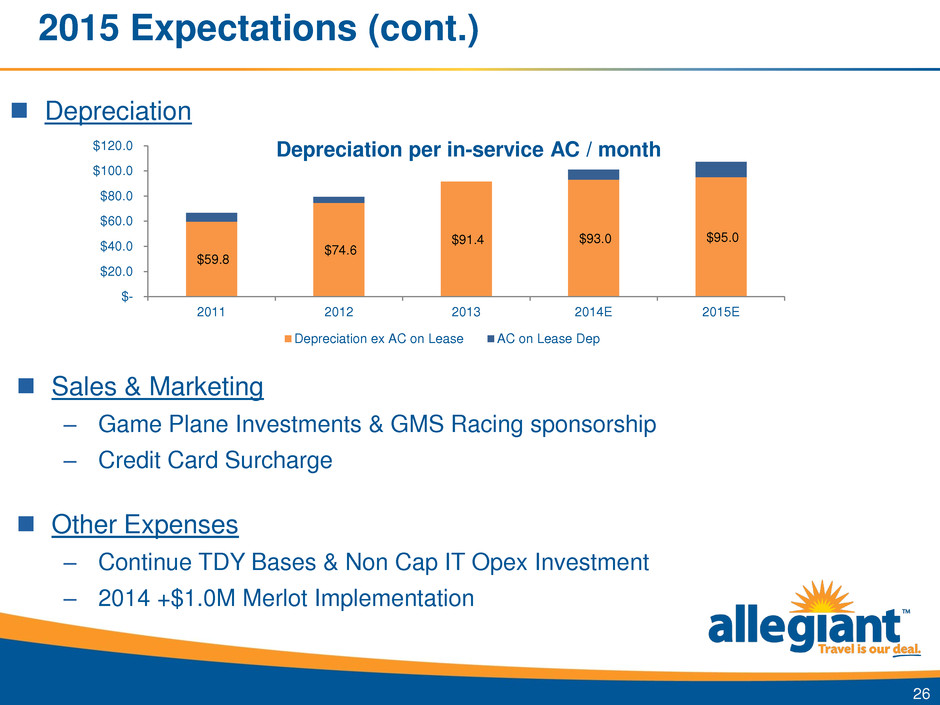
2015 Expectations (cont.) 26 Depreciation $59.8 $74.6 $91.4 $93.0 $95.0 $- $20.0 $40.0 $60.0 $80.0 $100.0 $120.0 2011 2012 2013 2014E 2015E Depreciation ex AC on Lease AC on Lease Dep Depreciation per in-service AC / month Sales & Marketing – Game Plane Investments & GMS Racing sponsorship – Credit Card Surcharge Other Expenses – Continue TDY Bases & Non Cap IT Opex Investment – 2014 +$1.0M Merlot Implementation
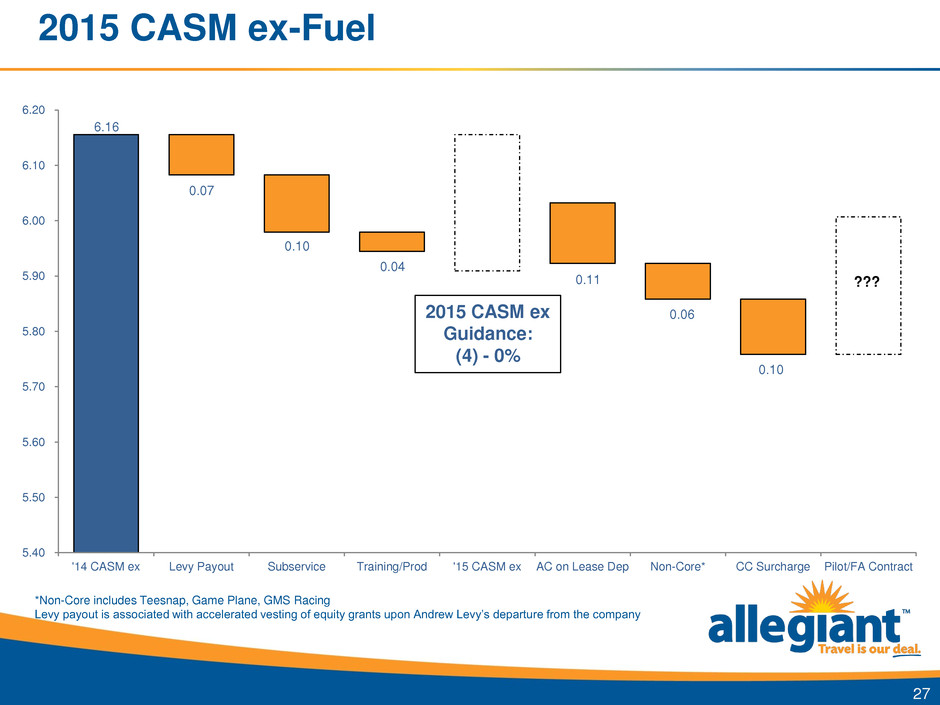
2015 CASM ex-Fuel 27 6.16 0.07 0.10 0.04 0.11 0.06 0.10 5.40 5.50 5.60 5.70 5.80 5.90 6.00 6.10 6.20 '14 CASM ex Levy Payout Subservice Training/Prod '15 CASM ex AC on Lease Dep Non-Core* CC Surcharge Pilot/FA Contract ??? 2015 CASM ex Guidance: (4) - 0% *Non-Core includes Teesnap, Game Plane, GMS Racing Levy payout is associated with accelerated vesting of equity grants upon Andrew Levy’s departure from the company
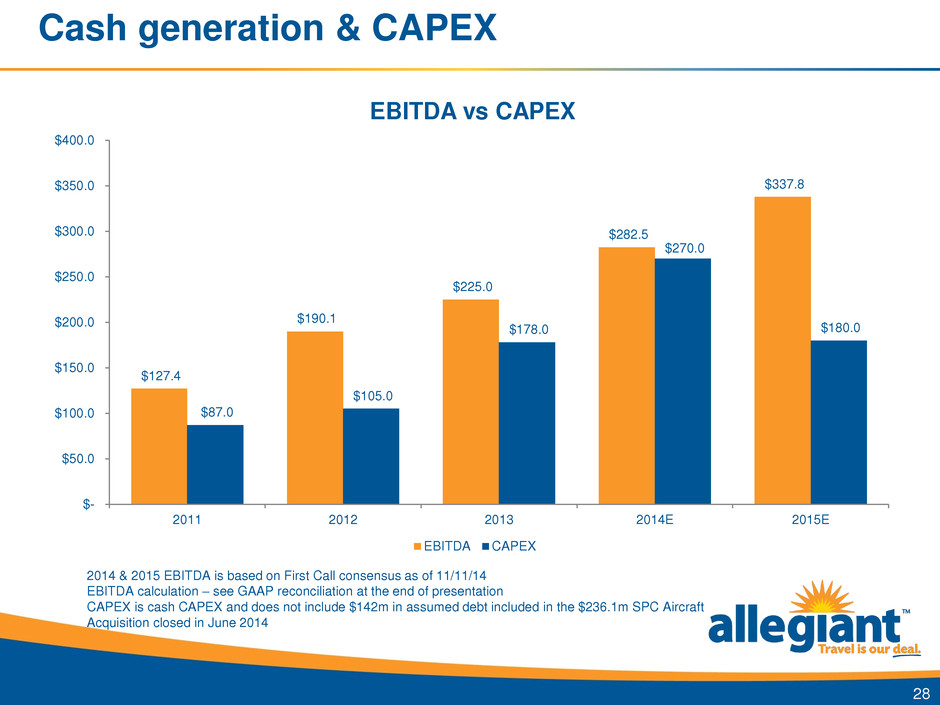
Cash generation & CAPEX 28 $127.4 $190.1 $225.0 $282.5 $337.8 $87.0 $105.0 $178.0 $270.0 $180.0 $- $50.0 $100.0 $150.0 $200.0 $250.0 $300.0 $350.0 $400.0 2011 2012 2013 2014E 2015E EBITDA vs CAPEX EBITDA CAPEX 2014 & 2015 EBITDA is based on First Call consensus as of 11/11/14 EBITDA calculation – see GAAP reconciliation at the end of presentation CAPEX is cash CAPEX and does not include $142m in assumed debt included in the $236.1m SPC Aircraft Acquisition closed in June 2014
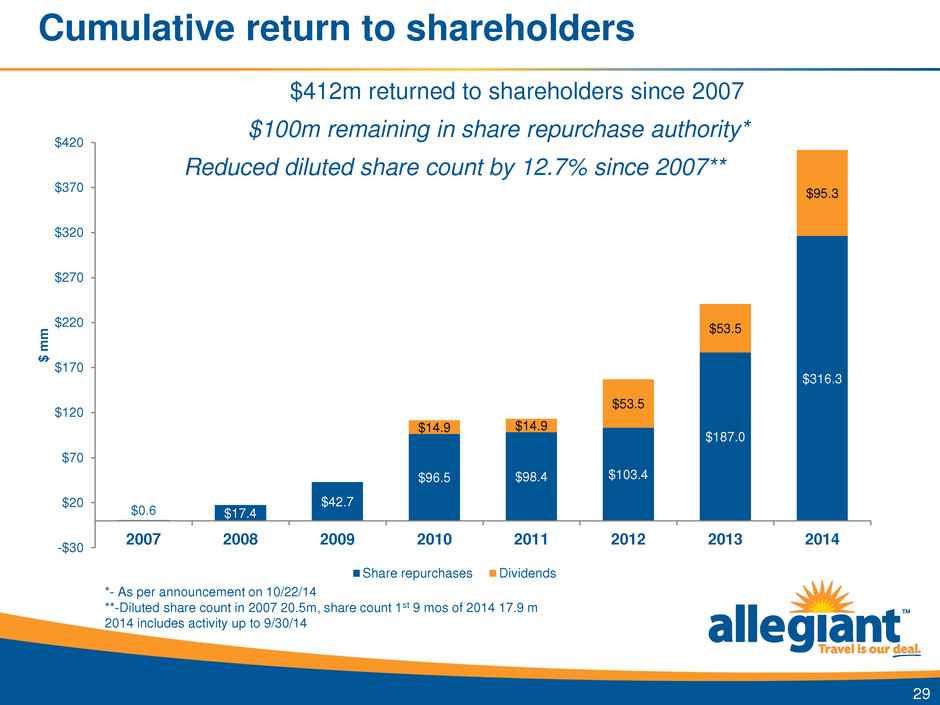
Cumulative return to shareholders $0.6 $17.4 $42.7 $96.5 $98.4 $103.4 $187.0 $316.3 $14.9 $14.9 $53.5 $53.5 $95.3 -$30 $20 $70 $120 $170 $220 $270 $320 $370 $420 2007 2008 2009 2010 2011 2012 2013 2014 $ m m Share repurchases Dividends 29 $412m returned to shareholders since 2007 $100m remaining in share repurchase authority* *- As per announcement on 10/22/14 **-Diluted share count in 2007 20.5m, share count 1st 9 mos of 2014 17.9 m 2014 includes activity up to 9/30/14 Reduced diluted share count by 12.7% since 2007**
Fleet update Tom Doxey– VP Fleet & Corporate Finance
Forward looking statements 31 This presentation as well as oral statements made by officers or directors of Allegiant Travel Company, its advisors and affiliates (collectively or separately, the "Company“) will contain forward- looking statements that are only predictions and involve risks and uncertainties. Forward-looking statements may include, among others, references to future performance and any comments about our strategic plans. There are many risk factors that could prevent us from achieving our goals and cause the underlying assumptions of these forward-looking statements, and our actual results, to differ materially from those expressed in, or implied by, our forward-looking statements. These risk factors and others are more fully discussed in our filings with the Securities and Exchange Commission. Any forward-looking statements are based on information available to us today and we undertake no obligation to update publicly any forward-looking statements, whether as a result of future events, new information or otherwise. The Company cautions users of this presentation not to place undue reliance on forward looking statements, which may be based on assumptions and anticipated events that do not materialize.
Bio Responsible for: – Fleet Planning – Aircraft Transactions – Corporate Finance – Materials / Supply Chain Joined Allegiant in 2009 Held various finance-related roles at US Airways prior to joining Allegiant BA, Brigham Young University MBA, Arizona State University 32

Topics of discussion Current fleet plan & transaction focus Overview of recently executed fleet deals Airbus update MD-80 update Financing flexibility 33

Current fleet plan & transaction focus 2013 2014E 2015E 2016E 2017E 2018E MD-80 (150 seat) 1 0 0 0 0 0 MD-80 (166 seat) 51 53 53 53 53 53 757 (218 seat) 6 6 6 6 6 6 A319 (156 seat) 3 4 9 12 12 24 A320 (177 seat) 5 7 10 10 10 10 Total 66 70 78 81 81 93 y/y fleet growth 5% 6% 11% 4% 0% 15% % Airbus Aircraft 12% 16% 24% 27% 27% 37% 34 Actual and projected fleet count of in service aircraft – end of period Continuously evaluate potential aircraft transactions and seek to acquire additional aircraft opportunistically The following counts include only executed transactions:
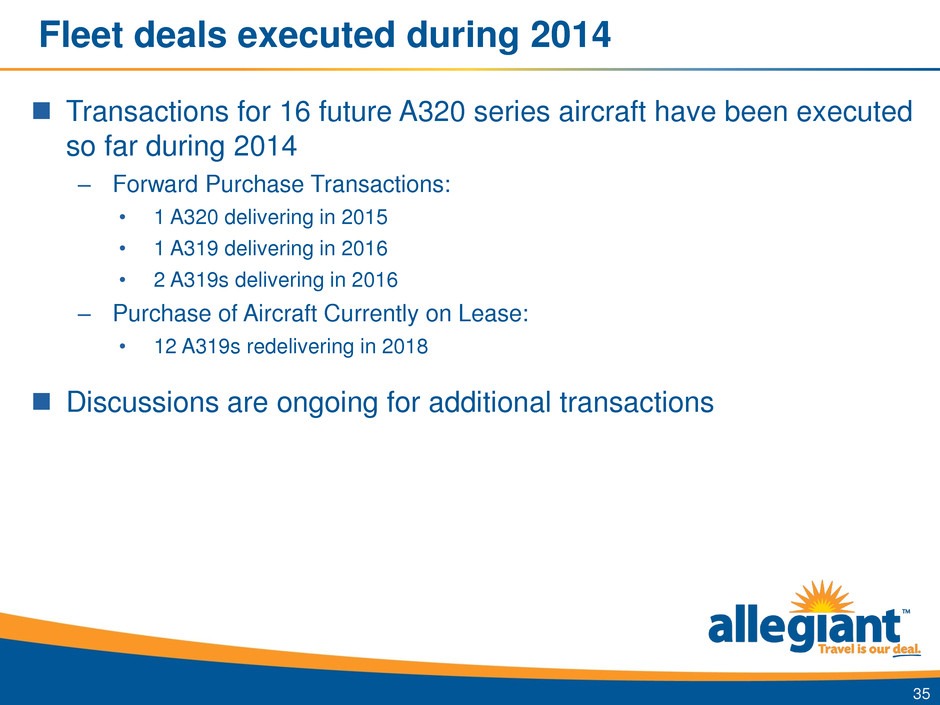
Fleet deals executed during 2014 Transactions for 16 future A320 series aircraft have been executed so far during 2014 – Forward Purchase Transactions: • 1 A320 delivering in 2015 • 1 A319 delivering in 2016 • 2 A319s delivering in 2016 – Purchase of Aircraft Currently on Lease: • 12 A319s redelivering in 2018 Discussions are ongoing for additional transactions 35
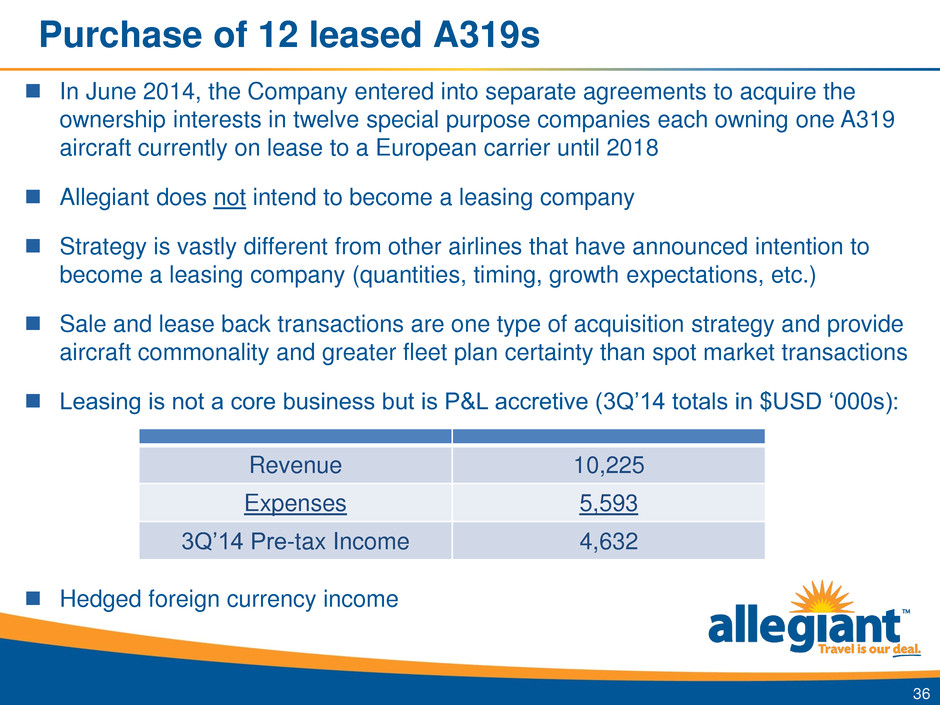
Purchase of 12 leased A319s In June 2014, the Company entered into separate agreements to acquire the ownership interests in twelve special purpose companies each owning one A319 aircraft currently on lease to a European carrier until 2018 Allegiant does not intend to become a leasing company Strategy is vastly different from other airlines that have announced intention to become a leasing company (quantities, timing, growth expectations, etc.) Sale and lease back transactions are one type of acquisition strategy and provide aircraft commonality and greater fleet plan certainty than spot market transactions Leasing is not a core business but is P&L accretive (3Q’14 totals in $USD ‘000s): Hedged foreign currency income 36 Revenue 10,225 Expenses 5,593 3Q’14 Pre-tax Income 4,632

Airbus update Current fleet of 10 A320 series aircraft (7 A320s + 3 A319s) Airbus transition allows for additional efficiency on variable costs for the higher utilization portion of the network while allowing us to maintain low costs at relatively low daily utilization High Degree of Commonality: – A319s previously operated by easyJet • 3 in service • 2 in delivery (see photo – N303NV) • 7 additional commitments • 12 owned and on lease – A320s previously operated by Iberia • 7 in service • 2 in delivery • 1 additional commitment 37
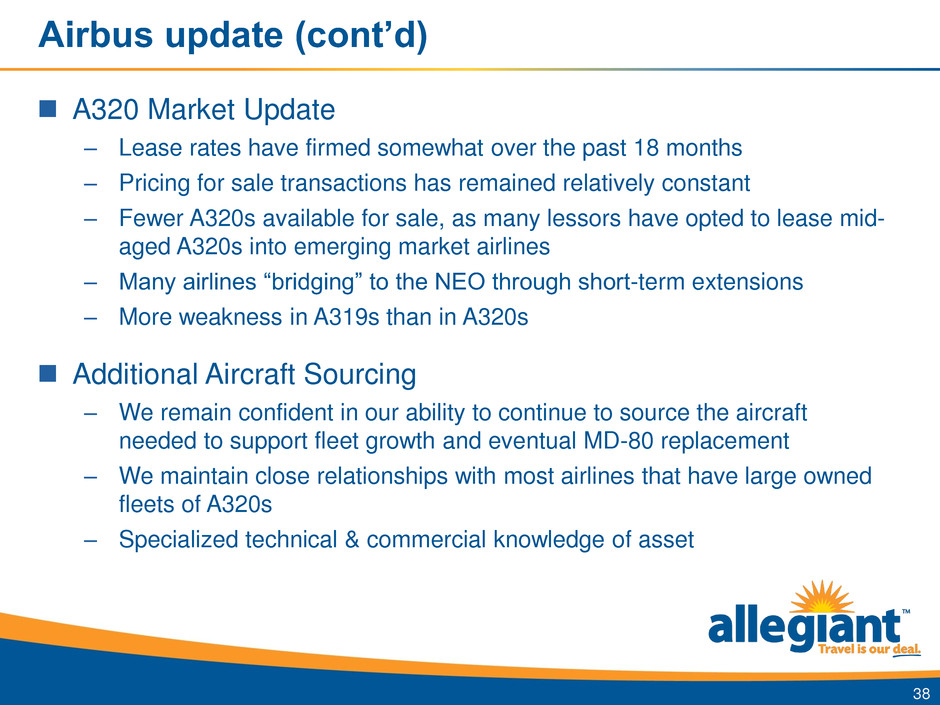
Airbus update (cont’d) A320 Market Update – Lease rates have firmed somewhat over the past 18 months – Pricing for sale transactions has remained relatively constant – Fewer A320s available for sale, as many lessors have opted to lease mid- aged A320s into emerging market airlines – Many airlines “bridging” to the NEO through short-term extensions – More weakness in A319s than in A320s Additional Aircraft Sourcing – We remain confident in our ability to continue to source the aircraft needed to support fleet growth and eventual MD-80 replacement – We maintain close relationships with most airlines that have large owned fleets of A320s – Specialized technical & commercial knowledge of asset 38
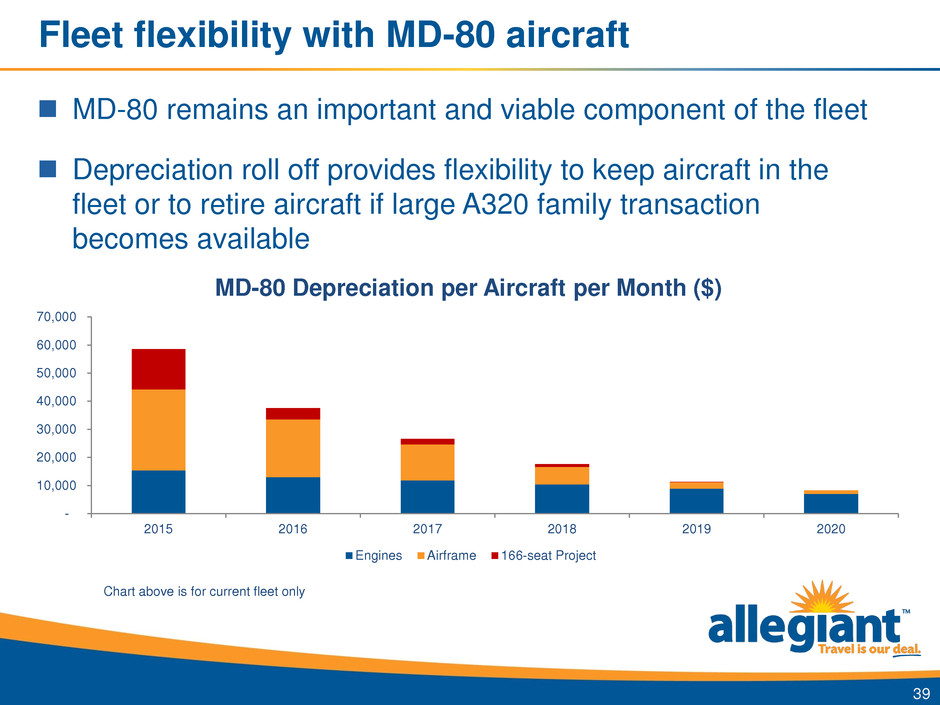
Fleet flexibility with MD-80 aircraft MD-80 remains an important and viable component of the fleet Depreciation roll off provides flexibility to keep aircraft in the fleet or to retire aircraft if large A320 family transaction becomes available 39 - 10,000 20,000 30,000 40,000 50,000 60,000 70,000 2015 2016 2017 2018 2019 2020 MD-80 Depreciation per Aircraft per Month ($) Engines Airframe 166-seat Project Chart above is for current fleet only
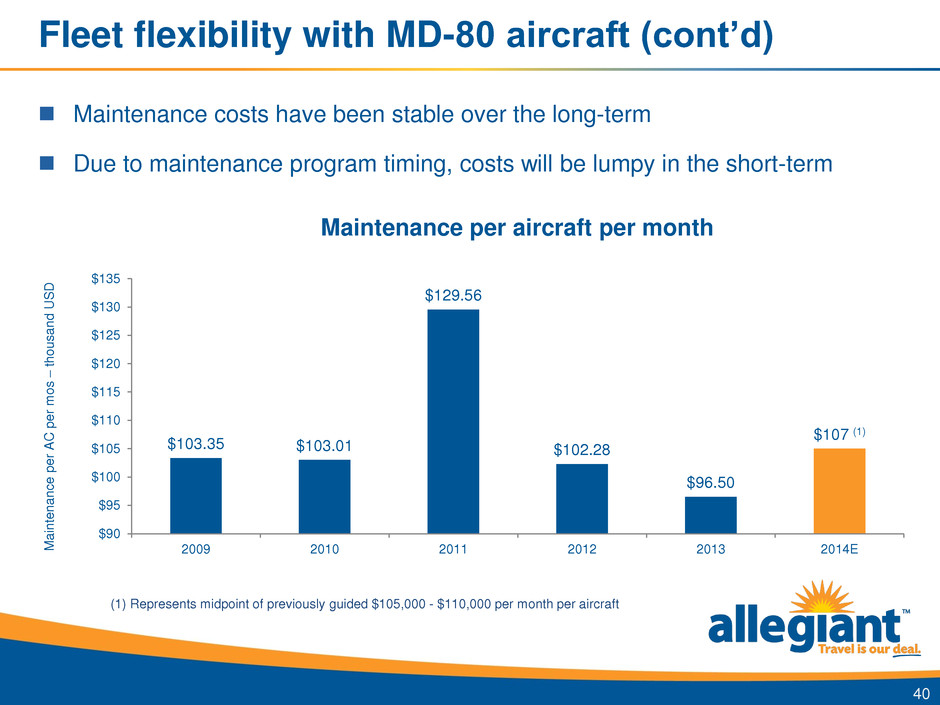
Fleet flexibility with MD-80 aircraft (cont’d) Maintenance costs have been stable over the long-term Due to maintenance program timing, costs will be lumpy in the short-term 40 $103.35 $103.01 $129.56 $102.28 $96.50 $107 (1) $90 $95 $100 $105 $110 $115 $120 $125 $130 $135 2009 2010 2011 2012 2013 2014EM a int e n a n c e p e r A C p e r m o s – th o u s a n d U S D Maintenance per aircraft per month (1) Represents midpoint of previously guided $105,000 - $110,000 per month per aircraft

Fleet flexibility with MD-80 aircraft (cont’d) Boeing has completed the FAA approval for the Widespread Fatigue Damage / Limit of Validity for the MD-80 at 110,000 cycles and 150,000 flight hours 41 ~ 58,000 cycles remaining on most restrictive aircraft = 77 yrs. @750 cycles / yr. ~ 80,000 flight hours remaining on most restrictive aircraft = 46 yrs. @1,750 flight hours /yr.
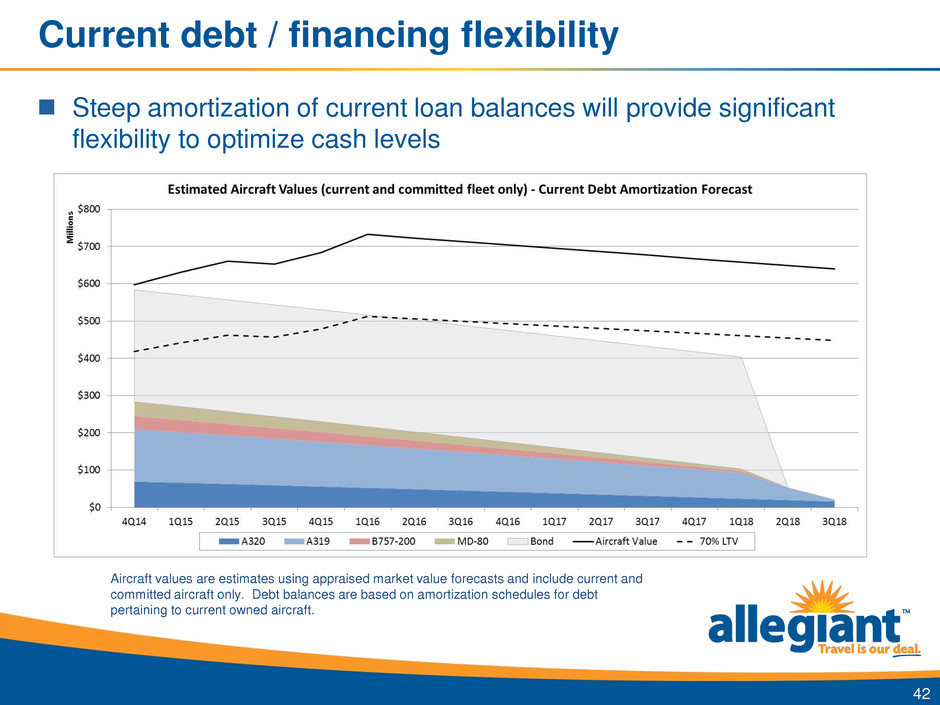
Current debt / financing flexibility Steep amortization of current loan balances will provide significant flexibility to optimize cash levels 42 Aircraft values are estimates using appraised market value forecasts and include current and committed aircraft only. Debt balances are based on amortization schedules for debt pertaining to current owned aircraft.
Marketing update Brian Davis – VP Business Development

Forward looking statements 44 This presentation as well as oral statements made by officers or directors of Allegiant Travel Company, its advisors and affiliates (collectively or separately, the "Company“) will contain forward- looking statements that are only predictions and involve risks and uncertainties. Forward-looking statements may include, among others, references to future performance and any comments about our strategic plans. There are many risk factors that could prevent us from achieving our goals and cause the underlying assumptions of these forward-looking statements, and our actual results, to differ materially from those expressed in, or implied by, our forward-looking statements. These risk factors and others are more fully discussed in our filings with the Securities and Exchange Commission. Any forward-looking statements are based on information available to us today and we undertake no obligation to update publicly any forward-looking statements, whether as a result of future events, new information or otherwise. The Company cautions users of this presentation not to place undue reliance on forward looking statements, which may be based on assumptions and anticipated events that do not materialize.
Bio Responsible for: – Marketing – Public relations – Loyalty – Co-branded credit card Joined Allegiant in 2005 Worked in government affairs, charters, fuel, and airport group at Allegiant The Wharton School – University of Pennsylvania – Master of Business Administration 45

Allegiant – 15 Years of Sunshine
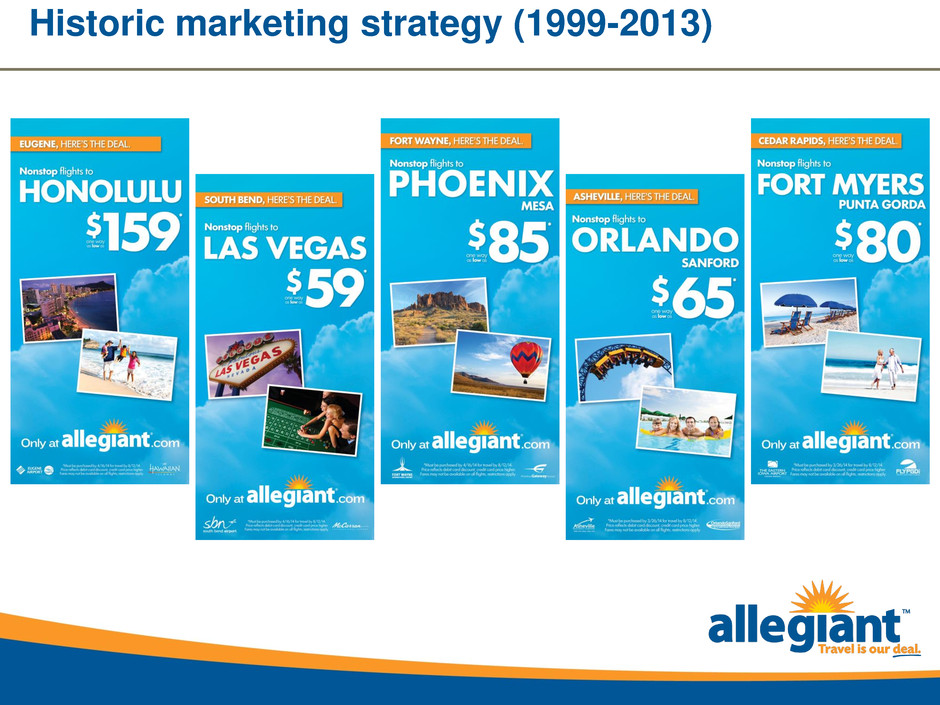
Historic marketing strategy (1999-2013)

Individual Local National 2013 2014 Allegiant – evolution of marketing strategy
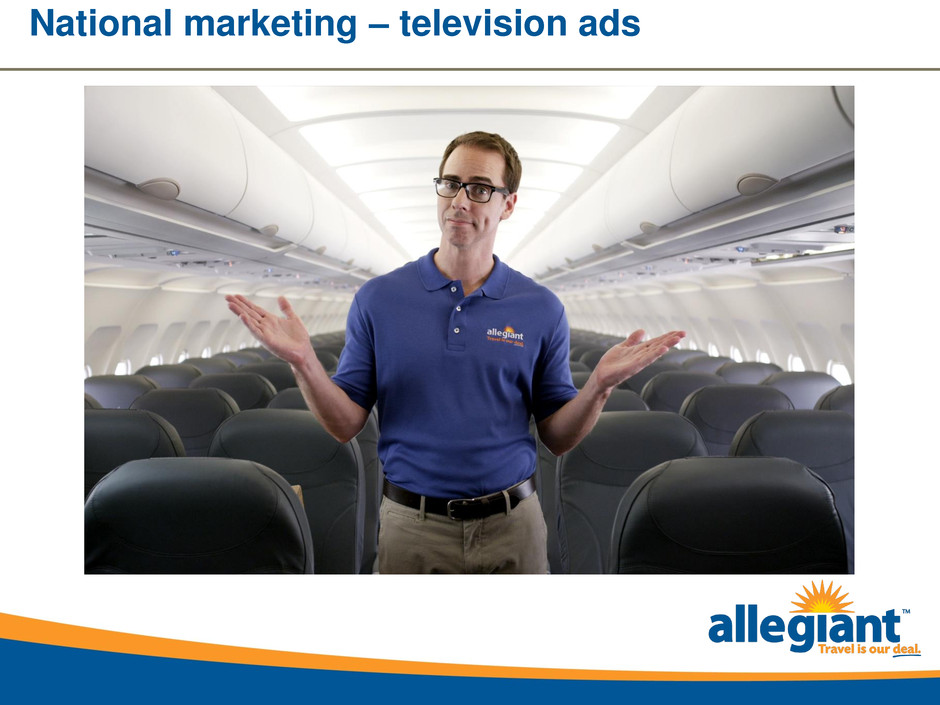
National marketing – television ads
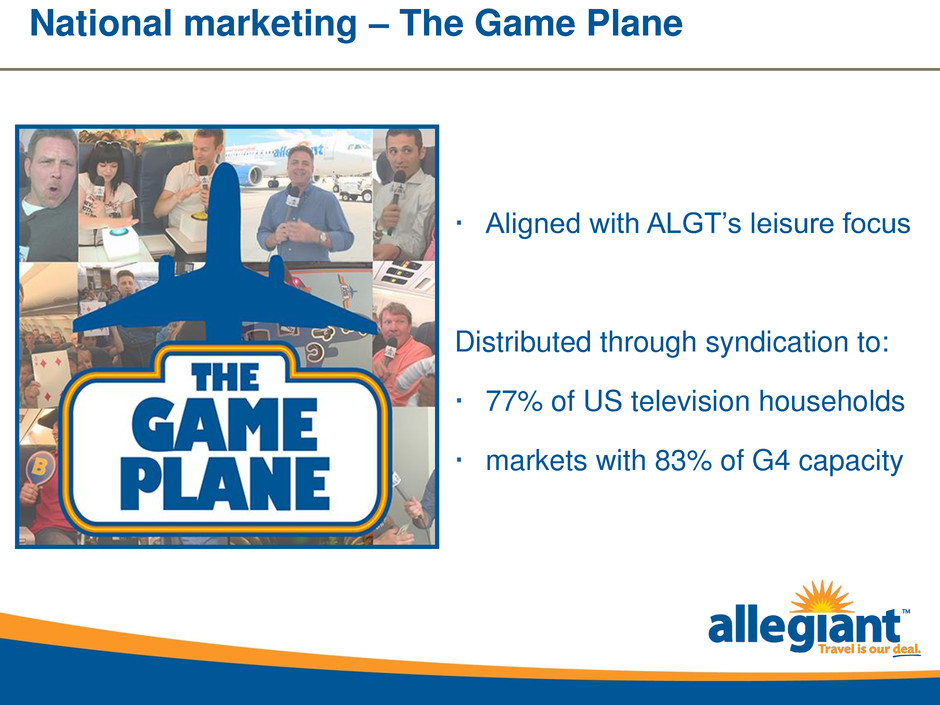
National marketing – The Game Plane Aligned with ALGT’s leisure focus Distributed through syndication to: 77% of US television households markets with 83% of G4 capacity
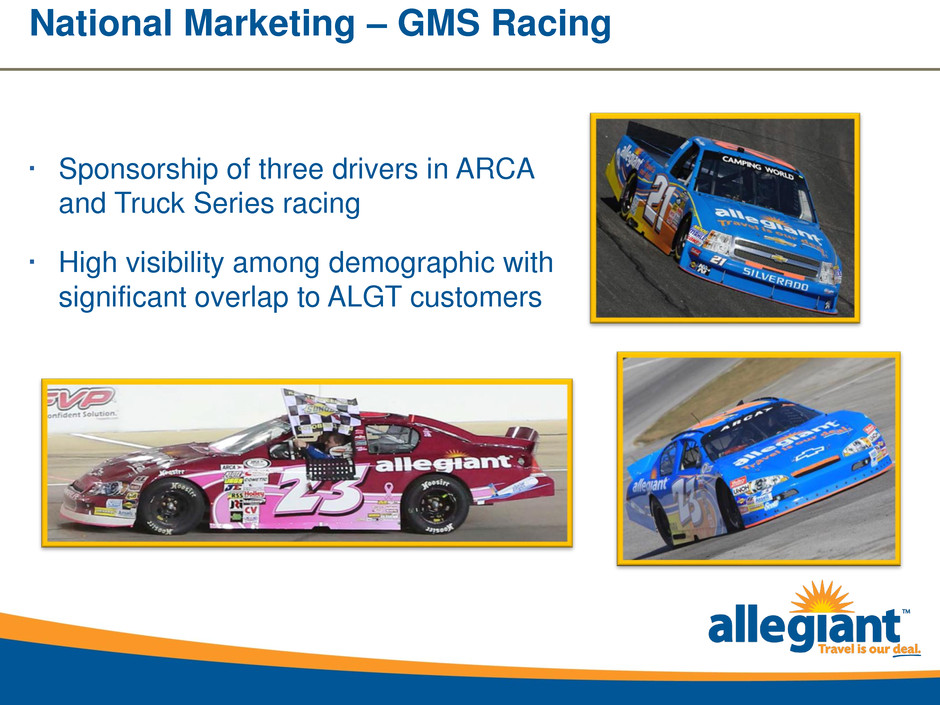
National Marketing – GMS Racing Sponsorship of three drivers in ARCA and Truck Series racing High visibility among demographic with significant overlap to ALGT customers

75% of all Make-A-Wish wishes involve air transportation Allegiant celebrated our 210th wish in November 2014 Created special aircraft livery to celebrate our 100th wish National marketing – Allegiant & Make-A-Wish
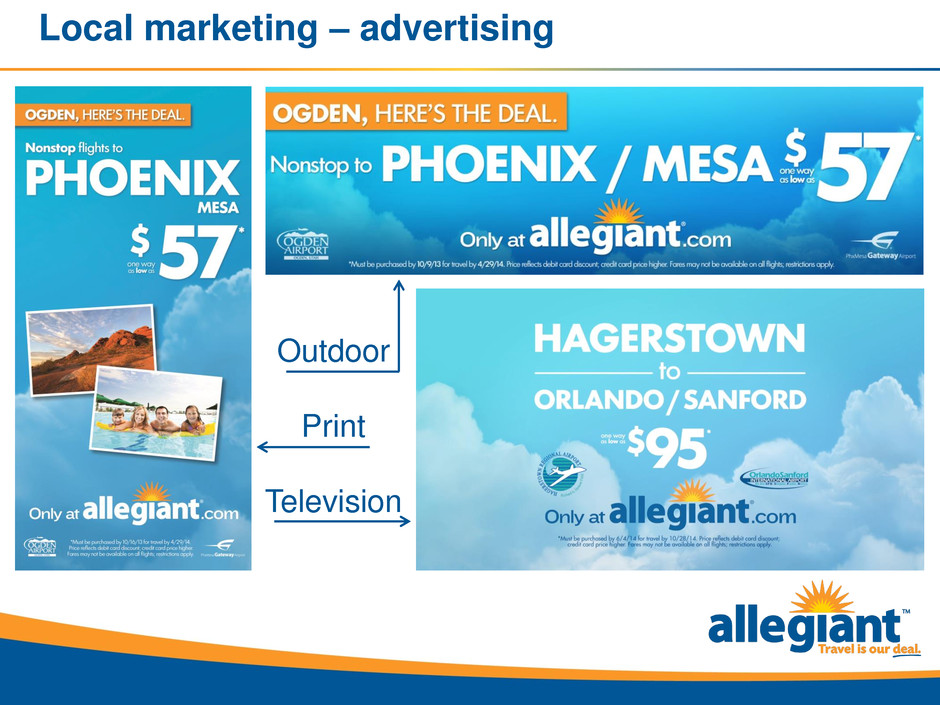
Outdoor Print Television Local marketing – advertising
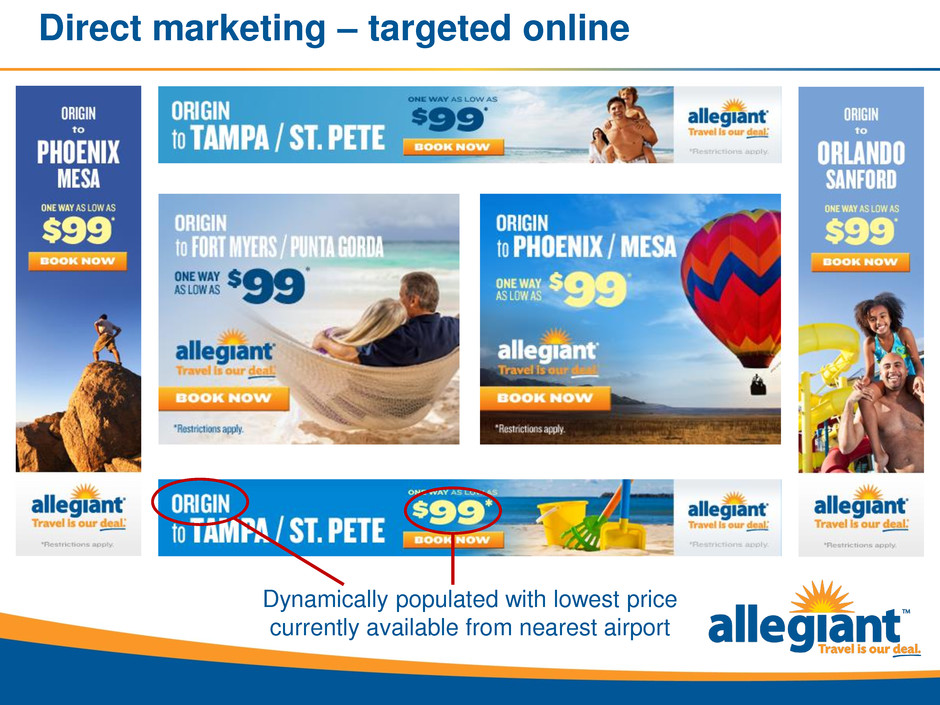
Dynamically populated with lowest price currently available from nearest airport Direct marketing – targeted online
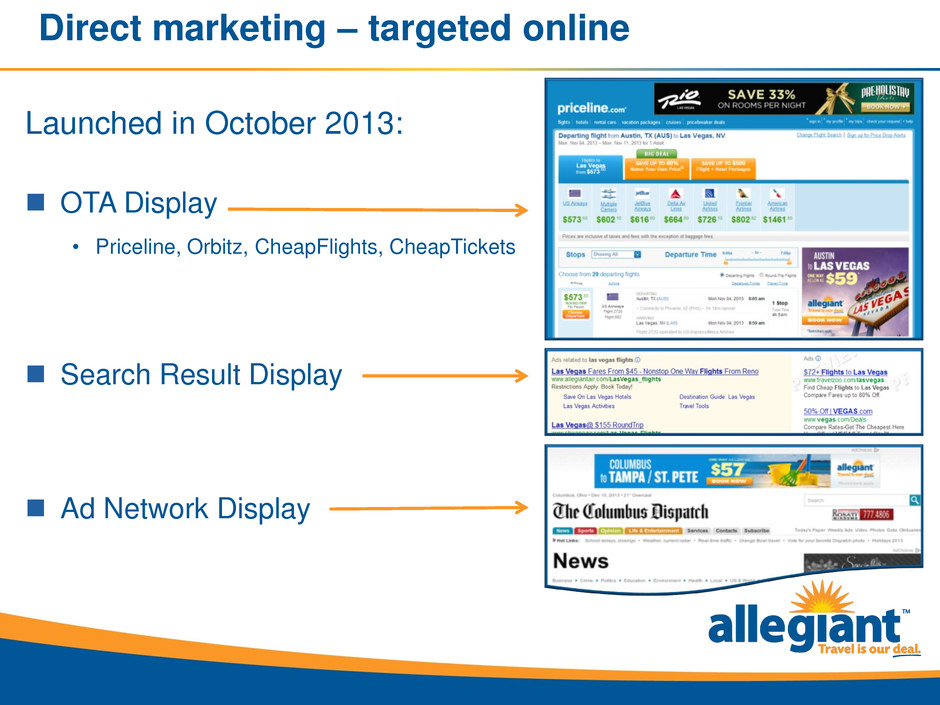
Launched in October 2013: OTA Display • Priceline, Orbitz, CheapFlights, CheapTickets Search Result Display Ad Network Display Direct marketing – targeted online

Industry Allegiant Unique Opens 10.7% 17.4% Click Through 1.5% 3.8% Unsubscribe 0.14% 0.12% • 4.6 Million Active Subscribers • Dynamic, Market-Specific Deals • Deep Links to Featured Deals Direct marketing – weekly email deals

Individual Local National 2013 2014 Evolution of marketing strategy
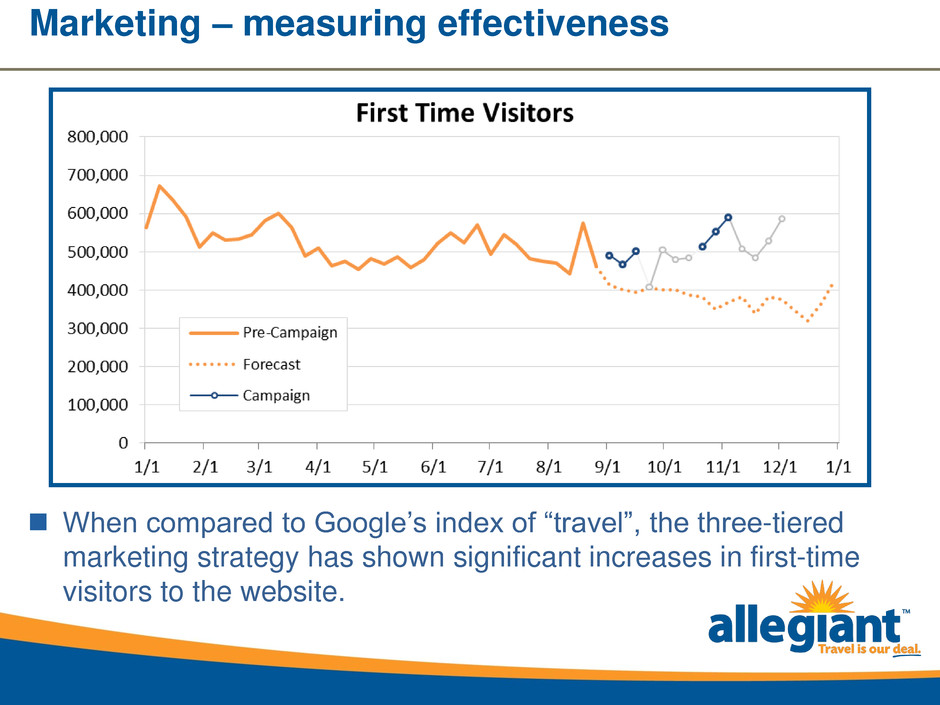
Marketing – measuring effectiveness When compared to Google’s index of “travel”, the three-tiered marketing strategy has shown significant increases in first-time visitors to the website.

Technology update Todd Cinnamon– VP IT

Forward looking statements 61 This presentation as well as oral statements made by officers or directors of Allegiant Travel Company, its advisors and affiliates (collectively or separately, the "Company“) will contain forward- looking statements that are only predictions and involve risks and uncertainties. Forward-looking statements may include, among others, references to future performance and any comments about our strategic plans. There are many risk factors that could prevent us from achieving our goals and cause the underlying assumptions of these forward-looking statements, and our actual results, to differ materially from those expressed in, or implied by, our forward-looking statements. These risk factors and others are more fully discussed in our filings with the Securities and Exchange Commission. Any forward-looking statements are based on information available to us today and we undertake no obligation to update publicly any forward-looking statements, whether as a result of future events, new information or otherwise. The Company cautions users of this presentation not to place undue reliance on forward looking statements, which may be based on assumptions and anticipated events that do not materialize.
Bio Responsible for: – Software development lifecycle for Allegiant portfolio Joined Allegiant in 2012 24+ years in the travel space, including American Airlines, Sabre, GetThere.com and United (pre-merger) BS in Computer Science, Rensselaer Polytechnic Institute Masters in Software Engineering, Texas Christian University 62

Platform advantages Scalability Flexibility and agility Marketing drives, not IT Code/service re-use Ability to perform Quality Assurance at all levels of the platform 63
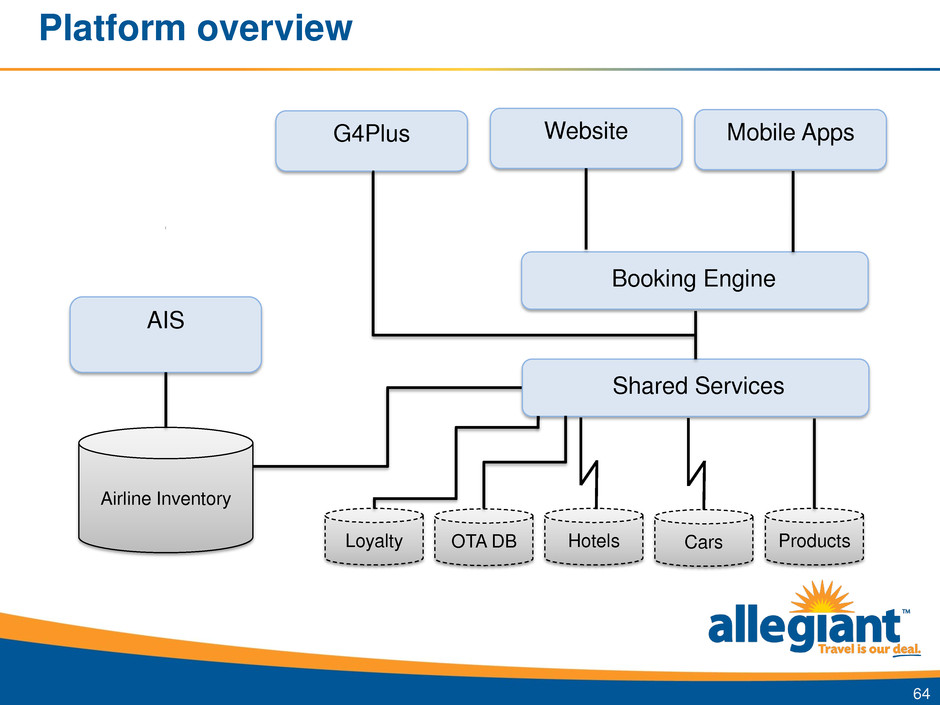
Platform overview 64 AIS Airline Inventory Website Mobile Apps Booking Engine Hotels Cars Products Shared Services G4Plus OTA DB Loyalty
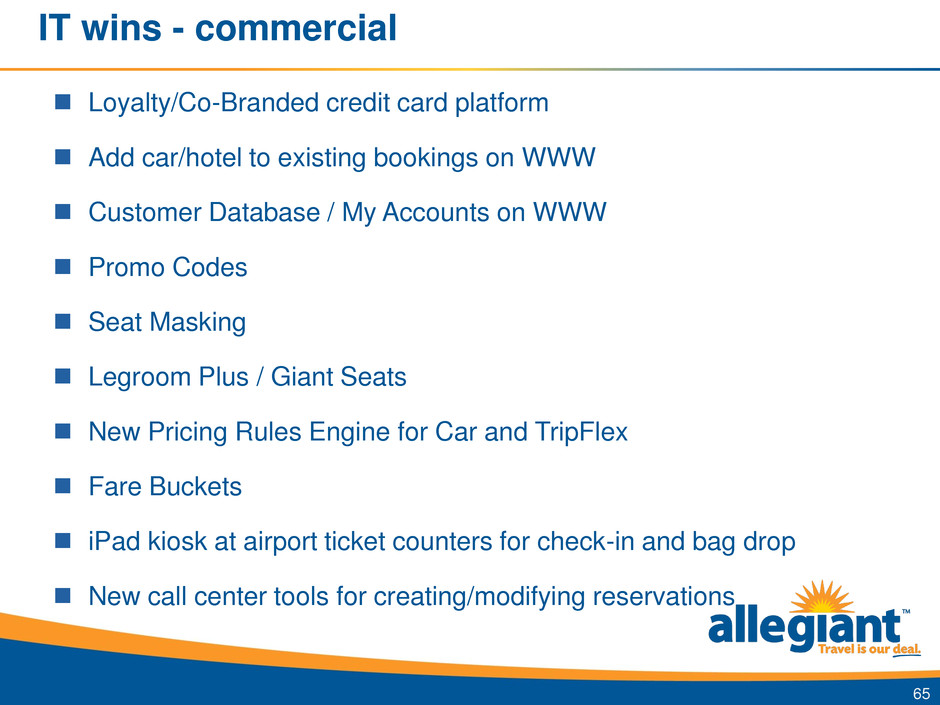
IT wins - commercial Loyalty/Co-Branded credit card platform Add car/hotel to existing bookings on WWW Customer Database / My Accounts on WWW Promo Codes Seat Masking Legroom Plus / Giant Seats New Pricing Rules Engine for Car and TripFlex Fare Buckets iPad kiosk at airport ticket counters for check-in and bag drop New call center tools for creating/modifying reservations 65
IT wins – airline operations iPads for mechanics on the line New boarding software at airport gates (DCS 1.0) Automated weight and balance / Eliminate F/A counts Mobile Check in 66
End of year pipeline Hotels for small markets (Priceline) Credit card surcharge 67
Ancillary update Jude Bricker – SVP Planning
Forward looking statements 69 This presentation as well as oral statements made by officers or directors of Allegiant Travel Company, its advisors and affiliates (collectively or separately, the "Company“) will contain forward- looking statements that are only predictions and involve risks and uncertainties. Forward-looking statements may include, among others, references to future performance and any comments about our strategic plans. There are many risk factors that could prevent us from achieving our goals and cause the underlying assumptions of these forward-looking statements, and our actual results, to differ materially from those expressed in, or implied by, our forward-looking statements. These risk factors and others are more fully discussed in our filings with the Securities and Exchange Commission. Any forward-looking statements are based on information available to us today and we undertake no obligation to update publicly any forward-looking statements, whether as a result of future events, new information or otherwise. The Company cautions users of this presentation not to place undue reliance on forward looking statements, which may be based on assumptions and anticipated events that do not materialize.

Revenue initiatives Fare buckets Seat assignment pricing Pre-paid bag pricing Charge for check-in TripFlex pricing 70
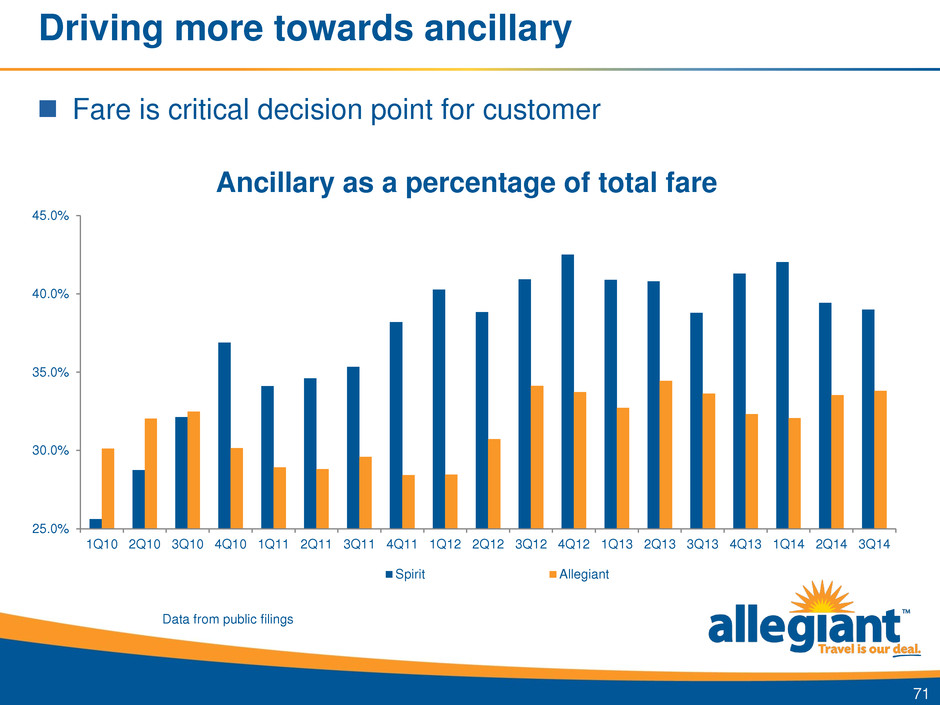
Driving more towards ancillary Fare is critical decision point for customer 71 25.0% 30.0% 35.0% 40.0% 45.0% 1Q10 2Q10 3Q10 4Q10 1Q11 2Q11 3Q11 4Q11 1Q12 2Q12 3Q12 4Q12 1Q13 2Q13 3Q13 4Q13 1Q14 2Q14 3Q14 Ancillary as a percentage of total fare Spirit Allegiant Data from public filings
Third party ancillary Factors on hotels – Network shift to the East – End of most favorable room rates from the CET contract in August 2013 – End of the air subsidy in November 2012 Car bookings are improving based on new pricing tools 72
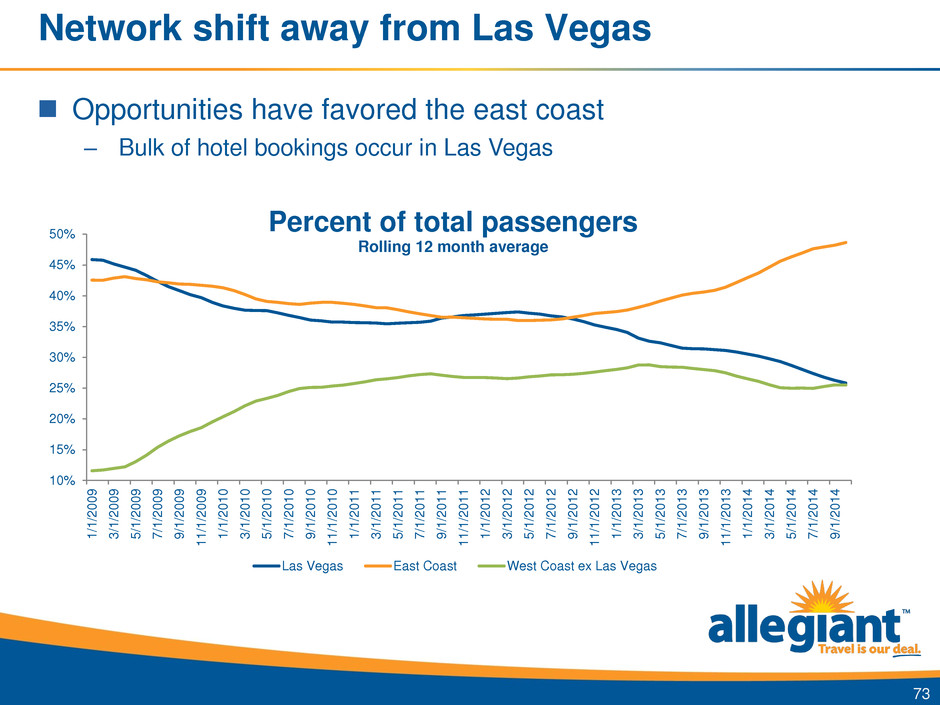
Network shift away from Las Vegas Opportunities have favored the east coast – Bulk of hotel bookings occur in Las Vegas 73 10% 15% 20% 25% 30% 35% 40% 45% 50% 1 /1/ 2 0 0 9 3 /1/ 2 0 0 9 5 /1/ 2 0 0 9 7 /1/ 2 0 0 9 9 /1/ 2 0 0 9 1 1 /1 /2 0 0 9 1 /1/ 2 0 1 0 3 /1/ 2 0 1 0 5 /1/ 2 0 1 0 7 /1/ 2 0 1 0 9 /1/ 2 0 1 0 1 1 /1 /2 0 1 0 1 /1/ 2 0 1 1 3 /1/ 2 0 1 1 5 /1/ 2 0 1 1 7 /1/ 2 0 1 1 9 /1/ 2 0 1 1 1 1 /1 /2 0 1 1 1 /1/ 2 0 1 2 3 /1/ 2 0 1 2 5 /1/ 2 0 1 2 7 /1/ 2 0 1 2 9 /1/ 2 0 1 2 1 1 /1 /2 0 1 2 1 /1/ 2 0 1 3 3 /1/ 2 0 1 3 5 /1/ 2 0 1 3 7 /1/ 2 0 1 3 9 /1/ 2 0 1 3 1 1 /1 /2 0 1 3 1 /1/ 2 0 1 4 3 /1/ 2 0 1 4 5 /1/ 2 0 1 4 7 /1/ 2 0 1 4 9 /1/ 2 0 1 4 Percent of total passengers Rolling 12 month average Las Vegas East Coast West Coast ex Las Vegas
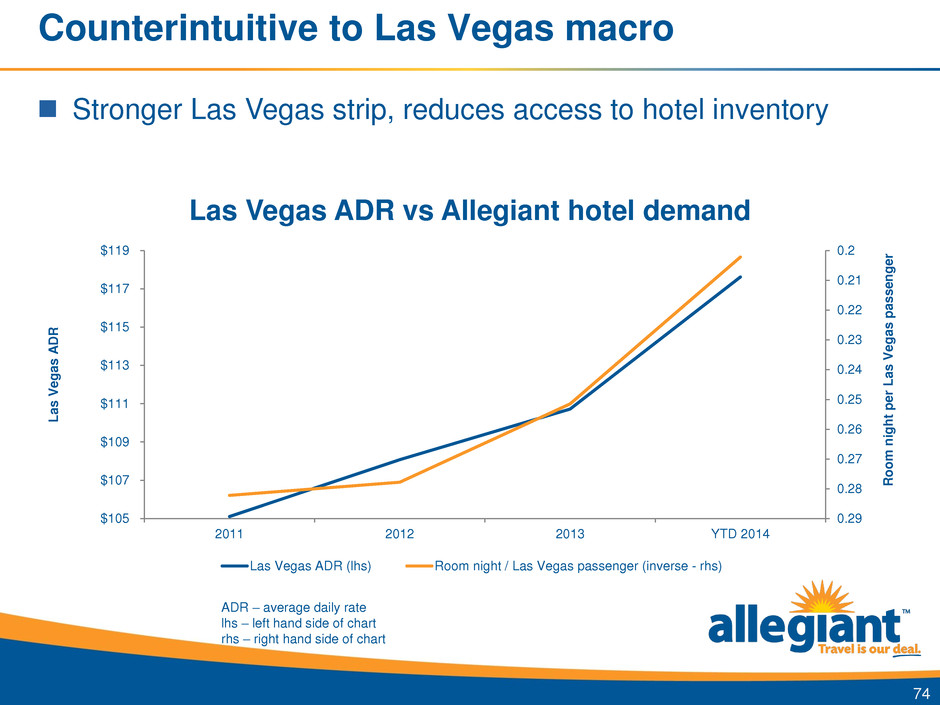
Counterintuitive to Las Vegas macro Stronger Las Vegas strip, reduces access to hotel inventory 74 0.2 0.21 0.22 0.23 0.24 0.25 0.26 0.27 0.28 0.29 $105 $107 $109 $111 $113 $115 $117 $119 2011 2012 2013 YTD 2014 R o o m n ig h t per L a s V egas p a s s e n g e r L a s V egas A D R Las Vegas ADR vs Allegiant hotel demand Las Vegas ADR (lhs) Room night / Las Vegas passenger (inverse - rhs) ADR – average daily rate lhs – left hand side of chart rhs – right hand side of chart

Q&A Maury Gallagher – Chairman & CEO

2015 Scheduled ASMs +9 to 13% 2015 CASM ex fuel (4) to 0% 2015 CAPEX $175mm to $185mm 2015 Guidance 76
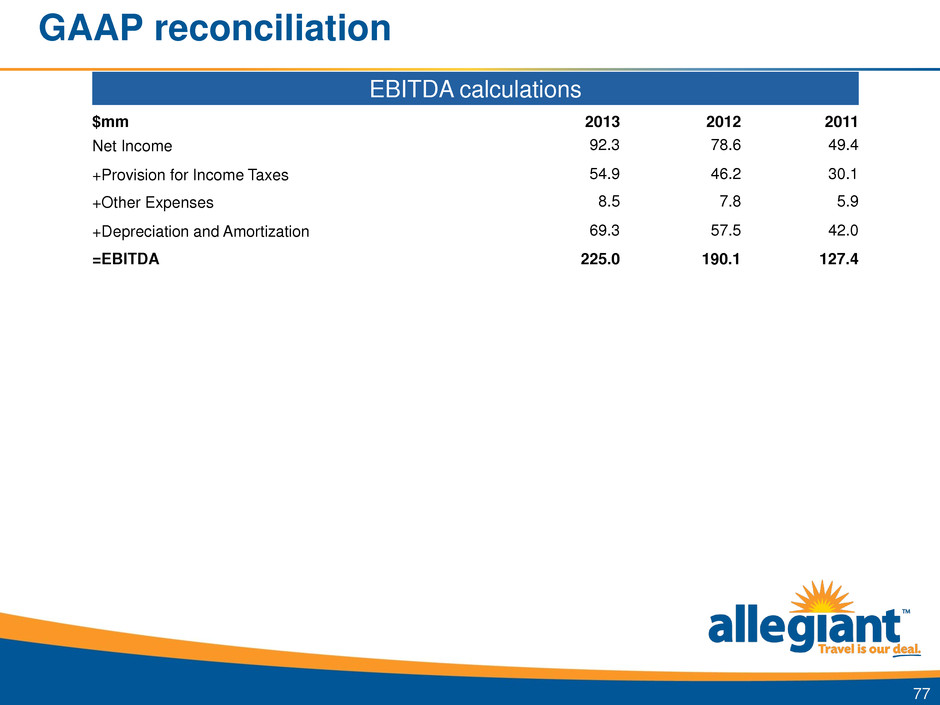
GAAP reconciliation EBITDA calculations 77 $mm 2013 2012 2011 Net Income 92.3 78.6 49.4 +Provision for Income Taxes 54.9 46.2 30.1 +Other Expenses 8.5 7.8 5.9 +Depreciation and Amortization 69.3 57.5 42.0 =EBITDA 225.0 190.1 127.4


