
2016 investor day

Forward looking statements This presentation as well as oral statements made by officers or directors of Allegiant Travel Company, its advisors and affiliates (collectively or separately, the "Company“) will contain forward-looking statements that are only predictions and involve risks and uncertainties. Forward-looking statements may include, among others, references to future performance and any comments about our strategic plans. There are many risk factors that could prevent us from achieving our goals and cause the underlying assumptions of these forward-looking statements, and our actual results, to differ materially from those expressed in, or implied by, our forward-looking statements. These risk factors and others are more fully discussed in our filings with the Securities and Exchange Commission. Any forward-looking statements are based on information available to us today and we undertake no obligation to update publicly any forward-looking statements, whether as a result of future events, new information or otherwise. The Company cautions users of this presentation not to place undue reliance on forward-looking statements, which may be based on assumptions and anticipated events that do not materialize.

Welcome Maury Gallagher– CEO

State of the state • Past solid financial performance • Operations focus o Catch up with the commercial side of the business o Excellent progress this year – more work to do • Transition to all Airbus fleet underway • Strategy remains constant – great deal of runway in front of us o Focus on leisure customer o Low frequency/utilization o Used aircraft o Low cost o Efficient use of capital • Aggressive focus on “other” revenue • Enhance the travel company • Terrific management team

New roles John Redmond - President

Corporate focus • Talent • IT • Right sizing •Execution
Third party focus • Cars •Hotels o Inventory o Content o Direct connect o Analytics o We know you and where you are • Other

IT update Scott Allard - CIO

Wired for the Future *AIS – proprietary, tightly-coupled web-based application *Reservations/Airline Ops/Mx Ops/General Ledger *Platform control has allowed accelerated innovation *Aging platform presents scalability & enhancement challenges *G4Plus – next generation, loosely-coupled, web service-based suite *Common business logic across web, mobile, internal, external apps *Ecommerce platform most mature *Operations apps underway Platform Evolution:

Leveraging platform investment 100+ web services created 57 Applications running in G4+ portal 20 million web service calls per day Average response time:140 milliseconds Website Call Center Mobile Operations

eCommerce…solid foundation for future Foundational work continues: *14 modules completed *4 modules due 1Q17 *5 modules remaining *Customer-centered sales with integrated loyalty *Dynamic packaging of 3rd-party products *Rules-based pricing of rental cars, hotels pending *CMS, exhaustive data reporting, multivariate UI testing 98% revenue booked on new platform Capabilities:

Customer mobile Mobile Functionality Mobile Usage Check-in/Alerts 1.6M users since 6/16 Purchase Seats/Bags 40K users / day IROP Self Service/Change/Canc el 7.5k new users / day Post travel customer surveys 50% of pax check-in’s Bookings coming Q1 2017 IOS / Android

Employee mobile –extensive task driven connectivity • Sales • Manuals • Forms •Kiosks •Event Driven Notifications •Manuals •Wakeup Checks •IPC •Log Book •EFB •Weather •Log Book •Manuals •Nav Flight Ops Mx Infllght Stations & Cust Ops 2200+ Devices to personnel
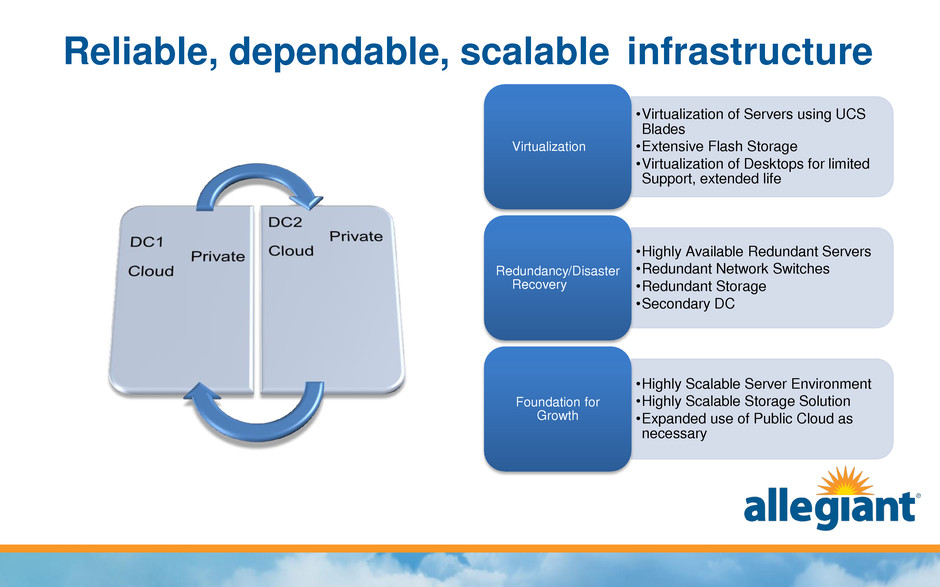
Reliable, dependable, scalable infrastructure •Virtualization of Servers using UCS Blades •Extensive Flash Storage •Virtualization of Desktops for limited Support, extended life Virtualization •Highly Available Redundant Servers •Redundant Network Switches •Redundant Storage •Secondary DC Redundancy/Disaster Recovery •Highly Scalable Server Environment •Highly Scalable Storage Solution •Expanded use of Public Cloud as necessary Foundation for Growth

Leveraging the cloud for a big data future IBM Cloudant / DB2 in the Cloud: * Real-time insight into customer behavior on the website. * Proactive monitoring of site activity. Future Predictive Analytics Leveraging NoSQL : * Redis- Key Value Store Caching Real-time aggregations * Mongo db- Document based data store Big Data Frameworks: * Apache Hadoop: Big Data storage * Apache Spark : Big Data execution framework

Award winning investments in infrastructure: 2016 Security Innovation Award/Americas - Check Point Software Technologies 2016 Software Innovators Award - Honorable Mention - HP Enterprise 2016 Brandon Hall Group Excellence in Learning Bronze Award 2015 Best in Class Information Security Program/International- HP Enterprise 2015 IBM Beacon Award Winner

Improved software development velocity Monthly platform releases (75% reduction in post-release related patches 19% increase in overall major releases year over year 57 in 2015, tracking to 68 in 2016 Software Quality Assurance runs around the clock with an onshore/offshore team Automated Deployment of Applications Load/Performance testing now integrated into a standard cycle

Extending platform for future development *Extension of the new pattern through ticket counters *Enhanced Mobile functionality *Enhanced self-service tools = smoother IROPS *Leveraging common services for applications *Continued eCommerce enhancements *Extension of Web Functionality to Mobile

Self service IROPS – a case study in reuse Project Goals: 1. Streamline the rescheduling of flights 2. Empower customers to select their own resolution Solution: Reuse of several existing web services Creation of 1 new web service Stitched together with situational business logic (cancel, reschedule known, reschedule unknown) in a G4Plus Portal Application Total Project duration: 71 calendar days

eCommerce & credit card Brian Davis– VP Marketing

Air Ancillary Purchase Path Flexible Fare In-App Purchase Third Party Automated Pricing Round-Trip Disc. Mobile Website Product Personalization Automatic Cancel Multi-Variant Testing Payment Options Loyalty Launch / Grow Credit Card Point Earning Partnerships eCommerce: roadmap

eCommerce: multi-variant testing • Results of Test #1: Increase in Click-Thru Rate of +1.05% • Currently on Test #4 (from a pipeline of 200+)

eCommerce: third-party initiatives • Experiment with Autos Apply learning with Hotels • 1Q15 - Introduced tri-brands (Alamo, Enterprise, & National) • 2Q15 – Revised pricing methodology based on margin of opportunity “MOO” • 3Q16 – Signed new 4-year agreement with EHI, capturing new opportunities including secondary airport price parity 700,000 800,000 900,000 1,000,000 1,100,000 1,200,000 1,300,000 1,400,000 1,500,000 1,600,000 6,000,000 7,000,000 8,000,000 9,000,000 10,000,000 11,000,000 12,000,000 13,000,000 14,000,000 15,000,000 De c -1 3 F e b -1 4 A p r- 1 4 J u n -1 4 A u g -1 4 O c t- 1 4 De c -1 4 F e b -1 5 A p r- 1 5 J u n -1 5 A u g -1 5 O c t- 1 5 De c -1 5 F e b -1 6 A p r- 1 6 J u n -1 6 A u g -1 6 O c t- 1 6 Car Days vs. System PAX System PAX Car Days
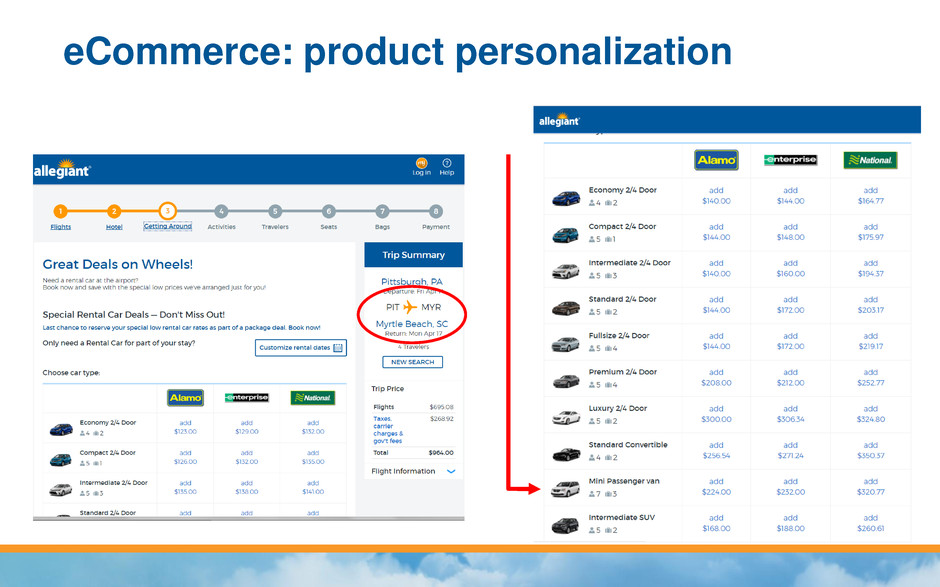
eCommerce: product personalization

Co-branded credit card • Launched on September 1st, 2016 • Partnership with Bank of America + MasterCard • Designed for Allegiant’s infrequent, leisure traveler • Based on principles of value and simplicity • Allegiant is primarily an opportunity to “burn”, not “earn”
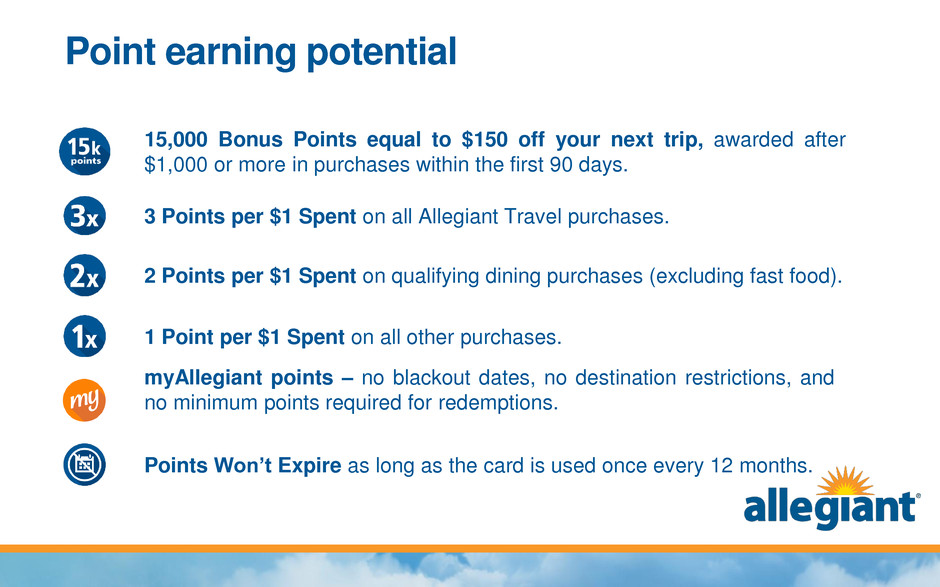
Point earning potential 15,000 Bonus Points equal to $150 off your next trip, awarded after $1,000 or more in purchases within the first 90 days. 3 Points per $1 Spent on all Allegiant Travel purchases. 2 Points per $1 Spent on qualifying dining purchases (excluding fast food). 1 Point per $1 Spent on all other purchases. Points Won’t Expire as long as the card is used once every 12 months. myAllegiant points – no blackout dates, no destination restrictions, and no minimum points required for redemptions.

Redeeming myAllegiant points

Additional travel benefits Free Inflight Beverage when cardholder shows their Allegiant MasterCard. Priority Boarding on Allegiant flights. myAllegiant Member Services – dedicated phone line for cardholders Buy One, Get One Free Airfare when card is used to purchase a vacation package with 4 hotel nights or 7 rental car days.

Incremental revenue potential ($m) 2017E 2020E eCommerce Initiatives $14 $92 Co-Branded Credit Card 10 45 Total $24m $137m Estimates are based on various assumptions which may not materialize

Transition cost impact Trent Porter – VP FP&A

2017 foundation investments 5 used A319s, 4 used A320s and 9 new A320s Headwind: Increase depreciation expense by $15m Tailwind: Increase ASMs/Gallon by 2% (inclusive effect of 757 retirements) Fleet Acquisitions Fleet Retirements 4 B757s and 8 MD80s Headwind: Accelerated depreciation expense of $7.5m Tailwind: Avoid heavy maintenance events for $10m Pilot Contract First full year of new pilot contract Headwind: 2017-over-2016 increase of $30 - $35m Tailwind: Lower attrition, higher number of applicants, fund transition training

Capex & Airbus heavy maintenance 315 360 190 295 270 54 55 58 60 62 18 30 30 75 65 2016E 2017E 2018E 2019E 2020E Aircraft Other Capex Heavy Maintenance Estimates are based on various assumptions which may not materialize Other Capex includes Capex for IT projects as well as other non-aircraft CAPEX Heavy maintenance consists of Airbus heavy airframe visits and engine expenses to be capitalized 387 M ill io n s U S D 445 278 430 397

2017 pilot contract impact $153 $153 $216 $216 $125 $145 $165 $185 $205 $225 $245 $265 Jan-10 Jan-15 Jul-16 Jan-17 G4 F9 (14yr) NK (15yr) 1 - Dataset includes top of scale rates for B737s & A320s for Alaska, Allegiant, American, Delta, Frontier, jetBlue, Southwest, Spirit, Virgin America, United G4 = Allegiant, F9 = Frontier, NK = Spirit. Frontier numbers at 14 year captain pay rates, Spirit numbers at 15 year captain pay rates

2017 CASM ex-fuel (¢) build 5.95 6.25 0.25 0.05 0.11 0.06 0.07 5.60 5.80 6.00 6.20 6.40 6.60 2016E CASM ex- Fuel (¢) Pilot Contract Accelerated Dep Add'l AC Dep Heavy Mtx Dep MD80 Heavy Mtx 2017E CASM ex- Fuel (¢) 6.48 +5 – 9% U S c e n ts Estimates are based on various assumptions which may not materialize

5.99 0.34 0.35 0.12 0.27 0.33 5.6 6.1 6.6 7.1 7.6 8.1 8.6 9.1 2017E CASM (¢) Fuel Efficiency AC/Hvy Mtx Depreciation MD80 Heavy Mtx Pilot Productivity Other Efficiencies 2020E CASM (¢) 6.37 midpoint of 2017 CASM ex guidance 2020 CASM (¢) build 8.03 1 – 2017 CASM built using 2017 estimated burn rate and current fuel price of $1.75 2 – Fuel efficiency savings estimated using 2020 burn rate and current fuel price of $1.75 CASM ex guidance is estimated and subject to change Fuel Efficiency 2 8.73 1 U S c e n ts

2017 guidance • FY 2017 system ASMs +8 to 12% versus FY 2016 • FY 2017 CASM ex fuel +5 to 9% versus FY 2016 • FY 2017 maintenance per aircraft per month $90 - $100 thousand • FY 2017 depreciation per aircraft per month $125 - $135 thousand • FY 2017 CAPEX $415m* • FY 2017 Airbus heavy maintenance $30m *- Excludes Airbus heavy maintenance Guidance subject to change

Network and revenue Lukas Johnson – VP Network and Pricing

Network and revenue Flexible capacity plans based on macro environment Catching our breath, connecting the dots Network runway long (and getting longer) Network Revenue Management Complexity of network/schedule, effect on revenue management Unique pricing environment for Allegiant, need a customized solution New AI-based revenue management system implemented 2017 Guidance Scheduled service ASM growth of +8-12% Fixed fee revenue of $40m Guidance subject to change

Single plane flexible capacity example - 5 ₵ 10 ₵ 15 ₵ Wed Thu Fri Sat Sun Mon Tue Week 2014 - Lower utilization - 5 ₵ 10 ₵ 15 ₵ Wed Thu Fri Sat Sun Mon Tue Week 2016 - Higher utilization TRASM Variable CASM 2014 Variable CASM - 5 ₵ 10 ₵ 15 ₵ Wed Thu Fri Sat Sun Mon Tue Week 2014 Utilization with 2016 CASM AC/year average EBIT = $2.3m TRASM = 12.71 EBIT = $4.6m TRASM = 10.98 EBIT = $4.0m TRASM = 12.08 Colors represent two different markets flown by the same plane

Network: catching our breath 0 1 2 3 4 5 6 7 8 New cities launched by quarter • Low oil allowed us to accelerate new city development the past two years • New city growth will slow as we transition to an all-Airbus fleet • Focus on maturing markets and connect- the-dot opportunities -10 0 10 20 30 40 50 60 70 80 YoY change in markets

Network runway long (and getting longer) Future market growth as of: 2010 (blue) • Small airports to large destinations only • 150 potential markets 2015 (orange) • Added mid-size airports, secondary destinations • 300 potential markets 2020E (green) • Add international, all-airbus fleet • 450 potential markets Destinations Older Newer D 4 8 A irp o rt siz e S m a lle r L a rg e r

Unique network and schedule • Complexity in less than daily schedules allows for better matching capacity with demand • Complex schedules requires lower utilization and systems / work rules / specifically built for the business model 95% Daily 82% Daily 52% Daily 3% Daily 0% 2x/Week 2% 2x/Week 1% 2x/Week 65% 2x/Week 0% 10% 20% 30% 40% 50% 60% 70% 80% 90% 100% Southwest Spirit Frontier Allegiant Unique market schedules by carrier Each color represents a unique weekly market schedule Offpeak represents flights on Tuesday, Wednesday, Saturday in non-holiday weeks % of flights that are offpeak 42% 43% 43% 23%

An economic sandbox • Allegiant has the unique position of being able to control schedules / fares in most markets • Leisure customers are extremely price sensitive • Opportunity to create a pricing system with value only to Allegiant 4% 13% 83% Competitive $75+ Advantage No Competition Allegiant market fare comparison

Schedule change pricing example • Less than daily schedules have large, varied revenue shifts • Traditional RM systems had difficulty with our small sample sizes and schedule design • Designed our system with small markets / less than daily schedules in mind 0% 10% 20% 30% 40% 50% 60% 70% 80% 90% 100% 024681012141618202224262830 Weeks Out S e lli n g F ar e L o a d F a c to r Booking curve by day of week Wednesday - LF Thursday - LF Wednesday - Fare Thursday - Fare

Flight history demand aggregation First Gen Allegiant System: Aggregate based on regions and haul Traditional RM system: Aggregate based on market

Pricing better, but room for improvement 0% 5% 10% 15% 20% 25% 30% 35% 0% 10% 20% 30% 40% 50% 60% 70% 80% 90% % o f fl ig h ts Standard deviation of fares sold / Average fare of flight Flight pricing distribution Well priced flights Before 1st gen system Current

First generation RM system results • New RM system started pricing flights 4Q 2010 • +10% PRASM difference vs US mainline domestic in 2011 • 48% of flights still hand- managed by analysts -15% -10% -5% 0% 5% 10% 15% 20% 25% 1Q10 2Q10 3Q10 4Q10 1Q11 2Q11 3Q11 4Q11 G4 - Mainline Domestic PRASM Difference 2010-2011 G4 minus US Domestic PRASM RM System
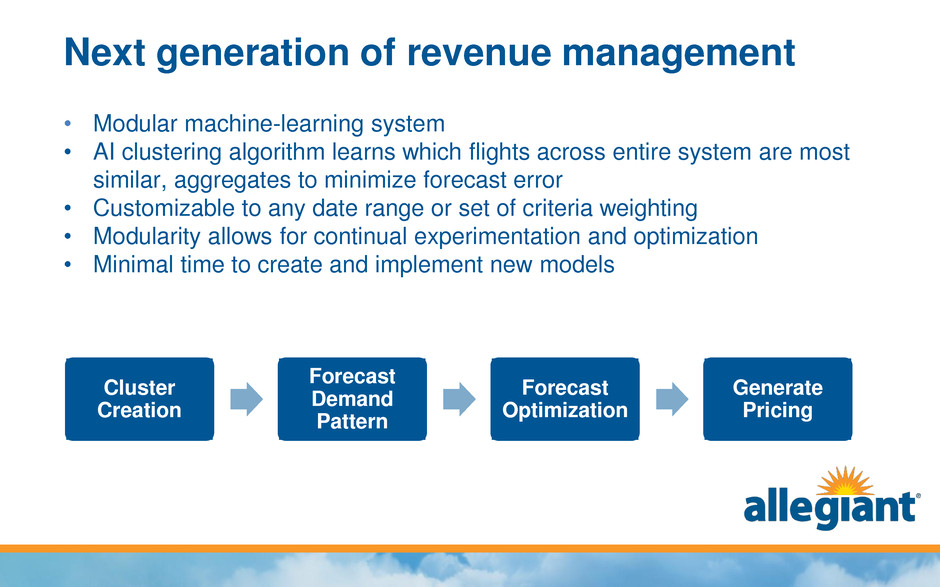
Next generation of revenue management • Modular machine-learning system • AI clustering algorithm learns which flights across entire system are most similar, aggregates to minimize forecast error • Customizable to any date range or set of criteria weighting • Modularity allows for continual experimentation and optimization • Minimal time to create and implement new models Cluster Creation Forecast Demand Pattern Forecast Optimization Generate Pricing

Flight clustering example First Gen Allegiant system: Aggregate based on regions and haul Next Gen Allegiant system: Aggregates individual flights into best-fit demand clusters

Module optimization example • Can update forecast optimization with new AI logic while leaving other modules alone • Easier to isolate and measure small changes • Not as much of a black box as traditional systems • High potential as we get more eCommerce / customer data Cluster Creation Forecast Demand Pattern Forecast Optimizatio n Generate Pricing Forec timization w/ AI Web Search & Conversion Price Sensitivity

Fixed fee • Limited fixed fee opportunities the last few years due to pilot availability • Airbus significantly more desirable for charters compared to MD80 • Started international track charter programs in 2016 Fixed fee revenue by year 2015: $20m 2016E: $30m 2017E: $40m

Revenue initiatives earnings impact ($m) 2017E 2018E 2019E 2020E New RM System $7 $28 $39 $49 Fixed Fee $5 $10 $15 $20 Total $12m $38m $54m $69m Estimates are based on various assumptions which may not materialize

Fleet & operations update Jude Bricker COO & SVP
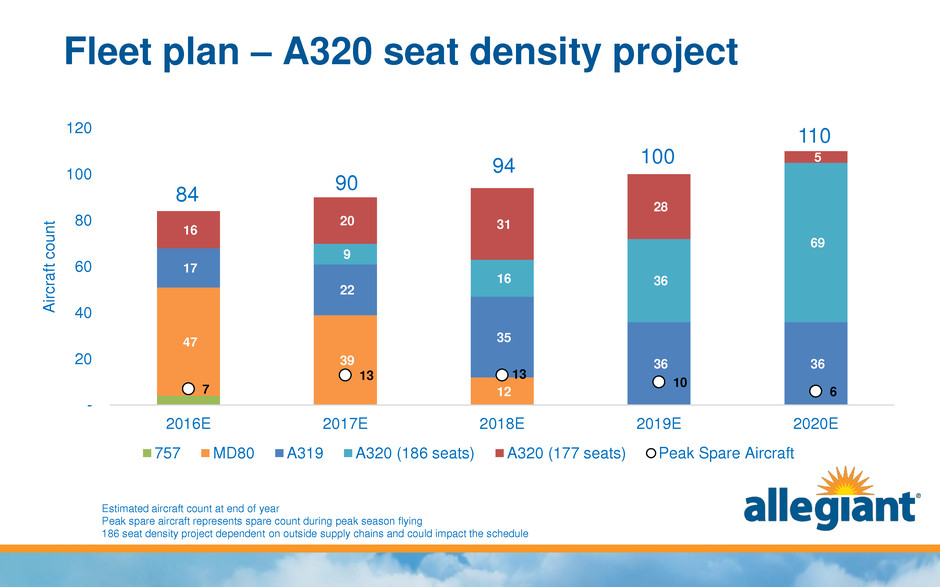
Fleet plan – A320 seat density project 47 39 12 17 22 35 36 36 9 16 36 69 16 20 31 28 5 7 13 13 10 6 - 20 40 60 80 100 120 2016E 2017E 2018E 2019E 2020E A ir c ra ft c o u n t 757 MD80 A319 A320 (186 seats) A320 (177 seats) Peak Spare Aircraft 94 84 90 100 110 Estimated aircraft count at end of year Peak spare aircraft represents spare count during peak season flying 186 seat density project dependent on outside supply chains and could impact the schedule

Continued focus on used Airbus aircraft “Sourced” is defined as being under a purchase agreement or letter of intent expected by the end of 2016 Estimated aircraft count at end of year 9 12 12 12 33 42 69 76 80 0 20 40 60 80 100 120 2016E 2017E 2018E 2019E 2020E A ir c ra ft c o u n t New Airbus Used Airbus (sourced) Used Airbus (to be sourced) 12 18 1

Monthly aircraft depreciation + rent (stacked) - 20 40 60 80 100 120 2014 2015 2016E 2017E 2018E 2019E 2020E M o n th ly e x p e n se p e r a ir cr a ft ($ 0 0 0 ’s) MD80 B757 Airbus Excludes heavy maintenance depreciation and sub-service expense Estimates are based on various assumptions which may not materialize

Airbus purchase prices have remained steady - 20 40 60 80 100 120 2014 2015 2016E 2017E 2018E 2019E 2020E M o n th ly e x p e n se p e r a ir cr a ft ($ 0 0 0 ’s) Airbus Depreciation + Rent (per month per aircraft) Based on actual costs of aircraft now in fleet and estimated acquisition costs of aircraft to be acquired in the future Excludes heavy maintenance depreciation expense

Conservative leverage & debt flexibility Upcoming debt is potential future debt and is subject to availability on terms acceptable to the Company 46% 53% 49% 45% 40% 0% 10% 20% 30% 40% 50% 60% $- $100,000 $200,000 $300,000 $400,000 $500,000 $600,000 $700,000 $800,000 $900,000 $1,000,000 2016E 2017E 2018E 2019E 2020E D e b t B a la n c e ( 0 0 0' s ) Secured Aircraft Debt Balances Secured Debt - current Secured Debt - upcoming Secured Debt - refinance Debt : Total Assets (%, no refi)
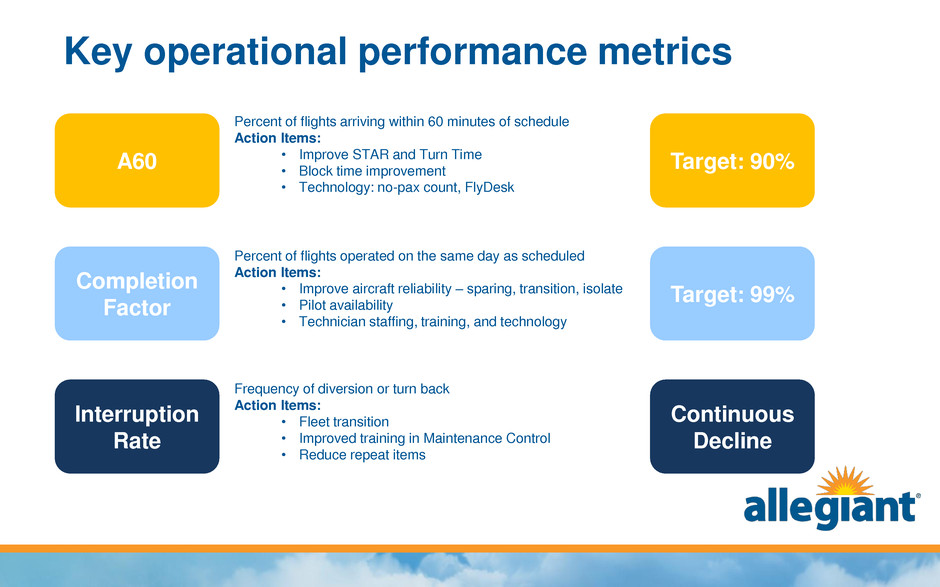
Key operational performance metrics Percent of flights arriving within 60 minutes of schedule Action Items: • Improve STAR and Turn Time • Block time improvement • Technology: no-pax count, FlyDesk A60 Completion Factor Interruption Rate Target: 90% Target: 99% Continuous Decline Percent of flights operated on the same day as scheduled Action Items: • Improve aircraft reliability – sparing, transition, isolate • Pilot availability • Technician staffing, training, and technology Frequency of diversion or turn back Action Items: • Fleet transition • Improved training in Maintenance Control • Reduce repeat items

A60 – improving 75.0% 80.0% 85.0% 90.0% 95.0% 1-Feb 2-Mar 1-Apr 1-May 31-May 30-Jun 30-Jul 29-Aug 28-Sep 28-Oct A60 - Rolling 30 days 2016 2015 2014 Target

STAR performance is improving 60.0% 65.0% 70.0% 75.0% 80.0% 85.0% 90.0% 1-Feb 2-Mar 1-Apr 1-May 31-May 30-Jun 30-Jul 29-Aug 28-Sep 28-Oct STAR D0 - Rolling 30 days 2016 2015 2014 Target STAR – Start the Airline Right % of on-time departures for first daily flight on an aircraft

Completion – peak periods are critical 95.0% 100.0% 1-Feb 2-Mar 1-Apr 1-May 31-May 30-Jun 30-Jul 29-Aug 28-Sep 28-Oct Completion % - Rolling 30 days 2016 2015 2014 Target Excludes – cancels for airport conditions, weather, passenger medical and security Excludes – flights scheduled less than seven days before departure

Investing heavily in Summer 2017 0% 5% 10% 15% 20% 25% 30% 201720162015 Summer Y/Y Departure Growth 0 2 4 6 8 10 12 14 201720162015 Summer Spare Aircraft 0 100 200 300 400 500 600 700 800 900 1000 201720162015 Summer Pilot Staffing “Summer” shown as June and July only Estimates are based on various assumptions which may not materialize

Interruptions – continuous improvement 0.00% 1.00% 1-Feb 2-Mar 1-Apr 1-May 31-May 30-Jun 30-Jul 29-Aug 28-Sep 28-Oct Interruption % - Rolling 90 Days 2016 2015 2014 Excludes – Air-traffic Control, Weather, Passenger Medical and Fuel Stops Includes – Any flight diverted or turning back to origination airport

Pilot transition 0% 5% 10% 15% 20% 25% % o f p ilot s Pilots in Training as % Line Pilot Requirement Target Estimates are based on various assumptions which may not materialize

Operations lagniappes • NCHEP Inspection and Results Implementation • Pilot Contract Implementation • East Coast Training Center • FlyDesk Integration • Flight Attendant Contract Negotiations • CFM Engine Program • Aircraft divestments

Contribution of initiatives Operating earnings impact -$m 2017E 2020E Fuel benefit from ASM production $6 $21 Ex-fuel savings (costs) (21) 73 Credit card program 10 45 eCommerce initiatives 14 92 Pricing engine 7 49 Fixed fee 5 20 186 seat modification 0 27 Fleet productivity 0 21 Total $21m $348m Estimates are based on various assumptions which may not materialize

2017 guidance summary • FY 2017 system ASMs +8 to 12% versus FY 2016 • FY 2017 scheduled service ASMs +8 to 12% versus FY 2016 • FY 2017 CASM ex fuel +5 to 9% versus FY 2016 • FY 2017 maintenance per aircraft per month $90 - $100 thousand • FY 2017 depreciation per aircraft per month $125 - $135 thousand • FY 2017 CAPEX $415m* • FY 2017 Airbus heavy maintenance $30m • FY 2017 fixed fee revenue $40m *- Excludes Airbus heavy maintenance Guidance subject to change


