This presentation as well as oral statements made by officers or directors of Allegiant Travel Company, its advisors and affiliates (collectively or separately, the "Company“) will contain forward looking statements that are only predictions and involve risks and uncertainties. Forward-looking statements may include, among others, references to future performance and any comments about our strategic plans. There are many risk factors that could prevent us from achieving our goals and cause the underlying assumptions of these forward-looking statements, and our actual results, to differ materially from those expressed in, or implied by, our forward-looking statements. These risk factors and others are more fully discussed in our filings with the Securities and Exchange Commission. Any forward-looking statements are based on information available to us today and we undertake no obligation to update publicly any forward-looking statements, whether as a result of future events, new information or otherwise. The Company cautions users of this presentation not to place undue reliance on forward-looking statements, which may be based on assumptions and anticipated events that do not materialize.
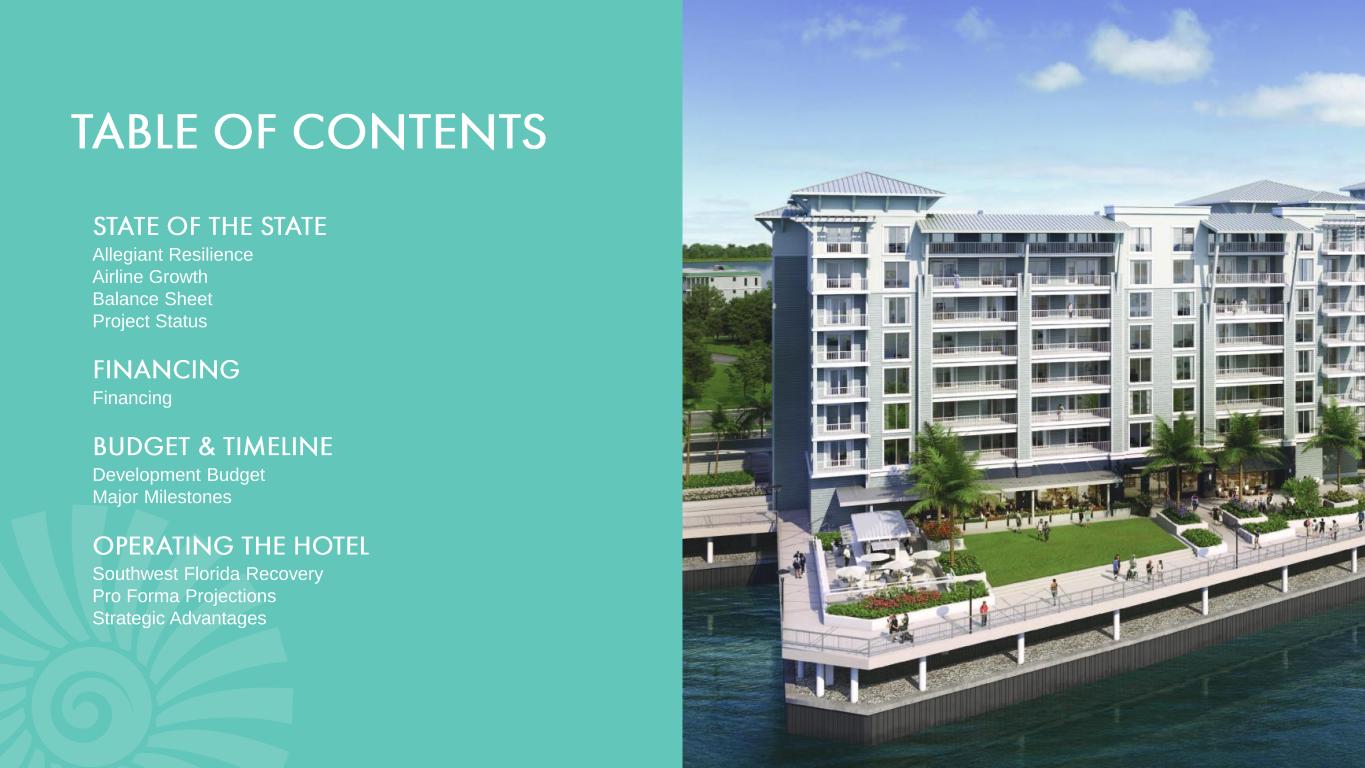
Allegiant Resilience Airline Growth Balance Sheet Project Status Financing Development Budget Major Milestones Southwest Florida Recovery Pro Forma Projections Strategic Advantages

% Change in Departures vs 2019 2020 (Actual), 2021 (Scheduled) Source: Schedules (Diio), T-100 BTS (100%) (80%) (60%) (40%) (20%) 0% 20% Jan '20 Mar '20 May '20 Jul '20 Sep '20 Nov '20 Jan '21 Mar '21 May '21 Jul '21 % C h a n g e f ro m 2 0 1 9 44% 45% 51% 56% 57% 57% 58% 61% 63% 64% 66% 82% 2020 Departures as % of 2019 US Industry Ex-Allegiant US Industry Ex-Allegiant Other airlines
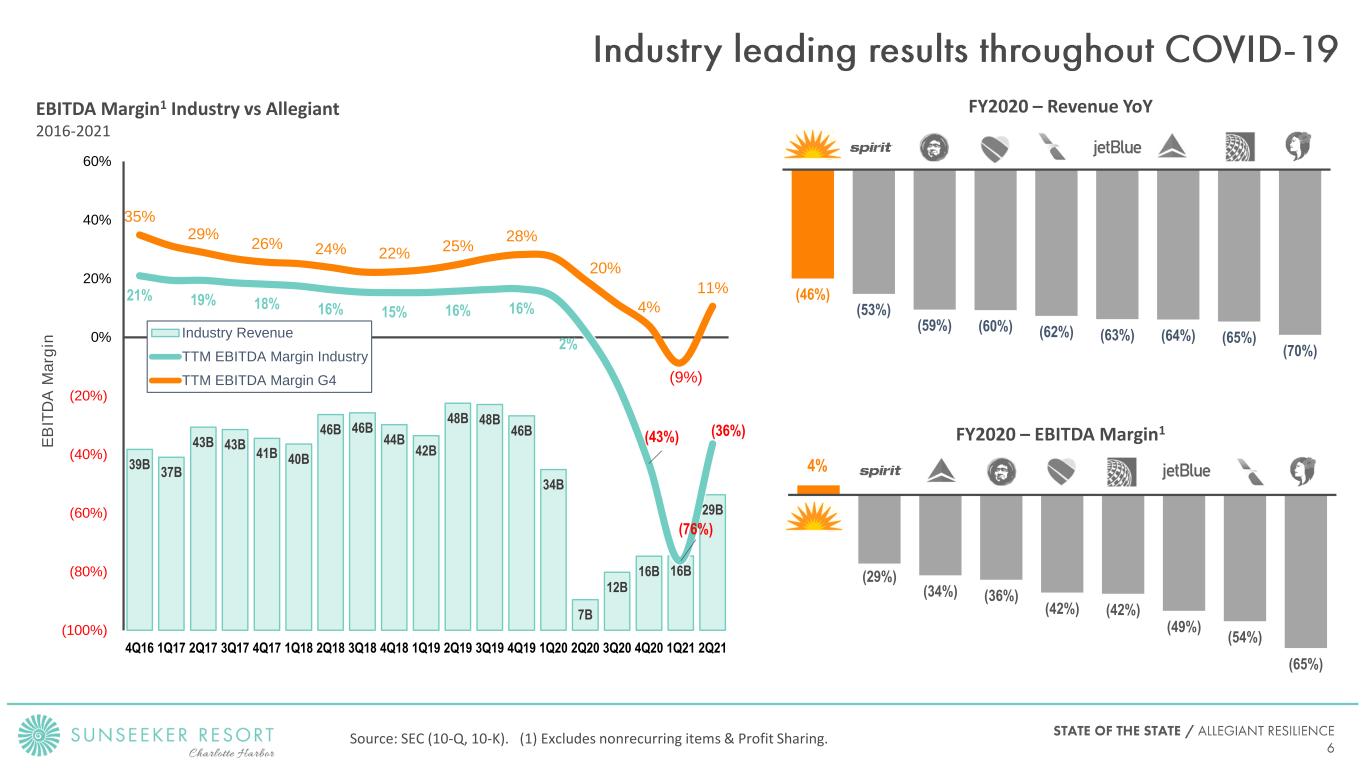
FY2020 – Revenue YoY (46%) (53%) (59%) (60%) (62%) (63%) (64%) (65%) (70%) FY2020 – EBITDA Margin1 (29%) (34%) (36%) (42%) (42%) (49%) (54%) (65%) 39B 37B 43B 43B 41B 40B 46B 46B 44B 42B 48B 48B 46B 34B 7B 12B 16B 16B 29B 21% 19% 18% 16% 15% 16% 16% 2% (43%) (76%) (36%) 35% 29% 26% 24% 22% 25% 28% 20% 4% (9%) 11% (100%) (80%) (60%) (40%) (20%) 0% 20% 40% 60% 4Q16 1Q17 2Q17 3Q17 4Q17 1Q18 2Q18 3Q18 4Q18 1Q19 2Q19 3Q19 4Q19 1Q20 2Q20 3Q20 4Q20 1Q21 2Q21 E B IT D A M a rg in Industry Revenue TTM EBITDA Margin Industry TTM EBITDA Margin G4 EBITDA Margin1 Industry vs Allegiant 2016-2021 4% Source: SEC (10-Q, 10-K). (1) Excludes nonrecurring items & Profit Sharing.
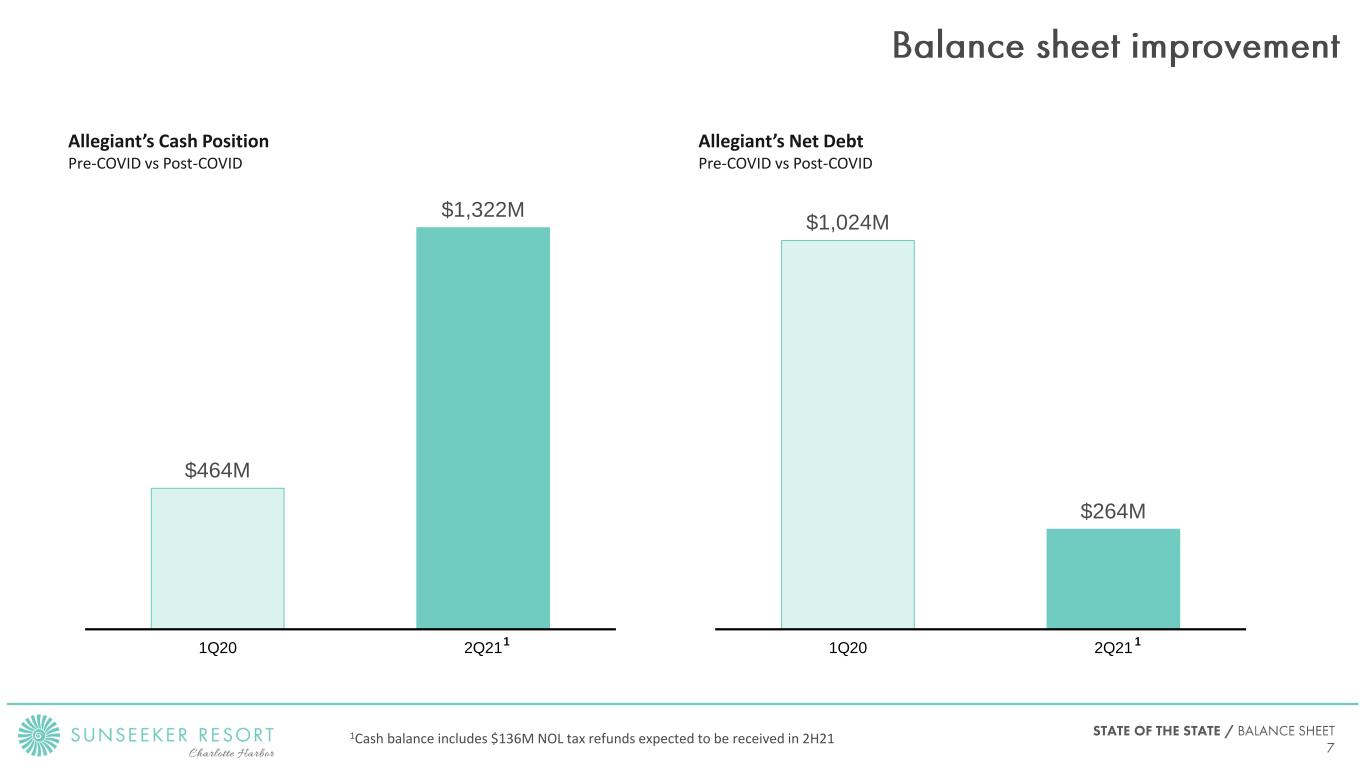
$464M $1,322M 1Q20 2Q21 Allegiant’s Cash Position Pre-COVID vs Post-COVID $1,024M $264M 1Q20 2Q21 Allegiant’s Net Debt Pre-COVID vs Post-COVID 1Cash balance includes $136M NOL tax refunds expected to be received in 2H21 1 1
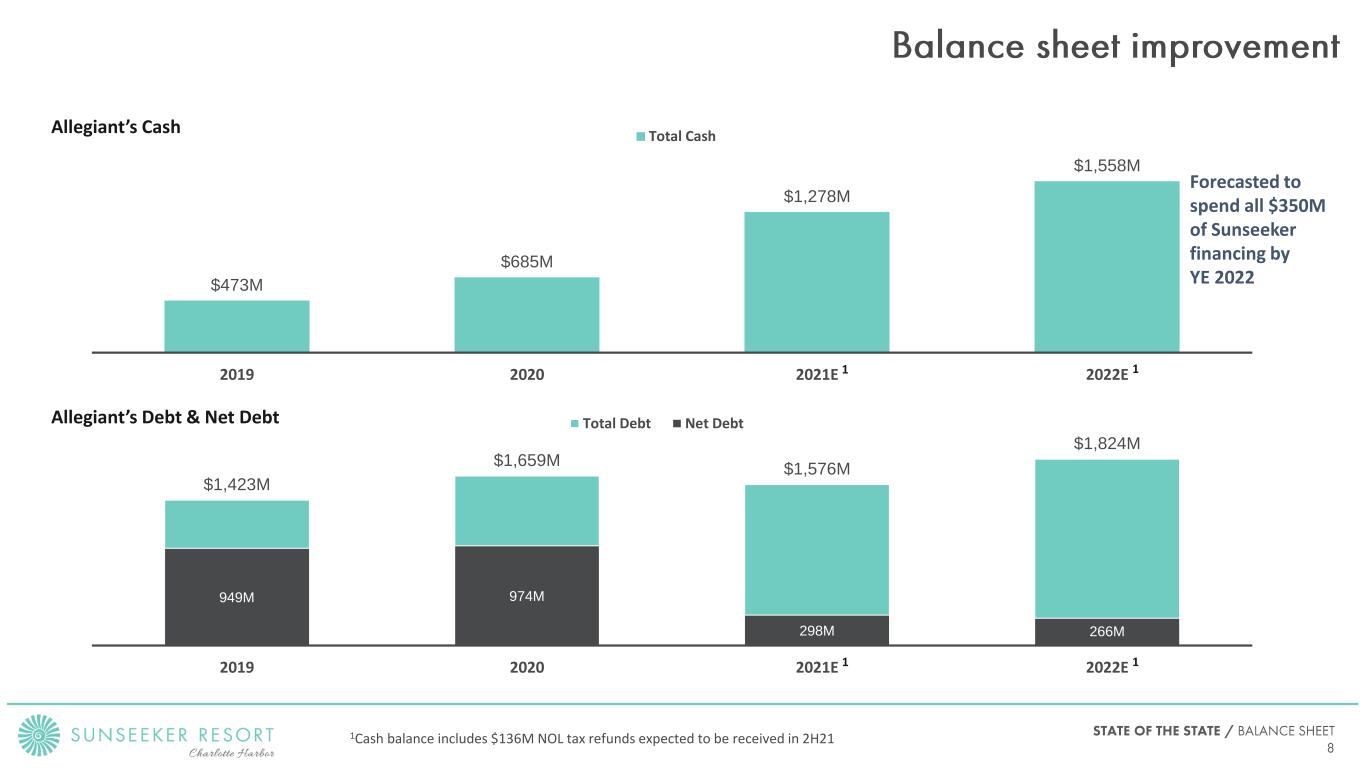
$473M $685M $1,278M $1,558M 2019 2020 2021E 2022E Total Cash $1,423M $1,659M $1,576M $1,824M 949M 974M 298M 266M 2019 2020 2021E 2022E Total Debt Net Debt Allegiant’s Cash Allegiant’s Debt & Net Debt Forecasted to spend all $350M of Sunseeker financing by YE 2022 1Cash balance includes $136M NOL tax refunds expected to be received in 2H21 1 1 11
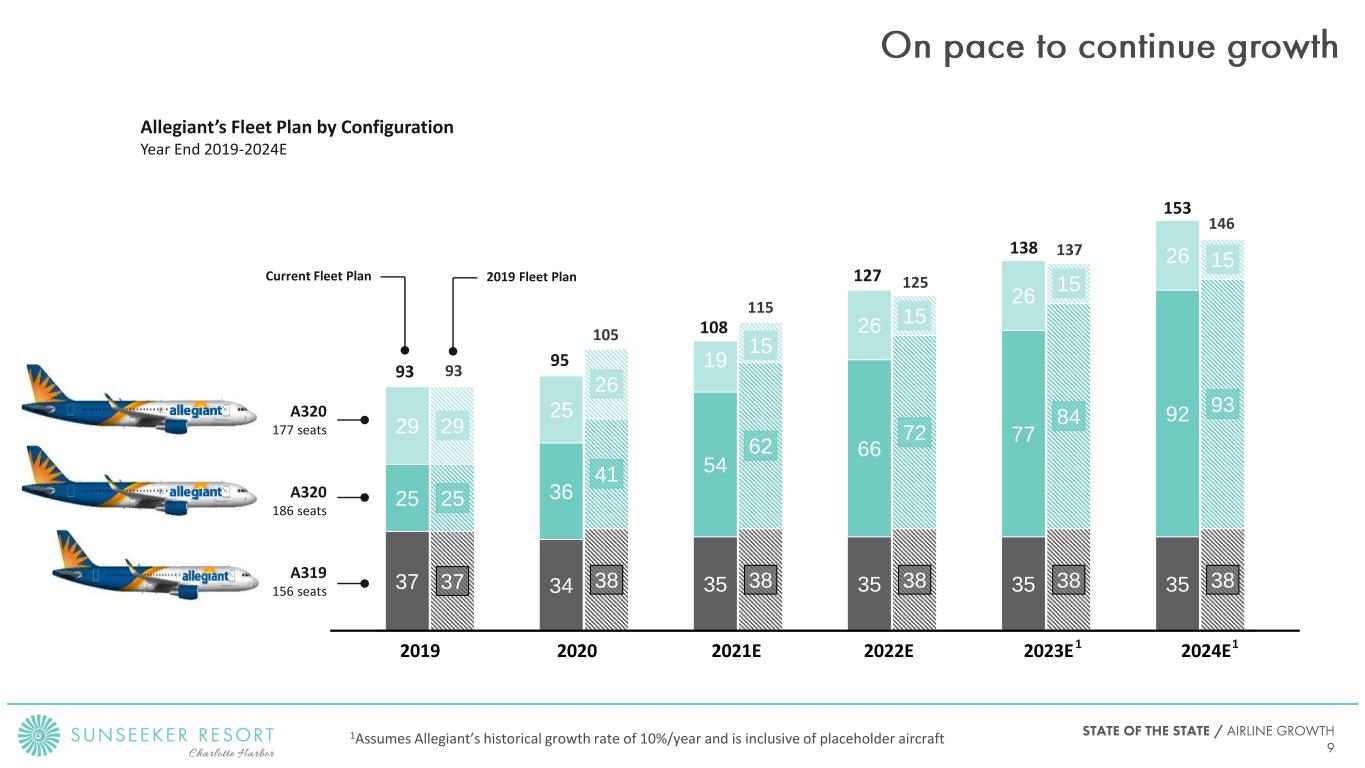
37 38 38 38 38 38 25 41 62 72 84 93 29 26 15 15 15 15 37 34 35 35 35 35 25 36 54 66 77 92 29 25 19 26 26 26 A320 186 seats A320 177 seats A319 156 seats Allegiant’s Fleet Plan by Configuration Year End 2019-2024E 2019 2020 2021E 2022E 93 105 115 125 93 95 108 127Current Fleet Plan 2019 Fleet Plan 2023E 2024E 137138 146 153 1 1 1Assumes Allegiant’s historical growth rate of 10%/year and is inclusive of placeholder aircraft
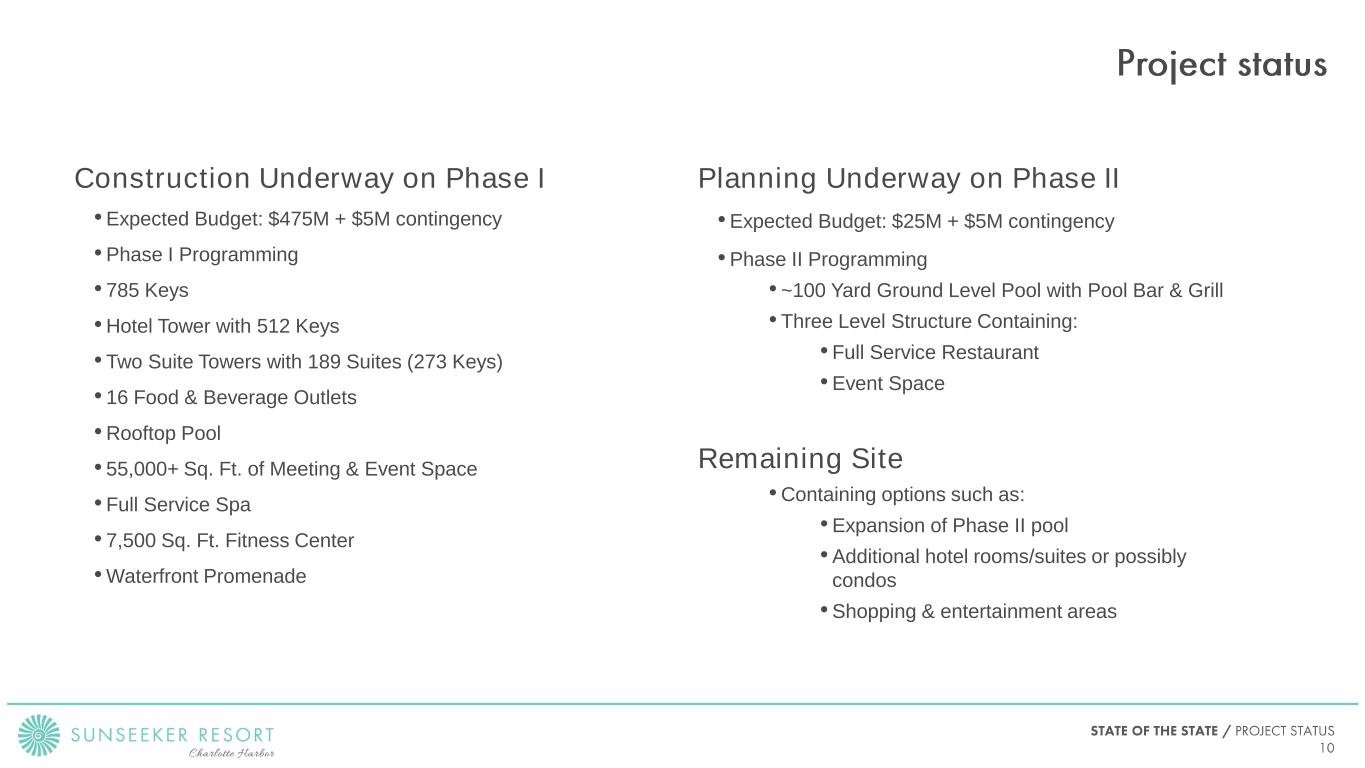
Construction Underway on Phase I • Expected Budget: $475M + $5M contingency • Phase I Programming • 785 Keys • Hotel Tower with 512 Keys • Two Suite Towers with 189 Suites (273 Keys) • 16 Food & Beverage Outlets • Rooftop Pool • 55,000+ Sq. Ft. of Meeting & Event Space • Full Service Spa • 7,500 Sq. Ft. Fitness Center • Waterfront Promenade Planning Underway on Phase II • Expected Budget: $25M + $5M contingency • Phase II Programming • ~100 Yard Ground Level Pool with Pool Bar & Grill • Three Level Structure Containing: • Full Service Restaurant • Event Space Remaining Site • Containing options such as: • Expansion of Phase II pool • Additional hotel rooms/suites or possibly condos • Shopping & entertainment areas

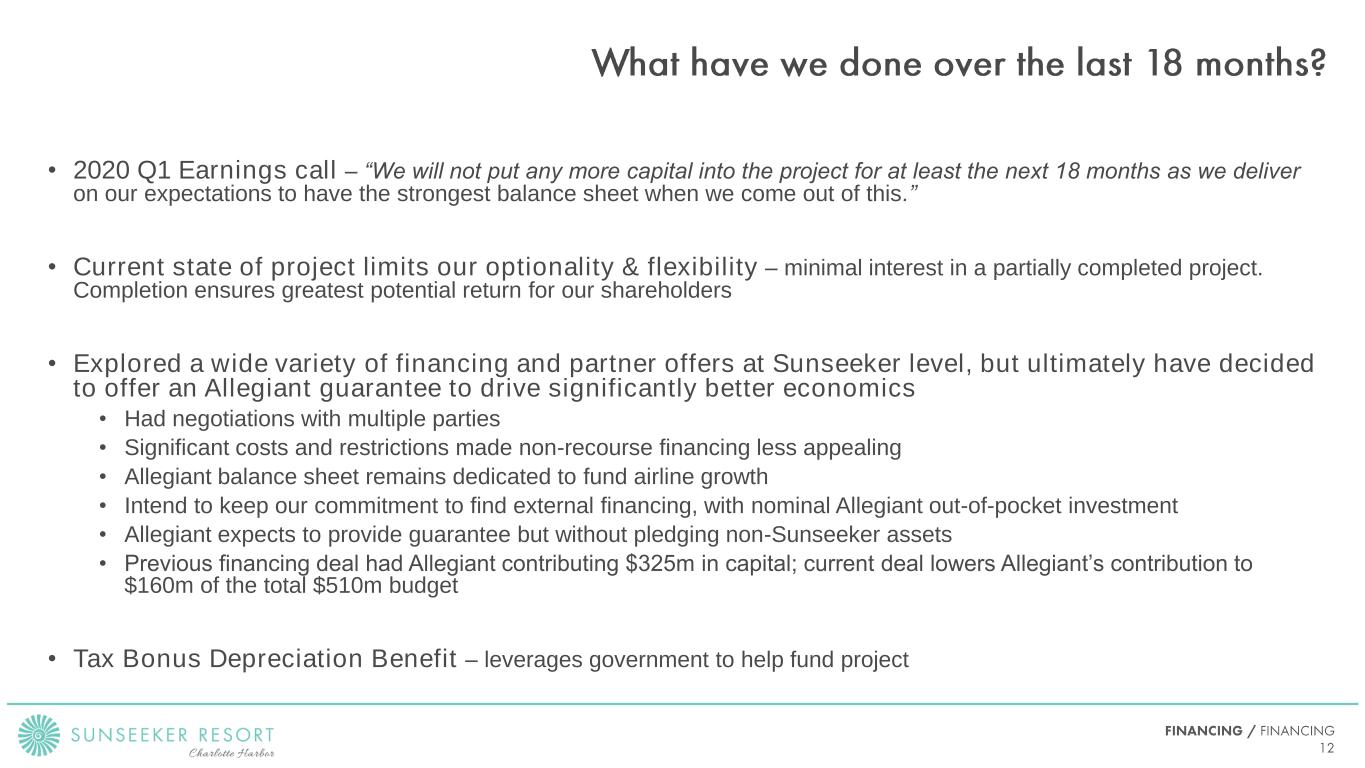
• 2020 Q1 Earnings call – “We will not put any more capital into the project for at least the next 18 months as we deliver on our expectations to have the strongest balance sheet when we come out of this.” • Current state of project limits our optionality & flexibility – minimal interest in a partially completed project. Completion ensures greatest potential return for our shareholders • Explored a wide variety of financing and partner offers at Sunseeker level, but ultimately have decided to offer an Allegiant guarantee to drive significantly better economics • Had negotiations with multiple parties • Significant costs and restrictions made non-recourse financing less appealing • Allegiant balance sheet remains dedicated to fund airline growth • Intend to keep our commitment to find external financing, with nominal Allegiant out-of-pocket investment • Allegiant expects to provide guarantee but without pledging non-Sunseeker assets • Previous financing deal had Allegiant contributing $325m in capital; current deal lowers Allegiant’s contribution to $160m of the total $510m budget • Tax Bonus Depreciation Benefit – leverages government to help fund project

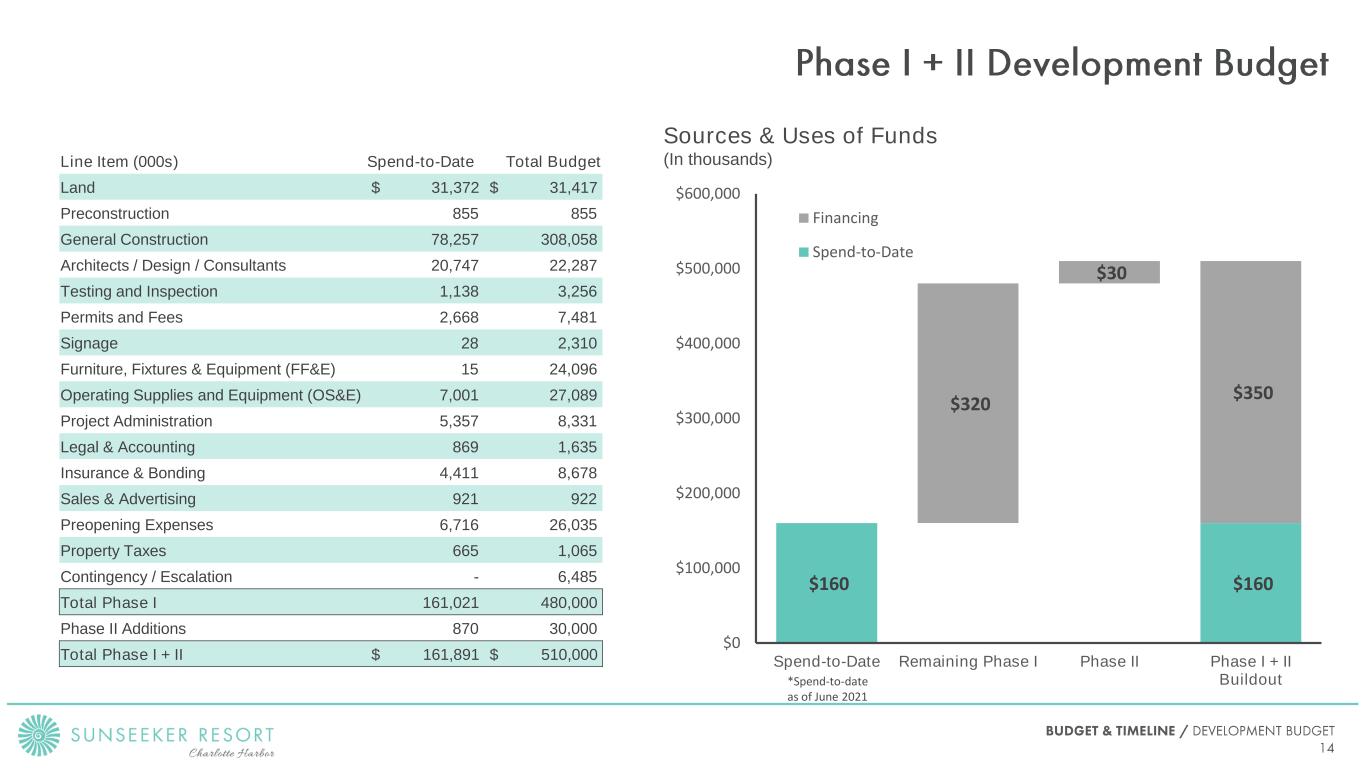
Line Item (000s) Spend-to-Date Total Budget Land $ 31,372 $ 31,417 Preconstruction 855 855 General Construction 78,257 308,058 Architects / Design / Consultants 20,747 22,287 Testing and Inspection 1,138 3,256 Permits and Fees 2,668 7,481 Signage 28 2,310 Furniture, Fixtures & Equipment (FF&E) 15 24,096 Operating Supplies and Equipment (OS&E) 7,001 27,089 Project Administration 5,357 8,331 Legal & Accounting 869 1,635 Insurance & Bonding 4,411 8,678 Sales & Advertising 921 922 Preopening Expenses 6,716 26,035 Property Taxes 665 1,065 Contingency / Escalation - 6,485 Total Phase I 161,021 480,000 Phase II Additions 870 30,000 Total Phase I + II $ 161,891 $ 510,000 $160 $160 $320 $30 $350 $0 $100,000 $200,000 $300,000 $400,000 $500,000 $600,000 Spend-to-Date Remaining Phase I Phase II Phase I + II Buildout Financing Spend-to-Date Sources & Uses of Funds (In thousands) *Spend-to-date as of June 2021


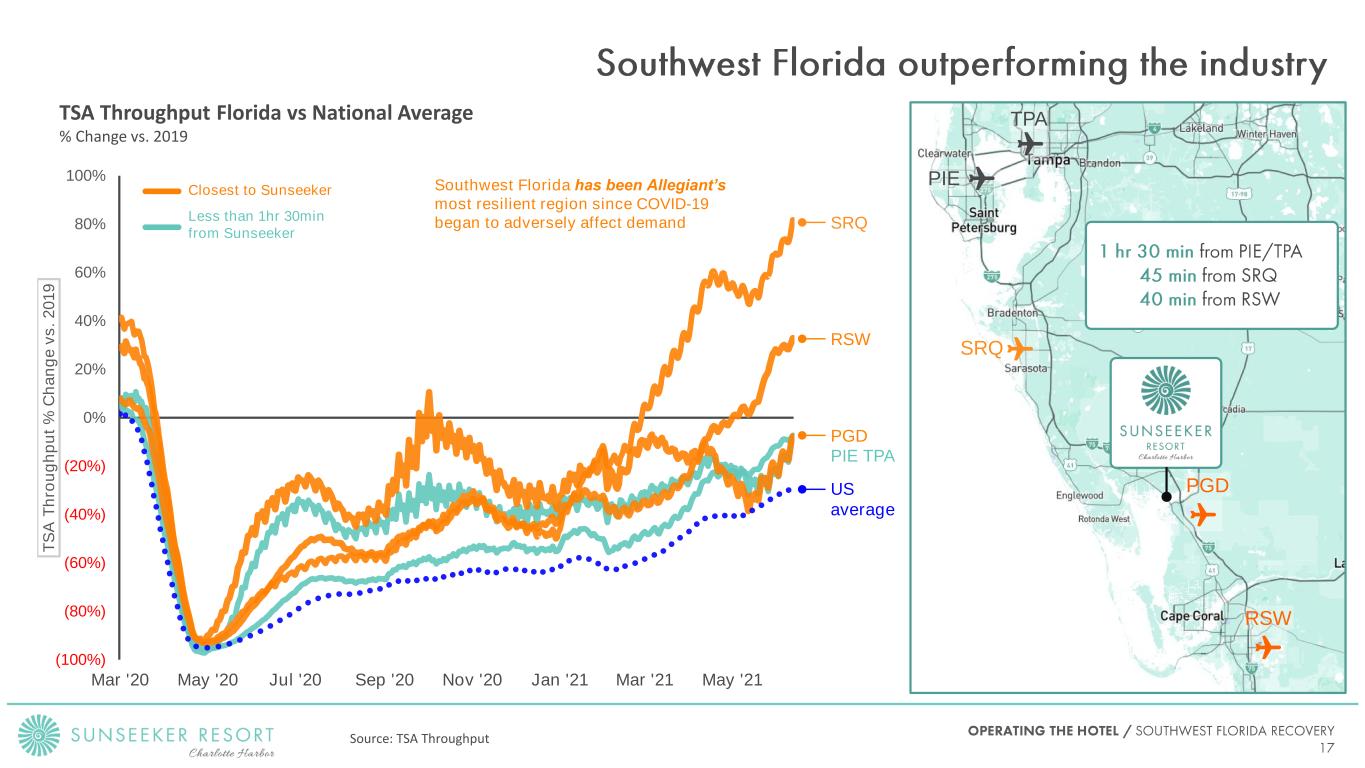
(100%) (80%) (60%) (40%) (20%) 0% 20% 40% 60% 80% 100% Mar '20 May '20 Jul '20 Sep '20 Nov '20 Jan '21 Mar '21 May '21 T S A T h ro u g h p u t % C h a n g e v s . 2 0 1 9 TSA Throughput Florida vs National Average % Change vs. 2019 Southwest Florida has been Allegiant’s most resilient region since COVID-19 began to adversely affect demand Source: TSA Throughput RSW PGD SRQ PIE TPA US average Closest to Sunseeker Less than 1hr 30min from Sunseeker ✈ ✈ ✈ ✈ ✈ TPA RSW PIE PGD SRQ
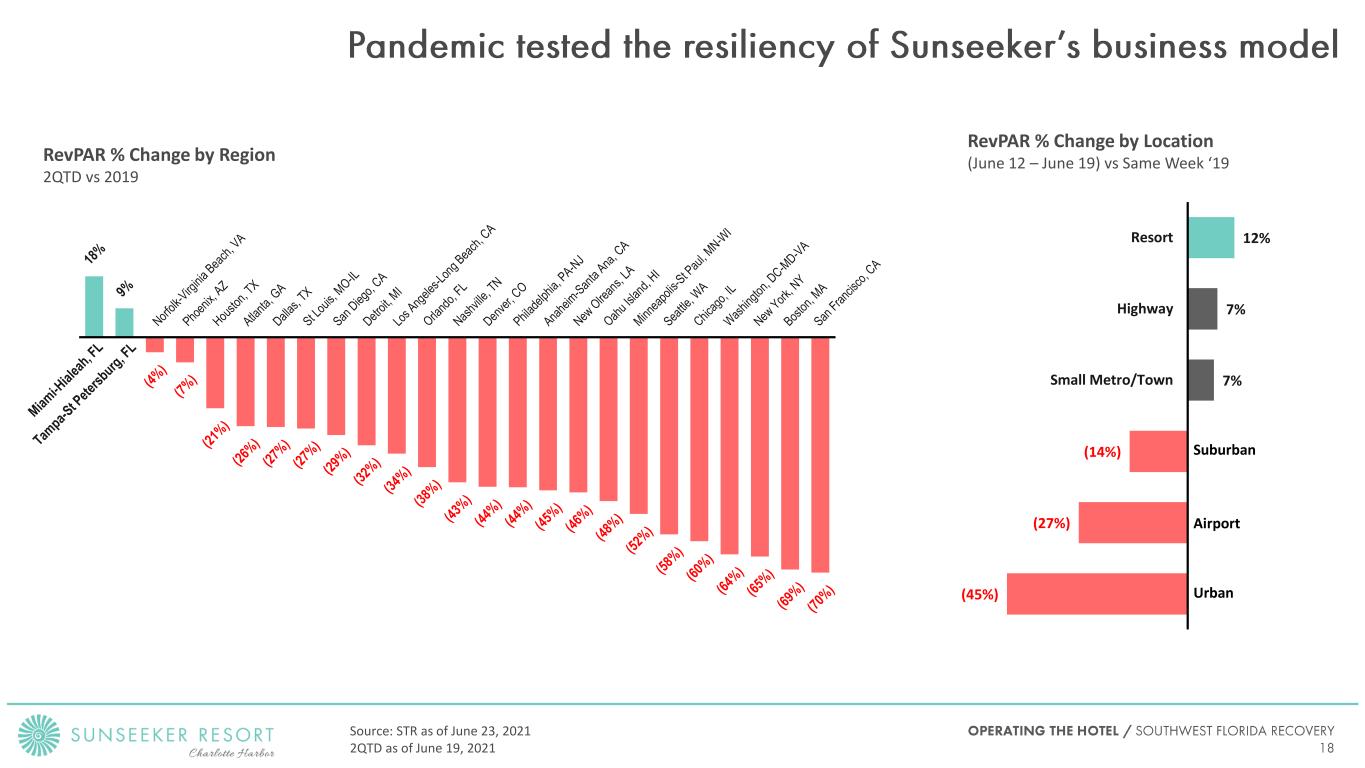
(45%) (27%) (14%) 7% 7% 12% Small Metro/Town Highway Resort RevPAR % Change by Region 2QTD vs 2019 RevPAR % Change by Location (June 12 – June 19) vs Same Week ‘19 Suburban Airport Urban Source: STR as of June 23, 2021 2QTD as of June 19, 2021

148% 66% 16% 14% 14% 1% (1%) (5%) (13%) (40%) (20%) 0% 20% 40% 60% 80% 100% 120% 140% 160% SRQ RSW PGD PIE Florida Phoenix % C h a n g e 2 0 2 1 v s 2 0 1 9 Domestic Seats % Change by Airport vs Florida & US June/July ‘21 vs 2019 TPA United States Source: Schedules (DIIO) Las Vegas
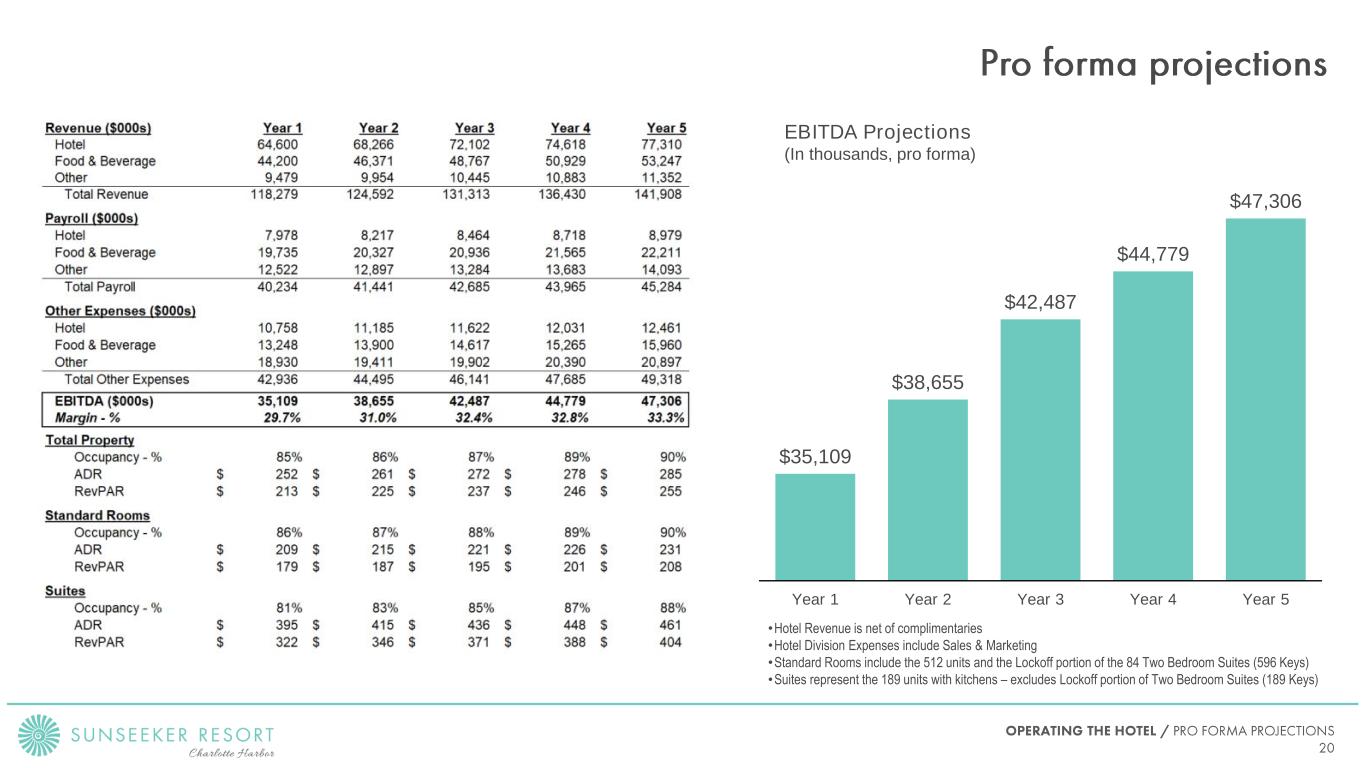
$35,109 $38,655 $42,487 $44,779 $47,306 Year 1 Year 2 Year 3 Year 4 Year 5 EBITDA Projections (In thousands, pro forma) •Hotel Revenue is net of complimentaries •Hotel Division Expenses include Sales & Marketing •Standard Rooms include the 512 units and the Lockoff portion of the 84 Two Bedroom Suites (596 Keys) •Suites represent the 189 units with kitchens – excludes Lockoff portion of Two Bedroom Suites (189 Keys)

Assumed Sunseeker ADR Revenue EBITDA EBITDA Margin ADR Comp $252 $ 118,279,358 $ 35,109,137 30% $321 $227 $ 112,177,875 $ 29,007,655 26% $321 $202 $ 106,076,393 $ 22,906,173 22% $321 $176 $ 99,974,911 $ 16,804,691 17% $321 $151 $ 93,873,429 $ 10,703,208 11% $321 $126 $ 87,771,946 $ 4,601,726 5% $321 COMPETITIVE SET PROPERTIES: JW Marriott Marco Island Beach Resort, Naples Grande Beach Resort, South Seas Island Resort, Hyatt Regency Coconut Point Resort & Spa, Ritz-Carlton Naples, Marriott Sanibel Harbour Resort & Spa , Hyatt Regency Sarasota. All ADR scenarios assume 85% occupancy and same total costs.
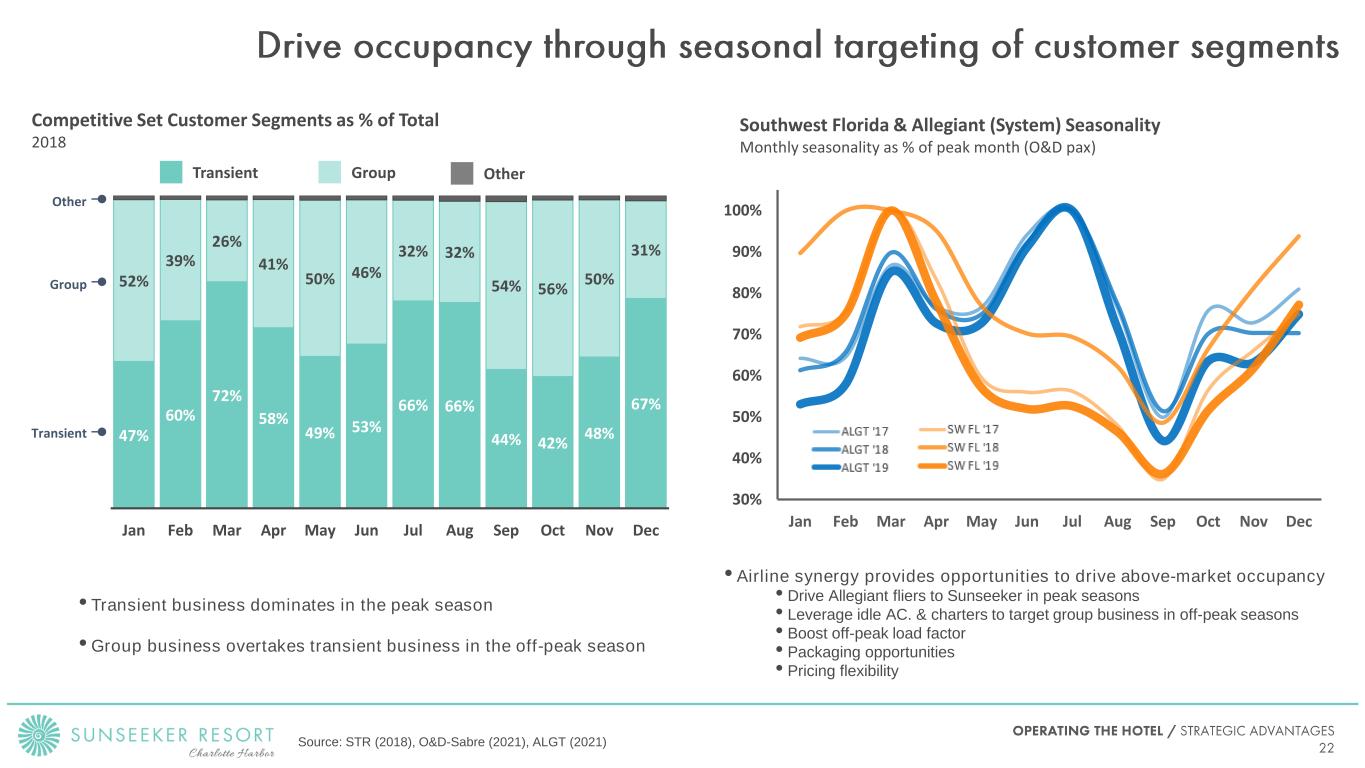
Source: STR (2018), O&D-Sabre (2021), ALGT (2021) 47% 60% 72% 58% 49% 53% 66% 66% 44% 42% 48% 67% 52% 39% 26% 41% 50% 46% 32% 32% 54% 56% 50% 31% Jan Feb Mar Apr May Jun Jul Aug Sep Oct Nov Dec 30% 40% 50% 60% 70% 80% 90% 100% Jan Feb Mar Apr May Jun Jul Aug Sep Oct Nov Dec Group OtherTransient Competitive Set Customer Segments as % of Total 2018 Southwest Florida & Allegiant (System) Seasonality Monthly seasonality as % of peak month (O&D pax) • Airline synergy provides opportunities to drive above-market occupancy • Drive Allegiant fliers to Sunseeker in peak seasons • Leverage idle AC. & charters to target group business in off-peak seasons • Boost off-peak load factor • Packaging opportunities • Pricing flexibility Transient Group Other • Transient business dominates in the peak season • Group business overtakes transient business in the off-peak season

Demand Stimulation • Over 75% of the routes Allegiant flies have no competition, leading to creation of markets rather than increased competition within existing markets • Sunseeker will allow Allegiant to stimulate additional demand, and Allegiant will bring customers to Southwest Florida that otherwise would not have made the trip Sunseeker Off-Peak Season Correlated with Low Utilization of Airplanes Across the Allegiant Network • Off-peak season in Southwest Florida (August, September, October especially) are the same months that Allegiant utilizes its airplanes least, leading to opportunities to increase off-peak travel • Flights that may not have been profitable can become profitable if larger portions of the customer wallet are captured • Allegiant’s load factor at PGD during 2019 was 84% Bundling Potential • Complete pricing flexibility with products owned by the same parent company • Ability to compare cost of opaque pricing with benefits of demand stimulation Customer Database • Allegiant has 12.6M Active Customer Emails in its “Flight Deals” distribution channel (emails associated with an Origin City) • 7.5M* out of the 12.6M represent potential Sunseeker customers, leading to unparalleled reach for an independent hotel, at no incremental cost • 149K customers have provided email addresses and additional demographic data to express interest in staying at the resort Loyalty Program • Over 235K Allegiant World Mastercard Holders, allowing for earning points on Sunseeker purchases, and redemption of rewards at Sunseeker, whether earned through card spend or airline purchases * Potential Sunseeker Customers: [Customer Emails in Cities that Fly to PGD] – 5M] + [Customer Emails in Cities within a 12 Hour Driving Distance of PGD – 2.5M]
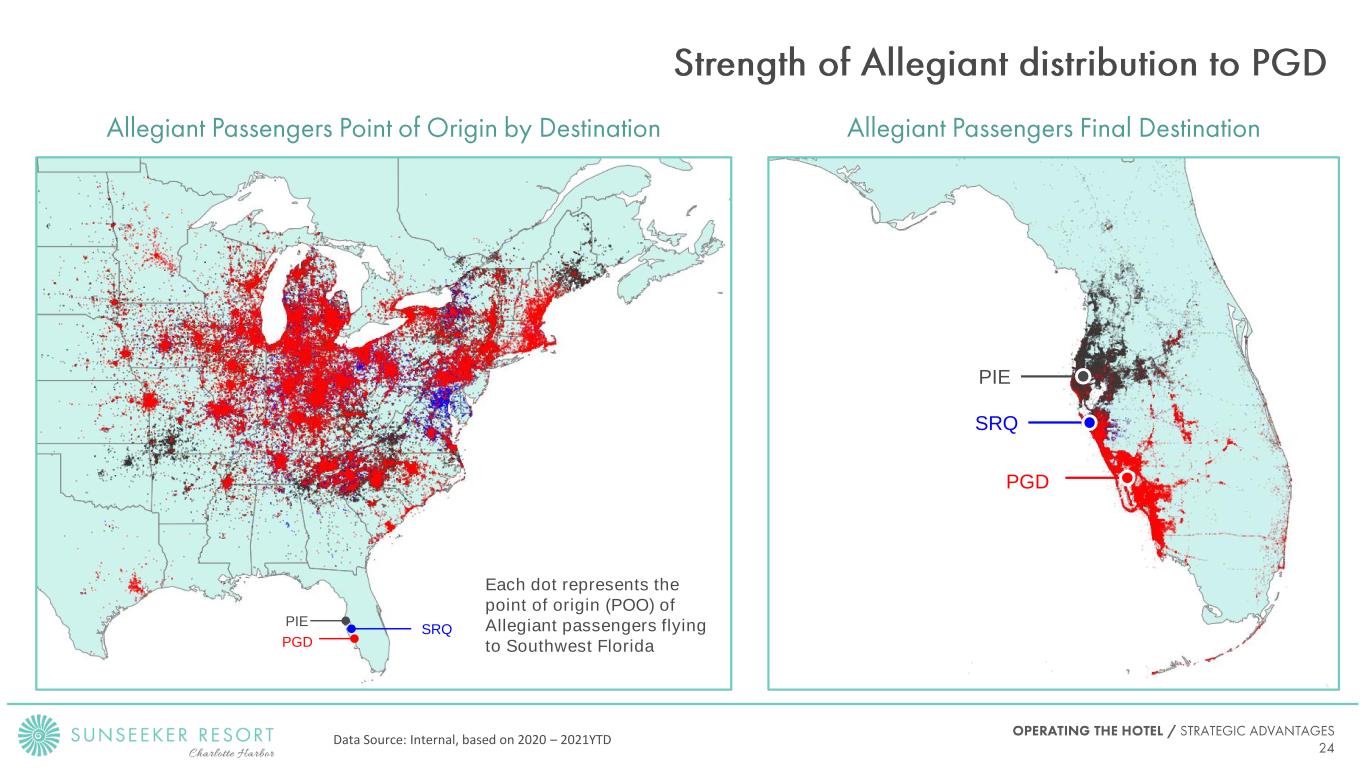
SRQ PIE PGD Each dot represents the point of origin (POO) of Allegiant passengers flying to Southwest Florida PGD SRQ PIE Data Source: Internal, based on 2020 – 2021YTD
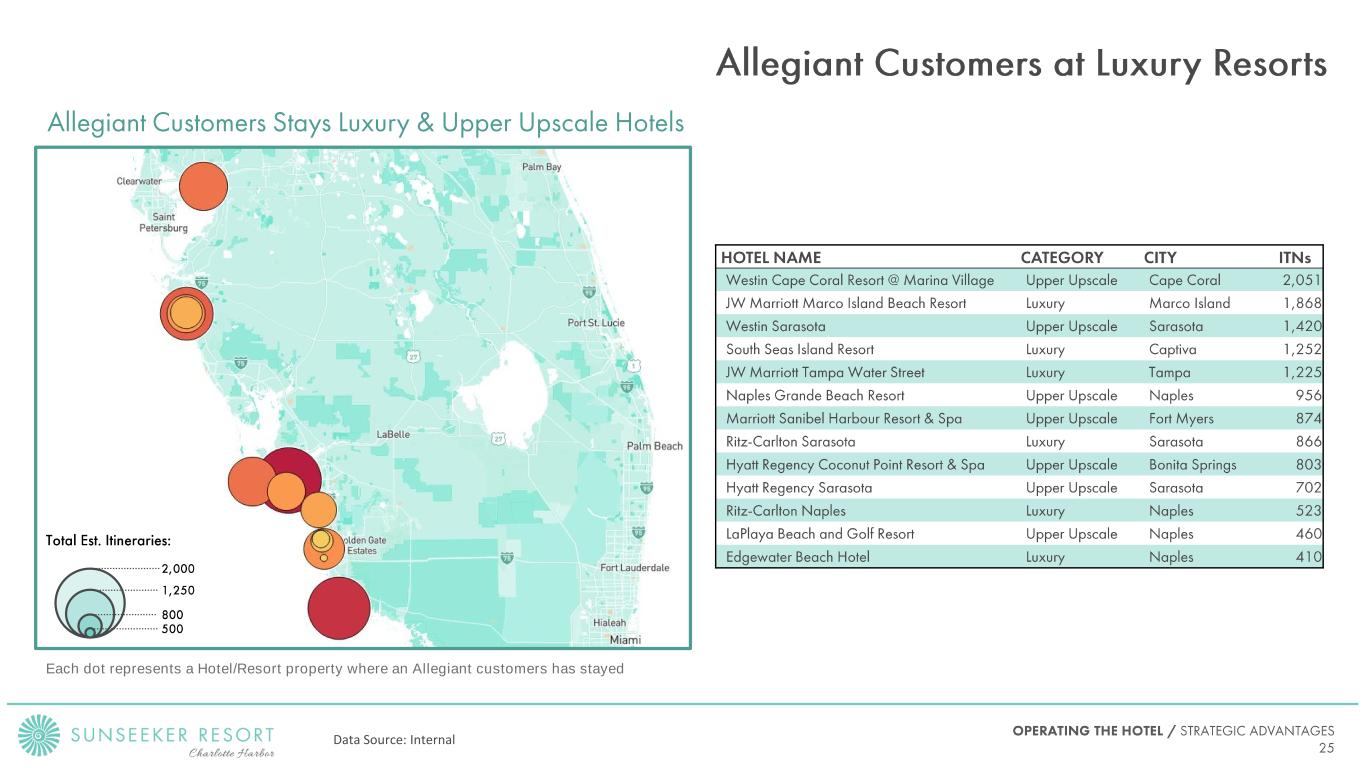
Each dot represents a Hotel/Resort property where an Allegiant customers has stayed Data Source: Internal
• Property worth more completed vs current state • Completion opens up opportunities • Own and operate the Resort • Sell and manage • Find a partner • Launch asset light business • Opportunity to obtain longer term financing • Divest completely • Sell suite towers as condos • Remaining site will have 13 acres of land for additional entertainment, hotel/suites, shopping, or even condos

Already developed 19 different restaurant / F&B brands Sports Bar Additional brands to be revealed at a future date
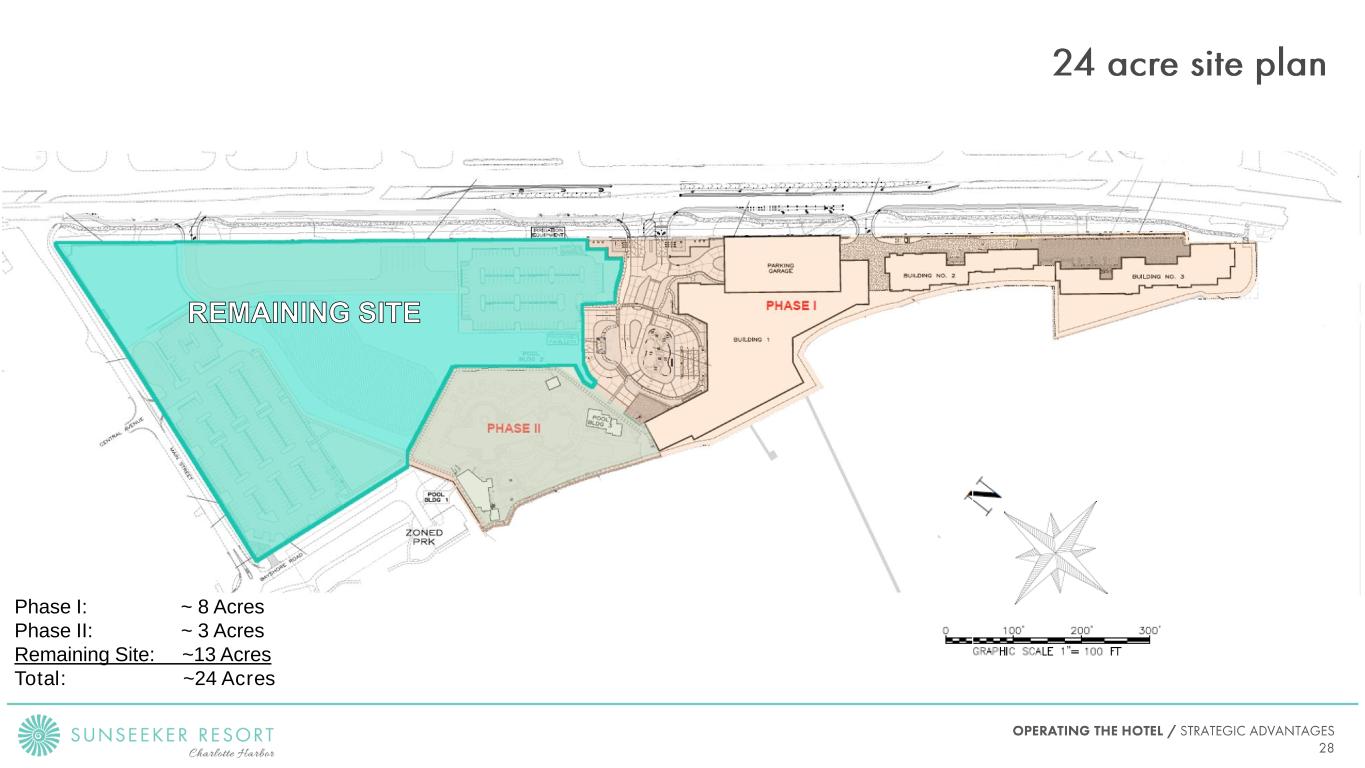
Phase I: ~ 8 Acres Phase II: ~ 3 Acres Remaining Site: ~13 Acres Total: ~24 Acres
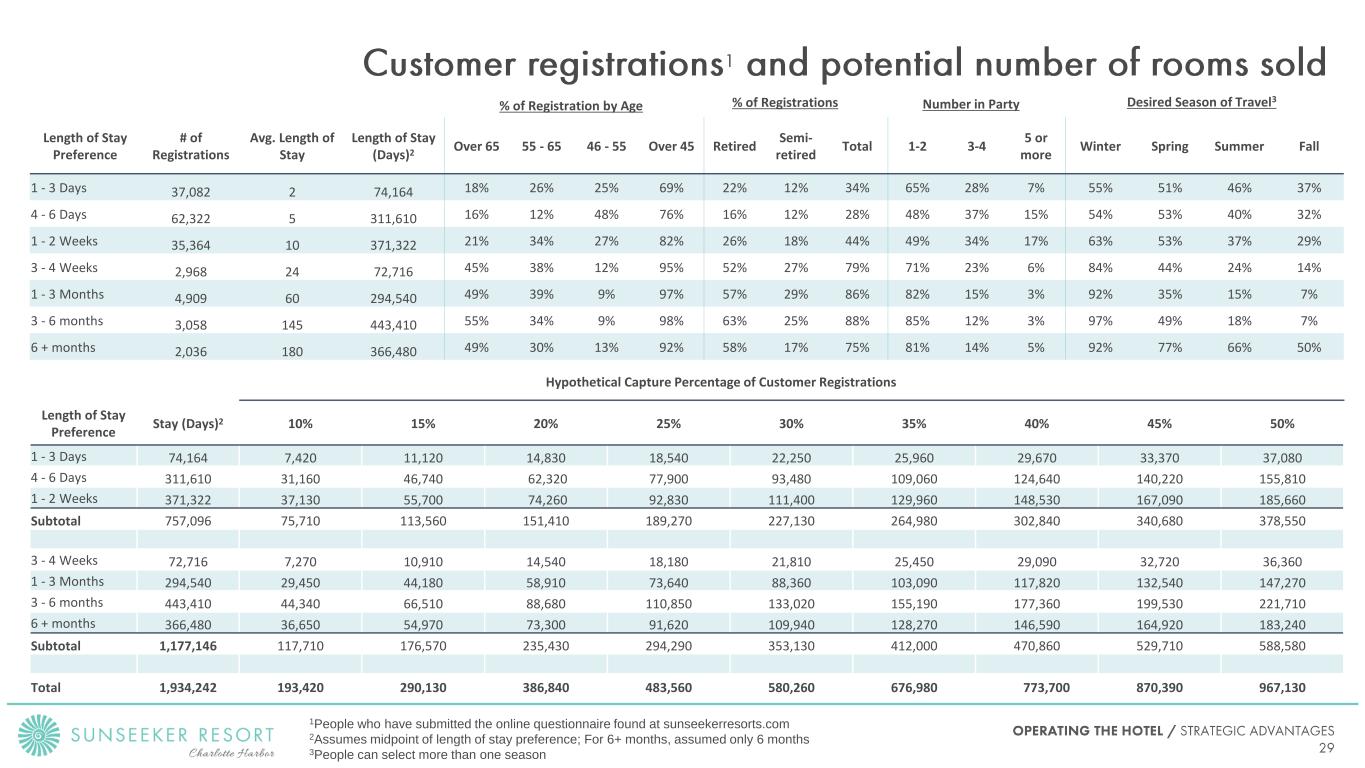
Length of Stay Preference # of Registrations Avg. Length of Stay Length of Stay (Days)2 Over 65 55 - 65 46 - 55 Over 45 Retired Semi- retired Total 1-2 3-4 5 or more Winter Spring Summer Fall 1 - 3 Days 37,082 2 74,164 18% 26% 25% 69% 22% 12% 34% 65% 28% 7% 55% 51% 46% 37% 4 - 6 Days 62,322 5 311,610 16% 12% 48% 76% 16% 12% 28% 48% 37% 15% 54% 53% 40% 32% 1 - 2 Weeks 35,364 10 371,322 21% 34% 27% 82% 26% 18% 44% 49% 34% 17% 63% 53% 37% 29% 3 - 4 Weeks 2,968 24 72,716 45% 38% 12% 95% 52% 27% 79% 71% 23% 6% 84% 44% 24% 14% 1 - 3 Months 4,909 60 294,540 49% 39% 9% 97% 57% 29% 86% 82% 15% 3% 92% 35% 15% 7% 3 - 6 months 3,058 145 443,410 55% 34% 9% 98% 63% 25% 88% 85% 12% 3% 97% 49% 18% 7% 6 + months 2,036 180 366,480 49% 30% 13% 92% 58% 17% 75% 81% 14% 5% 92% 77% 66% 50% Length of Stay Preference Stay (Days)2 10% 15% 20% 25% 30% 35% 40% 45% 50% 1 - 3 Days 74,164 7,420 11,120 14,830 18,540 22,250 25,960 29,670 33,370 37,080 4 - 6 Days 311,610 31,160 46,740 62,320 77,900 93,480 109,060 124,640 140,220 155,810 1 - 2 Weeks 371,322 37,130 55,700 74,260 92,830 111,400 129,960 148,530 167,090 185,660 Subtotal 757,096 75,710 113,560 151,410 189,270 227,130 264,980 302,840 340,680 378,550 3 - 4 Weeks 72,716 7,270 10,910 14,540 18,180 21,810 25,450 29,090 32,720 36,360 1 - 3 Months 294,540 29,450 44,180 58,910 73,640 88,360 103,090 117,820 132,540 147,270 3 - 6 months 443,410 44,340 66,510 88,680 110,850 133,020 155,190 177,360 199,530 221,710 6 + months 366,480 36,650 54,970 73,300 91,620 109,940 128,270 146,590 164,920 183,240 Subtotal 1,177,146 117,710 176,570 235,430 294,290 353,130 412,000 470,860 529,710 588,580 Total 1,934,242 193,420 290,130 386,840 483,560 580,260 676,980 773,700 870,390 967,130 % of Registration by Age % of Registrations Number in Party Desired Season of Travel3 Hypothetical Capture Percentage of Customer Registrations 1People who have submitted the online questionnaire found at sunseekerresorts.com 2Assumes midpoint of length of stay preference; For 6+ months, assumed only 6 months 3People can select more than one season
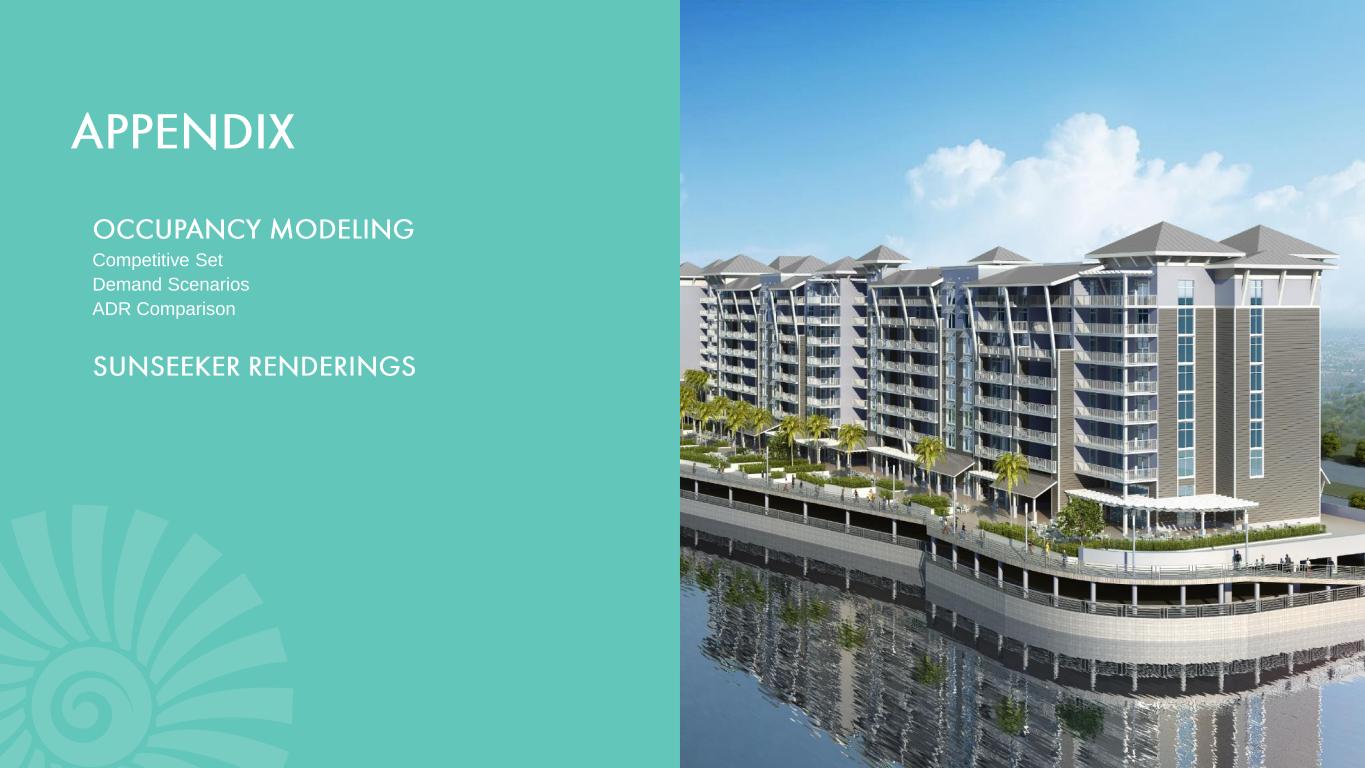
Competitive Set Demand Scenarios ADR Comparison
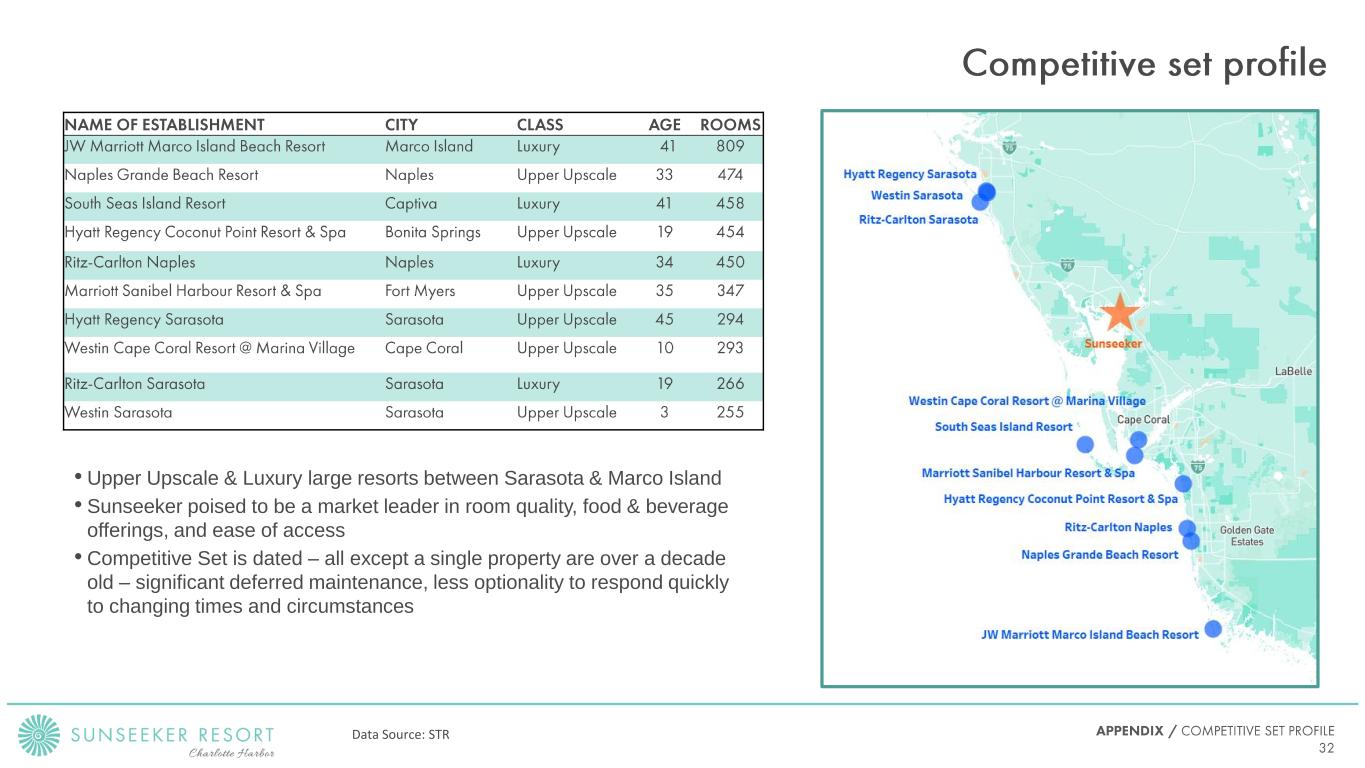
• Upper Upscale & Luxury large resorts between Sarasota & Marco Island • Sunseeker poised to be a market leader in room quality, food & beverage offerings, and ease of access • Competitive Set is dated – all except a single property are over a decade old – significant deferred maintenance, less optionality to respond quickly to changing times and circumstances Data Source: STR
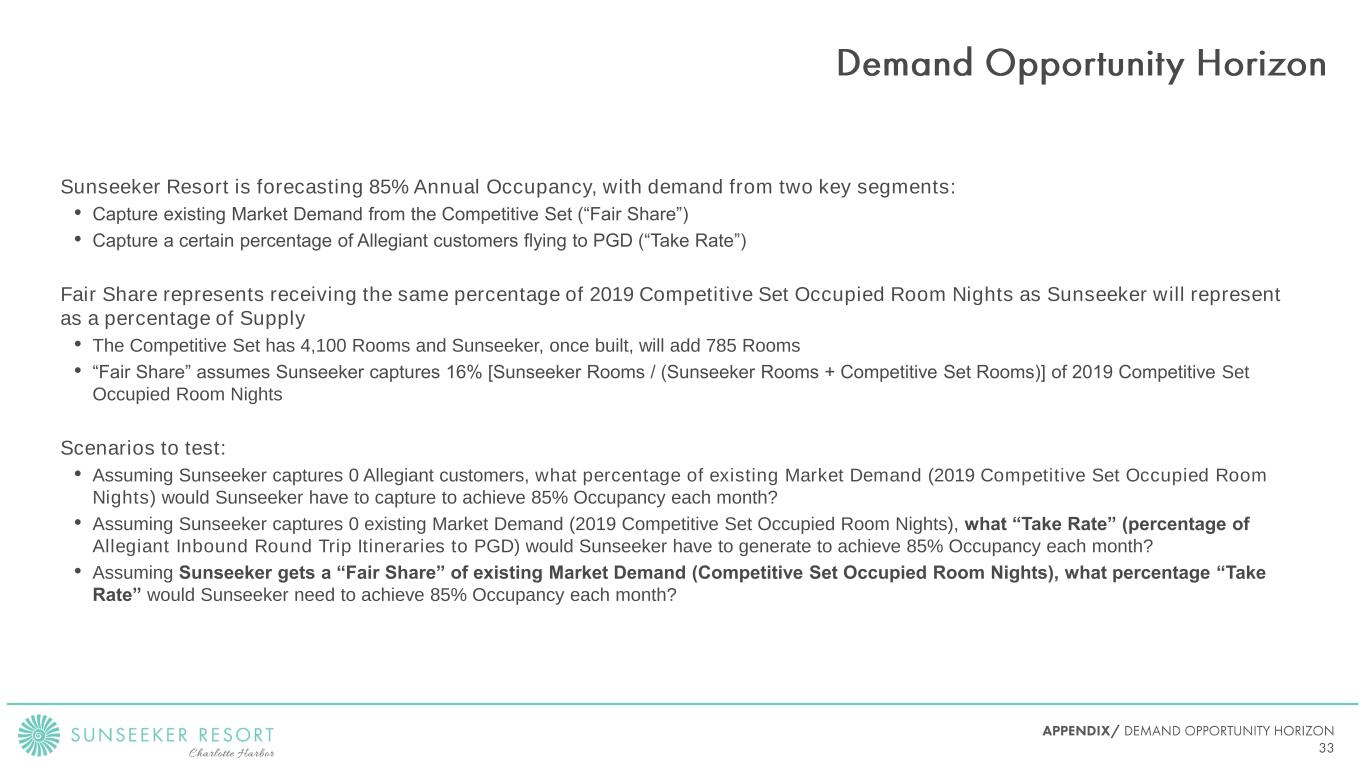
Sunseeker Resort is forecasting 85% Annual Occupancy, with demand from two key segments: • Capture existing Market Demand from the Competitive Set (“Fair Share”) • Capture a certain percentage of Allegiant customers flying to PGD (“Take Rate”) Fair Share represents receiving the same percentage of 2019 Competitive Set Occupied Room Nights as Sunseeker will represent as a percentage of Supply • The Competitive Set has 4,100 Rooms and Sunseeker, once built, will add 785 Rooms • “Fair Share” assumes Sunseeker captures 16% [Sunseeker Rooms / (Sunseeker Rooms + Competitive Set Rooms)] of 2019 Competitive Set Occupied Room Nights Scenarios to test: • Assuming Sunseeker captures 0 Allegiant customers, what percentage of existing Market Demand (2019 Competitive Set Occupied Room Nights) would Sunseeker have to capture to achieve 85% Occupancy each month? • Assuming Sunseeker captures 0 existing Market Demand (2019 Competitive Set Occupied Room Nights), what “Take Rate” (percentage of Allegiant Inbound Round Trip Itineraries to PGD) would Sunseeker have to generate to achieve 85% Occupancy each month? • Assuming Sunseeker gets a “Fair Share” of existing Market Demand (Competitive Set Occupied Room Nights), what percentage “Take Rate” would Sunseeker need to achieve 85% Occupancy each month?
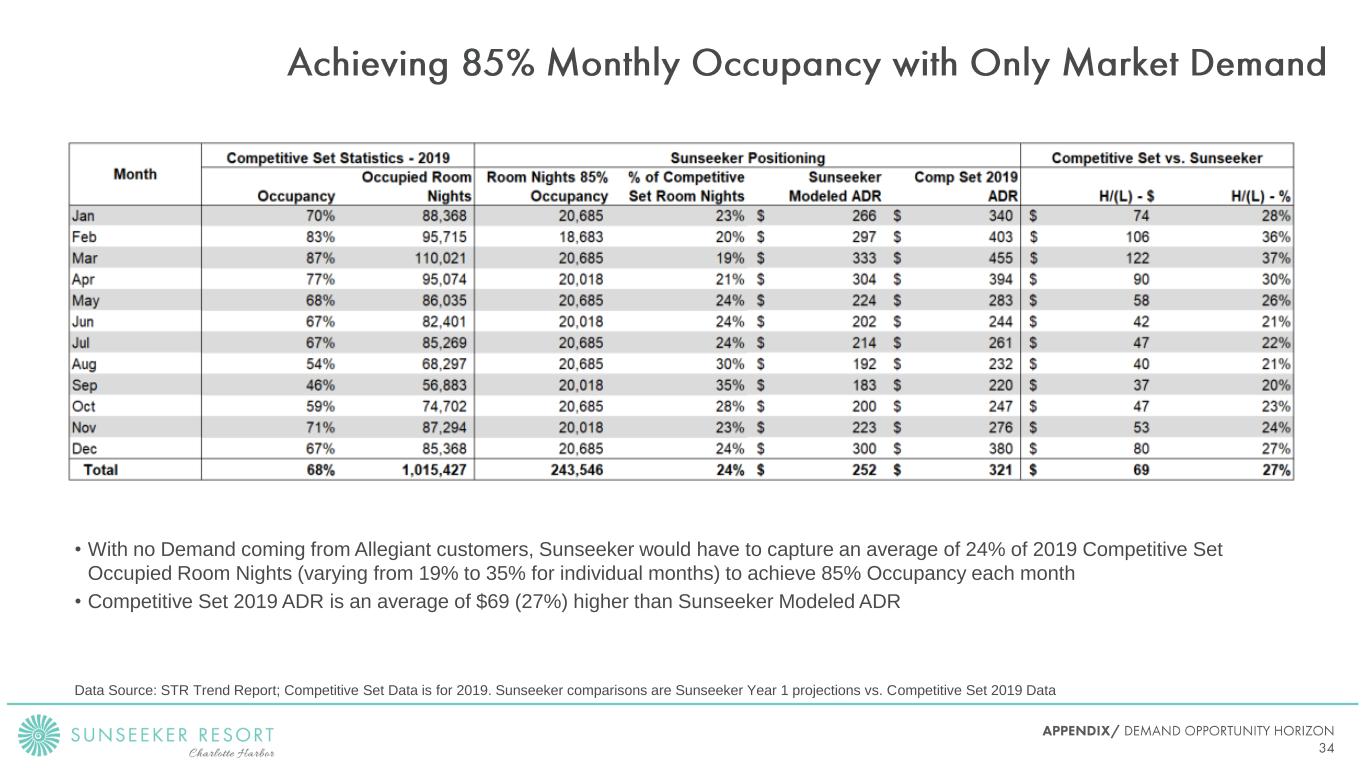
• With no Demand coming from Allegiant customers, Sunseeker would have to capture an average of 24% of 2019 Competitive Set Occupied Room Nights (varying from 19% to 35% for individual months) to achieve 85% Occupancy each month • Competitive Set 2019 ADR is an average of $69 (27%) higher than Sunseeker Modeled ADR Data Source: STR Trend Report; Competitive Set Data is for 2019. Sunseeker comparisons are Sunseeker Year 1 projections vs. Competitive Set 2019 Data
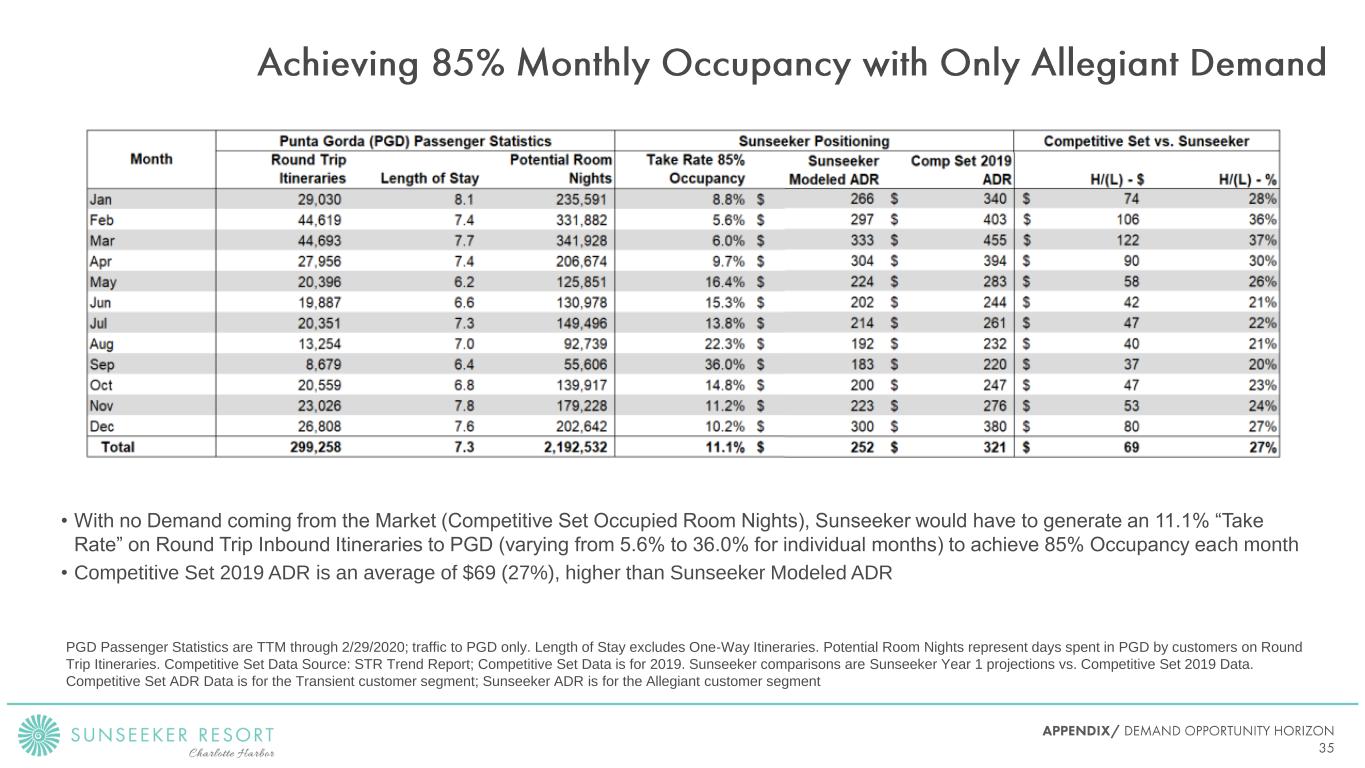
• With no Demand coming from the Market (Competitive Set Occupied Room Nights), Sunseeker would have to generate an 11.1% “Take Rate” on Round Trip Inbound Itineraries to PGD (varying from 5.6% to 36.0% for individual months) to achieve 85% Occupancy each month • Competitive Set 2019 ADR is an average of $69 (27%), higher than Sunseeker Modeled ADR PGD Passenger Statistics are TTM through 2/29/2020; traffic to PGD only. Length of Stay excludes One-Way Itineraries. Potential Room Nights represent days spent in PGD by customers on Round Trip Itineraries. Competitive Set Data Source: STR Trend Report; Competitive Set Data is for 2019. Sunseeker comparisons are Sunseeker Year 1 projections vs. Competitive Set 2019 Data. Competitive Set ADR Data is for the Transient customer segment; Sunseeker ADR is for the Allegiant customer segment
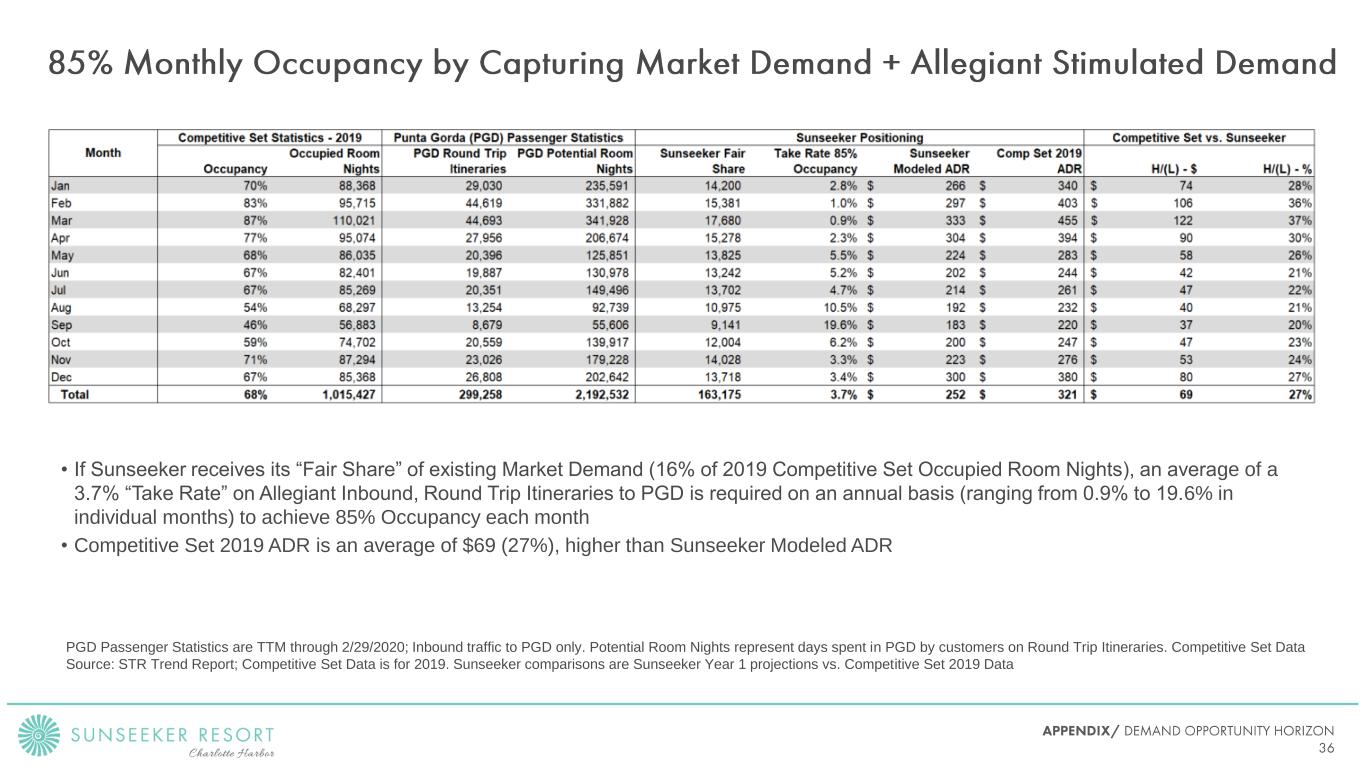
• If Sunseeker receives its “Fair Share” of existing Market Demand (16% of 2019 Competitive Set Occupied Room Nights), an average of a 3.7% “Take Rate” on Allegiant Inbound, Round Trip Itineraries to PGD is required on an annual basis (ranging from 0.9% to 19.6% in individual months) to achieve 85% Occupancy each month • Competitive Set 2019 ADR is an average of $69 (27%), higher than Sunseeker Modeled ADR PGD Passenger Statistics are TTM through 2/29/2020; Inbound traffic to PGD only. Potential Room Nights represent days spent in PGD by customers on Round Trip Itineraries. Competitive Set Data Source: STR Trend Report; Competitive Set Data is for 2019. Sunseeker comparisons are Sunseeker Year 1 projections vs. Competitive Set 2019 Data
• The “Take Rate” + “Fair Share” model for Demand assumes no cannibalization • To adjust for no assumed cannibalization, the model also assumes no Allegiant fliers to St. Petersburg (PIE), Sarasota (SRQ), or Sanford (SFB) stay at Sunseeker • Additionally, the model assumes that Allegiant only captures Demand from the 10 properties selected as the Competitive Set, and does not capture Demand from the hundreds of other properties in Southwest Florida • The model assumes that in Year 1 of Sunseeker Operation, Competitive Set Occupied Room Nights, Competitive Set ADR, and Allegiant Itineraries are the same as 2019 Competitive Set Data, and TTM through 2/29/2020 Allegiant Data • ADR in the Competitive Set has risen every year for the last 6 years (no data available for 6+ years ago) by an average of 3.8% per year • Assume that the additional supply added by Sunseeker balances out the 3.8% per year average ADR growth rate, leading to no change in Competitive Set ADR for Year 1
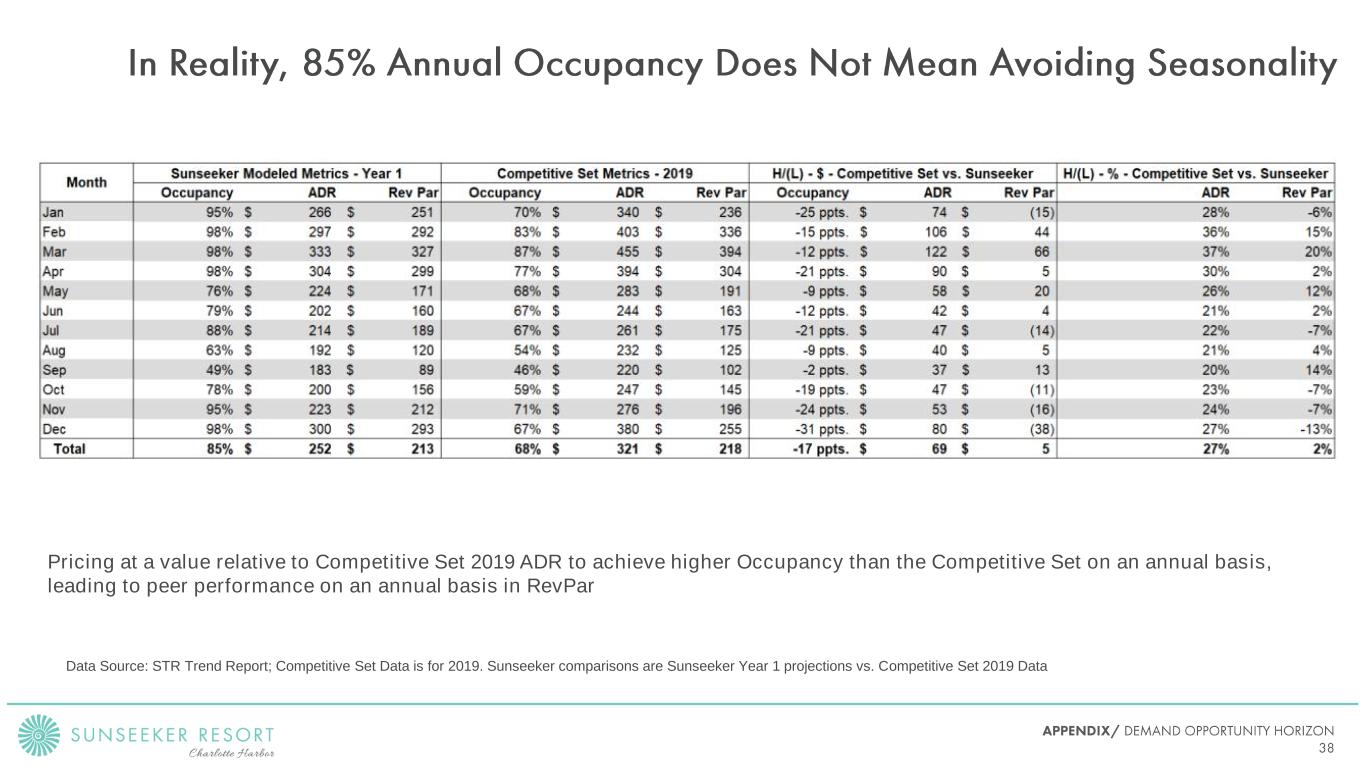
Pricing at a value relative to Competitive Set 2019 ADR to achieve higher Occupancy than the Competitive Set on an annual basis, leading to peer performance on an annual basis in RevPar Data Source: STR Trend Report; Competitive Set Data is for 2019. Sunseeker comparisons are Sunseeker Year 1 projections vs. Competitive Set 2019 Data

With “Fair Share,” Sunseeker only needs a 3.6% average Take Rate on an annual basis (ranging from 1.8% in March to 5.2% in July) to achieve 85% Occupancy PGD Passenger Statistics are TTM through 2/29/2020; Inbound traffic to PGD only. Potential Room Nights represent days spent in PGD by customers on Round Trip Itineraries. Competitive Set Data Source: STR Trend Report; Competitive Set Data is for 2019. Sunseeker comparisons are Sunseeker Year 1 projections vs. Competitive Set 2019 Data


