
1 Fleet Update January 6, 2022
2 Forward looking statements This presentation as well as oral statements made by officers or directors of Allegiant Travel Company, its advisors and affiliates (collectively or separately, the "Company“) will contain forward-looking statements that are only predictions and involve risks and uncertainties. Forward-looking statements may include, among others, references to future performance and any comments about our strategic plans. There are many risk factors that could prevent us from achieving our goals and cause the underlying assumptions of these forward-looking statements, and our actual results, to differ materially from those expressed in, or implied by, our forward- looking statements. These risk factors and others are more fully discussed in our filings with the Securities and Exchange Commission. Any forward-looking statements are based on information available to us today and we undertake no obligation to update publicly any forward-looking statements, whether as a result of future events, new information or otherwise. The Company cautions users of this presentation not to place undue reliance on forward-looking statements, which may be based on assumptions and anticipatedevents that do not materialize.
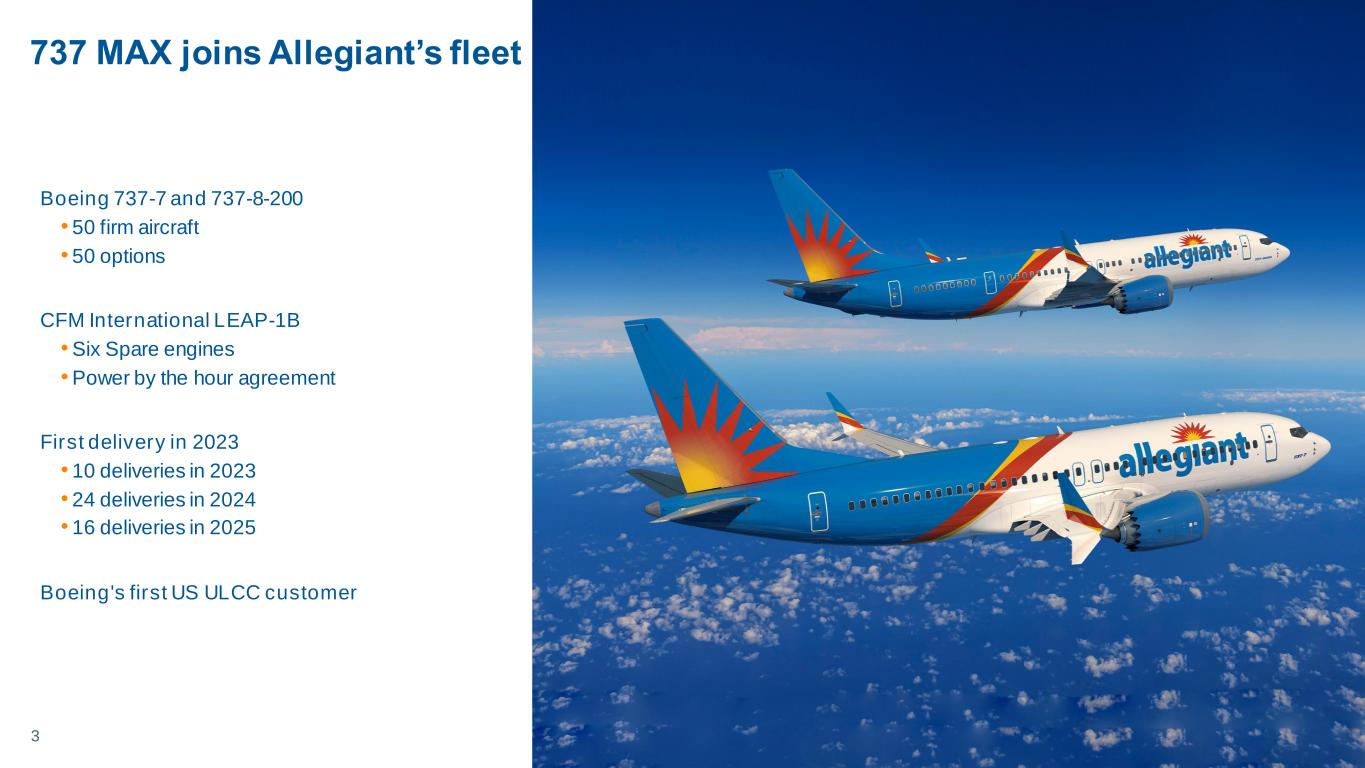
3 737 MAX joins Allegiant’s fleet Boeing 737-7 and 737-8-200 • 50 firm aircraft • 50 options CFM International LEAP-1B •Six Spare engines •Power by the hour agreement First delivery in 2023 • 10 deliveries in 2023 • 24 deliveries in 2024 • 16 deliveries in 2025 Boeing's first US ULCC customer

4 7% 10% 6% 6% 14% 11% 22% 16% 10% 14% 15% 12% 27% 25% 13% 12% 16% 1% (6%) (8%) (7%) 0% 2% (10%) (4%) 3% 1% 2% 5% 7% 15% 14% 11% 8% 10% (24%) 2003 2004 2005 2006 2007 2008 2009 2010 2011 2012 2013 2014 2015 2016 2017 2018 2019 2021¹ Allegiant Industry2 Opportunistic asset management has been key to sustained profitability Pre-tax Margin 2003 - 2021 MD80 9 9 17 24 32 38 46 52 56 58 52 53 51 47 37 757 1 5 6 6 5 4 A320 8 11 24 33 52 76 91 108 Total 9 9 17 24 32 38 46 52 57 63 66 70 80 84 89 76 91 108 1. 2021 pre-tax margin based on nine months ended September 30, 2021 and has been adjusted to exclude the net benefits from the Payroll Support Program, COVID related special charges, and bonus accruals. 2. Industry includes: WN, AA, AQ, AS, B6, CO, DH, DL, E9, F9, FF, FL, G4, HA, HP, JI, LC, MX, N7, NA, NJ, NK, NW, P9, PN, SX, SY, T9, TW, TZ, U5, UA, US, VX, XP, YX Introduced A320 family Introduced 757 Introduced 13 new A320 CEOs
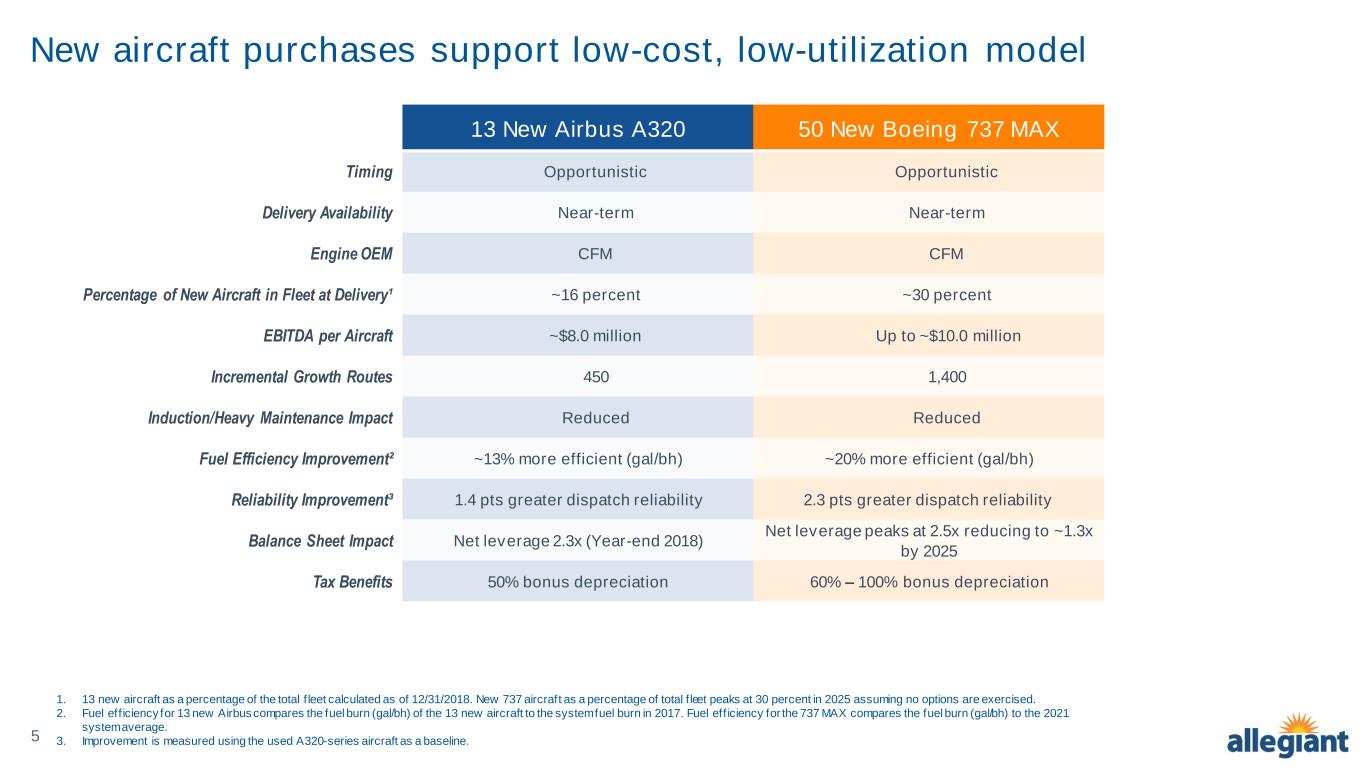
5 New aircraft purchases support low-cost, low-utilization model 13 New Airbus A320 50 New Boeing 737 MAX Timing Opportunistic Opportunistic Delivery Availability Near-term Near-term Engine OEM CFM CFM Percentage of New Aircraft in Fleet at Delivery¹ ~16 percent ~30 percent EBITDA per Aircraft ~$8.0 million Up to ~$10.0 million Incremental Growth Routes 450 1,400 Induction/Heavy Maintenance Impact Reduced Reduced Fuel Efficiency Improvement² ~13% more efficient (gal/bh) ~20% more efficient (gal/bh) Reliability Improvement³ 1.4 pts greater dispatch reliability 2.3 pts greater dispatch reliability Balance Sheet Impact Net leverage 2.3x (Year-end 2018) Net leverage peaks at 2.5x reducing to ~1.3x by 2025 Tax Benefits 50% bonus depreciation 60% – 100% bonus depreciation 1. 13 new aircraft as a percentage of the total f leet calculated as of 12/31/2018. New 737 aircraft as a percentage of total f leet peaks at 30 percent in 2025 assuming no options are exercised. 2. Fuel eff iciency for 13 new Airbus compares the fuel burn (gal/bh) of the 13 new aircraft to the system fuel burn in 2017. Fuel eff iciency for the 737 MAX compares the fuel burn (gal/bh) to the 2021 system average. 3. Improvement is measured using the used A320-series aircraft as a baseline.
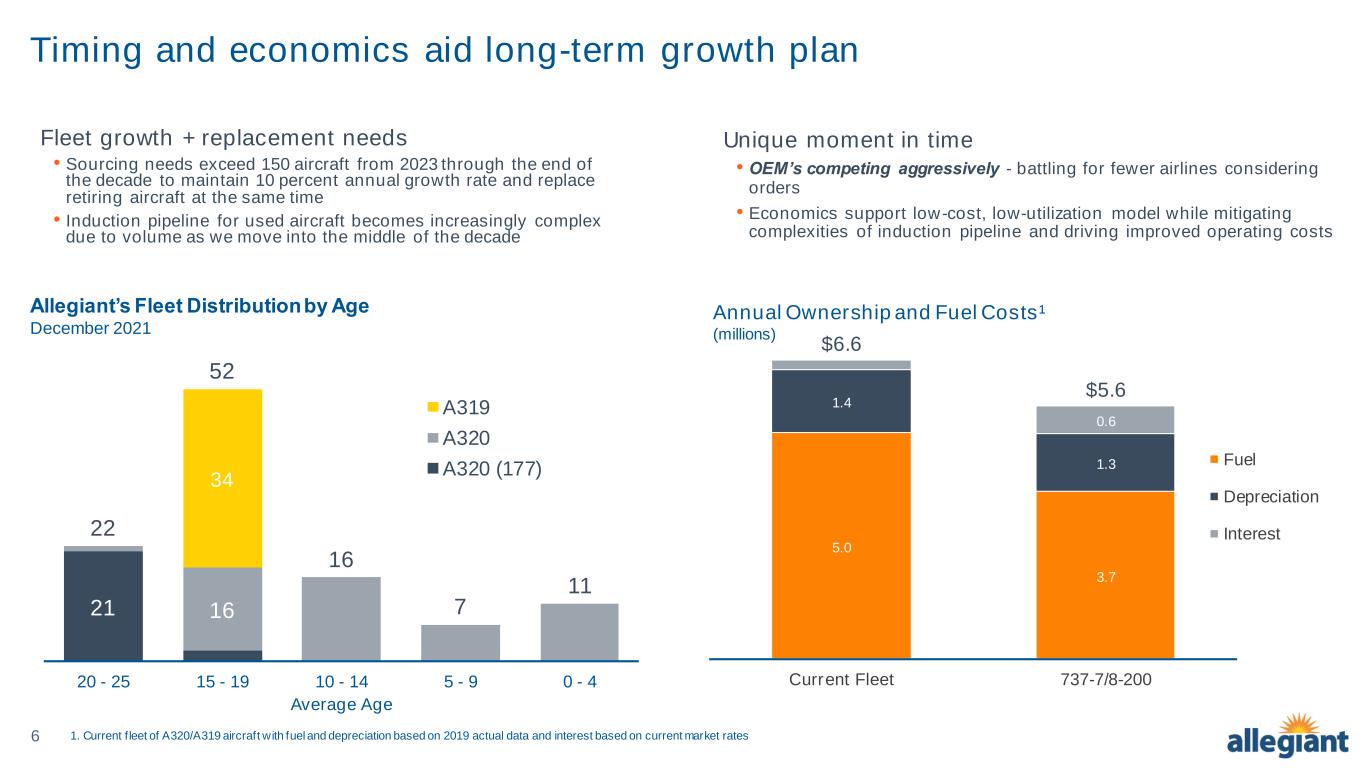
6 Timing and economics aid long-term growth plan 21 16 34 22 52 16 7 11 20 - 25 15 - 19 10 - 14 5 - 9 0 - 4 Average Age A319 A320 A320 (177) Allegiant’s Fleet Distribution by Age December 2021 Fleet growth + replacement needs • Sourcing needs exceed 150 aircraft from 2023 through the end of the decade to maintain 10 percent annual growth rate and replace retiring aircraft at the same time • Induction pipeline for used aircraft becomes increasingly complex due to volume as we move into the middle of the decade Unique moment in time • OEM’s competing aggressively - battling for fewer airlines considering orders • Economics support low-cost, low-utilization model while mitigating complexities of induction pipeline and driving improved operating costs Annual Ownership and Fuel Costs¹ (millions) 1. Current f leet of A320/A319 aircraft with fuel and depreciation based on 2019 actual data and interest based on current market rates $6.6 $5.6 5.0 3.7 1.4 1.3 0.6 Current Fleet 737-7/8-200 Fuel Depreciation Interest
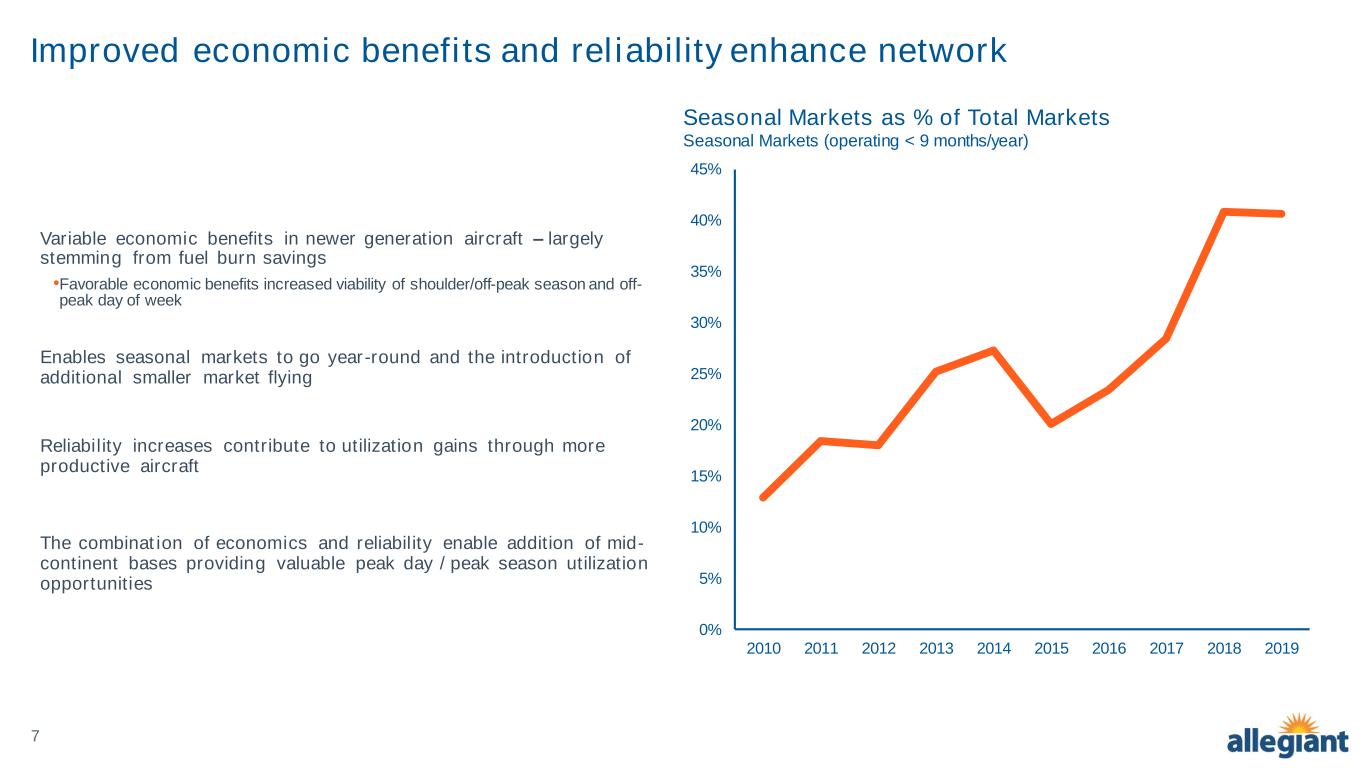
7 Improved economic benefits and reliability enhance network Line represents 2016 Deck for reference Variable economic benefits in newer generation aircraft – largely stemming from fuel burn savings •Favorable economic benefits increased viability of shoulder/off-peak season and off- peak day of week Enables seasonal markets to go year-round and the introduction of additional smaller market flying Reliability increases contribute to utilization gains through more productive aircraft The combination of economics and reliability enable addition of mid- continent bases providing valuable peak day / peak season utilization opportunities 0% 5% 10% 15% 20% 25% 30% 35% 40% 45% 2010 2011 2012 2013 2014 2015 2016 2017 2018 2019 Seasonal Markets as % of Total Markets Seasonal Markets (operating < 9 months/year)
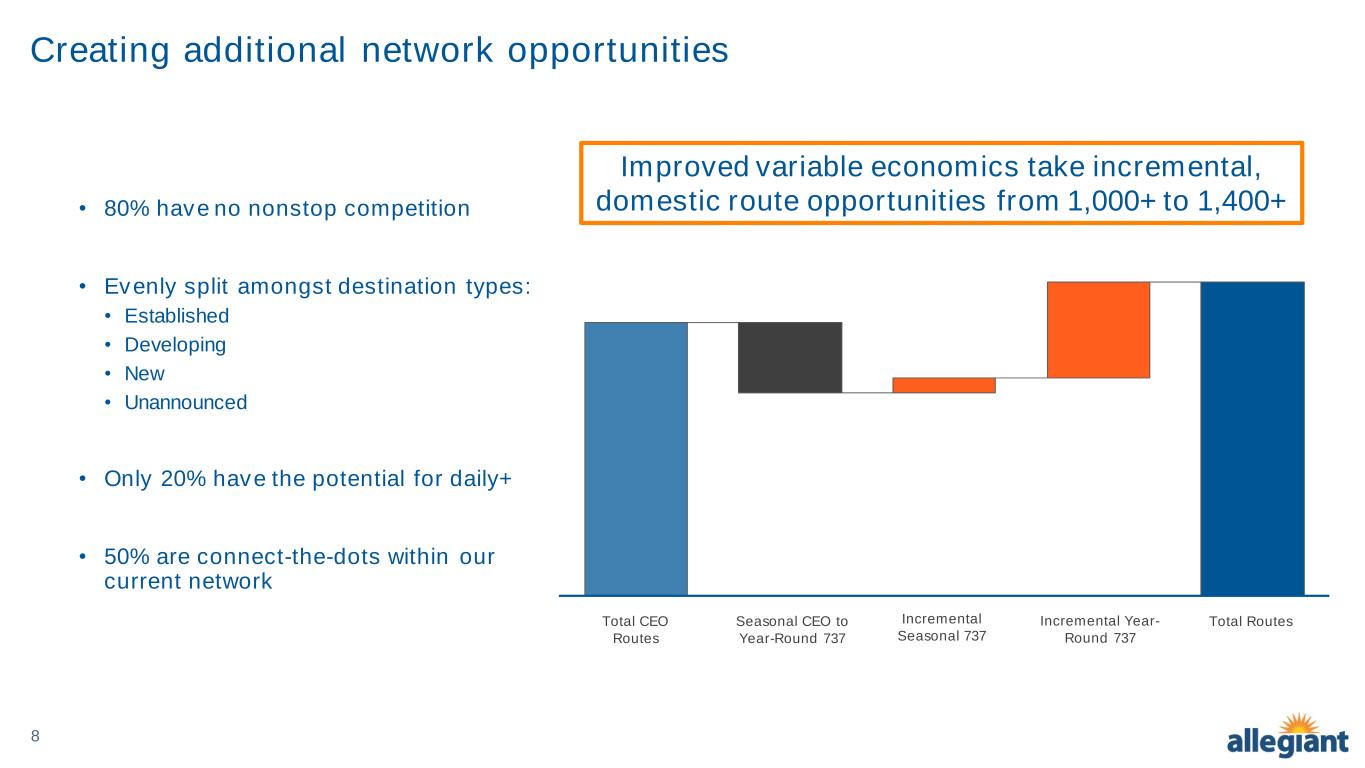
8 Creating additional network opportunities • 80% have no nonstop competition • Evenly split amongst destination types: • Established • Developing • New • Unannounced • Only 20% have the potential for daily+ • 50% are connect-the-dots within our current network 1400+ incremental domestic routes Improved variable economics take incremental, domestic route opportunities from 1,000+ to 1,400+ Total CEO Routes Seasonal CEO to Year-Round 737 Incremental Seasonal 737 Incremental Year- Round 737 Total Routes

9 Economics support mid-continent basing strategy Line represents 2016 Deck for reference • Small, mid-continent bases constitute nearly 50% of flying aircraft in 2022 driving significant returns • Economic profile of A320 series aircraft and reliability unlocked opportunities in smaller markets • Incremental improvement in variable economics with the 737 aircraft will continue to tap into these markets • Peak day, peak season utilization is most valuable flying • Adding new bases best enables this flying as incremental aircraft to existing bases invariably fly less than previous aircraft in base 31% 38% 47% 69% 62% 53% 2019 2021 2022 Large Base A/C as a % of total flyers Small Base A/C as a % of total flyers Base Size as a % of Total Fleet 2019-2022 Top Utilized Line in Each Base 2021 1 1 .1 1 1 .0 1 0 .9 1 0 .3 1 0 .3 1 0 .1 9 .8 9 .6 9 .5 9 .4 9 .4 9 .4 9 .3 9 .1 8 .8 8 .8 8 .8 8 .6 8 .4 8 .3 7 .8 7 .7 6 .7 Small Base Large BaseSystem Average
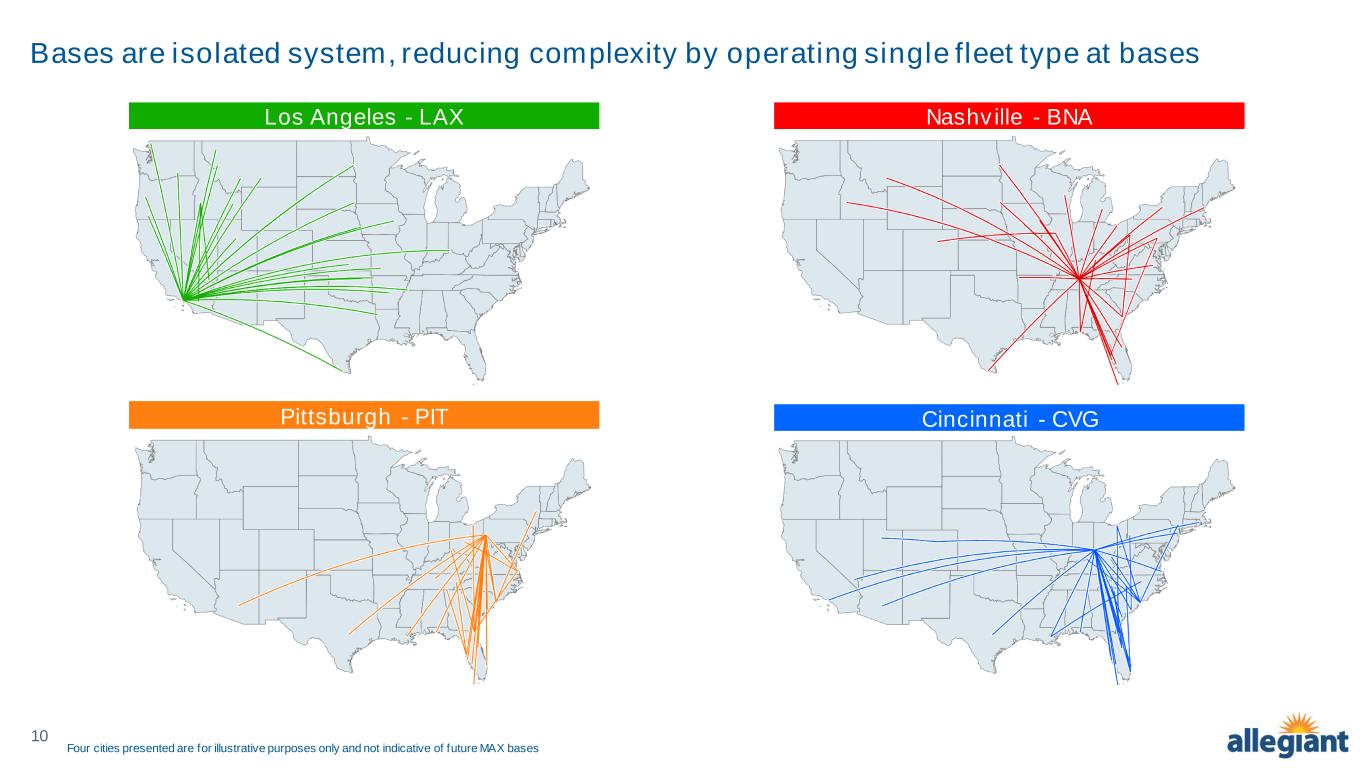
10 Bases are isolated system, reducing complexity by operating single fleet type at bases Nashville - BNALos Angeles - LAX Pittsburgh - PIT Cincinnati - CVG Four cities presented are for illustrative purposes only and not indicative of future MAX bases
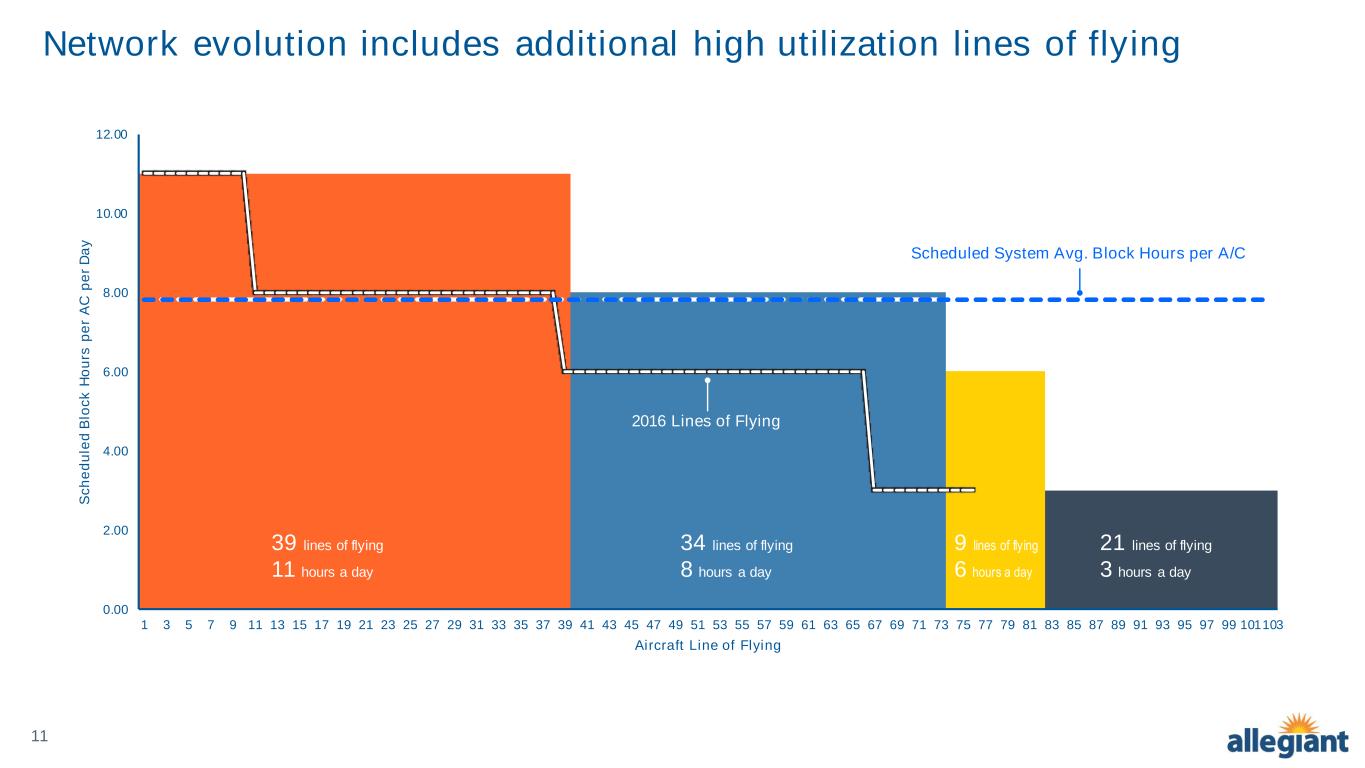
11 0.00 2.00 4.00 6.00 8.00 10.00 12.00 1 3 5 7 9 11 13 15 17 19 21 23 25 27 29 31 33 35 37 39 41 43 45 47 49 51 53 55 57 59 61 63 65 67 69 71 73 75 77 79 81 83 85 87 89 91 93 95 97 99 101103 S c h e d u le d B lo c k H o u rs p e r A C p e r D a y Aircraft Line of Flying Network evolution includes additional high utilization lines of flying Line represents 2016 Deck for reference 39 lines of flying 11 hours a day 34 lines of flying 8 hours a day 21 lines of flying 3 hours a day 9 lines of flying 6 hours a day Scheduled System Avg. Block Hours per A/C 2016 Lines of Flying

12 B737 meets Allegiant’s fleet needs 737 MAX A220-300 A320neo A320/19ceo Production Outlook In production In production In production Out of production Delivery Availability Short-term Short-term¹ Long-term Today Flexibility / Up-Gauge Optionality High (4 variants) Low (Uncertain) Medium (2 variants) Medium (3 variants) Unit Cost (Cost per Seat) Low Low Low Baseline Trip Cost (Cost per Departure) Low Low Low Baseline Reliability High High High Baseline Spare Parts Coverage High Low High Baseline Benefits Lowest unit cost for Allegiant, fuel and OPEX reductions late decade, Highest EBITDA/aircraft production Fuel and OPEX reductions late decade Single fleet type, fuel and OPEX reductions beginning late decade Single fleet type, minimize capex near/medium term, attractive used market (currently) Considerations Dual fleet complexity Dual fleet complexity Highest acquisition cost, delivery slots limited to mid-late decade Higher maintenance and fuel costs, decreasing reliability, large replacement need in late decade, ESG concerns 1. Short-term deliveries are available, how ever lower production rates extend desired delivery schedule
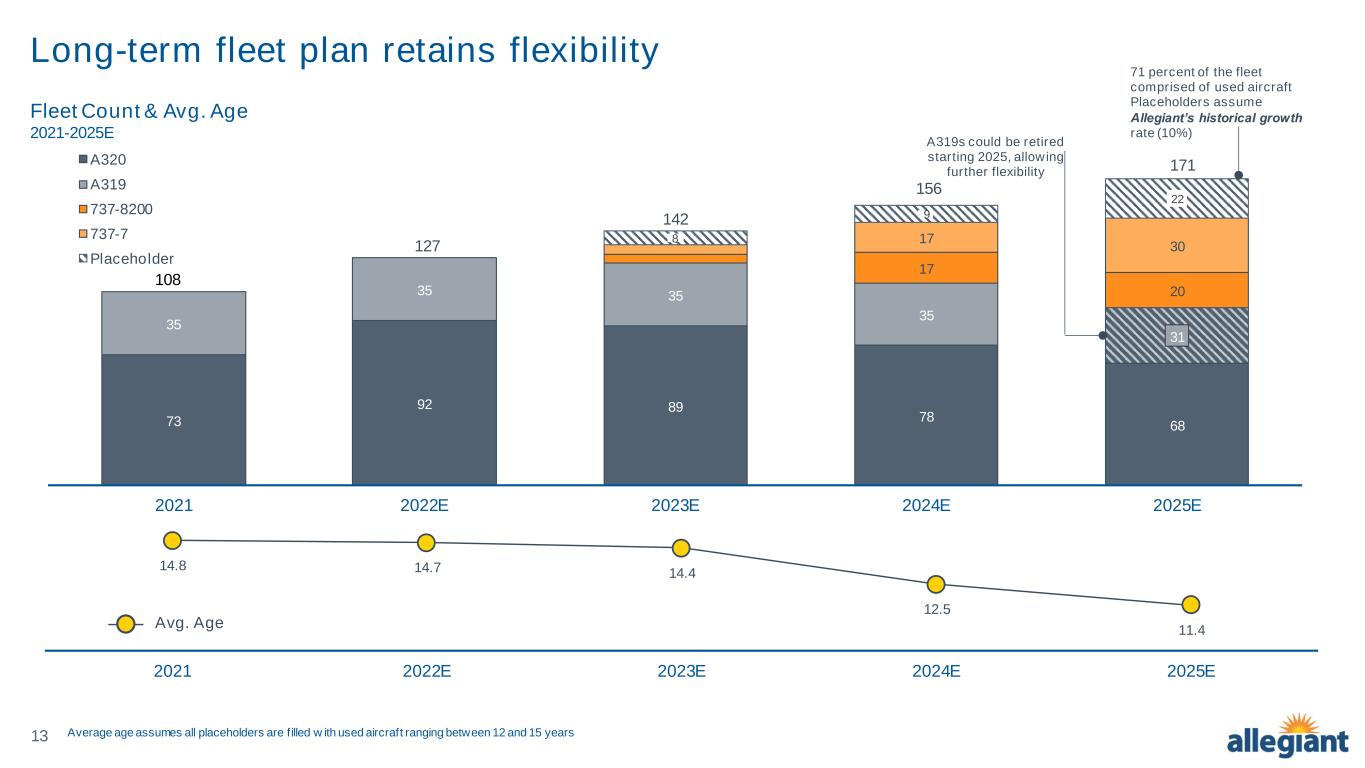
13 Long-term fleet plan retains flexibility 73 92 89 78 68 35 35 35 35 31 17 20 17 30 8 9 22 2021 2022E 2023E 2024E 2025E A320 A319 737-8200 737-7 Placeholder 108 14.8 14.7 14.4 12.5 11.4 2021 2022E 2023E 2024E 2025E Fleet Count & Avg. Age 2021-2025E Avg. Age 71 percent of the fleet comprised of used aircraft Placeholders assume Allegiant’s historical growth rate (10%) A319s could be retired starting 2025, allowing further flexibility Average age assumes all placeholders are f illed w ith used aircraft ranging between 12 and 15 years 142 156 171 127
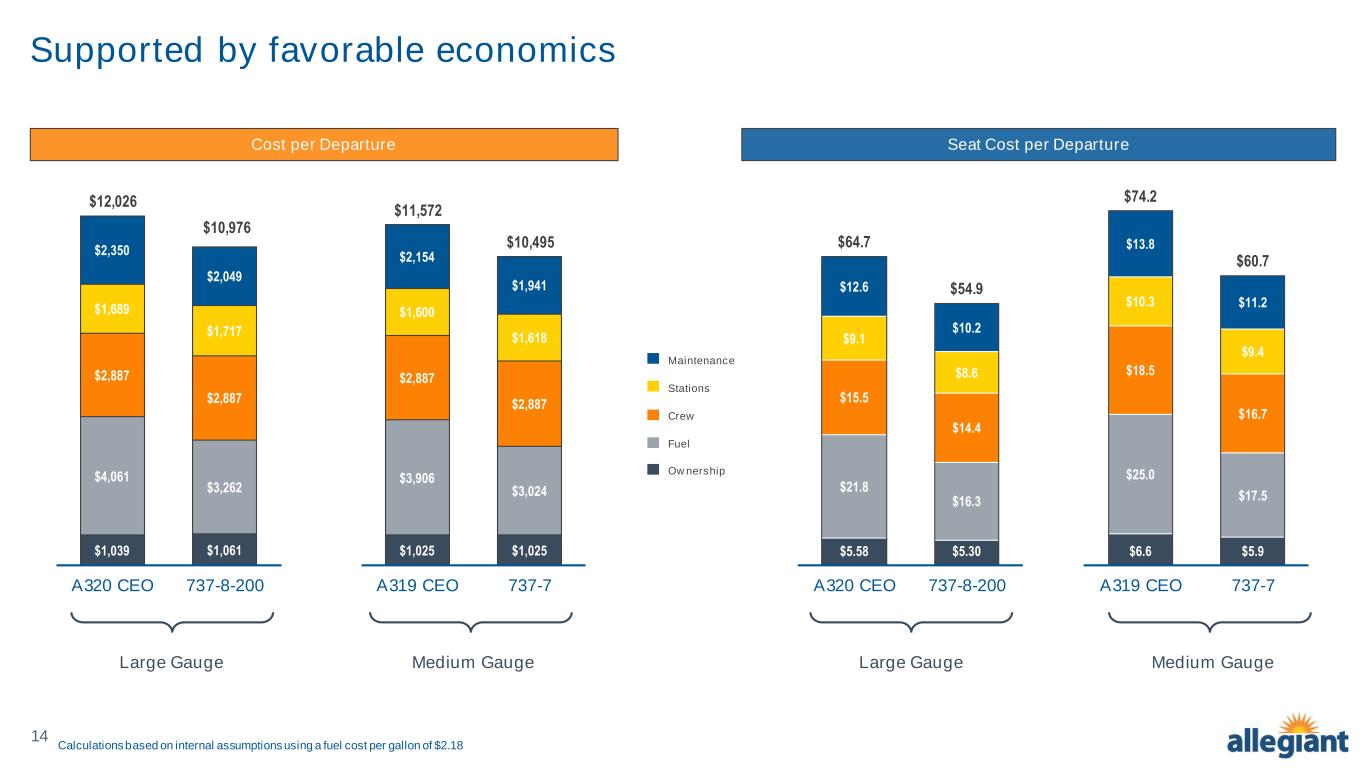
14 $1,039 $1,061 $4,061 $3,262 $2,887 $2,887 $1,689 $1,717 $2,350 $2,049 $12,026 $10,976 A320 CEO 737-8-200 Supported by favorable economics Cost per Departure Seat Cost per Departure Maintenance Stations Crew Fuel Ownership $5.58 $5.30 $21.8 $16.3 $15.5 $14.4 $9.1 $8.6 $12.6 $10.2 $64.7 $54.9 A320 CEO 737-8-200 Calculations based on internal assumptions using a fuel cost per gallon of $2.18 $1,025 $1,025 $3,906 $3,024 $2,887 $2,887 $1,600 $1,618 $2,154 $1,941 $11,572 $10,495 A319 CEO 737-7 $6.6 $5.9 $25.0 $17.5 $18.5 $16.7 $10.3 $9.4 $13.8 $11.2 $74.2 $60.7 A319 CEO 737-7 Large Gauge Medium Gauge Large Gauge Medium Gauge
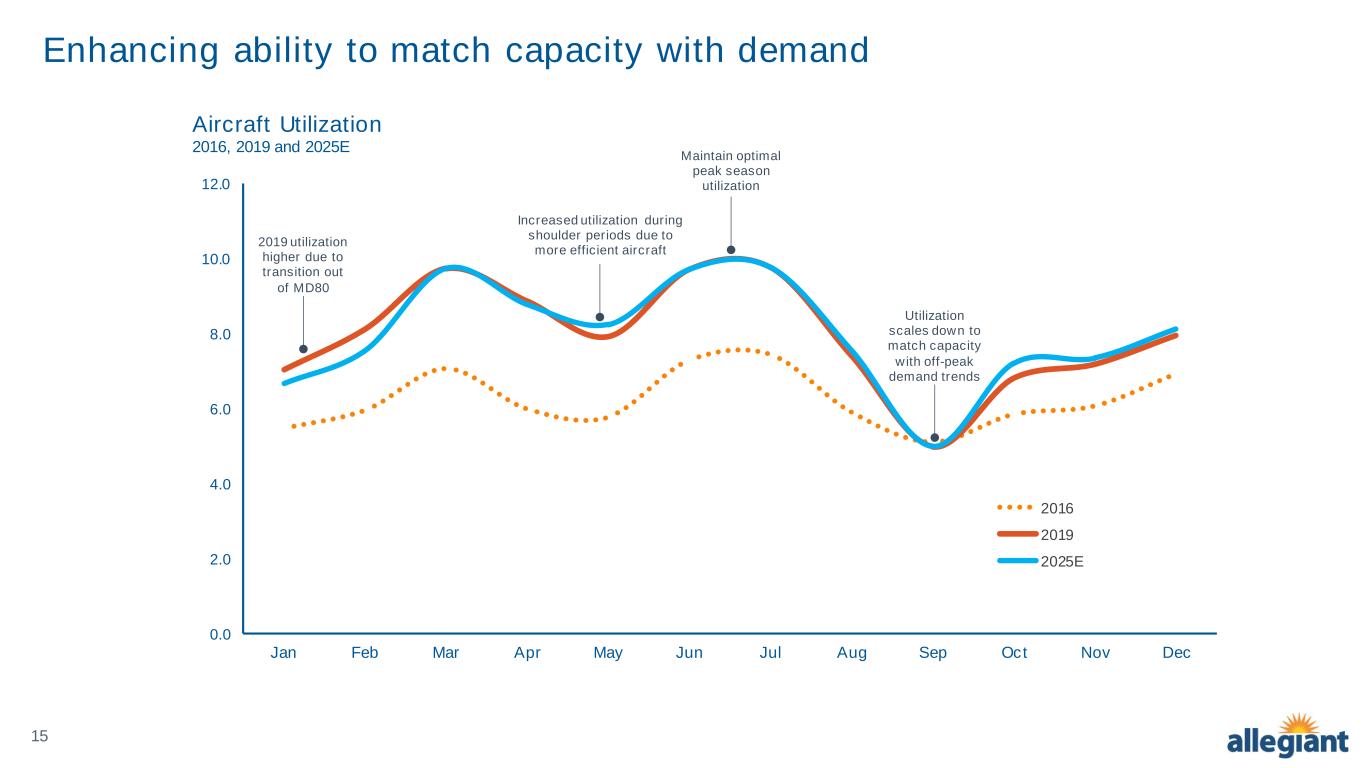
15 Enhancing ability to match capacity with demand Aircraft Utilization 2016, 2019 and 2025E 0.0 2.0 4.0 6.0 8.0 10.0 12.0 Jan Feb Mar Apr May Jun Jul Aug Sep Oct Nov Dec 2016 2019 2025E 2019 utilization higher due to transition out of MD80 Maintain optimal peak season utilization Utilization scales down to match capacity with off-peak demand trends Increased utilization during shoulder periods due to more efficient aircraft

16 2019 utilization results in increased EBITDA per aircraft $7.0M $10.0M A320 CEO 737-8200 EBITDA per 737 Aircraft vs Current Aircraft $5.0M $7.0M A319 CEO 737-7 Highest Gauge Mid-Gauge 177/ 186 seats 200 seats 156 seats 173 seats 7.3 Hrs/day 2019 8.1 Hrs/day 8.1 Hrs/day 7.3 Hrs/day 2019 737 EBITDA projections assume 2019 operating environment, fuel cost per gallon, and utilization levels, resulting in an increased EBITDA per 737-8-200 aircraft of roughly 43 percent when compared to the A320 CEO, and an increased EBITDA per 737-7 of roughly 40 percent when compared to the A319 CEO.
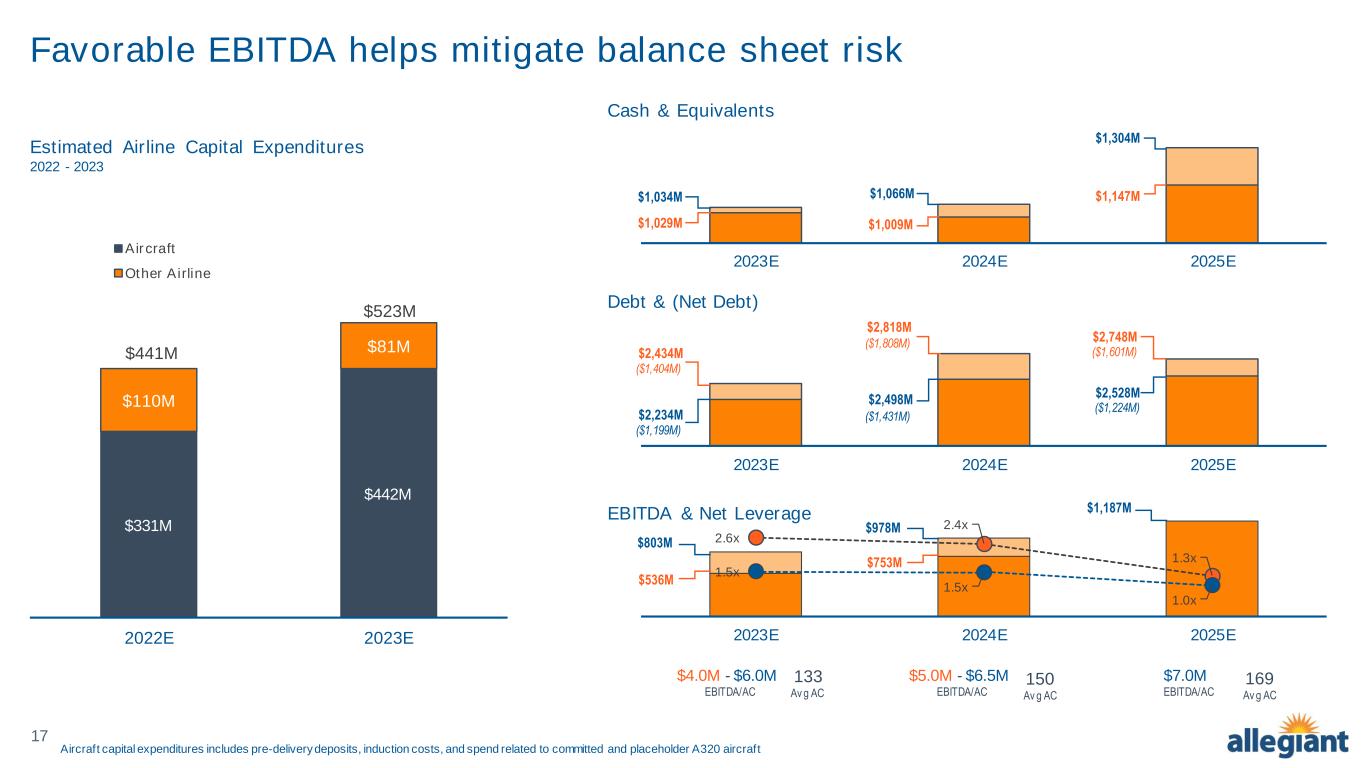
17 Favorable EBITDA helps mitigate balance sheet risk Cash & Equivalents Debt & (Net Debt) $1,029M $1,009M $1,147M$1,034M $1,066M $1,304M 2023E 2024E 2025E $2,234M $2,498M $2,528M $2,434M $2,818M $2,748M 2023E 2024E 2025E EBITDA & Net Leverage $536M $753M $803M $978M $1,187M 2.6x 2.4x 1.3x 1.5x 1.5x 1.0x 2023E 2024E 2025E $4.0M - $6.0M EBITDA/AC 133 Av g AC 150 Av g AC 169 Av g AC Aircraft capital expenditures includes pre-delivery deposits, induction costs, and spend related to committed and placeholder A320 aircraft Estimated Airline Capital Expenditures 2022 - 2023 $331M $442M $110M $81M 2022E 2023E Aircraft Other Airline $523M $441M ($1,199M) ($1,404M) ($1,808M) ($1,431M) ($1,601M) ($1,224M) $5.0M - $6.5M EBITDA/AC $7.0M EBITDA/AC

18 Low fixed costs maintained 1.9M 2.1M 2.2M 2.3M 2.0M 2.1M 2.4M 3.0M 5.0M 0.6M 0.4M 0.6M 0.7M 1.1M 1.2M 1.2M 0.9M 2.5M 2.5M 2.8M 3.0M 3.2M 3.3M 3.6M 3.9M 5.0M Ownership Expense per Aircraft (Mainline + Regionals) 3Q21TTM (millions) Source: Aerotransport DB, SEC (fillings), DOT (Form 41) Ownership Expense • D&A • A/C Rent • Interest Expense D&A A/C Rent 3Q21 TTM + Interest Exp 3Q21 TTM. Allegiant ’25E Ownership Expense – $2.6M
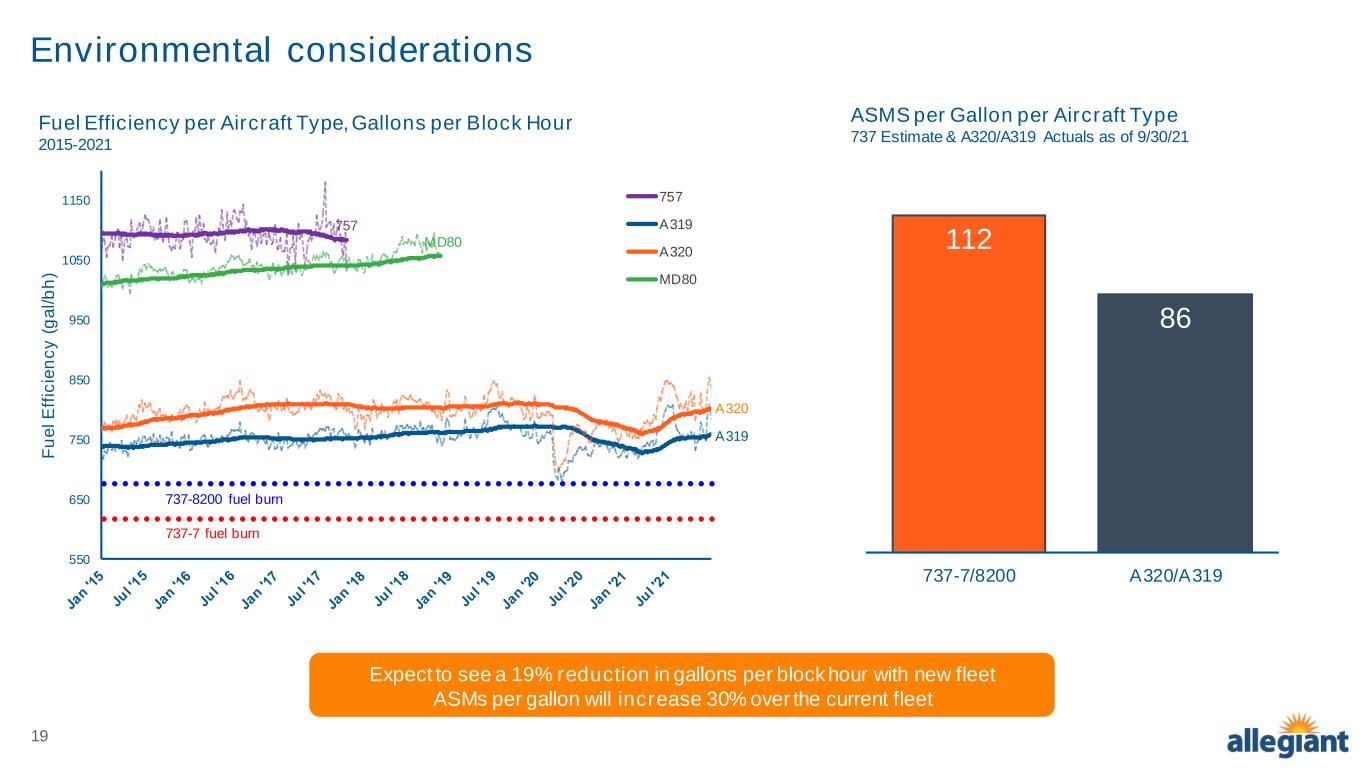
19 Environmental considerations Fuel Efficiency per Aircraft Type, Gallons per Block Hour 2015-2021 112 86 737-7/8200 A320/A319 ASMS per Gallon per Aircraft Type 737 Estimate & A320/A319 Actuals as of 9/30/21 Expect to see a 19% reduction in gallons per block hour with new fleet ASMs per gallon will increase 30% over the current fleet 550 650 750 850 950 1050 1150 F u e l E ff ic ie n c y ( g a l/ b h ) 757 A319 A320 MD80 737-8200 fuel burn 737-7 fuel burn 757 MD80 A320 A319


