UNITED STATES
SECURITIES AND EXCHANGE COMMISSION
Washington, D.C. 20549
FORM N-CSR
CERTIFIED SHAREHOLDER REPORT OF REGISTERED MANAGEMENT INVESTMENT COMPANIES
| Investment Company Act file number: | 811-21901 |
| | |
| Exact name of registrant as specified in charter: | abrdn Global Dynamic Dividend Fund |
| | |
| Address of principal executive offices: | 1900 Market Street, Suite 200 |
| | Philadelphia, PA 19103 |
| | |
| Name and address of agent for service: | Sharon Ferrari |
| | abrdn Inc. |
| | 1900 Market Street, Suite 200 |
| | Philadelphia, PA 19103 |
| | |
| Registrant’s telephone number, including area code: | 1-800-522-5465 |
| | |
| Date of fiscal year end: | October 31 |
| | |
| Date of reporting period: | April 30, 2023 |
Item 1. Reports to Stockholders.
(a) A copy of the report transmitted to shareholders pursuant to Rule 30e-1 under the Investment Company Act of 1940 (the “1940 Act”) is filed herewith.
Total Investment Return (unaudited)
The following table summarizes the average annual Fund performance compared to the Fund’s primary benchmark for the six-month, 1-year, 3-year, 5-year and 10-year periods ended April 30, 2023.
| | 6 Months | 1 Year | 3 Years | 5 Years | 10 Years |
| Net Asset Value (NAV) | 14.13% | 4.16% | 13.05% | 6.99% | 8.45% |
| Market Price | 11.20% | 1.78% | 13.40% | 5.78% | 8.00% |
| MSCI AC World Index (Net DTR) | 12.68% | 2.06% | 12.04% | 7.03% | 7.91% |
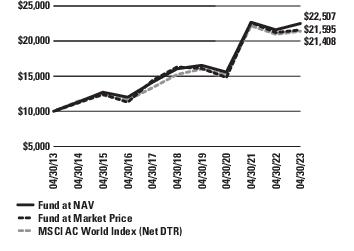
Performance of a $10,000 Investment (as of April 30, 2023)
This graph shows the change in value of a hypothetical investment of $10,000 in the Fund for the period indicated. For comparison, the same investment is shown in the indicated index.
abrdn Investments Limited (the "Adviser") assumed responsibility for the management of the Fund as investment adviser on May 7, 2018. Performance prior to this date reflects the performance of an unaffiliated investment adviser.
Effective May 4, 2018, the Adviser entered into a written contract with the Fund to waive fees or limit expenses. This contract may not be terminated before June 30, 2024. Absent such waivers and/or reimbursements, the Fund's returns would be lower. Additionally, abrdn Inc. has entered into an agreement with the Fund to limit investor relations services fees, without which performance would be lower if the Fund's investor services fees exceeded such limit during the relevant period. This agreement aligns with the term of the advisory agreement and may not be terminated prior to the end of the current term of the advisory agreement. See Note 3 in the Notes to Financial Statements.
Returns represent past performance. Total investment return at NAV is based on changes in the NAV of Fund shares and assumes reinvestment of dividends and distributions, if any, at market prices pursuant to the dividend reinvestment program sponsored by the Fund’s transfer agent. All return data at NAV includes fees charged to the Fund, which are listed in the Fund’s Statement of Operations under “Expenses.” Total investment return at market value is based on changes in the market price at which the Fund’s shares traded on the NYSE during the period and assumes reinvestment of dividends and distributions, if any, at market prices pursuant to the dividend reinvestment program sponsored by the Fund’s transfer agent. The Fund’s total investment return is based on the reported NAV as of the financial reporting period end date of April 30, 2023. Because the Fund’s shares trade in the stock market based on investor demand, the Fund may trade at a price higher or lower than its NAV. Therefore, returns are calculated based on both market price and NAV. Past performance is no guarantee of future results. The performance information provided does not reflect the deduction of taxes that a shareholder would pay on distributions received from the Fund. The current performance of the Fund may be lower or higher than the figures shown. The Fund’s yield, return, market price and NAV will fluctuate. Performance information current to the most recent month-end is available at www.abrdnagd.com or by calling 800-522-5465.
The annualized net operating expense ratio, excluding fee waivers based on the six-month period ended April 30, 2023 was 1.31%. The annualized net operating expense ratio net of fee waivers based on the six-month period ended April 30, 2023 was 1.17%. The annualized net operating expenses, net of fee waivers and excluding interest expense based on the six-month period ended April 30, 2023, was 1.16%.
| abrdn Global Dynamic Dividend Fund | 3 |
Notes to Financial Statements (unaudited)
April 30, 2023
abrdn Global Dynamic Dividend Fund ("AGD" or the “Fund”) is a diversified, closed-end management investment company. The Fund was organized as a Delaware statutory trust on May 11, 2006, and commenced operations on July 26, 2006. The Fund’s primary investment objective is to seek high current dividend income, more than 50% of which qualifies for the reduced Federal income tax rates created by the Jobs and Growth Tax Relief Reconciliation Act of 2003. The Fund also focuses on long-term growth of capital as a secondary investment objective. The Board of Trustees (the “Board”) authorized an unlimited number of shares with no par value.
On March 10, 2023, the Fund acquired the assets and assumed the liabilities of Delaware Enhanced Global Dividend and Income Fund ("DEX") and Delaware Investments® Dividend and Income Fund, Inc. ("DDF") pursuant to plans of reorganization approved by the Board on August 11, 2022 ("Reorganizations"). In the Reorganizations, common shareholders of DEX and DDF received an amount of AGD common shares with a net asset value equal to the aggregate net asset value of their holdings of DEX and DDF common shares, as determined at the close of regular business on March 10, 2023. Any applicable fractional shares were paid as cash-in-lieu to the applicable holder. The Reorganizations were each structured as a tax-free transaction. The Fund is considered the tax survivor and accounting survivor of the Reorganizations.
The following is a summary of the net asset value (“NAV”) per share issued as of March 10, 2023.
| Acquired Fund | AGD NAV per Share ($) 3/10/2023 | Conversion Ratio | Shares Issued |
| Delaware Enhanced Global Dividend and Income Fund (“DEX”) | 10.5040 | 0.835659 | 6,212,854 |
| Delaware Investments® Dividend and Income Fund, Inc. (“DDF”) | 10.5040 | 0.801802 | 6,102,645 |
2. Summary of Significant Accounting Policies
The Fund is an investment company and accordingly follows the investment company accounting and reporting guidance of the Financial Accounting Standards Board ("FASB") Accounting Standard Codification Topic 946 Financial Services-Investment Companies. The following is a summary of significant accounting policies followed by the Fund in the preparation of its financial statements. The policies conform to generally accepted accounting principles ("GAAP") in the United States of America. The preparation of financial statements requires management to make estimates and assumptions that affect the reported amounts of assets and liabilities, disclosure of contingent assets and liabilities at the date of the financial statements, and the reported amounts of income and expenses for the period. Actual results could differ from those estimates. The accounting records of the Fund are maintained in U.S. Dollars and the U.S. Dollar is used as both the functional and reporting currency.
a. Security Valuation:
The Fund values its securities at current market value or fair value, consistent with regulatory requirements. "Fair value" is defined in the Fund's Valuation and Liquidity Procedures as the price that could be received to sell an asset or paid to transfer a liability in an orderly transaction between willing market participants without a compulsion to transact at the measurement date. Pursuant to Rule 2a-5 under the Investment Company Act of 1940, as amended (the "1940 Act"), the Board designated abrdn Investments Limited (the "Adviser") as the valuation designee ("Valuation Designee") for the Fund to perform the
fair value determinations relating to Fund investments for which market quotations are not readily available.
In accordance with the authoritative guidance on fair value measurements and disclosures under U.S. GAAP, the Fund discloses the fair value of its investments using a three-level hierarchy that classifies the inputs to valuation techniques used to measure the fair value. The hierarchy assigns Level 1, the highest level, measurements to valuations based upon unadjusted quoted prices in active markets for identical assets, Level 2 measurements to valuations based upon other significant observable inputs, including adjusted quoted prices in active markets for similar assets, and Level 3, the lowest level, measurements to valuations based upon unobservable inputs that are significant to the valuation. Inputs refer broadly to the assumptions that market participants would use in pricing the asset or liability, including assumptions about risk, for example, the risk inherent in a particular valuation technique used to measure fair value including a pricing model and/or the risk inherent in the inputs to the valuation technique. Inputs may be observable or unobservable. Observable inputs are inputs that reflect the assumptions market participants would use in pricing the asset or liability, which are based on market data obtained from sources independent of the reporting entity. Unobservable inputs are inputs that reflect the reporting entity’s own assumptions about the assumptions market participants would use in pricing the asset or liability developed based on the best information available in the circumstances. A financial instrument’s level within the fair value hierarchy is based upon the lowest level of any input that is significant to the fair value measurement. Open-end mutual funds are
| abrdn Global Dynamic Dividend Fund | 13 |
Notes to Financial Statements (unaudited) (continued)
April 30, 2023
Summary of Derivative Instruments:
The Fund may use derivatives for various purposes as noted above. The following is a summary of the fair value of derivative instruments, not accounted for as hedging instruments, as of April 30, 2023:
| | Risk Exposure Category |
| | Interest
Rate
Contracts | Foreign
Currency
Contracts | Credit
Contracts | Equity
Contracts | Commodity
Contracts | Other | Total |
| |
| Liabilities: |
| Unrealized depreciation on: |
| Forward Foreign Currency Exchange Contracts | $– | $60,905 | $– | $– | $– | $– | $60,905 |
| Total | $– | $60,905 | $– | $– | $– | $– | $60,905 |
Amounts listed as “–” are $0 or round to $0.
The Fund has transactions that may be subject to enforceable master netting agreements. A reconciliation of the gross amounts on the Statement of Assets and Liabilities as of April 30, 2023 to the net amounts by broker and derivative type, including any collateral received or pledged, is included in the following tables:
| | |
| | | Gross Amounts Not Offset
in the Statement of
Assets and Liabilities | | Gross Amounts Not Offset
in the Statement of
Assets and Liabilities |
| | Gross Amounts
of Assets
Presented in
Statement of
Assets and
Liabilities | Financial
Instruments | Collateral
Received(1) | Net
Amount(2) | Gross Amounts
of Liabilities
Presented in
Statement of
Assets and
Liabilities | Financial
Instruments | Collateral
Pledged(1) | Net
Amount(2) |
| Description | Assets | Liabilities |
| Foreign Currency Exchange Contracts(3) |
| Citibank N.A. | $– | $– | $– | $– | $60,905 | $– | $– | $60,905 |
Amounts listed as “–” are $0 or round to $0.
| (1) | In some instances, the actual collateral received and/or pledged may be more than the amount shown here due to overcollateralization. |
| (2) | Net amounts represent the net receivables/(payable) that would be due from/to the counterparty in the event of default. Exposure from financial derivative instruments can only be netted across transactions governed under the same master netting agreement with the same legal entity. |
| (3) | Includes financial instrument which are not subject to a master netting arrangement across funds, or another similar arrangement. |
| abrdn Global Dynamic Dividend Fund | 17 |
(b) Not applicable.
Item 2. Code of Ethics.
This item is inapplicable to semi-annual report on Form N-CSR.
Item 3. Audit Committee Financial Expert.
This item is inapplicable to semi-annual report on Form N-CSR.
Item 4. Principal Accountant Fees and Services.
This item is inapplicable to semi-annual report on Form N-CSR.
Item 5. Audit Committee of Listed Registrants.
This item is inapplicable to semi-annual report on Form N-CSR.
Item 6. Schedule of Investments.
(a) Schedule of Investments in securities of unaffiliated issuers as of close of the reporting period is included as part of the Report to Shareholders filed under Item 1 of this Form N-CSR.
(b) Not applicable.
Item 7. Disclosure of Proxy Voting Policies and Procedures for Closed-End Management Investment Companies.
This item is inapplicable to semi-annual report on Form N-CSR.
Item 8. Portfolio Managers of Closed-End Management Investment Companies.
(a) Not applicable to semi-annual report on Form N-CSR.
(b) There has been no change, as of the date of this filing, in any of the portfolio managers identified in response to paragraph (a)(1) of this Item in the registrant’s most recently filed annual report on Form N-CSR.
Item 9. Purchases of Equity Securities by Closed-End Management Investment Company and Affiliated Purchasers.
No such purchases were made by or on behalf of the Registrant during the period covered by the report.
Item 10. Submission of Matters to a Vote of Security Holders.
During the period ended April 30, 2023, there were no material changes to the procedures by which shareholders may recommend nominees to the Registrant’s Board of Trustees.
Item 11. Controls and Procedures.
| (a) | The Registrant’s principal executive and principal financial officers, or persons performing similar functions, have concluded that the Registrant’s disclosure controls and procedures (as defined in Rule 30a-3(c) under the Investment Company Act of 1940 (the “Act”) (17 CFR 270.30a-3(c))) are effective, as of a date within 90 days of the filing date of the report that includes the disclosure required by this paragraph, based on the evaluation of these controls and procedures required by Rule 30a-3(b) under the Act (17 CFR 270.30a3(b)) and Rule 13a-15(b) or 15d-15(b) under the Securities Exchange Act of 1934, as amended (17 CFR 240.13a-15(b) or 240.15d15(b)). |
| (b) | There were no changes in the Registrant’s internal control over financial reporting (as defined in Rule 30a-3(d) under the Act (17 CFR 270.30a-3(d))) that occurred during the second fiscal quarter of the period covered by this report that has materially affected, or is reasonably likely to materially affect, the Registrant’s internal control over financial reporting. |
Item 12. Disclosure of Securities Lending Activities for Closed-End Management Investment Companies
Not applicable
Item 13. Exhibits.
| (a)(3) | Any written solicitation to purchase securities under Rule 23c-1 under the 1940 Act (17 CFR 270.23c-1) sent or given during the period covered by the report by or on behalf of the registrant to 10 or more persons. Not applicable. |
| (a)(4) | Change in Registrant’s independent public accountant. Not applicable. |
SIGNATURES
Pursuant to the requirements of the Securities Exchange Act of 1934 and the Investment Company Act of 1940, the Registrant has duly caused this report to be signed on its behalf by the undersigned, thereunto duly authorized.
| abrdn Global Dynamic Dividend Fund | |
| | |
| By: | /s/ Christian Pittard | |
| | Christian Pittard, | |
| | Principal Executive Officer of abrdn Global Dynamic Dividend Fund | |
Date: July 10, 2023
Pursuant to the requirements of the Securities Exchange Act of 1934 and the Investment Company Act of 1940, this report has been signed below by the following persons on behalf of the Registrant and in the capacities and on the dates indicated.
| By: | /s/ Christian Pittard | |
| | Christian Pittard, | |
| | Principal Executive Officer of abrdn Global Dynamic Dividend Fund | |
Date: July 10, 2023
| By: | /s/ Sharon Ferrari | |
| | Sharon Ferrari, | |
| | Principal Financial Officer of abrdn Global Dynamic Dividend Fund | |
Date: July 10, 2023