AVALON ADVANCED MATERIALS INC.
NI 43-101 TECHNICAL REPORT
ON THE
PRELIMINARY ECONOMIC ASSESSMENT
FOR THE PRODUCTION OF
PETALITE CONCENTRATE
FROM THE
SEPARATION RAPIDS LITHIUM DEPOSIT
KENORA, ONTARIO
Report Date: September 26, 2018
Effective Date of PEA: August 21, 2018
Effective Date of Updated Mineral Resource Estimates: May 23, 2018
Report By:
Richard M. Gowans, P.Eng.
Christopher Jacobs, CEng, MIMMM
EurIng, Bruce Pilcher, CEng, FIMMM, FAusIMM(CP)
Jane Spooner, P.Geo.
Steven R. Aiken, P.Eng.
Kevin E. Hawton, P.Eng.
William Mercer, PhD, P.Geo
900 – 390 BAY STREET, TORONTO ONTARIO, CANADA M5H 2Y2
Telephone +1 416 362 5135 Fax +1 416 362 5763

Table of Contents
i
ii
iii
iv
v
vi
vii
viii
List of Tables
ix
x
xi
xii
xiii
List of Figures
xiv
xv
xvi
xvii
1.0 SUMMARY
| 1.1 | INTRODUCTION |
Micon International Limited (Micon) has been retained by Avalon Advanced Materials Inc. (Avalon) to prepare a Technical Report under Canadian National Instrument 43-101 (NI 43-101) which discloses the results of the updated preliminary economic assessment (PEA) for the Separation Rapids Lithium Project.
The objective of this PEA is to demonstrate the economic potential of a revised production schedule which includes sales of three flotation concentrate products (petalite, lepidolite and feldspar) only. This study excludes conversion of petalite to lithium hydroxide for use in the production of Lithium Ion Batteries, although if market demand requires, and subject to financing availability, Avalon could proceed in the future with the development of a lithium hydroxide demonstration plant, followed by a full-scale lithium hydroxide production plant.
The PEA is based on processing 475,000 tonnes of mineralized material per year to produce approximately 1.32 million tonnes (Mt) of petalite, 220,000 t of lepidolite and 1.31 Mt of feldspar over a 20-year total operating life.
Avalon is proposing a phased development program for the Project starting with the development of the mine and a flotation concentrator for petalite and lepidolite production. A feldspar recovery circuit will be added in operating Year 5.
This PEA has been prepared by Micon under the terms of its agreement with Avalon. As discussed in the relevant sections of the report, Micon has prepared a mine plan and schedule and has prepared an economic analysis of the Project. Micon has reviewed the metallurgical testwork and the mineral processing flowsheet, the infrastructure requirements, and the capital and operating cost estimates prepared by Avalon and its retained consultants.
The PEA is based on updated mineral resource estimates for lithium and feldspar contained in the Separation Rapids Lithium Deposit (SRLD), prepared by Avalon dated 23 May, 2018. This updated estimate is considered not materially different from the previous independent one reported in a NI 43-101 Technical Report dated 10 November, 2016.
The Separation Rapids property is located in north-western Ontario, 55 km due north of Kenora and about 79 km by road. It is centred on latitude 50 15’ 30” N, longitude 94 35’ W (UTM coordinates: 388441E 5568996N in NAD 83, Zone 15N15). The property consists of eight mineral claims and one Mining Lease. The claims comprise 153 claim units, totalling 2,448 ha (6,049 acres).
Other than minor and largely funded reclamation requirements under the Advanced Exploration Permit, there are no known environmental liabilities associated with the Separation Rapids property. Avalon holds all necessary permits required to access the Separation Rapids property and to conduct exploration. Exploration permits will be required for additional drilling in the future. There are no known factors or risks that may affect access, title or the right or ability to perform work on the property.
Mining and mineral concentration will take place at the Separation Rapids property. Shipment of concentrates from the site will be by truck. However, a rail loading trans-shipment facility will be required in order to access rail transportation for product shipment and some inbound supplies. This loading site trans-shipment facility is planned to be located on the CNR line in the vicinity of Redditt, Ontario, approximately 55 km by road from the Separation Rapids site.
1
| 1.2 | PHYSIOGRAPHY ANDCLIMATE |
The Separation Rapids area is typical of much of northwestern Ontario and the Canadian Shield. The property is relatively flat with an average elevation of approximately 350 masl. Local topographic relief is limited to 50 m or less with typical Precambrian glaciated terrain. The English River system is proximal to all claim groups. The area is located within the Boreal Hardwood Transition or Mixed Boreal Forest. A Species at Risk Act assessment was completed, and no endangered or at-risk species were identified in the area of the proposed Project. The climate is typical of Canada’s mid-latitudes with long, cold winters and comparatively short spring-summer-fall periods.
The closest centre with significant services is Kenora. Forestry, tourism and mining are the three largest sectors of the Kenora economy. The closest community is Whitedog, home of the Wabaseemoong Independent Nations of One Man Lake, Swan Lake and White Dog. The SRLD is situated in the Traditional Land Use Area of these First Nations as recognized under an agreement signed in 1983 with the Province of Ontario.
| 1.3 | HISTORY |
Rare-element mineralization in the area was first encountered along the English River near Separation Rapids in 1932. The petalite-bearing SRLD and an associated group of rare-metal pegmatites, were discovered by Dr. Fred Breaks of the Ontario Geological Survey (OGS) as a result of a detailed study of rare-metal pegmatites in the region between 1994 and 1996. Avalon acquired its initial interest in the property through an option agreement with local prospectors who had staked the original claims in 1996.
Exploration on the SRLD, by Avalon, in the late-1990s was accompanied by a scoping level metallurgical study by Lakefield Research Limited and a marketing study by Equapolar Resource Consultants which concluded that the petalite mineralization was suitable as an industrial mineral product in thermal shock resistant glass applications. Additional exploration and drilling programs were completed by Avalon in 2017 and 2018.
Since 2014, Avalon has not only investigated market opportunities for petalite in the glass and ceramics industries, it has also developed processes for recovering concentrates of lepidolite and feldspars as well as a process for converting petalite into lithium carbonate and hydroxide.
2
| 1.4 | GEOLOGICALSETTING ANDMINERALIZATION |
The Late Archean SRLD belongs to the petalite sub-type of the complex-type class of rare-metal pegmatites. The SRLD, its parent granite, the Separation Rapids Pluton and associated rare-metal pegmatites, occur within the Archean Separation Lake Metavolcanic Belt (SLMB) which forms the boundary between the English River subprovince to the north and the Winnipeg River subprovince to the south. Both subprovinces are part of the larger Archean Superior Province of the Canadian Shield. Avalon has further subdivided the SRLD into three sub-zones, namely the Separation Rapids Pegmatite (SRP), Western Pegmatite and Eastern Swarm. Based on lithological, mineralogical and textural variations, the SRP itself has been subdivided into five distinct lithological units and subunits, 3a, 3b, 4, 5 and 6.
The Separation Rapids area is underlain predominantly by a mafic metavolcanic sequence (amphibolite or Avalon’s Unit 1), consisting of flows, tuffs, subordinate epiclastic metasediments and rare iron formation horizons and rhyolites. Locally, on the Avalon property itself, the metavolcanic sequence is restricted to amphibolite.
In the SRP, petalite, potassium feldspar and sodium feldspar are major rock-forming minerals, with subordinate amounts of other minerals including spodumene, lithian muscovite, lepidolite, and quartz of which some occur as potentially economically recoverable minerals.
The petalite-bearing Unit 6 is the principal unit of interest within the SRP. Geological mapping and assays for surface and drill core samples show that mineralogy and lithium oxide ( Li2O) grades of the mineralization (average 4.78% Li2O) in the SRP are relatively homogeneous and that the petalite is close to the theoretical (stoichiometric) chemical composition (4.88% Li2O), as well as being very pure, with marked absence of deleterious elements such as iron.
Potassium feldspars in the SRP have been shown to be rubidium-rich, high-purity end-members.
The Li2O content of the micas ranges from very low to over 6%. The highest Li2O values are in the micas found in Subunit 6d. This includes the pink to red mica referred to as lepidolite that is the distinctive identifying feature of Subunit 6d.
| 1.5 | EXPLORATION |
Following the discovery of the SRLD in 1996, Avalon carried out a brief prospecting and sampling program in November, 1996. This was followed by a program of geological mapping, trenching, line-cutting and magnetometry in 1997 and 1998.
3
In the period from 2000 to 2014, little work of a geoscientific nature was carried out at the property. The main activity relating to advancing the Project was process testwork and, consequently, the main activities at site were collection of samples, up to bulk sample size, for mineral product development.
Avalon completed a field program in July and August, 2017, on the Paterson Lake claim group. Lithogeochemical and biogeochemical surveys were undertaken over the claims, in conjunction with prospecting for new lithium pegmatites.
| 1.6 | DRILLING |
Avalon has drilled at the Separation Rapids Lithium Project in a number of campaigns between 1997 and 2018. The total number of diamond drill holes is 80 for a cumulative total of 13,192 m.
Three of these holes were drilled during April and May, 2001 for the purposes of a geotechnical investigation of the rock at the proposed open pit mine and to determine preliminary pit slope design parameters. The potential for water inflow into the open pit was also evaluated.
| 1.7 | SAMPLEPREPARATION, ANALYSES ANDSECURITY |
Surface samples taken in the 1990s were shipped to Chemex Labs Ltd. in Thunder Bay, Ontario for preparation then to Chemex’s laboratories in Mississauga, Ontario and Vancouver, British Columbia for subsequent assaying for lithium and a range of other elements. Drill core was logged and split with half of the core being sent for assay and the other half being stored in core boxes on site. Core sample intervals were varied, depending on lithology, to a maximum of 3 m. Split core samples were shipped to XRAL where they were assayed for lithium, rubidium using ICP and AA for rubidium and cesium.
In 2016, Avalon resampled drill core from the 1990s’ programs. The objective was to re-assay the core with modern methods and inserted lithium rock standards for comparison to the historic data.
In both the 2017 and 2018 diamond drill programs, all lithium bearing pegmatites (Unit 6) and representative non-mineralized pegmatite intercepts were sampled on continuous 2 m intervals, with shorter intervals where constrained by geologic contacts and amphibolite host rock. Samples were transported in sealed bags to the ALS preparation laboratory in Thunder Bay then pulps, including standards and blanks, were shipped to ALS in Vancouver for analysis.
The drill database contains 185 specific gravity (SG) values for various lithologies on the SRLD. Based on these measurements, the average SG for pegmatite and amphibolite (waste) was 2.62 and 3.04, respectively. The SG measurements showed low variability.
4
| 1.8 | DATAVERIFICATION |
The mineral resource estimation is based on the original drilling by Avalon in 1997 to 2001 as well as the additional 2017 and 2018 drill program results. The 2018 assay database has been updated using the one created by Micon in 1999 as a basis. There were certain quality assurance/quality control (QA/QC) procedures applied and reported on at the time of creation of the database that included check assays at a second laboratory and independent assaying by Micon.
Subsequently, Avalon completed further verification of the drill data including cross-checking the database against original field records such as drill logs, cross-checking the assays against laboratory assay certificates and re-assaying drill core splits with internally-inserted, certified lithium standards.
The assay laboratory comparison (XRAL and Chemex) undertaken in the 1990s using duplicate coarse rejects from drill core gave similar results. Despite some small differences, both the lithium and rubidium analyses from XRAL and Chemex were close and showed similar trends with high R2 values for the correlation. This indicated high and acceptable reliability in the analyses.
For the purpose of this PEA, Avalon verified the drill hole database against historic data records such as drill logs, assay certificates, and other original sources of data in order to ensure that there were no errors present database used for resource estimation. Drill hole angle, direction and the maximum hole depth were also verified.
| 1.8.1 | Certified Standard |
Avalon prepared a certified rock lithium analysis standard by shipping 16 kg of SRP to CDN Resource Laboratories Ltd. (CDN) in Langley, British Columbia. A Round Robin analysis procedure was then completed with five samples of the material being shipped to each of six laboratories for lithium analysis, with associated analytical methods performed. It was concluded that the lithium standard was a suitable standard for QA/QC of Separation Rapids drill core samples. The certified value for the standard SR2016 is 1.48% Li2O with a standard deviation of 0.03% Li2O.
In 2016, Avalon completed a program of re-assaying a limited amount of drill core with the insertion of the certified lithium standard. Comparing the 2016 re-assays for Li2O of 42 samples with the 1990’s results showed a small positive bias for the 2016 samples at smaller Li2O concentrations and identical mean values for each laboratory. These results confirmed the historic data.
| 1.9 | MINERALPROCESSING ANDMETALLURGICALTESTING |
A number of phases of metallurgical testing since 1997 have been completed by Avalon using samples obtained from of the SRLD. The work prior to 2014 was mainly undertaken by SGS Mineral Services at Lakefield, Ontario (SGS-L). This work not only included the recovery of petalite, but also a number of other mineral products which also can be found in the lithium bearing pegmatite.
5
The work since 2014 was mainly undertaken by Dorfner Analysenzentrum und Anlagenplanungsgesellschaft mbH (ANZAPLAN), a German company that specializes in the processing of high purity industrial and strategic minerals. This work focussed on the recovery of a petalite flotation concentrate and the subsequent processing of this concentrate to produce a high-quality lithium hydroxide product suitable for the lithium battery industry.
The lepidolite, petalite and feldspar recovery processes utilized for this PEA were developed and tested by ANZAPLAN. Approximately 20 testwork programs were undertaken by ANZAPLAN between 2014 and 2018, including the production of 1 t of petalite concentrate in a pilot program conducted in 2016. ANZAPLAN also developed the process to recover a mixed Na/K-feldspar product and completed preliminary testwork on this material which indicated the suitability of this product in not only the ceramics industry but also as filler in paint, fibreglass and other products.
Using the results generated by this testwork, Avalon is able to demonstrate the following:
| • | Optical sorting can be used to remove amphibolite host rock material ahead of the flotation process. | |
| • | A petalite concentrate assaying over 4% Li2O can be produced which, because of its low impurity levels, is potentially an excellent feed material to the specialized glass/ceramics industries. In addition, a high grade 4.5% Li2O petalite concentrate can also be produced (with low sodium and potassium levels). | |
| • | Lepidolite concentrates containing approximately 4.5% Li2O can be produced. | |
| • | A low impurity mixed (sodium/potassium) feldspar concentrate can also be produced which has applications in a number of ceramic applications as well as a filler in paints and other products. | |
| • | There is potential to produce other by-products from the mineralized material, including a high purity quartz, and for additional lithium recovery from micas contained in the magnetic fraction. |
| 1.10 | MINERALRESOURCEESTIMATE |
Lithium, rubidium, tantalum, cesium and feldspar mineral resource estimates for the Separation Rapids Lithium Project have been prepared by Avalon under the supervision of Dr. William Mercer, P.Geo. (ON), Vice President, Exploration of Avalon, who is the Qualified Person (QP) for the estimates. This updated mineral resource estimate is based on the eight diamond drill holes drilled by Avalon in 2017 and 2018, in combination with the data from the 1997 to 2001 drill holes, which were used in previous resource estimates.
6
The Separation Rapids Lithium Project overall Measured plus Indicated mineral resource is estimated to be 8.41 Mt at a grade of 1.41% Li2O, using a 0.6% Li2O cut-off grade, as summarized in Table 1.1. The Inferred mineral resource is 1.79 Mt at a grade of 1.35% Li2O. The total feldspar content of the mineralized zone is estimated at 43%. The two main mineralogical zones in the deposit, the petalite zone (6a, b, c) and the lepidolite + petalite zone (6d) have been estimated separately and contain combined Measured and Indicated resources of 6.42 Mt grading 1.41% Li2O and 1.99 Mt grading 1.41% Li2O, respectively (Table 1.1) . This mineral resource estimate was presented in an Avalon news release on May 23, 2018 and is deemed not to be materially different from the previous estimate dated October, 2016.
Table 1.1
Separation Rapids, Mineral Resource Estimate at 0.6%Li2O Cut-off Grade
(As at 23 May, 2018)
| Class | Rock unit | Tonnes (Mt) | % Li2O | % Ta2O5 | % Cs2O | % Rb2O | Wt. % feldspar |
| Measured | 6a,b,c | 2.425 | 1.440 | 0.005 | 0.010 | 0.322 | 44 |
| 6d | 0.939 | 1.410 | 0.008 | 0.027 | 0.473 | 40 | |
| Total | 3.364 | 1.431 | 0.006 | 0.015 | 0.365 | 43 | |
| Indicated | 6a,b,c | 3.992 | 1.391 | 0.006 | 0.012 | 0.338 | 44 |
| 6d | 1.049 | 1.402 | 0.009 | 0.025 | 0.469 | 40 | |
| Total | 5.041 | 1.393 | 0.007 | 0.014 | 0.366 | 43 | |
| Measured +Indicated | 6a,b,c | 6.416 | 1.409 | 0.006 | 0.011 | 0.332 | 44 |
| 6d | 1.989 | 1.406 | 0.009 | 0.026 | 0.471 | 40 | |
| Total | 8.405 | 1.408 | 0.007 | 0.015 | 0.365 | 43 | |
Inferred | 6a,b,c | 1.308 | 1.351 | 0.007 | 0.017 | 0.342 | 44 |
| 6d | 0.483 | 1.346 | 0.008 | 0.020 | 0.427 | 40 | |
| Total | 1.791 | 1.349 | 0.007 | 0.018 | 0.365 | 43 |
Notes:
| 1. | This resource estimate is valid as of May 23, 2018. | |
| 2. | CIM definitions were followed for Mineral Resources. | |
| 3. | The Qualified Person for this Mineral Resource estimate is William Mercer, PhD, P.Geo. (ON). | |
| 4. | The resource estimate is based on Avalon’s drilling of 74 previous holes totalling 11,644 m drilled between 1997 and 2017 and a further four holes totalling 1,282 m in 2018. | |
| 5. | Drill data was organised in Maxwell DataShed™ and for estimation purposes was transferred to the Geovia GEMS 6.8 Software, wherein the block model was developed. | |
| 6. | The geological units were modeled as outlined by drill core logs. | |
| 7. | Resources were estimated by interpolating composites within a block model of 10 x 10 x 3 m blocks oriented along the deposit strike. | |
| 8. | Grade interpolation used the Ordinary Kriging method combined with variograms and search ellipses modeled for each rock unit. For PZ unit, search ellipses of 50 x 35 x 15 m and 175 x 125 x 45 m were used for Passes 1 and 2, respectively. For LPZ unit, search ellipses of 35 x 25 x 8, 75 x 50 x 15 and 115 x 75 x 25 were used for Passes 1, 2 and 3, respectively. | |
| 9. | Measured material was defined as blocks interpolated using Passes 1 and 2, using composites from ≥ 4 drill holes and a distance ≤ 25 m to the nearest composite and additional blocks with excellent geological and grade continuity. Indicated material includes blocks interpolated with Pass 1 and 2 search ellipses, using ≥ 3 drill holes and a distance ≤ 35 m to the nearest composite and blocks with geological and grade continuity. Inferred material was defined as blocks interpolated with all Passes, composites from ≥ 2 drill holes and interpolated geological continuity up to 40 m below diamond drill holes. | |
| 10. | Two-metre composites were used, and no capping was necessary. | |
| 11. | The mean density of 2.65 t/m3was used for unit 6a,b,c and 2.62 t/m3for unit 6d. |
7
| 12. | The cut-off grade reported in this resource estimate, 0.6% Li2O, is consistent with the previously published resource estimates by Avalon (Preliminary Economic Assessment, 2016; November 15, 2017 resource estimate). | |
| 13. | The total feldspar contents were estimated utilizing QEMSCAN®analysis of 38 drill core intervals distributed throughout the deposit. | |
| 14. | Mineral resources do not have demonstrated economic viability and their value may be materially affected by environmental, permitting, legal, title, socio-political, marketing, or other issues. |
The primary lithium-bearing minerals, petalite and lepidolite, are found within the ~600 m by ~80 m SRP. Surface mapping and results from 80 diamond drill holes were used to create a 3D model of the host lithology which was used to constrain the interpolation of assays. The Project database is maintained in Maxwell DataShed™ software and the resource estimation utilized GEMS 6.8.1.
The Project database contains 80 diamond drill holes over a total length of 13,192 m drilled between 1997 and 2018 by Avalon. Assay values for Li2O, Rb2O, Cs2O and Ta2O5 were recorded for 3,243 mineralized samples and 148 country rock samples which were studied for environmental impact assessment purposes.
| 1.11 | MININGMETHODS |
| 1.11.1 | Pit Optimization |
Pit optimization was undertaken using the mineral resource block model imported into Surpac™ to create a block model compatible with the pit optimization software. A preliminary optimization was performed using Whittle™ software. Cost parameters were applied to the optimization model to assess the volume of mineral resources available for economic development. The purpose of the modelling was to generate an estimate of the mineable tonnage based on the mineral resources.
The pit optimization indicated that the economic cut-off grade was approximately 1.20% Li2O and the optimization run suggested a life of mine (LOM) plant feed tonnage of approximately 8.6 Mt at a grade of 1.39% Li2O.
| 1.11.2 | Pit Design, Development and Schedule |
A conceptual pit design was conducted from the bottom up using PEA design parameters and the selected optimum pit shell as a template. Figure 1.1 shows a plan and view of the pit design.
8
Figure 1.1
Plan View of the Pit Design
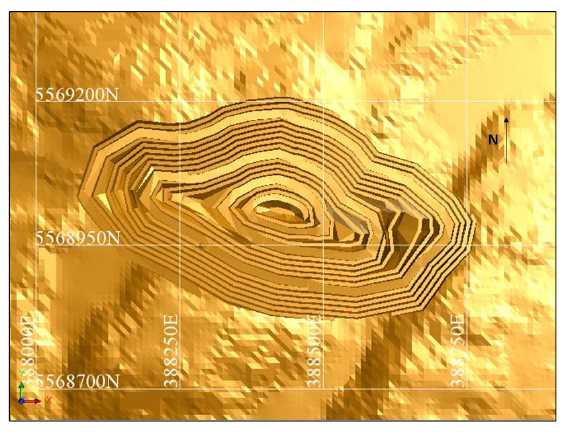
The proposed method of mining is by conventional open pit methods using drilling and blasting, loading with excavators and shovels and hauling with rigid dump trucks. Waste from the pit will initially be composed of overburden and will be dumped in the topsoil stockpile. As the pit is developed harder waste rock will be excavated and will be stored on separate waste dumps.
The Project will be undertaken by contractor-operated equipment and labour. Preproduction waste rock will be used to construct site roads, including the main haul roads and will also be used for the construction of tailing, concentrate and settling basin dam walls.
A conceptual production schedule has been produced using MineSched™ software. The production schedule is based on mining 475,000 t/y of petalite and lepidolite mineralized material. The life of the mine is expected to be 19 years with approximately 6.2 Mt of petalite material at 1.39% Li2O and 2.4 Mt of lepidolite mineralization at 1.41% Li2O mined over the length of the Project.
9
| 1.12 | RECOVERYMETHODS |
The Separation Rapids Lithium Project PEA mineral recovery flowsheet is based on the process testwork completed to-date. The process selected for the PEA comprises the mineral separation and recovery of a lepidolite concentrate, a petalite concentrate (both containing between 4.0% and 4.50% Li2O), and thirdly, a mixed Na/K-feldspar industrial mineral product.
This PEA is based on the processing of 475,000 t/y of mineralized material over a 19-year mine life to produce approximately 220,000 t of lepidolite concentrate, 1.32 Mt of petalite and 1.34 Mt of feldspar. The lepidolite is to be sold into the lithium chemicals industry to customers in Canada and Asia, while the petalite will be sold to customers in the glass/ceramics industries in Europe, Asia and North America. The feldspar will be sold to customers for a range of applications in North America and Europe.
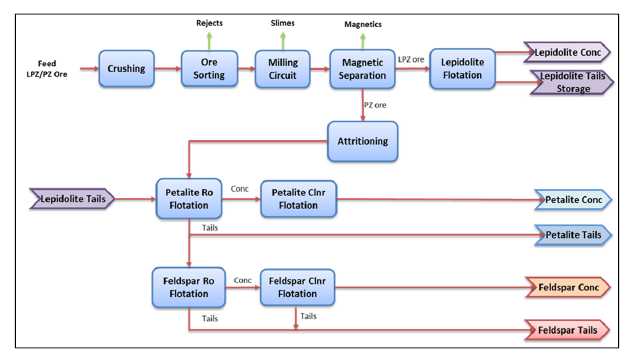
A single milling and flotation circuit is provided for processing both lepidolite/petalite (LPZ) mineralization and petalite (PZ) material on a campaign basis. Tailings from the flotation of lepidolite ore will be stockpiled for future re-processing to recover petalite. Some of the final tailings from the petalite ore flotation process will feed a second, dedicated feldspar flotation circuit with the balance of the petalite tailings reporting to the tailings management facility (TMF).
A simplified block flow diagram showing the main process steps within the overall Separation Rapids flowsheet is presented in Figure 1.2.
10
Figure 1.2
Simplified Process Block Flow Diagram
| 1.12.1 | Process Design Criteria |
The process plant design, PEA report and financial evaluation are based on the following process design criteria that have been derived from the testwork results:
| • | Optical sorting mass waste rejection is 1.8% with lithium losses of also 1.8%. | |
| • | For petalite PZ mineralization, the mass pull to slimes after comminution and attritioning is 7.9% of mill feed with an 8.6% lithium loss. For the lepidolite LPZ mineralization, mass and lithium losses are 8.4% and 6.5% respectively. | |
| • | Mass pull to magnetics (petalite PZ only) is 13% of sorted mineralized material tonnage with lithium losses of 13.8%. | |
| • | The lepidolite concentrates contains 4.5% Li2O% while 50% of the petalite concentrate will be 4.5% (with low sodium and potassium levels) and the balance being 4.0% for an average life of mine grade of 4.25% Li2O. | |
| • | Lithium recovery to lepidolite concentrate (LPZ) is 78%. Lithium recovery to petalite concentrate from lepidolite tailings is 70%. | |
| • | Lithium recovery to petalite concentrate (PZ) is 65.2% of flotation feed content. | |
| • | Mass pull to feldspar concentrate is 82.9% of feldspar flotation feed. | |
| • | Plant availabilities of 90% for the flotation plant although the crushing plant has been suitably sized to run on a single 12-hour shift per day. |
11
| 1.13 | PROJECTINFRASTRUCTURE |
The property is readily accessible with a total road distance from Kenora to the site of 79 km. However, development of the project will require upgrading of the 9.5 km long Avalon Road to accommodate the mining, concentrate removal and consumable delivery trucks.
The flotation concentrator will be located at the mine site with the various concentrates (petalite, lepidolite and feldspar) being dried, bagged and trucked to an existing CN rail siding at Redditt for shipping to customers.
The site is predominately bedrock exposure with a minimum of top soil or organic cover. The site buildings are anticipated to include crusher and concentrator buildings, change room and ablution facilities, office and laboratory, electrical MMCs, maintenance building and warehouse.
Fresh water and fire water for the site will be provided from the English River. Water treatment facilities will be provided as required to supply potable water to the site.
Approximately 10 MW of (operating) power will be required during operations and this will be supplied from the existing 115 kV system running from Caribou Falls to Whitedog Falls. A stepdown transformer will be installed at the connection point to the 115-kV line and approximately 25 km of transmission line will be installed to bring the power to the mine site.
Diesel fuel storage facilities will be provided to supply the mine equipment and smaller site vehicles. A propane tank farm will also be installed to accommodate the site heating and fuel for the concentrate driers.
| 1.14 | MARKETSTUDIES ANDCONTRACTS |
This PEA is based on the recovery of lepidolite, petalite and mixed sodium/feldspar (Na/K) feldspar concentrates at the following approximate annual rates:
| • | Lepidolite | 11,800 t/y | |
| • | Petalite | 73,000 t/y | |
| • | Na/K feldspar | 100,000 t/y |
It is anticipated that the lepidolite concentrate will be sold to a new lithium carbonate producer in Canada or possibly China, while the petalite will be sold to customers in the glass and ceramics industries in North America, Europe and Asia. The feldspar concentrate will be sold for applications in glass, ceramics, frits and glazes and fillers in North America and Europe.
At this stage of development of the Separation Rapids property, there are no material contracts in place. However, in February, 2017, Avalon entered into a non-binding letter of intent with Lepidico Ltd. (Lepidico) for the supply of up to 15,000 t/y of lepidolite concentrate for its demonstration plant planned for Sudbury, ON.
12
| 1.15 | ENVIRONMENTALSTUDIES, PERMITTING ANDSOCIAL ORCOMMUNITYIMPACT |
The Project site lies in an area adjacent to the English River, a regionally significant waterbody which supports a variety of wildlife and fisheries as well as tourism. The area surrounding the mine site is undeveloped and forested.
| 1.15.1 | Project Approvals and Permitting |
A Project Description and comprehensive Environmental Baseline Report of the mine and concentrator site was completed in March, 2007, updated from the July, 1999 draft. The 2007 report included a preliminary environmental impact assessment and, although this was based on a different project development model to that presently envisaged, it is expected that the vast majority of this study work is still valid.
Avalon has an Advanced Exploration Approval based on an approved closure plan, though it is presently in a state of inactivity and is permitted for 15,000 t of material. Exploration permits for additional drilling on site were acquired for drill programs in 2016 and 2017. There programs were successfully completed without any environmental impacts. The present permit allows for nearby future expanded nearby areas of exploration on recently acquired claims.
Due to the relatively small scale of the Project and the site being located well away from any federally protected areas, and because the capacity of the mine and concentrator are approximately half the tonnage triggers in the Federal Environmental Assessment Act 2012, permitting under this act does not apply. As such, permitting time lines are significantly reduced.
| 1.15.2 | Environmental Baseline |
For the mine and concentrator site, an environmental baseline study program has been conducted, investigating regional and site-specific aspects such as water quality, hydrology, vegetation, wildlife, fisheries, archaeology, and socioeconomics. Plans are in place to further update or validate this information in the next project phase, in consultation with all communities of interest.
| 1.15.3 | Closure and Rehabilitation |
For mines located on previously undisturbed sites, ecological restoration is a fundamental component of site reclamation. The main aspects of the closure and reclamation plans for the Project include:
| • | Flooding of the open pit following the cessation of mining, primarily through inflows of groundwater and surface water runoff. |
13
| • | Closure and rehabilitation of the TMF in a safe and secure manner in full accordance with government regulations and good engineering practice. | |
| • | Progressive rehabilitation of benches of the coarse rock aggregate storage areas, particularly on the river view sides. | |
| • | Breaching and revegetation of all sediment basins associated with the TMF and the mine rock aggregate stockpiles. | |
| • | Removal for reuse, salvage or disposal of all machinery and equipment from the crusher, process plant and other ancillary facilities. | |
| • | Responsible removal or demolishing of all buildings and site infrastructure. | |
| • | Maintain the mine access road during the closure and post-closure monitoring period to provide access to the site. Following completion of post-closure monitoring, the road will be scarified and re-vegetated, and culverts removed. |
A 5-year post-closure monitoring program will follow closure of the mine that includes maintenance of the revegetated areas.
| 1.15.4 | Community and Indigenous Peoples Engagement |
Consultation with local First Nations Bands and the public was initiated during the 1999 baseline study. This continued in a reduced manner during the period of inactivity but was again ramped up in 2013. A memorandum of understanding initially signed with the Wabaseemoong Independent Nation (WIN) in 1999 was renewed in 2013.
Avalon maintains an engagement log which records the numerous meetings held and summaries of the meeting content, and reports this annually in its Sustainability Report.
An archaeological study was completed in 1998. This will be reviewed with the communities of interest and updated, if required. There may be a requirement to complete additional traditional knowledge studies in the next phase of project development. A socioeconomic assessment of the Project is included in the 2007 environmental study. This will be updated in the next phase of the Project.
Avalon has a full time representative in Kenora who facilitates ongoing engagement with Indigenous Peoples, communities, regulators and politicians and that contributes to the strong support for the Project.
| 1.16 | CAPITAL ANDOPERATINGCOSTS |
| 1.16.1 | Capital Costs |
The basis for the PEA capital cost estimate is a processing facility and related infrastructure with a nominal throughput rate of 475,000 t/y of mineralized material, comprising either petalite mineralized material (PZ) or lepidolite mineralized material (LPZ).
14
Initial capex requirements are summarized in Table 1.2. All costs are reported as Canadian dollars (CAD). It should be noted that, apart from the feldspar flotation plant in Years 5 and 6, provisions for what might normally be designated as “sustaining capital” are included in the operating costs.
The Project is at a green fields location and so will require construction of new tailings and waste rock storage facilities as well as an up-grade to an existing access road and the installation of an electrical power supply line.
The capex for the open-pit mine is assumed to be zero as the operation will engage a contract miner and all mining capex will be built into the contract mining operating costs.
The concept of having most of the plant pre-assembled off-site and delivered in modules (fully or partly assembled) has been assumed for much of the equipment (particularly the flotation plant) and facilities in order to reduce on-site construction activities.
Table 1.2
Initial Capital Cost Estimate
| Capex CAD x 1,000 | ||
| Area | Initial Plant | Feldspar Flotation (Years 5/6) |
| Pre-construction | 500 | 0 |
| Mining | 0 | 0 |
| Concentrator | 39,696 | 8,450 |
| Tailings Disposal | 6,519 | 0 |
| Infrastructure | 5,750 | 0 |
| Total Direct Costs | 51,965 | 8,450 |
| EPCM | 3,204 | 845 |
| Freight & Transportation | 1,398 | 327 |
| Other Indirects | 5,076 | 1,199 |
| Total Indirect Costs | 9,677 | 2,371 |
| Owners Costs | 2,000 | 500 |
| Buildings | 1,000 | 250 |
| Contingency | 12,528 | 2,164 |
| Total Capital Costs | 77,671 | 13,735 |
| 1.17 | OPERATINGCOSTS |
Operating costs have been determined by Avalon and reviewed by Micon and are expressed in Canadian dollars. A summary of the estimated LOM average annual operating costs is presented in Table 1.3.
15
Table 1.3
Summary of Operating Costs
| Category | Ave. Annual Costs (CAD’000) | CAD/t Milled |
| Petalite and Lepidolite | ||
| Mining and Reclaim | 18,181 | 40.0 |
| Concentrate Production and Shipping | 35,826 | 78.8 |
| General and Administration | 1,830 | 4.0 |
| Total Production Costs CAD | 55,837 | 122.8 |
| Total Production Cost USD | 42,951 | 94.4 |
| Feldspar Production and Trucking | ||
| CAD | 9,707 | 87.7 |
| USD | 7,467 | 67.5 |
| 1.18 | ECONOMICANALYSIS |
Micon has prepared this assessment of the Project on the basis of a discounted cash flow model, from which Net Present Value (NPV), Internal Rate of Return (IRR), payback and other measures of project viability can be determined. Assessments of NPV are generally accepted within the mining industry as representing the economic value of a project after allowing for the cost of capital invested.
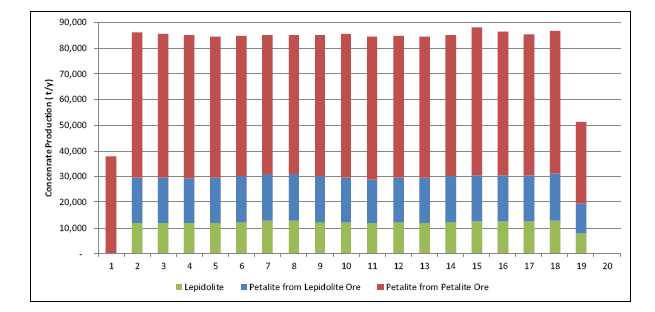
Figure 1.3 shows the annual tonnages of petalite and lepidolite produced during operations.
Figure 1.3
Annual Petalite/Lepidolite Production Schedule (tonnes)
Annual production of feldspar concentrates and intended markets are presented in Figure 1.4.
16
Figure 1.4
Annual Feldspar Production Schedule
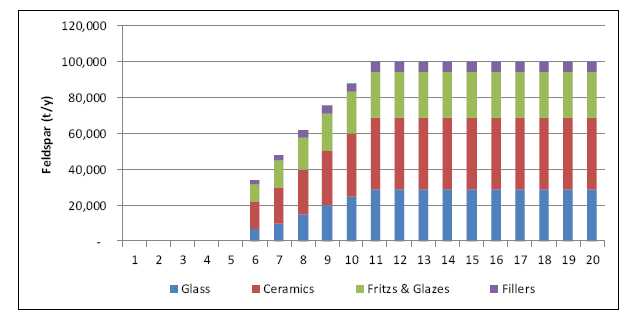
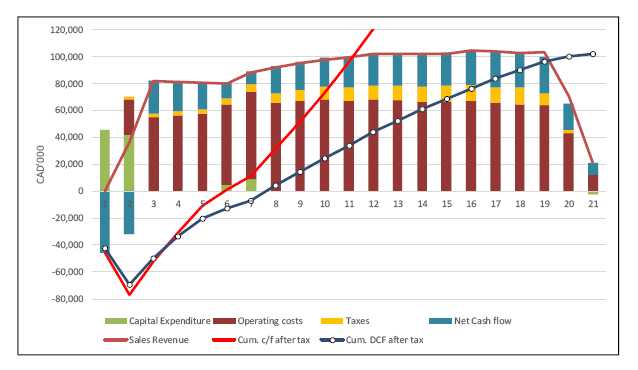
Figure 1.5 presents a summary of the Project cash flow while the key project economic indicators and performance are summarized in Table 1.4.
Figure 1.5
Net Annual Cash Flow (After Tax)
17
Table 1.4
Key Project Indicators
| Item | Units | LOM |
| Mine Production | ||
| Plant feed (Pre Sorter) | t | 8,567,928 |
| Waste | t | 52,344,381 |
| Total Mined | t | 60,912,309 |
| Processing | ||
| Mill Feed | t | 8,413,705 |
| Lepidolite Concentrate Grade | % Li2O | 4.50% |
| Lepidolite Concentrate Sold | t | 218,529 |
| Petalite Concentrate Grade | %Li2O | 4.25% |
| Petalite Concentrate Sold | t | 1,322,849 |
| Feldspar Concentrate Sold | t | 1,307,500 |
| Exchange Rate | CAD/USD | 1.30 |
| Total Sales Revenue | CAD'000 | 1,745,717 |
| Operating Costs | CAD/t milled | CAD'000 |
| Lithium Concentrate Production | 122.77 | 1,032,979 |
| Feldspar Production | 16.79 | 141,236 |
| Total Operating Costs | 139.56 | 1,174,215 |
| Capital Costs | CAD'000 | |
| Construction - Initial Capital | 77,671 | |
| Feldspar Plant (Yrs 5&6) | 13,735 | |
| Total Capital Expenditure | CAD'000 | 91,406 |
| Working Capital | 10,000 | |
| Site Closure | 7,500 | |
| Pre-tax | After Tax | |
| Net Cash Flow (CAD’000) | 472,595 | 327,758 |
| Net Present Value (at 8% disc. rate) | 155,562 | 102,191 |
| Internal Rate of Return (IRR) | 27.1 | 22.7 |
| Payback Period (after tax, undisc.) | Years | 4.4 |
Sensitivity analyses on product prices, recoveries, capital costs and operating costs suggest that the Project is most sensitive to revenue drivers, namely price and recovery which are essentially identical. At a discount rate of 8%, the Project NPV is negative when all product prices are reduced by 20%. The Project is also quite sensitive to changes in operating cost while sensitivity to capex is relatively low. Project NPV remains positive for adverse changes of up to 20% in either capital or operating costs.
18
| 1.19 | ADJACENTPROPERTIES |
Although the SRLD is reported to be the largest rare metal pegmatite of the petalite sub-type discovered in Ontario, there are a large number of other rare metal pegmatite occurrences within a few kilometres of the Separation Rapids property. The principal occurrences are the Big Mack Pegmatite, the Southwestern Pegmatite Subgroup which includes the SRLD, Great White North and the Swamp pegmatites, and the Eastern Pegmatite Subgroup which includes Marko’s Pegmatite, Lou’s Pegmatite and others.
| 1.20 | INTERPRETATION ANDCONCLUSIONS |
The PEA suggests that the Separation Rapids Project can be developed as an economically viable supplier of the lithium minerals petalite and lepidolite into the ceramics and lithium chemical industries for almost 20 years. Production of a third, feldspar concentrate further enhances the Project economics by supplying product into various industrial mineral markets.
The initial capital estimate for the Project is CAD77.7 million with a further CAD10 million required for initial working capital. The addition of the feldspar recovery circuit in Years 5/6 (or potentially sooner if funding is available) requires an additional CAD13.7 million.
Capital costs have been reduced by treating the 2 different types of lithium mineralization on a campaign basis rather than having 2 parallel processing plants.
The Project is relatively small and low in capex for a mining project, but the economic performance estimated by this report indicates a post-tax IRR of 22.7% and an NPV of CAD102 million. A sensitivity analysis suggests that the Project is most sensitive to revenue drivers, namely price and recovery (identical), and also quite sensitive to changes in operating cost while sensitivity to capex is relatively low.
The Project will provide over 70 full time employment opportunities, as well as a number of additional opportunities for local industries to grow through the provision of support services.
Consideration has been given in the design to the number and nature of the chemicals used in the flotation process and how best to minimise their consumption through recovery and recycling, as well as via water treatment to remove dissolved metals.
The site layout takes into account the various waste streams produced by the processes with all being relatively inert and free from toxic materials and sulphides. Flotation tailings are filtered and washed before being dry-stacked so as not to present a source of future ground and run-off water contamination.
Market demand for the lithium mineral products is increasing as more and more lithium is required for the expanding battery and energy storage industries and this is resulting in a squeeze on supply into the ceramics industry. In addition to a non-binding letter of intent for the lepidolite concentrate from a Canadian based customer, Avalon has identified a number of potential markets for the feldspar and is also in discussions with four potential major petalite customers.
19
The Project enjoys strong support from the community as well as from local politicians, First Nations and environmental NGOs. Avalon is also in discussions with a number of local businesses towards collaboration on future opportunities including contractor mining, power supply, local fabrication and product transportation.
The start of operations is not anticipated to be subject to approvals under the Canadian Environmental Assessment Act 2012 (CEAA) as the mine does not exceed any of the CEAA triggers including mine and mill tonnages. The Project will not have any new impacts to fish or fish habitat, nor will it impact on any Federal Wildlife Areas or Migratory Bird Sanctuaries. Final Permitting and Approval for the Project is therefore expected to be relatively short and simple.
| 1.21 | RECOMMENDATIONS |
The preliminary economic assessment presents a potentially viable project and the opportunity to generate significant revenue for Avalon. It is recommended therefore that the Project continues to the next stage of development, which is the completion of a full Feasibility Study (FS).
| 1.21.1 | Recommendations for the Next Phase of Project Development |
The next step in developing the Project is the completion of a full economic and technical FS in order to confirm these initial findings and to help source the necessary capital required for project implementation.
In order to maintain the proposed production levels and mine life, additional measured and indicated resources are required for an FS. It is probable that this requirement can largely be achieved by up-grading the inferred material through further, in-fill drilling and by mining deeper. Additional exploration drilling is also recommended in order to evaluate the potential for further, new near surface material in order to potentially reduce waste quantities and reduce mining costs.
The FS will require a more detailed mine plan and mining contract proposal based upon the revised mineral resource resulting from the above recommended work. A trade-off study for open pit vs. underground mining should also be conducted to determine if underground mining can be made economically viable and at what depth.
Further “mini-pilot” flotation work is recommended to confirm petalite recovery figures from the lepidolite mineralization and to better define the composition of the feldspar product from this material.
20
Additional reagent recovery and water treatment investigations are also proposed in order to maximise recycling potential and to confirm the quality of the recycled water.
The modular, pre-assembled/containerized package concept assumed in the PEA should be carried forward into the FS although a trade-off study may be warranted just to confirm and quantify the economic benefits of such an approach.
The validation and update of the 2007 baseline data is required and anticipated to be completed in the near future. Additional drilling to further develop and finalize the site hydrology and groundwater management plan is needed. Based on the results of the ongoing humidity cell and other test work on the anticipated waste materials and the plant and site water balance, a final design of the water management facilities is required. In consultation with regulators and other stakeholders, limited ongoing monitoring for surface and groundwater quality and quantity is recommended.
Based on the above and this PEA, a Certified Closure Plan is required for submission to the Ontario Ministry of Energy, Northern Development and Mines (MNDM).
In order to expedite the permitting process, the recommended trade off study and feasibility level design for the TMF containment structures should be initiated for the Environmental Compliance Approval (ECA) permit applications for these structures. The route for the power line must be finalized and obtaining all required information for permitting should be initiated in consultation with Ministry Natural Resources and Forestry (MNRF). Similarly, detailed engineering for the air and water emissions equipment are required to initiate the Provincial Ministry of Environment, Conservation and Parks (MECP) air and water ECAs.
| 1.21.2 | Budget |
The budget prepared by Avalon for the next phase of the Project development for the Separation Rapids Project is presented in Table 1.5 below.
Table 1.5
Budget for the Next Phase of the Project
| Expense | Amount (CAD’000) |
| Drilling | |
| Geotech & Hydrology | 450 |
| Testwork | |
| Process | 350 |
| Water Treatment | 50 |
| Engineering | |
| Mine Design | 75 |
| Process Plant & Site | 175 |
| Studies | |
| Power Supply | 50 |
| Market Studies | 30 |
| Hydrology | 175 |
21
| Expense | Amount (CAD’000) |
| Tailings & Waste Rock | 120 |
| Environmental Permitting | 140 |
| Final Report Compilation | 75 |
| Avalon Expenses | 30 |
| Total | 1,720 |
Micon concurs with the proposed work program budget and recommends that it be implemented.
22
2.0 INTRODUCTION
Micon International Limited (Micon) has been retained by Avalon Advanced Materials Inc. (Avalon) to prepare a Technical Report under Canadian National Instrument (NI) 43-101, which discloses the results of an updated preliminary economic assessment (PEA) for the Separation Rapids Lithium Project, located 70 km north of Kenora, Ontario.
The deposit was originally evaluated in 1999-2000 as a potential source of the lithium mineral, petalite, for glass-ceramics applications. Recent work by Avalon has looked at other minerals within the deposit as well as petalite, most notably lepidolite and feldspar, and developed processes for producing marketable concentrates for all three products.
The objective of this PEA is to demonstrate the economic potential of a revised production schedule which includes sales of all three flotation concentrate products (petalite, lepidolite and feldspar) only. This study excludes conversion of petalite to lithium hydroxide for use in the production of Lithium Ion Batteries. The PEA is based on processing 475,000 tonnes of mineralized material per year to produce approximately 1.3 million tonnes (Mt) of petalite, 220,000 t of lepidolite and 1.34 Mt of feldspar over a 20-year total operating life.
| 2.1 | PHASEDAPPROACH TOPROJECTDEVELOPMENT |
Avalon is proposing a phased development program for the Project starting with the development of the mine, and a flotation concentrator for petalite and lepidolite production. A feldspar recovery circuit will be added in operating Year 5.
In Phase 2 (which is not part of this PEA and is subject to market demand and financing) Avalon plans to develop a lithium hydroxide demonstration plant, followed in Phase 3 by a full-scale lithium hydroxide plant.
| 2.2 | TERMS OFREFERENCE |
| 2.2.1 | Preliminary Economic Assessment |
This PEA has been prepared by Micon under the terms of its agreement with Avalon. As discussed in the relevant sections of the report, Micon has prepared a mine plan and schedule and has prepared an economic analysis of the Project. Micon has reviewed the metallurgical testwork and the mineral processing flowsheet, the infrastructure requirements, and the capital and operating cost estimates prepared by Avalon and its retained consultants.
| 2.2.2 | Mineral Resource Estimate |
The PEA is based on updated mineral resource estimates for lithium and feldspar contained in the Separation Rapids Lithium Deposit (SRLD), prepared by Avalon dated 23 May, 2018. This updated estimate is considered not significantly different from the previous independent one reported in a NI 43-101 Technical Report dated 10 November, 2016.
23
The mineral resource estimates in this PEA have been prepared in accordance with the requirements of Canadian securities laws, which differ from the requirements of United States securities laws. Unless otherwise indicated, all mineral resource estimates included in this PEA have been prepared following CIM Definition Standards in accordance with NI 43-101. The NI 43-101 is a rule developed by the Canadian Securities Administrators which establishes standards for all public disclosure an issuer makes of scientific and technical information concerning mineral projects. No reserves have been determined.
Canadian standards, including NI 43-101, differ significantly from the requirements of the United States Securities and Exchange Commission (the SEC), and reserve and resource information contained in this Technical Report may not be comparable to similar information disclosed by United States companies. In particular, and without limiting the generality of the foregoing, the term “resource” does not equate to the term “reserve”. Under the SEC standards, mineralization may not be classified as a “reserve” unless the determination has been made that the mineralization could be economically and legally produced or extracted at the time the reserve determination is made. The SEC’s disclosure standards normally do not permit the inclusion of information concerning “measured mineral resources”, “indicated mineral resources” or “inferred mineral resources” or other descriptions of the amount of mineralization in mineral deposits that do not constitute “reserves” by United States standards in documents filed with the SEC. United States investors should also understand that “inferred mineral resources” have a great amount of uncertainty as to their existence and as to their economic and legal feasibility. It cannot be assumed that all or any part of an “inferred mineral resource” exists, is economically or legally mineable, or will ever be upgraded to a higher category. Under Canadian rules, estimated “inferred mineral resources” may not form the basis of feasibility or pre-feasibility studies. Disclosure of the amount of minerals contained in a resource estimate is permitted disclosure under Canadian regulations; however, the SEC normally only permits issuers to report mineralization that does not constitute “reserves” by SEC standards as in-place tonnage and grade without reference to unit measures. The requirements of NI 43-101 for identification of “reserves” are also not the same as those of the SEC, and reserves reported by Avalon in compliance with NI 43-101 may not qualify as “reserves” under SEC standards. Accordingly, information concerning mineral deposits set forth herein may not be comparable with information made public by companies that report in accordance with United States standards.
| 2.2.3 | Relationship with Avalon |
Micon does not have, and has not previously had, any material interest in Avalon or any related entities. The relationship between Micon and Avalon is solely a professional association between the client and the independent consultant. This report is prepared in return for fees based upon agreed commercial rates and the payment of these fees is in no way contingent on the results of this report.
The conclusions and recommendations in this report reflect the authors’ best independent judgment in light of the information available to them at the time of writing. The authors and Micon reserve the right, but will not be obliged, to revise this report and conclusions if additional information becomes known to them subsequent to the date of this report. Use of this report acknowledges acceptance of the foregoing conditions.
24
This report is intended to be used by Avalon subject to the terms and conditions of its agreement with Micon. That agreement permits Avalon to file this report as a Technical Report with the Canadian Securities Administrators pursuant to provincial securities legislation. Except for the purposes legislated under provincial securities laws, any other use of this report, by any third party, is at that party’s sole risk.
The requirements of electronic document filing on SEDAR (www.sedar.com) necessitate the submission of this report as an unlocked, editable PDF (portable document format) file. Micon accepts no responsibility for any changes made to the file after it leaves its control.
| 2.3 | QUALIFIEDPERSONS, SITEVISITS,ANDAREAS OFRESPONSIBILITY |
The primary authors of this report and Qualified Persons are:
| • | Richard Gowans, P.Eng., President and Principal Metallurgist, Micon. | |
| • | Christopher Jacobs, CEng, MIMMM, Vice President, Micon. | |
| • | EurIng, Bruce Pilcher, CEng, FIMMM, FAusIMM(CP), Senior Mining Engineer, Micon. | |
| • | Jane Spooner, P.Geo., Vice President, Micon. | |
| • | Steven R. Aiken, P.Eng., Knight Piésold Limited. | |
| • | Kevin E. Hawton, P.Eng., Knight Piésold Limited. | |
| • | William Mercer, PhD, P.Geo |
Micon’s site visit to the Separation Rapids property was conducted on 21 July, 2016 by Richard Gowans. He was accompanied by Chris Pedersen, Senior Geologist with Avalon. The mineral resource estimate was updated by Volker Moller under the guidance of William Mercer. Mr. Moller has also visited site on numerous occasions, including over-seeing of the most recent drill program. Dr. Mercer has visited the site numerous times during the period from 2007 to 2018. Geotechnical Engineers from Knight Piésold Limited (Knight Piésold) inspected the site in 2001.
| 2.4 | UNITS ANDABBREVIATIONS |
All currency amounts are stated in Canadian dollars, $ or CAD. Quantities are generally stated in metric units, the standard Canadian, and international practice, including metric tons (tonnes, t) and kilograms (kg) for weight, kilometres (km) or metres (m) for distance, hectares (ha) for area. Wherever applicable, Imperial units have been converted to Système International d’Unités (SI) units for reporting consistency. Metal grades may be expressed as a percentage (%), parts per million (ppm) or parts per billion (ppb). A list of abbreviations is provided in Table 2.1.
25
Table 2.1
List of Abbreviations
| Abbreviation | Term |
| AA | Atomic absorption spectrometry |
| ABA | Acid base accounting |
| A/cm2 | Amperes per square centimetre |
| Al | Aluminium |
| AMD | Acid mine drainage |
| ARD | Acid rock drainage |
| Bcm | Bank cubic metre(s) |
| Be | Beryllium |
| BQ | Drill core tube size interior diameter 36.5 mm |
| Ca | Calcium |
| CE | Current efficiency |
| CEAA | Canadian Environment Assessment Act |
| CGO | Coarse grained material |
| CIM | Canadian Institute of Mining, Metallurgy and Petroleum |
| Cm | Centimetre(s) |
| cm2 | Square centimetres |
| CNR | Canadian National Railway |
| CoV | Coefficient of variation |
| CPR | Canadian Pacific Railway |
| Cr | Chromium |
| Cs | Caesium |
| DFO | Federal Department of Fisheries and Oceans |
| DTM | Digital terrain model |
| d50 | 50% passing |
| ECA | Environmental Compliance Approval |
| ECCC | Environment and Climate Change Canada |
| EIA | Environmental Impact Assessment |
| EPCM | Engineering, procurement and construction management |
| ESIA | Environmental and Social Impact Assessment |
| FGO | Fine grained material |
| FOB | Free on board |
| g | Gram(s) |
| g/cm3 | Grams per cubic centimetre |
| g/L | Grams per litre |
| Ga | Gallium |
| G&A | General and administration |
| Ge | Germanium |
| GJ | Gigajoule(s) |
| GJ/h | Gigajoules per hour |
| g/t | Grams per tonne |
| GPS | Global positioning system |
| h | Hour(s) |
| ha | Hectare(s) |
| HIMS | High intensity magnetic separator |
| h/y | Hours per year |
| HVAC | Heating, ventilation, air conditioning |
| ICP | Inductively coupled plasma |
26
| Abbreviation | Term |
| ICP-MS | Inductively coupled plasma-mass spectrometry |
| in | Inch(es) |
| INAA | Instrumental neutron activation analysis |
| IRR | Internal rate of return |
| K | Potassium |
| kg | Kilogram(s) |
| km | Kilometre(s) |
| km/h | Kilometres per hour |
| kV | Kilovolt(s) |
| kWh | Kilowatt hour(s) |
| lb | Pound(s) weight |
| LA-ICP | Laser ablation - inductively coupled plasma |
| Li | Lithium |
| Li2O | Lithium oxide, lithia |
| LG | Lerchs-Grossman |
| LIMS | Low intensity magnetic separator |
| LOI | Loss on ignition |
| LRIA | Lakes and Rivers Improvement Act |
| Na | Sodium |
| NAA | Neutron activation analysis |
| m | Metre(s) |
| M | Million(s) |
| M | Mole per litre |
| mA/cm2 | Milliampere per square centimetre |
| Mbcm | Million bank cubic metres |
| masl | Metres above sea level |
| MDMER | Metal and Diamond Mining Effluent Regulations |
| MECP | Provincial Ministry of Environment, Conservation and Parks |
| Mg | Magnesium |
| mg/kg | Milligrams per kilogram |
| mg/L | Milligrams per litre |
| mm | Millimetre(s) |
| Mm3 | Million cubic metres |
| MNDM | Ontario Ministry of Energy, Northern Development and Mines previously the Ministry of Northern Development and Mines |
| MNRF | Ontario Ministry Natural Resources and Forestry |
| MOH | Ministry of Health |
| MOECC | Ontario Ministry of Environment and Climate Change |
| mol/L | Moles per litre |
| MOU | Memorandum of Understanding |
| Moz | Million ounces |
| Mt | Million tonnes |
| Mt/y | Million tonnes per year |
| MW | Megawatt(s) |
| Na | Sodium |
| NAD | North American Datum |
| Nb | Niobium |
| NQ | Drill core tube size interior diameter 47.6 mm |
| NPV | Net present value |
| NPV8 | Net present value at a discount rate of 8% per year |
27
| Abbreviation | Term |
| NSR | Net smelter return |
| OGS | Ontario Geological Survey |
| PLS | Pregnant leach solution |
| PLT | Point load test |
| ppb | Parts per billion |
| ppm | Parts per million |
| PWQO | Provincial Water Quality Objectives |
| Q | Rock tunnelling quality |
| QA/QC | Quality assurance/quality control |
| OGS | Ontario Geological Survey |
| QP | Qualified Person |
| R2 | Coefficient of determination |
| Rb | Rubidium |
| RMR | Rock mass rating |
| S | Sulphur |
| SARA | Species at Risk Act |
| SEM | Scanning electron microprobe |
| SG | Specific gravity |
| Si | Silicon |
| SiO2 | Silicon dioxide, silica |
| Sn | Tin |
| SRLD | Separation Rapids Lithium Deposit |
| SRP | Separation Rapids Pegmatite |
| sRPHD | Relative percent half difference |
| SWERFcs | Size-weighted respirable crystalline silica |
| t | Tonne(s) |
| Ta | Tantalum |
| t/d | Tonnes per day |
| t/h | Tonnes per hour |
| Ti | Titanium |
| Tl | Thallium |
| t/m3 | Tonnes per cubic metre |
| TMF | Tailings Management Facility |
| UCS | Uniaxial compressive strength |
| UTM | Universal Transverse Mercator |
| V | Volt(s) |
| v/v | Volume for volume |
| WIN | Wabaseemoong First Nation |
| wt.% | Weight percent |
| XRD | X-ray diffraction |
| XRF | X-ray fluorescence |
| ° | Degree(s) |
| °C | Degrees Centigrade |
| % | Percent |
| %/y | Percent per year |
| µm | Micron(s) |
| USD | United States dollars |
| $, CAD | Canadian dollars |
| 3D | Three dimensional |
28
3.0 RELIANCE ON OTHER EXPERTS
Micon has reviewed and analyzed data provided by Avalon and has drawn its own conclusions therefrom, augmented by its direct field examination. Micon has not carried out any independent exploration work, drilled any holes or carried out an extensive program of sampling and assaying on the property. However, Micon did take eight independent samples that were representative of the Separation Rapids Pegmatite (SRP) petalite-bearing Subunits 6a, 6c and 6d, in 1999, as part of an independent check sampling and assaying exercise. The results from this data validation process are reported in Section 12.3.
While exercising all reasonable diligence in checking, confirming and testing it, Micon has relied upon Avalon’s presentation of the data relating to the Separation Rapids property in preparing this report.
| 3.1 | MINERALTENURE ANDSURFACERIGHTS |
Micon and has not reviewed any of the documents or agreements under which Avalon holds title to the Separation Rapids property and offers no opinion as to the validity of the mineral titles claimed. A description of the properties, and ownership thereof, is provided in Section 4.2 for general information purposes only as Micon is not qualified to comment on these matters.
| 3.2 | ENVIRONMENTALLIABILITIES ANDSOCIAL ANDCOMMUNITYIMPACTS |
The existing environmental conditions, liabilities and remediation are described as required by NI 43-101 regulations as Micon is not qualified to comment on such matters. Where these matters are discussed in the report, Micon has relied upon representations and documentation provided by Avalon.
| 3.3 | TAXATION ANDROYALTIES |
Micon is not qualified to comment on such matters as taxation and royalties and has relied on the representations and documentation provided by Avalon.
29
4.0 PROPERTY DESCRIPTION AND LOCATION
| 4.1 | INTRODUCTION |
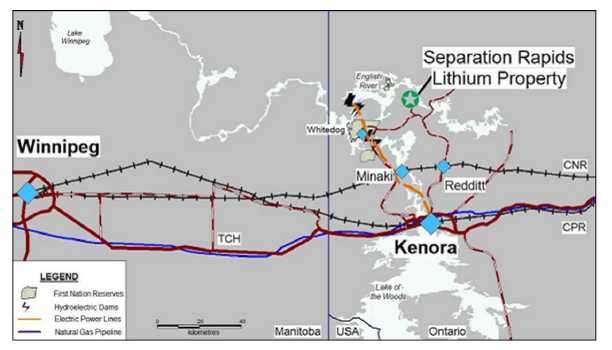
The Separation Rapids property is located in northwestern Ontario, 55 km due north of Kenora and about 79 km by road. It is centred on latitude 50 15’ 30” N, longitude 94 35’ W (UTM coordinates: 388441E 5568996N in NAD 83, Zone 15N15). It lies approximately 40 km east of the Manitoba-Ontario border. A general location map is provided in Figure 4.1.
Figure 4.1
Separation Rapids Property General Location Map
| 4.2 | PROPERTY ANDOWNERSHIP |
The Separation Rapids property is located in the southeast corner of claim sheet G-2634, Paterson Lake Area, and consists of eight Mining Claims and one Mining Lease as shown in Figure 4.2. The claims comprise 153 claim units, totalling 2,448 ha (6,049 acres). Information on the claims is summarized in Table 4.1.
In addition, Avalon holds a Mining Lease that encompasses the mineralized zone, referred to as Lease or Licence Number 108395. The lease covers an area of 421.441 ha over the area of the SRLD and adjacent lands. It was formed from Mining Claims K1178304, K1178305, K1178306, K1178349 and K1247023, Parts 1 to 5 on Plan 23R-11732, Paterson and Snook Lake Areas, as of October, 2009 (see Table 4.2) .
30
Figure 4.2
Separation Rapids Property Claim Map

Table 4.1
Separation Rapids Claim Listing
| Claim Number | Location | Claim Type | Number of Cells | Issue Date | Anniversary Date | Area (m )2 | Area (ha) | Area (a) |
| 129009 | Paterson Lake Area | Boundary Cell Mining | 1 | 10/04/2018 | 19/01/2020 | 206,071 | 20.6 | 50.9 |
| 164303 | Paterson Lake Area | Boundary Cell Mining | 1 | 10/04/2018 | 19/01/2020 | 206,053 | 20.6 | 50.9 |
| 166167 | Paterson Lake Area | Boundary Cell Mining | 1 | 10/04/2018 | 02/12/2018 | 206,034 | 20.6 | 50.9 |
| 281594 | Paterson Lake Area | Boundary Cell Mining | 1 | 10/04/2018 | 02/12/2018 | 206,016 | 20.6 | 50.9 |
| 298890 | Paterson Lake Area | Boundary Cell Mining | 1 | 10/04/2018 | 02/12/2018 | 205,980 | 20.6 | 50.9 |
31
| Claim Number | Location | Claim Type | Number of Cells | Issue Date | Anniversary Date | Area (m )2 | Area (ha) | Area (a) |
| 298892 | Paterson Lake Area | Boundary Cell Mining | 1 | 10/04/2018 | 02/12/2018 | 205,998 | 20.6 | 50.9 |
| 298893 | Paterson Lake Area | Boundary Cell Mining | 1 | 10/04/2018 | 02/12/2018 | 206,016 | 20.6 | 50.9 |
| 525020 | Snook Lake Area | Multi-cell Mining Claim | 20 | 27/06/2018 | 16/03/2020 | 4,124,368 | 412.4 | 1,019.2 |
| 525021 | Snook Lake Area Paterson | Multi-cell Mining Claim Multi-cell | 18 | 27/06/2018 | 16/03/2020 | 3,710,784 | 371.1 | 917.0 |
| 525022 | Lake/Snook Lake Area Paterson | Mining Claim Multi-cell | 14 | 27/06/2018 | 01/02/2020 | 2,885,355 | 288.5 | 713.0 |
| 525023 | Lake Area Paterson | Mining Claim Multi-cell | 22 | 27/06/2018 | 13/02/2020 | 4,532,901 | 453.3 | 1,120.1 |
| 525024 | Lake Area Paterson | Mining Claim Multi-cell | 25 | 27/06/2018 | 13/02/2020 | 5,149,673 | 515.0 | 1,272.5 |
| 525025 | Lake Area Paterson | Mining Claim Multi-cell | 24 | 27/06/2018 | 14/10/2019 | 4,942,109 | 494.2 | 1,221.2 |
| 525026 | Lake Area Paterson | Mining Claim Multi-cell | 8 | 27/06/2018 | 14/12/2018 | 1,647,326 | 164.7 | 407.1 |
| 525027 | Lake Area Paterson | Mining Claim Multi-cell | 19 | 27/06/2018 | 14/10/2019 | 3,913,467 | 391.3 | 967.0 |
| 525028 | Lake Area Paterson | Mining Claim Multi-cell | 6 | 27/06/2018 | 02/12/2018 | 1,236,097 | 123.6 | 305.4 |
| 525029 | Lake Area | Mining Claim | 14 | 27/06/2018 | 19/01/2020 | 2,885,156 | 288.5 | 712.9 |
| Total | 177 | 36,469,404 | 3,646.9 | 9,011.8 |
Table 4.2
Separation Rapids Mining Lease
| Mining Lease Number | Location | Expiry Date | Number of Units | Acres | Hectares |
| 108395 | Paterson Lake CLM469 | 30-Sep-30 | 26 | 1,041 | 421 |
The total area covered by the claims and the lease is 2,869 ha (7,091 acres).
Avalon entered into an option agreement with Robert Fairservice and James Willis, the owners of claims over the mineral deposit, on 18 October 1996, which was a four-year option from the above-named beneficial owners. Avalon completed all work and payment requirements of this option agreement and vested a 100% interest in the property in October, 1999. The title was transferred by the Government of Ontario from the owners to Avalon in November, 1999. Originally, the property was subject to a 2% net smelter royalty (NSR) retained by the vendors. This NSR was acquired on 23 February 2012 by a wholly-owned subsidiary of Avalon, 8110131 Canada Inc., for $220,000.
32
| 4.3 | ENVIRONMENTALLIABILITIES |
Other than minor and largely funded reclamation requirements under the Advanced Exploration Permit, there are no known environmental liabilities associated with the Separation Rapids property.
| 4.4 | RAILACCESS |
As there is no rail access to the mine/concentrator site, delivery of reagents to, and shipment of concentrates from the site will be by truck. However, a rail loading trans-shipment facility will be required in order to access rail transportation for product shipment and some inbound supplies. This loading site trans-shipment facility is planned to be located on the CNR line in the vicinity of Redditt, Ontario, approximately 55 km by road from the Separation Rapids site.
33
5.0 ACCESSIBILITY, CLIMATE, LOCAL RESOURCES, INFRASTRUCTURE AND PHYSIOGRAPHY
| 5.1 | ACCESSIBILITY |
The Separation Rapids property is readily accessible from Kenora by traveling 27 km north on Highway 658, an all-weather road, to the English River Road, 2 km south of the community of Redditt. Then a further 37 km on the English River Road to the Sand Lake Road, and west on the Sand Lake Road for 5.5 km to East Tourist Lake Road (ETL Road, also known as the Avalon Road), a former forestry access road (marked with a “Road to Avalon” sign). The Project site is located approximately 9.5 km north on the ETL Road or Avalon Road. The total distance from Kenora to the site is 79 km.
The main line of the CNR passes through the village of Redditt, 33 km south-southeast of the property and 52 km by road (see Figure 4.1) . The CPR lines pass through the City of Kenora.
The property is located within the Traditional Land Use Area of the Wabaseemoong Independent Nations (WIN). The larger community of WIN is Whitedog, Ontario, an Aboriginal community located approximately 31 km southwest of the property. The Swan Lake and One Man Lake reserves, also part of WIN are within approximately 35 km of the property as shown in Figure 4.1.
In 1999, Avalon constructed the access road. Over the period from 2011 to 2015, almost every year some work was completed relating to maintenance and access to the site. In 2011, new hazard awareness barricades were installed around the existing excavation and warning signs were installed in designated locations. In 2012, there was no notable site work conducted other than site visits for general site inspection. In 2015, Avalon entered into an Access and Maintenance Agreement (AMA) with the Ministry of Natural Resources and Forestry (MNRF) and obtained a Work Permit to conduct road repairs. The 1999 site access road was subsequently repaired with the installation of new culverts at the water crossings, allowing access to site with vehicles, rather than just by all-terrain vehicles. Additional signage was installed in accordance with the AMA and a new, more secure barrier was installed around the existing excavation.
Avalon’s existing quarry permit areas, located along the access road, were reflagged and new signage installed to ensure compliance with regulations. In 2016, no significant site work was done, other than monitoring road conditions and ensuring hazard awareness signs and barricades remain intact and effective.
Avalon recently (2016) purchased the Nelson Granite aggregate quarry in order to secure access rights along the entire access road, as well as to secure a nearby potential source of aggregate if required for road maintenance.
34
| 5.2 | PHYSIOGRAPHY |
The Separation Rapids area is typical of much of northwestern Ontario and the Canadian Shield. The property is relatively flat with an elevation of approximately 350 masl. Local topographic relief is limited to 50 m or less in typical Precambrian glaciated terrain and is mantled by low swamp or muskeg areas. In the low-lying areas, often underlain by recessively weathered amphibolite, there is a thin veneer of glacial till, whereas the higher areas are occupied by scoured outcrop of granite or pegmatite. The English River system is proximal to all claim groups.
Outcrop exposure is in general less than 40% in the Project area, but the area containing the SRLD has been stripped of ground cover where practicable or trenched. The remainder of the property is covered by thin glacial regolith and poorly developed soils, local swamps, muskeg, river bottom sediments and varied clays.
| 5.3 | VEGETATION |
The Separation Rapids area falls within the Boreal Hardwood Transition or Mixed Boreal Forest. The Project area is covered by boreal forest with the dominant species being Jackpine and Black Spruce. Willow shrubs and grasses dominate the low marshy areas and shoreline of the English River. Land adjacent to and within the sphere of influence of the Separation Rapids property is covered by an extensive area of blowdown caused by a wind storm around 2008. As a result of this, the surrounding forest is comprised of non-merchantable timber.
A Species at Risk Act assessment was completed, and no endangered or at-risk species were identified in the area of the proposed Project. Details of the flora and fauna within the Separation Rapids area are provided in Section 20.0.
| 5.4 | CLIMATE |
The climate is typical of Canada’s mid-latitudes. Winters are cold and long, stretching from late-October to mid-May with extremes in winter of below -40°C without the wind chill factor. The daily average temperature is below 0°C from November to March and the daily minimum is below 0°C from November to April (see Table 5.1 and Figure 5.1) . The spring-summer-fall periods are comparatively short and summer temperatures are typically warm.
Table 5.1
Average Temperatures, Kenora Weather Station, 1981-2010
| Jan | Feb | Mar | Apr | May | Jun | Jul | Aug | Sep | Oct | Nov | Dec | Year | |
| Daily Average (°C) | -16 | -12.5 | -5.2 | 4.1 | 11.3 | 16.8 | 19.7 | 18.6 | 12.7 | 5.1 | -4.2 | -13.1 | 3.1 |
| Standard Deviation | 3.8 | 3.9 | 2.7 | 2.7 | 2.2 | 1.9 | 1.5 | 1.8 | 1.8 | 1.8 | 3.2 | 3.9 | 1.1 |
| Daily Maximum (°C) | -11.4 | -7.6 | -0.2 | 9.4 | 16.7 | 21.7 | 24.4 | 23.4 | 17.1 | 8.8 | -0.9 | -9.2 | 7.7 |
| Daily Minimum (°C) | -20.5 | -17.4 | -10.1 | -1.3 | 5.8 | 11.8 | 14.9 | 13.9 | 8.3 | 1.4 | -7.4 | -17.1 | -1.5 |
| Extreme Maximum (°C) | 9.1 | 8.8 | 23.3 | 30.6 | 35.4 | 35.6 | 35.8 | 35 | 34.6 | 26.7 | 19.4 | 9.4 | |
| Date (yyyy/dd) | 2003/ 07 | 2000/ 23 | 1946/ 27 | 1952/ 30 | 1986/ 29 | 1995/ 17 | 1983/ 14 | 1955/ 18 | 1983/ 02 | 1943/ 08 | 1975/ 05 | 1941/ 03 | |
| Extreme Minimum (°C) | -43.9 | -41.4 | -36.1 | -27.2 | -12.2 | -0.6 | 3.9 | 1.1 | -6.7 | -13.9 | -31.3 | -38.3 | |
| Date (yyyy/dd) | 1943/ 20 | 1996/ 02 | 1962/ 01 | 1954/ 02 | 1958/ 01 | 1969/ 13 | 1972/ 02 | 1938/ 28 | 1965/ 25 | 1951/ 31 | 1985/ 28 | 1967/ 31 |
Environment Canada.
35
Figure 5.1
Graph of Average Temperatures, Kenora 1982-2012
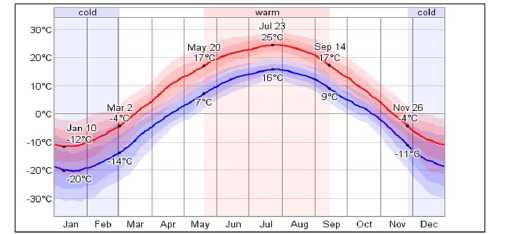
Note: the daily average low (blue) and high (red) temperature with percentile bands (inner band from 25th to 75th percentile, outer band from 10th to 90th percentile.
Weatherspark.com.
Average annual precipitation for the region is about 700 mm of which about 160 mm falls as snow (see Table 5.2) .
Typical snow accumulations, in the eight-month period September to May, range from 0.8 to 32 cm with typical peak accumulations in the period November to January. However, extreme snow falls of greater than 20 cm have been recorded for September to May. Most rainfall occurs in the period May to September with monthly average greater than 70 mm. It ranges from 72 to 118 mm, with recorded peak 24-h storms of 150 mm.
Table 5.2
Average Precipitation, Kenora Weather Station, 1981-2010
| Jan | Feb | Mar | Apr | May | Jun | Jul | Aug | Sep | Oct | Nov | Dec | Year | |
| Rainfall (mm) | 0.7 | 3 | 8.5 | 22.4 | 77.4 | 118.6 | 103.4 | 84.2 | 84.6 | 49.4 | 12 | 1.1 | 565.3 |
| Snowfall (cm) | 28.4 | 18.6 | 21.1 | 14.6 | 3.5 | 0.1 | 0 | 0 | 0.8 | 14.2 | 32.2 | 30.6 | 164.1 |
| Precipitation (mm) | 25.6 | 19.4 | 28.1 | 36.3 | 80.8 | 118.7 | 103.4 | 84.2 | 85.6 | 62.6 | 42.1 | 28.3 | 715 |
| Average Snow (cm) | 32 | 35 | 23 | 3 | 0 | 0 | 0 | 0 | 0 | 1 | 8 | 20 | 10 |
| Median Snow (cm) | 32 | 36 | 21 | 2 | 0 | 0 | 0 | 0 | 0 | 0 | 6 | 20 | 10 |
| Extreme Daily Rainfall (mm) | 9.4 | 16.2 | 19.8 | 33.3 | 106.4 | 121.4 | 153.5 | 92.5 | 108 | 46.5 | 23 | 29.7 | |
| Date (yyyy/dd) | 2010/ 23 | 2000/ 26 | 1960/ 28 | 1974/ 21 | 2007/ 29 | 1999/ 25 | 1993/ 27 | 1972/ 20 | 1981/ 06 | 1940/ 04 | 2008/ 06 | 1951/ 03 | |
| Extreme Daily Snowfall (cm) | 24.6 | 26.9 | 33.8 | 36.3 | 35.6 | 1.4 | 0 | 0 | 30 | 26.2 | 32.8 | 22.8 | |
| Date (yyyy/dd) | 1975/ 11 | 1955/ 20 | 1966/ 04 | 1957/ 10 | 2004/ 11 | 1998/ 01 | 1939/ 01 | 1938/ 26 | 1964/ 26 | 1970/ 09 | 1977/ 09 | 1984/ 16 | |
| Extreme Snow Depth (cm) | 102 | 117 | 145 | 84 | 23 | 1 | 0 | 0 | 20 | 20 | 66 | 91 | |
| Date (yyyy/dd) | 1966/ 17 | 1962/ 16 | 1966/ 05 | 1962/ 01 | 1966/ 02 | 1997/ 27 | 1955/ 01 | 1955/ 01 | 1964/ 27 | 2001/ 26 | 1965/ 28 | 1965/ 31 |
Environment Canada.
The most frequent wind direction is from the south, with speed averaging 13.7 km/h over the year. The monthly averages are similar with a relatively narrow range (see Table 5.3) . The maximum hourly speed is of the order of 50 to 68 km/h and the maximum gusts up to 120 km/h. These stronger winds can be from a variety of directions and not necessarily the south. Environment Canada wind speeds are quoted for a standard 10 m above ground level.
36
Table 5.3
Average Wind Speed, Kenora Weather Station, 1981-2010
| Jan | Feb | Mar | Apr | May | Jun | Jul | Aug | Sep | Oct | Nov | Dec | |
| Speed (km/h) | 13.4 | 13.4 | 14.1 | 14.5 | 14.3 | 13.4 | 12.6 | 12.9 | 13.8 | 14.5 | 14.3 | 13.5 |
| Most Frequent Direction | S | S | S | S | S | S | S | S | S | S | S | S |
| Max Hourly (km/h) | 58 | 51 | 56 | 53 | 56 | 68 | 64 | 64 | 57 | 64 | 58 | 59 |
| Date (yyyy/dd) | 1954/03 | 1959/15 | 1953/22 | 1960/15 | 1959/12 | 1954/07 | 1974/27 | 1962/28 | 1977/09 | 1956/24 | 1954/02 | 1999/25 |
| Max Gust (km/h) | 85 | 76 | 78 | 79 | 104 | 115 | 108 | 129 | 89 | 90 | 83 | 120 |
| Date (yyyy/dd) | 1986/11 | 1971/27 | 1982/13 | 1975/28 | 1977/28 | 2002/10 | 1974/27 | 1962/27 | 1964/26 | 1971/19 | 1978/05 | 1999/25 |
Source: Environment Canada.
| 5.5 | LOCALRESOURCES ANDINFRASTRUCTURE |
The development of the Separation Rapids Project is expected to have a positive impact on unemployment in the Kenora, Redditt and the Wabaseemoong Independent Nations (“WIN”) communities. The First Nations Community of Whitedog a probable source of mine personnel, is located approximately 30 km west of the property and is accessed via the Sand Lake Road and Highway 525 from Minaki.
Water for the mineral processing facility and other needs is available in abundance in the Project area. The closest hydroelectric power generating station is located at Whitedog Falls although there is also a larger generating station further north at Caribou Falls, which runs a transmission line south to join up with the Whitedog Falls facility. Hydro One then runs an existing 115 kV transmission line from Whitedog Falls to Kenora. Discussions with Hydro One have confirmed that there is sufficient power available from Caribou Falls to meet the requirements for the Project.
Further details on infrastructure requirements are provided in Section 18.0.
The closest centre with significant services is Kenora. Forestry, tourism and mining are the three largest sectors of the Kenora economy. During the summer, tourism can almost double the population of the area.
The Lake of the Woods District Hospital is located in Kenora. Education is provided by seven elementary schools, two high schools, Confederation College, a post-graduate institution, and Seven Generations Education Institute
Kenora is served by CP Rail and Bearskin Airlines. VIA Rail passes through Redditt, a small community with a population of approximately 150 people located on the CN Rail main line.
37
6.0 HISTORY
Prior to the discovery of rare-metal pegmatite occurrences, exploration in the Separation Rapids region focused on base and precious metal mineralization. Rare-element mineralization in the area was first encountered along the English River, near Separation Rapids, by Stockwell in 1932 (Breaks and Tindle, 2001). The petalite-bearing SRLD which forms a prominent hill on the south shore of MacDonald’s Bay on the English River, and an associated group of rare-metal pegmatites, were discovered by Dr. Fred Breaks of the Ontario Geological Survey (OGS) as a result of a detailed study of rare-metal pegmatites in the region between 1994 and 1996. Dr. Breaks and the OGS recognized the importance of the SRLD and public disclosure of the discovery was made in July, 1996 in an OGS special release (Breaks and Tindle, 1996).
It should be noted that the SRLD may be referred to in the geological literature and in earlier reports on the property as the Big Whopper Pegmatite or BWP.
The Superior Province of Ontario represents a vast terrain that contains numerous rare-element (Li, Cs, Rb, Ti, Be, Sn, Ta, Nb, Ga and Ge) mineral occurrences, many of which were found during the lithium exploration rush of the 1950s (Mulligan, 1965, cited in Breaks and Tindle, 2001). Mineral exploration for the rare elements in subsequent years, however, was essentially desultory. In 1993, Breaks and Tindle commenced a comprehensive study of rare-element mineralization in northwestern Ontario intended to provide a modern mineralogical, chemical and geochronological database and designed, in part, to encourage mineral exploration. The authors recognized that rare-element class pegmatites of the complex-type (petalite-subtype) are widespread in the Separation Rapids area. Such pegmatites are uncommon and comprise only 2% of lithium-rich pegmatites on a global basis (Černý and Ercit, 1989). Break’s work in the area culminated in the 1996 discovery of the SRLD pegmatite (Breaks and Tindle, 1996, 1997).
Subsequent to the discovery and staking of the SRLD, the area has experienced a significant increase in exploration interest for ceramic grade petalite, tantalum and cesium. The principal exploration companies include Avalon, Champion Bear Resources Ltd., Tantalum Mining Corporation of Canada Ltd. (Tanco), Gossan Resources Ltd. and Emerald Fields Resource Corporation (now Pacific Iron Ore Corporation).
Exploration on the SRLD in the late-1990s was accompanied by a scoping level metallurgical study by Lakefield Research Limited and a marketing study by Equapolar Resource Consultants (Pearse, 1998) on the principal mineral commodities to develop. A flowsheet for processing the mineralized material was developed and the size and value of the markets for the principal mineral commodities, petalite and feldspar was identified. Avalon’s senior geologist, Mr. Chris Pedersen, geologically mapped the major portion of the cleared outcropping SRLD on the property at a scale of 1:100.
38
Since 2014, Avalon has not only investigated market opportunities for petalite in the glass and ceramics industries, it has also developed processes for recovering concentrates of lepidolite and feldspars as well as a process for converting petalite into lithium carbonate and hydroxide.
Additional exploration and drilling programs have also been completed by Avalon in 2017 and 2018 and are described in Sections 9.0 and 10.0.
39
7.0 GEOLOGICAL SETTING AND MINERALIZATION
| 7.1 | INTRODUCTION |
The Late Archean-aged SRLD belongs to the petalite sub-type of the complex-type class of rare-metal pegmatites (Černy and Ercit, 2005). The complex-type pegmatites are geochemically the most highly evolved in the spectrum of granitic pegmatites and petalite-bearing pegmatites comprise only 2% of the known complex-type pegmatites.
The SRLD exhibits some significant differences from the norm in its structural setting, preservation of magmatic zonation and overall crystal size. Unlike the Tanco and Bikita deposits (owned by Cabot Corporation and Bikita Minerals Ltd., respectively), which are shallowly dipping, undeformed zoned intrusions, and the Greenbushes deposit (Talison Lithium), which is an approximately 45°dipping, zoned and locally mylonitized pegmatite, the SRLD dips subvertically, is complexly folded, strongly foliated and locally mylonitized.
The SRLD exhibits zoning characteristics seen in other highly evolved rare-metal pegmatites, i.e., well-developed wall zones with exo-contact and endo-contact borders and a petalite-rich intermediate zone. However, within the SRLD a significant portion of these zones and zonal features has been tectonically modified. In addition, all three recently producing rare-metal pegmatite deposits (Tanco, Bikita, Greenbushes) contain exceptionally large crystals of spodumene, petalite and feldspars which permit selective mining; at Bikita and Tanco petalite crystals and pseudomorphs are reported to be as large as 2 to 2.5 m in size. The megacrystic zones in the SRP, on the other hand, contain crystals no larger than 10 to 15 cm.
| 7.2 | REGIONALGEOLOGY |
The SRLD, its parent granite, the Separation Rapids Pluton, and associated rare-metal pegmatites occur within the Archean Separation Lake Metavolcanic Belt (SLMB) which forms the boundary between the English River subprovince to the north and the Winnipeg River subprovince to the south. Both subprovinces are part of the larger Archean Superior Province of the Canadian Shield. Figure 7.1 and Figure 7.2 provide the location and a simplified district geological map of part of Avalon’s lease, 108395 (Paterson Lake CLM469).
The SLMB is thought to represent the easterly extension of the Bird River metavolcanic-metasedimentary belt in Manitoba which contains the Tanco, Bernic Lake, Rush Lake and Greer Lake pegmatites, all of which are part of the Winnipeg River-Cat Lake pegmatite field. To date, this belt and pegmatite field combined contain the highest concentration of fertile peraluminous granites and rare-metal pegmatite mineralization in the Superior Province, and the greatest number of complex-type, petalite-subtype pegmatite occurrences in Canada (Breaks and Tindle, 1998).
40
Figure 7.1
Location of the Separation Rapids Lithium Deposit
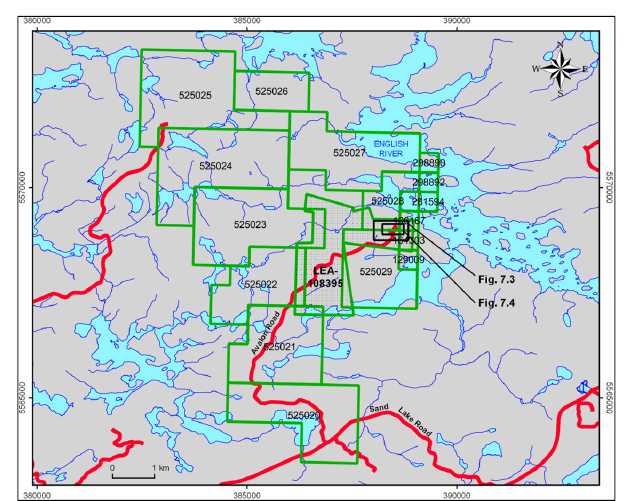
Note: The locations of detailed geology maps, Figure 7.3 and Figure 7.4, are indicated by the boxes. Micon, 2016.
The currently exposed and mapped areas of the SRLD and associated rare-metal pegmatites occur within an approximately 600 m wide package of predominantly mafic metavolcanic rocks that have been variably deformed and metamorphosed to lower and middle amphibolite facies. This package is bounded to the north by the Separation Rapids Pluton and to the south by pegmatitic granites of the Winnipeg River subprovince, as shown in Figure 7.2, the reproduction of an early map by Breaks and Tindle (1998).
The SRLD and its associated dykes fall within the southwestern subgroup of the SRP group (Breaks and Tindle, 1998) and are located south and west of the English River. The eastern subgroup occurs to the north and east of the English River and contains a number of rare-metal pegmatites, including Marko’s pegmatite approximately 5 km east of the SRLD.
41
Figure 7.2
District Geological Map
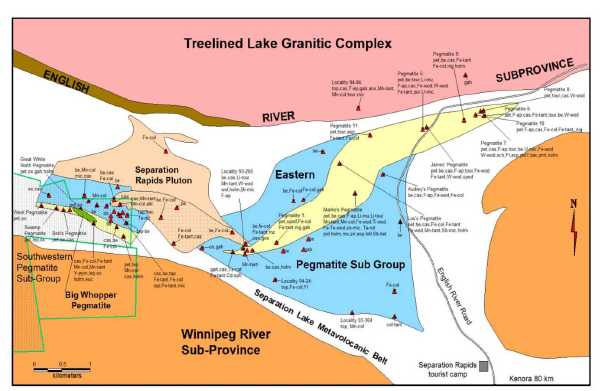
Note: Nomenclature is per original reference.
Breaks and Tindle, 1998.
| 7.3 | PROPERTYGEOLOGY |
Avalon has mapped seven distinct lithological units adjacent to and within the SRLD as described in Table 7.1, below.
The Separation Rapids area is underlain predominantly by a mafic metavolcanic sequence (amphibolite or Avalon’s Unit 1), consisting of flows, tuffs, subordinate epiclastic metasediments and rare iron formation horizons and rhyolites. Locally, on the Avalon property itself, the metavolcanic sequence is restricted to amphibolite (Pedersen, 2016a).
Figure 7.3 is a generalized geology map of the SRLD. The black outline on Figure 7.1 denotes location of this figure.
There has been confusion over the naming of various pegmatitic bodies in the Separation Rapids area over the years due to the informal nature of many of the deposit names utilized. The SRLD, as referred to by Avalon and as described in this report, extends for some 1,150 m in outcrops and various parts have had names applied to them over the years.
42
Table 7.1
MappedLithologies in theSeparation RapidsProperty
| Lithological Unit/Subunit | Rock Type | Physical Characteristics, Size and Distribution | Description |
| 1 | Amphibolite | Separation Lake Metavolcanic Belt | Dark green-grey, typically fine-grained but locally coarser gabbroic. Strongly foliated and folded. Local preservation of pillow flows. Li and Cs metasomatic alteration adjacent to SRP dykes produces holmquistite (blue-violet acicular Li-bearing amphibole) and glimmerite (black- brown Cs-rich phlogopite). |
| 2 | Pegmatitic granite | Winnipeg River Batholith | Medium-grained to locally megacrystic, massive to poorly foliated, with potassium feldspar predominant, and quartz and albite subordinate. Recent reinterpretation of lithologies mapped as Unit 2, on the south side of the SRP, indicate that they might be part of the SRP’s petalite- bearing feldspathic zone (Pedersen, personal communication). |
| 3a and 3b | Albitite | SRLD albite-rich wall zone to the petalite bearing pegmatitic subunits | Together, 3a and 3b constitute approximately 25% of the feldspathic units in the SRP. Zones from several cm to 15 m wide and to a maximum length of 120 m. Subunit 3a albitite is generally grey-white to light pink. Fine- to medium-grained, equigranular to seriate textures and locally exhibit pronounced magmatic banding (albite-rich versus potassium feldspar-rich layers, with the former predominating). Aplitic albite is the most common constituent. The abundance of albite and the albite: potassium feldspar is highly variable. Subunit 3b dykes are typically mottled grey, heterogeneous, medium grained to megacrystic albite potassium feldspar rock with light pink-orange potassium feldspar megacrysts in a finer-grained albitic groundmass. The total feldspar content of Subunit 3b is typically greater than 80%., but the ratios of potassium feldspar to albite is heterogeneous. |
| 4 | Megacrystic potassium feldspar quartz sub-zone | SRLD intermediate zone | Potassium feldspar-rich (plus albite and mica). Similar to Unit 3b in that Coarse-grained, subhedral potassium feldspar megacrysts (larger than 5 mm) set in a finer-grained matrix (less than 2 mm) of subhedral quartz, albite, potassium feldspar and minor mica. Distinct from Unit 7 in having a lower potassium feldspar to albite ratio. Very minor petalite. |
| 5 | Quartz-mica sub- zone | SRLD intermediate zone | Constitutes approximately 17% of the feldspathic units in the SRP. Coarse grained rock dominated by dark anhedral quartz with subordinate amounts of interstitial mica and potassium feldspar and no obvious petalite. |
| 6a, 6b, 6c, 6d | Petalite-bearing pegmatite zone | SRLD petalite zone (intermediate zone) | See text. |
| 7 | Pegmatite granite zone | SRP feldspathic wall zone | Constitutes approximately 31% of the feldspathic units in the SRP. Similar to Unit 4 being heterogeneous, medium grained and locally containing megacrystic Rb-rich potassium feldspar. |
43
Figure 7.3
Generalized Geology – Separation Rapids Lithium Deposit
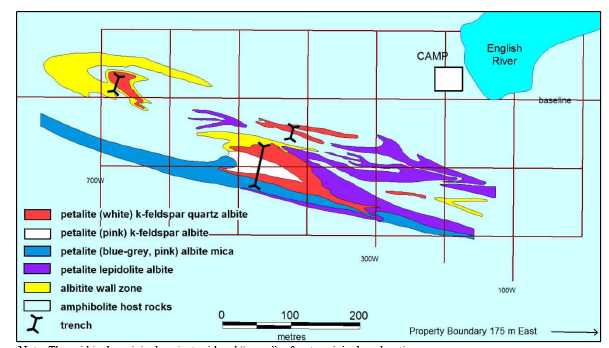
Note: The grid is the original project grid and “camp” refers to original exploration camp. Micon, 1999.
The drill tested portion is about 1,100 m in strike length, of which about 300 m is considerably thicker and thus contains the bulk of the presently defined mineral resource. The further continuation of the pegmatite 450 m to the west is thinner and has a few shallow drill holes. This thin portion, drilled in the past, has been informally referred to as Bob’s Pegmatite.
There is yet further extension of the thinner pegmatite in sparse outcrops to the west for approximately 400 m, referred to normally as the “Western Pegmatite” or, rarely, as the “West Pegmatite”. See Figure 7.2. (Breaks and Tindle, 1998; Micon, 1999). This 400 m extension has been drill tested in 2018.
Bob’s Pegmatite and the West or Western Pegmatite are all part of what Breaks and Tindle called the Southwestern Pegmatite Sub-Group to distinguish it from the “Big Whopper” sensu stricto, where the term Big Whopper was used by Breaks and Tindle, and others, originally to refer to the main known portion of the SRLD. Breaks and Tindle’s Southwestern Pegmatite Sub-Group though, appears to include some unnamed pegmatites as well as the Western and Bob’s Pegmatites.
For reference, Table 7.2 sets out the various names for the known pegmatite deposits in terms of their grid and UTM locations using the extent to the west and east of each portion of the pegmatite that comprises the SRLD.
44
Table 7.2
Separation Rapids Area Pegmatite Nomenclature
| Deposit | Terminology (See Figure 7.2) | Other Names | Description | Project Grid Westing | UTM Easting | ||||
| West End | East End | Strike (m) | West End | East End | Strike (m) | ||||
| SRLD | Big Whopper | Main Mass | Thick part of drilled pegmatite | 550 | 250 | 300 | 388350 | 388650 | 300 |
| SRLD | Bob’s Pegmatite | West extension of Main Mass | Thin part of drilled pegmatite. Part of Breaks’ Southwest Pegmatite Sub-unit | 1000 | 550 | 450 | 387900 | 388350 | 450 |
| SRLD | Usually Western Pegmatite or sometimes West Pegmatite | Western Extension | Undrilled. Part of Breaks’ Southwest Pegmatite Sub-unit | 1400 | 1000 | 400 | 387500 | 387900 | 400 |
In the northern part of the property, the mafic metavolcanic sequence is intruded by granite, pegmatitic granite and pegmatite dykes associated with the Separation Rapids Pluton, and in the southern part of the property by pegmatitic granite and related dykes of the Winnipeg River batholith. The amphibolite of the mafic metavolcanic sequence and the Winnipeg River granite (Unit 2) are the host lithologies to the SRLD.
As mapped by Avalon, see Figure 7.4 and Figure 7.5, the thickest part of the SRLD, historically referred to as the Big Whopper Pegmatite, forms a large lens-shaped body approximately 300 m long and approximately 70 m at its widest part.
The SRLD narrows to less than 20 m at both its eastern and western ends and extends along strike in both directions for at least 300 m in the form of relatively narrow tails up to 10 to 15 m wide. Smaller, subparallel, 1 m to 10 m wide, petalite-bearing pegmatite bodies predominantly occur to the northeast, north and northwest of the main SRLD body, with minor occurrences on the southern flank.
The narrower west-southwest-striking zone of petalite pegmatites extends from the main SRLD for a distance of approximately 750 m to the west and is exposed in four outcrops, namely the Great White North, Bob’s, Swamp and West pegmatites, see Figure 7.5.
Avalon has further subdivided the SRLD into three sub-zones, namely the SRP, Western Pegmatite and Eastern Swarm. Based on lithological, mineralogical and textural variations, the SRP itself has been subdivided into five distinct lithological units and subunits, 3a, 3b, 4, 5 and 6, as shown in Table 7.1 above, that outcrop as irregular dykes and larger irregular to elliptical bodies intruding the amphibolite and granites.
Within the SRP, Unit 1 amphibolite occurs as narrow, discontinuous screens with strike lengths ranging from tens of metres up to greater than 100 m and widths of predominantly less than 1 m.
45
Figure 7.4
Separation Rapids Lithium Deposit, Detailed Outcrop Mapping
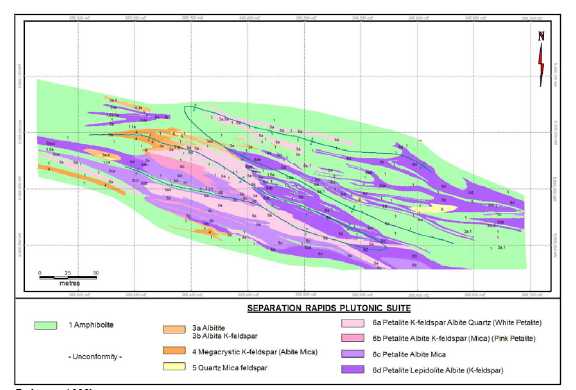
Pedersen, 1998b.
46
Figure 7.5
Separation Rapids Lithium Deposit, Extension of the Main Pegmatite Body
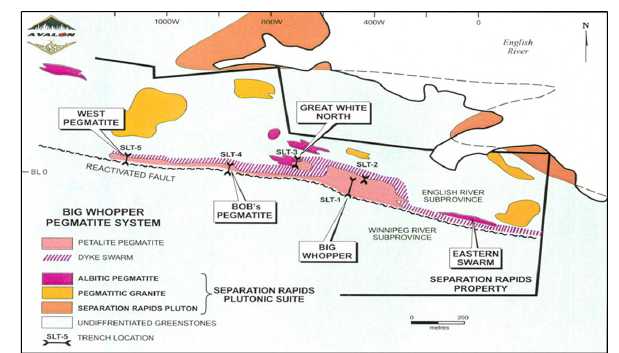
Note: 1. Names of deposits are historical, see Table 7.2; 2. Grid reference 1000W in original map is incorrect and should be 1200W; 3. (Micon, 1999).
These screens are preferentially, but not exclusively, concentrated near the north and south margins of the main pegmatite body. Core drilling has confirmed their down-dip continuity and surface mapping shows that they are also locally isoclinally folded with the pegmatite. Outside of the SRP, recessively-weathering amphibolite forms depressions and valleys adjacent to resistant ridges of granite and pegmatite.
Avalon reports that classification of the Winnipeg River pegmatitic granite (Unit 2) as a separate unit is based on its occurrence south of the SRP and the boundary fault between the Winnipeg River and Separation Rapids intrusive suites, and its distinct primary mineralogy (potassium feldspar, biotite, quartz, almandine).
| 7.3.1 | Pegmatite Units |
| 7.3.1.1 | Unit 3: Albitite |
The main SRLD is flanked by a swarm of narrower petalite-bearing, highly feldspathic pegmatites, albitite and albite-potassium feldspar zones, subunits, 3a and 3b. These two subunits make up a significant portion of the northwestern part of the SRLD (Albitite Wall Zone in Figure 7.3) .. Subunit 3a occurs as discrete, strongly foliated aplitic zones proximal to the SRLD and internally as endocontact border zones proximal to the amphibolite. Subunit 3b occurs as medium-grained, potassium feldspar-rich megacrystic dykes, which are somewhat similar to the Subunit 3a dykes and also occur within the same portions of the northwestern SRLD.
47
| 7.3.1.2 | Unit 4: Megacrystic Potassium Feldspar Quartz Sub-zone |
The potassium feldspar-rich zone lithology that constitutes Unit 4 is confined, on surface, to the northwestern and southwestern peripheral zones and two narrow, 20 m to 30 m long zones on the southern margin of the main zone, as shown in Figure 7.4. However, core drilling shows that this unit is more extensive at depth, and overall constitutes approximately 27% of the feldspathic units in the SRLD and forms the major portion of what Avalon has called the “Flame Structure”. This unit resembles Unit 7 but is reported to be distinct from it in having a lower potassium feldspar to albite ratio. The unit typically is strongly foliated to semi-massive, with elongate rounded, sub-lenticular, corroded and rotated potassium feldspar megacrysts in a fine-grained albite-potassium feldspar-mica-quartz ground mass. Avalon reports that Unit 4 has similar grain-size distribution to Subunit 3b and is texturally similar to Unit 6b but lacks petalite.
| 7.3.1.3 | Unit 5: Quartz-Mica Sub-zone |
As mapped by Avalon, Unit 5 occurs as irregular zones commonly associated and interbanded with Unit 4 in the northern and northwestern zone peripheral to the main SRLD. The Unit 5 zones tend to be less than 20 m in length (except for one larger, 60-m long zone on the northwestern flank) (see Figure 7.4) . At depth, Unit 5 is intersected in drill core, on sections 250 W, 300 W and in sections 450 W 500 W and 550 W in the “Flame Structure”. In total, Unit 5 constitutes 17% of the feldspathic units in the SRLD. See Figure 7.3, Figure 7.4 and Figure 7.5 for project grid locations.
Unit 5 is a poorly foliated to semi-massive, commonly bi-minerallic, medium- to coarse-grained quartz-rich lithology, estimated to contain an average of 50% dark grey, glassy quartz mixed with blebs, patches and stringers of medium- to coarse-grained dark silvery green mica. Avalon reports that the elevated Li2O and Rb2O values in Unit 5 are attributable to lithian micas as this unit contains no obvious petalite.
| 7.3.1.4 | Unit 6: Petalite-bearing Pegmatite Zone |
Within the intermediate zone of the SRP the predominant lithology is the petalite-bearing Unit 6 (see Figure 7.3, Figure 7.4 and Table 7.3) . Avalon has subdivided this unit into four textural and compositional sub units.
48
Table 7.3
Subunits of Unit 6: Petalite Pegmatite
| Subunit | Rock type |
| Subunit 6a | Pegmatite: petalite – albite – potassium feldspar – quartz |
| Subunit 6b | Pegmatite: petalite – quartz – albite – potassium feldspar – mica |
| Subunit 6c | Pegmatite: petalite – quartz – albite – mica – potassium feldspar |
| Subunit 6d | Pegmatite: petalite – lepidolite (Li/Rb-rich mica)-albite-potassium feldspar |
Subunits 6a, 6b and 6c form the bulk of the petalite pegmatite.
Subunit 6a: Petalite-potassium feldspar-albite-quartz. This unit is characterized by an intense to protomylonitic foliation containing elongate lenses and layers (schlieren) and ribbon-like white petalite that give this subunit a streaked appearance. The schlieren themselves consist of coarse-grained and megacrystic, white web-textured, petalite, and coarse-grained potassium feldspar megacrysts all enveloped by silver-green lithian mica and a ground mass of fine-grained albite and quartz.
Subunit 6b: The characteristic features of Subunit 6b, the petalite-albite-potassium feldspar-mica zone, are strong to locally protomylonitic foliation, megacrystic to glomeroporphyritic textures, absence of schlieren, and the occurrence of pink petalite that shows an eastwards transition into blue-grey to blue-pink lenticular petalite.
Subunit 6c: Petalite-albite-mica-potassium feldspar. This is the most deformed subunit and is characterized by fine to medium-grained petalite and feldspar, in finely-banded mylonitic layers that locally anastomose around lenses of less-deformed coarse-grained petalite and feldspar. It is essentially a mylonitized version of Subunit 6b.
Subunit 6d: Contains significant proportions of petalite and between 10% to 25% lepidolite, a lithium- and rubidium-rich mica. This lepidolite-rich petalite and albite-petalite pegmatite phase occurs in a series of west-northwest striking, folded and interfingered dykes along the northern and eastern flank of the main SRLD petalite zone. It also occurs as a series of lenses and subparallel zones occurring to the northeast of the main SRLD petalite zone and connected to the aforementioned series, as a small zone to the northwest of the main SRLD, and as subordinate narrow dykes along the southern margin of the SRLD (Figure 7.3) . Subunit 6d is also found proximal to amphibolite screens as continuous narrow vertical zones, showing an eastward increase in thickness of the zones and lepidolite content.
Avalon has also recognized a crude north-to-south lateral zonation in petalite character from white ribbon-like petalite, seen in Subunit 6a, grading into coarse-grained pink and white petalite, seen in Subunit 6b, and the latter grading into blue-grey to pink-grey petalite in Subunit 6c. Transitional zones and interlayering are common between each subunit and the results of recent surface geological mapping show that folding has produced a repetition of Subunit 6a on the south side of Subunit 6b. The central and north portions of the main SRLD (Unit 6) end abruptly to the west, and thin to the east.
49
The petalite zone rock units are characterized by a heterogeneous texture and locally a strong to mylonitic foliation developed parallel to the primary compositional banding. Grain size and textural features vary from fine- to medium-grained (as seen in Subunits 6c and 6d), ribbon-like (as seen in Subunit 6a), and locally coarse and megacrystic (Subunits 6b and 6c). In many of the finer grained and mylonitized zones, as in Subunits 6c and 6b, petalite either resembles potassium feldspar or is too fine-grained to permit visual identification.
Through surface geological mapping and core drilling, Avalon has identified two petalite-deficient zones within the main petalite zone. One at the west end centred on 460W and the other to the east end centred on 350W (these lines are the original project grid lines shown on Figure 7.3) . The western unit is a combination of Units 4 and 5, whereas the eastern unit is reported to be texturally and mineralogically identical to the enclosing petalite zone but abruptly becomes completely devoid of petalite.
Discontinuous albitic dykes, commonly with petalite cores, occur in boudinaged, pinch-and-swell swarms proximal to the northern contact of the SRLD and the Western Pegmatite. Most are narrow and less than 1 m wide, with exceptions reaching 12 to 15 m in width and 150 m in length, including a lepidolite-rich dyke encountered in diamond drilling, and referred to as the Lepidolite Dyke.
Avalon reports that the SRLD and its proximal dykes exhibit zoning characteristics seen in other highly evolved rare-metal pegmatites, i.e., well-developed wall zones with exo- and endocontact borders and an internal intermediate petalite-rich zone. The exocontact border zones are discontinuous and narrow (1 to 10 cm) and comprise recrystallized amphibolite with abundant fine- to coarse-grained acicular holmquistite and cesium-rich biotite-phlogopite (glimmerite).
Pegmatitic granite dykes and larger elliptical intrusions related to the Separation Rapids Pluton outcrop at several locations on the property. These rocks (Unit 7) consist predominantly of white rubidium-rich potassium feldspar, with subordinate amounts of albite, green lithian muscovite, quartz, accessory garnet (spessartine), cassiterite, apatite, tantalum oxides and granite.
| 7.4 | STRUCTURALGEOLOGY |
Lithological units making up the SRLD, the amphibolite and Separation Rapids Pluton (see Figure 7.2) are characterized by a strong to locally mylonitic subvertically-dipping foliation. This foliation and associated ductile shear zones are heterogeneously developed parallel to the primary compositional banding and regional trend of the rare-metal pegmatite dykes and the SLMB during north-northeast to south-southwest regional compression. Centimetre- and metre-scale, tight to isoclinal folding and boudinage of dykes is abundant in the amphibolite and the SRLD.
A zone of intense deformation, indicated by well-developed mylonite, bifurcating and anastomosing around smaller less-deformed zones, occurs within the southern third of the SRP along an inferred reactivated regional-scale fault structure (see Figure 7.4) . This deformation zone continues westwards into the compositionally-similar Western Pegmatite and eastwards into albitite dykes of the Eastern Swarm.
50
A significant proportion of the original pegmatite minerals in the SRLD has been modified by ductile shearing and deformation. The tectonic modification of the original pegmatitic zoning and local obliteration of primary textures, secondary alteration and replacement textures, greatly hinders visual identification of such features in outcrop and drill core. In addition, deformation within the SRLD has also produced localized recrystallization and conversion of petalite into a polygonal, net-like (web-textured), mosaic of secondary medium- to coarse-grained petalite enveloped by fine-grained (100 μm) intergrowths of quartz+petalite+spodumene. This phenomenon might locally constitute as much as 20% of the petalite zone. However, the multiphase nature of the SRLD, the primary magmatic zonation and banding, and original petalite and feldspar crystals are all locally preserved.
Pegmatite and amphibolite screens within the main zone of the SRLD, and especially along its east flank, are complexly interfolded. Fold axial planes lie subparallel and parallel to the prominent foliation in the pegmatite. In pegmatite and amphibolite within the main zone of the SRLD and amphibolite outside of the main zone of the SRLD, these folds plunge steeply east-southeast, subparallel to all observed linear fabrics, i.e., mineral and intersection lineations. However, elongation of boudins is reported to be vertically oriented. The intensity of fold development and local variation in strain intensity are associated with local variation in composition and lithology.
Avalon has inferred that the widest part of the SRLD consists of a series of coeval zoned units that have been tectonically coalesced through isoclinal folding in a dilatant flexure.
Avalon reports that there are no large-scale faults parallel or crosscutting the SRLD and small-scale joints or faults are discontinuous, few in number and have insignificant offsets. The fold pattern is, on the scale of the whole pegmatite area, classic Type III interference as reported by Ramsay (1962).
| 7.5 | MINERALIZATION |
| 7.5.1 | Extent of Mineralization |
Geological mapping and diamond drilling show that the SRLD system has a strike length of over 1.5 km, and widths ranging from 10 to 70 m (see Figure 7.5) . To date, the SRLD has been intersected by drilling to a vertical depth of almost 275 m. The petalite-bearing pegmatite zones show little variation in true width between surface outcrop, up to 70 m, and up to 45 m for near-surface and the deepest intersected levels. These zones are open to depth.
The central portion of the SRLD is a low, dome-shaped hill, formed by the well-exposed main mineralized zone. It has a strike length of 600 m with a drill-tested vertical depth of at least 250 m. It forms the widest portion of the SRLD, averaging 55 m over a 300 m strike length.
51
As noted above, the SRLD has been divided into three sub-zones, namely the SRP, Western Pegmatite and Eastern Swarm (see Table 7.4 and Figure 7.5) .
Table 7.4
Main Zones Comprising the Separation Rapids Pegmatite Area
| Zone | Areal Extent | Length (m) | Width (m) | Geological Notes1 |
| SRP | 300W to 550W | 250 | up to 70 | See text. |
| Western Pegmatite | 550W to 1400W | 850 | up to 15, averaging 10 | Pervasive mylonitic fabrics obscure primary textures |
| Eastern Swarm | 100E to 300W | 400 | vertically continuous, 5 to 10 | Narrow, discontinuous albitic and petalite- rich dykes occurring in a swarm averaging 40 m in width. Wall rock to pegmatite ratios is in the order of 4:1 or greater. |
1 The areal extent refers to the original exploration grid coordinates, see Figure 7.3, Figure 7.4 and Figure 7.5.
Surface geological mapping and diamond drilling carried out by Avalon between lines 550W and 700W (see Figure 7.3, Figure 7.4 and Figure 7.5) show that the Western Pegmatite is the western continuation of the SRP, with the width narrowing significantly to 10 m and less. The western limit for the SRP is not definitively established due to poor exposure beyond the mapped portion of the Western Pegmatite. However, holmquistite is reported to occur in lithium-exomorphic haloes where it coats fractures in amphibolite outcrops west of Avalon’s claim block 1178306, indicating the likely proximity and westward continuation of the lithium-rich pegmatites.
The Eastern Swarm is interpreted by Avalon to represent the bifurcated extension of the southern part of the SRP.
Folded and deformed, discontinuous, albitite dykes and stringers are common to the north of the SRP, especially in proximity to the northwestern boundary in the vicinity of the Great White North pegmatite (see Figure 7.5) .
| 7.6 | MINERALOGY |
Companies currently mining rare-metal deposits containing spodumene, petalite and the other lithium-bearing silicate minerals, commonly quote reserves and resources in tonnes and percent Li2O rather than the proportion of minerals present. However, unlike the chemical industry, which is interested in Li2O and lithium carbonate, the glass and ceramics industry is predominantly interested in the major lithium-bearing minerals, which can be used directly in glass and ceramic production. In the case of the SRP, Avalon recognized that the modal content of the primary mineral petalite is critical to establishing the resources for the deposit, with Li2O content important in defining the grade of the final product.
52
Geological mapping and assays for surface and drill core samples indicate that mineralogy and Li2O grades of the mineralization in the SRP are relatively homogeneous throughout the petalite-bearing body. An example of this is seen in trench SLT-1 which extends across the widest part of the exposed zone; Li2O grades in this trench vary from 0.97 to 2.00% and average 1.58% over the 58.9 -m width. Mineralogy is obviously a critical concern for the Separation Rapids Project. A number of mineralogical studies have been carried out during the exploration of the Project including by commercial laboratories and also academic studies, such as those by Taylor, 1999a.
Rare-element pegmatites are a major source of lithium-bearing minerals (spodumene, petalite, amblygonite/montebrasite, eucryptite and lepidolite and lithian micas) used in the glass and ceramics industries. Lepidolite is also a major source for rubidium metal and formates. Sodium and potassium feldspars, also important to the glass and ceramics industry, are ubiquitous in these deposits. As well, rare-metal pegmatites are also the major source of tantalum, cesium and beryllium, found in oxide minerals such as wodginite, manganocolumbite and manganotantalite, pollucite and beryl, respectively.
In the SRP, petalite, potassium feldspar and sodium feldspar are major rock-forming minerals, with subordinate amounts of other minerals including spodumene, lithian muscovite, lepidolite, and quartz of which some occur as potentially economically recoverable minerals (see Table 7.5 and Table 7.6) . Other potentially economic minerals in the SRP that occur as accessory mineral phases include the tantalum bearing minerals, manganocolumbite and manganotantalite, and the tin bearing oxide, cassiterite. The tantalum minerals are finely dispersed through much of the petalite zones.
Table 7.5
Visual Mineral Estimates from 1997-98 Drill Core Logging
| Unit/ Subunit | Lithology | Petalite (Pet) (%) | Potassium Feldspar (Ksp) (%) | Albite (Alb) (%) | Quartz (Qtz) (%) | Spodumene (%) | Lepidolite (Lep) (%) | Li-Mica (Mica) (%) | Tantalum Minerals (%) | Cassiterite (%) |
| 3a | Albitite | 10 | 80 | 10 | Trace | trace | ||||
| 3b | Albite-Ksp | 20 | 70 | 10 | trace | Trace | trace | |||
| 4 | Megacrystic Ksp | 55 | 30 | 10 | 5 | |||||
| 5 | Qtz-Mica- Fspar | 10 | 10 | 50 | 30 | |||||
| 6a | Pet-Ksp- Alb-Qtz | 30 | 20 | 20 | 15 | 10 | 5 | trace | ||
| 6b | Pet-Alb- Ksp-Mica | 35 | 25 | 20 | 15 | 5 | ||||
| 6c | Pet-Alb- Mica-Ksp | 30 | 20 | 20 | 15 | 10 | 5 | 5 | Trace | |
| 6d | Pet-Lep- Alb-Ksp | 30 | 25 | 15 | 15 | 15 | <1 |
| 7.6.1 | Mineralogy – Pedersen Modal Estimates from Core Logging |
Rare accessory mineral phases in the SRP include topaz and zircon, while the tantalum-bearing minerals ferrocolumbite and microlite, rare earth-bearing minerals thorite, monazite, and xenotime, the zinc-aluminum oxide granite, an unidentified uranium-lead oxide, calcite, and the sulphides bismuthinite, sphalerite and arsenopyrite occur as very rare accessory minerals.
53
During the core logging completed in 1997-1998 Pedersen estimated the modal percentages of the minerals present in the mineralized body (see Table 7.5) . The estimates were collated into a Microsoft Excel spreadsheet and submitted to Avalon (Pedersen, 2016a).
Pedersen’s drill report notes the following (Pedersen, 1998a):
“Four core samples from the Big Whopper were submitted to Lakefield Research of Lakefield, ON, for polished thin sectioning and petrographic study. Specifically, the study identified the mineralogy and textural relationships of four recognizable subunits of the Petalite Zone. In addition, a search to identify the presence of fluid inclusions was requested due to the presence of a strong propane-like odour emanating from certain petalite types when struck or broken. Lastly, the study was to identify any secondary or alteration features.
Thin sections verified to a large degree the macroscopically determined mineralogy and cataclastic fabrics. Interestingly, K-feldspar was not identified in these samples; it is highly probable that due to the coarse to megacrystic nature of the K-feldspar, core was deliberately cut to avoid megacrysts, to the exclusion of K-feldspar in the sample. This indicates that K-feldspar can be expected to be found as coarse crystals and not as fine interstitial grains.
Albite was found to be very common and primary, with no recognized secondary albite typically found in the tantalum zones of Tanco. Quartz was another common interstitial mineral, belying the field observed paucity of this mineral. Petalite is found as the most abundant constituent in three of the four samples, averaging 30% by volume. It is partially altered along cleavage boundaries locally, generally by mechanical grinding with lesser hydrothermal alteration to clay in one sample. Two samples show abundant fluid inclusions, which are likely the source of the propane-like odour.
Only minor secondary features were noted, mainly as alteration along petalite cleavage planes. One sample identified eucryptite as an alteration product of albite.
Li-bearing (postulated) mica is seen to be a significant constituent in the samples submitted, averaging 15% in interstitial aggregates and enclosed in albite.
Trace fine grained Ta-Nb-Mn oxides, likely mangano-tantalite, were observed in three samples in various associations: inclusions in petalite; interstitial to quartz, albite, and petalite; and with mica.”
| 7.6.2 | Mineralogy – Studies by Pedersen |
Specific X-ray diffraction (XRD) and scanning electron microprobe (SEM) studies were also reported by Pedersen, 1998a:
54
“Seven samples, three from outcrop at the centre of trench SLT-1, and four from drill core, were collected for specific mineral phase identification by X-ray diffraction (XRD) by Pedersen. One sample from trench SLT-1 was further investigated by scanning electron microprobe (SEM). This work was done using the facilities of the Department of Geological Sciences at the University of Manitoba in Winnipeg.
Minerals identified or confirmed by XRD include:
| • | Petalite, pink. | |
| • | Petalite, green. | |
| • | Petalite, blue-grey. | |
| • | Cassiterite, lustrous red-black with flat diamond shaped cross-section. | |
| • | Spodumene, greenish grey, splintery, pearly lustre. | |
| • | Nontronite, a pink Fe-clay of the Smectite group (Montmorillonites).This may not be a correct identification because of the difficulty ofdetermining clay structures by XRD. Associated with petalite, likely acleavage plane alteration. |
The sample investigated by SEM contained pink petalite, fine green mica, albite, and K-feldspar.
Single points were tested on petalite, K-feldspar, and albite, and three points on mica. No elemental substitution was identified in petalite; iron and manganese were not detected, indicating the pink variety of petalite to be very pure. K-feldspar was found to be highly enriched in rubidium, with 1.5 wt.% Rb. Mica is significantly enriched in Rb and F, with an average 2.14 wt.% Rb and 1.369 to 4.139 wt.% F. Iron (Fe2O3) ranges from 2.8 to 5.4 wt.% Fe2O3, and manganese from 0.661 to 1.659 wt.% Mn. No gallium (Ga) or Rb was detected in albite.
One polished thin section was examined by XRD by Lakefield, which confirmed constituent minerals to be petalite, quartz, albite, plagioclase, mica, and K-feldspar.”
| 7.6.3 | Mineralogy – Studies by Taylor |
| 7.6.3.1 | Mineralogical and Geochemical Determination of Petalite Content |
In 1999, Avalon, through Dr. Richard Taylor at Carleton University in Ottawa, carried out a comprehensive mineralogical and geochemical study of SRP drill core, surface samples and some sub-samples of mineral concentrates. Forty samples from drill holes SR97-02, SR97-03 and SR98-57 from section 460W, the widest portion of the SRP, and two samples from the lepidolite dyke, Subunit 6d, were analysed.
This study identified and chemically characterized the essential and accessory mineral phases present in the petalite-bearing lithologies of the SRP (Figure 7.6) . Analytical techniques used are listed in Taylor (1999a). The constituent minerals of the SRP are listed in Table 7.6.
55
The average modal abundance of petalite in Subunits 6a, 6b, 6c and 6d as estimated by Taylor in this preliminary study were:
| Subunits 6a and 6b | 30% | |
| Subunit 6c | 34% | |
| Subunit 6d | 37% |
Table 7.6
Constituent Minerals of the Separation Rapids Pegmatite
| Mineral | Chemical Formula | Relative Abundance | Physical Characteristics |
| Major Minerals | |||
| Petalite | LiAlSi4O10 | 30%1, 22-47% with an average of 37%2, 20- 35%5. | Typically, translucent, light pink on fresh surfaces and light brown on weathered surfaces. Avalon has recognized five varieties of petalite. (a) Milky-white to grey web-textured, (b) pink coarse lenticular, c) blue-grey to blue-pink lenticular, (d) Green to blue green associated with orange potassium feldspar, (e) Clear to glassy green, rare and associated with lepidolite and coarse-grained segregations of white petalite. Grey milky-white petalite occurs in zones of extensive recrystallization. Pink petalite is rare. SG 2.41-2.42. |
| Spodumene | LiAlSi2O6 | 0-13% in Subunit 6a. | Visual estimation of outcrops and core indicate that primary spodumene is rare in the SRP. Very difficult to tell in Units 6c and 6a probably contains the most spodumene (Pedersen, 2016b). Average intergrowth grain size is <500 m. SG 3.03-3.22. |
| Lepidolite | (K, Rb)(Li, Al)2(Al,Si)4O10(OH, F)2 | (15%1), 10-25%4 in Subunit 6d. | All micas contain lithium. The lepidolite (fine-grained and purple) and lithian micas are predominantly in unit 6d but occur throughout the SRP. Lakefield study included lithian mica and lepidolite. SG 2.80-2.90. |
| Lithian muscovite | K(Al, Li)2(Al, Si)4O10(OH, F)2 | 4-7% in the petalite zone.5 | Fine-grained green mica. SG 2.90-3.02. |
| Microcline | (K,Rb)AlSi3O8 | 15-20%4, >20%5, 35- 40% in Units 4 and 7, 5- 20% in Subunit 3b, lower in 3a. 15-20% in Unit 5. 2 - 33% in Unit 4 and Subunits 3a, 3b6 mean value 21%5 | White to grey and containing between 1 and 4% Rb. Taylor’s study shows an average of 1.82%. SG 2.56- 2.63. Mean content for potassium feldspar in Unit 4 and Subunits 3a and 3b is 21% These are high-purity end- member feldspars evidenced by low iron (less than 0.03% Fe2O3, extremely low sodium (average 0.38% Na2O) and low phosphorus (0.06 - 0.24% P2O5). |
| Albite | NaAlSi3O8 | 20-25% in Units 4 and 7, 50-80% in Subunit 3b, higher in 3a. 0% in Unit 5.5 21-77% in Unit 4 and Subunits 3a, b6 25-30% in Unit 6 | SG 2.62-2.63. Mean content for albite in Units 4, 3a, 3b is 44%. As with the potassium feldspars, the albites are high- purity end members with very low concentrations of Fe, Ca and K. |
| Quartz | SiO2 | 5-10%3in the potassium feldspar-petalite and aplite units. Recently6: 20-30% in Unit 6. 10-20% in Subunits 3a and 3b. 35- 40% in Units 4 and 7 and up to 60% in Unit 5.5 | SG 2.65. |
56
| Mineral | Chemical Formula | Relative Abundance | Physical Characteristics |
| Spessartine garnet | (Mn>Fe)3Al2Si3O12 | Light orange to red brown and pervasively disseminated throughout the SRP | |
| Common Accessory Minerals | |||
| Manganocolu mbite | (Mn>Fe)(Nb>Ta)2O6 | Tin- tantalum- and niobium-bearing oxide phases occur as sparsely disseminated brown to black specks and aggregates that may reach up to 0.5 by 1.2 cm in size. | |
| Manganotant alite | (Mn>Fe)(Ta>Nb)2O6 | ||
| Cassiterite Fluorapatite | SnO2(Ca, Mn)5(PO4)3F | ||
1Results from SGS, 2013 study of four core samples.
2Inferred petalite content for the SRP based on visual estimates and Li2O assay extrapolation (Pedersen 1998a).
3Breaks and Tindle, 1997.
4Visually estimated by Avalon.
5Visually estimated by Avalon from thin sections (Taylor, 1999a).
6Taylor, 1999a.
Petalite from the SRP is remarkably close to the ideal theoretical chemical composition, as well as being very pure, with marked absence of deleterious elements such as iron. An average petalite analysis is provided in Table 7.7.
Table 7.7
Petalite Composition
| Oxide | SiO2 | Al2O3 | Total Fe | MnO | CaO | Na2O | K2O | Li2O |
| Wt.% | 77.93 | 16.24 | 0.01 | 0.01 | 0.02 | 0.01 | 0.01 | 4.78 |
Taylor 1999a.
The average Li2O content of 4.78% for SRP compares to the stoichiometric value of pure petalite at 4.88% Li2O.
As reported in Micon, 1999, the petalite content in the SRP was originally determined by using a combination of visual estimates, observations from outcrops and drill core, and stoichiometric extrapolation of Li2O whole rock assays. Avalon determined that the Li2O grades in its preliminary resource estimation were consistent with the main zone of the SRP containing a chemically-derived modal petalite content ranging from 22% to 47%. This modal content range was corroborated by Li2O and Rb2O assays from continuous chip samples from trenches SLT-1 to SLT-5, which were reported to be consistent with visual estimates of petalite and potassium feldspar contents of approximately 30% each. The average Li2O content and estimated percent petalite in the four main pegmatite masses, representing most of the strike length of the SRLD, shown in Table 7.8, are also remarkably consistent. However, the latter values are higher than those obtained for the chip samples from trenches SLT-1 to SLT-5.
57
Table 7.8
Average Li2O Content and Estimated Percent of Petalite
| Pegmatite | Percent Li2O/Width (m) | Calculated Petalite Content (%) |
| SRP | 1.58/59.8 | 37 |
| Great White North | 1.78/1.43 | 41 |
| Bob’s Pegmatite | 1.67/15.2 | 39 |
| Western Pegmatite | 1.56/8.3 | 36 |
Breaks and Tindle, 1997.
Although the results of Avalon’s preliminary work and Taylor’s studies in 1998 and 1999 show a good correlation of average Li2O grades determined for the SRP, chemically-derived modal abundances are imprecise. Taylor, (1999a) reported that whole-rock analyses might not necessarily be indicative of the true petalite content in the SRP due to the following:
| • | No attempt was made to adjust calculations to take into account the presence of other lithium-bearing minerals, e.g., spodumene, lepidolite and lithian micas in the SRP. | |
| • | Representativeness of samples is difficult to maintain when the lithologies are coarse- grained (pegmatitic). | |
| • | Visual identification of petalite, both in drill core and outcrop, is difficult due to similarities between petalite and sodium feldspar, with which it is intimately associated, and the effects of cataclasis and grain size reduction. | |
| • | Li2O content has been shown to decrease in petalite that has undergone incipient or mechanical alteration, and clay-altered petalite might produce and account for lower than expected Li2O values in drill core where visual estimation indicated the potential for higher than normal Li2O assays. | |
| ||
| • | Taylor’s preliminary results should be applied to section 460W of the SRP alone, even though samples from section 460W are considered by Avalon to be representative of the entire petalite zone of the SRP. | |
| • | The obtained modal abundances from Taylor’s preliminary mineralogical and geochemical study were intended to provide broad estimates of the mineral content. |
| 7.6.3.2 | Quantitative Modal Analysis |
A petrographic and mineralogical study of eleven drill core samples spanning the length and width of Unit 6 of the SRP, with both near surface and deeper intercepts, was undertaken by Taylor and the results shown in Table 7.9 (Taylor, 1999b). The locations of drill holes used for mineralogical studies are shown in Figure 7.6.
58
Table 7.9
Representative Samples from Unit 6 of the Separation Rapids Pegmatite
| Sample Number | Section | DDH | From-To (m) | Length (m) | Subunit | Li2O (%) |
| 236562 | 450 W | 97-02 | 23.00-26.00 | 3 | 6a | 1.66 |
| 236829 | 350 W | 97-07 | 34.00-36.00 | 2 | 6b | 1.51 |
| 236940 | 500 W | 97-09 | 12.00-14.00 | 2 | 6b | 1.31 |
| 237017 | 500 W | 97-09 | 56.00-58.00 | 2 | 6b | 1.84 |
| 237200 | 300 W | 97-18 | 71.00-73.00 | 2 | 6c, 6a | 1.89 |
| 51044 | 275 W | 98-32 | 48.00-50.00 | 2 | 6c | 1.41 |
| 51138 | 325 W | 98-35 | 38.80-40.00 | 1.2 | 6a | 1.05 |
| 51239 | 375 W | 98-37 | 79.00-81.00 | 2 | 6c | 1.52 |
| 51385 | 425 W | 98-40 | 100.00-102.00 | 2 | 6a, 6c | 1.54 |
| 51400 | 425 W | 98-41 | 14.00-17.00 | 3 | 6a | 1.36 |
| 51486 | 475 W | 98-43 | 34.00-36.00 | 2 | 6a, 6c | 1.48 |
Taylor, 1999b.
polished grain mounts of aliquots from the original drill core assay samples. The investigation was undertaken to establish the modal abundance of the primary minerals petalite, potassium feldspar, albite, mica, spodumene and quartz. The detailed results of the study are given in Taylor (1999b) and are summarized below in Table 7.10. Note that these data exclude Subunit 6d which is high in lepidolite.
Table 7.10
Results of the Modal Point Count Analysis of Unit 6 Lithologies
| Mineral | Modal Range (%) | Mean (+ 5%) | Lakefield Study Feed (%) |
| Petalite | 19-36 | 25 | 21.8 |
| Potassium feldspar | 7-17 | 10 | 9 |
| Sodium feldspar (albite) | 22-30 | 27 | 30.7 |
| Mica (lepidolite and Li-micas) | 8-16 | 11 | 11.1 |
| Spodumene | 0-13 | 1 | 3.9 |
| Quartz | 18-33 | 25 | 23.5 |
Taylor 1999b, Lakefield, 1998, Micon, 1999.
The spodumene content is typically low, from 0 to 2%, but highly variable; where petalite has been replaced by spodumene, it can be as much as 13%. This replacement phenomenon appears to be randomly distributed throughout the SRP. All the micas identified in the above study are fluorine-rich and therefore considered to be lepidolite or lithian micas (muscovite does not contain fluorine).
59
Figure 7.6
Location of Drill Holes Used for Mineralogical Studies
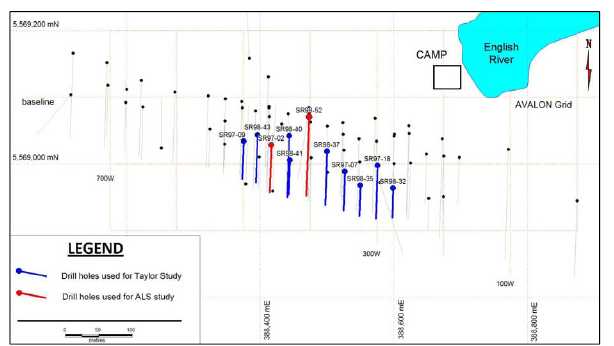
Note: “Camp” refers to location of original exploration camp. Micon, 2016.
Although limited to eleven samples, the results nevertheless show that petalite content in the SRP is laterally and vertically consistent, with minimal significant changes apart from local increases in spodumene as a result of petalite replacement. While the error on the mean values for modal contents of these minerals is reported to be in the region of ±5%, the means and ranges are close to those obtained in Avalon’s preliminary estimates and correspond closely with the feed determined from the Lakefield metallurgical study (Lakefield, 1998).
| 7.6.3.3 | Feldspars |
Potassium feldspars in the SRP have been shown to be rubidium-rich, high-purity end-members (Taylor, 1999b).
Avalon’s preliminary geochemical study of the petalite-bearing lithologies showed that microcline contains very high concentrations of rubidium ranging from 1.51 -2.78% Rb2O, with an average of 1.82% (Pedersen, 1997). The study also showed that the petalite zone microclines (potassium feldspar) have low iron concentrations, less than 0.03% Fe2O3, and relatively low concentrations of Na2O (0.28 - 0.46 %). As well, Taylor (1998) notes that perthitic intergrowth of albite and microcline feldspars, a common feature of pegmatites, is not well-developed in microcline in the SRP.
Sodium feldspar (albite) in Unit 6 is also low iron, less than 0.03% Fe2O3, low in CaO (0.47%) and K2O (less than 0.15%) .
60
Drill core assays of Unit 6 lithologies indicate an average overall whole rock grade of 0.35% Rb2O, it appears that about half the rubidium is contained in potassium feldspar (microcline), and half in mica species. The exception is the lepidolite-rich Unit 6 lithologies, specifically Subunit 6d where it is likely that much of the rubidium is in lepidolite. Analysis of individual potassium feldspars show that this mineral is rich in both rubidium, in the range of 1.51 to 2.78% Rb2O, equivalent to 1.38 to 2.54% rubidium metal, and potassium, in the range of 15.62 to 16.47% K2O.
Avalon initially considered that Rb2O grades indicated a chemically-derived potassium feldspar modal content averaging approximately 15-20%, or more (Pedersen, 1998a). Taylor’s petrographic study showed that this estimate is high is due to the presence of lepidolite and lithium mica (Taylor, 1998).
The SRP feldspathic units (Units 3, 4, and 7) also contain elevated Rb2O contents comparable to the petalite zone (Unit 6) lithologies. Preliminary detailed analysis of potassium feldspars from these units show that they are chemically similar to the petalite zone feldspars and indicates that the feldspathic zone units constitute a further potentially economic source of this mineral (Pedersen, 1998a).
Further detailed petrography of the feldspathic zone units is required for a better understanding of the potentially economic feldspar content and quality.
| 7.6.4 | Mineralogy – ALS (QEMSCAN®) Study |
In 2016, Avalon submitted eight samples of crushed drill core to the ALS Environmental (ALS) laboratory in Kamloops, British Columbia for QEMSCAN® analysis of mineralogy (ALS, 2016). ALS completed QEMSCAN® analysis of the eight samples and submitted the data to Avalon as an Excel spreadsheet. In addition, one XRD analysis was completed of an individual sample for comparison purposes. The XRD analysis was completed at Department of Earth, Ocean and Atmospheric Sciences at University of British Columbia. The XRD results are presented below (Table 7.11) . The XRD diffraction data is useful because the method can identify petalite whereas QEMSCAN® cannot definitively identify petalite due to its inability to analyse light elements like lithium.
The analyses for XRD account for 100% of the mineral content, a satisfactory total considering that some minerals such as tantalite, topaz and others are not measured by this method.
61
Table 7.11
X-Ray Diffraction Analysis of Sample 862938 from Separation Rapids
(Percent mineral content)
| SAMPLE_ID | Petalite | Plagioclase | K-Feldspar | Total Feldspar | Illite- Muscovite | Quartz | |
| XRD | 862938 | 33.00 | 31.00 | 8.40 | 39.40 | 6.20 | 18.30 |
| SAMPLE_ID | Pargasite | Dolomite/ Ankerite | Calcite | Schorl | Sillimanite | ||
| XRD | 862938 | 1.20 | 0.60 | 0.50 | 0.40 | 0.40 |
Note: Sample from drill hole SR98-52 at 163.78 -166 m. ALS, 2016.
Table 7.12 gives the results of the QEMSCAN® analysis for the eight samples, with the lithological subunit specified.
62
Table 7.12
QEMSCAN®MineralogicalAnalysis by ALS
(Percentmineralcontent)
| Hole Number | From (m) | To (m) | Interval (m) | Lithological Subunit | Sample Number (2016) | Sample Number (1997-8) | Quartz | Muscovite | Albite | Potassium Feldspar | Aluminum Silicate (Petalite) |
| SR98-52 | 157.10 | 158.65 | 1.55 | 6a | 862932 | 51800 | 32.5 | 10.0 | 30.1 | 8.8 | 17.0 |
| SR97-2 | 5.00 | 8.00 | 3.00 | 6a | 862944 | 236555 | 31.3 | 8.5 | 24.0 | 12.4 | 21.9 |
| SR97-2 | 32.00 | 35.00 | 3.00 | 6b | 862947 | 236566 | 24.1 | 12.1 | 26.5 | 11.4 | 24.6 |
| SR97-2 | 35.00 | 37.90 | 2.90 | 6b | 862948 | 236567 | 23.1 | 13.2 | 25.1 | 9.3 | 28.0 |
| SR97-2 | 47.40 | 48.30 | 0.90 | 6c | 862953 | 236574 | 22.2 | 9.7 | 33.2 | 10.1 | 23.8 |
| SR97-2 | 80.70 | 81.90 | 1.20 | 6c | 862964 | 236591 | 25.5 | 14.1 | 28.9 | 8.1 | 22.6 |
| SR98-52 | 84.05 | 86.05 | 2.00 | 6d | 862922 | 51762 | 24.0 | 14.5 | 30.5 | 8.9 | 21.0 |
| SR98-52 | 163.78 | 166.00 | 2.22 | 6d | 862938 | 51807 | 18.9 | 7.9 | 27.6 | 10.0 | 31.7 |
| Hole Number | From (m) | To (m) | Interval (m) | Lithological Subunit | Sample Number (2016) | Topaz | Apatite | Others | Total | Elemental Iron (Tramp Iron) | |
| SR98-52 | 157.10 | 158.65 | 1.55 | 6a | 862932 | - | 0.1 | 0.6 | 99.9 | 0.5 | |
| SR97-2 | 5.00 | 8.00 | 3.00 | 6a | 862944 | <0.1 | 0.1 | 1.0 | 99.9 | 0.3 | |
| SR97-2 | 32.00 | 35.00 | 3.00 | 6b | 862947 | <0.1 | 0.1 | 0.4 | 99.9 | 0.4 | |
| SR97-2 | 35.00 | 37.90 | 2.90 | 6b | 862948 | - | 0.2 | 0.3 | 100.0 | 0.4 | |
| SR97-2 | 47.40 | 48.30 | 0.90 | 6c | 862953 | - | 0.1 | 0.3 | 100.0 | 0.3 | |
| SR97-2 | 80.70 | 81.90 | 1.20 | 6c | 862964 | - | 0.1 | 0.3 | 99.9 | 0.3 | |
| SR98-52 | 84.05 | 86.05 | 2.00 | 6d | 862922 | 0.1 | 0.2 | 0.4 | 99.9 | 0.2 | |
| SR98-52 | 163.78 | 166.00 | 2.22 | 6d | 862938 | 1.3 | 0.2 | 0.4 | 99.9 | 0.3 | |
ALS, 2016.
63
Comparisons of the average ALS QEMSCAN® data and the Pedersen estimates are given in Table 7.13 for Subunits 6a, 6b, 6c and 6d. This illustrates the range of estimated mineral contents in each unit.
Table 7.13
Mineral Modal Abundance: Comparison of ALS QEMSCAN® with Pedersen (2016) Visual CoreEstimates
| Subunit | Lithology | Pedersen Estimates (%) | ALS QEMSCAN®and XRD (%) | ||||||||
| Petalite (Pet) | K- Feldspar (Ksp) | Albite (Alb) | Total Feldspar | Quartz (Qtz) | Spodumene | K- Feldspar (Ksp) | Albite (Alb) | Total Feldspar | Quartz (Qtz) | ||
| 6a | Pet-Ksp- Alb-Qtz | 30 | 20 | 20 | 40 | 15 | 10 | 10.68 | 26.55 | 37.23 | 32.95 |
| 6b | Pet-Alb- Ksp-Mica | 35 | 25 | 20 | 45 | 15 | 11.75 | 28.36 | 40.11 | 22.48 | |
| 6c | Pet-Alb- Mica-Ksp | 30 | 20 | 20 | 40 | 15 | 10 | 10.62 | 35.14 | 45.76 | 20.20 |
| 6d | Pet-Lep- Alb-Ksp | 30 | 25 | 15 | 40 | 15 | 7.97 | 30.32 | 38.29 | 21.33 | |
Pedersen, 2016a; ALS, 2016.
A similar comparison, but of the averages of subunits 6a, b and c for Pedersen, Taylor, Lakefield and ALS, are given in Table 7.14, averaged for Subunits 6a, 6b and 6c. Subunit 6d is excluded because of its enhanced lepidolite content. In viewing this data, it must be noted that the number of samples in each study is relatively small and the range of results may simply be due to the inherent variability in the material and the small sample number.
Table 7.14
Average Mineral Contents Estimated by Pedersen, Taylor, Lakefield and ALS
| Mineral | Pedersen Average 2016a (%) | Taylor Modal Range 1999a (%) | Mean Taylor (%) | Lakefield 1999 (%) | ALS QEMSCAN® 2016 (%) |
| Number of samples | NA1 | 11 | 11 | 4 | 16 |
| Petalite | 31.3 | 19-36 | 25.0 | 21.8 | 24.2 |
| Potassium feldspar | 22.5 | 7-17 | 10.0 | 9.0 | 10.3 |
| Albite | 18.8 | 22-30 | 27.0 | 30.7 | 30.1 |
| Total feldspar | 43.3 | 29-47 | 37 | 39.7 | 40.4 |
| Mica (lepidolite and Li-micas) | 15.0 | 8-16 | 11.0 | 11.1 | 9.4 |
| Spodumene | 5.0 | 0-13 | 1.0 | 3.9 | NA2 |
| Quartz | 15.0 | 18-33 | 25.0 | 23.5 | 24.2 |
1 Not applicable.
2 Not available.
In conclusion, the various mineralogical investigations show similar estimates of mineral content for a range of samples. In particular the mean estimates of Taylor, Lakefield and ALS of the total feldspar content average 39% for the two means and representing a total of 28 samples examined of four different lithologies of Subunits 6a, 6b, 6c and 6d. This average of 39% for individual samples can be compared to two metallurgical bulk samples of Unit 6 that averaged 40.7% total feldspar when analysed by QEMSCAN®.
64
Pedersen’s average of 43.3% total feldspar is higher but illustrates the difficulty of accurately estimating mineral percentages during visual examination of drill core using a hand lens where some minerals in some cases have been subjected to shearing and mylonite textures. In particular, when albite and potassium feldspar are fine-grained distinguishing the two is challenging.
The representivity of the feldspar content measurements given in this report can be considered by reference to Figure 7.7. Eleven drill holes have had quantitative mineralogy of which Taylor (1999a) examined SR97-02, -07, -09, -18 and SR98-32, 35, 37, 40, 41, 43 while ALS analysed SR97-02 and SR98-52. Lithologies were covered to the extent of seven samples of Subunit 6a, five samples of Subunit 6b, five samples of Subunit 6c and three samples of Subunit 6d. As a result, it can be considered that the drill holes studied cover most of the strike length of the deposit and all subunits of Unit 6 were studied. Thus, the conclusions are considered to be representative of the deposit.
Figure 7.7
Drill Holes with Samples with Measured Quantitative Mineralogy
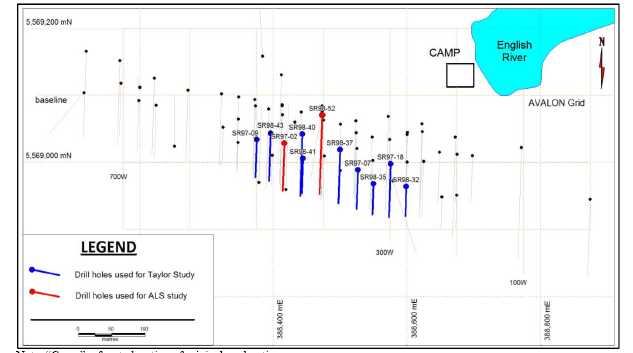
Note: “Camp” refers to location of original exploration camp. Micon, 2016.
Avalon has completed further QEMSCAN analysis of about 50 drill core assay samples in order to understand the distribution of the economically important minerals. The results of this work show that the average petalite content ranges from 21% to 28% and the lepidolite content in Subunit 6d averages about 11%. However, it should be kept in mind that these percentages are only representative of the samples analysed and the overall deposit may differ somewhat from these numbers.
65
The distinction between micas with high and low iron content noted in Table 7.15 is presented as it is believed that the low iron micas include lepidolite, the distinctive red coloured high lithium mica in Subunit 6d (see further discussion below in the section on micas).
Table 7.15
Abundance of Minerals (%) as Determined by QEMSCAN® Analysis on Drill Core Assay Samples
| Lithology | Count | Petalite | Spodumene | Quartz | Plagioclase | K-Spar | High Fe Mica | Low Fe Mica | Total |
| 6a | 18 | 20.5 | 1.66 | 25.5 | 27.0 | 9.9 | 8.1 | - | 92.7 |
| 6b | 8 | 28.2 | 0.00 | 21.4 | 28.5 | 9.4 | 11.5 | - | 98.9 |
| 6c | 11 | 23.0 | 0.01 | 22.6 | 32.6 | 8.4 | 9.0 | - | 95.6 |
| 6d | 12 | 21.1 | 0.00 | 22.7 | 33.6 | 6.5 | 0.0 | 11.3 | 95.1 |
Table 7.16 shows the various estimates of mineral abundance with the most recent QEMSCAN®values added. As can be seen there is good agreement between the various estimates.
Table 7.16
Average Mineral Contents Estimated by Pedersen, Taylor, Lakefield, ALS and SGS
| Mineral | Pedersen Average 2016a (%) | Taylor Modal Range 1999a (%) | Mean Taylor (%) | Lakefield 1999 (%) | ALS QEMSCAN® 2016 (%) | SGS QEMSCAN®1 2017/18 (%) |
| Number of samples | NAP1 | 11 | 11 | 4 | 16 | 49 |
| Petalite | 31.3 | 19-36 | 25 | 21.8 | 24.2 | 21.57 |
| Potassium feldspar | 22.5 | 7-17 | 10 | 9 | 10.3 | 9.82 |
| Albite | 18.8 | 22-30 | 27 | 30.7 | 30.1 | 32.21 |
| Total feldspar | 43.3 | 29-47 | 37 | 39.7 | 40.4 | 42.03 |
| Mica (lepidolite and Li-micas) | 15 | 8-16 | 11 | 11.1 | 9.4 | 8.29 |
| Spodumene | 5 | 0-13 | 1 | 3.9 | NA2 | 2.05 |
| Quartz | 15 | 18-33 | 25 | 23.5 | 24.2 | 22.93 |
1For this analysis, SGS provided Avalon with Excel spreadsheets of the data and the statistics were completed by Avalon. There is no report to be referenced.
| 7.6.5 | Tantalum, Tin and Niobium |
Tantalum occurs in a number of different, fine-grained tantalum bearing minerals (Table 7.5), but discrete tantalum-rich zones have not been encountered. To date, trace to minor amounts of tantalum have been found in albite-rich rocks and in the lepidolite-rich zones within the SRP.
Metallogenic zoning within the SRP is closely related to mineralogical zoning. Lithium and rubidium enrichment occur in zones where tantalum and cesium are excluded. The exception to this is in Subunit 6d where the tantalum content is elevated to several hundred ppm.
66
Tantalum is also sporadically elevated in the albitic dykes wherever lithium and rubidium values are depressed.
Preliminary mineralogical and geochemical studies (Taylor, 1999a) showed that the mineral columbite-tantalite, (Mn,Fe)(Nb,Ta)2O6, is typically manganese-rich, widespread and comprises about half of the accessory mineral population in any given sample. Taylor (1999a) also identified the presence of microlite as an important mineral in terms of abundance, and this is also a manganese-rich tantalum mineral.
The average Ta2O5 contents for the petalite zone lithologies are:
| Subunits 6a & 6b | 0.009% Ta2O5 | |
| Subunit 6c | 0.009% Ta2O5 | |
| Subunit 6d | 0.010% Ta2O5 | |
| Unit 6 combined | 0.009% Ta2O5 |
Importantly, the instrumental neutron activation analysis (INAA) tantalum results from Taylor’s 1998 study were as much as 30% higher than those obtained by ICP in the original assaying program. Taylor suggests that the INAA results are more accurate and indicate that tantalum values in the SRP might be higher than originally thought.
The study also showed that cassiterite (SnO2) is locally abundant and represents from 4% to 70% of the accessory mineral population in the samples analysed and it appears to be relatively more abundant in near surface samples from section 460W. Taylor reported that the Ta2O5 content of the tin mineral cassiterite is typically low (less than 1.5%) . Cassiterite distribution is much more irregular than that of columbite-tantalite. It was noted that cassiterite occurs largely within peripheral albitic dykes.
| 7.6.5.1 | Micas |
Preliminary mineralogical and geochemical studies (Taylor, 1998) showed that the SRP micas carry very high concentrations of rubidium (2.46 -3.92% Rb2O in silvery mica and 4.36 -4.54% Rb2O in purple micas).
Further study of the micas has been completed by Avalon including funding of Laser Ablation – ICP (LA-ICP) mineral analysis by Professor Cliff Stanley at Acadia University in Nova Scotia. The results of this work have not been published to date and the information presented here is from personal communication with Professor Stanley.
The LA-ICP analyses have shown that the micas present in the SRLD have a complex range of compositions and vary from subunit to subunit. The details of the composition variations are not presented here, but the relationship of Li2O and FeO content to subunit is shown in Figure 7.8 to illustrate the following points:
| • | There are at least three major distinct trends in mica composition. |
67
| • | Each of Subunits 6a, b and d have their own distinct trend. | |
| • | Subunit 6c overlaps with 6a and b. | |
| • | The Li2O content of the micas ranges widely from very low to over 6%. The highest Li2O values are in the micas found in Subunit 6d. This includes the pink to red mica referred to as lepidolite that is the distinctive identifying feature of Subunit 6d. The micas in Subunit 6d are also distinctive in their relatively low FeO content. |
Figure 7.8
LA-ICP Analysis Results for FeO and Li O on Micas from Subunits 6a, b, c and d
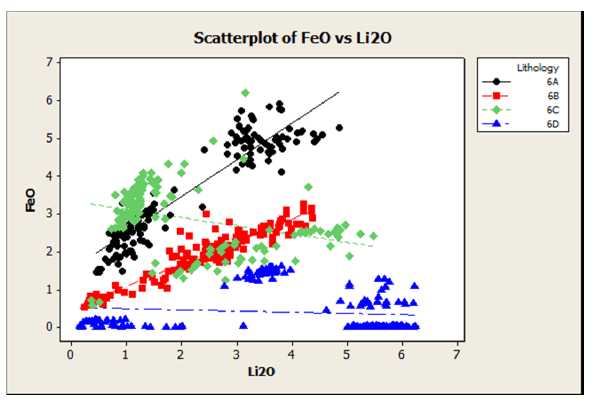
| 7.6.5.2 | Potentially Deleterious Elements |
The SRP petalite is very pure and chemically close to that of the stoichiometric petalite composition. Importantly, the iron content is extremely low, averaging 0.01% Fe2O3, with a maximum of 0.4% Fe2O3. Fluorapatite occurs as an accessory phase within the SRP and is the major source of the phosphorus detected in drill core assays. The SRP has very low P2O5 content as shown by bulk analyses of trench STL-1 samples (range 0.02 to 0.09% P2O5, and average 0.04% P2O5 with one sample of albitic wall-rock assaying 0.22% P2O5). A P2O5 content of greater than 1% is considered deleterious in feldspar, spodumene and petalite concentrates used in the ceramics industry.
68
| 7.7 | PATERSONLAKECLAIMS, COVERINGGLITTER, WOLF, RATTLER ANDSNOWBANKPEGMATITES |
This group of pegmatites is about 5 km west of the SRLD, or about 3 km west of the Big Mack Pegmatite system and with the exception of the Snowbank pegmatite, is described in the publication by Clark, 2016, for GoldON Resources Ltd. (GoldON). It was not specifically identified as a group by Breaks and Tindle, 2001, and it lies west of any pegmatites referred to by those authors. The property was acquired by Avalon in 2017.
The region including and beyond the claim group has had intermittent exploration for base metals and gold associated with volcanogenic iron formation and silicified shear zones since 1947, and more recently (late 1990's) for rare-metal pegmatites with the discovery of the Big Whopper pegmatite in 1996. Previous work comprised the following:
| • | 1947: Base metals reported by Thomson (Gauthier occurrence) at the west boundary of the claim block. | |
| • | 1987-1992: Champion Bear Resources: Mapping, trenching, stripping, geophysical surveys, diamond drilling for base metals | |
| • | 1990: Kamo Energy and Resources: Airborne magnetic and electromagnetic survey over portions of the current claim block. | |
| • | 1999-2001: Champion Bear Resources: Prospecting, stripping, mapping of pegmatite occurrences. | |
| • | 2015-2016: GoldON Resources: Re-staking of lapsed Champion Bear claims, property visit and pegmatite sampling, technical report. |
The claim group is situated in the continuation of the Separation Lake Greenstone Belt hosting the SRLD. The area is underlain by mafic meta-volcanics (amphibolite) at the bottom of an upward younging sequence of dacite, rhyolite, and derived metasediments in a northwesterly facing trend. Sulphide-rich oxide facies iron formation horizons are intercalated in amphibolite, with a conformable siliceous alteration horizon at or near the contact between amphibolite and rhyolite to the northwest.
Granite, pegmatitic granite, and pegmatite all occur throughout the area. These rocks have similar visual and mineralogical components and vary with respect to their mica type and content. Most are mineralogically simple with only minor accessory minerals, including garnet, dark almandine being the dominant garnet noted. Three known occurrences exhibit some degree of mineral fractionation with the reported presence of beryl at the Wolf and Rattler pegmatites, and the lithium mineral petalite occurs in the Glitter pegmatite.
A narrow "corridor" of narrow, disjointed feldspathic pegmatites and aplites occur for 4.5 km along strike from the Glitter pegmatite southeastward toward the Big Mack pegmatite. The width of the zone is interpreted from outcrop sampling and traversing to be approximately 200-500 m wide. It is postulated that this zone is the locus for evolved pegmatite emplacement, similar to the albite "corridor" defined along the north boundary of the Big Whopper pegmatite system. This zone is occupied by the petalite-bearing Glitter pegmatite and represents a geologic target for other sub-cropping or surficially covered petalite-bearing pegmatites.
69
A strong tectonic fabric is overprinted on all units, with strong penetrative foliation and schistosity in all non-pegmatitic units. Granites and pegmatite dykes commonly exhibit internal strain, particularly at contacts where the competency contrast with weaker supracrustals produces mullion and flame structures.
Avalon completed a field program in July-August, 2017, on the recently acquired Paterson Lake claim group. Lithogeochemical and biogeochemical surveys were conducted over the claims, in conjunction with prospecting for mineralized pegmatites.
A narrow west-northwest trending corridor of aplitic dykes and lithium geochemical anomalies were identified in the course of the work and final analytical results. Five areas of anomalous Li in country/host rock were identified in the survey, coinciding with the narrow linear corridor of aplitic pegmatite development. A follow-up program of in-fill lithogeochemical sampling, geologic and structural mapping, and focused prospecting was completed in 2018 along this corridor, centering initially in the identified Li-anomalies.
The Glitter Pegmatite is the westernmost known occurrence of petalite pegmatite in the Separation Rapids greenstone belt. It is extremely deformed and isoclinally folded. It is exposed for 75 m along strike before pinching in to boudins to the east and striking in to overburden to the west. Petalite occurs in the central portion of a series of folded dykes and boudins, with the major portion of petalite mineralization occurring in the central thickened hinge of the dyke. The dyke is zoned and thins to albitic aplite and petalite-free feldspathic pegmatite to the east, and to petalite-free feldspathic pegmatitic granite tectonically “nested” at the south margin/limb. Although Breaks (1999) reports the pegmatite to be up to 25 m wide (in the fold-thickened hinge), the petalite-bearing portion of the pegmatite has a maximum thickness of 15 m.
Considerable deformation is obvious in the form of lenses of biotite-rich, metasomatized mafic metavolcanic rock along the contact which locally are traceable into tight folds contained within the petalite-rich pegmatite zone. A similar structural history to the Big Mack Pegmatite was observed. Notable thickening of petalite-bearing pegmatite within an adjacent apophysis was developed during the isoclinal folding stage.
Clark and Siemieniuk (2016) reported that Breaks’ trenching, and channel sampling of 1 m samples returned values of 1.03% Li2O to 1.64% Li2O, accompanied by trace levels of other rare metals (Breaks’ sampling reported by Clark). Samples collected by GoldON have a maximum of 1.02% Li2O over 1.90 m in trench and channel sampling. These values compare well with chip sampling on the original channels conducted by Avalon in the 2017 exploration program. Continuous chip samples range from 0.87% Li2O to 2.11% Li2O, with an average lithium grade of 1.18% Li2O over a continuous 14.8 m length (See Table 7.17) .
70
The Wolf and the Rattler pegmatites are reported as moderately evolved beryl-type pegmatites (Breaks et al., 1999). These pegmatites may be genetically linked to a small mass of muscovite-biotite-bearing, peraluminous granite, herein named the Skidder pluton.
Table 7.17
Continuous Chip Samples from the Glitter Pegmatite
| Sample Width (cm) | Cs (ppm) | Nb (ppm) | Rb (ppm) | Ta (ppm) | Li Geochem (ppm) | Li Assay (%) | Li2O (%) | |
| V671667 | 1.00 | 17.3 | 75.7 | 1,195 | 23.1 | 7290 | 0.768 | 1.65 |
| V671668 | 1.00 | 45.9 | 59.7 | 1,020 | 22.8 | 4020 | 0.87 | |
| not sampled | 1.20 | - | - | - | - | 0 | 0 | - |
| V671669 | 1.40 | 15.8 | 81.9 | 1,265 | 41.1 | 5210 | 0.528 | 1.14 |
| V671671 | 1.50 | 14.0 | 68.4 | 1,765 | 31.1 | 7120 | 0.731 | 1.57 |
| V671672 | 1.50 | 5.9 | 65.8 | 1,700 | 36.0 | 5720 | 0.589 | 1.27 |
| V671673 | 1.50 | 5.8 | 70.5 | 2,230 | 43.5 | 3960 | 0.85 | |
| V671674 | 1.00 | 12.4 | 51.8 | 2,350 | 26.6 | 9420 | 0.981 | 2.11 |
| V671675 | 0.90 | 22.8 | 31.4 | 3,060 | 20.6 | 7480 | 0.763 | 1.64 |
| V671677 | 0.80 | 12.9 | 59.5 | 2,950 | 46.0 | 6010 | 0.647 | 1.39 |
| V671678 | 1.00 | 24.3 | 82.1 | 1,465 | 40.4 | 6090 | 0.624 | 1.34 |
| V671679 | 1.00 | 13.3 | 77.9 | 1,070 | 36.1 | 2090 | 0.45 | |
| V671680 | 1.00 | 17.0 | 89.2 | 1,090 | 31.7 | 5660 | 0.576 | 1.24 |
| 14.80 | 15.0 | 63.1 | 1,595.8 | 31.0 | 5,311.1 | 0.5 | 1.18 |
Breaks (1999) describes the Wolf Pegmatite as a west-striking apophysis of the Skidder Pluton. It is essentially a megacrystic pegmatitic granite, consisting of pink K-feldspar megacrysts to 30 cm, aplitic albite pods, grey glassy quartz, coarse muscovite, and subordinate biotite. Tourmaline has been reported by Breaks (1999). It is exposed over 40 m x 100 m and has relatively low values of lithium. No petalite is reported to be present (Clark, 2016).
The Rattler Pegmatite is a series of deformed lenses, dykes and boudins, in up to 7 m x 12 m segregations consisting of pink, coarse grained to locally megacrystic pegmatite hosted in strongly foliated amphibolite. The pegmatite is mineralogically simple and likely represents a weakly evolved pegmatitic phase proximal to the Separation Rapids Pluton, Skidder pluton, or other associated progenitor. No Li-minerals were observed with overall low lithium values. Beryl occurs in quartz pods and is the only rare-element mineral reported (Breaks, 1999).
The Snowbank Pegmatite occurs approximately four kilometres northwest of the main SRLD and 1300 m east of the Glitter Pegmatite. It was discovered in 2018 by Avalon (Avalon News Release, September 4th, 2018), and is associated with albitic dykes in a large outcrop area traceable for over 100 m along strike (open under overburden at both ends) averaging 6 m wide. Like the main deposit, the lithium occurs primarily in the ore mineral petalite, which occurs as large crystals up to 15 cm in diameter. Individual channel samples have yielded assays of up to 2.51% Li2O over 1.1 m, indicating that petalite comprises approximately 50% of the mineral content in the rock sampled.
71
A preliminary channel sampling program was carried out, focused on the petalite mineralized areas, with results compiled in Table 7.18 below. The main Snowbank Pegmatite zone is up to 9 m wide, but pinches and swells with some sections bifurcating into two to three smaller parallel dykes from 1 to 3 m in width, for a combined average width of 6 m, over the 100 m long exposure. Individual dykes exhibit classic pegmatite zoning features, with an internal assemblage of coarse petalite, potassium feldspar, albite and quartz, flanked by narrow albitic border and wall zones. Three channel samples collected from the petalite mineralized sections of the main Snowbank Pegmatite zone average 1.40% Li2O, while three other parallel dykes, also sampled, locally host similar mineralization over narrower widths.
Three channels are distributed over a strike length of just over 30 m, with spacing averaging about 10 m, in one discrete pegmatite dyke. Visible petalite is exposed continuously for about 100 m.
Table 7.18
Results of Channel Sample Analysis, Snowbank Pegmatite
| Channel number | Sample number | Length (m) | Li2O (%) |
| Main Pegmatite | |||
| Channel 1A including and | W860205 W860206 | 2.60 1.30 1.30 | 1.53 0.99 2.08 |
| Channel 2B | 2.30 | 1.61 | |
| including | W860209 | 1.20 | 0.78 |
| and Channel 4A including | W860210 W860213 | 1.10 2.90 1.30 | 2.51 1.07 0.90 |
| and | W860214 | 1.60 | 1.21 |
| Parallel Peripheral Pegmatites | |||
| Channel 1B Channel 2A Channel 2C | W860207 W860208 W860211 | 1.20 0.88 0.48 | 1.19 0.43 0.84 |
| Channel 3 | W860212 | �� 0.62 | 0.08 |
| Channel 4B | W860215 | 1.07 | 1.64 |
Notes:
| • | Sampling was supervised in the field by Avalon geologist J.C. Pedersen, P.Geo. | |
| • | Samples were collected by channel sampling using a portable rock saw, making two cuts about 5 cm apart and chiseling out the sample in between. For each analysed sample the cuts and sample were continuous. The average weight of each of the twelve samples was 3 kg with a range of 1.3 to 4.8 kg. | |
| • | Samples were shipped to ALS Global Laboratory in Thunder Bay. Lithium was analysed by method ME-4ACD81 and re-analysed by method LI-OG63 for concentrations above 0.5% Li. | |
| • | QA/QC samples (standard and blank) were included with the sample batch and gave acceptable results. |
As of the present, none of these pegmatites have been drilled. Breaks et al., 1999 recommended further exploration around the Skidder pluton.
72
8.0 DEPOSIT TYPES
The Late Archean SRLD belongs to the petalite sub-type, complex-type class of rare-metal pegmatites (Černy and Ercit, 2005). The complex-type pegmatites are geochemically the most highly evolved in the spectrum of granitic pegmatites, and petalite-bearing pegmatites comprise only 2% of the known complex-type pegmatites.
Complex-type pegmatites are found in many areas of the world and are economically important as resources for the rare metals, including lithium, tantalum, cesium and rubidium. Bradley and McCauley (2013) and Kesler et al. (2012) have published comprehensive overviews of lithium pegmatite deposits. Except for the former producer, Tanco in Manitoba, Canada, and the Bikita operation in Zimbabwe and Greenbushes in Western Australia (see Table 8.1), most complex-type pegmatites are too small to be profitably mined. With the presently estimated resources The Separation Rapids property is of similar order of magnitude in size and grade to the Tanco and Bikita original resources.
Table 8.1
Tonnage and Grade for Three Major Complex-type Pegmatites
| Deposit | Million Tonnes | Grade (Li2O %) |
| Tanco1 | 22.3 | 1.37 |
| Greenbushes2 | 70.4 | 2.6 |
| Bikita3 | 12 | 1.4 |
1Kesler (2012) Historic Resource Quotation.
2Talison Lithium Website (November, 2017).
3Jaskula (2010): Garrett 2004, Historic Resource Quotation.
The SRLD exhibits some significant differences from the norm in its structural setting, preservation of magmatic zonation and overall crystal size. Unlike Tanco and Bikita, which are shallow dipping, undeformed zoned intrusions, and Greenbushes, which is an approximately 45°-dipping, zoned and locally mylonitized pegmatite, the SRLD is subvertically-dipping, complexly folded, strongly foliated and locally mylonitized.
73
As described in Section 7.0, the SRLD exhibits zoning characteristics seen in other highly evolved rare-metal pegmatites, i.e., well-developed wall zones with exo- and endo-contact borders and petalite-rich intermediate zone. However, within the SRLD a significant portion of these zones and zonal features has been tectonically modified. In addition, all three currently producing rare-metal pegmatite deposits contain exceptionally large crystals of spodumene, petalite and feldspars which permit selective mining; at Bikita and Tanco, petalite crystals and pseudomorphs are reported to be as large as 2 m to 2.5 m in size. The megacrystic zones in the SRLD, on the other hand, contain crystals no larger than 10 cm to 15 cm. The true widths and strike extent of the SRLD and the petalite-producing Al Hyat sector of Bikita are almost identical (Garret, 2004).
The SRLD also hosts internal and lateral lepidolite-rich zones, found only in the highest fractionated rare-element pegmatites. Most of the lepidolite occurs in lateral extensions of the pegmatite, possibly as a continuum of separate dykes, but nevertheless the result of late stage extreme fractionation. High levels of lithium, rubidium and fluorine enrichment are associated with lepidolite in these lepidolite zones. Lithium in mica at the SRLD occurs principally in lepidolite, but also occurs in lithian-muscovite, which occurs in subordinate amounts to lepidolite in lepidolite zones, and also fairly ubiquitously in the petalite sub-zones of the deposit
74
9.0 EXPLORATION
| 9.1 | EARLYEXPLORATION |
As noted in Section 6.0, prior to the discovery of rare-metal pegmatite occurrences, exploration in the Separation Rapids region focused on base and precious metal mineralization. The petalite-bearing SRLD which forms a prominent hill on the south shore of MacDonald’s Bay on the English River, and an associated group of rare-metal pegmatites, were discovered by Dr. Fred Breaks of the Ontario Geological Survey (OGS) as a result of a detailed study of rare-metal pegmatites in the region between 1994 and 1996.
Avalon entered into an option agreement with Robert Fairservice and James Willis in October, 1996 and carried out a brief prospecting and sampling program in November, 1996. Dr. David Trueman, a consulting geologist experienced in rare-metal pegmatite deposits, carried out a preliminary study of the property and recommended a comprehensive exploration program. Avalon subsequently carried out a CAD1.1 million exploration program from May, 1997 to March, 1998. This program is described below with the information from the assessment report prepared by Pedersen (Pedersen, 1998a).
| 9.2 | 1997-1998 EXPLORATIONPROGRAM |
| 9.2.1 | Line Cutting and Magnetometer Survey |
Line cutting, and ground magnetometer survey work were conducted on the Separation Rapids property in two stages, the first during May, 1997, and the second in January, 1998. Both stages of work were completed by Gibson and Associates of Sault Ste. Marie, Ontario.
During the first stage of work, a north-south oriented grid totalling 30.9 -line km was cut on 50 to 100 m line spacing and 25 m station intervals. The magnetometer survey was carried out over 28.5 km of the grid during May, 1996, with readings taken at 12.5 m intervals. During the second stage of work, a total of 6.9 km of line were cut over areas that were not accessible during the previous stage and consisted of 50 m fill-in lines between the existing 100 m lines on the west end of the grid. This portion was surveyed by magnetometer during January, 1998.
The magnetic survey was performed using two Scintrex Envi-Mag portable total-field magnetometers. The purpose of the survey was to assist with geological interpretation and, in particular, to determine the magnetic signature of pegmatite bodies, and to delineate structural features, such as faults or folds, which may indicate an appropriate host structure for pegmatite bodies.
The results identified a number of breaks in the contours across the entire area, indicating faulting or tight open to isoclinal fold patterns. A large reactivated fault, along which the SRLD was emplaced, is interpreted from the magnetic data as a sharp contact between a linear magnetic high that trends southeasterly across the grid area and a large area of moderate magnetic susceptibility. The SRLD is represented as a magnetic low adjacent to a linear magnetic high, which is the host amphibolite. Larger granitic pegmatites and pegmatitic granite also have a low magnetic susceptibility compared to the host amphibolite.
75
| 9.2.2 | Geological Mapping and Sampling |
Geological mapping was conducted over the grid during June and July, 1997, at a scale of 1:1000 by Pedersen, with the assistance of Jacob Willoughby and Richard Brett. Mapping was conducted between the eastern claim boundary at L0+50E and L18+00W.
A second detailed surface geological mapping program was carried out during the summer of 1998, at a scale of 1:100, over the stripped main SRP outcrop area and some of the adjacent pegmatite zones. This second phase of mapping identified the various phases of the SRP, delineated the areal extent of petalite-bearing units and the SRP, expanded the known area containing the lepidolite zone (Subunit 6d), identified the structural controls on the emplacement of the SRP and some of the complexities due to folding, and outlined areas of further potential petalite-bearing units, especially the lepidolite-bearing Subunit 6d along the east and northeast part of the main SRP body. Outcrop stripping, trenching and systematic sampling were also carried out in conjunction with both phases of surface geological mapping.
Twenty representative samples of various pegmatitic outcrops were collected and assayed for Li, Ta, Nb, Cs, Rb, and Sn. Most samples were representative grab samples, with a few chip samples where outcrop allowed. Because of the smooth glaciated nature of most pegmatite outcrops, good samples are generally difficult to obtain without trenching or sawing.
Samples were sent to Chemex Labs Ltd. (Chemex) in Thunder Bay, Ontario, for preparation and then assayed in Vancouver, British Columbia, and Mississauga, Ontario using atomic absorption (AA) for Li and Sn, neutron activation (NAA) for Ta, Cs and Rb, X-ray fluorescence (XRF) for Nb, and inductively coupled plasma analysis (ICP) for phosphorus reported as P2O5. Results were reported in parts per million and converted to oxide values by Avalon with the exception of phosphate, which was reported by Chemex.
| 9.2.3 | Trenching |
Five outcrop exposures of the SRLD and other pegmatites were trenched by blasting and hand-stripping following completion of field mapping, for the purpose of obtaining continuous chip samples across the width of the pegmatites, i.e., trenches SLT-1 through SLT-5.
A total of 47 continuous chip samples were collected from the five trenches, with a maximum sample length of 3.0 m. The results of assays of samples from the trenches were consistent both from trench to trench and along each trench. Assuming that the lithium is largely contained in petalite averaging 4.2% Li2O and the rubidium in potassium feldspar averages 1.0 -1.5% Rb2O, then these levels are consistent with visual estimates of petalite and potassium feldspar contents of about 30-35% and 20-25%, respectively (Pedersen, 2016a).
76
| 9.2.4 | Diamond Drilling |
The history and statistics of diamond drilling on the property is covered in Section 10.0.
| 9.3 | 2000-2014 EXPLORATION |
In the period from 2000 to 2014, little work of a geoscientific nature was carried out at the property. The main activity relating to advancing the Project was metallurgical and, consequently, the main activity at the site was collection of samples, up to and including bulk sample sizes, for metallurgical testing.
The principal bulk sample was obtained during Avalon’s work program in 2006 when approximately 300 t of a bulk sample was extracted from the property, crushed to 5/8-in size, and packed in storage bags. This included material down to very fine grain size. This finely ground material is very important to retain since it contains most of the petalite mineral of interest.
A relatively small sample was shipped to a prospective customer in Europe, but the interest for this type of product declined due to market conditions at that time.
Some of the sample bags had started to split as a result of deterioration due to outdoor storage prior to the sample being shipped to Europe. Therefore, the material contained in the bags was cleaned and any organic material (plants, moss, wood particles) was removed, then dried prior to shipment. The decision was made to clean and re-bag all of the sample material.
| 9.3.1 | Check Assay Program |
An assaying program was undertaken at the same time as sample preparation, as a check on the material in storage. A total of 259 subsamples were collected from the bulk sample material. In order to reduce the number of analyses required, these subsamples were combined to create 40 composites each of between five and seven subsamples. The summary statistics of the composite samples are given in Table 9.1.
Table 9.1
Comparison of Subsample Statistics of Li% with Li% of Composite
| Subsample Set | Mean Li (%)1 | Median Li (%) | Standard Deviation | Standard Deviation (%) | Minimum Li (%) | Maximum Li (%) | Composite Li (%) |
| 1 | 0.7278 | 0.7290 | 0.0346 | 4.8 | 0.685 | 0.769 | 0.740 |
| 2 | 0.6358 | 0.6465 | 0.0766 | 12.0 | 0.534 | 0.733 | 0.659 |
| 3 | 0.7282 | 0.7240 | 0.0655 | 9.0 | 0.644 | 0.828 | 0.697 |
1Original data presented in terms of Li%, rather than Li2O%.
77
Various other analyses were completed, including comparison of washed and unwashed samples, which importantly demonstrated that washing did not significantly change the lithium grade.
| 9.3.2 | Rock and Soil Survey |
In September, 2009, a brief rock and soil survey was undertaken at the property by geologist Angela Martin (Avalon, 2009) for assessment work credit purposes. The survey area was limited to claim number 4221036. The objective of the soil/rock survey was to detect a potential extension of the mineralized zone of the SRLD pegmatite system to the north.
As reported by Avalon in 2009, the pegmatite rock descriptions and the mineral assemblages, biotite and garnet in particular, imply that the rocks are poorly fractionated and unlikely to be lithium mineral bearing. The assay results, and more specifically the rubidium values, while interesting, indicated the level of fractionation that might be expected in a pegmatite or a pegmatitic granite. No further work has been completed in this area.
In the period 2011 to 2015, there was little geological field work and, generally, site visits were either connected with collecting samples for metallurgical work or maintenance of access roads and the site.
In 2014, Avalon undertook a program of rehabilitation of the drill core stored at the Project site. This comprised reboxing core that was in core boxes that had deteriorated, building new racks to replace any in danger of collapse and clearing brush and other vegetation growing around the core racks.
| 9.3.2.1 | Acid Rock Drainage |
For the purpose of examining acid rock drainage potential of waste rock at Separation Rapids, four NQ whole core samples out of 21 collected in November, 2013, were submitted for ARD tests to SGS Canada in March, 2015 (Pedersen, 2016c). These core samples were chosen as “typical” amphibolite from the main mass area of the SRLD. Visible sulphides were difficult to discern in the great majority of amphibolite samples; sample 98-47 is an exceptional anomaly, having minor visible pyrrhotite along fractures. Thus, sample 98-47 is not chemically representative of typical amphibolite but was chosen to indicate what a sample with exceptional visible sulphides, and so a “worst case” may indicate. The initial results indicated rocks with low ARD potential. Sulphide percentage ranges from 0.02% to 0.04%, with total sulphur ranging from 0.05% to 0.101% . The single higher value of 0.101% S coincides with a single high carbonate % (0.824%), both of which occur in sample 98-47.
| 9.4 | 2017 EXPLORATIONPROGRAM |
As discussed in Section 7.0, Avalon completed a field program in July-August, 2017, on the recently acquired Paterson Lake claim group. The claim group lies immediately north of and adjacent to the property that Avalon owned prior to the acquisition from GoldON Resources of the Paterson Lake group.
78
Lithogeochemical and biogeochemical surveys were conducted by Avalon over the claims, in conjunction with prospecting for mineralized pegmatites. The geology of the mineral occurrences and conclusions of the 2017 exploration program are described in Section 6.0 of this report.
No drilling has been completed on the Paterson Lake group for lithium mineralization. Some 99 drill holes were completed in the past (GoldON Resources, 2016, NI 43-101 Technical Report on the Paterson Lake Property) but all of these were targeted on base metal occurrences in amphibolite units, not lithium pegmatites, and so are not relevant to this report.
79
10.0 DRILLING
| 10.1 | INTRODUCTION |
Avalon has drilled at the Separation Rapids Lithium Project in a number of campaigns between 1997 and 2018. The total number of diamond drill holes is 80 for a cumulative total of 13,192 m, as summarized in Table 10.1. The locations of all holes drilled on the property are shown in Figure 10.1.
Table 10.1
Summary Drilling Statistics, Separation Rapids Pegmatite
| Year | Purpose | Number of Holes | Metres | Size |
| 1997 | Geological/resources | 30 | 4,922 | NQ |
| 1998 | Geological/resources | 27 | 3,829 | NQ |
| 2001 | Geological/resources/geotechnical | 12 | 1,420 | NQ |
| 2017 | Geological/resources | 5 | 1,473 | HQ |
| 2018 | Geological resources | 6 | 1,548 | HQ |
| Total | 80 | 13,192 |
All core is stored in racks on site. In 2014, new core racks adjacent to the original core storage were installed. Drill core was transferred to new boxes and stored in the new racks.
| 10.2 | 1997-1998 DRILLINGPROGRAM |
A first phase diamond drilling program was initiated in early October, 1997, (Pedersen, 1998a) with the objectives of defining the physical parameters of the SRLD pegmatite, its tenor of mineralization, and testing of peripheral pegmatites for potential economic size and grade coincident with the SRLD. Thirty holes totalling 4,922 m were completed by early December, 1997 by Bradley Brothers of Rouyn-Noranda, Quebec. All core drilled was NQ diameter and logged on site by Pedersen, with the assistance of Jeff Morgan. With the exception of isolated narrow albitic dykelets, all pegmatite core was split on site and sent to X-Ray Assay Laboratories (XRAL) of Don Mills, Ontario for analysis for Li, Rb, Ta, and Cs with some check analyses completed at Chemex. Sample preparation was carried out at Chemex’s Thunder Bay facilities and assays at its Vancouver, BC and Mississauga, ON facilities.
Narrow amphibolite screens in areas of abundant pegmatite and internally in the SRLD were also split and assayed. With the exception of two holes (SR97-3 and SR97-10) which were drilled north (azimuth 000°), all holes were drilled to the south (azimuth 180°). Most were drilled at an inclination of -45°, with the exception of several holes, designed to intersect pegmatite at a deeper level, which were inclined -50° to -67°. Down hole surveys were completed with a Pajari instrument for both dip and azimuth; all were surveyed at the bottom of the hole, with longer holes also surveyed below the casing and at the midpoint. Holes ranged in length from 80 to 281 m. Drill hole collar locations were surveyed by Ross Johnson Surveying of Kenora, Ontario with UTM coordinates applied, and elevations established to within 1.0 m.
80
Figure 10.1
Map of Drill Hole Locations, Separation Rapids Property
(The base map indicates the distribution of lithium pegmatite, based on outcrop mapping and drill hole
data. Coordinates: UTM NAD83 Zone 15N)

The rationale for the 30 holes of the first phase of drilling was as follows:
| • | 23 holes were drilled to delineate the SRLD on approximately 50 m spacing: SR97-1 to SR97-12 and SR97-16 to SR97-26. | |
| • | 6 holes were drilled to outline the eastern portion of the Western Pegmatite: SR97-13 to SR97-15 (originally to test the Great White North outcrop as an extension of the SRLD), SR98-28 and SR97-29 (under Bob’s Pegmatite), and SR97-30. | |
| • | 1 hole was drilled to test the Eastern Swarm: SR97-27. |
A second phase definition drilling program commenced in February, 1998, with the objectives of reducing average hole spacing in the SRLD pegmatite to 25 m, extending the known geological resource of the SRLD to 300 m below surface, testing the eastern continuation of the Eastern Swarm, and testing two magnetic lows in the northwest quadrant of the Fairservice-Willis claims for hidden pegmatites. A total of 27 NQ holes totalling 3,829 m were drilled by Bradley Brothers of Rouyn-Noranda between early February and the middle of March, 1998. All holes were drilled to the south (180°) with the exception of three holes in the northwest quadrant which were drilled to the north to test magnetic low anomalies. Most holes were drilled at an inclination of -45°, except for deeper holes which were inclined -50° to -72°. Holes ranged from 63 to 350 m in length.
81
The rationale for the 27 holes of the second phase of drilling was:
| • | 20 holes were drilled to provide in-fill control for mineral resource estimation on the SRLD on 25 m centres: SR98-31 to SR98-47, SR98-51 to SR98-53. | |
| ||
| • | 2 holes were drilled to test for vertical continuity of the SRLD: SR98-54 and SR98- 57. | |
| ||
| • | 3 holes were drilled to test magnetic low anomalies in the northwest quadrant of the Fairservice claims: SR98-48 to SR98-50. | |
| ||
| • | 1 hole was drilled to test the eastern limit of the Eastern Swarm: SR98-55. | |
| • | 1 hole was drilled to test the vertical continuity of a lepidolite-bearing dyke uncovered by stripping during the on-going drill program: SR98-56. |
| 10.3 | GEOTECHNICALDRILLPROGRAM2001 |
SR01-58, SR01-59 and SR01-60, were drilled using a Boyles 35 diamond drill equipped with a wireline core retrieval system and supervised by Knight Piésold (Knight Piésold, 2001). Knight Piésold was retained to complete a geomechanical investigation of the rock mass at the proposed open pit mine and to develop suitable pit slope design parameters to comply with a feasibility level study. The potential for water inflow into the open pit was also evaluated. Packer tests were completed in each hole.
The drill was supplied and operated by Bradley Brothers Limited of Timmins, Ontario. Drilling was completed using an NQ triple-tube core barrel. Core orientation was performed with the clay imprint method. For this method, an eccentrically weighted core tube was lowered down the hole with the wire line equipment. The lifter case at the base of the orienter tube was filled with plasticine clay, which is pushed down the hole to obtain an impression of the core stub at the bottom of the hole.
Upon retrieval of the following drill run, the clay impression was matched with the top of the run. This was used to determine the top of the core. The core was then assembled, and a reference line was drawn on the core to indicate the top of the core. Work completed included:
| • | Logging and photographing by Avalon of all core prior to being split for assaying. | |
| • | Measurements of the discontinuity orientations. | |
| • | Point Load Tests (PLT) on representative samples of the core to obtain an estimate of the Uniaxial Compressive Strength (UCS) of the rock types encountered. |
82
| • | Packer testing: at selected intervals in the drill holes, measurements of the hydraulic conductivity of the rock mass were made using an NQ diameter double packer system. | |
| • | Rock mass classification: in order to quantify the engineering properties of rock masses, two separate rock mass classification systems were used for the study – the Rock Tunnelling Quality Index (Q) and the Rock Mass Rating (RMR) system. |
As noted by Knight Piésold, 2001, Avalon assayed the core from the geotechnical holes. The data are included in the Separation Rapids drill database.
| 10.4 | GEOLOGICALDRILLPROGRAM2001 |
In May, 2001, 12 diamond drill holes totalling 1,401 m were completed (Avalon News Release 25 July, 2001), including the three geotechnical drill holes noted above, i.e., holes SR01-58 through SR01-69. The drilling of nine non-geotechnical holes was east of the main mass of the SRLD to delineate the depth and Ta-Cs potential of a series of anastomosing narrow lepidolite-rich petalite-dykes which represent the eastern extension of the pegmatite. The results indicated a continuous vertical extent of the dyke swarm, but no thickening with depth. Tantalum and cesium values were slightly elevated relative to those in the main mass of the SRLD. In general, the results from this program were consistent with those from previous drilling, which indicated zones of relative tantalum enrichment on both the eastern and western extremities of the deposit, ranging from 0.009% Ta2O5 to 0.022% Ta2O5 (0.2 to 0.5 lb/t) compared to 0.007% to 0.009% Ta2O5 within the main mass of the SRLD pegmatite.
| 10.5 | 2016 RE-ANALYSISPROGRAM |
In June, 2016, 45 intervals from two previous drill holes (SR97-2 and SR98-52) were selected and quartered for re-analysis as part of an updated QA/QC program, with standards inserted every tenth sample. This is reported in more detail in Section 12.0.
| 10.6 | DRILLPROGRAM2017 |
A diamond drill program of five holes totalling 1,473 m was performed in the spring of 2017, which targeted the Separation Rapids lithium-rubidium pegmatite (holes SR17-71 to -74) and a magnetic low in the west of the main pegmatite (SR17-70). Boart Longyear of Calgary, Alberta, was contracted to perform the drilling using a Boart Longyear LF70 skid-mounted diamond drill rig producing HQ core.
Downhole azimuth and inclination for all holes was surveyed using a magnetic Devishot multi-shot tool (Devico) at intervals of 6 m.
Collar surveys were conducted by Rugged Geomatics Ontario Land Surveyors of Kenora, ON. Survey objectives were two-fold:
| • | Survey current drill program collars (5 drill collars). |
83
| • | Survey historic collars). collars with intact casing to obtain additional azimuth data (13 |
The survey was horizontally related to UTM Zone 15 NAD83 CSRS datum, and vertically to Geodetic CGVD 28 datum. A Trimble RTK system consisting of two R8 receivers and high-powered radio coupled to a TS2 data collector were utilized. A 2-point control network was created consisting of post processed baselines.
Drill hole SR17-70 tested a drift covered magnetic low and the on-strike projection of the Western Pegmatite. The drill hole encountered numerous intervals of muscovite-bearing pegmatitic granite, but no petalite-bearing pegmatite. The hole was terminated due to poor ground conditions short of the Western Pegmatite strike projection.
The four diamond drill holes that targeted the SRLD (DH SR17-71 to 74) successfully confirmed the geological and grade continuity of the main pegmatite mass (see Table 10.2 for intercepts details). Significant drill intercepts of petalite and lepidolite and petalite ± spodumene pegmatite, all given as true horizontal thicknesses and length-weighted average grades, include 15.4 m grading 1.176 % Li2O (drill hole SR17-71), 8.1 m grading 1.431 % Li2O and 6.9 m grading 1.506 % Li2O (SR17-72), 19.5 m grading 1.576 % Li2O (SR17-73) and 8.2 m grading 1.565 % Li2O in drill hole SR17-74 See Table 10.3) . The lithium grades are elevated compared to previous resource estimates for the entire deposit, indicating a moderate grade increase with depth. The intersected intercepts are associated with length-weighted averages of Rb2O between 0.343 and 0.473 %.
Preliminary geotechnical evaluations on the drill core, in combination with previous studies, indicate good rock stability based on a range of parameters including rock hardness, weathering, core recovery, rock quality designation and fracture indices.
A waste rock study was initiated with specific analyses of drill core which indicates overall low absolute concentrations of environmental contaminants in the rocks and a low environmental risk of acid mine drainage, based on acid base accounting analyses.
Table 10.2
Drill Hole Location and Specifications
| Hole ID | Easting (m) | Northing (m) | Collar dip (°) | Collarazimuth (°) | Final depth(m) |
| SR17-70 | 387210.30 | 5569404.48 | -45 | 180 | 276 |
| SR17-71 | 388200.98 | 5569172.25 | -55 | 180 | 243 |
| SR17-72 | 388278.53 | 5569144.21 | -55 | 180 | 228 |
| SR17-73 | 388454.21 | 5569132.85 | -63 | 165 | 390 |
| SR17-74 | 388673.84 | 5569035.01 | -70 | 180 | 336 |
| Total | 1,473 |
84
Table 10.3
Significant Drill Intersections
| Drill hole | GeologicalUnit | From | To | Drilled width (m) | Estimated true width (m) | Li2O % |
| SR17-71 (including) | Lepidolite | 184.45 | 211.30 | 26.85 | 15.40 | 1.18 |
| 186.35 | 204.48 | 18.13 | 10.40 | 1.41 | ||
| SR17-72 | Lepidolite | 172.10 | 210.50 | 38.40 | 22.03 | 1.11 |
| SR17-73 | Petalite | 260.40 | 304.49 | 44.09 | 20.02 | 1.55 |
| SR17-74 | Lepidolite | 33.00 | 37.00 | 4.00 | 1.37 | 2.27 |
| SR17-74 | Lepidolite | 129.00 | 135.20 | 6.20 | 2.12 | 1.48 |
| SR17-74 | Lepidolite | 142.50 | 148.25 | 5.75 | 1.97 | 1.58 |
| SR17-74 | Lepidolite | 160.48 | 165.80 | 5.32 | 1.82 | 0.95 |
| SR17-74 | Petalite | 262.15 | 265.20 | 3.05 | 1.04 | 1.64 |
| SR17-74 | Petalite | 282.70 | 317.80 | 35.10 | 12.00 | 1.39 |
| 10.7 | DRILLPROGRAM2018 |
A six-hole, 1,548 m diamond drill program was completed in the winter of 2018. Drilling was performed by Boart Longyear using the same drill as the 2017 drill program to produce HQ diameter core (see Table 10.4) . The purpose of the drill program was three-fold:
| • | Test the depth extension of the Western Pegmatite, 700 m to the east of the main mass of the SLRD (SR18-75, 76). | |
| • | Test and expand the petalite zone (PZ) lepidolite-petalite (LPZ) resources to depth at west end of SLRD main mass (SR18-77, 78). | |
• | Test the lepidolite-petalite mineralization (LPZ) at the SLRD east extension (SR18- 79, 80). |
Downhole azimuth and inclination for all holes was surveyed using a magnetic Devishot multi-shot tool (Devico) at intervals of 6 m.
A collar survey for the six holes was conducted by Rugged Geomatics Ontario Land Surveyors of Kenora, ON at the end of the drill program using a Trimble GPS system with two R10 receivers. The survey was horizontally related to UTM Zone 15 NAD83 CGVD28 datum.
Table 10.4
Drill Hole Location and Specifications
| Hole ID | Easting (m) | Northing (m) | Collar dip (°) | Collar azimuth (°) | Final depth (m) |
| SR18-75 | 387528 | 5569171 | -50 | 180 | 109 |
| SR18-76 | 387528 | 5569171 | -65 | 180 | 157 |
| SR18-77 | 388201 | 5569175 | -65 | 180 | 316 |
| SR18-78 | 388326 | 5569136 | -65 | 178 | 343 |
| SR18-79 | 388500 | 5569090 | -67 | 175 | 313 |
| SR-18-80 | 388552 | 5569068 | -67 | 175 | 310 |
| Total | 1,548 |
85
The two holes drilled at the Western Pegmatite (SR18-75,76) intersected petalite mineralization over true widths of up to 3 m, confirming lateral continuity of the deposit to the west over relatively narrow widths.
Holes SR18-77 and 78 tested depth extensions on the west side of the main deposit to approximately 250 m below surface and intersected mainly petalite mineralization (PZ) outside the 2017 deposit resource volume. The primary intercepts of petalite pegmatite returned values of 1.1% Li2O over 50.9 m cumulative thickness in hole SR18-77 and 1.33% Li2O over an 18.7 m thickness in hole SR18-78.
Holes SR18-79 and 80 tested the east side of the main deposit to similar depths and intersected a wider zone of lepidolite-rich lithium mineralization (Subunit 6d) than expected. Hole SR18-79 intersected 62.27 m of lepdiolite mineralization (6d) within an interval of 77.05 m averaging 1.27% Li2O, which also includes other zones of petalite mineralization (Table 10.5) . This represents an estimated true thickness of 33.46 m of Subunit 6d mineralization. Hole SR18-80 intersected 1.51% Li2O over a cumulative thickness of 62.85 m, of which 37.75 m was lepidolite-petalite mineralization and the remainder was petalite mineralization. Subunit 6d mineralization in these two holes is largely outside the 2017 resource model.
Table 10.5
Significant Drill Hole Intersections with Lithium Grades Expressed as Percent Lithium Oxide
| Drill Hole | From | To | Drilled Width (m) | Estimated TrueWidth (m) | Li2O % | Lithology |
| SR18-75 | 72.36 | 78.84 | 6.48 | 2.94 | 1.04 | 6a,b,c |
| 81.46 | 83.90 | 2.44 | 1.15 | 1.41 | 6a,b,c | |
| SR18-76 | 116.50 | 117.35 | 0.85 | 0.40 | 2.28 | 6a,b,c |
| SR18-77 | 188.10 | 196.60 | 8.50 | 3.86 | 1.50 | 6a,b,c |
| 244.30 | 286.70 | 42.40 | 19.91 | 1.02 | Mixed 6a,b,c,d | |
| SR18-78 | 256.40 | 275.10 | 18.70 | 7.61 | 1.33 | 6a,b,c |
| SR18-79 | 162.50 | 239.55 | 77.05 | 41.40 | 1.27 | Mixed 6a,b,c, d |
| Including | 167.93 | 201.50 | 33.57 | 18.04 | 1.38 | 6d |
| and | 210.85 | 239.55 | 28.70 | 15.42 | 1.60 | 6d |
| SR18-80 | 72.00 | 74.90 | 2.90 | 1.32 | 1.20 | 6a,b,c |
| 117.65 | 128.70 | 11.05 | 5.02 | 1.72 | 6a,b,c | |
| 172.85 | 184.00 | 11.15 | 5.58 | 1.15 | 6a,b,c | |
| 222.15 | 259.90 | 37.75 | 20.00 | 1.58 | 6d |
The 2018 winter drill program successfully demonstrated continued depth continuity in the main and eastern sections of the SRLD, which remain open to depth. The lepidolite zone (6d) at the east extension has strong vertical continuity, with a thicker down dip extent in hole SR18-80 than pre-drilling projections had indicated.
Holes SR18-75, 76 at the Western Pegmatite confirmed continuity of the petalite pegmatite to the west, but with a narrowing to depth, from approximately 10 m in outcrop to <3 m at 60 m depth. It is possible that this is a function of both pinch and swell deformation, with any repetitive cycles at depth requiring further drill testing.
86
11.0 SAMPLE PREPARATION, ANALYSES AND SECURITY
| 11.1 | SAMPLEHANDLING ANDANALYTICALMETHODSUSED– 1997/98 |
This section, reporting on the past drill core sampling, is largely derived from the reports of Pedersen (1998a) and Micon (1999). A summary of the historic sampling is provided in Table 11.1.
Forty-seven surface samples taken in the 1990s were shipped to Chemex in Thunder Bay, Ontario for preparation and then to Chemex’s facilities in Mississauga, Ontario and Vancouver, British Columbia for subsequent assaying.
The surface samples from the SRLD were analysed for lithium and tin using atomic absorption spectroscopy (AA), and for rubidium, cesium and tantalum using instrumental neutron activation analysis (INAA). The trench samples were also analysed for phosphorus using Inductively Coupled Plasma Spectroscopy (ICP). Surface samples collected from the outcropping dykes in the winter of 1997 were analysed for gallium, niobium and tin by X-ray fluorescence spectrometry (XRF) in addition to lithium, rubidium, cesium and tantalum by AA and INAA.
In the 1990s, drill core was logged and split with half of the core being sent for assay and the other half being stored in core boxes on site. Core sample intervals were varied, depending on lithology, to a maximum of 3 m.
Split core samples were shipped to XRAL where they were assayed for lithium, rubidium, cesium and tantalum using ICP for lithium and tantalum and AA for rubidium and cesium.
Records indicate that they were a total of 2,491 drill core samples assayed at XRAL (see Table 11.1 and Table 11.2), with an additional 221 duplicate analyses for the 1997-98 drill programs. Avalon’s sampling program includes 163 samples from the SRP and associated pegmatites. This included 19 surface grab samples, 47 continuous chip trench samples from trenches SLT-1 to SLT-5 (analysed at Chemex), nine trench, chip and surface grab samples from the Lepidolite dyke, three surface grab samples from the Fairservice dyke, and 84 drill core check assay samples.
A further 299 drill core samples from the 2001 program were analysed at XRAL. No QA/QC data is available for these samples.
Check-assaying was routinely carried out for lithium and rubidium by Chemex at its Vancouver, British Columbia, and Mississauga, Ontario facilities.
The QA/QC analysis completed on historic drill core are summarized in Table 11.1 and Table 11.2.
87
Additional independent analyses were completed by Micon (1999) totalling six core duplicates. Also, as reported below, in 2016 Avalon completed additional splitting of the original drill core to complete check analyses after preparation of a lithium analytical standard from Separation Rapids mineralized rock.
Table 11.1
QA/QC Sample Statistics
| Item | QC Category | Year | Primary Lab | Check Lab | Sample Count | QC Sample Count | Ratio QC:Original |
| i | Pulp duplicates | 1997-19981 | XRAL | XRAL | 2,491 | 221 | 11 |
| ii | Core duplicates | 1997-19982 | XRAL | Chemex | 2,491 | 84 | 30 |
| iii | Field duplicates | 20163 | XRAL | ALS | 2,516 (1990s core) | 42 | 60 |
| iv | Standards | 20164 | ALS | 42 | 4 | 11 |
Notes:
1Duplicate core analysed at primary lab (XRAL).
2Core duplicates shipped to secondary lab (Chemex).
3Reanalysis (ALS) of 1997/8 historic core using core duplicates.
4Avalon standards inserted in reanalysis (ALS).
Table 11.2
Analyses of Drill Core Samples, 1997-1999 and 2001
| Laboratory/Operator | Number ofSamples | Notes |
| XRAL | 2,491 | Original analyses of drill core, 1990s |
| XRAL | 221 | 1990s pulp duplicate analyses1 |
| Chemex | 84 | Reject duplicate analyses |
| XRAL | 299 | Original analyses of drill core, 2001 |
| Chemex2 | 6 | Core duplicates |
1Not in DataShedTMdatabase.
2Check assays by Micon, 1999.
| 11.2 | SAMPLEHANDLING ANDANALYTICALMETHODSUSED– 2016 |
In 2016, Avalon re-sampled drill core from the 1990s’ programs stored at the Project site. The objective was to re-assay the core with modern methods and inserted lithium rock standards for comparison to the historic data.
There was no evidence that the drill core had been tampered with in the interim period. The work was personally supervised by Chris Pedersen who also supervised the drilling in the 1997-1998 period. Pedersen also supervised the re-boxing and re-racking of the drill core in 2015. Thus, Pedersen could observe whether the core appeared to be undisturbed in terms of being correctly labelled and complete.
In July, 2016, under the supervision of Pedersen, the half core of two 1998 drill holes was quartered using a core saw at Ontario government facilities in Kenora. Samples were bagged according to identical intervals to the samples collected in the 1990s. This enables direct comparison between original analytical values and 2016 assays. The two drill holes, SR97-02 and SR98-52, were sampled across the complete intercept of the pegmatite body. Lithium rock analytical standards developed internally by Avalon were inserted into the sample stream (see Section 12.0 for details).
88
The 2016 quarter-core samples were sent to ALS Geochemistry Laboratory (ALS) in Sudbury, Ontario with a request for the following analyses:
| • | CRU21 – preliminary crushing with fine crushing of rock chip and drill samples to 70% nominal -2 mm. | |
| ||
| • | SPL22Y – premium splitting procedure producing split sample using a Boyd crusher/rotary splitter combination. | |
| ||
| • | PUL31 – Pulverize a split or total sample up to 250 g to 85% passing 75 µm. | |
| ||
| • | CCP-PKG01 involving five different analytical methods. | |
| ||
| • | ME-ICO06 – whole rock analysis. | |
| ||
| • | ME-MS81 – 31 elements by lithium metaborate fusion, acid digestion and ICP-MS. | |
| ||
| • | ME-4ACD81 – 10 elements including lithium by four-acid digestion – ICP. | |
| ||
| • | ME-MS42 – 9 gold-related elements with aqua regia digestion. | |
| ||
| • | ME-IR08 – carbon and sulphur. |
The core analysis results are discussed in Section 12.0.
| 11.3 | SAMPLEHANDLING ANDANALYTICALMETHODSDRILLPROGRAMS(2017AND2018) |
In both the 2017 and 2018 diamond drill programs, all lithium bearing pegmatites (Unit 6) and representative non-mineralized pegmatite intercepts were sampled on continuous 2-m intervals, with shorter intervals where constrained by geologic contacts and amphibolite host rock. In the 2017 drill program, representative samples of amphibolite were also collected from holes SR17-71 to 74 for analysis and environmental test work focused to some extent on potential for acid rock generation.
Sample intervals were marked along the core axis by the geologist, then split using a mechanical splitter by a technician under the supervision of the geologist. One half of the split core went in to a plastic sample bag, the other half returned to its position in the core box. A corresponding sample tag was placed in the bag of each sample, with a duplicate sample tag stapled in to the core box at the beginning of the sample interval. The sample number was also written in felt pen on the outside of the bag. Each sample was then sealed with single-use nylon zip-ties.
Avalon had previously prepared an analytical standard for the Project utilizing rock material from the SRLD. This analytical standard, SR2016, was created from rock collected off the SRLD outcrop, prepared at CDN Laboratory in British Columbia. It was subjected to a Round Robin involving six independent laboratories in Canada and Australia in order to determine a certified value. The certified value for the standard based on the round robin is 1.488 ± 0.039 wt. % Li2O at one standard deviation (see discussion in Section 12.4.3.1) .
89
Together with the drill core assay batches, packages of Avalon's lithium standard were analyzed with one standard inserted per 25 samples. The standard samples, when inserted into the sample stream, were given appropriate sample numbers using the same sample tags as core samples, to ensure they remained in the correct position within the analysis stream.
Blank samples were also inserted into the sample stream, at one per 40 drill core samples. Blanks were composed of silica sand which was inserted in standard plastic sample bags by Avalon geological staff and then numbered with sample numbers consecutive with core samples, in order to ensure an appropriate analysis order.
Samples were placed in rice bags for transport to the ALS preparation laboratory in Thunder Bay, with from three to five samples per rice bag. The rice bag was then secured shut with nylon zip ties and stored inside the core logging facility on private property. Rice bags were delivered by Avalon personnel to Manitoulin Truck Lines in Kenora, where the rice bags were placed on wooden pallets and shrink wrapped for shipping and direct delivery to the ALS in Thunder Bay.
Upon arrival at ALS in Thunder Bay, samples were received and documented by ALS staff for initial preparation, and then pulps were shipped to ALS in Vancouver for analysis.
Pulp duplicates also were prepared at ALS and shipped to Avalon’s Toronto office. Avalon then repackaged the duplicates with inserted pulp standards and shipped to SGS Canada Laboratory in Lakefield, Ontario, for check assays.
Analytical procedures are discussed below.
Sample preparation of pegmatite core for both 2017 and 2018 drill programs:
| • | Method PREP-33D: |
| o | Crush entire sample to 90% passing 2mm | |
| o | Pulverize 1 kg split to 95% passing 100 microns | |
| o | Second 250 gm split prepared from every 10th core sample EXCLUDING standards and blanks for check analysis at second lab (SGS) |
Sample preparation of amphibolite host rock from the 2017 drill program:
| • | Crush entire sample to >70% passing 2 mm. | |
| • | Riffle-split 250 gm and pulverize to >85% passing 75 microns. | |
| • | Composite 200 gm of each of 3 samples from rejects and combine to make 1 sample of 600 gm. Remaining 400 gm samples shipped to Toronto with new sample for further environmental testwork. |
90
Following initial sample preparation, samples were analysed using the following techniques:
2017 Drill Program
| • | Pegmatite: ALS is the primary laboratory |
| o | Initial analysis using ME-4ACD81 with 4-acid digestion and ICP-AES finish | |
| o | When Li >5000ppm re-run with Li-OG63 ore grade Li by specialized 4-acid digestion, with Li-specific CRMs. |
| • | Amphibolite: ALS |
| o | Individual samples using method). ME-IR08 for carbon and sulphur (Leco furnace | |
| o | Composited samples: |
| i) | ME-IR08 for carbon and sulphur (Leco furnace method). | |
| ii) | F-IC881 (KOH fusion and ion chromatography) for fluorine. | |
| iii) | Hg-MS42 (trace level Hg by aqua regia and ICP-MS) for mercury. | |
| iv) | MS81d for major and trace elements. |
| • | Pegmatite: SGS is the check laboratory |
| o | GE_ICM40B Multi-acid (four-acid) digestion and ICP-AES. | |
| o | GE_ICM90A Na2O2 fusion, combined with ICP-AES and ICP-MS finish. |
2018 Drill Program
| • | Pegmatite: ALS is the primary laboratory |
| o | ME-4ACD81 4-acid digestion and ICP-AES. | |
| o | When Li > 5000ppm re-run with Li-OG63 ore grade Li by specialized 4-acid digestion, with Li-specific CRMs. |
| • | Pegmatite: SGS is the check laboratory |
| o | GE_ICM90A Na2O2 fusion combined with ICP-AES and ICP-MS finish. | |
| o | GO_XRF76V borate fusion/XRF whole rock package. |
| 11.4 | DRILLDATABASEPREPARATION |
For the drill programs in the 1990s, data compilation and drafting of sections and level plans were carried out on site by the Project geologist with subsequent modification at Avalon’s Thunder Bay office. All field logging was done on paper and data were not digitized.
The original drill hole database for the Separation Rapids Lithium Project was developed for the 1999 Micon Preliminary Feasibility Study by Pearson, Hoffman and Associates Ltd. (PHA). The database was created from the drill logs with lithologies, provided by Avalon to PHA as well as laboratory analysis certificates and surveying data. There is no information in the PHA (1999) report or the prefeasibility study as to what quality control measures were implemented on the database.
91
The database was provided by Micon to Avalon as a series of Excel worksheets in 2011. These data were then imported into the Avalon corporate drill database in the Maxwell Geoservices DataShedTM data management software. This is the major database that Avalon utilizes for all its drilling projects and to provide organised drill data for resource estimation.
Avalon then completed verification of this database against historic data records such as drill logs, assay certificates, and other original sources of data. The objective was to ensure that errors are not present in the DataShedTM database. The results of this work are given in Section 12.0.
| 11.5 | HISTORICSPECIFICGRAVITY |
The drill database contains 185 specific gravity (SG) values for various lithologies on the SRLD. This comprises 118 measurements on pegmatite, 66 on amphibolite and one measurement which was considered an outlier and was rejected.
As part of the original drill program (Pedersen, 1998a), Avalon carried out SG measurements on 20 representative drill core samples of the pegmatite using a Mettler Toledo PB 1501 Electronic Balance at the University of Manitoba. The balance was calibrated at the beginning of the procedure with a 1,000 g sample and checked on a regular basis. A microcline (potassium feldspar) sample measured at 2.53 was deemed an acceptable test, as the SG of the sample fell within the range of published data.
The original data for 20 samples has not been identified. However, PHA (1999) provides the data shown in Table 11.3 for the SG of the various lithologies.
Table 11.3
1998 Specific Gravity Measurements
| Rock Type | Specific Gravity |
| Petalite Zone | 2.57 |
| Feldspar Zone | 2.62 |
| Internal Amphibolite Waste | 2.90 |
| Host Rock Waste | 2.90 |
| Air | 0.00 |
PHA, 1999.
In October, 2014, Pedersen completed a further 185 specific gravity determinations on core samples using the same equipment at the University of Manitoba. These core samples were from eight drill holes that covered both pegmatite (118 measurements) and amphibolite (66 measurements). Holes covered were SR97-08, -09 and -10 and SR98-33, -34, -35, -36 and - 37. One additional measurement was rejected during resource estimation as an outlier.
92
Based on the measurements completed in 2014, the average SG for pegmatite is 2.62 for the 118 samples (one high outlier at 3.16 removed). The average SG for amphibolite (waste) is 3.04 based on the 66 measurements. The SG measurements show low variability (standard deviation of 0.08, or 3% for pegmatite and 0.05 or 2% for amphibolite) indicating that the risk of significant error is low.
The details of the SG statistics for resource estimation are given in Section 14 including data from the 2017 and 2018 drill programs. Table 11.4 gives a comparison between the original data utilized in resource estimation in 1999 and the SG values obtained in 2014. The data for the pegmatite illustrates that the two sets of data are statistically not significantly different, with the 1999 values lying within one standard deviation of the 2014 values.
Table 11.4
Comparison of SG Measurements, 1998/99 and 2014
| 2014 Data1 | |||
| Unit | Pegmatite | Feldspar Zone | Amphibolite |
| Number | 118 | 66 | |
| Average | 2.62 | 3.04 | |
| Median | 2.62 | 3.04 | |
| Standard deviation | 0.08 | 0.05 | |
| 1998 Data2 | |||
| Values used in 1999 | 2.57 | 2.62 | 2.90 |
1 Pedersen, 2016a.
2 Micon, 1999.
93
12.0 DATA VERIFICATION
| 12.1 | INTRODUCTION |
The resource estimation completed in 2018 is based on the original drilling by Avalon in 1997 to 2001, assay database created by Micon in 1999 with additional drilling completed by Avalon in 2017 and 2018. There were certain QA/QC procedures applied and reported on at the time of creation of the database as summarized in Section 12.2 below. These procedures included check assays at a second laboratory and independent assaying by Micon.
Subsequently, Avalon completed further verification of the drill data, given below in Sections 12.4 and 12.5. This included cross-checking the database against original field records such as drill logs, cross-checking the assays against laboratory assay certificates and re-assaying drill core splits with inserted internally certified lithium standards. Quality control procedures for recent drilling are covered in Sections 12.6 and 12.7.
| 12.2 | QUALITYCONTROL, 1990S |
As reported in Section 11.0, during the original drill program, 84 duplicate coarse rejects samples from drill core were submitted to Chemex, as a check laboratory. The results can then be compared with the primary samples analysed by XRAL (Pedersen, 1998a).
Figure 12.1, Table 12.1, Figure 12.2 and Table 12.2 show the comparison of the XRAL and Chemex data sets. The two sets compare favourably for Li2O grades when Li2O grade is lower than approximately 1.5% but show an increasing amount of scatter above this grade. XRAL’s Rb2O data were consistently lower than Chemex’s.
Avalon reported at the time (Pedersen, 1998a) that the discrepancies in lithium and rubidium assays may be due to differences in analytical techniques, especially for lithium, which was analysed by ICP at XRAL and by AA at Chemex. As rubidium was analysed by AA at both laboratories, Pedersen, 1998a, suggested that incomplete sample digestion and/or the use of different standards might be the reason for the differences in these results.
However, there were other differences in the methods utilized besides the instruments. The XRAL analysis method utilized sodium peroxide fusion followed by ICP for Li and Ta and perchloric-nitric-HF digestion followed by AA for Rb and Cs. Chemex applied “Preparation Method 232” to the samples, where procedure 232 is reported as perchloric-nitric-HF acids digestion. Lithium was then analysed by AA and Rb by ICP-MS. The difference in initial steps of fusion (XRAL) and acid digestion (Chemex) was not discussed originally as a possible influence on differences between XRAL and Chemex analyses, but it is possible that different lithium bearing minerals, petalite, spodumene and lepidolite, may respond differently to fusion versus acid digestion.
94
Assays classed as outliers (or ‘bad repeats’) in the graphs below, generated by DataShedTMand the associated Maxwell Geoservices software “QAQCReporter”, meet the following criteria:
| 1. | Assay value is 10 times the lower detection limit. | |
| 2. | Assay Value is ≤10% different than the original assay. |
Figure 12.1
Scatter Plot of Original Sample (XRAL Analysis) and Reject Duplicate Sample (Chemex Analysis) for
Li2O
![]()
Table 12.1
Summary Statistics for Figure 12.1 – Li2O Analyses
| Number ofSamples | Mean Li2O XRAL (%) | Mean Li2O Chemex (%) | Standard Deviation Li2O XRAL (%) | Standard Deviation Li2O Chemex (%) | CoV Li2O XRAL | CoV Li2O XRAL | sRPHD1 (mean) |
| 84 | 1.42 | 1.46 | 0.52 | 0.53 | 0.36 | 0.36 | -1.44 |
1Relative percent half difference.
95
Comparison of the original 1997 and 1998 XRAL assays vs. the field duplicates assayed by Chemex in 1998 yields a 2.8% difference in the means of the two laboratories’ data for Li2O with Chemex higher than XRAL. Along with this small difference in the means, the correlation coefficient, R2, is high, at 93.25%, indicating strong correlation, and from the graph, there is almost no bias at any concentration level.
Figure 12.2
Scatter Plot of Original Sample (XRAL Analysis) and Field Duplicate Sample (Chemex Analysis) for
Rb2O
![]()
Table 12.2
Summary Statistics for Figure 12.2 – Rb2O Analyses
| Number of Samples | Mean Rb2O XRAL (%) | Mean Rb2O Chemex (%) | Standard Deviation Rb2O XRAL (%) | Standard Deviation Rb2O Chemex (%) | CoV Rb2O XRAL | CoV Rb2O XRAL | sRPHD1 (mean) |
| 84 | 0.42 | 0.48 | 0.23 | 0.24 | 0.53 | 0.51 | -6.96 |
1Relative percent half difference.
Comparison of the 1997 and 1998 XRAL assays with the field duplicates assayed by Chemex yields a 12.5% difference in the means of the two laboratories’ data for Rb2O.This is a rather high difference in means, however, the R2 is high, at 96.21%, very strongly correlated, and from Figure 12.2, a small positive bias exists in Chemex compared to XRAL. This positive bias appears to increase at higher concentrations of Rb2O.
96
In conclusion, despite some small differences, both the lithium and rubidium analyses from XRAL and Chemex are close and show similar trends with strong R2 scores for the correlation. This indicates high and acceptable reliability in the analyses.
| 12.3 | INDEPENDENTCHECKSAMPLING ANDASSAYING– 1999 |
As an independent check on the results reported by Avalon, Micon collected a total of eight samples as due diligence portion of the original prefeasibility study (Micon, 1999). Of these check samples, five samples were of previously logged and assayed drill core and thus were drill core duplicates, two were of continuous chip samples from trench SLT-1 and one sample from Subunit 3b. These eight samples were regarded as being representative of the SRP petalite-bearing Subunits 6a, 6c and 6d.
For the core samples, Micon removed the core from the boxes, noting the interval and box number and placed the sampled core into new plastic bags along with sequentially numbered assay tags. Trench samples were collected directly by Micon from trench SLT-1. The samples were hand carried by Micon’s representative to Winnipeg and shipped by air as baggage to Toronto (Micon, 1999).
Micon submitted the samples by courier to Chemex in Mississauga for check assay using ICP-MS for tantalum and rubidium and using AA for lithium. The results are shown in Table 12.3.
Table 12.3
Independent Check Assay Results
| Micon Sample Number | Subunit | Li2O (%) | Rb2O (%) | Ta2O5 (%) | Sample Location | Avalon Sample Number | Li2O (%) | Rb2O (%) | Ta2O5 (%) |
| 57951 | 6a | 1.66 | 0.38 | 0.01 | Drill hole 97-1 | 236532 | 1.76 | 0.36 | 0.0 |
| 57952 | 6d | 1.94 | 0.44 | 0.01 | Drill hole 97-4 | 236676 | 1.59 | 0.59 | 0.0 |
| 57953 | 6a | 1.98 | 0.15 | 0.0 | Drill hole 97-4 | 236699 | 1.71 | 0.17 | 0.0 |
| 57954 | 6a | 1.94 | 0.3 | 0.01 | Drill hole 97-9 | 237946 | 1.97 | 0.47 | 0.0 |
| 57955 | 3b | 1.81 | 0.0 | 0.01 | Drill hole 97-9 | 237004 | 1.36 | 0.0 | 0.01 |
| 57956 | 6a | 1.27 | 0.29 | 0.01 | Drill hole 97-3 | 236603 | 1.67 | 0.49 | 0.01 |
| 57957 | 6a | 1.55 | 0.24 | 0.01 | Trench SLT-1/101 | ||||
| 57958 | 6c | 0.52 | 0.17 | 0.01 | Trench SLT-1/202 |
114 m from the western wall zone.
21.2 m wide zone.
The mean values for the drill core samples are 1.77% Li2O (Micon samples) and 1.68% Li2O (Avalon samples), which is a 5% difference. This is considered a very low level of difference for drill core duplicates. Micon stated in the 1999 Prefeasibility Study report (Micon, 1999) that it was satisfied that its check assay results corroborated, overall, the assay data reported by Avalon. The data are given as scatter plots in Figure 12.3 for lithium and Figure 12.4 for rubidium.
97
Figure 12.3
Plot of XRAL (Original) versus Micon/Chemex (Check) Analyses for Li2O
![]()
Figure 12.4
Plot of XRAL (Original) versus Micon/Chemex (Check) Analyses for Rb2O
![]()
98
| 12.4 | AVALON2016 DATAVERIFICATION |
| 12.4.1 | Database Checks |
Historic data currently contained in Avalon’s Maxwell GeoServices DataShedTM database was sourced digitally from a database created by Micon in 1999. Micon provided the data to Avalon in Excel spreadsheets in 2011. A data verification process was undertaken to confirm that the source data from Micon are accurate and complete once they were imported into DataShedTM. The verification included comparison of assay values in DataShedTM versus the values reported on the original Certificates of Analysis, verification of values in the ‘DH Collars’ table of DataShedTM against the original drill hole logs and verification of location survey values.
| 12.4.2 | Original Assay Certificate Checks |
As of 6 July, 2016, the database contained records for 2,790 downhole samples which were assayed for the 1997, 1998 and 2001 drill programs. A random sampling of 12% of the assay values contained in DataShedTM were compared against the values as reported on the original certificates of analysis provided by XRAL. No errors were found in the downhole assay values as entered into DataShedTM from the original Micon database.
It is to be noted that the assays entered in DataShedTM are reported as oxide percentages, while the original assays for drill programs are reported by element in parts per million (ppm). The conversion factors and calculations from element to oxide were also checked and accepted as accurate.
The DataShedTM oxide entries, original assay element assays, and conversion factors are summarized in Table 12.4.
Table 12.4
Conversion Factors from Element to Oxide
| DataShedTM Units (%) | Certificate of Analysis Units (ppm) | Conversion Element to Oxide |
| Li2O | Li | 2.1528/10000*Element |
| Ta2O5 | Ta | 1.221/10000*Element |
| Cs2O | Cs | 1.06/10000*Element |
| Rb2O | Rb | 1.094/10000*Element |
The assay values were exported from DataShedTM into an Excel spreadsheet which was used for the remainder of the verification work. Oxides converted to their elemental form were compared with the values as reported on the original Certificate of Analysis. A total of 271 sample assays were selected for verification in this manner, over all, four of the reported elements.
Trench samples were exported into Excel in the same manner. The trench samples begin with a global positioning system (GPS) location for the start of the trench, then a reading in metres, of distance to the next sample. As such, the trench samples were entered into DataShedTM as though they were drill holes.
99
| 12.4.3 | Re-assay of Drill Core in 2016 |
| 12.4.3.1 | Certified Standard |
Avalon prepared a certified rock lithium analysis standard by shipping 16 kg of SRP to CDN in Langley, British Columbia. CDN is a commercial laboratory that specializes in preparation of standards for the mineral exploration industry. The procedure included drying, crushing, grinding, screening and packaging the 16 kg sample. The result was 665 packages each containing 25 g of the standard material. A Round Robin analysis procedure was then completed with five samples of the material being shipped to each of six laboratories for lithium analysis, with associated analytical methods performed, with methods in bold font below applying to Li2O:
| 1. | Actlabs, Ancaster, ON: |
| a. | Ultratrace-7 Na2O2 fusion, both ICP-OES and ICP-MS finish. | |
| b. | Code-8, 4-Acid Digestion with ICP-OES finish. |
| 2. | Bureau Veritas, Vancouver, BC: |
| a. | PF370, Peroxide fusion ICP-ES finish. | |
| b. | LF200 (Whole rock extended), Aqua Regia digest followed by ICP-ES/MS finish. |
| 3. | AGAT Lab, Burnaby, BC: |
| a. | 201079 (Na2O2 digestion, ICP-OES finish). | |
| b. | 201676 (whole rock). |
| 4. | ALS, Vancouver, BC: |
| a. | CCP-PKG01, Trace elements reported from three digestions with either ICP-AES or ICP-MS finish: lithium borate fusion for the resistive elements (ME-MS81), a four-acid digestion for the base metals (ME-4ACD81) and an aqua regia digestion for gold related trace elements (ME-MS42). | |
| b | ME-ICP82b, Na2O2 Digestion, ICP finish. |
| 5. | SGS, Lakefield, ON: |
| a. | GE ICM90A, Na2O2 Fusion, combined ICP-AES and ICP-MS finish. |
| 6. | Intertek Genalysis, Perth, Australia: |
| a. | FB1/XRF, Fused Disk preparation for XRF, Analysed by XRF Spectrometry. | |
| b. | FP1/MS, Sodium peroxide fusion (Zirconia crucibles) and Hydrochloric acid, ICP-MS finish. |
Previously certified Avalon rock standards, which have significant lithium values (developed for the East Kemptville Tin-Indium Project), were included with the subsamples of the proposed standard. However, these are rather low in lithium, of the order of 500 ppm, to be a future suitable standard for Separation Rapids Lithium Project analyses. However, these standards served as an additional quality control check on the Round Robin analysis results.
100
The Round Robin yields the following results for the new Separation Rapids lithium rock analysis standard, usingall laboratory assay values:
| Standard: | STD_SR2016 | |
| Calculated mean: | 1.4995 | |
| Calculated standard deviation: | 0.057 | |
| Lower limit: | 1.3856 | |
| Upper limit: | 1.6133 |
Figure 12.5 shows the results of the 2016 Round Robin test.
Figure 12.5
Run Chart for Lithium for Standard in Round Robin Test – All Results, 2016
![]()
As can be seen in Figure 12.5, all the assay values, with the exception of instances 31-35, are within a narrow band of 1.421% Li2O to 1.542% Li2O, which is itself well within 2 standard deviations as calculated using all 35 data points. Instances 31-35 were provided by one laboratory (referred to here as Lab E) utilizing ICP analysis which exceeded or close to 2 standard deviations from the statistics for all six laboratories.
The analysis was rerun, removing instances 31-35 from Lab E, and the run chart for this data is provided as Figure 12.6.
101
Figure 12.6
Run Chart of Lithium for Standard with One Laboratory Removed (2016)
![]()
This yielded the following aggregate statistics:
| Standard: | STD_SR2016 | |
| Calculated mean: | 1.4882 | |
| Calculated standard deviation: | 0.039 | |
| Lower limit: | 1.4099 | |
| Upper limit: | 1.5665 |
In the case with Lab E/ICP (but Lab E/Fusion retained) removed, the difference in the means of each remaining laboratory is small, a 1.29% decrease with removal of Lab E from the data set of all laboratories. The standard deviation also decreases by 42%, a significant change. All remaining laboratories’ assay values used in Figure 12.6 are within two standard deviations of the mean of all data.
The decision was made to accept the recalculated statistics for the values shown in Figure 12.6 as the certified values for standard STD_SR2016. These certified values are reported in Table 12.5 as accepted mean 1.488% Li2O and a standard deviation of 0.039% Li2O, a relative standard deviation of 2% compared to 4% with all six laboratories (including Lab E).
Table 12.5
Summary of Round Robin Data for all Laboratories on Standard STD_SR2016
| Laboratory | Count | Median | Mean | StDev | Minimum | Maximum |
| A | 5 | 1.443 | 1.451 | 0.036 | 1.421 | 1.507 |
| B | 5 | 1.471 | 1.477 | 0.022 | 1.455 | 1.507 |
| B | 5 | 1.466 | 1.468 | 0.016 | 1.449 | 1.492 |
| C | 5 | 1.460 | 1.461 | 0.031 | 1.425 | 1.494 |
| D | 5 | 1.500 | 1.503 | 0.010 | 1.493 | 1.517 |
| E | 5 | 1.531 | 1.536 | 0.044 | 1.481 | 1.593 |
102
| Laboratory | Count | Median | Mean | StDev | Minimum | Maximum |
| F | 5 | 1.522 | 1.521 | 0.016 | 1.503 | 1.542 |
| Overall | 35 | 1.485 | 1.488 | 0.039 | 1.421 | 1.593 |
It was concluded that the lithium standard was a suitable standard for QA/QC of Separation Rapids drill core samples. The certified value for the standard SR2016 is 1.488% Li2O with a standard deviation of 0.039% Li2O for future analyses of Separation Rapids samples.
| 12.4.3.2 | Core Re-analysis Using Certified Standard (2016) |
As the original assay procedure did not include the insertion of certified assay standards for lithium, Avalon completed a program of re-assaying a limited amount of drill core with the insertion of the certified lithium standard prepared as described above. The key points of this re-analysis involved:
| • | At least 30 drill core samples. | |
| • | Cover all subunits of the pegmatite lithology. | |
| • | Samples would correspond to the sample intervals originally sampled. |
As long as these points were adhered to, it was considered that the results would be valid for comparing original assays with the 2016 assays.
The procedure is described in Section 11.2 above and resulted in 42 quarter core samples which were submitted to ALS for analysis and can be compared to the assays from the 1990s.
The comparison is shown in Figure 12.7 with the statistics given in Table 12.6.
103
Figure 12.7
Comparison of Original Lithium Analyses (Pedersen, 1998a) with Core Duplicates (“Field Resample”) Reanalysis (2016)
![]()
Table 12.6
Statistics Relevant to Figure 12.7– Li2O Analyses
| Number of Samples | Mean Li2O XRAL (%) | Mean Li2O Chemex (%) | Standard Deviation Li2O XRAL (%) | Standard Deviation Li2O Chemex (%) | CoV Li2O XRAL | CoV Li2O XRAL | sRPHD1 (mean) |
| 42 | 1.42 | 1.42 | 0.44 | 0.43 | 0.31 | 0.31 | -0.08 |
1Relative percent half difference.
The comparison of the original XRAL assay values reported by Pedersen (1998a) to the 2016 core duplicates (“field resample”) shows a small positive bias for the 2016 samples at smaller Li2O concentrations, crossing to an even smaller negative bias at higher Li2O concentrations. The regression line is virtually identical to the 45° line between 1.2% and 2% Li2O, which is where the majority of the mineralized samples lie. The mean values for each laboratory are identical at 1.42% Li2O, with a high R2of 92.23% . Further, the sRPHD, at -0.08, is an extremely low number compared to the mean values. This results in confirmation of the historic data by the subsequent re-analysis with inserted certified standards.
104
Figure 12.8 and Table 12.7 provide the comparison for rubidium analyses.
Figure 12.8
Comparison of Original Rubidium Analyses (Pedersen, 1998a) with Core Duplicates (“Field Resample”)
(2016)
![]()
Table 12.7
Statistics Relevant to Figure 12.8 –Rb2O Analyses
| Number of Samples | Mean Rb2O XRAL (%) | Mean Rb2O Chemex (%) | Standard Deviation Rb2O XRAL (%) | Standard Deviation Rb2O Chemex (%) | CoV Rb2O XRAL | CoV Rb2O XRAL | sRPHD1 (mean) |
| 42 | 0.41 | 0.43 | 0.17 | 0.15 | 0.42 | 0.34 | -4.66 |
1Relative percent half difference.
Comparison of the original XRAL assays with 2016 core duplicates for Rb2O shows the same bias trend as Li2O, positive at low Rb2O concentrations, turning negative at high concentrations. The mean of the two laboratories’ data shows a small 5% difference (Table 12.7), with an acceptable R2 of 85.09% . This is a higher difference than for lithium but is still very low and within acceptable range for core duplicates assayed at different laboratories with different methods.
Along with the re-sampled drill core, four samples of the SR2016 internal certified standard were included with the 42 samples as part of the QA/QC process. The analyses are plotted in Figure 12.9. Note that the certified, acceptable results for the standard, as noted above, should lie within 1.48% Li2O with a standard deviation of 0.33, thus between 1.447% Li2O and 1.513% Li2O to be within one standard deviation. All of these values comply with this criterion.
105
Figure 12.9
Lithium Analyses for Lithium Standard SR2016
![]()
| 12.5 | DRILLHOLECOLLARS ANDSURVEYDATA |
As noted in Section 10.0, all historic drilling was undertaken in the period 1997 to 2001. Between the 1997, 1998 and 2001 drill campaigns, 69 holes were drilled and sampled on the Separation Rapids property, as well as samples taken from five trenches. The drill hole data (hole number, depth, UTM location, azimuth, dip) in the DataShedTM database were compared to the data originally published in the 1998 Assessment Report (Pedersen, 1998a). The majority of the data were found to be identical and complete; however, there were some differences between the two data sources, which are discussed below.
Holes were drilled using NQ-wireline (47.6 mm core). The holes, spaced 25 m apart, were drilled in the central and widest part of the SRP between sections 240W and 460W. All drill holes were inclined at either 45° or 60°.
Downhole surveys, using a Tropari instrument, were carried out by Avalon, with measurements being taken at two or more regular down-hole intervals, with one of the measurements at the end of each hole. Infrequent acid tests also were completed.
In the review of the Avalon database, drill hole angle and the maximum hole depth were both verified as being the same in the original report of Pedersen in 1998 and in the DataShedTM database. Elevation readings in metres in the database and drill logs are identical, with the exception of the third decimal place, which is not considered material.
The comparison is summarized in Table 12.8.
106
Table 12.8
Difference in Database Coordinates and Survey Coordinates
(Difference = Original Survey – Database)
| Statistic | Easting (Difference) | Northing (Difference) |
| Mean | 40.94 | -6.34 |
| Standard deviation | 1.17 | 7.69 |
| Standard deviation, % | 3 | -121 |
None of the data sources state whether the UTM coordinates are in NAD83 or another standard. The differences do not correspond to the difference between NAD27 and NAD83.
The location of the drill hole collars is noted in a number of available data sets. First, the original typed drill logs for the holes from 1997 to 1999 give the collar location both in the project grid and UTM coordinates. Second, data comprising project grid locations produced by a surveyor at the time is available from the data supplied by Micon from the original project digital drill database. Copies of hand-written surveyor’s notations of UTM locations are available that appear to be surveyed UTM locations. Easting and northing coordinates were reported on original drill logs based on the local project grid (“mine grid”) referred to as “AVL97”, while the 2001 drill holes were reported both in AVL97 and UTM coordinates. In the database, all northings and eastings are tabulated in UTM coordinates.
The latter records, representing 30 of the drill holes, when compared to the coordinates within the database, indicate some consistent differences that average 40.9 m in the easting and 3 m in the northing. The northing differences, at 3 m, are considered not to be material, but the easting difference is material. However, records indicate that this table of UTM locations was, in fact, derived by manually plotting the drill holes on a government topographic map and scaling off the UTM coordinates. This method is not considered accurate or precise and, thus, it is the likely explanation of the UTM discrepancy.
| 12.5.1 | Drill Hole Collar Location Verification Using Handheld GPS (2016) |
In 2016, Avalon identified four drill holes in the field by locating the drill collar casing protruding from the ground. Utilizing a hand-held GPS, the UTM location of each drill hole was measured. These locations are compared with the surveyed coordinates in the DataShedTM database as per Table 12.9.
107
Table 12.9
Survey Coordinates for Handheld GPS Unit (2016) Compared to Database UTM Coordinates
| Measured in Field July, 2016 (NAD83) | DataShedTM Database | UTM Difference | ||||
| Hole Number | UTM East | UTM North | UTM East | UTM North | UTM East | UTM North |
| 97-26 | 388520 | 5569065 | 388523.3 | 5569062.1 | -3.3 | 2.9 |
| 98-53 | 388519 | 5569048 | 388524.1 | 5569044.5 | -5.1 | 3.5 |
| 98-38 | 388497 | 5568990 | 388500.2 | 5568987.9 | -3.2 | 2.1 |
| 98-43 | 388393 | 5569045 | 388395.7 | 5569043.4 | -2.7 | 1.6 |
| Mean difference | -3.6 | 2.5 | ||||
As can be seen, the difference between the database coordinates and handheld GPS are minor, being in the range of 1.6 m to 5.1 m, which considering the inherent inaccuracies of a handheld GPS are acceptable. According to the United States Geological Survey (www.water.usgs.gov/osw/gps/), the accuracy of a handheld GPS is within 3 m to 10 m depending on the model. In addition, the differences given here are systematic with a slight negative for the easting and positive for northing. It is important to note that the handheld GPS was set to give UTM readings in NAD83 (Zone 15). As a result, it was verified that the readings in the database are NAD83 readings (Zone 15), which was the system current at the time of its creation.
This concordance between the database UTM location and the check readings in 2016 results in the conclusion that the drill hole locations in the digital database are correct and reliable. It also demonstrates that the UTM coordinates on the hand-written surveyor sheets that have the 40 m consistent difference are in error due to the manual scaling methodology utilized.
| 12.5.2 | Drill Hole Collar Location Re-Surveys (2017) |
For the holes drilled in 2001, only locations obtained from a handheld GPS had been recorded and added to the Project database. Hence Avalon commissioned a re-survey of their collars in 2017 and also verified some of the collars of the holes drilled in 1997 and 1998 (Table 12.10) . The 2017 location surveys were performed by Eric Rody of Rugged Geomatics of Kenora, certified Ontario Land Surveyor and Canada Lands Surveyor, using a Trimble RTK system consisting of two R8 receivers and high-powered radio coupled to a TS2 data collector. The accuracy of the collar location surveys was estimated at 0.02 m in the vertical and horizontal directions. Not all 2001 collars could be located in the field, likely because the casings have been removed.
The seven 2001 drill holes that were located in the field show deviations from the database values ranging from -2.1 to 1.0 m, 6.5 to 3.8 m and -3.4 to 0.6 m for the eastings, northings and elevations, respectively. The largest deviations are thus found for the northings. The database has been updated with the new survey values obtained in 2017.
For the six re-surveyed 1997 and 1998 drill holes, the deviations are smaller and range from 0.7 to 1.0 m, 0.0 to 0.4 m and -1.2 to 0.1 m. These differences are relatively minor and are considered acceptable with regards to the evolution of survey accuracy between 1997-1998 and 2017.
108
Table 12.10
Surveyed Coordinates Obtained in 2017 Compared to Database UTM Coordinates
| Hole ID | Easting (m) | Northing (m) | Elevation (m) | ||||||
| Database | 2017 | δ | Database | 2017 | δ | Database | 2017 | δ | |
| SR01-58 | 388579 | 388576.9 | -2.1 | 5568972 | 5568969.2 | -2.8 | 334 | 334.5 | 0.5 |
| SR01-61 | 388171 | 388171.1 | 0.1 | 5569125 | 5569118.5 | -6.5 | 363 | 361.1 | -1.9 |
| SR01-62 | 388197 | 388197.4 | 0.4 | 5569098 | 5569092.8 | -5.2 | 359 | 355.6 | -3.4 |
| SR01-63 | 388225 | 388223.1 | -1.9 | 5569083 | 5569086.8 | 3.8 | 355 | 353.2 | -1.8 |
| SR01-64 | 388599 | 388600.1 | 1.0 | 5569043 | 5569042.5 | -0.5 | 333.5 | 333.4 | -0.1 |
| SR01-65 | 388649 | 388649.9 | 0.9 | 5569015 | 5569013.5 | -1.5 | 330 | 327.4 | -2.6 |
| SR01-67 | 388675 | 388673.0 | -2.0 | 5569012 | 5569011.4 | -0.6 | 329 | 329.6 | 0.6 |
| SR97-03 | 388418.6 | 388418.0 | -0.6 | 5568959.4 | 5568959.4 | 0.0 | 349.8 | 349.9 | 0.1 |
| SR97-14 | 388221.6 | 388221.0 | -0.6 | 5569125.5 | 5569125.6 | 0.1 | 360.9 | 360.9 | 0.1 |
| SR98-34 | 388549.0 | 388550.0 | 1.0 | 5569003.0 | 5569003.4 | 0.4 | 336.5 | 335.3 | -1.2 |
| SR98-38 | 388500.2 | 388499.5 | -0.7 | 5568987.9 | 5568988.0 | 0.1 | 338.8 | 338.8 | 0.0 |
| SR98-43 | 388395.7 | 388395.0 | -0.6 | 5569043.4 | 5569043.5 | 0.1 | 351.1 | 351.1 | 0.0 |
| SR98-53 | 388524.1 | 388523.4 | -0.7 | 5569044.5 | 5569044.6 | 0.1 | 335.3 | 335.3 | 0.0 |
| 12.6 | AVALON2017/18 DRILLPROGRAMSASSAYDATAVERIFICATION |
The overall statistics for the number of blanks, standards, etc., is given in Table 12.11. The following Sections discuss the results in detail.
Table 12.11
Statistics for the Quality Control of the Two Assay Batches Analyzed in 2017 and 2018
| Assay batch | TB17103883 (2017) | TB18043795 (2018) | ||
| Count | % | Count | % | |
| Samples | 251 | 100 | 204 | 100 |
| Avalon standards | 10 | 4% | 8 | 4% |
| Laboratory standards | 110 | 44% | 99 | 49% |
| Field blanks | 7 | 3% | 4 | 2% |
| Laboratory blanks | 48 | 19% | 43 | 21% |
| Laboratory duplicates | 42 | 17% | 40 | 20% |
| Reject duplicates | 26 | 10% | 25 | 12% |
| 12.6.1 | External Standards |
| 12.6.1.1 | Avalon's Standard |
Avalon has prepared a certified analytical standard for the Project utilizing rock material from the SRLD. This analytical standard, SR2016, was created from rock collected from the SRLD outcrop, prepared at CDN Laboratory in British Columbia and was subjected to a Round Robin involving six independent laboratories in Canada and Australia. The certified value for the standard based on the round robin is 1.488 ± 0.039 wt.% Li2O (1 σ).
109
Together with the drill core assay batches, powders of Avalon's lithium standard were analyzed (Figure 12.10) with one standard inserted per 25 samples. Overall, the values range between 1.5% and +5.0% from the expected value (-0.022 wt. % Li2O to +0.075 wt. % Li2O), which is within the 2σ range of the standard value (±7.6%) . Batch TB18043795 shows a slightly stronger positive average bias (+2.4%) compared to batch TB17103883 (+1.9%, Figure 12.10) . For the entire data set, there is a small positive bias in the analyses compared to the previously established standard values (+2.0% or +0.030 wt. % Li2O). This bias is considered by Avalon to be acceptable for resource estimation purposes.
Figure 12.10
Relative Differences of Repeat Analyses of Avalon's Lithium Standard (N = 18) to the Established Inter-Laboratory Value
(The analyses are shown in ascending sample number sequence for each batch)
![]()
| 12.6.1.2 | Standards Run by the Laboratory |
The reproducibility of the reference values for lithium in standards with certified ore-grade concentrations (NCSDC86303, NCSDC86304, SRM 181, SRM-183; Li2O = 0.459 to 6.39 wt. %) using method OG63 for both batches is between -4.3% and +3.2% and averages -1.0% . The reproducibility is considered acceptable. Using the ICP-MS method ME-4ACD81, the deviations from the certified standard values range between -11.5% and 32.7%, averaging 2.9% (corresponding to absolute values between -326 and +94 ppm, averaging -14 ppm), with three outliers at +16.3 ppm and twice -12.6 ppm for standards with 33.7 and 22.6 ppm, respectively.
For Cs, Rb and Ta, the deviation from the reference values of standards AMIS0085, AMIS0167, AMIS0304 and SY-4 (all contain these elements in trace concentrations) ranges from -22% to +34% and averages + 3%, excluding one aberrant analysis of the AMIS0304 standard and excluding the Ta concentrations measured for AMIS0304, which are all 119 to 149% higher than the provisional reference value (10.92 ppm). This is likely a problem related to the provisional data of this standard, as the other standards were reproduced adequately.
110
| 12.6.2 | Field Blanks |
As a field blank, inserted after every 40 samples, silica sand was used (Silica Sand used was manufactured by FMC Corporation and sold by McNunn and Yates, Kenora). In all field blank analyses (N = 10), lithium was at or below the detection limits of the analytical methods (10 ppm for method ME-MS81), Rb ≤ 23.3 ppm, Cs ≤ 0.76 ppm and Ta ≤ 0.4 ppm. There is thus no evidence for the contamination or switching of samples.
| 12.6.3 | Laboratory Blanks |
The laboratory blanks were at or below the detection limit for lithium via method OG63 (50 ppm) and method ME-MS81 (10 ppm). Rubidium in most of the blanks was below 0.2 ppm (the detection limit); two exceptions were recorded with 0.3 and 0.4 ppm. Tantalum was at or below the detection limit of 0.1 ppm in all but one of the blanks (0.2 ppm). The blanks for cesium were lower than 0.06 ppm (detection limit 0.01 ppm). These results indicate that cross-sample contamination did not affect the laboratory analyses.
| 12.6.4 | Within Laboratory Duplicates |
The laboratories conducted duplicate analyses of prepared pulps in both analytical batches. For the lithium analyses using the ICP-MS method ME-4ACD81, the duplicates were reproduced with deviations from the first assay between -1.6% and +7.0% with an average of +0.8% . For the ICP-OES method OG63, the lithium analyses of the duplicates were between -2.1% and +5.1%, averaging 0.5% . For Rb, Cs and Ta, the deviations of the duplicate analyses were +1.7% on average and ranged from -21.7 to +30.6%, excluding a single outlier for Ta with repeat analyses of 0.1 and 0.2 ppm (equivalent to a 100% relative deviation). The largest deviations were observed for trace concentrations. These laboratory duplicate results are considered acceptable by Avalon.
| 12.6.5 | Core Duplicates |
Four core duplicates of medium- to high-grade samples were randomly chosen and analyzed to evaluate the reproducibility of the assay data and the presence or absence of bias in sampling, i.e., during the core splitting process. Core duplicates comprised the second half of previously sampled drill core. Standards and blanks in the same sample batch as the duplicates showed no values outside the acceptable range. Given the nature of the mineralization with relatively even grade distribution and lack of domination of veining in a barren substrate, sampling bias would be expected to be very low.
111
The duplicate assays show a good reproducibility for lithium (-8 to +3% difference between original and duplicate sample) and acceptable reproducibility for Rb, Cs and Ta (-30 to +26%) for three of the samples (Table 12.12) . One sample (drill hole SR17-73 from 279 to 281 m) however, shows a large deviation of +63% from the original assay for lithium (the other elements show moderate deviations within the range of the other samples). Notably, this sample has a significantly lower lithium concentration than the other three samples. Inspection of the corresponding drill core photos of this samples showed coarse patchy petalite + spodumene, indicating that nuggety mineralization may be responsible for the higher lithium concentration due to sample inhomogeneity.
The data indicate that in three out of four randomly chosen medium- to high-grade core duplicate samples, there is no bias in the lithium grade due to the core splitting. However, in one of the four core duplicates (a sample with an atypical nuggety texture), there is a significant bias with the duplicate being 63% higher than the original assay.
Table 12.12
Core Duplicate Analyses with Corresponding Original Assays and Relative Deviations
| Hole ID | from (m) | to (m) | Core Duplicate analyses | Original analyses | Deviations | |||||||||
| Li (wt. %) | Rb (ppm) | Cs (ppm) | Ta (ppm) | Li (wt. %) | Rb (ppm) | Cs (ppm) | Ta (ppm) | Li | Rb | Cs | Ta | |||
| SR-17-71 | 199 | 201 | 0.879 | 4250 | 51.6 | 56.2 | 0.86 | 4770 | 51.5 | 67.3 | 2% | -11% | 0% | -16% |
| SR-17-72 | 179 | 181 | 0.684 | 4330 | 52.4 | 70.8 | 0.74 | 4940 | 74.4 | 56 | -8% | -12% | -30% | 26% |
| SR-17-73 | 279 | 281 | 0.688 | 2630 | 33.3 | 71.2 | 0.423 | 3630 | 44.5 | 66.6 | 63% | -28% | -25% | 7% |
| SR-17-74 | 145 | 147 | 0.844 | 8990 | 328 | 156 | 0.819 | 8550 | 318 | 166.5 | 3% | 5% | 3% | -6% |
| Averages | 0.774 | 5050 | 116.3 | 88.6 | 0.711 | 5473 | 122.1 | 89.1 | 15% | -11% | -13% | 3% | ||
With the exception of one outlier, the results of this work indicate that there is no significant sampling bias (Table 12.12) . In fact, the average of the original analyses is slightly lower than the duplicate core samples (0.711 vs. 0.774 wt. %, Table 12.12), indicating that there was no positive bias in the sampling.
| 12.6.6 | Pulp Duplicates |
Five Li-mineralized drill core pulp samples (Li = 0.80 - 0.92 wt. %), which were selected by Avalon, were re-analyzed in a separate assay batch by ALS using method OG63 in batch TB17138018. The reproducibility for lithium was better than 1.2% in all cases and 0.7% on average.
| 12.6.7 | Reject Duplicates Analyzed by the Secondary Laboratory |
Fifty-one reject duplicates of mineralized rock were analyzed by a secondary laboratory, SGS Canada Inc. Instructions to the primary laboratory were to prepare a second 250 g split off the 90% passing 2 mm crushed material using a riffle splitter on every tenth core sample and then pulverize this. These were shipped to Avalon, where standards were inserted, and the samples sent to the secondary laboratory.
112
By using the reject material, the variance includes sample heterogeneity after the second crushing stage and potential contamination in the crushing stage in addition to analytical factors. The analyses show that there is no substantial systematic bias in the lithium concentration (with an overall average difference of -1.5% relative to the primary laboratory) and that the average absolute deviation is 13%, a value deemed acceptable (Figure 12.11, Figure 12.12) . Four outliers among the duplicates with >30% deviations (included in the calculated mean) deviate by -85.5%, +77.2%, -37.3%, and +67.5% relative to the lithium assays by the primary laboratory (Figure 12.11, Figure 12.12) . The fact that these differences are two positives and two negatives suggest this is a random effect and not bias. Similarity among the other measured elements precludes the possibility that the sample were switched accidentally. Hence, the deviations are due to sample heterogeneity and measurement errors.
For Rb, there are 8 duplicate samples with deviations between 21 and 65%; one duplicate deviates by 159%. The average absolute deviation is 22%. Despite these elevated deviation values, there is no significant systematic bias; the duplicate analyses are on average -1.9% lower than those of the primary laboratory. The duplicate analyses for Cs are on average 16% lower than those by the primary laboratory and the absolute deviations average 21%. The large deviation and negative bias are likely due to the low concentrations of Cs (2.9 -342 ppm, one sample with 2495 ppm) and possibly an analytical problem. Tantalum (also present in low concentrations, 1-134 ppm) is on average 1.3% lower than in the analyses by the primary lab (i.e., a very small negative bias) and the average of the absolute deviations is 30%.
113
Figure 12.11
Comparison Between the Lithium Assays of Crushed Reject Duplicates Analyzed by the Secondary
Laboratory (SGS) and Those Analyzed by the Primary Laboratory (ALS)
(The linear regression line and corresponding correlation coefficient are shown)
![]()
Figure 12.12
Deviation of Individual Lithium Analyses (N = 51) Relative to the Primary Laboratory and Average of all Deviations (in red)
(The X-axis represents the sequence of sample IDs in ascending order)
![]()
114
| 12.7 | DRILLHOLEAZIMUTHS |
| 12.7.1 | Historic Data |
Azimuths in the DataShedTM database were found to be consistently 1.8794° higher than the readings as reported in Pedersen 1998a. On examining the data from the original 2002 database, it was clear that the azimuths were referred to as “corrected” and 1.8794° were added to all originally recorded azimuths. This is very close to the correction for magnetic north in December, 1999, in the Separation Rapids area. However, it is not clear that the correction should have been applied as the azimuths in the original drill logs are reportedly true azimuths relative to true north (Pedersen, 2016b). At present, this is not considered a material issue as a difference of two degrees in azimuth is not material to resource estimation and, also, the difference is consistent for all drill holes.
| 12.7.1.1 | Collar Dip and Azimuth Verification Using a Handheld Compass |
In 2016, for the same four drill holes as discussed above (Table 12.9) with regards to survey locations, and using the casing still present, the azimuths were measured using a clinometer-equipped Suunto compass by Avalon staff, and the results are compared in Table 12.13 with the azimuths in the drill logs and those in the database information provided by Micon. The Suunto compass had been adjusted by the appropriate magnetic declination.
Table 12.13
Drill Hole Azimuths
| Hole Number | 1 | 2 | 3 | ||
| Field, Suunto, 2016 (°) | Original Drill Log (°) | DataShedTM Database (°) | Difference (column 2-1) (°) | Difference (column 3-1) (°) | |
| 97-26 | 180 | 180 | 181.88 | 0 | 1.88 |
| 98-38 | 178 | 180 | 181.88 | 2 | 3.88 |
| 98-43 | 176 | 180 | 181.88 | 4 | 5.88 |
| 98-53 | 174 | 180 | 181.88 | 6 | 7.88 |
The accuracy and precision of the Suunto compass is not sufficient to compare the azimuths quantitatively in detail. In addition, it is possible that the casings are not in their original orientations. However, it is worth noting that the orientations measured in 2016 are closer to those in the drill logs than the “corrected” database readings. Avalon believes that it was assumed that the azimuths on the original drill logs from the 1990s drilling were relative to magnetic north and that 1.8794° was the declination adjustment at the time. However, Avalon now considers this to be an error and that the drill holes were in fact intended to be oriented due south, not magnetic south.
| 12.7.1.2 | Collar Dip and Azimuth Verification Using Survey-Grade GPS |
Using an insert for the drill hole collars, Eric Rody of Rugged Geomatics of Kenora, certified Ontario Land Surveyor and Canada Lands Surveyor, measured two points along the extended collars and calculated the azimuths and dips from the spatial difference of the two points (Table 12.14) . The survey methods have been outlined in Section 12.5.2. The accuracy of this approach has been estimated to be 52 arc minutes or 0.87 decimal degrees by E. Rody for both dip and azimuth.
115
Table 12.14
Drill Hole Collar Dips and Azimuths Surveyed in 2017
| Hole ID | Dip (°) | Azimuth relative to UTM grid north (°) | ||||
| Database | 2017 | δ | Database | 2017 | δ | |
| SR01-58 | -55 | -52.9 | 2.1 | 161.35 | 159.4 | -2.0 |
| SR01-61 | -45 | -43.1 | 1.9 | 181.35 | 175.9 | -5.5 |
| SR01-62 | -45 | -42.5 | 2.6 | 181.35 | 183.3 | 2.0 |
| SR01-63 | -44 | -40.0 | 4.0 | 181.35 | 182.8 | 1.4 |
| SR01-64 | -45 | -41.7 | 3.3 | 181.35 | 180.4 | -0.9 |
| SR01-65 | -45 | -43.6 | 1.4 | 181.35 | 180.6 | -0.8 |
| SR01-67 | -45 | -42.8 | 2.2 | 181.35 | 183.2 | 1.8 |
| SR97-03 | -45 | -43.5 | 1.5 | 358.1 | 340.7 | -17.4 |
| SR97-14 | -45 | -42.2 | 2.9 | 178.1 | 181.1 | 3.0 |
| SR98-34 | -45 | -43.0 | 2.0 | 178.1 | 177.1 | -1.0 |
| SR98-38 | -45 | -42.3 | 2.7 | 178.1 | 182.5 | 4.4 |
| SR98-43 | -45 | -43.5 | 1.6 | 178.1 | 175.5 | -2.6 |
| SR98-53 | -50 | -46.8 | 3.2 | 178.1 | 175.6 | -2.5 |
The deviations from the values in the database range from 1.4 to 4.0° and average 2.5° for the dips and from 5.5 to 4.4°, averaging -0.2° for the azimuths with one outlier at -17.4° for drill hole SR97-03, which has been excluded from the calculation of the average (Table 12.13) . There are a number of error sources that could cause the difference between the historic and the 2017 dip and azimuth surveys, including original measurement errors, modifications of the casing immediately after drilling and accidental/natural modifications between 1998 and 2017. For the outlier with an azimuth deviation of 17.4°, a modification of the casing is the most likely cause. Nevertheless, the reproducibility of the azimuths is overall excellent. For the dips, it should be noted that the measured values are consistently flatter than those recorded in the database. However, the average difference of 2.5° is considered acceptable considering that the collar dip was likely not measured originally but set by the drill contractor.
For the resource estimates prepared by Avalon in 2017 and 2018, the azimuths of the historic holes were converted from the original values (which were measured relative to local exploration grid north in 1997 and 1998, and likely relative to geographic north in 2001) into values relative to UTM grid north by applying the appropriate grid declinations.
| 12.7.2 | Drill Programs 2017-2018 |
The downhole azimuth and inclination were surveyed using a magnetic Devishot multi-shot tool (Devico) at intervals of 6 m. Measurements for which a disturbance of the normal magnetic field was indicated were removed from the data set. Magnetic reference data was obtained from the NRCAN calculator (http://geomag.nrcan.gc.ca/calc/mfcal-en.php) using the decimal degree coordinates 50.263446, -94.565650. The approximate values for the total intensity of magnetic vector and its inclination are 57100 nT and 75.2°, respectively. The following thresholds were used for deciding which data were disturbed:
116
| • | A deviation of >1000 nT for the magnetic vector. | |
| ||
| • | A >1.5° deviation for the inclination of the gravity vector (indicates measurements that were taken while the instrument was moving). A 2% deviation from the drill hole average was used to eliminate potentially erroneous values. |
Other outlier values were also removed, e.g. >1° variations of azimuth or dip over 6 m intervals. The measured azimuths were corrected using the magnetic declination relative to geographic north, 0.7°, and the UTM grid convergence, -1.35° . The azimuths are thus given relative to UTM grid north.
For the 2017 drill holes, this procedure resulted in the removal of ~19% of the downhole survey data (Table 12.15) . There was sufficient data left in all cases to confidently estimate the downhole parameters for each hole. The dips of the holes generally flattened, and the azimuths curved in a dextral sense, i.e., with the drill rotation (Table 12.15) . Verification of the downhole surveys for drill hole SR17-74 using a Reflex EZShot downhole survey tool indicates generally good reproducibility, except for a zone of magnetic disturbance (Figure 12.13) . As an additional quality control, the drill hole casing azimuths and dips were measured using a custom GPS apparatus by Rugged Geomatics of Kenora. The reproducibility is generally acceptable, except for drill hole SR17-73 (Table 12.16) . This can be attributed to a disturbance of the casing by the bulldozer following drilling.
Table 12.15
Deviations of Dip and Azimuth in the Surveyed 2017 Drill Holes
| Drill Hole ID | Final Depth (m) | No. of Surveys Removed of Total | Flattening (°)1 | Azimuth Deviation (°)1 |
| SR17-70 | 276 | 7 / 45 | 8.6 | 5.7 |
| SR17-71 | 243 | 4 / 40 | 6.4 | 7.8 |
| SR17-72 | 228 | 12 / 38 | 2.1 | 5.1 |
| SR17-73 | 390 | 4 / 64 | 3.9 | 17.6 |
| SR17-74 | 336 | 18 / 56 | 9.7 | 11.4 |
1Flattening of the holes and azimuth deviations calculated by subtracting the mean of the last four from the mean of the first four survey points.
117
Figure 12.13
Comparison Between Downhole Surveys Done Using the Devishot and Reflex EZShot Tools for Drill Hole
SR17-74
![]()
Table 12.16
Comparison of Azimuth and Dip as Sighted, Measured on the Casing and as Determined by Downhole Surveys
| Sighted Values | Measured Casing | Mean of First FourDownhole Surveys | ||||
| DDH | Azimuth | Dip | Azimuth | Dip | Azimuth | Dip |
| SR17-71 | 180 | -55 | 178.5 | -54.2 | 178.8 | -54.0 |
| SR17-72 | 180 | -55 | 184.9 | -54.2 | 185.7 | -54.7 |
| SR17-73 | 165 | -63 | 160.7 | -60.9 | 164.5 | -64.9 |
| SR17-74 | 180 | -70 | 176.5 | -68.9 | 177.4 | -70.2 |
118
13.0 MINERAL PROCESSING AND METALLURGICAL TESTING
| 13.1 | INTRODUCTION |
A number of phases of metallurgical testing since 1997 have been completed by Avalon using samples obtained from of the SRLD. The work prior to 2014 was mainly undertaken by SGS Mineral Services at Lakefield, Ontario (SGS-L). This work not only included the recovery of petalite, but also a number of other mineral products which also can be found in the lithium bearing pegmatite.
The work since 2014 has focussed on the recovery of a petalite flotation concentrate and the subsequent processing of this concentrate to produce a high-quality lithium hydroxide product suitable for the lithium battery industry. However, more recent testwork has been completed in the separation of petalite, lepidolite and feldspars into separate saleable concentrates.
| 13.2 | HISTORICALMETALLURGICALINVESTIGATIONS(PRE-2014) |
| 13.2.1 | SGS-L (1997-1999 and 2009) |
An initial metallurgical testwork program was undertaken at SGS-L between 1997 and 2009.
The initial phase of this work began in November, 1997, with the objective of producing a high grade petalite product. The following information was gleaned from this testwork program:
| • | Overgrinding the feed and producing large amounts of fines would be detrimental to flotation recoveries. Thus, comminution and classification are important unit operations of the flotation plant. | |
| • | Iron is an important impurity in the final product and use of steel grinding media may increase the amount iron in the circuit. | |
| • | Use of hydrofluoric acid (HF) as a collector for petalite during flotation was required although a sodium fluoride and hydrochloric acid mix was potentially a suitable replacement for HF. |
The flowsheet developed recovered both a high and low grade petalite concentrate from the SRLD at 4.63% and 2.47% Li2O respectively, as well as a 5% Li2O spodumene concentrate.
| 13.2.1.1 | SGS-L (2009) |
Avalon successfully completed a metallurgical process research project in 2009 to develop a modified petalite process flowsheet, using sodium fluoride and hydrochloric acid as an alternative to hydrofluoric acid. This work was carried out at SGS-L using a 660 kg mineralized sample with an average grade of 1.52% Li2O. This program developed a flotation process to recover separate concentrates of mica, petalite, sodium feldspar, potassium feldspar and spodumene from the SRLD.
119
| 13.3 | RECENTMETALLURGICALTESTWORK |
Following renewed interest in the Separation Rapids Lithium Project in 2013 and 2014, Avalon was requested by potential customers to provide fresh samples of petalite concentrate. However, attempts by SGS-L to reproduce the results from 2009 were unsuccessful.
Avalon approached ANZAPLAN to develop a process for recovering the petalite and achieving target product grade of >4% Li2O. ANZAPLAN also investigated the recovery of a separate lithium mica product and a low impurity feldspar by-product and tested these products to determine their suitability in a number of industrial applications.
With the increasing demand for lithium chemicals to satisfy the growth in the battery and energy storage industries, Avalon investigated the potential to use petalite as a source of both lithium carbonate and hydroxide. Initial investigations for producing carbonate were completed by the Saskatchewan Research Council (SRC) and subsequently by Thibault and Associates Inc. (Thibault), which developed the process for producing lithium hydroxide.
| 13.3.1 | Mineral Processing Development Testwork |
Table 13.1 lists all the flotation/concentrator testwork reports issued since the Project was reactivated in 2014:
Table 13.1
List of Mineral Processing Testwork Reports
| Date | Author | Title | Remarks |
| May 2014 | ANZAPLAN | Processing of Petalite Ore from Separation Rapids | Petalite and feldspar flotation testwork on coarse grained mineralized material. |
| August 2014 | ANZAPLAN | Physical Processing of Fine- Grained Ore from Separation Rapids | As above but using fine grained mineralized material. |
| September 2014 | ANZAPLAN | Processing of Petalite Ceramic Application Tests | Sample of petalite was tested to determine key physical/chemical characteristics for ceramic applications. |
| September 2014 | ANZAPLAN | Sample Production of Petalite and Feldspar Concentrate | 20 kg of both materials were produced for providing samples to potential clients. |
| November 2014 | ANZAPLAN | Flowsheet and Core Machinery | Base flotation flowsheet and preliminary equipment recommendations. |
| December 2014 | ANZAPLAN | Locked Cycle Petalite Flotation Tests on Fine Grained Ore (FGO) | Bench scale determination of petalite flotation recovery with locked cycle tests. |
| June 2015 | ANZAPLAN | Pretests Pilot Scale Sample Production of Petalite and Feldspar Concentrates | To determine optimum conditions for magnetic separation and product filtration. |
| July 2015 | ANZAPLAN | Analysis of Nb/Ta in Magnetic Fraction of Separation Rapids Ore | Determination of nature of Nb and Ta in magnetics discard stream. |
120
| Date | Author | Title | Remarks |
| December 2015 | ANZAPLAN | Testing and characterization of a feldspar filler | Sample of feldspar was tested to determine key physical/chemical characteristics for filler applications. |
| May 2016 | ANZAPLAN | Pilot Scale Sample Production of 1t Petalite Concentrate | Bulk sample processed to produce a 1 t sample of petalite. |
| June 2016 | ANZAPLAN | Evaluation of HPQ Potential of Flotation Tailings from the Big Whopper Pegmatite | Testwork investigations to determine if tailings from pilot plant could be used to produce a high purity quartz product. |
| May 2016 | ANZAPLAN | Testing of Feldspar sample as potential paint filler | Note from Dorfner confirming their tests indicating Avalon feldspar matches existing paint fillers. |
| 2015/2016 | SRC | Various flotation tests’ analyses | Various small petalite sample production tests. |
| July 2016 | ANZAPLAN | Parameter Study Petalite Flotation – Part 1 Flotation Tailings | Testwork program to review the reduced flotation performance during the one tonne petalite pilot production program |
| October 2016 | ANZAPLAN | Sample Production – Feldspar Filler | Feldspar concentrate with lower silica content produced by introducing a number of cleaner flotation stages. This was then milled to a d50 of 6 µm and determined to have a SWERF value of 0.6%. |
| February 2017 | ANZAPLAN | Parameter Study Petalite Flotation – Part 2 | Testwork to adjust flotation parameters to improve petalite flotation process |
| June 2017 | ANZAPLAN | Support and Test Work for Separation Rapids Project | Testwork program to test all the updated petalite flotation parameters from previous work programs in 2017 |
| December 2017 | ANZAPLAN | Sodium and Potassium Reduction in Petalite Concentrate | Testwork to reduce the final sodium and potassium levels in the petalite concentrate from 2016 one tonne pilot |
| April 2018 | ANZAPLAN | Flotation of Lithium Mica | Testwork to produce lepidolite, petalite and feldspar concentrates |
The results and conclusions generated by this work are summarized below.
| 13.3.2 | Preliminary Physical Separation Testwork |
In late 2013, Avalon sent a small mineralized sample to ANZAPLAN to investigate producing a petalite concentrate containing >4.0% Li2O with a low iron content (<100 ppm). An analysis of the sample is presented in Table 13.2.
Table 13.2
Analysis of the 2013 Metallurgical Test Sample
| Description | Formula | Assay (%) |
| Lithium oxide | Li2O | 1.64 |
| Rubidium oxide | Rb2O | 0.34 |
| Silicon oxide | SiO2 | 74.9 |
| Aluminum oxide | Al2O3 | 16.2 |
| Iron oxide | Fe2O3 | 0.25 |
| Titanium dioxide | TiO2 | <0.01 |
121
| Description | Formula | Assay (%) |
| Potassium oxide | K2O | 2.29 |
| Sodium oxide | Na2O | 3.26 |
| Calcium oxide | CaO | 0.10 |
| Magnesium oxide | MgO | 0.04 |
| Manganese oxide | MnO | 0.24 |
| Phosphorus pentoxide | P2O5 | 0.05 |
| LOI 1,000°C | 0.65 |
The sample was a mix of coarse and fine grained pegmatitic rock. Since the degree of mineral inter-growth for the coarse and fine grained texture differed, sensor based sorting was used in order to separate coarse grained material (CGO) from the fine grained material (FGO). Figure 13.1 presents the procedure used to separate the CGO and FGO and Table 13.3 presents a summary of the feed sample and product analyses.
Figure 13.1
Sample Preparation and Separation Procedure
![]()
122
Table 13.3
Sensor Based Sorting Product Analyses
| Process | Mass Recovery (%) | Analyses (%) | Recovery (%) | |
| Li2O | Fe2O3 | Li2O | ||
| FGO plus < 8 mm fraction | 57.3 | 1.27 | 0.32 | 46.4 |
| Combined CGO fraction | 46.4 | 1.95 | 0.20 | 53.6 |
| Feed sample | 100.0 | 1.58 | 0.27 | 100.0 |
A comparison of the FGO and CGO modal mineralogy for two size fractions is presented in Table 13.4. For both size fractions, the modal analysis shows higher proportions of petalite and K-feldspar and lower proportions of mica, quartz and Na-feldspar in the CGO compared to FGO.
Table 13.4
Comparison of FGP and CGO Modal Mineralogical Analyses
| Mineral | Size Fraction 0.02-0.1 mm | Size Fraction 0.1-0.3 mm | ||
| CGO | FGO | CGO | FGO | |
| Petalite | 37.8 | 22.1 | 38.3 | 23.0 |
| Spodumene | 0.2 | 0.1 | 0.1 | 0.1 |
| Mica | 6.8 | 11.0 | 9.0 | 11.5 |
| Quartz | 18.8 | 23.0 | 16.9 | 20.3 |
| Na-feldspar | 24.3 | 34.6 | 25.6 | 37.0 |
| K-feldspar | 11.6 | 8.5 | 9.8 | 7.5 |
| Other | 0.5 | 0.7 | 0.3 | 0.6 |
A comparison of the liberation showed >90% liberation for all minerals for the fine size fraction and around 90% liberation of petalite and feldspar in the coarser fraction (0.1 -0.3 mm) for both the FGO and CGO.
| 13.3.2.1 | Tests Using CGO |
Following some scoping tests, a magnetic separation plus flotation circuit was developed which was able to produce a petalite concentrate grading 4.09% Li2O with iron content below 0.01% Fe2O3. The flotation recovery of petalite to this product for both the 0.1 -0.3 mm fraction and the 0.02 to 0.1 mm fraction were approximately 74-75%, based on the flotation feed.
The recovery of feldspar from the petalite tailings was investigated using a specific reagent suite and approximately 84% and 72% of the feldspar feeding this circuit were recovered into a feldspar concentrate for the coarse fraction and fine fraction, respectively.
| 13.3.2.2 | Tests Using FGO |
Since the degree of intergrowth of iron bearing and valuable minerals is higher in the fine-grained mineralization, a separate program of testwork was conducted using this material. A beneficiation process based on the CGO tests was used as the basis for the FGO test program.
123
Using a similar flowsheet to the coarse-grained mineralization, a petalite concentrate assaying 4.0% Li2O and <0.01% Fe2O3 was achieved, albeit with relatively low flotation recoveries of around 20% and 41% for the 0.1 -0.3 mm and 0.02 -0.3 mm size fractions, respectively.
The feldspar flotation tests, using the CGO test procedure, were also completed using the FGO sample fraction. These results were similar to the CGO tests with high feldspar yields into a concentrate containing <0.01% Fe2O3.
It was concluded during this phase of the flowsheet development testwork that optical sorting will be required to remove the gangue mineral amphibolite ahead of the flotation process as this also reports to the petalite concentrate making the target Li2O grade difficult to achieve.
| 13.3.2.2 | FGO Locked Cycle Tests |
The two size fractions (0.1 -0.3 mm and 0.02 -0.3 mm) were combined for the Locked Cycle Tests (LCT) using FGO material. The objective of the LCT was to try and improve the relatively low petalite recoveries achieved during the FGO flotation static tests.
Using a slightly modified flowsheet, the LCT did produce a 4.0% Li2O petalite concentrate with less than 0.01% Fe2O3. The flotation recovery was approximately 50%, which was an improvement.
| 13.3.3 | Magnetic Separation Tests |
In order to optimize the magnetic separation process, samples of Separation Rapids mineralization were sent to Metso in Sala, Sweden, for extensive testing to determine optimal magnetic separator machine settings and matrix selection. A total of 28 tests were carried out on 3 samples at different size fractions, at varying matrix loads and flushing rates. Table 13.5 compares the best Metso results with the results achieved by ANZAPLAN using similar material.
The test results suggest that combining the two size fractions for magnetic separation yields similar results to feeding each size fraction separately and that a setup based on Metso Test HGMS 24-1 using a single stage unit with medium matrix will provide the best results.
Table 13.5
Magnetic Separation Test Results
| Li2O (%) | Fe2O3 (%) | Mass (%) | Li2O Recovery | Matrix Load (g/cm3) | |
| Fraction 0.1-0.3 mm | |||||
| Feed | 1.5 | 0.27 | 100.0 | 100.0 | - |
| Metso non-mag | 1.5 | <0.01 | 83.5 | 83.5 | 1.6 |
| ANZAPLAN | 1.4 | <0.01 | 68.7 | 67.6 | - |
124
| Li2O (%) | Fe2O3 (%) | Mass (%) | Li2O Recovery (%) | Matrix Load (g/cm3) | |
| Fraction 0.02-0.1 mm | |||||
| Feed | 1.4 | 0.37 | 100.0 | 100.0 | - |
| Metso non-mag | 1.4 | <0.01 | 85.6 | 85.6 | 1.6 |
| ANZAPLAN | 1.5 | 0.01 | 85.8 | 82.2 | |
| Fraction 0.02-0.3 mm | |||||
| Feed | 1.5 | 0.30 | 100.0 | 100.0 | - |
| Metso non-mag | 1.4 | <0.01 | 85.5 | 85.5 | 0.8 |
| ANZAPLAN | Tests not done using combined size fractions | ||||
| 13.3.4 | Filtration Tests |
There are a number of key filtration stages in the flowsheet, including filtration for reagent recycle as well as dewatering of flotation feed, petalite rougher tails, petalite second cleaner concentrate and petalite fourth cleaner concentrate. Washing of the final concentrates during filtration was also deemed important to remove extra salt and reduce final fluorine levels. Materials for testing were prepared and the tests were conducted at an equipment manufacturer in Germany. The filtration testwork results are presented in Table 13.6.
Table 13.6
Filtration Test Results
| Number | Description | Particle Size (mm) | Washing | Moisture (%) |
| 1 | Tailings petalite rougher- scavenger flotation | 0.02-0.3 | Reduction of brine content | 11.9-13.3 |
| 2 | Concentrate petalite cleaner flotation stage 2 | 0.02-0.3 | Reduction of brine content | 10.5-13.5 |
| 3 | Petalite product | 0.02-0.3 | Reduction of acid and F Content | 8.0-9.1 |
| 4 | Feldspar product | 0.02-0.3 | Reduction of acid and F Content | 6.6-7.7 |
| 5 | Quartz (Tailings FS Flotation) | 0.02-0.1 | Reduction of acid and F Content | 9.6-10.5 |
| 6 | Feed magnetic separator | 0.02-0.1 | Not Required | 16.4-17.8 |
| 7 | Non-magnetic fraction | 0.02-0.1 | Not Required | 16.2-19.7 |
| 13.3.5 | Ceramic Application Tests |
To review the suitability of using Avalon’s petalite and feldspar in the ceramic market, ANZAPLAN conducted the following ceramic application tests:
| • | Hot Stage Microscopy: to analyze melting behavior of the material. | |
| ||
| • | Dilatometry: to measure volume changes in the material as it temperatures. melts at high | |
| ||
| • | Firing colour: to determine firing colour of the material as it melts. |
Based on the results of these tests on the petalite and feldspar concentrates, the samples were deemed suitable for the following possible applications in ceramics:
125
| • | Glazes and frits within the respective range of firing temperature between 1,150°C and 1,300°C. | |
| • | A source of lithium for heat-resistant glass and cookware. | |
| • | Sintering agent in ceramic body material for the production of stoneware and porcelain. | |
| • | A non-plastic material or as alternative/replacement of chamotte in ceramic bodies for earthenware or other low-fired ceramic materials. |
A potential additional application for petalite is to reduce the coefficient of thermal expansion in ceramic bodies and glazes.
| 13.3.6 | One Tonne Petalite Concentrate Production Test |
In August, 2015, Avalon engaged ANZAPLAN to produce one tonne of petalite concentrate, using the flowsheet and conditions developed from previous tests. For this test program, the coarse and fine grained mineralized samples were combined.
Approximately 30 t of crushed mineralized sample, sized 8-25 mm, was delivered to Germany for processing in a pilot plant facility. The sample was first wet screened to remove any -6 mm material, optically sorted to remove dark coloured gangue minerals then crushed to -0.3 mm and classified to remove -0.1 mm fines before undergoing magnetic separation to remove iron minerals using a Metso unit. Non-magnetic material was then forwarded to petalite flotation with the objective to produce a >4.0% Li2O low iron petalite product.
The flotation pilot plant was initially set-up to recycle the brine streams to minimize flotation reagent consumptions. However, selectivity issues in the rougher flotation stages prevented the production of a suitable petalite product at reasonable recoveries. Following some additional bench scale testing the pilot test continued with reduced collector dosages and open circuit production without brine recirculation and the 1 tonne sample of petalite concentrate was successfully produced. The analysis of the petalite concentrate is presented in Table 13.7.
Table 13.7
Chemical Analysis of the Pilot Plant One Tonne Petalite Concentrate Product
| Description | Formula | Assay(%) | Trace Elements | |
| Element | ppm | |||
| Lithium oxide | Li2O | 4.0 | Fe | 44 |
| Rubidium oxide | Rb2O | 0.06 | Cr | 0.6 |
| Silicon oxide | SiO2 | 77.8 | Mn | 22 |
| Aluminum oxide | Al2O3 | 16.6 | Ti | 2.5 |
| Iron oxide | Fe2O3 | <0.01 | Co | <0.5 |
| Titanium dioxide | TiO2 | <0.01 | Ni | <0.5 |
| Potassium oxide | K2O | 0.6 | Cu | 1.0 |
| Sodium oxide | Na2O | 0.4 | V | <0.5 |
126
| Description | Formula | Assay(%) | Trace Elements | |
| Element | ppm | |||
| Calcium oxide | CaO | <0.01 | F | 500 |
| Magnesium oxide | MgO | <0.01 | ||
| Manganese oxide | MnO | <0.01 | ||
| Phosphorus pentoxide | P2O5 | <0.01 | ||
| LOI 1,000°C | 0.5 | |||
Subsequent investigations identified a number of key recommendations which needed to be incorporated into the flotation circuit. These included the following:
| • | Grind top size should be reduced from 0.3 mm to around 0.25 mm. | |
| • | HF dosage to be controlled by flotation feed tonnage and not simply by slurry pH. | |
| • | Some of the recycled water will need to be neutralized before recycling in order to control pH. | |
| • | It will be necessary to partially remove dissolved ions (especially Al, S, Mg, Ca) in the recycle water as these tend to interfere with the flotation chemistry as their concentration increases. | |
| • | Collector dosage needs to be reduced. |
The effectiveness of these changes was determined during a subsequent test program (discussed below).
| 13.3.7 | Feldspar Filler Tests |
The potential to use the feldspar concentrate filler for the paint and other industries was investigated by ANZAPLAN. The material was milled to three different product sizes (50% passing size (d50) of 2.5, 6.3 and 23 µm) and analyzed for a number of physical characteristics.
The results from these tests were considered promising although the two finer products contained slightly elevated amounts (1.3% and above) of size-weighted respirable crystalline silica (SWERFcs) which could possibly be reduced during flotation by introducing additional cleaner stages. A SWERFcs value greater than 1% means that the material is classified as hazardous.
A sample of the d50 6.3 µm material was also tested as filler in a number of actual commercial indoor paint recipes (2 German and 1 US) and compared to a commercially available material currently being used as paint filler. Avalon’s material compared favourably showing almost the same results with regards rheology, density, brightness, colour, scrub resistance and gloss.
The feldspar used to produce the above filler products was recovered from a simple rougher-only flotation circuit so ANZAPLAN then produced a feldspar concentrate through a process involving cleaner stages. The impact of this was a reduction in silica content of the concentrate from 2% to 1.5%, plus a final SWERFcs value of 0.6% after grinding to a d50 of 6 µm.
127
| 13.3.8 | Petalite Recovery Optimization Testwork Program |
A two-part testwork program was completed to further investigate the effect of certain individual process parameters on flotation results following observations made during the one-tonne petalite production pilot. The first part of the study was to analyse the tailings produced from the one-tonne petalite pilot plant to identify and quantify causes for suboptimal flotation performance. The second part of the program reviews various flotation parameters and adjusts them to optimise the flotation process.
| 13.3.8.1 | Examination of Flotation Tailings |
Samples of the flotation feed material, and three different tailings batches were collected from the one tonne petalite pilot plant. The material was sieved and separated into five different grain size fractions to analyze for lithium content. It was shown that petalite content increased with increasing particle size, indicating reduced petalite flotation efficiency in the coarser fractions. Mineralogy of the various sized fraction samples can be seen below in Figure 13.2.
Figure 13.2
Comparison of Modal Mineralogy of Tailings (Individual Size Fractions)
![]()
Liberation of the individual minerals was also examined, which showed that the petalite liberation was good, ranging between approximately 91-93 % in all size fractions. Thus, it was concluded that petalite liberation was not the reason for the poor flotation performance.
128
From the mineralogical investigation of the tailings, it was recommended to reduce the top particle size of flotation feed and use a narrower particle size distribution to improve flotation efficiency.
The optimization program also investigated the impact of water recycling on flotation performance as the pH gradually dropped over time. The following conclusions were reached:
| • | At least part of the flotation water has to be removed from the circuit and neutralized to adjust the pH-value in the flotation circuit (to maintain a steady value). | |
| • | pH cannot be used to regulate HF dosage, which was the previous practice. HF has to be added at fixed dosage rates based on added solids (tph). | |
| • | Assays of the process water show the concentration of the following elements Al, Si, Ca, Mg, Na and K in solution gradually increase. | |
| • | Neutralization can remove or reduce most of the dissolved elements in the process water and may be a potential solution for recycling of the process water. | |
| • | Collector dosages should be reduced to 10% when operating in a closed circuit, to maintain a constant collector concentration in the flotation feed. |
| 13.3.8.2 | Petalite Flotation Optimization |
Following the work completed on pilot plant petalite flotation tailings, a more detailed testwork program using fresh ore was undertaken to confirm previous results. Table 13.8 below lists the parameters investigated and the results and recommendations from the optimized tests.
Table 13.8
Flotation Operating Parameters Investigated
| Parameter | Results / Recommendations |
| Grind size | Reducing grind size to 150 micron from 300 improved Li2O recovery in the rougher scavenger stage from 60 to 71 wt.%. |
| Collector dosage | A collector dosage of 700 g/t in the rougher scavenger stage |
| Frother dosage | A frother dosage of 60 g/t in rougher-scavenger stage is recommended for petalite flotation |
| Hydrofluoric acid dosage | HF dosage in the rougher-scavenger stage can be reduced to 2,000 g/t without negative effect on the flotation results |
| Brine concentration | Brine concentration can be reduced to 8% in petalite flotation |
| Temperature | Temperature of flotation slurry is recommended to be maintained between 10 and 22°C. Elevated temperatures adversely affect lithium recovery. |
| Cell agitator speed | Increasing agitator speed leads to a decrease in lithium oxide recovery. |
| Alteration of ore over time | A flotation test with a sample which was stored over 10 weeks in water was conducted to evaluate if alteration may have a negative influence. A slightly negative effect on recovery (5 percentage points) was observed therefore storage of processed intermediate products prior to flotation in wet state should be avoided |
129
| Parameter | Results / Recommendations |
| Water recirculation with and without water treatment | In water recirculation tests flotation performance gradually declined without water treatment and the pH value decreased from cycle to cycle from 2.0 down to 1.3. However, tests with water treatment using calcium hydroxide to neutral pH, flotation performance remained steady. Therefore, water treatment of the recirculated water is recommended. |
| Attrition scrubbing | When applying attrition scrubbing, lithium recovery in the rougher-scavenger stage (at comparable Li2O grades in the concentrate) was improved from 71 wt. % (2.2 wt. % Li2O) to 78 wt. % (2.3 wt. % Li2O). |
| 13.3.8.3 | Testwork Confirmation |
Following the mineralogical and process optimization testwork, ANZAPLAN conducted additional flotation tests incorporating all the recommendations in order to confirm the flotation results.
The sample was ground to a P80 of 150 µm and deslimed at 20 µm. The flotation then followed the following flowsheet in Figure 13.3 below. In total, 4 tests were conducted with the 150 µm material. Table 13.9 shows the conditions for each of the tests conducted.
Table 13.9
Summary of Flotation Test Conditions
| Test Number | Conditions |
| F1 | 2000 g/t HF in Rougher Scavenger with 10 wt. % brine |
| F2 | 2000 g/t equivalent HF using NaF/HCl in Rougher Scavenger with 10 wt. % brine |
| F3 | 2000 g/t HF in Rougher Scavenger with 8 wt. % brine |
| F5 | 2000 g/t equivalent HF using NaF/HCl in Rougher Scavenger with 8 wt. % brine |
The first flotation stages (rougher, scavenger, cleaners 1 and 2) are used to reject feldspar and were conducted in KCl/NaCl brine using the mixture of Flotigam K2C (70%) and PEG-oleate (30%) as collectors. After the second cleaner stage, the intermediate petalite concentrate was filtered, washed with water and fed to final cleaner stages 3 and 4. Here the remaining quartz is removed to produce a final petalite concentrate. These sections were conducted in water (as opposed to brine) using Flotigam 4343 as collector.
HF is an activator for petalite and was added in all flotation stages. As an alternative to HF, sodium fluoride (NaF) and hydrochloric acid was tested. The NaF dosage was adjusted to introduce an equal amount of fluorine as compared to HF addition. Table 13.10 shows a summary of the results in each of the four flotation tests.
130
Figure 13.3
Updated Petalite Flotation Flowsheet 2017
![]()
131
Table 13.10
Summary of Flotation Test Results
| Test Description | Rougher Concentrate | Cleaner Concentrate | TailsLi2O Grade (%) | ||||
| wt.% | Li2O Grade (%) | Li2O Recovery (%) | wt.% | Li2O Grade (%) | Li2O Recovery (%) | ||
| F1 (10% brine and HF) | 61.0 | 2.3 | 82 | 13.8 | 4.1 | 33 | 0.8 |
| F2 (8% brine and HF) | 62.1 | 2.2 | 84 | 18.7 | 4.3 | 49 | 0.7 |
| F3 (10% brine and NaF) | 58.7 | 2.5 | 80 | 11.8 | 4.5 | 29 | 0.9 |
| F4 (8% brine and NaF) | 55.1 | 2.4 | 79 | 17.5 | 4.3 | 45 | 0.8 |
Note: recoveries indicated for “Cleaner Concentrate” are for open circuit tests and do not reflect final recoveries achievable with the recycling of cleaner tailings.
These test results suggest that brine dosage can be reduced to 8% from 10% for petalite flotation tests but using NaF/HCl as a substitute for HF will require additional optimization studies if it is to be considered a viable alternative as the results when using HF tended to be better.
| 13.3.8.4 | Process Water Recycling |
Water recycling and neutralization with calcium hydroxide to pH 7 was also investigated as part of the optimization study. With the neutralization around pH 7, the selectivity with regard to feldspar rejection was reduced. To remedy this, neutralization pH was reduced to 5.5 and recycling tests were carried out to assess the impact on recovery and grade of lithium oxide. After each cycle of neutralization, the solution was filtered prior to being recycled for flotation.
In all, nine cycles were completed using standard flotation conditions for each cycle. Petalite rougher and scavenger flotation stages were carried out in all cycles with cleaner stages
The rougher and scavenger flotation results suggested that even with water treatment there is a slight decrease in overall rougher/scavenger Li2O recovery over time suggesting there remains scope for some further optimization.
Cleaner flotation was conducted in cycles 8 and 9 with >4.0% Li2O grade being achieved in both tests. Results for cycle 9 are summarized in Table 13.11.
Table 13.11
Cycle 9 Petalite Flotation Results, 2000 g/t HF, 8% Brine
| Sample Description | wt. % | Grade (%) | Distribution (%) | ||
| Li2O | K2O+Na2O | Li2O | K2O+Na2O | ||
| Head | 100.0 | 1.6 | 5.5 | 100.0 | 100.0 |
| Scavenger tails | 48.0 | 0.8 | 8.6 | 23.3 | 75.4 |
| Cleaner tails 1 | 15.6 | 1.4 | 5.4 | 13.2 | 15.3 |
| Cleaner tails 2 | 9.3 | 1.8 | 3.5 | 10.2 | 5.9 |
| Cleaner tails 3 | 7.0 | 1.0 | 0.2 | 4.3 | 0.3 |
132
| Sample Description | wt.% | Grade (%) | Distribution (%) | ||
| Li2O | K2O+Na2O | Li2O | K2O+Na2O | ||
| Cleaner tails 4 | 1.9 | 3.4 | 0.7 | 3.8 | 0.2 |
| Cleaner 4 conc. | 18.2 | 4.1 | 0.9 | 45.2 | 2.9 |
| Combined Products | |||||
| Rougher conc. | 52.0 | 2.4 | 2.6 | 76.7 | 24.6 |
| Cleaner conc. 1 (brine) | 36.4 | 2.9 | 1.4 | 63.5 | 9.3 |
| Cleaner conc. 2 (brine) | 27.1 | 3.2 | 0.7 | 53.3 | 3.4 |
| Cleaner conc. 3 (water) | 20.0 | 4.0 | 0.9 | 49.0 | 3.1 |
| Cleaner conc. 4 (water) | 18.2 | 4.1 | 0.9 | 45.2 | 2.9 |
Based on these results, partial neutralization of process water to pH 5.5 followed by thickening and filtration of precipitated solids appears desirable.
From the optimization program, reagent dosage parameters and addition points for petalite flotation were developed as well as recommended conditioning and flotation times.
| 13.3.9 | Sodium and Potassium Reduction in Petalite Concentrate |
In October, 2017, Avalon requested ANZAPLAN to prepare a petalite concentrate with reduced sodium and potassium content, using material produced from the 2016 one tonne pilot plant campaign. ANZAPLAN completed the testwork and was able to produce 10 kg of low sodium and potassium high grade petalite (which Avalon calls “Super Petalite”). ANZAPLAN refloated the concentrate to reject sodium and potassium in order to achieve targets of < 0.5% Na2O and <0.4% K2O (ideally less than <0.4% Na2O and <0.2 % K2O).
Of the three tests undertaken, the best test produced a final concentrate that contained 0.22 % K2O and 0.13 % Na2O. The results for this test (F3) are summarized in Table 13.12 below. The procedures for bench scale test F3 were applied to a bulk concentrate campaign where a total of 12 kg of upgraded concentrate was produced. This work was able to demonstrate that it was possible to produce a 4.5% Li2O petalite concentrate with a relatively low sodium and potassium content.
Table 13.12
Best Flotation Test Result for Reducing Sodium and Potassium in Petalite
| Test F3 | Weight (%) | Grade | Distribution | ||||
| Li2O (wt.-%) | K2O (wt.-%) | Na2O (wt.-%) | Li2O (wt.-%) | K2O (wt.-%) | Na2O (wt.-%) | ||
| Head (calc.) | 100 | 4.1 | 0.8 | 0.4 | 100 | 100 | 100 |
| Petalite rougher tails | 17.9 | 3.0 | 2.3 | 1.3 | 13 | 54 | 55.9 |
| Petalite cleaner tail 1 | 2.5 | 3.2 | 2.2 | 1.4 | 1.9 | 7 | 8.2 |
| Petalite cleaner tail 2 | 4.8 | 3.7 | 1.9 | 0.76 | 4.3 | 11.8 | 8.8 |
| Petalite cleaner tail 3 | 4.3 | 4.1 | 1.2 | 0.5 | 4.2 | 6.8 | 5.1 |
| Petalite cleaner conc. 3 | 70.5 | 4.5 | 0.22 | 0.13 | 76.6 | 20.3 | 22 |
133
| Test F3 | Weight (%) | Grade | Distribution | ||||
| Li2O (wt.-%) | K2O (wt.-%) | Na2O (wt.-%) | Li2O (wt.-%) | K2O (wt.-%) | Na2O (wt.-%) | ||
| Combined products | |||||||
| Rougher conc. | 82.1 | 4.4 | 0.43 | 0.22 | 87 | 46 | 44.1 |
| Cleaner conc. 1 | 79.6 | 4.4 | 0.37 | 0.19 | 85.1 | 38.9 | 35.9 |
| Cleaner conc. 2 | 74.8 | 4.5 | 0.28 | 0.15 | 80.8 | 27.1 | 27.1 |
| Cleaner conc. 3 | 70.5 | 4.5 | 0.22 | 0.13 | 76.6 | 20.3 | 22 |
| 13.3.10 | Flotation of Lithium Mica |
In December 2017, 50 kg of Zone 6d material, which is relatively rich in lepidolite, was sent to ANZAPLAN to explore the possibility of producing lepidolite and petalite concentrates from the lepidolite rich zone. Table 13.13 shows the analysis of the sample.
Table 13.13
Analysis of Head Sample for Testing
| Sample ID | Unit | Analysis % | |
| Lithium oxide | Li2O | wt.-. % | 1.6 |
| Rubidium oxide | Rb2O | wt.-. % | 0.97 |
| Silicon oxide | SiO2 | wt.-. % | 72.2 |
| Aluminum oxide | Al2O3 | wt.-. % | 16.9 |
| Iron oxide | Fe2O3 | wt.-. % | 0.05 |
| Titanium dioxide | TiO2 | wt.-. % | 0.01 |
| Potassium oxide | K2O | wt.-. % | 2.79 |
| Sodium oxide | Na2O | wt.-. % | 4.0 |
| Calcium oxide | CaO | wt.-. % | 0.18 |
| Magnesium oxide | MgO | wt.-. % | <0.01 |
| Manganese oxide | MnO | wt.-. % | 0.21 |
| Phosphorous oxide | P2O5 | wt.-. % | 0.13 |
| LOI 1,000°C | wt.-. % | 0.9 |
A sub-sample was sent for mineralogical analysis; the results are summarized in Table 13.14.
Table 13.14
Modal Mineralogy of Zone 6d Sample Calculated from Mineral Liberation Analysis Data
| Mineral | -150 µm |
| wt.-% | |
| Mica | 26.2 |
| Petalite | 8.0 |
| Spodumene | <0.1 |
| Quartz | 26.8 |
| Na-Feldspar | 33.8 |
| K-Feldspar | 4.7 |
| Others | 0.5 |
| Total | 100.0 |
134
Mineral liberation and inter mineral associations were estimated for the two lithium bearing minerals, namely petalite and lepidolite (mica). Figure 13.4 below presents the mineral liberation and association for the two minerals at a 150-micron grind. It can be seen that mica was 57% liberated while petalite was 52%. The non-liberated lithium minerals are mostly interlocked in binary phases with sodium and potassium feldspar.
Figure 13.4
Mineral Liberation and Association of Mica and Petalite
![]()
| 13.3.10.1 | Mica Flotation Reagent Collector Selection |
The crushed and deslimed ore sample was used for a series of mica flotation tests to identify a suitable collector. Out of the collectors tested, Flotigam EDA was considered the best for its ability to produce a high lithium grade and high Li2O recovery into a rougher-scavenger concentrate while using a relatively low reagent dosage.
| 13.3.10.2 | Sequential Flotation Tests for Lepidolite, Petalite and Feldspar |
Four bench scale sequential flotation tests for lepidolite, petalite and feldspar extraction were conducted by ANZAPLAN. The flowsheet for the testwork is illustrated in Figure 13.5.
135
Figure 13.5
Flowsheet for Sequential Flotation of Lepidolite, Petalite and Feldspar
![]()
The flowsheet consisted of three sections, one each for extracting lepidolite, petalite and feldspar separately. The sample is crushed, ground and deslimed prior to mica rougher and scavenger and three stages of mica cleaner flotation to produce a mica concentrate. Tailings from the lepidolite scavenger are filtered, re-pulped in brine and fed to the petalite flotation circuit. The petalite recovery process includes attrition scrubbing, magnetic separation and desliming before petalite rougher and rougher scavenger flotation, followed by four stages of petalite cleaning. Petalite scavenger tailings are fed to the feldspar rougher flotation circuit. which comprises a rougher circuit and three stages of cleaning. Results of the four open circuit tests can be seen in Table 13.15.
136
Table 13.15
Collection of Open Circuit Sequential Flotation Results
| Test ID | Unit | F5 | F7 | F8 | F9 |
| Collector type | - | EDA | EDA | EDA | EDA |
| Collector dosage / g/t | g/t | 130 | 130 | 270 | 110 |
| pH value flotation | - | 2.5 | 2.5 | 2.5 | 2.5 |
| Number of cleaner stages | 2 | 3 | 3 | 3 | |
| Mica Mass Distribution | |||||
| Mica flotation tails | wt.-% | 59.4 | 56.7 | 50.8 | 62.6 |
| Mica rougher conc. | wt.-% | 34.4 | 37.1 | 43 | 31.2 |
| Mica cleaner conc. 1 | wt.-% | 26.4 | 28.4 | 32.9 | 18.9 |
| Mica cleaner conc. 2 | wt.-% | 21.5 | 23 | 27.8 | 10.6 |
| Mica cleaner conc. 3 | wt.-% | - | 18 | 23.4 | 6 |
| Li2O Grade | |||||
| Mica flotation tails | wt.-% | 0.6 | 0.5 | 0.5 | 0.6 |
| Mica rougher conc. | wt.-% | 3.7 | 3.5 | 3.3 | 3.6 |
| Mica cleaner conc. 1 | wt.-% | 4.4 | 4.2 | 3.9 | 4.3 |
| Mica cleaner conc. 2 | wt.-% | 4.7 | 4.5 | 4.3 | 4.6 |
| Mica cleaner conc. 3 | wt.-% | - | 4.6 | 4.6 | 4.6 |
| Li2O Distribution | |||||
| Mica flotation tails | wt.-% | 20.4 | 18.3 | 15.5 | 25.1 |
| Mica rougher conc. | wt.-% | 73.9 | 76 | 79 | 68.9 |
| Mica cleaner conc. 1 | wt.-% | 67.5 | 69.8 | 73.3 | 50.5 |
| Mica cleaner conc. 2 | wt.-% | 58.4 | 61.2 | 68.1 | 30.1 |
| Mica cleaner conc. 3 | wt.-% | - | 48.9 | 60.7 | 17 |
| Petalite Flotation | |||||
| Feed petalite flotation (mass) | wt.-% | 59.4 | 56.7 | 50.8 | 62.6 |
| Petalite concentrate (mass) | wt.-% | 2.2 | 1.4 | 1.2 | 1.2 |
| Li2O analyses | |||||
| Feed petalite flotation | wt.-% | 0.6 | 0.5 | 0.5 | 0.6 |
| Petalite concentrate | wt.-% | 4.3 | 4.2 | 4.1 | 4.5 |
| Petalite flotation tailings | wt.-% | 0.3 | 0.2 | 0.2 | 0.4 |
| Li2O distribution | |||||
| Feed petalite flotation | wt.-% | 20.4 | 18.3 | 15.5 | 25.1 |
| Petalite concentrate | wt.-% | 5.4 | 3.6 | 2.8 | 3.4 |
| Chemical analysis petalite conc. | |||||
| Fe2O3petalite conc. | wt.-% | <0.01 | <0.01 | <0.01 | <0.01 |
| K2O in petalite conc. | wt.-% | 0.36 | 0.18 | 0.4 | 0.18 |
| Na2O in petalite conc. | wt.-% | 0.54 | 0.89 | 1.34 | 0.21 |
The sample used for this test program was hand-picked from surface material and, based on the testwork results, looks to have contained a relatively high proportion of lepidolite compared to petalite. However, the test program confirmed that concentrates of both lepidolite and petalite can be produced which meet target requirements in terms of lithium grade and impurity levels.
Feldspar flotation was only done on the petalite tails from one of the tests (F7). The results from this test are presented in Table 13.16. The test results were similar to previous feldspar flotation tests except that the Na to K ratio was much higher suggesting that the processing of the lepidolite ore could generate a sodaspar product.
137
Table 13.16
Feldspar Flotation Results
| F7 | Weight (%) | Grade (wt.%) | Recovery (%) | ||||||
| (Mica, Petalite, Feldspar) | Li2O | MnO | K2O | Na2O | Li2O | MnO | K2O | Na2O | |
| FS flotation feed | 24.3 | 0.2 | 0.02 | 1.02 | 8.73 | 3.2 | 2.2 | 8.5 | 52.3 |
| FS rougher conc. | 21.7 | 0.2 | 0.02 | 1.1 | 9.60 | 2.9 | 2.1 | 8.2 | 51.4 |
| FS cleaner conc.1 | 20.3 | 0.2 | 0.02 | 1.12 | 9.83 | 2.6 | 1.9 | 7.8 | 49.3 |
| FS cleaner conc.2 | 19.0 | 0.2 | 0.02 | 1.14 | 9.92 | 2.3 | 1.8 | 7.4 | 46.5 |
| FS cleaner conc.3 | 17.5 | 0.2 | 0.02 | 1.15 | 10.00 | 2.1 | 1.6 | 6.9 | 43.1 |
| 13.3.10.3 | Lepidolite Mica Flotation without Desliming |
ANZAPLAN conducted lepidolite flotation tests to investigate whether or not desliming was beneficial to the process. The results showed that concentrate lithium grades and mass pull declined significantly without desliming. The best test result with no desliming showed only 3.9% wt. Li2O in the final concentrate, far below the >4.5% achieved in the previous tests.
| 13.3.10.4 | Locked Cycle Test Results |
Following the open circuit three product sequential flotation tests, two 6-cycle locked cycle tests (LCT1 and LCT2) were undertaken by ANZAPLAN to recover lepidolite and petalite concentrates. The main process steps used were:
| • | Lepidolite rougher and scavenger flotation. | |
| • | Two lepidolite flotation cleaner stages. | |
| • | Recirculation of lepidolite cleaner tailings 1 and 2 to the rougher stage. | |
| • | Petalite rougher and scavenger flotation on lepidolite scavenger flotation tailings. | |
| • | Two petalite cleaner flotation stages in brine and two in water. | |
| • | Recirculation of petalite cleaner tails 1 and 2 to the petalite rougher stage. | |
| • | Recirculation of petalite cleaner tails 4 to petalite cleaner 3. | |
| • | Process water recycling during LCT1 but not during LCT2. |
In locked cycle test LCT1, stable lithium grades in the lepidolite concentrate in the range of 4.7 % Li2O were achieved. For the petalite flotation circuit the petalite concentrate grade ranged between 4.4 and 3.3 % Li2O with the lower grade during later cycles due to an accumulation of reagents in the process water. Reducing the frother addition improved the concentrate lithia grade.
Based on cycle 3 to 6 the LCT1 lithium recovery into the lepidolite concentrate was 71.1 % with a grade of 4.7 % Li2O. Using MnO distribution as an indicator for mica, 89.9% of the mica was captured into the lepidolite concentrate. The lithium loss to slimes was 6.1 %. The lithium recovery to the petalite concentrate was 7.8 % with a grade of 3.6% Li2O. Overall lithium recovery in products (lepidolite and petalite concentrate) was 78.9% .
138
Using test LCT2 cycles 3 to 6 the estimated lithium recovery to the lepidolite concentrate was72.8 % with a grade of 4.5 % Li2O. Approximately 90.5% of the mica was recovered to the lepidolite concentrate. The lithium loss during desliming was 6.5 %. and the petalite concentrate had an estimated grade of 4.3 % Li2O. The overall lithium recovery into the two products was 87.3 %. Results of the LCT1 and LCT2 are summarized in Table 13.17.
Table 13.17
Summarized Results of LCT1 and 2
| Weight | Grade | Distribution | |||
| Li2O | MnO | Li2O | MnO | ||
| wt.-% | wt.-% | wt.-% | wt.-% | wt.-% | |
| LCT1 – Combined Products | |||||
| Slimes | 6.94 | 1.5 | 0.2 | 6.2 | 6.6 |
| C1-C6 Mica Conc. | 24.14 | 4.8 | 0.75 | 67.2 | 85.2 |
| C1-C6 Petalite tails | 58.56 | 0.3 | 0.02 | 11.6 | 4.3 |
| C1-C6 Petalite cleaner Tails 3 | 1.92 | 2.1 | 0.01 | 2.3 | <0.1 |
| C1-C6 Petalite cleaner Conc.4 | 3.99 | 3.8 | 0.01 | 8.9 | 0.2 |
| C6 Cleaner. Tails | 4.45 | 1.5 | 0.18 | 3.9 | 3.7 |
| LCT1 – Projected Metallurgical Balance | |||||
| Slimes | 6.9 | 1.5 | 0.2 | 6.1 | 6.6 |
| Mica Conc. | 25.9 | 4.7 | 0.74 | 71.1 | 89.9 |
| Petalite Conc. | 3.7 | 3.6 | 0.01 | 7.8 | 0.2 |
| Petalite Flotation Tails | 63.5 | 0.4 | 0.01 | 15.1 | 3.3 |
| LCT2 – Combined Products | |||||
| Slimes | 8.4 | 1.3 | 0.17 | 6.5 | 6.6 |
| C1-C6 Mica Conc. | 27.5 | 4.5 | 0.71 | 71.4 | 90 |
| C1-C6 Petalite tails | 44.6 | 0.2 | 0.01 | 5.5 | 2.7 |
| C1-C6 Petalite cleaner Tails 3 | 7 | 0.1 | 0 | 0.4 | 0 |
| C1-C6 Petalite cleaner Conc.4 | 5.3 | 4.2 | 0 | 13 | 0 |
| C6 Cleaner Tails | 7 | 0.8 | 0.02 | 3.3 | 0.7 |
| LCT 2 – Projected Metallurgical Balance | |||||
| Slimes | 8.4 | 1.3 | 0.17 | 6.5 | 6.6 |
| Mica Conc. | 28 | 4.5 | 0.7 | 72.8 | 90.5 |
| Petalite Conc. | 5.9 | 4.3 | <0.01 | 14.5 | <0.1 |
| Petalite Flotation Tails | 57.6 | 0.2 | 0.01 | 6.2 | 2.9 |
Results of the concentrate analysis produced from LCT2 can be seen in in Table 13.18.
139
Table 13.18
LCT2 Concentrate Analysis
| Sample ID | Mica conc. Cycle 5 Cycle 6 | Petalite conc. Cycle 5 Cycle 6 | Petalite tails Cycle 5 Cycle 6 | ||||
| Li2O | wt-. % | 4.5 | 4.6 | 4.2 | 4.2 | 0.2 | 0.2 |
| Rb2O | wt-. % | 3.3 | 3.4 | 0.06 | 0.06 | 0.16 | 0.16 |
| SiO2 | wt-. % | 55.2 | 55.2 | 76.5 | 76.5 | 75.7 | 76.2 |
| Al2O3 | wt-. % | 25.5 | 25.4 | 17.0 | 17.0 | 15.1 | 15.2 |
| Fe2O3 | wt-. % | 0.03 | 0.03 | <0.01 | <0.01 | <0.01 | <0.01 |
| TiO2 | wt-. % | 0.02 | 0.01 | 0.01 | 0.01 | 0.01 | 0.01 |
| K2O | wt-. % | 8.03 | 8.02 | 0.37 | 0.37 | 0.93 | 0.87 |
| Na2O | wt-. % | 1.16 | 1.01 | 1.46 | 1.60 | 7.26 | 6.68 |
| CaO | wt-. % | 0.01 | 0.01 | 0.01 | 0.01 | 0.27 | 0.28 |
| MgO | wt-. % | <0.01 | <0.01 | <0.01 | <0.01 | <0.01 | <0.01 |
| MnO | wt-. % | 0.71 | 0.71 | <0.01 | <0.01 | 0.01 | 0.01 |
| P2O5 | wt-. % | 0.03 | 0.03 | <0.01 | <0.01 | 0.2 | 0.2 |
| LOI | wt-. % | 1.4 | 1.5 | 0.3 | 0.2 | 0.1 | 0.1 |
A feldspar concentrate was produced from the petalite tails from cycle 4-6 of test LCT1. The feldspar concentrate analysis is shown in Table 13.19.
Table 13.19
Feldspar Analysis from LCT1
| Sample ID | Feldspar Conc. | ||
| Lithium oxide | Li2O | wt.-. % | 0.3 |
| Rubidium oxide | Rb2O | wt.-. % | 0.21 |
| Silicon oxide | SiO2 | wt.-. % | 66.3 |
| Aluminum oxide | Al2O3 | wt.-. % | 21.5 |
| Iron oxide | Fe2O3 | wt.-. % | <0.01 |
| Titanium dioxide | TiO2 | wt.-. % | 0.01 |
| Potassium oxide | K2O | wt.-. % | 1.16 |
| Sodium oxide | Na2O | wt.-. % | 9.54 |
| Calcium oxide | CaO | wt.-. % | 0.41 |
| Magnesium oxide | MgO | wt.-. % | <0.01 |
| Manganese oxide | MnO | wt.-. % | 0.02 |
| Phosphorous oxide | P2O5 | wt.-. % | 0.3 |
| LOI 1,000°C | wt.-. % | 0.2 | |
| 13.3.10.5 | Mica Flotation from the Magnetics Product |
A sample of the magnetic fraction produced during a previous test program (using petalite sample) was used as the feed to a mica flotation test. Despite several stages of cleaning, a concentrate with only 2.0 wt. % Li2O was produced indicating the mica in this material was not lepidolite. The mica flotation concentrate also contained relatively high iron oxide (2.55%) and manganese oxide (1.23%) levels.
140
14.0 MINERAL RESOURCE ESTIMATES
Lithium, rubidium, tantalum, cesium and feldspar mineral resource estimates for the Separation Rapids Lithium Project have been prepared by Avalon under the supervision of Dr. Mercer, P.Geo. (ON), Vice President of Exploration of Avalon, and who is the Qualified Person for the resource estimates. This updated mineral resource estimate is based on the eight diamond drill holes drilled by Avalon in 2017 and 2018 in combination with the 1997 to 2001 drill holes, which were used in previous resource estimates. All steps of the geological modeling, variography analyses and resources estimation were performed using the Dassault Systemes/Geovia GEMS 6.8.1 Software.
| 14.1 | SUMMARY |
The Separation Rapids Lithium Project overall Measured plus Indicated mineral resource is estimated to be 8.41 Mt at a grade of 1.41% Li2O using a 0.6% Li2O cut-off grade, as summarized in Table 14.1. The Inferred mineral resource is 1.79 Mt at a grade of 1.35% Li2O. The total feldspar content of the mineralized zone is estimated at 43%. The two main mineralogical zones in the deposit, the petalite zone (6a, b, c) and the lepidolite + petalite zone (6d) have been estimated separately and contain combined Measured and Indicated resources of 6.42 Mt grading 1.41% Li2O and 1.99 Mt grading 1.41% Li2O, respectively (Table 14.1) . This mineral resource estimate was presented in an Avalon news release on May 23, 2018 and is deemed not to be significantly different from the previous estimate dated October, 2016.
Table 14.1
Separation Rapids, Mineral Resource Estimate at 0.6%Li2O Cut-off Grade
(As at 23 May, 2018)
| Class | Rock Unit | Tonnes (Mt) | % Li2O | % Ta2O5 | % Cs2O | % Rb2O | Wt. % feldspar |
| Measured | 6a, b, c | 2.425 | 1.440 | 0.005 | 0.010 | 0.322 | 44 |
| 6d | 0.939 | 1.410 | 0.008 | 0.027 | 0.473 | 40 | |
| Total | 3.364 | 1.431 | 0.006 | 0.015 | 0.365 | 43 | |
| Indicated | 6a, b, c | 3.992 | 1.391 | 0.006 | 0.012 | 0.338 | 44 |
| 6d | 1.049 | 1.402 | 0.009 | 0.025 | 0.469 | 40 | |
| Total | 5.041 | 1.393 | 0.007 | 0.014 | 0.366 | 43 | |
| Measured +Indicated | 6a, b, c | 6.416 | 1.409 | 0.006 | 0.011 | 0.332 | 44 |
| 6d | 1.989 | 1.406 | 0.009 | 0.026 | 0.471 | 40 | |
| Total | 8.405 | 1.408 | 0.007 | 0.015 | 0.365 | 43 | |
| Inferred | 6a, b, c | 1.308 | 1.351 | 0.007 | 0.017 | 0.342 | 44 |
| 6d | 0.483 | 1.346 | 0.008 | 0.020 | 0.427 | 40 | |
| Total | 1.791 | 1.349 | 0.007 | 0.018 | 0.365 | 43 |
Notes:
| 1. | This resource estimate is valid as of May 23, 2018. |
| 2. | CIM definitions were followed for Mineral Resources. |
| 3. | The Qualified Person for this Mineral Resource estimate is William Mercer, PhD, P.Geo. (ON). |
| 4. | The resource estimate is based on Avalon’s drilling of 74 previous holes totalling 11,644 m drilled between 1997 and 2017 and a further four holes totalling 1,282 m in 2018. |
| 5. | Drill data was organised in Maxwell DataShed™ and for estimation purposes was transferred to the Geovia GEMS 6.8 Software, wherein the block model was developed. |
141
| 6. | The geological units were modeled as outlined by drill core logs. |
| 7. | Resources were estimated by interpolating composites within a block model of 10 x 10 x 3 m blocks oriented along the deposit strike. |
| 8. | Grade interpolation used the Ordinary Kriging method combined with variograms and search ellipses modeled for each rock unit. For PZ unit, search ellipses of 50 x 35 x 15 m and 175 x 125 x 45 m were used for Passes 1 and 2, respectively. For LPZ unit, search ellipses of 35 x 25 x 8 m, 75 x 50 x 15 m and 115 x 75 x 25 m were used for Passes 1, 2 and 3, respectively. |
| 9. | Measured material was defined as blocks interpolated using Passes 1 and 2, using composites from ≥4 drill holes and a distance ≤25 m to the nearest composite and additional blocks with excellent geological and grade continuity. Indicated material includes blocks interpolated with Pass 1 and 2 search ellipses, using ≥3 drill holes and a distance ≤35 m to the nearest composite and blocks with geological and grade continuity. Inferred material was defined as blocks interpolated with all Passes, composites from ≥2 drill holes and interpolated geological continuity up to 40 m below diamond drill holes. |
| 10. | Two-metre composites were used, and no capping was necessary. |
| 11. | The mean density of 2.65 t/m3was used for Unit 6a, b, c and 2.62 t/m3for Unit 6d. |
| 12. | The cut-off grade reported in this resource estimate, 0.6% Li2O, is consistent with the previously published resource estimates by Avalon (Preliminary Economic Assessment, 2016; November 15, 2017 resource estimate). |
| 13. | The total feldspar contents were estimated utilizing QEMSCAN®analysis of 38 drill core intervals distributed throughout the deposit. |
| 14. | Mineral resources do not have demonstrated economic viability and their value may be materially affected by environmental, permitting, legal, title, socio-political, marketing, or other issues. |
The primary lithium-bearing minerals, petalite and lepidolite, are found within the ~600 m by ~80 m SRP. Surface mapping and results from 80 diamond drill holes were used to create a 3D model of the host lithology which was used to constrain the interpolation of assays.
| 14.2 | DRILLHOLEDATABASE |
The Separation Rapids Project drill hole database is a Maxwell DataShed™ system operated by Avalon Advanced Materials. All historic and recent drill hole data and QA/QC samples have been digitized and imported by Avalon staff. The database contains 80 diamond drill holes over a total length of 13,192 m drilled between 1997 and 2018 by Avalon. The core diameters are NQ and HQ for the 1997 to 2001 and 2017 to 2018 drill holes, respectively. For all drill holes, geological logs have been digitized. Assay values of Li2O, Rb2O, Cs2O and Ta2O5 are recorded for 3,243 mineralized samples and 148 country rock samples which were studied for environmental impact assessment purposes. The QA/QC procedures and results are discussed in detail in Section 12.0.
Downhole dip and azimuth measurements are acid tests and Tropari measurements for the 1997 to 2001 drill holes. For the 2017 to 2018 drill holes, a Devico Devishot multi-shot magnetic downhole survey tool was used.
| 14.3 | GEOLOGICALMODEL |
The 3D-geological model was prepared by interpreting drill hole intercepts along UTM grid north-south sections spaced ~25 m (see Figure 14.1) . Interpretative outcrop maps by Avalon (1998) were also used to aid the geological modeling. Units 6a, b, c and d represent the lithium-rich lithologies (Table 14.2) and of these, Units 6a and 6d are the most abundant. Units 6b and c were found to only show limited spatial continuity and, for the purpose of 3D modeling, were merged with Unit 6a to a combined rock Unit 6a, b, c. In addition, Units 6a, b, c are those that have little or no lepidolite and consequently, the lithium present is dominantly in petalite in these three Units. In contrast, Unit 6d which has petalite and lepidolite, is important to distinguish for metallurgical processing reasons. During mining these Units may need to be handled separately and consequently it makes sense to estimate 6a, b, c and 6d as distinctive Units.
142
To allow a simplification of the model, all subdivisions of rock Unit 3 were ignored and Units 2, 4, 5, 7 and 8 were merged to one model. The overburden was also modeled as a 3D geology wireframe. The rock units as used for the resource estimation are listed in Table 14.3 while Figure 14.1 presents a 3D view of the geology model. The wireframes were constructed by interpreting the lithological continuity between the drill sections.
143
Table 14.2
Geological Units, Based on Avalon (1998)
| Lithocode | Unit Name | Distinguishing characteristics | |||
| Ovb | Overburden | ||||
| 1 | Amphibolite (Separation Lake Metavolcanic Belt) | ||||
| • | Dark green-grey. | ||||
| • | Fine-grained, locally coarse, foliated and folded. | ||||
| a | Amphibolite | • | Local preservation of pillow flows. | ||
| • | Li and Cs metasomatism adjacent to pegmatite dykes: holmquistite (blue- violet acicular Li-bearing amphibole) and glimmerite (black-brown Cs-rich phlogopite). | ||||
| b | Intrusive equivalent | Coarse-grained variety of the amphibolite. | |||
| 2 | Pegmatitic granite (Winnipeg River Batholith) | • | Medium-grained, locally megacrystic, massive to poorly foliated | ||
| • | K-feldspar, quartz, albite | ||||
| 3 | SRP | Albitite | A few cm to 15 m wide, max. length of 120 m. | ||
| Grey-white to light pink | |||||
| Fine- to medium-grained, equigranular to seriate textures. | |||||
| a | aplitic | Locally magmatic banding (albite-rich and K-feldspar-rich layers). | |||
| • | Aplitic albite is the most common constituent. abundances of albite and K- feldspar variable. | ||||
| Mottled grey, heterogeneous, medium grained to megacrystic albite, K-feldspar in variable contents | |||||
| b | mottled | Light pink-orange K-feldspar megacrystals in finer-grained albitic groundmass | |||
| • | Potassium feldspar, albite, mica. | ||||
| 4 | Megacrystic K-feldspar – quartz zone | • | Coarse-grained, subhedral potassium feldspar megacrystals (larger than 5 mm) in a finer-grained (<2 mm) matrix of subhedral quartz, albite, potassium feldspar and minor mica. | ||
| • | Very minor petalite. | ||||
| 5 | Quartz-mica zone | • | Coarse grained, dominated by dark anhedral quartz with subordinate interstitial mica and K-feldspar. | ||
| • | No obvious petalite. | ||||
| 6 | Petalite-bearing zone | Petalite Pegmatite | |||
| a | Web-textured white petalite subzone (petalite – albite – K- feldspar – quartz) | Web/net textured white petalite + coarse K-feldspar, Li-mica envelopes around K-feldspar, petalite and in the matrix (albite + quartz groundmass) in thin section: spodumene. | |||
| b | Pink petalite subzone (petalite - quartz - albite - K-feldspar - mica) | megacrystic to porphyritic textures, pink to blue petalite. | |||
| finely-banded, strongly mylonitic / cataclastic | |||||
| c | Cataclastic 6AB (petalite – quartz | fine- to medium-grained petalite and feldspar | |||
| – albite – mica – K-feldspar) | mylonitic equivalent of 6A and 6B | ||||
| with coarser bands/lenses of 6A and 6B | |||||
| d | Lepidolite subzone (petalite - lepidolite (Li/Rb-rich mica)- albite - K-feldspar) | 10-25% lepidolite (purple), petalite, albite, K-feldspar, accessory fluorapatite and topaz, heterogeneous texture | |||
| 7 | Pegmatite granite | Heterogeneous, medium grained and locally containing megacrystic K- feldspar. along south contact likely equivalent to 3B/4 (possibly merge for modeling) – could be similar to the pegmatitic granite (Separation Pluton) | |||
| 8 | Pegmatitic granite (Separation Rapids Granite) | pegmatitic granite, locally with coarse muscovite | |||
| IF | Iron formation | sulfide-enriched lenses (mostly occurs outside of the deposit area) | |||
144
Figure 14.1
3D View of the Geology Models
![]()
Table 14.3
Lithological Units Used in Resource Estimation
| Rock code | Rock Type | Rock Unit Name |
| 1 | amphibolite | Amphibolite |
| 2/4/5/7/8 | granite | combination of various granitic units |
| 3 | albitite, feldspathic pegmatitic granite | Albitite |
| 6a, b, c | petalite-bearing pegmatitic granite | Petalite Pegmatite |
| 6d | lepidolite- and petalite-bearing pegmatitic granite | Lepidolite-Petalite Pegmatite |
| 9 | glacial till, soil | Overburden |
| 14.4 | ROCKDENSITY |
The average rock densities for the geological units that were modeled in 3D are listed in Table 14.4. All measurements were performed by Avalon staff by measuring the weights of drill core pieces in air and immersed in water. The density of Unit 6d is with 2.62 t/m3 slightly lower than that of Unit 6a, b, c (2.65 t/m3, Table 14.4) . The density values for Units 6a, b, c and 6d in Table 14.4 include all data up to the 2017 drilling campaign in order to provide consistency for resource update reporting. For the other rock units all data up to the 2018 drilling campaign were used. The mean density values including 18 and 22 additional measurements collected for Units 6a, b, c and 6d in 2018, yielded total means of 2.66 ± 0.10 and 2.61 ± 0.06 t/m3, respectively, which are consistent with the previous data as they overlap within the standard deviations (compare Table 14.4) . As the data coverage is insufficient to allow 3D interpolation of the density, the rock unit averages were used for the block model. The relatively low standard deviations show that the rock units are well-characterized by the available measurements.
145
Table 14.4
Statistics for Rock Density Measurements
| Rock Unit | Mean | Standard Deviation | No. of Measurements | Minimum | Maximum |
| 6a, b, c | 2.65 | 0.10 | 89 | 2.48 | 3.06 |
| 6d | 2.62 | 0.06 | 36 | 2.46 | 2.80 |
| 1 | 3.01 | 0.12 | 424 | 2.08 | 3.70 |
| 3 | 2.66 | 0.09 | 94 | 2.50 | 3.09 |
| 2/4/5/7/8 | 2.65 | 0.03 | 35 | 2.59 | 2.70 |
| 14.5 | DRILLHOLEASSAYDATA ANDSTATISTICS |
Assay statistics for lithium, rubidium, cesium and tantalum were calculated for the lithium-enriched units, a subset of the entire assay database (Table 14.5) . Units 6a, b, c and 6d have median sample interval lengths of 2.0 and 1.8 m, respectively. Unit 6d has higher mean lithium and rubidium concentrations than Unit 6a, b, c (1.480 vs. 1.373 wt. % Li2O and 0.526 vs. 0.319 wt.% Rb2O). Within the two units, the Li2O grades of the assays vary moderately around the median (Figure 14.2) . Unit 6d shows a near-normal grade distribution around a single mode (Figure 14.2) . The histogram for the Li2O assays in Unit 6a, b, c however, shows a bimodal distribution with an additional low-grade group and a scattered high-grade population (Figure 14.2) . An inspection of the data shows that the high-grade (i.e., >3 wt.%) Li2O assays in Unit 6a, b, c mainly have sample lengths <1 m.
Table 14.5
Average Assay Data Weighted by Interval Length for All Intervals, in wt.%
| Unit | wt.% | Length-Weighted Mean | Median | Mean | Σ | Minimum | Maximum |
| 6a, b, c (N = 1411) | Li2O | 1.387 | 1.449 | 1.373 | 0.534 | 0.000 | 4.557 |
| Rb2O | 0.327 | 0.305 | 0.319 | 0.143 | 0.000 | 1.772 | |
| Cs2O | 0.006 | 0.006 | 0.007 | 0.006 | 0.000 | 0.063 | |
| Ta2O5 | 0.012 | 0.005 | 0.014 | 0.031 | 0.000 | 0.445 | |
| 6d (N = 537) | Li2O | 1.527 | 1.539 | 1.480 | 0.426 | 0.035 | 2.840 |
| Rb2O | 0.532 | 0.520 | 0.526 | 0.176 | 0.089 | 1.510 | |
| Cs2O | 0.009 | 0.009 | 0.009 | 0.006 | 0.000 | 0.057 | |
| Ta2O5 | 0.018 | 0.011 | 0.022 | 0.041 | 0.001 | 0.532 |
146
Figure 14.2
Histograms for the Li2O Grade of the Assays in Rock Units 6a, b, c and 6d
![]()
The cumulative probability plots for the assays shows that, despite several outliers at elevated grade, there are no extreme values which would strongly bias the data set (Figure 14.3, Figure 14.4) . For Rb2O, Cs2O and Ta2O5, there are also no high-grade outliers. The data assay distribution indicates that capping of the grades is not necessary.
147
Figure 14.3
Cumulative Probability Plot for the Assays in Rock Unit 6a, b, c
![]()
Figure 14.4
Cumulative Probability Plot for the Assays in Rock Unit 6d
![]()
148
| 14.6 | COMPOSITING |
The Li2O, Rb2O, Cs2O and Ta2O5 assays including those from the boreholes drilled in 2018 were composited into 2 m intervals (the median sample length) from the top down within intersects between the drill holes and the 3D geology wireframes for Units 6a, b, c and 6d. The last interval was created when it was >0.3 m. For missing samples, a background value of zero was used for all elements. Hereby, two separate sets of composites were created for each of the two mineralogical rock types, 6a, b, c and 6d. Each composite was assigned a code for the corresponding geology wireframe, i.e., the specific pegmatite dike in which it is located. Table 14.6 lists the basic statistics for the composites.
Table 14.6
Basic Statistics for the Composites within the Lithium Pegmatite Geology Models
| Unit | wt.% | Median | Mean | Σ | Min | Max |
| 6a, b, c (N = 1,193) | Li2O | 1.436 | 1.351 | 0.455 | 0.000 | 2.884 |
| Rb2O | 0.315 | 0.326 | 0.101 | 0.000 | 0.758 | |
| Cs2O | 0.005 | 0.012 | 0.022 | 0.000 | 0.241 | |
| Ta2O5 | 0.005 | 0.006 | 0.003 | 0.000 | 0.032 | |
| 6d (N = 501) | Li2O | 1.464 | 1.389 | 0.421 | 0.000 | 2.82 |
| Rb2O | 0.473 | 0.481 | 0.176 | 0.000 | 1.2 | |
| Cs2O | 0.012 | 0.023 | 0.032 | 0.000 | 0.253 | |
| Ta2O5 | 0.008 | 0.009 | 0.005 | 0.000 | 0.026 |
In Table 14.7, the mean grades of the composites are compared to those of the original assays. The Li2O and Rb2O grades show moderate decreases of their means (-0.8 and -3.0%, respectively), which are due to the elimination of short intervals of elevated grade and inclusion of background (zero) grade material in the composites. The means of Ta2O5 and Cs2O show larger apparent relative deviations, which are, however, the result of only minor changes in absolute grade (Table 14.7) .
Table 14.7
Comparison Between the Mean Grades and Lengths of the Composites and the Original Assays within
the Lithium Pegmatite Geology Models
| Unit | wt.% Li2O | wt.% Ta2O5 | wt.% Cs2O | wt.% Rb2O | Length (M) | |
| 6a, b, c | Assays | 1.361 | 0.006 | 0.016 | 0.336 | 1.739 |
| Composites | 1.351 | 0.006 | 0.012 | 0.326 | 1.915 | |
| delta | -0.8% | -4.3% | -25.7% | -3.0% | ||
| 6d | Assays | 1.412 | 0.007 | 0.033 | 0.513 | 1.632 |
| Composites | 1.389 | 0.009 | 0.023 | 0.481 | 1.868 | |
| delta | -1.6% | 17.5% | -31.3% | -6.4% |
| 14.7 | VARIOGRAPHY |
The variography was performed separately on the composites for Units 6a, b, c and 6d, including the composites up to the 2017 drill holes, for those composites within the two largest dikes of each of the two pegmatite rock types. The search ellipse and variogram parameters were thus not modified between the 2017 and 2018 resource updates.
149
For Unit 6a, b, c, the linear downhole semi-variogram for Li2O indicates a range of ~8 meters, a nugget of ~0.18 and a sill of ~0.57 (Figure 14.5) . The 3D variography for Li2O indicates that the lowest variance, longest range (175 m) and the greatest number of pairs occurs along the 190° azimuth and 85° dip direction, i.e. near-vertical (Figure 14.6) . For the modelled 3D semi-variogram of the major axis, the nugget of 0.18 from the linear downhole semi-variogram and a range of 175 m, as indicated by the empirical data, were used (Figure 14.6) . The empirical semi-variograms in the semi-major and minor directions indicate ranges of ~125 and ~45 m, respectively (Figure 14.7, Figure 14.8) . These observations indicate that a search ellipse with radii of 175 x 125 x 45 m can be used for the interpolation of blocks in the inferred resource category and more constrained search ellipses adjusted proportionally for the measured and indicated categories (see Table 14.11 in Section 14.8) .
The empirical downhole semi-variogram for Li2O in Unit 6d indicates a nugget of 0.27 and a range of 16 m (Figure 14.9) . Based on the 3D variography, the main direction of Li2O grade continuity is horizontal along 115° with a range of 75 m (Figure 14.10) . The indicated range in the semi-major axis is 50 m (Figure 14.11); in the minor direction the data did not allow determination of a range, hence the range indicated by the downhole semi-variogram was used for the variogram model (Figure 14.12) . The variograms thus indicate that a search ellipse with radii of 75 x 50 x 15 m can be used to model the Li2O grades. This search ellipse was used for the indicated resource category; more constrained and expanded search ellipses were used for the measured and inferred categories, respectively (see Table 14.11 in Section 14.8) ..
Figure 14.5
Empirical Downhole Semi-Variogram and Variogram Model for Li2O in Unit 6a, b, c
![]()
150
Figure 14.6
Empirical Semi-Variogram and Variogram Model for the Major Axis of Li2O in Unit 6a, b, c
![]()
Figure 14.7
Empirical Semi-Variogram and Variogram Model for the Semi-Major Axis of Li2O in Unit 6a, b, c
![]()
151
Figure 14.8
Empirical Semi-Variogram and Variogram Model for the Minor Axis of Li2O in Unit 6a, b, c
![]()
Figure 14.9
Empirical Downhole Semi-Variogram and Variogram Model for Li2O in Unit 6d
![]()
152
Figure 14.10
Empirical Semi-Variogram and Variogram Model for the Major Axis of Li2O in Unit 6d
![]()
Figure 14.11
Empirical Semi-Variogram and Variogram Model for the Semi-Major Axis of Li2O in Unit 6d
![]()
153
Figure 14.12
Empirical Semi-Variogram and Variogram Model for the Minor Axis of Li2O in Unit 6d
![]()
The subvertical dip and horizontal strike directions along 110 to 115° of the modeled variograms for Li2O correspond well to the observed strike and dip of the deposit based on outcrop mapping and structural observations. The observed ranges of grade continuity also correspond to the consistent mineralization observed in drill core across the deposit. The greater Li2O grade continuity of Unit 6a, b, c in the vertical direction compared to Unit 6d, which displays greater continuity in the horizontal direction, is likely mainly an effect of the better drill coverage of Unit 6a, b, c.
For the other potentially economic elements in the deposit, Rb2O, Cs2O and Ta2O5, variography was performed on the composites for the main body of Unit 6a, b, c in a similar fashion as for Li2O. The variograms are not discussed in detail here, but the deduced search ellipse parameters are given in Table 14.11 of Section 14.8.
| 14.8 | BLOCKMODEL |
The block model was developed using a block size of 10 x 3 x 10 m which is appropriate for the approximate drill section spacing of 25 m and allows for additional resolution in the across-strike direction of the deposit where a high sample resolution is available along the drill holes (see Table 14.8) . This block size is consistent with previous resource estimates for the SRLD. The block model has been rotated along -16° in the GEMS convention which corresponds to a 106° azimuth, the outcrop strike of the deposit approximated from two-dimensional views of the 3D geology wireframes. The block model origin was set to UTM NAD 83 Zone 15 N coordinates 388,000 / 5,569,000 / 380 (easting / northing / elevation) in metres.
154
Table 14.8
Block Model Specifications
| Direction | Block size (m) | Number of blocks |
| Column | 10 | 100 |
| Row | 3 | 100 |
| Level | 10 | 40 |
Rock codes were assigned to the block model from the geology wireframes based on a >50% rule and horizontal needling with an integration level of 10 needles per block. Block rock densities were then assigned to each rock code based on the empirical measurements discussed in Section 14.3, except for the Overburden, for which a value of 1.80 t/m3 based on a literature review was used (Table 14.9) .
Table 14.9
Block Rock Codes and Corresponding Rock Densities
| Block code | Rock Unit | Density (t/m3) |
| 0 | Air | 0.00 |
| 1 | Amphibolite (country rock) | 3.01 |
| 457 | Units 2, 4, 5, 7, 8 (SRP, barren) | 2.65 |
| 3 | Unit 3 (SRP, barren) | 2.66 |
| 6 | Lithium Pegmatite, Petalite Zone (Unit 6a, b, c) | 2.65 |
| 64 | Lithium Pegmatite, Lepidolite-Petalite Zone (Unit 6d) | 2.62 |
| 9 | Overburden | 1.80 |
The parameters for each block that were assigned from the geology solids or recorded during the interpolation of each block are given in Table 14.10. The latter include values that were used for assessing the confidence in the blocks (see Section 14.10) .
Table 14.10
Parameters Recorded for Each Block in the Model
| Parameter | Type | Name | Values |
| MII | Integer | Resource Confidence | 1 = measured, 2 = indicated, 3 = inferred |
| Density | Single | Density | as listed in Table 14.9 |
| Rock Type | Integer | Rock Type | as listed in Table 14.9 |
| Li2O | Single | Lithium grade | variable |
| Ta2O5 | Single | Tantalum grade | variable |
| CS2O | Single | Caesium grade | variable |
| Rb2O | Single | Rubidium grade | variable |
| Nearest | Double | Actual distance to closest point | variable |
| Pass | Integer | Interpolation run | 1 = first, 2 = second, 3 = third |
| No-of-pts | Integer | Number of composites used for the estimate | variable |
| No-of-holes | Integer | Number of holes used | variable |
The grade interpolations were performed using Ordinary Kriging with the search ellipses and variograms derived from the variography. The search ellipse dimensions given as radii in metres, their orientations in the GEMS ZXZ convention relative to the block model orientation, and the number of composites used in each interpolation step, are given in Table 14.11. Figure 14.13 and Figure 14.14 show the search ellipses used to interpolate the grade for the two rock types. A limit of two samples per hole was applied to all interpolation profiles, resulting in the effective number of holes used for the Li2O interpolation ranging from 3 to 6 for Passes 1 and 2 and 2 to 4 holes for Pass 3. For Rb2O, Cs2O and Ta2O5, the combination of a limit of two samples per hole and 4 to 12 samples results in 2 to 6 holes being used for the interpolation.
155
Table 14.11
Search Ellipse Parameters and Sample Restrictions for the Interpolation of Li2O, Rb2O, Cs2O and Ta2O5
| Li2O 6a, b, c | Li2O 6d | Rb2O1 | Cs2O1 | Ta2O5 | |||||
| Pass 1 | Pass 2 | Pass 3 | Pass 1 | Pass 2 | Pass 3 | ||||
| Search ellipse | |||||||||
| Radius X (m) | 25 | 50 | 175 | 35 | 75 | 115 | 150 | 175 | 175 |
| Radius Y (m) | 20 | 35 | 125 | 25 | 50 | 75 | 130 | 150 | 175 |
| Radius Z (m) | 5 | 15 | 45 | 8 | 15 | 25 | 25 | 15 | 25 |
| Rotation Z (°) | 0 | 0 | 0 | 0 | 0 | 0 | 195 | 195 | 0 |
| Rotation X (°) | 90 | 90 | 90 | -90 | -90 | -90 | 80 | -85 | -85 |
| Rotation Z (°) | 280 | 280 | 280 | 0 | 0 | 0 | 285 | 105 | 0 |
| Number of composites | |||||||||
| Minimum | 6 | 6 | 4 | 6 | 6 | 4 | 4 | 4 | 4 |
| Maximum | 12 | 12 | 8 | 12 | 12 | 8 | 12 | 12 | 12 |
1The rotation for the Rb2O and Cs2O search ellipses is given in the format Azimuth/Dip/Azimuth instead of the Z/X/Zformat used in the GEMS software.
Figure 14.13
Horizontal View of the Pass 1, 2 and 3 Search Ellipses for the Li2O Interpolation of Unit 6a, b, c
(The drill hole traces are shown for reference)
![]()
156
Figure 14.14
Horizontal View of the Pass 1, 2 and 3 Search Ellipses for the Li2O Interpolation of Unit 6d
(The drill hole traces are shown for reference)
![]()
To interpolate the grades of the blocks coded according to their location within the individual pegmatite dikes, only composites inside of the corresponding geology wireframes were used. The Passes were interpolated in the sequence 1, 2, 3 and the Pass was used as a first indication for the assignment of the confidence category.
The statistics for the block model, separated into the two rock units and the grades that were interpolated are provided in Table 14.12.
Table 14.12
Block Model Statistics
| Block | Valid Blocks | Minimum (%) | Maximum (%) | Mean (%) | Standard Deviation(%) | Variance (%) |
| Rock Units 6a, b, c | ||||||
| Li2O | 9,856 | 0.176 | 2.169 | 1.386 | 0.265 | 0.070 |
| Rb2O | 9,841 | 0.087 | 0.600 | 0.334 | 0.061 | 0.004 |
| Cs2O | 9,671 | 0.003 | 0.135 | 0.012 | 0.012 | 0.000 |
| Ta2O5 | 9,856 | 0.001 | 0.020 | 0.006 | 0.002 | 0.000 |
| Rock Unit 6d | ||||||
| Li2O | 3,168 | 0.283 | 2.156 | 1.387 | 0.232 | 0.054 |
| Rb2O | 3,187 | 0.078 | 0.931 | 0.461 | 0.103 | 0.011 |
| Cs2O | 3,162 | 0.003 | 0.133 | 0.025 | 0.017 | 0.000 |
| Ta2O5 | 3,187 | 0.002 | 0.019 | 0.008 | 0.002 | 0.000 |
157
| 14.8.1 | Comparison of Interpolated Grades to the Composite Data |
Table 14.13 shows a comparison between the mean interpolated grades (from Table 14.12) and those of the composites (from Table 14.6) by rock unit. There are modest increases in the mean Li2O and Rb2O grades for Unit 6a, b, c and a 4.16% decrease in the Rb2O of Unit 6d, whereas the Li2O for this Unit showed only a very minor decrease. These relatively small changes are likely the result of a bias of the drilling in certain zones of elevated or decreased grade and fall within expected ranges of deviation. For Cs2O and Ta2O5, there are larger relative changes (Table 14.13); however, these are due to only minor differences in the corresponding absolute values (0.025% vs. 0.023% Cs2O, 0.008% vs. 0.009% Ta2O5; block vs. composite mean). In Unit 6a, b, c, the interpolations of Cs2O and Ta2O5 yielded the same grade values as the means of the composites (Table 14.13) .
Table 14.13
Comparison of the Means Grades of the Blocks Relative to the Mean Grades of the Composites
| Rock Unit | Li2O | Rb2O | Cs2O | Ta2O5 |
| 6a, b, c | 2.59% | 2.45% | 0.00% | 0.00% |
| 6d | -0.14% | -4.16% | 8.70% | -11.11% |
| 14.9 | VALIDATIONDIAGRAMS |
| 14.9.1 | Grade-Tonnage Curve |
A grade-tonnage curve for the block model including both modeled lithium pegmatite rock types (6a, b, c and 6d) of the SRLD and all interpolation passes is shown in Figure 14.15. The plot shows that the total tonnage is relatively insensitive to changes in the cut-off grade at values between 0.1 and 0.7% Li2O; corresponding tonnages range between 10.33 and 10.10 Mt, respectively. This shows that relatively little zero-grade amphibolite country rock has been included based on the geology model and that the grades of the lithium pegmatite are rarely below 0.7% Li2O. For higher cut-off grades, a modest decrease in tonnage can be observed up to a cut-off grade of 1.1% Li2O, followed by a sharp drop in tonnage at higher cut-off grades.
158
Figure 14.15
Separation Rapids, Grade-Tonnage Curve for the 23 May, 2018 Mineral Resource Including all Rock
Types and Interpolation Passes
(The tonnage is given in metric tonnes)
![]()
| 14.8.2 | Swath Diagrams |
A swath diagram for the levels (each level is 10 mm high) in the block model for rock Unit 6a, b, c is presented in Figure 14.16. There is no significant systematic vertical grade variation in the interpolated blocks of the resource model, which is consistent with the grades recorded by the composites (Figure 14.16) . Along the strike direction, the highest Li2O grades of the interpolated blocks are located in the centre of the deposit with drops near the edges, but also in the east (Figure 14.17) .
159
Figure 14.16
Swath Diagram for Rock Unit 6a, b, c Including All Interpolation Passes Showing the Grade of the
Blocks by Level and that of the Corresponding Composites that were Used for Interpolation
(The histogram shows the number of blocks per level)
![]()
160
Figure 14.17
Swath Diagram for Rock Unit 6a, b, c Including all Interpolation Passes Showing the Grade of the Blocks
by Column (i.e., along strike) and that of the Corresponding Composites that were Used for Interpolation
(The histogram shows the number of blocks per column)
![]()
For rock Unit 6d, there is relatively little vertical and along-strike variation in the block grades, as is the case for the composites (Figure 14.18, Figure 14.19) .
161
Figure 14.18
Swath Diagram for Rock Unit 6d Including all Interpolation Passes Showing the Grade of the Blocks by
Level and that of the Corresponding Composites that were Used for Interpolation
(The histogram shows the number of blocks per level)
![]()
162
Figure 14.19
Swath Diagram for Rock Unit 6d Including all Interpolation Passes Showing the Grade of the Blocks by
Column (i.e., along strike) and that of the Corresponding Composites that were Used for Interpolation
(The histogram shows the number of blocks per column)
![]()
| 14.10 | RESOURCECONFIDENCECLASSIFICATION |
The resource confidence classification was assigned based on the scheme presented in Table 14.14, which is a combination of numerical parameters and drilling, geological and spatial factors. The confidence categories Measured and Indicated were assigned by outlining continuous zones in level plans. The interpolation of all blocks in the Measured and Indicated categories is supported by sufficient three-dimensional drill coverage to assert a high confidence and does not extend beyond the zones of drilling. The Inferred category includes blocks within the geology wireframes that have been modeled from the drill hole logs up to the search ellipse limits.
163
Table 14.14
Resource Confidence Classification Scheme
| Confidence | Interpolation Passes | Number of Drill Holes | Distance to Nearest Composite | Other Factors Considered |
| Measured | 1 + 2 | ≥ 4 | ≤ 25 m | + blocks within zones of excellent geological and grade continuity and drilling support from Passes 2 & 3 and/or with <4 holes or >25 m distance. |
| Indicated | 1 + 2 ± 3 | ≥ 3 | ≤ 35 m | + blocks within zones of geological & grade continuity and good drilling support from Pass 3 and/or with <3 drill holes and >35 m distance where geology continuous. |
| Inferred | 1 + 2 + 3 | ≥ 2 | no limit | includes interpolated geology up to 40 m below drill holes and blocks with little drilling support. |
The confidence categories were assigned to rock Units 6a, b, c and 6d separately. Table 14.15 lists the statistics for the blocks in each of the confidence categories and shows that the criteria were successfully applied. The low standard deviations for the Li2O grades attest to the relatively homogeneous grade distribution in the deposit.
Table 14.15
Statistics for the Blocks in Each of the Confidence Categories
| Minimum | Maximum | Mean | |
| Measured Blocks | |||
| 6a, b, c (N = 3,104) | |||
| Li2O | 0.237 | 2.095 | 1.423 ± 0.251 (1σ) |
| No. of holes | 3 | 7 | 5 |
| No. of composites | 6 | 12 | 9 |
| Distance to closes point | 0.50 | 38.48 | 12.01 |
| 6d (N = 1,195) | |||
| Li2O | 0.755 | 2.156 | 1.410 ± 0.206 (1σ) |
| No. of holes | 3 | 7 | 5 |
| No. of composites | 5 | 12 | 9 |
| Distance to closes point | 1.06 | 32.91 | 12.90 |
| Indicated Blocks | |||
| 6a, b, c (N = 5,102) | |||
| Li2O | 0.176 | 2.169 | 1.376 ± 0.265 (1σ) |
| No. of holes | 2 | 6 | 4 |
| No. of composites | 4 | 12 | 8 |
| Distance to closes point | 0.39 | 51.13 | 23.69 |
| 6d (N = 1,335) | |||
| Li2O | 0.715 | 2.048 | 1.402 ± 0.203 (1σ) |
| No. of holes | 3 | 6 | 4 |
| No. of composites | 5 | 12 | 7 |
| Distance to closes point | 0.83 | 43.55 | 21.97 |
164
| Minimum | Maximum | Mean | |
| Inferred Blocks | |||
| 6a, b, c (N = 1,650) | |||
| Li2O | 0.396 | 1.917 | 1.348 ± 0.283 (1σ) |
| No. of holes | 2 | 5 | 4 |
| No. of composites | 4 | 8 | 7 |
| Distance to closes point | 1.01 | 103.82 | 50.81 |
| 6d (N =638) | |||
| Li2O | 0.283 | 1.910 | 1.315 ± 0.308 (1σ) |
| No. of holes | 2 | 6 | 3 |
| No. of composites | 4 | 8 | 5 |
| Distance to closes point | 1.67 | 66.52 | 29.51 |
The classification and distribution of resource blocks is shown graphically in Figure 14.20 and Figure 14.21 for rock Units 6a, b, c and 6d, respectively.
Figure 14.20
Block Model for Unit 6a, b, c, Blocks Colour-coded According to their Confidence Category
(Measured = red, indicated = orange, and inferred = blue; oblique view, UTM coordinates are shown)
![]()
165
Figure 14.21
Block Model for Unit 6d, Blocks Colour-coded According to their Confidence Category
(Measured = red, indicated = orange, and inferred = blue; oblique view, UTM coordinates are shown)
![]()
| 14.11 | MINERALRESOURCEESTIMATE |
The 22 May, 2018, Measured plus Indicated resource estimate dated 23 May, 2018, for Separation Rapids is 8.41 Mt at an average grade of 1.41% Li2O at a cut-off grade of 0.6% Li2O (Table 14.16) . The cut-off grade is the same as that quoted in previous resource estimates for the deposit and considered to be a reasonable economic cut-off prior to the establishment of detailed operating costs and revenue.
The measured resource outcrops at the surface. An additional Inferred resource of 1.79 Mt at 1.349% Li2O is mostly located greater than 150 m below surface and in the west of the deposit (Figure 14.22) .
Table 14.16
Separation Rapids, Overall Mineral Resource Estimate at Multiple Cut-off Grades as at 23 May, 2018;
(The preferred cut-off grade is marked in bold font)
| Class | Cut-off Grade (% Li2O) | Tonnes (Mt) | % Li2O | wt. % Feldspars |
| Measured | 0.6 | 3.364 | 1.431 | 43 |
| 0.8 | 3.329 | 1.439 | 43 | |
| 1.0 | 3.221 | 1.456 | 43 | |
| 1.2 | 2.906 | 1.493 | 43 | |
| Indicated | 0.6 | 5.041 | 1.393 | 43 |
| 0.8 | 4.911 | 1.411 | 43 | |
| 1.0 | 4.677 | 1.436 | 43 | |
| 1.2 | 4.140 | 1.478 | 43 |
166
| Class | Cut-off Grade (% Li2O) | Tonnes (Mt) | % Li2O | wt. % Feldspars |
| Measured + Indicated | 0.6 | 8.405 | 1.408 | 43 |
| 0.8 | 8.240 | 1.422 | 43 | |
| 1.0 | 7.898 | 1.444 | 43 | |
| 1.2 | 7.046 | 1.484 | 43 | |
| Inferred | 0.6 | 1.791 | 1.349 | 43 |
| 0.8 | 1.706 | 1.381 | 43 | |
| 1.0 | 1.535 | 1.434 | 43 | |
| 1.2 | 1.349 | 1.479 | 43 |
Notes:
| 1. | This resource estimate is valid as of May 23, 2018. |
| 2. | CIM definitions were followed for Mineral Resources. |
| 3. | The Qualified Person for this Mineral Resource estimate is William Mercer, PhD, P.Geo. (ON). |
| 4. | The resource estimate is based on Avalon’s drilling of 74 previous holes totalling 11,644 m drilled between 1997 and 2017 and a further four holes totalling 1,282 m in 2018. |
| 5. | Drill data was organised in Maxwell DataShedTMand for estimation purposes was transferred to the Geovia GEMS 6.8 software, wherein the block model was developed. |
| 6. | The geological units were modeled as outlined by drill core logs. |
| 7. | Resources were estimated by interpolating composites within a block model of 10 x 10 x 3 m blocks oriented along the deposit strike. |
| 8. | Grade interpolation used the Ordinary Kriging method combined with variograms and search ellipses modeled for each rock unit. For PZ unit, search ellipses of 50 x 35 x 15 m and 175 x 125 x 45 m were used for Passes 1 and 2, respectively. For LPZ unit, search ellipses of 35 x 25 x 8 m, 75 x 50 x 15 m and 115 x 75 x 25 m were used for Passes 1, 2 and 3, respectively. |
| 9. | Measured material was defined as blocks interpolated using Passes 1 and 2, using composites from ≥4 drill holes and a distance ≤25 m to the nearest composite and additional blocks with excellent geological and grade continuity. Indicated material includes blocks interpolated with Pass 1 and 2 search ellipses, using ≥3 drill holes and a distance ≤35 m to the nearest composite and blocks with geological and grade continuity. Inferred material was defined as blocks interpolated with all Passes, composites from ≥2 drill holes and interpolated geological continuity up to 40 m below diamond drill holes. |
| 10. | Two-metre composites were used, and no capping was necessary. |
| 11. | The mean density of 2.65 t/m3was used for Unit 6a, b, c and 2.62 t/m3for Unit 6d. |
| 12. | The cut-off grade reported in this resource estimate, 0.6% Li2O, is consistent with the previously published resource estimates by Avalon (Preliminary Economic Assessment, 2016; November 15, 2017 resource estimate). |
| 13. | The total feldspar contents were estimated utilizing QEMSCAN®analysis of 38 drill core intervals distributed throughout the deposit. |
| 14. | Mineral resources do not have demonstrated economic viability and their value may be materially affected by environmental, permitting, legal, title, socio-political, marketing, or other issues. |
167
Figure 14.22
Block Model at a Cut-off Grade of 0.6%Li2O, Colour-Coded According to Confidence Category
(Measured = red, indicated = orange, and inferred = blue; the drill hole traces are shown for reference;
view from south, UTM coordinates are shown along the axes)
![]()
The present resource model includes separate estimates for the petalite-dominant (Unit 6a, b, c) and the lepidolite + petalite-dominant (6d) rock units. The detailed Table 14.17 lists the resources by rock type at multiple cut-off grades; Figure 14.23 shows the two rock types as colour-coded blocks. At a cut-off grade of 0.6% Li2O, the Measured and Indicated resources for rock Unit 6a, b, c include 6.42 Mt grading 1.409% Li2O and additional Inferred resources are 1.31 Mt at a grade of 1.351% Li2O. For Unit 6d, the Measured and Indicated resources are 1.99 Mt grading 1.406% Li2O and the Inferred resources are 0.48 Mt at a grade of 1.346% Li2O. It is worth noting that Unit 6d is distinctly higher in Ta, Cs and Rb compared to 6a, b, c at the same Li2O cut-off grade.
Table 14.17
Mineral Resource Estimate by Rock Unit and at Multiple Cut-off Grades as at 23 May, 2016
(The preferred cut-off grade is marked in blue)
| Class | Rock Unit | Cut-off Grade (% Li2O) | Tonnes (Mt) | % Li2O | % Ta2O5 | % Cs2O | %Rb2O | wt. % Feldspars |
| Measured | 6a, b, c | 0.6 | 2.425 | 1.440 | 0.005 | 0.010 | 0.322 | 44 |
| 0.8 | 2.394 | 1.449 | 0.005 | 0.010 | 0.323 | 44 | ||
| 1.0 | 2.311 | 1.468 | 0.005 | 0.010 | 0.323 | 44 | ||
| 1.2 | 2.118 | 1.501 | 0.005 | 0.009 | 0.325 | 44 | ||
| 6d | 0.6 | 0.939 | 1.410 | 0.008 | 0.027 | 0.473 | 40 | |
| 0.8 | 0.935 | 1.412 | 0.008 | 0.027 | 0.474 | 40 | ||
| 1.0 | 0.910 | 1.426 | 0.008 | 0.027 | 0.477 | 40 | ||
| 1.2 | 0.788 | 1.474 | 0.008 | 0.026 | 0.483 | 40 |
168
| Class | Rock Unit | Cut-off Grade (% Li2O) | Tonnes (Mt) | % Li2O | % Ta2O5 | % Cs2O | %Rb2O | wt. % Feldspars |
| Total | 0.6 | 3.364 | 1.431 | 0.006 | 0.015 | 0.365 | 43 | |
| 0.8 | 3.329 | 1.439 | 0.006 | 0.015 | 0.365 | 43 | ||
| 1.0 | 3.221 | 1.456 | 0.006 | 0.015 | 0.367 | 43 | ||
| 1.2 | 2.906 | 1.493 | 0.006 | 0.013 | 0.368 | 43 | ||
| Indicated | 6a, b, c | 0.6 | 3.992 | 1.391 | 0.006 | 0.012 | 0.338 | 44 |
| 0.8 | 3.872 | 1.412 | 0.006 | 0.012 | 0.340 | 44 | ||
| 1.0 | 3.667 | 1.440 | 0.006 | 0.012 | 0.343 | 44 | ||
| 1.2 | 3.248 | 1.482 | 0.006 | 0.011 | 0.348 | 44 | ||
| 6d | 0.6 | 1.049 | 1.402 | 0.009 | 0.025 | 0.469 | 40 | |
| 0.8 | 1.038 | 1.409 | 0.009 | 0.025 | 0.471 | 40 | ||
| 1.0 | 1.010 | 1.423 | 0.009 | 0.025 | 0.474 | 40 | ||
| 1.2 | 0.892 | 1.463 | 0.009 | 0.025 | 0.481 | 40 | ||
| Total | 0.6 | 5.041 | 1.393 | 0.007 | 0.014 | 0.366 | 43 | |
| 0.8 | 4.911 | 1.411 | 0.007 | 0.015 | 0.368 | 43 | ||
| 1.0 | 4.677 | 1.436 | 0.007 | 0.014 | 0.372 | 43 | ||
| 1.2 | 4.140 | 1.478 | 0.007 | 0.014 | 0.377 | 43 | ||
| Measured + Indicated | 6a, b, c | 0.6 | 6.416 | 1.409 | 0.006 | 0.011 | 0.332 | 44 |
| 0.8 | 6.266 | 1.426 | 0.006 | 0.011 | 0.333 | 44 | ||
| 1.0 | 5.978 | 1.451 | 0.006 | 0.011 | 0.336 | 44 | ||
| 1.2 | 5.365 | 1.489 | 0.006 | 0.010 | 0.339 | 44 | ||
| 6d | 0.6 | 1.989 | 1.406 | 0.009 | 0.026 | 0.471 | 40 | |
| 0.8 | 1.974 | 1.411 | 0.009 | 0.026 | 0.472 | 40 | ||
| 1.0 | 1.920 | 1.424 | 0.009 | 0.026 | 0.475 | 40 | ||
| 1.2 | 1.680 | 1.468 | 0.009 | 0.026 | 0.482 | 40 | ||
| Total | 0.6 | 8.405 | 1.408 | 0.007 | 0.015 | 0.365 | 43 | |
| 0.8 | 8.240 | 1.422 | 0.007 | 0.015 | 0.367 | 43 | ||
| 1.0 | 7.898 | 1.444 | 0.007 | 0.014 | 0.370 | 43 | ||
| 1.2 | 7.046 | 1.484 | 0.007 | 0.014 | 0.373 | 43 | ||
| Inferred | 6a, b, c | 0.6 | 1.308 | 1.351 | 0.007 | 0.017 | 0.342 | 44 |
| 0.8 | 1.255 | 1.377 | 0.007 | 0.015 | 0.343 | 44 | ||
| 1.0 | 1.119 | 1.434 | 0.007 | 0.013 | 0.346 | 44 | ||
| 1.2 | 0.966 | 1.486 | 0.007 | 0.012 | 0.346 | 44 | ||
| 6d | 0.6 | 0.483 | 1.346 | 0.008 | 0.020 | 0.427 | 40 | |
| 0.8 | 0.451 | 1.392 | 0.008 | 0.020 | 0.438 | 40 | ||
| 1.0 | 0.416 | 1.435 | 0.008 | 0.019 | 0.450 | 40 | ||
| 1.2 | 0.383 | 1.461 | 0.008 | 0.018 | 0.455 | 40 | ||
| Total | 0.6 | 1.791 | 1.349 | 0.007 | 0.018 | 0.365 | 43 | |
| 0.8 | 1.706 | 1.381 | 0.008 | 0.016 | 0.368 | 43 | ||
| 1.0 | 1.535 | 1.434 | 0.008 | 0.014 | 0.374 | 43 | ||
| 1.2 | 1.349 | 1.479 | 0.007 | 0.014 | 0.377 | 43 |
Note: See Table 14.16.
169
Figure 14.23
Block Model at a Cut-off Grade of 0.6%Li2O, Colour-coded According to Rock Type
(6a, b, c = orange, and 6d = pink; the drill hole traces are shown for reference)
![]()
Cross-sections illustrating the nature of the block model are shown in Figure 14.24 to Figure 14.29. The cross-sections are oriented north-south along the UTM grid, i.e., parallel to the drill hole section lines, and were selected based on the good drill hole coverage on these sections. The drill holes have been superimposed on the blocks and are shown up to a distance of 12.5 m in each direction from the section center planes. The sections show the grades in the drill hole assay samples and blocks without a cut-off grade applied with the same colour scheme.
170
| Figure 14.24 | Figure 14.25 |
| Cross-Section 388200 East with Drill Holes and Resource Blocks | Cross-Section 388325 East with Drill Holes and Resource Blocks |
| (looking west) | (looking west) |
171
| Figure 14.26 | Figure 14.27 |
| Cross-Section 388425 East with Drill Holes and Resource Blocks | Cross-Section 388475 East with Drill Holes and Resource Blocks |
| (looking west) | (looking west) |
| |
172
| Figure 14.28 | Figure 14.29 |
| Cross-Section 388550 East with Drill Holes and Resource Blocks | Cross-Section 388625 East with Drill Holes and Resource Blocks |
| (looking west) | (looking west) |
| |
173
| 14.12 | COMPARISON TOPREVIOUSMINERALRESOURCEESTIMATES |
A summary of the historic mineral resource estimates for the SRLD is presented in Table 14.7. Compared to Avalon’s 2017 resource estimate, which used identical estimation methods to the current estimate, the combined Measured and Indicated resources increased by ~3% and the Inferred resources increased by ~49% (Table 14.7) . A better refinement of the geological models, including for the overburden, resulted in a tighter constraint for the Measured Resource (Table 14.7) .
Compared to the resource prepared by Avalon in 2016 and quoted in a Preliminary Economic Assessment report, the combined Measured and Indicated resources increased by ~6% and the Inferred resources increased by ~10% (Table 14.7) . The current estimate uses stricter geological constraints compared to those used in 2016, resulting in only a moderate tonnage increase despite additional drilling. Previously interpreted down-dip geology models were found to be narrower at depth than previously predicted by the 2016 estimate.
A prefeasibility study in 1999 (Avalon/Micon) reported Measured and Indicated resources of 8.0 Mt grading 1.29% Li2O and Inferred resources of 2.7 Mt grading 1.34% Li2O without any cut-off applied (Table 14.7) . The greater tonnage and lower grade compared to the current resource estimate (compare Figure 14.15) indicates that the 1999 study included a greater volume of material diluted with country rock.
Factors in addition to the geology and assay data from the new holes drilled in 2017 and 2018 that affect comparisons with historic resource estimates include additional density data and improved geological models.
Table 14.18
Historic Mineral Resource Estimates for the Separation Rapids Lithium Deposit, Compared to the
Current Estimate
| Reference | Cut-off grade (% Li2O) | Measured | Indicated | Measured + Indicated | Inferred | ||||
| Mt | % Li2O | Mt | % Li2O | ||||||
| Mt | % Li2O | Mt | % Li2O | ||||||
| Current estimate (Avalon, 2018, News Release No. 18-08) | 0.6% | 3.36 | 1.431 | 5.04 | 1.39 | 8.40 | 1.41 | 1.79 | 1.349 |
| Avalon, November 15, 2017 MD&A Report | 0.6% | 4.04 | 1.389 | 4.09 | 1.36 | 8.13 | 1.37 | 1.20 | 1.330 |
| Micon, 2016 PEA | 0.6% | 4.03 | 1.32 | 3.97 | 1.26 | 8.00 | 1.29 | 1.63 | 1.42 |
Avalon/Micon, 1999 Prefeasibility Study | none | - | - | 8.9 | 1.34 | 8.9 | 1.34 | 2.7 | 1.34 |
| 1% Li2O, above 200 m elevation | - | - | 7.9 | 1.40 | 7.9 | 1.40 | - | - | |
| 1% Li2O, in-pit | - | - | 7.3 | 1.40 | 7.3 | 1.40 | - | - | |
| Avalon, 1998 Geological Report | 0.5% | 7.08 | 1.29 | ||||||
174
| 14.13 | ESTIMATEDFELDSPARRESOURCES |
The Separation Rapids Lithium Project is a potential producer of high-purity feldspar, a mixture of albite and potassium feldspar (microcline), in addition to lithium chemicals and/or petalite. The mineralogy of the pegmatite is described in detail in Section 7.6, which also covers the methodology for the QEMSCAN® analyses.
Figure 14.30 shows the locations of the samples for which quantitative mineralogy, including feldspar content, has been determined. It is important to note that these samples are well distributed throughout the deposit and that the sampling covers the volume of the resource spatially in an adequate fashion.
To determine the mineralogy of the pegmatites, Avalon commissioned 39 QEMSCAN® analyses. The samples include one outcrop bulk sample (rock Unit 6a, b, c), four polished thin section samples and 34 coarse-crushed assay rejects. Table 14.19 provides a summary of the modal proportions of the feldspars based on the QEMSCAN® analyses. The mean combined proportions of albite and K-feldspar are 43.7 and 40.1 wt.% for rock Units 6a, b, c and 6d, respectively. A single outlier sample from rock Unit 6a, b, c with unusually high feldspar contents (32.5 wt. % albite, 44.7 wt.% K-feldspar) has been excluded from the calculation of the mean. The similarity of the means and medians indicates that the means are not strongly affected by outlier values (Table 14.19) . The slightly lower total feldspar content of Unit 6d may be explained by the presence of abundant lepidolite as an additional aluminosilicate.
Table 14.19
Summary of QEMSCAN® Analyses of the Feldspars in Rock Units 6a, b, c and 6d
| Albite (wt. %) | K-feldspar (wt. %) | Total feldspar (wt. %) | |
| 6a, b, c (N = 21) | |||
| Median | 32.1 | 9.0 | 43.3 |
| Mean | 34.7 | 9.0 | 43.7 |
| Standard deviation (1 σ) | 11.1 | 4.6 | 9.4 |
| Minimum | 18.1 | 0.7 | 26.3 |
| Maximum | 64.7 | 17.2 | 66.5 |
| 6d (N = 17) | |||
| Median | 31.8 | 6.2 | 38.6 |
| Mean | 33.6 | 6.5 | 40.1 |
| Standard deviation (1 σ) | 9.4 | 3.8 | 8.2 |
| Minimum | 24.9 | 0.4 | 31.8 |
| Maximum | 67.2 | 15.6 | 67.5 |
Figure 14.31 provides the individual QEMSCAN® analyses for the two feldspars in the two rock units. In particular in Unit 6a, b, c, there is a wide variation in albite content and a trend towards high albite concentrations, skewing the calculated means somewhat and resulting in a relatively large standard deviation of 11.1 wt.% for albite (corresponding to a relative standard deviation of 32.0%, relative to the mean).
175
Figure 14.30
Locations of Drill Hole QEMSCAN® Samples (top), the Block Model Coded by Confidence Category is
Shown for Reference (bottom)
![]()
The modal mineralogy has previously been determined via point counts and optical microscopy on thin sections (Taylor, 2001); the results for the feldspars in Unit 6a, b, c are summarized in Table 14.20 (no data is available for Unit 6d). Within the standard deviation ranges, the visual determinations agree with the QEMSCAN® data, but the mean is with 37% by volume somewhat lower than that of the total feldspar content determined via QEMSCAN® analysis (~44%). Owing to the small number of samples for the point counts and the nature of the analysis, the QEMSCAN® results are regarded as more reliable. Visual estimations directly on the drill core performed by Avalon staff yielded a global average feldspar content (albite and K-feldspar combined) of 43% by volume, which agrees well with the result of the QEMSCAN® analyses for Units 6a, b, c.
176
Figure 14.31
Individual QEMSCAN® Analyses of the Feldspars for the Two Rock Units in the Resource Model
(The mean values per rock unit are displayed with their 1σ ranges)
![]()
Table 14.20
Average Modal Proportions of the Feldspars in Unit 6a, b, c Determined by Visual Point Counting
(N = 11, from Taylor, 2001)
| Albite (volume %) | K-feldspar (volume %) | Total feldspar (volume %) | |
| Median | 27 | 10 | 36 |
| Mean | 27 | 10 | 37 |
| Standard deviation (1 σ) | 2 | 3 | 3 |
| Minimum | 22 | 7 | 34 |
| Maximum | 30 | 17 | 43 |
Based on QEMSCAN® analysis of 38 representative samples, and supported by independent methods, the mean total feldspar contents throughout the SRLD are 44 wt.% and 40 wt. % for rock Units 6a, b, c and 6d, respectively. Thus, the total feldspar mineral estimates have been added to the estimated resources presented in Table 14.16 and Table 14.17.
177
15.0 MINERAL RESERVE ESTIMATES
Mineral reserve estimates have not been undertaken for the Separation Rapids Project and are not presented herein.
178
16.0 MINING METHODS
| 16.1 | INTRODUCTION |
Micon has undertaken pit optimization calculations to provide an updated PEA using the mineral resource block model prepared by Avalon. Micon has imported the block model into Surpac™ to create a block model compatible with the pit optimization software.
A preliminary optimization has been performed using Whittle™ software in order to estimate the potential for future open pit mining of the deposit. Cost parameters, derived from the operating cost estimate, were applied to the optimization model to assess the amount of resources available for economic exploitation. Inferred Resources were also incorporated into this preliminary optimization, along with the Measured and Indicated Resources to provide an indication of the potential future mineral reserves, should further drilling be completed to increase the geological certainty of the current mineral resources.
The SRLD requires further exploration and infill drilling to both increase the size of the resource and increase the geological certainty of the current Inferred Resources. Under NI 43-101 rules, Inferred Resources cannot be included in a mineral reserve and cannot form the basis of a feasibility study, however, it is acceptable to include Inferred material in a PEA, however, the reader should take note that this material is of low geological certainty and is included only as an indication of possible future potential.
It should also be stressed that the optimization analysis presented here is not an open pit design. The analysis presents the potential size of resource which could be contained within an open pit if the Inferred material can be upgraded to the Indicated and Measured categories by further infill drilling.
| 16.2 | TERMS OFREFERENCE ANDDATAAVAILABLE |
The resource estimate update (see Section 14.0) was completed by Avalon (News Release 08-18: Updated Resource Estimate and Development Plans for Separation Rapids Lithium Project, Kenora, Ontario, 23 May 2018).
| 16.3 | GEOTECHNICALEVALUATION |
The geotechnical data has been gathered from the pit slope design study which was conducted by Knight Piesold and summarised in their report “Determination of Feasibility Level Pit Slope Design Parameters”, Ref. No. D2392/1 dated 9th July 2001.
179
| 16.4 | PITOPTIMIZATION |
| 16.4.1 | Method |
The purpose of the modelling was to generate an estimate of the conceptual mineable tonnes including the Measured, Indicated and Inferred Resources that would be acceptable for the PEA. Micon used Whittle software for the optimization, applying conceptual financial and technical parameters from industry best practice.
The Whittle™ programme comprises three components, the ultimate pit shell generator, a push back generator, and the optimising scheduler. The ultimate pit generator is the first stage of the optimization process and utilises a Lerchs Grossman (LG) algorithm to generate an economic open pit shell from the mineral resource block model based on the initial input parameters.
The second component is the push back generator which a series of pushbacks according to the LG phases. The third component is the scheduler and is used to create optimum mining schedules.
It should be noted that the Whittle™ software, used for the optimization, does not provide ultimate pit shells with in-pit roads or berms and therefore further design work was required in order to estimate realistic waste amounts within the optimised pit, as well as more precise indications of the resources contained in the optimal pit.
| 16.4.2 | Optimization Parameters |
The GEMS™ block model for the SRLD was imported into Surpac™ and then imported into Whittle™. The pit optimization iterations were based on a single processing method and targeting only the Lithium Oxide (Li2O) as the final product. An exchange rate of CAD1.30:USD1.00 was used to convert all parameters to US dollars. The input parameters are summarised in Table 16.1.
Table 16.1
Separation Rapids Open Pit Optimization Parameters
| Category | Unit | CAD | USD |
| Production Rate | tpa | 539,715 | 539,715 |
| Slope Angle | deg | 55 | 55 |
| Petalite Density | t/m3 | 2.65 | 2.65 |
| Lepidolite Density | t/m3 | 2.62 | 2.62 |
| Waste Density | t/m3 | Various | Various |
| Petalite Mining Costs | $/t mined | 4.42 | 3.40 |
| Lepidolite Mining Costs | $/t mined | 5.68 | 4.37 |
| Waste Mining Costs | $/t mined | 5.52 | 4.25 |
| Incr mining costs | $/t per m | 0.007 | 0.0054 |
| Mining Recovery | % | 100 | 100 |
| Mining Dilution | % | 0 | 0 |
180
| Category | Unit | CAD | USD |
| Processing Costs | $/t ore | 44.77 | 34.44 |
| G&A Costs | $/t ore | 2.80 | 2.15 |
| Transport | $/t concentrate | - | - |
| Petalite Process Recovery | % | 49.70 | 49.70 |
| Petalite Product Grade | % | 4.25 | 4.25 |
| Lepidolite Process Recovery | % | 73.50 | 73.5 |
| Price Li2O | $/t | 19,813 | 15,241 |
| Exchange | 1.30 | 1.00 |
| 16.4.3 | Results |
The pit optimization calculations using the above parameters indicated that the economic cutoff grade was approximately 1.20% Li2O and the optimization run suggested a life of mine (LOM) plant feed tonnage of approximately 8.3 Mt at a grade of 1.4% Li2O.
As a result of the optimization, a number of ultimate pit shells were produced, as shown in Figure 16.1. Each of the ultimate pit shells (final pit envelope) contains the maximum mineable resources for the given economic criteria, based upon maximising net present value (NPV). The NPV in these models consider operating cost, but not capital costs. Pit shell 15 was chosen as the optimum pit because it indicated the maximum NPV; after that point the NPV is decreasing as the waste strip ratio increases. The pit optimization results are shown in Table 16.2.
Figure 16.1
Pit Optimization Results by Pit Shell
![]()
181
Table 16.2
Pit Optimization Results
| Category | Rock Unit | Tonnes (Thousands) | Grade (% Li2O) |
| Measured | 6a, b, c (Petalite) | 2,468 | 1.42 |
| 6d (Lepidolite) | 939 | 1.41 | |
| Indicated | 6a, b, c (Petalite) | 3,296 | 1.39 |
| 6d (Lepidolite) | 985 | 1.41 | |
| Total M&I | 6a, b, c (Petalite) | 5,763 | 1.40 |
| 6d (Lepidolite) | 1,924 | 1.41 | |
| Inferred | 6a, b, c (Petalite) | 186 | 1.34 |
| 6d (Lepidolite) | 384 | 1.33 |
Figure 16.2 and Figure 16.3 shows the starter and the optimum pit shells.
Figure 16.2
Starter Pit Shell
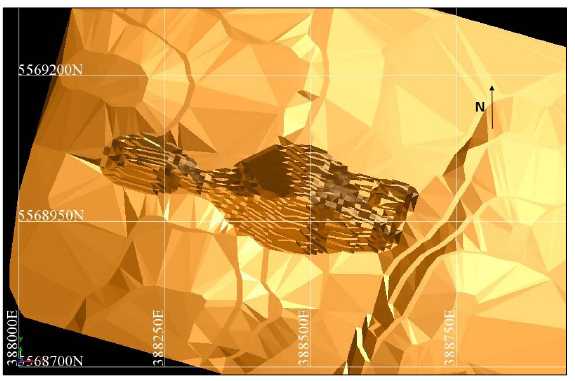
182
Figure 16.3
Optimum Pit Shell
![]()
| 16.5 | PITDESIGN |
A conceptual pit design was conducted from the bottom up using the design parameters in Table 16.3 below and the optimum pit shell 15 as a template. The bench to bench face angle of 80 degrees, with a 10 m bench and a 6 m wide safety berm was applied every 20 m. A haul road width of 15 m was used from the pit base (75 level) to the surface, on the assumption that two-way traffic would be operating in the whole of the mine.
Table 16.3
Pit Design Parameters
| Category | Value |
| Pit Base | 75 level |
| Wall Angle Between Benches | 80 degrees |
| Height of Bench | 10 metres |
| Safety Berm Width | 6 metres |
| Height between safety berms | 20 metres |
| Haul Road Gradient | 1:10 |
| Haul Road Width | 15 metres |
183
During the pit design process, the pit contours were extended beyond the topography to enable the pit and digital terrain model (DTM) and the topography DTM to intersect. Figure 16.4 and Figure 16.5 show a plan and long section view of the pit design.
Figure 16.4
Plan View of the Pit Design
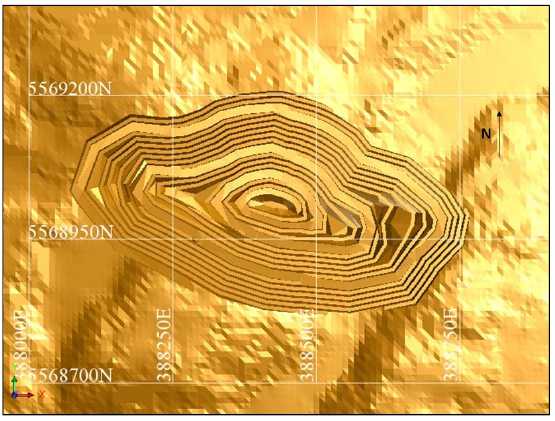
Figure 16.5
West East Long Section View of the Pit Design

184
| 16.6 | INPITRESOURCE |
The mineral resources within the pit design were calculated with the petalite and lepidolite ore types in their respective resource categories. The “in pit” tonnages are greater than the pit optimization results due to the inclusion of haul roads and safety berms. A summary of the “in pit” mineral resources is shown in Table 16.4 below.
Table 16.4
Summary of Mineral Resources Within the Pit
| Category | Rock Type | Tonnes (Thousands) | % Li2O |
| Measured | Petalite (6a, b, c) | 2,468 | 1.42 |
| Lepidolite (6d) | 939 | 1.41 | |
| Subtotal | 3,407 | 1.42 | |
| Indicated | Petalite (6a, b, c) | 3,429 | 1.37 |
| Lepidolite (6d) | 1,028 | 1.41 | |
| Subtotal | 4,457 | 1.38 | |
| Combined M&I | Petalite (6a, b, c) | 5,897 | 1.39 |
| Lepidolite (6d) | 1,967 | 1.41 | |
| Subtotal | 7,864 | 1.40 | |
| Inferred | Petalite (6a, b, c) | 260 | 1.31 |
| Lepidolite (6d) | 444 | 1.33 | |
| Subtotal | 704 | 1.32 | |
| Total Life-of-Mine | |||
| Total | Plant Feed | 8,568 | 1.39 |
| Waste | 52,344 | ||
| Strip Ratio | 6.11 | ||
| 16.7 | OPENPITMINING |
The proposed method of mining is by conventional open pit methods using drilling and blasting, loading with excavators and shovels and hauling with rigid dump trucks. The mineral will be excavated by hydraulic excavator to allow selectivity in ore and waste areas. A dedicated front-end loader, Caterpillar 992 or equivalent, will also assist in excavating high outputs of waste.
The deposit is near surface and suitable for conventional truck and shovel open pit mining. The topsoil and any sensitive material will be removed and stockpiled in a specific site. This material will be used in the rehabilitation of mine site at the end of operations. Waste from the pit will initially be composed of overburden and will be dumped near the topsoil stockpile. As the pit is developed harder waste rock will be excavated and will be stored on a separate waste dump.
There will be a requirement for a low and high-grade ore stockpiles to be positioned adjacent to the primary crusher.
185
| 16.8 | CONTRACTORVERSUSOWNEROPERATED |
The Project will be undertaken by contractor-operated equipment and labour. This was selected as the base case following a cost comparison of Owner versus contractor mining operations.
| 16.9 | MINEDEVELOPMENT |
The mine development activities would commence with the removal of the trees and other vegetation. Topsoil will then be excavated and stockpiled.
A new site access road is to be built. The preproduction stripping of waste will be used to construct site roads, including the main haul roads. Acceptable waste material will also be used for the construction of fresh water and tailing dam walls.
| 16.10 | WASTESTORAGE |
The barren waste that will be excavated during the life of the mine has been estimated to be 52.3 Mt and a site will need to be located to store at least 17.6 Mm3. Detailed studies to determine the best locations for waste storage will be undertaken during the next phase of project development.
| 16.11 | PRODUCTIONSCHEDULE |
A conceptual production schedule has been produced in MineSched™ software. This program uses block model information, together with pit locations, mining strategy, constraints, production data and targets to produce a schedule in tabular form of quantities and qualities.
Production data in the form of annual rates are input, as well as the locations of where and in what sequence mining is to take place. Quality and material ratio targets can be specified to guide the program to achieve the best schedule. The production schedule shown in Table 16.5 is based on mining 475,000 t/y of petalite and lepidolite mineralized material.
The life of the mine is expected to be 19 years with approximately 6.2 Mt of petalite material at 1.39% Li2O and 2.4 Mt of lepidolite mineralization at 1.41% Li2O mined over the length of the Project.
186
Table 16.5
Separation RapidsProductionSchedule
| Category | Unit /Year | 1 | 2 | 3 | 4 | 5 | 6 | 7 | 8 | 9 | 10 | 11 | 12 | 13 | 14 | 15 | 16 | 17 | 18 | 19 | 20 | Total |
| Petalite | Tonnes | 220,000 | 338,306 | 338,306 | 338,306 | 338,306 | 338,306 | 338,306 | 338,306 | 338,306 | 338,306 | 338,306 | 338,306 | 338,306 | 338,306 | 338,306 | 338,306 | 338,306 | 338,306 | 185,278 | 6,156,480 | |
| Grade % Li2O | 1.45 | 1.41 | 1.4 | 1.39 | 1.37 | 1.36 | 1.35 | 1.35 | 1.37 | 1.39 | 1.39 | 1.37 | 1.37 | 1.37 | 1.44 | 1.40 | 1.37 | 1.38 | 1.46 | 1.39 | ||
| Lepidolite | Tonnes | - | 136,694 | 136,694 | 136,694 | 136,694 | 136,694 | 136,694 | 136,694 | 136,694 | 136,694 | 136,694 | 136,694 | 136,694 | 136,694 | 136,694 | 136,694 | 136,694 | 136,694 | 87,650 | 2,411,448 | |
| Grade % Li2O | - | 1.38 | 1.38 | 1.37 | 1.38 | 1.41 | 1.45 | 1.45 | 1.41 | 1.39 | 1.35 | 1.39 | 1.38 | 1.41 | 1.42 | 1.42 | 1.42 | 1.46 | 1.41 | 1.41 | ||
| Combined Total | Tonnes | 220,000 | 475,000 | 475,000 | 475,000 | 475,000 | 475,000 | 475,000 | 475,000 | 475,000 | 475,000 | 475,000 | 475,000 | 475,000 | 475,000 | 475,000 | 475,000 | 475,000 | 475,000 | 272,928 | 8,567,928 | |
| Grade % Li2O | 1.45 | 1.40 | 1.39 | 1.39 | 1.38 | 1.37 | 1.38 | 1.38 | 1.38 | 1.39 | 1.38 | 1.38 | 1.37 | 1.38 | 1.43 | 1.41 | 1.38 | 1.40 | 1.44 | 1.39 | ||
| Waste | Tonnes | 1,000,000 | 2,500,000 | 2,750,000 | 3,000,000 | 3,500,000 | 3,500,000 | 3,500,000 | 3,500,000 | 3,500,000 | 3,000,000 | 3,000,000 | 3,000,000 | 2,750,000 | 2,750,000 | 2,750,000 | 2,500,000 | 2,500,000 | 2,250,000 | 1,094,381 | 52,344,381 | |
| Strip Ratio | t:t | 4.55 | 5.26 | 5.79 | 6.32 | 7.37 | 7.37 | 7.37 | 7.37 | 7.37 | 6.32 | 6.32 | 6.32 | 5.79 | 5.79 | 5.79 | 5.26 | 5.26 | 4.74 | 4.01 | 6.11 | |
| Total Material | Tonnes | 1,220,000 | 2,975,000 | 3,225,000 | 3,475,000 | 3,975,000 | 3,975,000 | 3,975,000 | 3,975,000 | 3,975,000 | 3,475,000 | 3,475,000 | 3,475,000 | 3,225,000 | 3,225,000 | 3,225,000 | 2,975,000 | 2,975,000 | 2,725,000 | 1,367,309 | 60,912,309 |
187
| 16.12 | MININGFLEET |
The majority of the mining and support equipment will be diesel powered. The main loading equipment will be a hydraulic backhoe excavator. A front-end loader will assist in the mass excavation of waste, bench and haul road management as well as providing backup support in the pit.
The assumptions for the fleet calculation were based on 22 hours per day, 7 days per week and 50 weeks per year.
| 16.12.1 | Main Mining Equipment |
For this level of study, the main mining equipment selection is based on a Caterpillar 6020 diesel hydraulic backhoe excavator with a 12 m3 bucket capacity. This excavator was selected for its reliability and performance. One unit will be required for both mineralized mill feed and waste excavation, which is based on each unit working 7,700 h/y with 95% availability and 75% operator efficiency.
The haul trucks selected are Caterpillar 777 rigid body trucks with a 60.4 m3 capacity and capable of moving 90 t loads. These trucks were selected for their reliability and performance, combined with good size matching to the Caterpillar 6020 excavator. It is estimated that six trucks will be required during the peak activity period in Years 6 to 8 (including one service spare). This is based on each unit working 7,700 h/y with 85% availability and 85% operator efficiency.
| 16.12.2 | Ancillary Equipment |
The ancillary equipment required to support the mining activities includes drill rigs, explosives plant and trucks, tracked dozers, fuel and lubrication truck, a motor grader, water trucks for dust suppression, light vehicles and lighting plant. Table 16.6 summarizes the specifications of the ancillary equipment and the number of units required.
Table 16.6
Summary of Ancillary Equipment
| Auxiliary Equipment | Number |
| Front End Loader (Cat 992) | 1 |
| Drill Rig (Sandvik D45KS) | 2 |
| Blast Truck (Tread 4216) | 1 |
| AN and Emulsion Plant (10tpd) | 1 |
| Dozer (Cat D9T) | 1 |
| GP Tool Handler (Cat ITH 62) | 1 |
| Fuel/Lube Truck (Bell 35D) | 1 |
| Water Truck (Bell 35D) | 1 |
| Telehandler (Cat TH580B) | 1 |
| Excavator/Secondary Breaker | 1 |
| Grader (Cat 16M) | 1 |
188
| Auxiliary Equipment | Number |
| Light Vehicles | 8 |
| Lighting sets | 8 |
| 16.13 | LABOUR |
The Labour requirements have been broken down by department; these are management, technical services and tradesmen, supervisors and production. The shift rotation would be based on two, twelve-hour shifts with three crews, two-on and one-off at any one time. Senior management and administration will work a five to six-day week on day shift only roster. Table 16.7 summarises the labour requirements for the Project.
Table 16.7
Labour Requirements
| Department | Required |
| Management and Administration | 6 |
| Technical Services | 24 |
| Supervisors | 7 |
| Production | 51 |
| Total | 88 |
189
17.0 RECOVERY METHODS
| 17.1 | INTRODUCTION |
The Separation Rapids Lithium Project PEA metallurgical process is based on the testwork that is described in Section 13.0. The process selected for the PEA comprises the mineral separation and recovery of a lepidolite concentrate a petalite concentrate (both containing between 4.0% and 4.50% Li2O), and thirdly, a mixed Na/K-feldspar product. While the previous, 2016 PEA was based around the conversion of all petalite to lithium hydroxide, this latest study stops at the production of petalite, lepidolite and feldspar flotation concentrates. That said, there remains the potential to install a hydroxide production facility in the future.
The lepidolite, petalite and feldspar recovery processes were developed and tested by ANZAPLAN in Germany. Various testwork programs were undertaken by ANZAPLAN between 2014 and 2018 including the production of 1 t of petalite concentrate in a pilot program conducted in 2016. ANZAPLAN also developed the process to recover a mixed Na/K-feldspar product and completed preliminary testwork on this material which indicated the suitability of this product in not only the ceramics industry but also as filler in paint, fibreglass and other products.
This PEA is based on the processing of 475,000 t/y of mineralized material over a 19-year mine life to produce approximately 220,000 t of lepidolite concentrate, 1.32 Mt of petalite and 1.34 Mt of feldspar. The lepidolite is to be sold into the lithium chemicals industry to customers in Canada and Asia, while the petalite will be sold to customers in the glass/ceramics industries in Europe, Asia and North America. The feldspar will be sold to customers for a range of applications in North America and Europe.
A single milling and flotation circuit is provided for processing both lepidolite/petalite (LPZ) mineralization and petalite (PZ) material on a campaign basis. Tailings from the flotation of lepidolite ore will be stockpiled for future re-processing to recover petalite. Some of the final tailings from the petalite ore flotation process will feed a second, dedicated feldspar flotation circuit with the balance of the petalite tailings reporting to the tailings management facility (TMF).
The magnetic concentrate and slimes (-20 microns) product recovered ahead of flotation in the petalite circuit will be combined and also delivered to the TMF as will final lepidolite tailings (after petalite recovery), and feldspar tailings. All tailings will be dewatered and stacked in a dedicated TMF.
Results from the extensive testwork programs (see Section 13.0) have been used to develop a processing flowsheet, mechanical equipment list and reagent consumptions. A simplified block flow diagram showing the main process steps within the overall Separation Rapids flowsheet is presented in Figure 17.1.
190
Figure 17.1
Simplified Process Block Flow Diagram
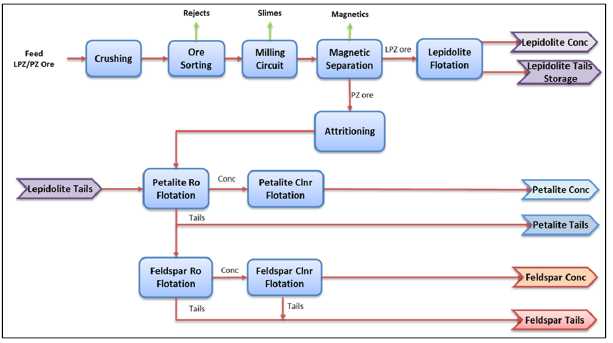
| 17.2 | PROCESSDESIGNBASISASSUMPTIONS |
The PEA report and financial evaluation are based on the following design criteria that have been derived from the testwork results:
| • | Optical sorting mass waste rejection is 1.8% with lithium losses of also 1.8%. | |
| • | For petalite PZ mineralization, the mass pull to slimes after comminution and attritioning is 7.9% of mill feed with an 8.6% lithium loss. For the lepidolite LPZ mineralization, mass and lithium losses are 8.4% and 6.5% respectively. | |
| • | Mass pull to magnetics (petalite PZ only) is 13% of sorted mineralized material tonnage with lithium losses of 13.8%. | |
| • | The lepidolite concentrates contains 4.5% Li2O% while 50% of the petalite concentrate will be 4.5% (with low sodium and potassium levels) and the balance being 4.0% for an average life of mine grade of 4.25% Li2O. | |
| • | Lithium recovery to lepidolite concentrate (LPZ) is 78%. Lithium recovery to petalite concentrate from lepidolite tailings is 70%. | |
| • | Lithium recovery to petalite concentrate (PZ) is 65.2% of flotation feed content. | |
| • | Mass pull to feldspar concentrate is 82.9% of feldspar flotation feed. | |
| • | Plant availabilities of 90% for the flotation plant although the crushing plant has been suitably sized to run on a single 12-hour shift per day. |
191
| 17.3 | CONCENTRATORPROCESSDESCRIPTION |
| 17.3.1 | Crushing and Sorting of Mineralized Material |
This circuit will process both LPZ and PZ mineralization separately on a campaign basis.
Run-of-mine (ROM) mineralized material is fed to multi-stage crushing and optical sorting before proceeding to the comminution circuit. The circuit is designed to process 200 t/h of material to facilitate a single, 12 h/day operating cycle and to also facilitate a possible future expansion of production capacity.
ROM mineralized material is delivered to a stockpile at the plant by truck. A front-end loader then reclaims the material and feeds it into a bin equipped with a 400 mm square static grizzly. From this bin it is fed at a rate of 200 t/h by a vibrating grizzly feeder, the oversize of which (+150 mm) feeds a jaw crusher. Crusher product is mixed with the feeder undersize and conveyed to a vibrating screen. The oversize (+50 mm) of this screen is fed to a secondary cone crusher with crusher product being combined with the screen undersize which then feeds a second vibrating screen. The second screen separates the mineralized material into three size fractions, these are:
• | +25 mm: This material is fed by conveyor to an optical sorter where waste rock (mainly amphibolite) is rejected onto a conveyor and transported to a stockpile from which it is then transferred by truck to the main waste stockpile. The non-waste rock is fed by conveyor to a tertiary cone crusher. | |
• | -25 +8 mm: This material is fed to a second optical sorter. Waste rejects are combined on the same waste conveyor as that for the first sorter, non-waste rock is combined with that of the first sorter non-waste and sent to the tertiary crusher. | |
| • | -8 mm: This material is transported by conveyor to a crushed mineralized material storage silo sized to hold 24 hours of crusher product. |
The amount of material rejected by the sorter has been estimated at 1.8% of crusher plant feed (as measured in a 30-t bulk sample processed in Germany).
Tertiary crusher product is combined with the product from the secondary cone crusher and recycled to the second of the vibrating screens.
| 17.3.2 | Comminution, De-sliming and Magnetic Separation |
The grinding and classification circuit consists of a ball mill operating in closed circuit with a wet classification screening process, followed by a two-stage magnetic separation process, attrition scrubbers and a cluster of desliming cyclones.
The feed to the ball mill is drawn from the crushed mineralized material silo by one of two vibrating feeders and conveyor at a nominal rate of 67.4 t/h (dry basis). Feed rate is controlled by a weightometer on this belt. Mill product is pumped to a cluster of fine screens cutting at 150 µm. The oversize from this screen is returned to the ball mill and the undersize gravitates to the magnetic separation circuit.
192
The magnetic separation is made up of firstly a low intensity unit (LIMS) and then a high intensity (WHIMS) unit. Screened slurry gravitates to the LIMS where any highly magnetic material is removed. Non-magnetics are collected in a sump and are pumped to the WHIMS where weakly magnetic material (mostly lithium/iron micas) is removed. Both magnetic products are combined and pumped to a thickener while the non-mags are pumped to dewatering cyclones to thicken the slurry to approximately 60% solids by weight. This thickened slurry is fed to a bank of attritioners in order to clean the mineral surfaces ahead of flotation. Product from the attritioners is diluted with overflow from the feed dewatering cyclones and pumped to a cluster of desliming cyclones cutting at 20 µm. The slimes (dewatering cyclone overflow) from these are combined with the magnetics’ streams and pumped to the thickener while the desliming cyclone underflow gravitates to a belt filter for dewatering ahead of flotation. (Note that when processing lepidolite LPZ the magnetic separators are by-passed).
| 17.3.3 | Petalite Flotation |
The cake from the belt filter is re-pulped using an 8% (50:50) NaCl/KCl brine solution and pumped to the petalite flotation circuit. A recycled stream of combined cleaner tailings 1 and 2 is also added here after being densified by dewatering cyclones.
When processing petalite (PZ), some of the tailings from the lepidolite circuit will also be fed into the petalite circuit. These will be reclaimed from the lepidolite tailings stockpile, re-pulped in 8% brine and pumped to the re-pulping tank after the filter.
The petalite flotation circuit consists of rougher and rougher scavenger flotation and five stages of cleaner flotation. The slurry is first fed to two stages of conditioning then gravitates to the rougher flotation cells and a rougher petalite concentrate is produced. The tailings from the rougher flotation cells are conditioned with additional brine and flotation reagents added before being fed to a rougher-scavenger bank where a rougher-scavenger concentrate is produced. This gets combined with the rougher concentrate before being pumped to the first petalite cleaner flotation stage. The tailings from rougher-scavenger flotation are sampled before being pumped to a filter press for dewatering and washing. A portion of this dewatered material (approximately 22 t/h) is re-pulped and sent to the feldspar flotation circuit while the balance is filtered and deposited in the TMF.
The petalite cleaner flotation circuit consists of five cleaner flotation stages and a belt filter for dewatering the cleaner 2 petalite concentrate ahead of cleaner 3. The petalite rougher concentrate is fed to two stages of conditioning where additional brine and flotation reagents are added. The conditioned feed is then fed into the first stage of petalite cleaners. Primary petalite cleaner concentrate is pumped to the second cleaner stage via one stage of conditioning and reagent addition. The tails from primary cleaner are combined with tailings from cleaner 2 and recycled back to the head of the rougher circuit via dewatering cyclones.
193
Concentrate from the secondary cleaner is pumped into an agitated holding tank before it is pumped into a belt filter for dewatering and washing to remove excess brine. The secondary concentrate is filtered to approximately 10% moisture and the brine filtrate is recycled as petalite rougher process water. The filter cake is transferred to an agitated holding tank and re-slurried with fresh process water. This step is necessary since the chemistry and reagents used in the final three stages of petalite flotation differ from those in the first two stages. The re-pulped concentrate is then pumped to cleaner 3 via two stages of conditioning (it is also mixed with cleaner 4 flotation tails). The petalite tertiary cleaner concentrate is produced and pumped into cleaner 4, while the cleaner flotation 3 tails are pumped to a filter for disposal. Cleaner 4 concentrate proceeds to the cleaner 5 circuit, with cleaner 4 tails returning to cleaner 3. A final petalite concentrate is produced in cleaner flotation 5 and is sampled and pumped to a holding tank before being filtered and dried. Cleaner 5 tails are recycled to cleaner 4.
| 17.3.4 | Petalite Concentrate Handling |
The petalite concentrate is dewatered and washed on a belt filter before feeding a collection hopper from which it is extracted by a screw feeder and fed into a rotary drier where it is dried to <1% moisture. All petalite produced will feed a hopper ahead of a bulk-bag (2 t) packaging facility for bagging and export via a nearby railway siding to customers in Europe and North America.
Filtrate from the concentrate filter is re-cycled back to the petalite cleaner process water circuit.
| 17.3.5 | Feldspar Flotation |
The feldspar flotation circuit will be introduced in year 5 and will consist of a rougher and two cleaner stages of flotation. The feldspar flotation circuit has been designed to produce 100,000 t/y of feldspar concentrate and as such, only a portion of the filtered petalite tailings are re-pulped and pumped to the feldspar circuit, the remainder is transported to the TMF.
The re-pulped petalite tailings are first conditioned with flotation reagents before being fed into the feldspar rougher flotation bank. The feldspar rougher concentrate is pumped to a conditioner before being fed to the first stage of cleaning. Cleaner 1 concentrate is fed to a second stage of cleaning with the tailings from both cleaner stages and the rougher tailings being pumped to the tailings filter. Cleaner 2 concentrate is pumped to the feldspar dewatering circuit. Additional reagents are added ahead of each cleaner stage.
| 17.3.6 | Feldspar Concentrate Handling |
The feldspar concentrate is dewatered and washed on a belt filter before being dried in a rotary drier. The dried feldspar concentrate is cooled and fed to a hopper ahead of a bulk-bag (2-t) packaging facility. The bags are covered and strapped to the pallets ready for transporting to customers.
194
Filtrate from the feldspar filter is re-cycled back to the feldspar process water circuit.
Avalon has identified a market of approximately 40,000 t/y for the feldspar product as a filler in both the paint and potentially the fibreglass industries. This material has a premium price but first needs to be milled to a d50 size of 6.3 µm. It is intended that material destined for the filler market will be fed after the cooler to an air-swept ball mill (with ceramic balls and liners). Milled product will be classified to the correct size in an air classifier with oversize being returned to the ball mill. Final product will report to a dedicated hopper and bagging facility.
| 17.3.7 | Tailings and Magnetics Concentrate Storage |
There are five tailings circuits at the flotation plant. The first circuit consists of a thickener and a plate and frame filter to thicken and dewater tailings suitable for dry stacking. The feed materials to the thickener are the slimes from the comminution circuit along with the magnetics materials. Water recovered from this circuit is directed to the Comminution Process Water tank and the solids are trucked to the TMF for permanent storage.
The second circuit handles the petalite cleaner 3 tailings and entails filtering the solids on a belt filter. These solids are also deposited at the TMF by truck and the filtrate reports to the Petalite cleaner process water tank.
The third circuit processes the lepidolite or petalite scavenger tails, depending on the campaign, and again involves dewatering on a belt filter. Approximately 50% of filtered petalite tailings are repulped for feldspar flotation while the other half is stored in one area of the TMF and the lepidolite tails are stored in another area for future reprocessing to recover petalite. Filtrate from this circuit is sent to the water treatment facility.
The fourth circuit is reclaimed lepidolite tails, which are repulped separately for petalite flotation with comminution water.
The fifth circuit is a small amount of feldspar tails which are also filtered and stacked in the TMF.
All circuits are designed to produce filter cakes averaging ±10% moisture (w/w).
| 17.3.8 | Lepidolite Mineralization (LPZ) Processing |
When processing LPZ the comminution circuit is the same as for PZ except that the magnetic separators are by-passed.
The flotation circuit makes use of the rougher, scavenger and first 2 stages of cleaners to produce a final concentrate. Sulphuric acid is added to the flotation feed to adjust pH to 2.5 and then a collector (Flotigam EDA) is added into a conditioning tank.
195
Rougher flotation concentrate is pumped to the first cleaner stage, rougher tails reports to a scavenger circuit, the concentrate of which is returned to the head of the rougher cells. Scavenger tails is filtered, and the cake stacked in a designated area close to the plant site, for future reclamation.
Concentrate from the first cleaner stage is pumped to a second cleaner while cleaner 1 tailings are also returned to the rougher feed. Cleaner 2 tails are recycled to cleaner 1 while cleaner 2 concentrate is pumped to the concentrate filter. The lepidolite filter cake is then dried, bagged and trucked/shipped to customers.
| 17.3.9 | Reagents |
There are a number of reagents used in the flotation process that come in solid or liquid form with various safety concerns. These reagents will be handled and stored, mixed and pumped to specific addition points within the process in a safe manner. Some of the reagents will arrive on site in bulk and some will be in drums. The reagents include the following:
Petalite Flotation:
| • | Hydrofluoric acid (HF). | |
| • | PEG collector. | |
| • | K2C flotation collector. | |
| • | 4343 collector. | |
| • | D14 flotation reagent. | |
| • | Sodium chloride (NaCl). | |
| • | Potassium chloride (KCl). | |
| • | Lime |
Lepidolite:
| • | Flotigam EDA Collector. | |
| • | Sulphuric Acid. |
Feldspar Flotation:
| • | Hydrofluoric acid (HF) | |
| • | 4343 flotation reagent. |
Product Dewatering:
| • | Flocculants. |
196
Individual dosing pumps with variable speed drives will be employed for each reagent dosing point.
| 17.3.10 | Metallurgical Accounting |
Weightometers will be installed on the primary crusher product conveyor, mineralized material sorter rejects conveyor and the crushed mineralized material reclaim/VSI feed conveyor.
Mass flow systems and automatic samplers will be installed on the following process streams:
| • | Crushed ore to mill feed bin. | |
| • | Slimes + Magnetics tailings. | |
| • | Petalite/Lepidolite flotation circuit feed after magnetic separation. | |
| • | Petalite/Lepidolite flotation rougher scavenger tailings. | |
| • | Petalite/Lepidolite concentrate. | |
| • | Petalite cleaner 3 tailings. | |
| • | Feldspar flotation circuit feed. | |
| • | Feldspar flotation tailings. | |
| • | Feldspar flotation concentrate. |
| 17.3.11 | Plant Services |
The concentrator will utilize compressed air and low-pressure blower air. Compressed air will be split into plant air, and instrument air (which will also be filtered and dried). The low-pressure blowers will supply air for the petalite/lepidolite and feldspar flotation cells.
| 17.3.12 | Water |
| 17.3.12.1 | Fresh Water |
Fresh water will be obtained from the nearby English River and pumped to a storage tank. Fresh water will be used to provide gland service water, potable water (after treatment in the potable water plant), reagent make-up water and filter wash water for the concentrate and tailings filter washing. If required, fresh water will also be used as a source of fire water.
197
| 17.3.12.2 | Process Water |
The water balance within the flotation plant is very complex; there will be a number of separate process water circuits at the flotation plant that will have their own dedicated process water storage tank and distribution systems. These circuits include:
| • | Comminution Process Water: Comminution, classification, desliming and magnetic separation circuits. | |
| • | Petalite Rougher Process Water: Petalite rougher, scavenger, primary cleaning and secondary cleaning circuits. | |
| • | Petalite Cleaner Process Water (and Lepidolite Process Water): Petalite cleaning circuits and the lepidolite flotation circuit. | |
| • | Feldspar Process Water: Used in the feldspar circuit for launder sprays and general process applications |
| 17.3.12.3 | Water Treatment |
Final water treatment will consist of processing the filtrate from the flotation scavenger tailings filter. Lime will be added to precipitate dissolved metal ions and these solids will then be removed by firstly a thickener and then a filter. Filter cake will then be deposited within the TMF and the treated water will be returned to the petalite rougher process water circuit or directly to the brine make-up system.
198
18.0 PROJECT INFRASTRUCTURE
| 18.1 | OVERVIEW |
The flotation concentrator will be located at the mine site with the various concentrates (petalite, lepidolite and feldspar) being dried, bagged and trucked to an existing CN rail siding at Redditt for despatch to customers.
Figure 18.1 shows the location of the Separation Rapids property in relation to principal supporting infrastructure.
Figure 18.1
Location of the Separation Rapids Property
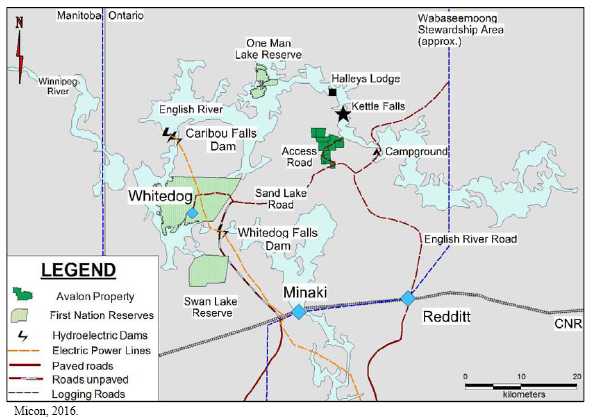
As there is no rail access to the mine/concentrator site, delivery of reagents to and shipment of concentrates from the site will be by truck.
199
| 18.2 | MINE ANDCONCENTRATORSITE |
| 18.2.1 | Location and Access |
As discussed in Section 5.0, the property is readily accessible with a total road distance from Kenora to the site of 79 km. Figure 18.2 shows the location of the property and the route of the mine access road.
Figure 18.2
Route of the Avalon Mine Road

Development of the Project will require upgrading of the Avalon Road to accommodate the mining, concentrate removal and consumable delivery trucks.
200
| 18.2.2 | Site Preparation and Haul Roads |
The site is predominately rock with a minimum of top soil or organic cover. Existing soil and organics will be stripped and retained to be used later for site restoration. Some of the waste rock that will need to be excavated as part of the mining operation will be crushed and used as fill for the site development.
| 18.2.3 | Site Buildings |
Site buildings are anticipated to include:
| • | Crusher Building. | |
| • | Main Process Plant Building housing: |
| o | Milling and flotation Circuits. | |
| o | Concentrate storage/loading facilities. |
| • | Wash room/change room/lunch room. | |
| • | Offices and laboratory. | |
| • | Electrical MCC’s. | |
| • | Maintenance building and warehouse. |
Heating, ventilation and air conditioning will be provided for all buildings as required. Propane will be used to fuel the heating system.
| 18.2.4 | Fresh Water |
Fresh water and fire water for the site will be provided from the English River. An intake line will be installed to a sufficient depth in the river to be below the ice level. Water treatment facilities will be provided as required to supply potable water to the site.
| 18.2.5 | Sewage |
Sanitary waste water treatment will be provided at the site using appropriately sized parallel septic tanks and field bed. Arrangements will be made with a local contractor for the periodic pumping of the septic tanks for removal and disposal of the sludge as required.
| 18.2.6 | Power |
Approximately 10 MW of (operating) power will be required and this will be supplied from the existing 115 kV system running from Caribou Falls to Whitedog Falls. A stepdown transformer will be installed at the connection point to the 115-kV line and approximately 25 km of transmission line will be installed to bring the power to the mine site. An additional stepdown transformer will be installed at the site to supply power to the local electrical distribution system. An emergency back-up generator will also be provided at the fueled by propane.
201
Project information and requirements have been supplied to Hydro One who have confirmed that sufficient power is available for the Project and are currently investigating the best option for supplying power to the site. In the meantime, a provision has been included in the capital cost estimate for the installation of this power line.
| 18.2.7 | Fuel Storage |
Diesel fuel storage facilities will be provided to supply the mine equipment and smaller site vehicles. Two double-wall diesel tanks will be provided on a concrete foundation.
A propane tank farm will also be installed to accommodate the site heating, fuel for the concentrate driers and back-up power generator.
| 18.2.8 | Hydrogen Fluoride |
Hydrogen fluoride is required in the flotation process. A facility will be constructed to receive 49% aqueous hydrogen fluoride by truck and store it as required to meet the process plant requirements.
| 18.2.9 | Communications |
A telecommunications system will be installed at the site to provide telephone service and internet access, and to support the site security and fire detection systems. A mobile radio system will be installed to provide local communication to all parts of the mine and site facilities.
A microwave link will be installed to provide access to an internet service provider. A backup system will be provided using a cellular modem. Distribution will be provided by a fibre optics system in the concentrator and related facilities and a wireless system for the mine site.
| 18.2.10 | Camp |
No camp facilities are envisioned for this Project. It is anticipated that the work force will live in Kenora and the surrounding area.
202
19.0 MARKET STUDIES AND CONTRACTS
| 19.1 | INTRODUCTION |
As discussed in Section 17.0, this PEA is based on the recovery of lepidolite, petalite mixed sodium/feldspar (Na/K) feldspar concentrates at the following approximate annual rates:
| Lepidolite | 11,800 t/y | |
| Petalite | 73,000 t/y | |
| Na/K feldspar | 100,000 t/y |
It is planned that the lepidolite concentrate will be sold into the lithium chemicals industry to customers in Canada, while the petalite will be sold to customers in the glass and ceramics industries in North America, Europe and Asia. The feldspar concentrate will be sold for applications in glass, ceramics, frits and glazes and fillers in North America and Europe.
Avalon conducts its own market research and analysis which includes attendance at relevant conferences and presentations and holds regular discussions with industry participants and potential off-takers. The company subscribes to Benchmark Minerals’ Quarterly magazine which provides analysis of the battery raw materials markets (specifically lithium), and purchases specialist market analysis reports, as required.
| 19.2 | LITHIUM |
Lithium is the lightest of all metals, appearing at the top left-hand corner of the periodic table (atomic mass 6.9 and atomic number 3). It does not occur in nature in the metallic form but in the silicate minerals, spodumene, petalite and lepidolite, contained in pegmatites as at Separation Rapids. As noted above, the purpose of this PEA is to assess the recovery of petalite and lepidolite as mineral concentrates.
The U.S. Geological Survey (USGS) reports production of lithium minerals and products as shown in Table 19.1. In terms of gross product weight, Australia is the largest single producer of lithium minerals and chemicals, with output exceeding 400,000 t/y spodumene. Chile is the second ranking producer with a range of lithium chemicals recovered from subsurface brines.
Table 19.1
Lithium Mineral and Brine Production (Tonnes gross weight)
| 2011 | 2012 | 20131 | 2014 | 2015 | |
| Argentina, subsurface brine | |||||
| Lithium carbonate | 10,024 | 10,535 | 9,248 | 11,698 | 14,137 |
Lithium chloride | 4,605 | 4,297 | 5,156 | 7,370 | 5,848 |
| Australia, spodumene | 421,391 | 456,921 | 415,000 | 463,000 | 490,000 |
| Brazil, concentrates | 7,820 | 7,084 | 7,982 | 8,519 | 8,500 |
203
| 2011 | 2012 | 20131 | 2014 | 2015 | |
| Chile, subsurface brine | |||||
| Lithium carbonate | 59,933 | 62,002 | 52,358 | 55,074 | 50,418 |
| Lithium chloride | 3,864 | 4,145 | 4,091 | 2,985 | 2,069 |
| Lithium hydroxide | 5,800 | 5,447 | 4,197 | 4,194 | 3,888 |
| China, lithium carbonate equivalent | 11,300 | 10,000 | 11,200 | 10,100 | 10,700 |
| Portugal, lepidolite | 37,534 | 20,698 | 19,940 | 17,459 | 17,120 |
| United States | w | w | w | w | w |
| Zimbabwe1 | 48,000 | 53,000 | 50,000 | 50,000 | 50,000 |
1 Amblygonite, eucryptite, lepidolite, petalite, spodumene.
w = withheld.
USGS, 2017.
Data reported by the USGS for 2016 and 2017 are provided in terms of contained lithium in the Mineral Commodity Summaries; on this basis, Australia and Chile are also the first and second largest producers (estimated at 18,700 t contained lithium and 14,100 t contained lithium, respectively in 2017), followed by Argentina and China (5,500 t contained lithium and 3,000 t contained lithium, respectively). The USGS data indicate that lithium minerals accounted for approximately 54% of the total in terms of contained lithium. (USGS, 2018a).
| 19.2.1 | End-use Sectors |
The USGS estimates global demand for lithium broken down by end-use sector as shown in Figure 19.1.
Figure 19.1
2017 Lithium Consumption by End-use Application

Consumption in batteries has increased significantly over the past five years, to the point where it now surpasses demand in ceramics and glass. Rechargeable lithium batteries are used in a wide range of applications including cell phones, cameras, portable electronic devices and hand-held tools and, increasingly in electric vehicles and renewable energy storage.
204
Lithium demand and supply may be expressed in terms of lithium carbonate equivalent (LCE) in order to compare lithium sources and prices.
It is expected that demand for batteries and energy storage systems will continue to outpace other lithium demand sectors and will drive overall lithium demand. Predictions for lithium demand in 2025 range from approximately 525,000 t LCE to 875,000 t LCE, up from approximately 150,000 t LCE in 2016 (Avalon, internal data). These projections are based on the anticipation that as governments support the transition from a hydrocarbon-based economy, electric vehicles and renewable energy storage systems will become increasingly important.
| 19.2.2 | Lithium Chemicals |
The battery and renewable energy storage sectors use lithium principally in the form of lithium carbonate (Li2CO3) and lithium hydroxide (LiOH). Avalon plans to participate in the battery sector through the supply of lepidolite concentrate for processing by a third party into lithium carbonate.
On 6 February, 2017, Avalon announced that a non-binding letter of intent had been signed with Lepidico Ltd. (Lepidico) of Australia for the supply of up to15,000 t/y of lepidolite concentrate to feed Lepidico’s planned Phase 1 lithium carbonate demonstration plant in Sudbury, Ontario. Lepidico expects the feasibility study for this facility to be completed in September, 2018 (Lepidico, 2017). As of August, 2018, it is understood that Lepidico continues to be interested in purchasing lepidolite from Avalon.
| 19.2.3 | Glass and Ceramics |
As shown in Figure 19.1, glass and ceramics make up the second largest lithium end-use sector which is supplied by both lithium chemicals and mineral concentrates from hard rock deposits. These minerals are used as fluxes in the production of ceramic tiles and sanitary-, table- and cookware where the contained lithium provides certain advantages over other silicate minerals. Glass-ceramics, a group of products which share properties of traditional glasses and ceramics, are used in items such as glass cookware, ceramic cooktops and fireplace shields. The addition of lithium strengthens the glass and reduces melting temperatures.
As described in Sections 13.0 and 17.0, Avalon will produce two grades of petalite: 50% of output will contain 4.5% Li2O and low levels of sodium and potassium (“Super Petalite”), and 50% will grade 4.0% Li2O. Samples of both grades have been well-received by potential end-users in the glass and glass-ceramics industries.
205
| 19.3 | FELDSPAR |
The feldspar group is by far the most abundant group of minerals in the earth’s crust, forming about 60% of terrestrial rocks. Feldspar minerals, including nepheline syenite, are widely produced with global output reported by the USGS as summarized in Table 19.2.
Table 19.2
Feldspar, Mine Production by Country (Thousand tonnes)
| Country | 2011 | 2012 | 2013 | 2014 | 2015 |
| China | 2,100 | 2,100 | 2,500 | 2,500 | 2,500 |
| Czech Republic | 407 | 445 | 411 | 422 | 430 |
| India | 763 | 1,178 | 1,459 | 1,413 | 1,500 |
| Iran | 577 | 600 | 1,313 | 1,300 | 1,200 |
| Italy | 4,700 | 4,700 | 4,500 | 4,500 | 4,000 |
| Korea, Republic | 384 | 360 | 343 | 544 | 600 |
| Spain | 622 | 530 | 593 | 533 | 600 |
| Thailand | 1,041 | 1,101 | 1,073 | 1,413 | 1,332 |
| Turkey | 4,355 | 4,525 | 4,545 | 5,100 | 5,000 |
| United States | 580 | 560 | 550 | 530 | 520 |
| Others | 5,671 | 4,601 | 4,713 | 4,745 | 4,618 |
| Total | 21,200 | 20,700 | 22,000 | 23,000 | 22,300 |
USGS, 2018b.
Data reported by the USGS for 2016 and 2017 show an increase in total production to 23,600 thousand tonnes and 23,000 thousand tonnes, respectively (USGS, 2018c).
Production is dominated by Turkey, Italy, China and India. Production in the United States has declined steadily over the past five years. The USGS does not report production from Canada.
| 19.3.1 | End-use Sectors |
Feldspar is used principally as a source of alumina and alkali metals for the glass and ceramics industries. The USGS estimates that the glass market for feldspar in the United States represents the largest market at around 60% with ceramics and other applications, including fillers, accounting for the balance (USGS, 2018c).
In the manufacture of glass, feldspar is both an important raw material and a fluxing agent where it reduces the melting temperature of the glass batch and helps to control the viscosity of glass.
In ceramics, feldspars are used as fluxing agents to form a glassy phase at low temperatures and as a source of alkali elements and alumina in glazes. They improve the strength, toughness, and durability of the ceramic body and cement the crystalline phase of other ingredients, softening, melting and wetting other batch constituents. In enamels and frits, feldspar assists the enamel composition, ensuring the absence of defects and the finish of the end product, such as ceramic tiles, sanitaryware, tableware, electrical porcelain and giftware.
206
Feldspars also are used as fillers and extenders in applications such as paints, plastics and rubber. Beneficial properties of feldspars include good dispersability, high chemical inertness, stable pH, high resistance to abrasion, low viscosity at high filler loading, interesting refractive index and resistance to frosting. The products used in such applications are generally fine-milled grades.
Further end-uses are in paints, mild abrasives, urethane, welding electrodes, latex foam and road aggregate.
Testwork carried out by ANZAPLAN indicates that feldspar from the Separation Rapids property has a very low iron content and has similar chemical composition to the feldspars marketed by major North American producers.
Through discussions with market participants and industry experts, and evaluation of data provided in purchased reports and publicly available information, Avalon estimates that an average of 70,000 t/y of feldspar can be sold into markets in the United States, Canada and Europe. Sales will be built up between Years 5 and 9 of the life of mine, to reach a steady rate of 100,000 t/y in Year 10.
| 19.4 | PRICESUSED FORECONOMICANALYSIS |
Avalon has carried out its own assessment of the markets for lepidolite, petalite and feldspar, based on purchased reports, information presented at conferences and discussions with industry participants and potential off-takers.
The QP has reviewed the volume and pricing information prepared by Avalon and has independently confirmed that Avalon’s projections are reasonable for the purpose of this PEA.
| 19.5 | CONTRACTS |
At this stage of development of the Separation Rapids property, there are no material contracts in place.
In February, 2017, Avalon entered into a non-binding letter of intent with Lepidico for the supply of 15,000 t/y of lepidolite concentrate for Lepidico’s demonstration plant.
207
20.0 ENVIRONMENTAL STUDIES, PERMITTING AND SOCIAL OR COMMUNITY IMPACT
The information in this Section has been abstracted from the March, 2007, Project Description and Environmental Baseline Study Report (Knight Piésold, 2007), the September, 2013, Species at Risk Assessment (Knight Piésold, 2013), 2016 Tailing, Waste Rock and Water Management Plan (Knight Piésold, 2016a) and the 2016 PEA Conceptual Closure Plan (Knight Piésold, 2016b), prepared by Avalon’s environmental consultant, Knight Piésold. The 2007 report was based largely on information collected in the late 1990s, and additional data collection to validate the conclusions of this study has been completed and is undergoing analysis to validate the earlier studies. Additional environmental testing of waste products has also been initiated in 2018 to validate earlier conclusions. A biological assessment of the newly proposed location of the Tailings Management Facility (TMF) was completed in 2018. Discussions with regulators have been initiated.
| 20.1 | INTRODUCTION |
The Project site lies in an area adjacent to the English River, a regionally significant waterbody which supports a variety of wildlife and fisheries as well as tourism. The area surrounding the mine site is undeveloped and forested. The general arrangement of proposed mine development components is shown on Figure 20.1.
| 20.2 | PROJECTAPPROVALS ANDPERMITTING |
| 20.2.1 | Separation Rapids Permitting |
The Federal and Ontario Provincial permitting processes are well defined and understood. The Ministry of Northern Development and Mines (MNDM) is responsible for coordinating the various regulatory agencies in the mine permitting process.
A Project Description and comprehensive Environmental Baseline Report of the mine and concentrator site was completed in March 2007, updated from the July, 1999 draft. The 2007 report included a preliminary environmental impact assessment, although this was based on a different project development model to that presently envisaged. It is expected that given that there has been little development activity at the site since 1999, the vast majority of the baseline assessment work will be adequate for the foundation of an assessment of potential environmental impacts and all permitting work, with only minor work required to validate the data.
208
Figure 20.1
Separation RapidsProject SiteLayout
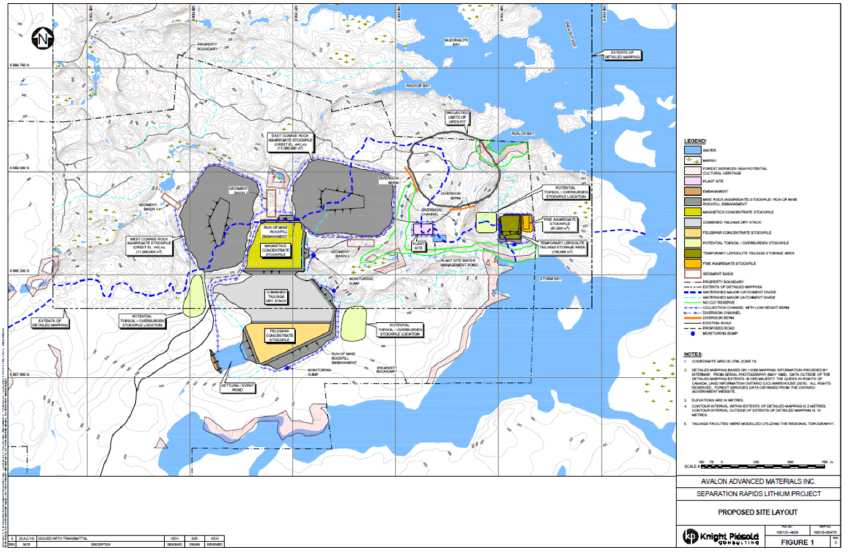
209
A Species at Risk Act (SARA) study for the mine and concentrator site area was completed in September, 2013 (Knight Piésold, 2013). Subsequent site environmental investigations have confirmed that no endangered or at-risk animal or plant species exist at site. Discussions with responsible Ministries regarding potential additional updates were held in late 2016, although these were based on a larger and more complex business model than the 2018 business model described in this PEA.
Additional environmental baseline data were collected in the spring and fall of 2017 and July 2018 and analyses of these data are ongoing to augment and validate the environmental data in the original Project Description and Environmental Baseline Report. Additional testing on all waste products based on the most recent flow sheet was initiated.
A Memorandum of Understanding has been signed with the Wabaseemoong First Nation and a detailed presentation based on the 2017 business model was provided to Chief and Council. Preliminary discussions, including a Valued Components Workshop were similarly held with the Métis Nation of Ontario. Preliminary discussions have been held with the Dalles and Grassy Narrows First Nation bands as well, though it is Avalon’s understanding that their indigenous rights are subject to those of the Wabaseemoong Independent Nation (WIN) who have a Stewardship Agreement with the Province of Ontario. This agreement, in partial compensation for the required relocation of WIN communities due to the construction of hydroelectric dams, gives them joint control of natural resource development in the Project area with the Ministry of Natural Resources and Forestry (MNRF). Discussions are also ongoing with political and community representatives. Engagement is expected to continue through the life of the Project. The Project has strong community support.
| 20.2.2 | Mine and Floatation Plant |
Avalon already has an Advanced Exploration Approval based on an approved closure plan, though it is presently in a state of inactivity and is permitted for 15,000 t of material. Prior to construction of the concentrator and finalization of a Feasibility Study, a 30-t bulk sample will be processed in a pilot plant to validate the laboratory scale work. This sample will be acquired from existing broken rock from previous test programs and rehabilitation work to improve access and egress to the existing exploration area (centre Figure 20.2 below). Exploration permits for additional drilling on site were acquired from MNDM for drill programs in 2016 and 2017. There programs were successfully completed without any environmental impacts. The present permit allows for nearby future expanded areas of exploration on recently acquired claims.
210
Figure 20.2
2017 Photo of the Separation Rapids Site
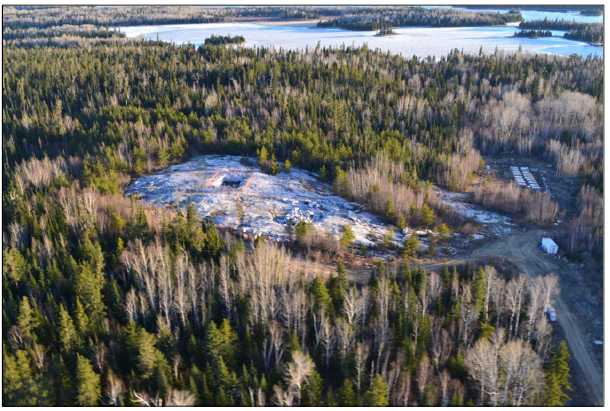
The present business model now envisages the production of lepidolite, petalite and feldspar concentrates. Mining will be by conventional truck and shovel open pit mining. Preliminary mining plans comprise typically the excavation of approximately 338,000 t/y of petalite mineralization and 137,000 t/y of lepidolite mineralization for 18.5 years, averaging 475,000 t/y, or less than 2,000 tonnes/day. A concentrator located on-site will produce three products (petalite concentrate, lepidolite concentrate and feldspar concentrate) Lepidolite and petalite mineralization will be processed separately, necessitating small plant feed and concentrate storage stockpiles near the concentrator. Concentrate, aggregate (waste rock) dumps, and a TMF will be managed at the site. A separate magnetics storage area is also planned in anticipation that a process can be developed to recover lithium from this process stream. Additionally, a storage area will be constructed near the plant site for temporary storage of up to 150,000 tonnes of lepidolite tailings for future reprocessing to recover petalite. All stored products will be either whole rock or filtered and stacked tailings.
Due to the relatively small scale of the Project and the site being located well away from any federally protected areas, and because the capacity of the mine and concentrator are approximately half the tonnage triggers in the Federal Environmental Assessment Act 2012, permitting under this act does not apply. As such, permitting time lines are significantly reduced.
211
The proposed site of the TMF was selected under the basis of initial verbal reports from an external environmental consultant study that stated that this area did not contain fish. However, additional work in the area has recently identified it as containing small populations of three minnow species. It is likely that these are temporary populations that are periodically lost due to beaver dam failures and/or winter conditions during which the small ponds freeze to or near the bottom, and/or periods of drought that dry up these small water bodies thus eliminating these populations until conditions for life return. As a result, there is potential to trigger the Fisheries Act due to the location of the TMF at this location. Discussions with the WIN, MNRF and Federal Department of Fisheries and Oceans are planned to determine the extent of any required compensation or offsets required for the temporary loss of this small amount of fish habitat. It is noted that both the TMF and open pit can become fish habitat post closure, though discussions with stakeholders regarding post closure land use are ongoing. These discussions and any approvals that may be required are anticipated to take approximately one year.
A number of provincial environmental permits will be required. These permits are approved by Ministry of Northern Development and Mines (MNDN), Ministry of Natural Resources and Forestry (MNRF) and the Provincial Ministry of Environment, Conservation and Parks (MECP, formally MOECC) and Ministry of Health (MOH). Additional non-environmental approvals under the Ministry of Labour will also be required for construction and operations.
A Project Description of the 2017 activities, which was based on the previous project criteria outlined in the 2016 PEA, was prepared and reviewed with all applicable regulators. No fatal flaws were identified associated with this more complex design with greater potential for environmental impacts than this current business model described in this updated PEA.
A closure plan will be required for the Project. This includes filed financial assurance to complete the rehabilitation of the site once the Project is completed. Depending on whether or not additional engagement is required, the time line for this will range from 45 days to 3-4 months. Financial assurance is in place for the original advanced exploration program and these funds will be allocated to the Project. Given the extent of the rehabilitation work completed to date (camp removed, signage installed, pit egress improved, significant areas already self-re-vegetated), no additional short-term financial assurance is anticipated.
Long term assurance will eventually be required to rehabilitate the TMF, remove infrastructure, roads and for re-vegetation. There will be two aggregate (waste rock) stockpiles on site. One will be cost effectively rehabilitated during operations with material recovered from the site of the second stockpile. Stored organic material from the stripping of the first stockpile will be utilized at closure for the second stockpile. The pit will have an access/egress designed into it. Discussions are ongoing with stakeholders regarding potential beneficial reuse of the site post closure and include forestry, rice production and aquaculture in the flooded pit.
212
Avalon has acquired the existing Nelson Granite quarry and associated permit along the present access road to ensure ongoing road access. No additional quarry or aggregate permits will be required. This assures that the access route is fully controlled by Avalon.
| 20.2.3 | Construction, Operations and Closure |
The Separations Rapids Lithium Project approval time line is governed by the time required to obtain individual construction and operating permits, none of which are anticipated to exceed 1 year. In discussions with the regulator, the Federal Canadian Environmental Assessment Act process from Environment and Climate Change Canada (ECCC) is not anticipated to apply as the Project does not exceed any of the applicable triggers. Given that the power supply will be distribution (vs transmission), permitting is limited to those required by MNRF and this is also anticipated to be less than one year. Discussions are ongoing with Hydro One regarding the optimal source and route for the transmission line from local hydro electric supply.
The following key permits and approvals are expected to be required:
| • | Certified Closure Plan under the Mining Act from the Ontario MNDM for the full project. | |
| • | Environmental Compliance Approvals (ECA) under the Ontario Environmental Protection Act and Ontario Water Resources Act for effluent waste water and sewage treatment management from the MOECC and MOH for the mine site. | |
• | An ECA will be required for all significant air discharges from the MOECC. The significant air discharges requiring permits will be those associated with discharges from dust collection systems and for emissions from back-up power generation at the concentrator. | |
| • | Permit for explosives storage on site from the Ontario Ministry of Labour (MOL). | |
• | Approval of the containment structures under the Lakes and Rivers Improvement Act (LRIA) from the MNRF and MNDM will be required initially, and any future expansions will require approval from the Ministry of Northern Development and Mines. | |
| • | Permit to take water for process and potable (drinking) water from the MOECC for the mine and concentrator site. | |
• | A Waste Generator Approval is required under the Ontario Environmental Protection Act. This will include permits to temporarily store wastes on site prior to sending to an appropriate licensed disposal/landfill facility. As a landfill site is not presently contemplated at site, an associated permit is not required. | |
• | Additional Work Permits under the Forest Fires Prevention Act, Lakes and Rivers Improvement Act and Public Lands Act will be required from the MNRF for use of public lands, power line, lake and river crossings and forest fire prevention. |
213
The Tailing Management Facility (TMF) impacts on temporary fisheries habitat. Pending discussions with the WIN, MNRF and Department of Fisheries and Oceans, authorization under the Fisheries Act from the Department of Fisheries and Oceans (DFO) may be required. An approval under the SARA from ECCC or MNRF is not expected to be required based on the SARA study. This study was completed in 2013 and no species listed under the act were identified as living on site, though Little Brown Bats are known to visit (Knight Piésold, 2013). Subsequent site investigations did not identify any additional species of concern in the immediate areas of planned Project infrastructure.
Authorizations under the Navigation Act will not be required as a dock is already at the mine site and no additional work that could cause an obstruction to the waterway is planned.
Additional minor approvals with short approval time lines will also periodically be required such as those necessary for small radiation sources for monitoring or laboratory analytical equipment for example.
The key steps and time line for the permitting process include the following:
• | Update and review the Project Description with the Federal CEAA Agency. This will include validation that the triggers in the CEAA are not exceeded. Provincial permits may take up to a year to complete but known key critical path permits may be initiated as soon as the technical data are available. | |
| • | Environmental Compliance Approval (ECA). This will be required from the Ontario MECP for effluent discharged and for air emissions. | |
| • | Approval of the containment structures under the Lakes and Rivers Improvement Act (LRIA) from the Ministry of Natural Resources and Forestry. This is on the critical path. | |
| • | Provincial regulatory approvals, anticipated to take approximately 1 year. | |
| • | Once the route of the transmission line is identified, approvals for this will be initiated with the Ministry of Natural Resources but are not anticipated to be critical path. | |
| • | Discussions with the Federal Fisheries Act personnel will be initiated once input from the WIN has been obtained. |
214
| 20.2.4 | Conclusion |
The Avalon Separation Rapids Lithium Project is a small-scale mining project without many of the risks frequently found at other mines such as acid mine drainage. Based on the earlier studies, all tailings mine rock aggregate and concentrate materials are expected to be inert, air and water quantities utilized and discharged are relatively small and can be managed to acceptable standards with conventional technologies. However, until such time as this information is validated for the final process design, as a precaution and to minimize fresh water use, as much of the water as is feasible will be recycled back to the concentrator. Similarly, remaining runoff water will be treated for suspended solids in settling ponds.
Water quality assumptions are being validated by humidity cell test work that simulates long term runoff quality.
Meetings have already been held with all key regulators to develop positive relationships early and to review the proposed Project. Through this early engagement, specific concerns are identified, and all required studies can be completed in a timely manner so that there are no surprises during the permitting process. Similarly, positive relationships have already been developed with Indigenous Peoples, political and community representatives.
The mine site is approximately 70 km from the city of Kenora where there is an educated workforce knowledgeable and supportive of the Project.
The permitting project is being managed by Avalon’s Vice President, Sustainability, who has extensive permitting experience and a track record of successful permitting with support from similarly experienced consultants. An external gap analysis regarding the information required to permit the Project has been completed by Knight Piésold, a qualified consultant and all requirements have been identified.
Given the relatively small size and low environmental risk, permits should be acquired in a timely manner that will not negatively impact the Project schedule.
| 20.3 | ENVIRONMENTALBASELINE |
For the mine and concentrator site, an environmental baseline study program has been conducted, investigating regional and site-specific aspects such as water quality, hydrology, vegetation, wildlife, fisheries, archaeology, and socioeconomics. The ecology of the Project area was investigated with field visits carried out in all four seasons during 1998 and 1999 The majority of these data are still valid and utilizable, and some additional work has been completed related to regulatory changes since this study.
Plans are in place to further update or validate this information in the next project phase, in consultation with all communities of interest. This is based in part on a gap analysis that has been completed by Knight Piésold to ensure the data will be comprehensive, historical dataare validated and to ensure all potential areas impacted by the Project are evaluated in line with present regulatory requirements.
215
| 20.4 | TOPOGRAPHY |
The English River is located within the Severn Upland region of the Canadian Shield, which generally comprises low rolling bedrock hills overlain by a mantle of Wisconsinan glacial deposits. Elevations on the Project site range from approximately 310 masl to 370 masl, while elevations within 5 km of the site range between 310 and 410 masl. The SRP and the Great White North deposits immediately to the northwest are prominent topographic features of the Project site, with elevations of 352 m and 366 m, respectively.
The deposit topographic feature will be removed in the process of developing the open pit, however, the Great White North deposit will remain adjacent to the pit at this time. Two mine rock aggregate stockpiles (waste rock) located west of the open pit will reach a maximum elevation of 442 masl, which are marginally higher than the range of elevations found within 5 km of the Project site. Several potential mine rock aggregate storage facility arrangements were investigated in order to minimize both the areal extent and the final height of the facilities, within a reasonable haul distance of the open pit. A third small (180,000 tonne) crushed aggregate stockpile (fine aggregate) consisting of the rejects from the mineralized material sorting will be stockpiled near the concentrator and will be ideal material for ongoing infrastructure construction such as the concentrate and tailing storage facilities, road maintenance and pit road construction. Given that petalite and lepidolite concentrator feed material will be processed at different times but in the same circuit, an additional temporary 150,000 tonne stockpile will be utilized to temporarily store lepidolite tails for future reprocessing to recover petalite.
| 20.5 | AIRQUALITY |
Due to the mine site location, air quality is considered to be good and is not affected by long range atmospheric pollutants. Air quality will be potentially affected primarily by dust emissions from haulage roads, blasting, mine rock aggregate stockpiles, and the TMF, of which the Tailing storage poses the greatest potential risk. There will also be some intermittent emission from the back-up power generation system. Wind erosion of tailings should be minimized due to the location of the TMF in a valley bottom, shielded by higher hills and the mine rock aggregate management facility, and the generally moderate winds in the locality of the site. Dust control, such as the use of water or recycled water, will be utilized as appropriate to mitigate potential impacts. Dust monitoring will be implemented.
| 20.6 | NOISE |
With the exception of light motor boat traffic on the English River in summer and snow machine traffic in winter, background noise levels are low. Noise will be generated during construction and operational phases of the mine due to blasting, mill operation and vehicular traffic. Potential mitigation measures include natural sound ‘baffles’ (i.e., locating the concentrator site behind hills), the use of sound insulation in building construction, enforcement of speed limits on access roads, and suitable timing of blasting. The nearest permanent residences are sufficiently distant to not be impacted by the site.
216
| 20.7 | HYDROLOGY |
The major receiving water for surface water flow from the mine site is the English River, which flows from near the town of Dryden for approximately 420 km in a northwesterly direction, through a chain of lakes extending from Wabigoon Lake in Ontario, to Lake Winnipeg in Manitoba. In 1957, a hydroelectric dam was constructed at Caribou Falls, approximately 60 km downstream of the Project site, and this had a major influence upon the physical characteristics of the English River, forming Umphreville Lake, with flooding extending upstream to near the Project site.
The Project area is drained by four small streams. Stream C, a small intermittent drainage flows from the proposed open pit location north into Avalon Bay and is not identified as fish habitat. A swamp located at the southwest edge of the deposit also did not contain fish and intermittently drains south into an abandoned beaver pond, and then east into a stream (Stream B) leading into Storm Bay. Storm Bay is a large, shallow water body with a constricted mouth, which leads into the main English River channel. A stream further to the southwest of the pit (Stream D) also drains the area to the south west. If not recycled back to the concentrator, treated (settling only) runoff from inert tailing will contribute to the downstream flows. Stream A, known to be fish habitat and located to the north and west of the Project, will not be utilized for storage of mine rock aggregate, concentrate or tailing.
Construction of the proposed mine site will have an effect on site hydrology. Significant efforts to minimize this impact have been made, including the use of dry stacked tailing.
The northern part of the intermittent component of Stream B and the wetland on the southwest edge of the deposit that is not considered fish habitat, will be consumed by the pit and mine rock aggregate management area. For the purposes of this PEA, the components south of the existing access road (and small waterfall that acts as a fish barrier) that eventually becomes fish habitat will not be disturbed by the Project. The proposed open pit will occupy most of the drainage area of the small intermittent non-fish bearing stream flowing into Avalon Bay (Stream C).
Local and regional hydrology will not be affected by mine development, as the proposed mine will occupy less than 2 km2 in area. This is not significant in terms of total size of the English River and the Storm Bay watersheds and, since no significant effluent discharge quantities are projected from mine operations, no hydrological impacts are predicted. The site drainage system is shown in Figure 20.3.
217
Figure 20.3
SiteCatchmentBoundaries

218
| 20.8 | WATERQUALITY |
Results of a 12-month surface water quality monitoring program on the English River during 1998-1999 revealed that median concentrations of the majority of parameters monitored are comparable to those expected in a river free of major contaminant inputs. Provincial Water Quality Objectives (PWQO) were at times exceeded for aluminum, cadmium, copper, mercury, lead, silver and zinc, which is not unusual for catchments containing mineralized zones.
A baseline surface water quality monitoring program was initiated in streams on the proposed mine site. Aluminum was found to exceed PWQO which, in the absence of known anthropogenic sources, is most likely due to natural weathering of soils and bedrock. PWQO concentrations for cadmium, copper, iron, lead and zinc were also exceeded. Baseline water quality data will be used to define water quality goals on closure of the proposed mine.
The preliminary characterization testing indicates that the mine rock and mineralized material will not be acid generating. Additional work in 2015 analyzed selected “worst case” mine rock samples. Even the single highest and rare sulphide bearing samples with visible sulphidic material had a carbonate: sulphur ratio of 8:1, further supporting this conclusion. Impacts to the water quality of receiving waters could potentially result from runoff from the waste rock storage facilities or TMF. Parameters of potential concern may include total suspended solids, organic reagents and brine used during processing, and residual trace metals from weathering of waste rock and tailings. However, the preliminary Synthetic Precipitation Leaching Procedure (SPLP) 1312 tests on mineralized material, mine rock, and tailings suggest that runoff would not contain any parameters that would exceed the Metal and Diamond Mining Effluent Regulations (MDMER). All mine rock will thus be stored as aggregate for future utilization. Laboratory kinetic tests (humidity cells), which mimics accelerated weathering of the rock over time, have been initiated.
Nitrate is a potential nutrient of concern that can be generated by the use of ammonium nitrate blasting agents. Phosphorus is not a concern from the mineralized material, mine rock aggregate, processing or the minor quantities of treated sewage. On this basis, eutrophication from nitrate is unlikely due to the fact that phosphorus is normally the limiting nutrient in northern Ontario waters. Regardless, best management practices for blasting will be incorporated, and monitoring of nitrogen compound concentrations will be part of the ongoing monitoring plans. In the event that nitrates approach concentrations of concern, strategies can include the use of emulsions, mine employee retraining in ammonium nitrate management and investigation of the maintenance of ammonium nitrate storage and/or loading equipment or using wetland treatment.
Several measures to mitigate impacts to water quality can be incorporated into the Project plan, including:
| 1. | Recycling and potentially treating process water in the concentrator to minimize fresh water requirements and the rate of discharge to the environment. |
219
| 2. | Diversion of non-impacted site runoff away from the site to reduce impacted water volume. | |
| 3. | To significantly reduce the risk from tailings water at the TMF, tailings will not be hydraulically placed and will be filtered and trucked to the TMF as solids. | |
| 4. | Collection and treatment of process and pit and runoff water from the TMF in the concentrator to the extent feasible to reduce fresh water use. | |
| 5. | Construction of a final clarification pond to remove suspended solids and facilitate treatment from the TMF and mine rock aggregate surface runoff (if necessary) prior to discharge to the environment. | |
| 6. | Some water from the TMF is assumed to be recycled back to the concentrator to minimize fresh water consumption. | |
| 7. | If determined necessary or beneficial, the option to install a submerged pipe fitted with an end diffuser to discharge water from the settling/event pond and/or the treated water from the concentrator into the main channel of the English River in order to maximize mixing and the assimilative capacity of the river will be considered. This would reduce potential impacts to water quality in Storm Bay, which has a relatively small catchment area, water volume and outflow, and therefore would have a low assimilative capacity for effluent. |
During the next phase of the Project, when additional water and waste products will be available from tests undertaken using the final process flow sheet, additional water quality testing will be completed on all waste streams. Humidity cell and additional water quality and biological toxicity studies are ongoing on additional mine rock aggregate, concentrate and tailing samples. A water treatment process will be developed and tested if necessary to meet regulatory requirements. Given the relatively small surface area impacted, impacts to the relatively small water quantity and quality as a result of mine development are considered to be mitigatable and not significant.
| 20.9 | GROUNDWATER |
Groundwater hydrogeology will be of major importance during mine development due to the close proximity of the planned open pit to the English River. A detailed hydrogeological assessment of the mine site is scheduled for completion during the next phase of the Project, including an assessment of groundwater and an evaluation of the hydrogeological conditions near the proposed open pit. A key focus will be on the future pit dewatering requirements, pit stability and the engineering requirements for the mine rock aggregate, tailings and concentrate management areas.
Existing data suggests that bedrock underlying the site is relatively impermeable, which would reduce the risk of groundwater impacts. As the tailing/concentrate and mine rock aggregate will also not be acid generating, acid mine drainage is not considered an issue at this site. Dry stacking of tailing further reduces this risk.
220
Dewatering of the open pit will create a groundwater drawdown cone in the vicinity of the pit. The planned detailed hydrogeological investigation will evaluate the potential impacts of the drawdown cone between the pit and the river. This may result in elevated flows from the river into the pit that will require management to ensure the safe operation of the pit. During development and operation of the pit, water inflow from the English River to the open pit via groundwater will be monitored. Significant groundwater inflows to the pit may be controlled by grouting.
| 20.10 | VEGETATION |
The Project is located in the boreal forest region. The dominant tree species found on the Project site are jack pine and black spruce. The site is characterized by thin soils and dry site vegetation communities, as well as several wetland communities, including a black spruce swamp immediately adjacent and to the southwest of the deposit, as well as several marsh communities adjacent to the English River. Upland vegetation communities observed included conifer, mixed wood and hardwood forests, and blowdown areas, while wetland vegetation communities include treed and shrub swamp, marsh, sand shrub or graminoid fens. Some additional work may be required following additional engagement or to address potential new areas impacted. No unique, rare or endangered plant species or vegetation community types were observed or are expected.
Development of the proposed mine will result in direct impacts to the vegetation of the site. Vegetation will be removed from the Project development area, including the open pit, plant site and waste storage areas. The major components of impact and their areal extent are listed in Table 20.1.
Table 20.1
Areal Extent of Major Project Components at the Separation Rapids Site
| Item | Area (ha) |
| Open pit | 25.0 |
| Concentrator site | 1.1 |
| Tailings and concentrate management area | 57.0 |
| East coarse rock aggregate stockpile | 34.0 |
| West coarse rock aggregate stockpile | 32.0 |
| Fine aggregate stockpile | 1.5 |
| Temporary lepidolite tails stockpile | 3.3 |
Thus, the total impacted area, excluding roads, will be approximately 1.57 km2. In a regional context, this is not considered to be significant since the Project site is surrounded by un-impacted forested land.
In the absence of an identified beneficial use for the site, the mine site will be revegetated on closure to restore the disturbed area to as close to pre-mine conditions as possible, and thus reduce long term impacts. Three topsoil stockpiles have been proposed during initial mine construction to facilitate mine site revegetation after closure.
221
The potential surficial impacts to the mine site will be minimized by containing mine rock, Tailing products within engineered storage facilities, such as the TMF and the mine rock aggregate storage facilities.
The Kenora 2012-2017 Forest Management Plan identified a 90 m “No Cut Zone” between the mineralized zone and the English River. This plan is being updated. These zones are identified based on a computer-generated algorithm that is based on land slope and other factors and are not substantiated by site visits. These plans do not hold authority over mining applications. While Avalon wishes to maintain a treed visual barrier between the mine site and the river, the edge of this no cut zone could potentially be impacted by the open pit. As a precaution, a submission to the plan developers to correct the zone from 90 m width to a 30 m width as required based on the actual slope of the area, was requested. This will avoid overlap of the pit and the no cut zone and continue to provide a protected area to help mitigate runoff from the site.
| 20.11 | WILDLIFE |
Wildlife in the Project area is abundant, with the species observed typical of Ontario’s boreal forests. Large flocks of common mergansers were observed at Separation Rapids during spring migration, while common mergansers, common goldeneyes, buffleheads and mallards were observed breeding in the Project area. Moose were the most common ungulate observed on the Project site, while black bear, wolf, fisher, red fox, marten, mink, and otter are common carnivorous species. Small mammals, rodents and lagomorphs observed included deer mouse, beaver, red squirrel, muskrat and snowshoe hare. Wood frog, leopard frog and American toad were the most common amphibian species, while painted turtles were observed in Avalon Bay, and garter snakes were observed on site. Woodland caribou were not observed.
As noted above, a SARA was completed in 2013 (Knight Piésold, 2013), and additional observances of wildlife continued to be monitored during 2017 and 2018 studies. Bald eagles and white pelicans, which are on the Ontario Endangered Species list, were encountered in the Project area. Bald eagles and white pelicans are both piscivores and no feeding opportunities for these species exist on the Project site. Bald eagles’ nest in close proximity to water in conspicuous large stick nests that are used year after year and are usually located in trees a few metres from the shores of large water bodies. The closest bald eagle nest is over 1 km east of the proposed mine development. The white pelicans observed on the English River near the Project site had likely moved into the area for summer feeding from the main pelican population and breeding ground on the Three Sisters Island in Lake of the Woods. It is concluded that mine development will not adversely impact bald eagle or white pelican populations. Little Brown Bats were identified on site, but no nesting habitat was identified. Some additional SARA work may be required following additional engagement or to address potential new areas impacted. Engagement with the indigenous community has identified moose as an important animal to them. Moose have been known to periodically visit the area of the mine site. Mitigations include the development of travel corridors in the Project design along Stream A and parts of Stream B and D. Given the small overall environmental footprint of the Project, the mobility of moose and the abundant local undisturbed areas in the vicinity of the mine site, no significant impacts are anticipated.
222
The Project site is relatively small in a regional context and contains no rare or significant wildlife habitat components. As with the moose, most of the mammals inhabiting the site, with the possible exception of small mammals, will simply be displaced to the adjacent abundant suitable habitat. Since small mammals are generally prolific breeders, they are not sensitive to extirpation, and populations will re-expand to the capacity of the environment very quickly. The proposed mine development is not predicted to have a significant impact on wildlife.
| 20.12 | FISHERIES |
A significant recreational fishery exists on the English River in the Project area, providing income to local tourism outfitters and recreation for local anglers. The use of the fishery for subsistence by local First Nation communities has been restricted following historical contamination of the river with mercury, discharged from a pulp and paper mill located upstream. The major target species were identified as walleye, northern pike, and smallmouth bass. A benthic macroinvertebrate community monitoring program was conducted in 1998 to characterize fish habitat.
A northern pike spawning site was observed in Goose Bay, at the mouth of the stream flowing south of the proposed mine site into Storm Bay. The streams immediately to the north and the south of the Project site both have populations of baitfish, including finescale dace, northern redbelly dace, fathead minnow, bluntnose minnow and ninespine stickleback. Since these streams are within a licensed baitfish block, there is a potential for commercial exploitation of the bait fishery, and therefore, the streams would be classified as fisheries habitat by the DFO. For this reason, no deposits of any mine rock or tailings are planned in these streams.
A third stream (Stream D) further south and west of the Project has been selected for the TMF. This facility is planned to be located in the upper intermittent reaches of this stream in an effort to avoid direct impacts on permanent fisheries habitat. Potential for impacts from runoff on downstream populations are low given that the tailings are non-acid generating and are not hydraulically deposited. Further, preliminary SPLP 1312 tests suggest little potential to impact streams. Unanticipated impacts to the downstream area dominated by wetland also have water quality polishing capability. Significant impacts to fisheries are expected to be mitigatable. Similarly, the mine rock aggregate is not expected to generate leachates of concern, and simple settling of solids will be completed to mitigate this risk. Additional testing is planned in the next project phase.
Contrary to previous indications (1998 and 1999 baseline data collection), Stream D was found to contain three minnow species inhabiting the stream, at least intermittently, during a July, 2018 study. Initially, due to the fisheries habitat located in Stream B, it was decided not to utilize Stream B for tailing, mine rock aggregate or concentrate management. However, a 2017 study determined that fish no longer inhabit Stream B. For the purposes of this PEA, Stream D will remain as the location for the tailing management infrastructure, though it is likely that both streams B and D will not contain fish on a full-time basis due to low flow conditions, freezing to the bottom in winter, or periodic beaver dam failures that flush fish from the system. The final selection of the tailing infrastructure will be the subject of a tradeoff technical study in the next project phase. This decision will also include additional engagement with stakeholders for their input to the decision as to the preferred location of this infrastructure.
223
| 20.13 | TAILINGS ANDCONCENTRATEMANAGEMENT |
The principal objective of the TMF is to provide the safe and secure storage of the process waste products while ensuring the protection of the environment during operations and in the long-term (after closure). The conceptual level design of the TMF has taken into account the following requirements:
| • | Permanent, secure and total confinement of all process waste products within an engineered facility. | |
| • | Control, collection and removal of free draining liquids from the tailings during operations for recycling as process water to the maximum practical extent. | |
| • | The inclusion of monitoring features for all aspects of the facility to ensure performance goals are achieved and design criteria and assumptions are met. | |
| • | Secure reclamation and closure of the impoundment after mining is complete. | |
| • | The flexibility to reprocess select by-products (concentrates) at a future date. |
The TMF design includes the initial starter arrangement and ongoing raises to the facility throughout the life of the operation.
Approximately 1.0 Mt of magnetics concentrate, 0.8 Mt of tailing slime, and 0.3 Mt of feldspar tailing and 5.0 Mt of petalite tailings will be produced over the life of the Project. The magnetics will be stored separately due to their potential to be re-processed in the future. Some feldspar production is planned, limited by annual markets for this material. The TMF will consist of valley impoundment type facilities located west and southwest of the plant site as shown above in Figure 20.1. Tailings will be filtered in the concentrator and trucked to the TMF as solids. The petalite tailings and feldspar concentrate will be mixed with the slimes material to aid in the filtration process.
The TMF is located approximately 1.5 km southwest of the open pit as shown in Figure 20.1 above. The facility will be constructed as three distinct cells as previously noted. The Magnetics Concentrate cell will be located at the north side of the area, while the Feldspar Tailing, Slimes and Petalite Flotation Tails will be stored in the two other cells of the TMF. The tailings, slimes and concentrates, to be filtered at the plant, will be transported to the TMF by truck, placed and compacted in horizontal lifts starting at the base of the cells and advanced up slope of the basin floor and side slopes. In areas not confined by natural ground, the tailings/concentrates will be buttressed with 20 m wide (min) mine rock berms around the perimeter.
224
| 20.13.1 | Tailings Management Facility (TMF) |
Potential optimization is available for the storage of these materials. This includes an economic trade off study of storage in Stream D vs Stream B, and the potential opportunities associated with combining the remaining materials in the same management area to reduce capital and operating costs.
| 20.13.2 | Mine Rock Aggregate and Mineralized Material Management |
Given the inert nature of the waste material from the open pit and the scarcity of aggregate in the area, all mine rock is considered as utilizable aggregate product. Approximately 52.6 Mt of coarse mine rock aggregate and 0.18 Mt of crushed and optically sorted rejects (fine aggregate) will be generated during the life of the Project. The aggregate materials will consist primarily of amphibolite and pegmatitic granite rock, with a lesser amount of feldspathic material. At this stage, these materials will be managed together. The coarse mine rock aggregate will be placed in two storage areas to the west of the open pit while the fine aggregate will be stored near the concentrator for easy access for road maintenance, storage facility construction and pit road construction.
The mine rock aggregate materials have been characterized as non-acid generating based upon the results of the preliminary laboratory testwork carried out in the Project Description and Environment Baseline Study (Knight Piésold, 2007), and in additional recent assessments of “worst case” materials, it is not expected that the mine rock aggregate storage areas will require any facilities for control or adjustment of pH in relation to acid rock drainage. In general, the rock is expected to be benign (although there is the potential for some minor leaching of metals as a result of natural weathering). For the purposes of this preliminary economic assessment therefore, sediment control and closure issues have been determined to be the key environmental design factors.
Current planning of the mine rock aggregate storage facilities includes the following considerations:
| 1. | Minimum surficial and environmental impacts, including not utilizing fisheries habitat. | |
| 2. | Minimum visual impacts. | |
| 3. | Minimum impact on potential sites of heritage value. | |
| 4. | Close proximity to the pit to minimize the haul distances and grades. | |
| 5. | Maximum integration with other project facilities where this is beneficial. | |
| 6. | Minimum of 100 m from the edge of the open pit. |
225
| 7. | Ensuring that the facilities can be safely and securely rehabilitated in accordance with best available practices at the end of the mine life. | |
| 8. | Minimum of 30 m (normally over 75 m) from wetlands and 120 m from significant water bodies. |
For the purposes of this PEA, the volumes of mine rock aggregate materials that will be generated by the Project have been estimated using a specific gravity of 2.9 and an excavation swell factor of 1.3, giving a placement density of 2.23 t/m3. Based on this density, the total volumes of feldspathic material and pegmatitic granite mine rock aggregate that are expected to be generated over the mine life are approximately 23.6 Mm3. An updated estimate of the placement density should be completed at a subsequent stage in the design of the Project.
Figure 20.1 (above) shows the general arrangement of the three-mine rock aggregate storage facilities for the Project. The two coarse aggregate management areas will occupy an area of about 66 ha. They will be developed to a maximum elevation of approximately 442 m which will give them a maximum height of about 70 m. It is planned that the coarse aggregate produced during the initial years of mining will be placed in the nearest facility due to its shorter haul distance from the pit, moving to more distant facilities as the nearer site reaches its capacity. The maximum elevation will not be substantially different to similar topography located within 5 km of the site. The relatively small volume (0.18 Mm3) of crushed fine aggregate material will be stored next to the plant site.
Small quantities of run of mine mineralized material will be stored in contained areas adjacent to or within the plant site
There will be no waste material located at the metallurgical plant site. All concentrate feed will be stored inside the facility.
| 20.14 | SEWAGETREATMENT |
Domestic sewage will be generated from the mine dry, processing plant, and office areas. The daily loading of sewage and grey water can be expected to be approximately 11,000 L, based on a total of 75 contractor and full-time employees using the facilities during three shifts over a 24 h period.
The sewage and grey water will be conveyed in sanitary sewer pipes to a permitted septic system located adjacent to the processing plant. Two suitably sized septic tanks, operating in parallel, will provide the necessary capacity and the flexibility for system maintenance. Grey water will be decanted from the septic tanks and discharged into a septic field. The sludge which accumulates in the bottom of the septic tanks will be regularly pumped out and transported offsite for disposal by a licensed contractor.
226
| 20.15 | WATERMANAGEMENT |
The design and implementation of a comprehensive water management plan for the mine site will be fundamental to the Project. The key water management issues will centre around handling the following:
| • | Open pit runoff and seepage. | |
| • | Runoff from the plant site. | |
| • | Runoff from the mine rock aggregate management facilities. | |
| • | Runoff from the TMF. |
The principal objectives of the water management plan for the Project will be:
| 1. | To minimize the volume of potentially impacted water generated from the site. | |
| 2. | To minimize the amount of water extracted from the English River for processing and general mine site use by maximizing the use of reclaimed runoff water plant site runoff, mine dewatering flows, through internal concentrator recycling and use of filtered Tailing storage. | |
| 3. | To the extent practical, direct all water that is impacted by processing operations to a single point in order to minimize the locations that require monitoring and treatment. |
| 20.15.1 | Water Management Measures |
In general, the runoff management measures will include a series of low height berms, collection/diversion channels, collection basins and sumps. Runoff from the various catchment areas in and around the site will be managed as follows:
• | Topsoil/Overburden Stockpiles – Runoff will be directed to temporary perimeter ditches, and sediment and erosion control measures (i.e., silt fences, straw bales) will be incorporated into the ditches until vegetation is established. | |
• | Fine Aggregate Stockpile and Temporary Lepidolite Tailings Area – Runoff from this area will be directed to perimeter collection channels that will drain to a monitoring sump. Runoff reporting to the sump will be monitored periodically to ensure it is acceptable for discharge to the environment. | |
• | Coarse Mine Rock Aggregate Stockpiles – Runoff originating within each of these stockpiles will be directed to perimeter collection channels. These channels will drain to one of three sediment basins where the majority of sediment will be allowed to settle prior to the runoff being decanted out of the basin and discharged to the downstream environment. The exception to this is the southeastern portion of the west coarse rock aggregate stockpile, which will have its runoff directed to the settling/event pond. | |
| • | Plant Site – Runoff originating within the plant site will be directed to a series of perimeter collection channels which will drain to the plant site water management pond. Water from this basin will be pumped to the water treatment plant for treatment prior to discharge to the environment or for use in the concentrator. |
227
• | TMF – Runoff originating within the TMF will be directed to the settling/event pond at the southwest end of the facility. The majority of sediment will be allowed to settle out of the runoff before the runoff is decanted out of the basin and discharged to the downstream environment. Runoff originating from the downstream embankment slopes of the TMF will report to collection channels that drain to small monitoring sumps. Runoff reporting to the sumps will be monitored periodically to ensure it is acceptable for discharge to the environment. |
Low height berms will be constructed adjacent to the collection channels to help direct disturbed areas runoff to the channels and sediment basins, and also to help divert undisturbed areas runoff from upstream areas away from the sediment basins. Diversion berms will also be constructed on the west and south sides of the open pit to divert runoff away from the pit. The locations and schematic of the proposed water management measures are shown in Figure 20.4. A simple water balance was prepared to provide estimates of the volumes of runoff reporting to each pond/basin on the site (see Figure 20.5) ..
The water balance was prepared for one year of operations, based on average annual precipitation conditions. The total annual precipitation value was 715 mm, which includes rainfall and snowfall water equivalent. Figure 20.5 shows that there will be a surplus of water from the Project.
The natural downstream receiver from the settling/event pond is Storm Bay. However, due to its relatively shallow depth and flow rate and the limited potential for mixing and assimilation of the flows, if required, the potential exists to discharge the water from the settling/event pond through a submerged pipe, with an end diffuser, into the main channel of the English River. Notwithstanding this, some infrequent flows which result from excessive snowmelt and precipitation events may be released directly to Storm Bay through engineered overflow spillways.
Water management at the hydrometallurgical plant site is planned to be discharged to the Kenora sewage treatment system where there is significant capacity for the small volumes expected.
228
Figure 20.4
Tailings/Concentrate, Mine Rock andSurface WaterManagementLayout
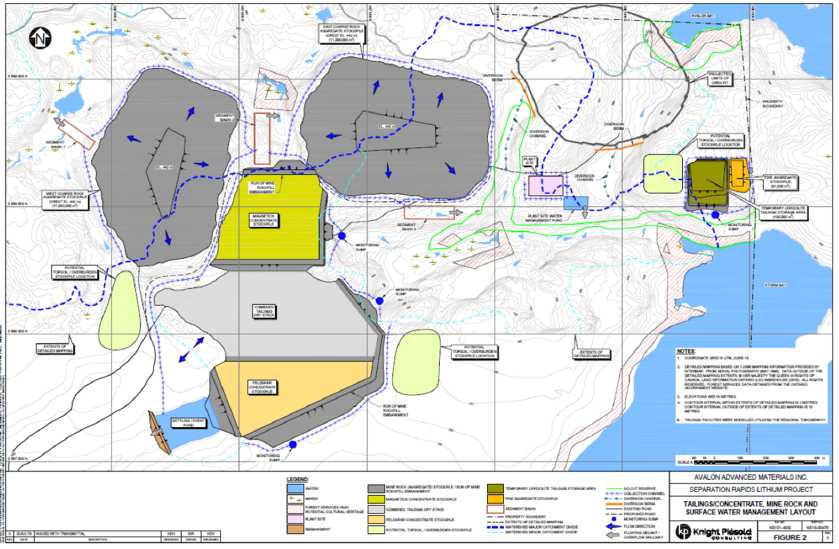
229
Figure 20.5
Separation Rapids Site WaterBalance
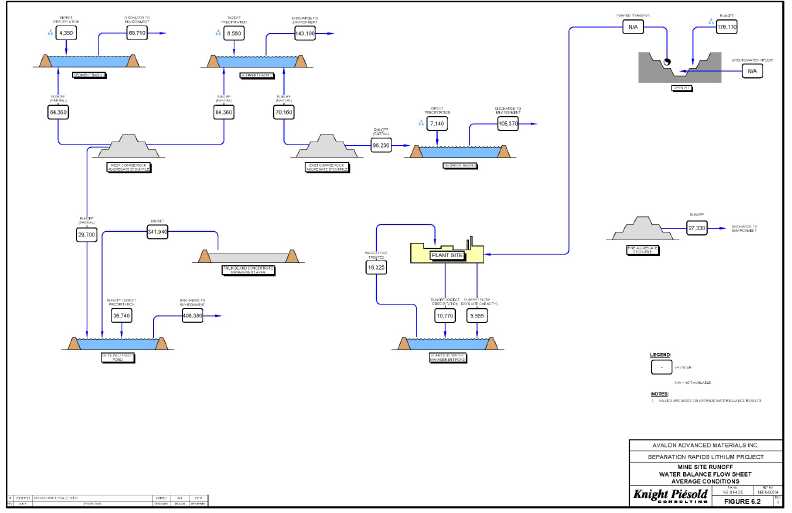
230
| 20.16 | CLOSURE ANDREHABILITATION |
The Ontario Mining Act requires that, upon cessation of operations, mining lands are to be restored to their former use or condition or are to be made suitable for a use approved by the Director of the Ministry of Northern Development and Mines. The primary objectives of mine decommissioning are to ensure that public safety and security are not compromised and that any environmental impacts are reduced to an acceptable level or eliminated. An additional objective is to rehabilitate any disturbed areas and integrate them into the naturally surrounding landscape.
For mines located on previously undisturbed sites, ecological restoration is a fundamental component of site reclamation. The main aspects of the closure and reclamation plans for the Project are described in the following paragraphs.
Following the cessation of mining, the open pit will be allowed to flood. Flooding will occur primarily through inflows of groundwater and surface water runoff. It is currently unknown if the pit will become completely filled with water, however if this occurs, excess water will be discharged through a high-level overflow channel into the English River after demonstration that the water is of good quality. Given that the mineralized material and pit wall rock is expected to be inert, an alternative being considered is to generate a direct link to the river to facilitate the development of aquatic and fisheries habitat in the pit. A barrier, consisting of boulders, will be placed around the perimeter of the open pit at closure to prevent access. Signs warning of the open pit will also be erected.
The TMF will be closed and rehabilitated in a safe and secure manner in full accordance with government regulations and good engineering practice. Testwork done to date indicates that the tailings and concentrate will be non-acid generating, and as such acid mitigation measures are not expected to be necessary for closure. (Knight Piésold, 2016b). This will be fully confirmed by testwork in subsequent stages of the Project planning. As a precaution, the concentrate storage facilities are also planned to be rehabilitated at the end of the mine life. Once sufficient tailings are available, reclamation testing will be completed in order to demonstrate that direct seeding is feasible for vegetation of the TMF.
In the absence of an identified beneficial reuse such as wild rice production, following closure, the TMF will be a reclaimed landform that sheds runoff. Some ditching may be required, but no water ponds or spillways will be necessary. The tailings and any remaining concentrate will be vegetated with local species.
Progressive rehabilitation of benches of the coarse rock aggregate storage areas is planned to minimize the potential for aesthetic visual concerns during operations, particularly on the river view sides. Benches and the top of the first aggregate storage area will be progressively covered with a layer of seedbed material and revegetated when completed, assuming the aggregate is not being utilized for other purposes. The seedbed material will be obtained from the topsoil stockpile which will be developed from stripping various areas prior to mining. It is expected that some areas of the mine rock aggregate management area will be filled to capacity before operations are completed. As part of a progressive decommissioning plan, vegetation test plots will be established on the completed management area to determine the optimum revegetation procedure. Once this is determined, the completed portions of both aggregate facilities will be reclaimed progressively during the life of the mine. The top of the second aggregate storage area will be revegetated following mine closure, assuming no markets or alternate use for this material have been identified.
231
All sediment basins associated with the TMF and the mine rock aggregate stockpiles will be breached and revegetated as necessary for closure.
All machinery and equipment from the crusher, process plant and other ancillary facilities will be removed for reuse, salvage or disposal, and all buildings and infrastructure will be removed or demolished. Every practical effort will be made to maximize the salvage or recycling of the materials. Inert demolition materials that cannot be salvaged will be broken up and used to fill any below-grade openings. All chemicals or hazardous materials will be returned to the supplier or removed to an appropriate waste disposal facility by a licensed contractor. Petroleum storage tanks will be removed in accordance with applicable regulations. General waste materials will be disposed of in an offsite licensed site landfill.
The mine access road will be maintained to provide access during the closure and post-closure monitoring period. Following completion of post-closure monitoring, the road will be scarified and re-vegetated, and culverts removed. All other mine roads and disturbed areas will be scarified and revegetated. In the event that ongoing engagement on the Project and closure plan identifies an alternate user (e.g., a forestry company) that wishes to maintain and take responsibility for all or parts of the road, this option can be utilized, in consultation with applicable regulators.
A 5-year post-closure monitoring program will follow closure of the mine that includes maintenance of the revegetated areas. The monitoring program will include assessment of the physical stability of the aggregate storage facilities, and TMF, surface water and groundwater quality, and periodic biological monitoring of the aquatic and terrestrial ecosystems in the immediate vicinity of the site. The monitoring program will continue, as required, until the target objectives of the site closure have been achieved and approved by the MNDM.
| 20.17 | COMMUNITY ANDINDIGENOUSPEOPLESENGAGEMENT |
Consultation with local First Nations Bands and the public was initiated during the 1999 baseline study. This continued in a reduced manner during the period of inactivity but was again ramped up in 2013. A memorandum of understanding initially signed with the Wabaseemoong Independent Nation (WIN) in 1999 was renewed in 2013. This agreement commits Avalon to maximize opportunities for WIN and to facilitate business partnerships. To this end, Avalon has utilized Indigenous personnel and companies to the extent practical during work completed to date.
232
Avalon has also reached out to the Métis Nation of Ontario (MNO) in an effort to engage with them. While a formal engagement meeting with their full area engagement committee has not yet occurred, relationships with the MNO remain positive.
In discussions with the MNDM, no additional First Nations are required to be engaged with regarding the exploration permits. This is due in part to the Isslington Agreement that was signed between the Province of Ontario and the WIN. This agreement was developed following the relocation of many community members due to the flooding of the English River associated with hydroelectric dam construction. This agreement gives the WIN exclusive control over the area that includes the Avalon site. The Métis rights have recently been granted to a wide area of the north and overlap the Isslington Agreement.
Avalon has also held preliminary discussions with the Dalles and Grassy Narrows First Nations, though it is understood that the WIN has primary responsibility for natural resources development in the Project area.
Avalon maintains an engagement log which records the numerous meetings held and summaries of the meeting content, and reports this annually in its Sustainability Report.
An archaeological study was completed in 1998 (Adams, 1998). This will be reviewed with the communities of interest and updated, if required. There may be a requirement to complete additional traditional knowledge studies in the next phase of Project development. A socioeconomic assessment of the Project is included in the 2007 environmental study. This will be updated in the next phase of the Project.
It is also noted that the Kenora 2012-2017 Forest Management Plan identified sites of High Potential Cultural Heritage. While the plan does not have the authority to enforce its requirements on mining and mining has different approval processes, these sites were a concern. In these plans, cultural heritage sites are identified based on a computer-generated algorithm and are not based or substantiated by site visits. Heritage sites may be added or removed by site investigations by qualified archeologists or by extensive study and artifact recovery in consultation with Indigenous Peoples. This plan was prepared without the benefit of the Avalon archeological study. While efforts have been made to avoid these theoretical sites, there is a small unavoidable area of overlap in the proposed pit outline and part of a potential heritage area along the English River. The Avalon archaeological study did not identify this area as a heritage site. Avalon is in the process of providing this information to those responsible, and who are presently updating this information for the next 5-year Forest Management Plan, in order to have this area removed as an area of potential cultural heritage. In the highly unlikely event that this area remains a concern, Avalon is prepared to initiate a detailed study and if necessary, artifact recovery of this area, in consultation with appropriate Aboriginal groups.
Avalon has a full time representative in Kenora who facilitates ongoing engagement with Indigenous Peoples, communities, regulators and politicians that contributes to the strong support for the Project.
233
| 20.18 | OPPORTUNITIES |
There are a number of trade-off studies proposed that have both environmental and economic upside potential. These include the following:
| 1. | Given that a significant portion of the ore is not recovered with the existing open pit design, a pit optimization study may improve this. In addition, a trade-off study to look at underground mining could also improve the sustainable recovery of the ore, while reducing the quantity of waste rock produced and reducing the energy and environmental footprint of the Project. This would include an analysis of electrification of the underground mine vs conventional mining to further reduce energy consumption and Green House Gas production. | |
| 2. | Given that the original and existing TMF location have both been identified a fish habitat, a trade off study of both locations based on the present business model may result in significant cost savings and lower risk structures. | |
| 3. | The present arrangement has the magnetics, feldspar concentrate, slimes and Petalite tailing stored in separate cells within the TMF. This creates additional capital and operating costs associated with additional tailing embankments. A study to evaluate potential cost benefits of fully combing two or more of these materials will be completed in the next Project phase. | |
| 4. | The most significant opportunity is considered to be the potential future development of a lithium hydroxide demonstration plant followed by the construction of a full- scale lithium hydroxide plant to take advantage of the fastest growing segment of the lithium market: lithium chemicals for batteries for the electric vehicles industry. These potential facilities are not part of this PEA. |
234
21.0 CAPITAL AND OPERATING COSTS
| 21.1 | CAPITALCOSTS |
The basis for the PEA capital cost estimate is a processing facility and related infrastructure with a nominal throughput rate of 475,000 t/y of mineralized material, comprising either petalite mineralized material (PZ) or lepidolite mineralized material (LPZ).
Foreign exchange rates used as a basis for the estimate are:
USD1 = CAD1.30.
Euro 1= CAD1.46.
The capex for the open-pit mine is assumed to be zero as the operation will engage a contract miner and all mining capex will be built into the contract mining operating costs.
The crusher plant has been sized at double the capacity of the concentrator to facilitate a single 12-hour shift for crushing.
The Project is at a green fields location and so will require construction of new tailings and waste rock storage facilities as well as an up-grade to an existing access road and the installation of an electrical power supply line.
Initial capex requirements are summarized in Table 21.1 with a more detailed breakdown presented in Table 21.2. All costs are reported as Canadian Dollars (CAD). It should be noted that, apart from the feldspar flotation plant in Years 5 and 6, provisions for what might normally be designated as “sustaining capital” are included in the operating costs.
Table 21.1
Initial Capital Cost Estimate
| Area | Capex CAD x 1,000 | |
| Initial Plant | Feldspar Flotation (Years 5/6) | |
| Pre-construction | 500 | 0 |
| Mining | 0 | 0 |
| Concentrator | 39,696 | 8,450 |
| Tailings Disposal | 6,519 | 0 |
| Infrastructure | 5,750 | 0 |
| Total Direct Costs | 51,965 | 8,450 |
| EPCM | 3,204 | 845 |
| Freight & Transportation | 1,398 | 327 |
| Other Indirect | 5,076 | 1,199 |
| Total Indirect Costs | 9,677 | 2,371 |
| Owners Costs | 2,000 | 500 |
| Buildings | 1,000 | 250 |
| Contingency | 12,528 | 2,164 |
| Total Capital Costs | 77,671 | 13,735 |
235
The concept of having most of the plant pre-assembled off-site and delivered in modules (fully or partly assembled) has been assumed for much of the equipment (particularly the flotation plant) and facilities in order to reduce on-site construction activities.
| 21.1.1 | Mining |
| 21.1.1.1 | Contract Mining |
A budget cost of $4.5/t for the mining of mineralization and waste from the open pit was received by Avalon from a local mining contractor. A provision of an additional $1/t for transportation of waste rock to the waste rock dumps is also included in the mining costs.
| 21.1.2 | Concentrator Direct Costs |
Based on the results of the various testwork programs and process flowsheets, mass balances were generated together with a detailed equipment list, and process design criteria. From this information, preliminary equipment duties have been determined and budget prices received from qualified vendors. For some of the smaller items, Avalon has used costs from other studies with a similar size or type of equipment.
The pricing of the crushing plant is based on a modular type facility as used in many quarry-type operations.
Site and plant maintenance costs and a provision for site closure are included in operating expenses so no sustaining capital is indicated. There is however a provision of $7.5M for site closure in Year 20.
Factors for each area of the processing facility were applied to estimate the associated direct and indirect costs for civil and earthworks, concrete, structural steel, plate-work, piping and electrical/instrumentation. These factors are based on in-house expertise and other similar sized projects.
There will be only one mill and flotation circuit initially with the processing of the 2 ore types being conducted in campaigns rather than simultaneously. There will be a number of other shared equipment items although there will be separate reagent mixing and dosing facilities provided for both ore types.
236
Table 21.2
DetailedBreakdown of InitialCapital CostRequirements
| LEPIDOLITEAND PETALITEPLANTDIRECTS | Units | Mechanical Equipment | Sub Total | Civil & Concrete | Structural Steel | Platework | Piping | Electrical & Instrumentation | Total CAD | |
| Equipment | Installation | |||||||||
| PRE-CONSTRUCTION Sorting Plant Crushing Circuit Milling Circuit & Pre-treatment Flotation Reagents Services Tailings Transfer TOTAL PROJECT DIRECTS | CAD $ CAD $ CAD $ CAD $ CAD $ CAD $ CAD $ CAD $ CAD $ | 2,664,500 2,438,809 5,371,223 15,084,347 670,214 1,026,392 1,458,404 26,049,388 | 133,225 73,164 537,122 754,217 134,043 153,959 218,761 1,871,266 | 2,797,725 2,511,973 5,908,345 15,838,564 804,257 1,180,350 1,677,165 27,920,655 | 139,886 125,599 886,252 791,928 160,851 236,070 335,433 2,536,134 | 139,886 75,359 886,252 791,928 120,638 88,526 167,717 2,130,421 | 69,943 50,239 590,835 395,964 160,851 236,070 167,717 1,601,677 | - - 886,252 1,187,892 160,851 354,105 419,291 3,008,393 | 209,829 188,398 590,835 791,928 160,851 177,053 251,575 2,160,640 | 500,000 3,357,270 2,951,568 9,748,770 19,798,205 1,568,300 2,272,175 3,018,897 42,715,185 |
| INDIRECTS | ||||||||||
| EPCM Commissioning & Start-up Vendor Rep's First Fill, 3 Months Consumables Spare Parts Freight & Transportation Contractor Indirects Insurance Construction Indirects | 7.5% |
2.5% |
|
|
|
| 3,203,639 651,235 200,000 56,407 520,988 1,398,021 1,041,976 1,302,469 1,302,469 | |||
| TOTAL PROJECT INDIRECTS | CAD$ | 9,677,204 | ||||||||
| Contingency Owners Costs | 20% | 10,478,4782,000,000 | ||||||||
| TOTAL PLANT CAPITAL COSTS | CAD$ | 65,370,867 | ||||||||
| SITEINFRASTRUCTURE | ||||||||||
| Buildings Power Supply Road Up-grade Site Preparation Tailings Storage Contingency | CAD$ CAD$ CAD$ CAD$ CAD$ 20% | 1,000,000 4,000,000 750,000 1,000,000 3,500,000 2,050,000 | ||||||||
| TOTAL SITEINFRASTRUCTURE | CAD$ | 12,300,000 | ||||||||
237
| 21.1.3 | Concentrator Indirect Costs |
The EPCM cost is estimated at only 7.5% of direct costs as a result of the following:
| • | Crusher plant being a pre-engineered modular/mobile facility. | |
| • | The flotation plant will be a pre-engineered facility of modular construction pre- assembled off site. | |
| • | Many other facilities (such as reagent mixing/storage/dosing) will also be pre- assembled on skids or modular structure; hence much of the engineering and installation costs will be borne by the vendors. | |
| • | Avalon will have a small team on site to manage construction so minimal input from the EPCM engineer will be required during the construction period. | |
| • | Electrical design will be completed by the equipment supply vendor. | |
| • | The process modules will be installed in a building that will be a pre-engineered and fabricated steel structure with cladding. |
Other Indirect costs have been conservatively estimated by either factoring from the Total Direct costs or as lump sum values.
| 21.1.4 | Feldspar Flotation Circuit |
In Years 5 to 6 a feldspar flotation plant will be installed at an estimated cost of CAD13.7M (Table 21.1 above). These capital costs have been estimated using the same philosophy and methodology as applied to the main plant.
This facility will include rougher and a two-stage cleaner flotation circuit, reagent mixing and dosing equipment, blowers, and product filters. There will be a drier for the final concentrate as well as a fine-grinding mill to grind some of the feldspar concentrate (up to 6,000 t/y) to P80 of ~6 microns for sale into the filler industry
| 21.1.5 | Tailings |
The operation will employ dry tailings stacking methodology with final flotation tailings being filtered and then transported by truck to designated tailings storage areas.
Flotation tailings from processing of the lepidolite material will be deposited into a temporary storage area as it will be re-processed for petalite recovery when the plant is treating petalite ore.
| 21.1.6 | Infrastructure |
There is currently no power available at site although there is sufficient capacity available nearby from the main transmission line running south from Caribou Falls to Whitedog Falls.
238
The capital cost estimate includes a sum of $4M to connect into this line and install a power supply cable to the mine.
There is already an access road to the mine, but this will need some up-grading to accommodate the increased traffic from deliveries and product shipment. These up-grades are estimated to cost $750,000.
Other site infrastructure includes the main process plant building which will also house stores and workshop areas. A second building will house the offices and ablution facilities.
Process plant infrastructure provisions in the capex estimate include compressed air, clean, process, gland service and tailings return water circuits for the processing plant.
| 21.1.7 | Owners Costs |
A provision of CAD2 million is included for Owners Costs (see Table 21.3) .
Table 21.3
Breakdown of Owners Costs Provision
| Expense | Cost CAD |
| Training – Operation/Maintenance Labour | 400,000 |
| Site Construction Management | 1,000,000 |
| H/Office Support – Expenses | 150,000 |
| Permitting | 100,000 |
| Recruitment | 100,000 |
| Miscellaneous Disbursements | 250,000 |
| Total | 2,000,000 |
| • | The training provision allows for 2 months for all personnel prior to commissioning (the potential for some government funding for this activity is being investigated). | |
| • | Site construction management provides for one site manager, 3 site supervisors, 2 engineers and a clerk for a total of 18 months. | |
| • | Home office support expenses provides for travel and food during site visits by head office. | |
| • | Permitting – permits for final construction and operations. | |
| • | There will be a number of expenses associated with the recruitment of operating personnel and miscellaneous activities both at site and at head office. |
| 21.1.8 | Contingency |
A contingency of 20% has been added to the capital cost estimate. This is considered acceptable on the basis that significant detail has already gone into the process design and equipment sizing. In addition, there is potential for equipment savings through the procurement of second-hand equipment particularly for the mill and crusher plant.
239
| 21.2 | OPERATINGCOSTS |
Operating costs have been determined by Avalon and reviewed by Micon and are expressed in Canadian Dollars based on:
| • | Total tonnes mined as determined by the mining schedule, and typical industry rates. | |
| • | Anticipated labour complements and appropriate labour rates and burdens. | |
| • | Energy estimates calculated from electrical equipment loads and current tariffs. | |
| • | Estimates for miscellaneous minor operating expenses. | |
| • | Reagent dosages from testwork programs and budget supply costs. |
A summary of the LOM average annual costs is presented in Table 21.4. Table 21.5 presents the life-of-mine production schedule.
Table 21.4
Summary of Operating Costs
| Category | Ave. Annual Costs(CAD’000) | CAD/t Milled |
| Petalite and Lepidolite | ||
| Mining and Reclaim | 18,181 | 40.0 |
| Concentrate Production and Shipping | 35,826 | 78.8 |
| General and Administration | 1,830 | 4.0 |
| Total Production Costs CAD | 55,837 | 122.8 |
| Total Production Cost USD | 42,951 | 94.4 |
| Feldspar Production and Trucking | ||
| CAD | 9,707 | 87.7 |
| USD | 7,467 | 67.5 |
| 21.2.1 | Mining |
| 21.2.1.1 | Contract Mining |
The PEA base case includes contract mining rather than Owner mining. The LOM average estimated unit costs for this case equates to $39.98/t of mineralized material processed or $5.52/t of material mined.
A budget cost of $4.5/t for the mining of mineralization and waste from the open pit was received by Avalon from a local mining contractor. A provision of an additional $1/t for transportation of the waste rock to the waste rock dumps is also included in the mining costs.
| 21.2.2 | Lepidolite Tailings Reclaim |
For the reclamation of the lepidolite tailings from the temporary storage area an assumed cost of $5/t has been used (this also covers the cost of transporting the lepidolite tailings from the plant to the temporary storage area).
240
Table 21.5
ProjectProductionSchedule
| Description | Year- | 1 | 2 | 3 | 4 | 5 | 6 | 7 | 8 | 9 | 10 | |
| MINING & MILLING Ore Mined Waste Mined Sorter Rejects Mill Feed Slimes Production Magnetics Production PRODUCTION Lepidolite Concentrate Production Lepidolite Concentrate Sold Petalite Concentrate Production Petalite Concentrate Sold Feldspar Concentrate Production Final Tailings (exc. Slimes & Magnetics) | mt mt mt mt mt mt mt mt mt mt mt mt | 220,000 1,000,000 3,960 216,040 17,067 28,085 - - 37,804 37,500 - 133,084 | 475,000 2,500,000 8,550 466,450 37,561 43,188 12,173 12,000 73,879 74,000 - 299,649 | 475,000 2,750,000 8,550 466,450 37,561 43,188 12,173 12,000 73,479 73,500 - 300,049 | 475,000 3,000,000 8,550 466,450 37,561 43,188 12,085 12,000 72,952 73,000 - 300,664 | 475,000 3,500,000 8,550 466,450 37,561 43,188 12,173 12,500 72,436 72,000 - 301,092 | 475,000 3,500,000 8,550 466,450 37,561 43,188 12,437 12,500 72,252 72,000 34,000 259,294 | 475,000 3,500,000 8,550 466,450 37,561 43,188 12,790 12,500 72,354 72,500 48,000 241,661 | 475,000 3,500,000 8,550 466,450 37,561 43,188 12,790 13,000 72,354 72,500 62,000 224,483 | 475,000 3,500,000 8,550 466,450 37,561 43,188 12,437 12,500 72,653 73,000 75,500 207,972 | 475,000 3,000,000 8,550 466,450 37,561 43,188 12,261 12,000 73,203 72,500 88,000 192,261 | |
| Description | Year- | 11 | 12 | 13 | 14 | 15 | 16 | 17 | 18 | 19 | 20 | LoM Total |
| MINING & MILLING Ore Mined Waste Mined Sorter Rejects Mill Feed Slimes Production Magnetics Production PRODUCTION Lepidolite Concentrate Production Lepidolite Concentrate Sold Petalite Concentrate Production Petalite Concentrate Sold Feldspar Concentrate Production Final Tailings (exc. Slimes & Magnetics) | mt mt mt mt mt mt mt mt mt mt mt mt | 475,000 3,000,000 8,550 466,450 37,561 43,188 11,908 12,000 72,700 73,000 100,000 178,393 | 475,000 3,000,000 8,550 466,450 37,561 43,188 12,261 12,000 72,402 72,500 100,000 178,339 | 475,000 2,750,000 8,550 466,450 37,561 43,188 12,173 12,500 72,276 72,500 100,000 178,553 | 475,000 2,750,000 8,550 466,450 37,561 43,188 12,437 12,500 72,653 72,500 100,000 177,911 | 475,000 2,750,000 8,550 466,450 37,561 43,188 12,526 12,500 75,585 75,000 100,000 174,891 | 475,000 2,500,000 8,550 466,450 37,561 43,188 12,526 12,500 73,981 74,500 100,000 176,494 | 475,000 2,500,000 8,550 466,450 37,561 43,188 12,526 12,500 72,779 73,000 100,000 177,697 | 475,000 2,250,000 8,550 466,450 37,561 43,188 12,878 13,000 73,683 73,500 100,000 176,440 | 272,928 1,094,381 4,913 268,015 21,629 23,653 7,975 8,029 43,424 43,849 100,000 48,635 | - - - - - - - - - - 100,000 - | 8,567,928 52,344,381 154,223 8,413,705 677,233 785,936 218,529 218,529 1,322,849 1,322,849 1,307,500 3,927,562 |
241
| 21.2.3 | Concentrator |
| 21.2.3.1 | Power |
Power costs have been determined based on the installed mechanical equipment load. It is assumed all operating drives draw 80% of their installed power except for certain intermittent operating equipment items such as filter circuits, samplers, spillage pumps and stand-by equipment. An average power cost of CAD0.1108/kWh has been used based on current rates from the local power supplier.
| 21.2.3.2 | Reagents and Consumables |
Reagent costs are a significant portion (18%) of the processing costs for the recovery of petalite (most notably HF, NaCl and KCl). They are also a source of potential environmental issues if released to the environment. As a consequence, significant effort is placed in capturing and recycling as much of these reagents as possible either through internal process recirculation or via a water treatment facility.
Through these measures it is believed possible to recover as much as 90% of the chlorides and 10% of the HF with the balances captured as solids from the water treatment plant. These solids will then be placed in a dedicated, purpose-designed permanent storage facility.
Annual reagent costs average approximately CAD10.4 million for the petalite/lepidolite circuit. As well as flotation reagents this also includes flocculent for dewatering of the various products.
There are 2 product driers installed- one for petalite/lepidolite and a second for the feldspar. Both of these require liquid gas which will be delivered to site by truck.
Besides the flotation reagents, other consumables include grinding media (calculated assuming 1.2 kg/t), mill liners (1 complete set per annum) and crusher liners.
| 21.2.3.3 | Labour |
Labour requirements for operating the petalite/lepidolite processing plant are estimated at 49 personnel as indicated in Table 21.6 for a total annual operating cost of CAD3.77 million. In addition, there are a further 10 personnel employed full time at the mine under the category of General and Administration plus Head Office personnel on a part-time basis for activities such as procurement, accounting, human resources and technical support in areas such as metallurgy, environmental, geology and marketing. Annual cost for these roles’ totals CAD0.882 million.
The feldspar plant once operating will engage a further 11 personnel at an annual cost of CAD0.77 million.
242
The “day-shift” operators will oversee on-site environmental monitoring, basic training, on-site safety, product packing and dispatch, etc. under the supervision of the operations manager.
Table 21.6
Breakdown of Operating Labour & Costs
| Petalite/Lepidolite Flotation | |||
| Organizational Data | Total Annual | ||
| Department | Position Title | Number | CAD$ |
| Operations | Operations Manager | 0 | $0 |
| Operations | Process Manager | 1 | $170,000 |
| Engineering | Engineering Manager | 1 | $150,000 |
| Engineering | Engineering Foreman | 1 | $110,000 |
| Technical | Geologist | 1 | $90,000 |
| Operations | Crusher Operator | 4 | $280,000 |
| Operations | Shift/Plant Foreman | 4 | $320,000 |
| Operations | Senior Plant Operators | 8 | $600,000 |
| Operations | Process Operator | 8 | $560,000 |
| Operations | Day shift Operator | 3 | $195,000 |
| Technical | Lab'Technician | 3 | $195,000 |
| Technical | Plant Metallurgist | 1 | $80,000 |
| Engineering | Shift Artisan | 4 | $300,000 |
| Engineering | Millwright | 2 | $180,000 |
| Engineering | Fitter | 2 | $160,000 |
| Engineering | Electrician | 2 | $160,000 |
| Engineering | Aides | 4 | $220,000 |
| TOTAL | 49 | $3,770,000 | |
| General & Administration | |||
| Organizational Data | Labour Total | ||
| Department | Position Title | Number | Total Costs |
| H/Office | Accountant | 0.5 | $65,605.50 |
| H/Office | Procurement | 1 | $81,000.00 |
| Administration | General Manager | 1 | $200,000.00 |
| Administration | Admin' Manager | 1 | $85,000.00 |
| Administration | Clerks | 6 | $300,000.00 |
| Technical | HSE Officer | 1 | $75,000.00 |
| Technical | Stores Manager | 1 | $75,000.00 |
| TOTAL | 11.5 | $881,606 | |
| Feldspar Production | |||
| Organizational Data | Labour Total | ||
| Department | Position Title | Number | Total Costs |
| Operations Operations Operations Engineering Engineering Engineering | Senior Plant Operators Process Assistants Day Shift Fitter Fitter Aides | 4 4 2 1 0 0 | $300,000 $260,000 $130,000 $80,000 $0 $0 |
| TOTAL | 11 | $770,000 | |
243
| 21.2.3.4 | Maintenance |
Annual maintenance supply costs have been estimated using 3% of the installed mechanical equipment costs per annum. This will be predominantly for pump spares and wear components in the flotation cells.
| 21.2.3.5 | Environmental & Tailings |
There is a CAD500,000/y allowance for monitoring and effecting repairs and maintenance to the tailings area and overall site water management as well as on-going analyses of various environmental samples.
A CAD7.5 million provision is included to cover final closure costs- remediation of tailings, open pit and plant site. The plant building will be specifically designed for easy removal and potential sale or relocation.
A cost of $3/t is included for transporting and depositing the filtered tailings (including slimes and magnetics) into the tailings storage areas.
| 21.2.3.6 | Transportation of Concentrates |
A cost of USD150/t (CAD195/t) of dry concentrate produced is assumed (based on budget quotations) for petalite concentrate transport to customers (based predominantly in Europe). It is anticipated that the lepidolite and feldspar concentrates will be sold to customers either in Ontario or the northern parts of the USA and so a transport cost provision of CAD50/t is included.
| 21.2.4 | General and Administration |
There will be 11 fulltime employees and one part time employee (Table 21.5 above) at an annual cost of approximately CAD882,000 All other costs included are annual estimates for corporate expenses (CAD150,000/y), equipment rental (site vehicles etc. @CAD300,000/y), other fixed costs (CAD200,000/y) and “Miscellaneous” (CAD250,000/y).
244
22.0 ECONOMIC ANALYSIS
Micon has prepared this assessment of the Project on the basis of a discounted cash flow model, from which Net Present Value (NPV), Internal Rate of Return (IRR), payback and other measures of project viability can be determined. Assessments of NPV are generally accepted within the mining industry as representing the economic value of a project after allowing for the cost of capital invested.
The objective of the study was to determine the potential viability of the proposed development of the Separation Rapids Lithium Minerals Production Project. In order to do this, the cash flow arising from the base case has been forecast, enabling a computation of the NPV to be made. The sensitivity of this NPV to changes in the base case assumptions is then examined.
| 22.1 | MACRO-ECONOMICASSUMPTIONS |
| 22.1.1 | Exchange Rate, Inflation and Discount Rate |
The prices used for the petalite, lepidolite and feldspar concentrates are based on a US dollar (USD) rate, but unless otherwise stated, financial results are expressed in Canadian dollars (CAD). Cost estimates and other inputs to the cash flow model for the Project have been prepared using constant, second quarter 2018 money terms, i.e., without provision for escalation or inflation.
An exchange rate of CAD1.30/USD is applied in the base case, approximately equal to current rates and to the trailing average over the past two years.
Micon has applied a real discount rate of 8% in its base case evaluation, approximating the weighted average cost of capital (WACC) for the Project.
| 22.1.2 | Expected Metal Prices |
The base case cash flow projection assumes constant prices for all 3 concentrates. These prices are based on discussions held between Avalon and potential customers while negotiating off-take agreements, or, in the case of the feldspar, current market prices.
| 22.1.3 | Taxation Regime |
Ontario mining taxes and Canadian federal and provincial income taxes payable on the Project have been provided for in the cash flow forecast. Mining tax is charged at 10% of net income, after deductions for depreciation and a processing allowance. Depreciation is deductible on a straight-line basis at 30% on mining assets and 15% on processing assets. The processing allowance is set at 8% of processing capital (subject to the allowance falling between minimum and maximum percentages of profit of 15% and 65% respectively).
245
Provincial and federal income tax rates are 10% and 15%, respectively. Depreciation allowances for income tax are limited to 25% on a declining balance basis, with none of the Project’s initial capital assumed to be eligible for an accelerated allowance that may only be claimed during the transition period ending in 2020.
| 22.1.4 | Royalty |
No royalty has been provided for in the cash flow model.
| 22.1.5 | Selling Expenses |
A provision for petalite concentrate transport from Separation Rapids to customer of USD150/t (CAD195/t) is included within forecast cash operating costs. Transport rates for lepidolite and feldspar are much lower (CAD50/t) as they will be sold into local markets.
| 22.2 | TECHNICALASSUMPTIONS |
The technical parameters, production forecasts and estimates described elsewhere in this report are reflected in the base case cash flow model. These inputs to the model are summarized below. The measures used in the study are metric throughout.
| 22.2.1 | Mine Production Schedule |
Figure 22.1 presents the annual tonnage and grade of mineralization type, as well as the annual waste rock tonnages.
Figure 22.1
Open Pit Mine Production Schedule
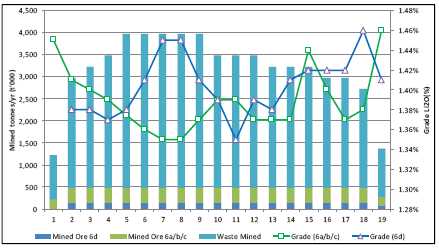
| 22.2.2 | Mineral Concentrate Production Schedule |
Figure 22.2 shows the annual tonnages of petalite and lepidolite produced during operations.
246
Figure 22.2
Annual Petalite/Lepidolite Production Schedule (tonnes)

Annual production of feldspar concentrates and intended markets are shown in Figure 22.3.
Figure 22.3
Annual Feldspar Production Schedule

247
| 22.3 | COSTS |
| 22.3.1 | Operating Costs |
Cash costs over the Life-of-Mine (LOM) average CAD122.77/t milled (Tables 21.4) for production of petalite and lepidolite, equivalent to USD516/t concentrate sold. In addition, operating costs of CAD87.7/t treated (petalite flotation tails) are estimated for feldspar production, equating to USD83/t feldspar concentrate sold. These costs are inclusive of product transportation, maintenance and management of the tailings storage facilities.
| 22.3.2 | Capital Costs |
Pre-production capital expenditures are estimated to total CAD77.7 M which includes CAD42.7 M in processing plant direct costs, CAD10.3 M infrastructure, CAD9.7 M indirect costs, CAD2.00 M for Owners Costs and a contingency of CAD12.5 M. There is a further requirement of CAD10 M for working capital in Year 1.
The feldspar flotation plant is estimated to cost CAD13.74 M in Years 5-6, which includes CAD8.45 M plant directs, CAD2.37 M indirects, CAD0.25 M for extensions to the plant building, CAD0.50 M Owners cost and a CAD2.16 M contingency.
No sustaining capital is forecast, since all maintenance requirements are included in the Operating Cost estimate. Provision is made for CAD7.5 M in site remediation in Year 20.
| 22.3.3 | Base Case Cash Flow |
Figure 22.4 presents a summary of the Project cash flow. Annual cash flows are presented in Table 22.1.
248
Figure 22.4
Net Annual Cash Flow (After Tax)

This preliminary economic assessment is preliminary in nature; it includes inferred mineral resources that are considered too speculative geologically to have the economic considerations applied to them that would enable them to be categorized as mineral reserves, and there is no certainty that the preliminary economic assessment will be realized.
Before tax, the base case demonstrates an undiscounted payback period of less than 3.5 years and an IRR of 27.1% . At an annual discount rate of 8%, the Project has a net present value (NPV8) before tax of CAD156 M.
After tax, the base case undiscounted payback period is just under 4.5 years, leaving a tail of 15 years planned production, and the Project has an IRR of 22.7% . At an annual discount rate of 8%, the Project NPV8 after tax is CAD102 M.
249
Table 22.1
LOMAnnual Cash Flow
| PRODUCTION | Units | LOM | -1 | 1 | 2 | 3 | 4 | 5 | 6 | 7 | 8 | 9 | 10 | 11 | 12 | 13 | 14 | 15 | 16 | 17 | 18 | 19 | 20 | |
| Mine: | ||||||||||||||||||||||||
| Ore (Pre Sorter) | mt | 8,567,928 | 220,000 | 475,000 | 475,000 | 475,000 | 475,000 | 475,000 | 475,000 | 475,000 | 475,000 | 475,000 | 475,000 | 475,000 | 475,000 | 475,000 | 475,000 | 475,000 | 475,000 | 475,000 | 272,928 | - | ||
| Waste | mt | 52,344,381 | 1,000,000 | 2,500,000 | 2,750,000 | 3,000,000 | 3,500,000 | 3,500,000 | 3,500,000 | 3,500,000 | 3,500,000 | 3,000,000 | 3,000,000 | 3,000,000 | 2,750,000 | 2,750,000 | 2,750,000 | 2,500,000 | 2,500,000 | 2,250,000 | 1,094,381 | - | ||
| Total Mined | mt | 60,912,309 | 1,220,000 | 2,975,000 | 3,225,000 | 3,475,000 | 3,975,000 | 3,975,000 | 3,975,000 | 3,975,000 | 3,975,000 | 3,475,000 | 3,475,000 | 3,475,000 | 3,225,000 | 3,225,000 | 3,225,000 | 2,975,000 | 2,975,000 | 2,725,000 | 1,367,309 | - | ||
| Processing: | ||||||||||||||||||||||||
| Crusher Feed | mt | 8,567,928 | 220,000 | 475,000 | 475,000 | 475,000 | 475,000 | 475,000 | 475,000 | 475,000 | 475,000 | 475,000 | 475,000 | 475,000 | 475,000 | 475,000 | 475,000 | 475,000 | 475,000 | 475,000 | 272,928 | - | ||
| Mill Feed | mt | 8,413,705 | 216,040 | 466,450 | 466,450 | 466,450 | 466,450 | 466,450 | 466,450 | 466,450 | 466,450 | 466,450 | 466,450 | 466,450 | 466,450 | 466,450 | 466,450 | 466,450 | 466,450 | 466,450 | 268,015 | |||
| Lepidolite Concentrate Grade | % Li2O | 4.50% | 4.50% | 4.50% | 4.50% | 4.50% | 4.50% | 4.50% | 4.50% | 4.50% | 4.50% | 4.50% | 4.50% | 4.50% | 4.50% | 4.50% | 4.50% | 4.50% | 4.50% | 4.50% | 4.50% | |||
| Lepidolite Concentrate Sold | mt | 218,529 | 0 | 12,000 | 12,000 | 12,000 | 12,500 | 12,500 | 12,500 | 13,000 | 12,500 | 12,000 | 12,000 | 12,000 | 12,500 | 12,500 | 12,500 | 12,500 | 12,500 | 13,000 | 8,029 | |||
| Petalite Concentrate Grade | % Li2O | 4.25% | 4.25% | 4.25% | 4.25% | 4.25% | 4.25% | 4.25% | 4.25% | 4.25% | 4.25% | 4.25% | 4.25% | 4.25% | 4.25% | 4.25% | 4.25% | 4.25% | 4.25% | 4.25% | 4.25% | |||
| Petalite Concentrate Sold | mt | 1,322,849 | 37,500 | 74,000 | 73,500 | 73,000 | 72,000 | 72,000 | 72,500 | 72,500 | 73,000 | 72,500 | 73,000 | 72,500 | 72,500 | 72,500 | 75,000 | 74,500 | 73,000 | 73,500 | 43,849 | |||
| Feldspar Concentrate Sold | mt | 1,307,500 | - | - | - | - | - | 34,000 | 48,000 | 62,000 | 75,500 | 88,000 | 100,000 | 100,000 | 100,000 | 100,000 | 100,000 | 100,000 | 100,000 | 100,000 | 100,000 | 100,000 | ||
| Exchange Rate | CAD/US$ | 1.30 | 1.30 | 1.30 | 1.30 | 1.30 | 1.30 | 1.30 | 1.30 | 1.30 | 1.30 | 1.30 | 1.30 | 1.30 | 1.30 | 1.30 | 1.30 | 1.30 | 1.30 | 1.30 | 1.30 | 1.30 | 1.30 | |
| Sales Revenue | CAD'000 | 1,745,717 | - | 36,563 | 81,510 | 81,023 | 80,535 | 79,950 | 87,854 | 91,683 | 94,933 | 97,728 | 99,223 | 102,161 | 101,673 | 102,063 | 102,063 | 104,501 | 104,013 | 102,551 | 103,428 | 70,641 | 21,626 | |
| OPERATING COSTS | CAD/t milled | |||||||||||||||||||||||
| Mining | 39.98 | CAD'000 | 336,353 | 6,494 | 16,450 | 17,825 | 19,200 | 21,950 | 21,948 | 21,947 | 21,947 | 21,948 | 19,199 | 19,201 | 19,199 | 17,825 | 17,823 | 17,823 | 16,448 | 16,448 | 15,071 | 7,606 | - | |
| Labour | 8.40 | CAD'000 | 70,688 | 2,828 | 3,770 | 3,770 | 3,770 | 3,770 | 3,770 | 3,770 | 3,770 | 3,770 | 3,770 | 3,770 | 3,770 | 3,770 | 3,770 | 3,770 | 3,770 | 3,770 | 3,770 | 3,770 | - | |
| Energy | 8.97 | CAD'000 | 75,497 | 1,573 | 4,208 | 4,203 | 4,195 | 4,190 | 4,191 | 4,196 | 4,196 | 4,196 | 4,201 | 4,190 | 4,190 | 4,187 | 4,196 | 4,235 | 4,214 | 4,199 | 4,215 | 2,522 | - | |
| Consumables | 24.82 | CAD'000 | 208,815 | 5,395 | 11,568 | 11,568 | 11,570 | 11,568 | 11,561 | 11,551 | 11,551 | 11,561 | 11,566 | 11,575 | 11,566 | 11,568 | 11,561 | 11,558 | 11,558 | 11,558 | 11,549 | 6,863 | - | |
| Maintenance | 1.54 | CAD'000 | 12,973 | 78 | 781 | 781 | 781 | 781 | 781 | 781 | 781 | 781 | 781 | 781 | 781 | 781 | 781 | 781 | 781 | 195 | 781 | 195 | - | |
| Tailings Disposal | 3.08 | CAD'000 | 25,922 | 785 | 1,641 | 1,642 | 1,644 | 1,646 | 1,520 | 1,467 | 1,416 | 1,366 | 1,319 | 1,277 | 1,277 | 1,278 | 1,276 | 1,267 | 1,272 | 1,275 | 1,272 | 782 | 500 | |
| Lepidolite Shipment | 1.30 | CAD'000 | 10,926 | - | 600 | 600 | 600 | 625 | 625 | 625 | 650 | 625 | 600 | 600 | 600 | 625 | 625 | 625 | 625 | 625 | 650 | 401 | - | |
| Petalite Shipment | 30.66 | CAD'000 | 257,956 | 7,313 | 14,430 | 14,333 | 14,235 | 14,040 | 14,040 | 14,138 | 14,138 | 14,235 | 14,138 | 14,235 | 14,138 | 14,138 | 14,138 | 14,625 | 14,528 | 14,235 | 14,333 | 8,551 | - | |
| Feldspar Production | 16.79 | CAD'000 | 141,236 | - | - | - | - | - | 4,232 | 5,592 | 6,952 | 8,252 | 9,457 | 10,626 | 10,626 | 10,626 | 10,626 | 10,626 | 10,626 | 10,626 | 10,626 | 10,626 | 11,117 | |
| Interest | - | CAD'000 | - | - | - | - | - | - | - | - | - | - | - | - | - | - | - | - | - | - | - | - | - | |
| General & Administration | 4.02 | CAD'000 | 33,850 | 1,681 | 1,782 | 1,782 | 1,782 | 1,782 | 1,782 | 1,782 | 1,782 | 1,782 | 1,782 | 1,782 | 1,782 | 1,782 | 1,782 | 1,782 | 1,782 | 1,782 | 1,782 | 1,582 | 300 | |
| Operating costs | 139.56 | CAD'000 | 1,174,215 | - | 26,146 | 55,230 | 56,504 | 57,778 | 60,351 | 64,450 | 65,849 | 67,182 | 68,516 | 66,812 | 68,037 | 67,929 | 66,580 | 66,578 | 67,092 | 65,604 | 64,713 | 64,048 | 42,898 | 11,917 |
| NB: excl. feldspar prod. | 122.77 | |||||||||||||||||||||||
| Capital Expenditure | CAD'000 | 91,406 | 45,605 | 32,066 | - | - | - | 4,428 | 9,307 | - | - | - | - | - | - | - | - | - | - | - | - | - | - | |
| Working Capital | CAD'000 | - | 10,000 | (10,000) | ||||||||||||||||||||
| Site Closure | CAD'000 | 7,500 | 7,500 | |||||||||||||||||||||
| Pre-tax Cash Flow | CAD'000 | 472,595 | (45,605) | (31,649) | 26,280 | 24,519 | 22,757 | 15,171 | 14,097 | 25,833 | 27,750 | 29,211 | 32,410 | 34,123 | 33,744 | 35,483 | 35,485 | 37,408 | 38,409 | 37,837 | 39,380 | 27,743 | 12,209 | |
| Taxes | CAD'000 | 144,838 | - | - | 1,742 | 2,508 | 2,973 | 3,050 | 4,232 | 5,662 | 7,113 | 7,913 | 9,237 | 9,994 | 10,028 | 10,736 | 10,864 | 11,525 | 11,883 | 11,736 | 12,245 | 8,543 | 2,852 | |
| Net Cash flow | CAD'000 | 327,758 | (45,605) | (31,649) | 24,538 | 22,010 | 19,784 | 12,121 | 9,865 | 20,171 | 20,637 | 21,298 | 23,173 | 24,129 | 23,716 | 24,747 | 24,621 | 25,883 | 26,526 | 26,101 | 27,135 | 19,200 | 9,357 | |
| Cum. c/f after tax | CAD'000 | (45,605) | (77,254) | (52,716) | (30,706) | (10,922) | 1,198 | 11,064 | 31,235 | 51,872 | 73,170 | 96,343 | 120,472 | 144,187 | 168,935 | 193,556 | 219,439 | 245,965 | 272,066 | 299,201 | 318,401 | 327,758 | ||
| Payback period | yrs | 4.4 | 0.0 | 0.5 | 1.0 | 1.0 | 1.0 | 0.9 | 0.0 | 0.0 | 0.0 | 0.0 | 0.0 | 0.0 | 0.0 | 0.0 | 0.0 | 0.0 | 0.0 | 0.0 | 0.0 | 0.0 | 0.0 | |
| Discount rate | 8.00% | Pre Tax | Post Tax | |||||||||||||||||||||
| NPV | CAD'000 | $155,562 | $102,191 | |||||||||||||||||||||
| IRR | % | 27.1% | 22.7% | |||||||||||||||||||||
| Discount factor | 0.9259 | 0.8573 | 0.7938 | 0.7350 | 0.6806 | 0.6302 | 0.5835 | 0.5403 | 0.5002 | 0.4632 | 0.4289 | 0.3971 | 0.3677 | 0.3405 | 0.3152 | 0.2919 | 0.2703 | 0.2502 | 0.2317 | 0.2145 | 0.1987 | |||
| Discounted cash flow before tax | (42,227) | (27,134) | 20,862 | 18,022 | 15,488 | 9,560 | 8,225 | 13,957 | 13,882 | 13,530 | 13,900 | 13,551 | 12,408 | 12,081 | 11,186 | 10,919 | 10,381 | 9,469 | 9,125 | 5,952 | 2,425 | |||
| Cum. DCF before tax | (42,227) | (69,361) | (48,500) | (30,478) | (14,989) | (5,429) | 2,796 | 16,753 | 30,635 | 44,165 | 58,066 | 71,616 | 84,024 | 96,105 | 107,291 | 118,210 | 128,591 | 138,060 | 147,185 | 153,137 | 155,562 | |||
| Discounted cash flow after tax | (42,227) | (27,134) | 19,479 | 16,178 | 13,464 | 7,638 | 5,756 | 10,898 | 10,324 | 9,865 | 9,938 | 9,582 | 8,720 | 8,425 | 7,762 | 7,555 | 7,169 | 6,532 | 6,288 | 4,119 | 1,859 | |||
| Cum. DCF after tax | (42,227) | (69,361) | (49,882) | (33,704) | (20,239) | (12,601) | (6,845) | 4,053 | 14,377 | 24,242 | 34,180 | 43,762 | 52,482 | 60,908 | 68,669 | 76,224 | 83,394 | 89,925 | 96,213 | 100,332 | 102,191 | |||
250
| 22.3.4 | Summary of Economic Indicators |
Table 22.2 summarizes the key project economic indicators and performance.
Table 22.2
Key Project Indicators
| Item | Units | LOM |
| Mine Production | ||
| Ore (Pre-Sorter) | t | 8,567,928 |
| Waste | t | 52,344,381 |
| Total Mined | t | 60,912,309 |
| Processing | ||
| Mill Feed | t | 8,413,705 |
| Lepidolite Concentrate Grade | % Li2O | 4.50% |
| Lepidolite Concentrate Sold | t | 218,529 |
| Petalite Concentrate Grade | %Li2O | 4.25% |
| Petalite Concentrate Sold | t | 1,322,849 |
| Feldspar Concentrate Sold | t | 1,307,500 |
| Exchange Rate | CAD/USD | 1.30 |
| Total Sales Revenue | CAD'000 | 1,745,717 |
| Operating Costs | CAD/t milled | CAD'000 |
| Lithium Concentrate Production | 122.77 | 1,032,979 |
| Feldspar Production | 16.79 | 141,236 |
| Total Operating Costs | 139.56 | 1,174,215 |
| Capital Costs | CAD'000 | |
| Construction - Initial Capital | 77,671 | |
| Feldspar Plant (Yrs 5&6) | 13,735 | |
| Total Capital Expenditure | CAD'000 | 91,406 |
| Working Capital | 10,000 | |
| Site Closure | 7,500 | |
| Pre-tax | After Tax | |
| Net Cash Flow (CAD’000) | 472,595 | 327,758 |
| Net Present Value (at 8% disc. rate) | 155,562 | 102,191 |
| Internal Rate of Return (IRR) | 27.1 | 22.7 |
| Payback Period (after tax, undisc.) | Yrs | 4.4 |
251
| 22.4 | SENSITIVITYSTUDY |
| 22.4.1 | Capital, Operating Costs, Tin Price and Recovery Sensitivity |
The sensitivity of post-tax project returns to changes in capital, operating costs and all revenue factors (including recovery and concentrate price) was tested over a range of 20% above and below base case values (see Figure 22.5 and Figure 22.6) .
Figure 22.5
NPV Sensitivity Diagram
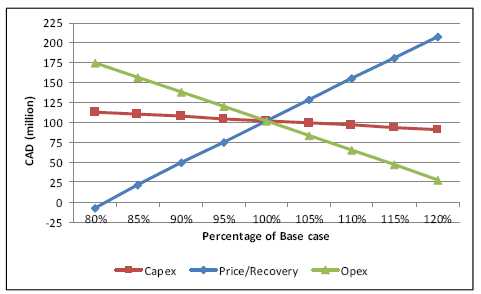
Figure 22.6
IRR Sensitivity Diagram
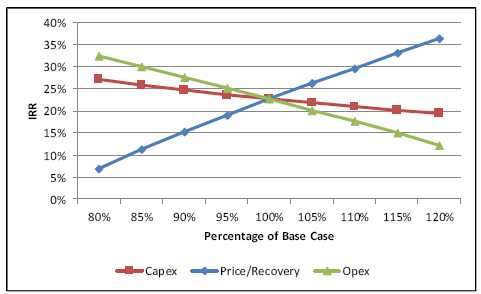
252
The charts suggest that the Project is most sensitive to revenue drivers, namely price and recovery which are essentially identical. At a discount rate of 8%, the project NPV is negative when all product prices are reduced by 20%. The Project is also quite sensitive to changes in operating cost while sensitivity to capex is relatively low. Project NPV remains positive for adverse changes of up to 20% in either capital or operating costs.
| 22.5 | CONCLUSION |
Micon concludes that the Project is potentially economic under the base case assumptions for product price, process recoveries, capital and operating costs, and appears sufficiently robust to withstand adverse changes in cost assumptions of more than 20%.
The proposed project format presents an opportunity to viably produce lithium mineral and feldspar concentrates for both the ceramics and lithium chemical industries. The prices currently being negotiated with potential customers present strong project economic returns with an after-tax IRR of 22.7% and an NPV of CAD102 M. The capital required is CAD77.7 M with a further requirement of CAD10 M for initial working capital.
The Project currently has a petalite/lepidolite production life of 18.5 years although plant operations have been expanded in this study to 20 years through the continued production of feldspar from stockpiled petalite tailings. There will be sufficient petalite tailings to continue feldspar production for several decades further at the planned production rate of 100,000 t/y but this is not taken into consideration in this study.
There is also the potential for a longer petalite/lepidolite production life as the current ore body remains open at depth and along strike and areas of other mineralization outcrops have been identified. At some point it may also become viable to start underground mining for the known deeper mineralization. Further, if sufficient additional mineralization is identified it is quite possible that the production capacity of the initial plant could be expanded relatively cheaply and quickly.
There are other by-product opportunities as well which have not been evaluated in this report. These include recovery of lithium, niobium and tantalum from the waste magnetics stream and the very low impurity silica material from the petalite mineralization tailings after petalite and feldspar removal.
253
23.0 ADJACENT PROPERTIES
| 23.1 | INTRODUCTION |
Although the SRLD is described by Breaks in numerous publications as the largest rare metal pegmatite of the petalite sub-type discovered in Ontario, there are a large number of other rare metal pegmatite occurrences within a few kilometres of the Separation Rapids property. As noted by Breaks and Tindle, 1998, “most rare metal mineralization occurs within 5 km of the Separation Rapids Pluton, the postulated parent granite for two distinct clusters of pegmatites”. These have been designated by Breaks and Tindle, 1998, as the Eastern Pegmatite Subgroup and the Southwestern Pegmatite Subgroup (see Figure 23.1) .
The principal occurrences are the Big Mack Pegmatite, the Southwestern Pegmatite Subgroup which includes the SRLD, Great White North and the Swamp pegmatites, and the Eastern Pegmatite Subgroup which includes Marko’s Pegmatite, Lou’s Pegmatite and others as described in Breaks and Tindle, 1998. The grouping references as given by Breaks and Tindle, 2001, are used in the text below, with the exception of the Western Pegmatites. This group is added here since the individual mineralized bodies were not clearly discussed in various publications by Breaks. Most of these were mapped and sampled during the period 1996-2002 and have received little or no attention since.
Figure 23.1
Location of Claims in the Separation Rapids Project Area

254
| 23.2 | BIGMACKPEGMATITE |
The Big Mack Pegmatite is about 2 km west of the SRLD system. The system has been described in the report by Breaks et al. (1999), for the Ontario government and Chastko (2001) as an NI 43-101 technical report. The occurrence is located on mining lease CLM 428 held by Pacific Iron Ore Corporation (formerly Emerald Fields Resource Corporation). This lease has an expiry date of 28 February, 2021. The information was obtained from the Ontario government online claim database as of 5 August, 2016 (www.mci.mndm.gov.on.ca/claims).
According to Breaks et al. (1999) the Big Mack Pegmatite system contains four known petalite occurrences on one set of claims and a fifth occurrence (referred to briefly as the Glitter Pegmatite). Locally, there are additional occurrences of rare-element mineralization consisting of numerous oxide mineral-bearing pegmatites and aplite dykes.
The Big Mack Pegmatite and the SRLD are thought to be “early pegmatites” and are complexly folded. The pegmatite has been stripped over its entire surface area and has been tested by three short narrow diameter Winkie drill holes and nine BQ sized drill holes for a total of 1,261 m. The surface expression of the Big Mack Pegmatite measures 30 by 150 m. The petalite content is stated by Chastko, 2001, to average 30.5% . The pegmatite is mainly confined to the nose area of a tight to isoclinal, macroscopic fold (Breaks et al., 1999). Boudinage of pegmatite dykes is widely noted on a mesoscopic scale throughout the entire Big Mack Pegmatite system. This subsequent structural event likely applies on a macroscopic scale to the Big Mack Pegmatite, as this mass exhibits a plan view suggestive of boudinage.
The Big Mack Pegmatite represents the largest petalite-bearing mass on CLM 428 and is exposed over an 80 by 225 m area (Breaks et al., 1999). The pegmatite comprises a 30 by 100 m main mass coupled with several prominent, narrow apophyses that taper towards the south and southeast. These apophyses consist of non-petalite-bearing sodic pegmatites and similar units. The Big Mack Pegmatite exhibits an internal zonation expressed by a continuous wall zone, 0.5 to 3 m thick, that grades into a main core mass of petalite-rich pegmatite. Petalite-rich pegmatite comprises most of the body and contains areas up to 56 to 60% light brown weathering petalite. Chrysoberyl-bearing petalite pegmatite is confined to a 2 to 6 by 25 m unit that is exposed within a trench.
Diamond drill holes established the continuity of the Big Mack Pegmatite zone to at least 50 m below surface. However, holes below this level encounter petalite-free pegmatite that may or may not correlate with the petalite-bearing zone of the Big Mack Pegmatite. It is the opinion of Pedersen, 2016, based on logging the holes, that the petalite-free lower pegmatite is a barren continuation of the upper petalite-bearing pegmatite, and it is simply the termination through boudinage of the pegmatite. The Big Mack Pegmatite zone is speculated to extend down plunge to the west at a moderate angle (Chastko, 2001).
255
Chastko (2001) reports a mineral resource estimate of 275,700 t with an estimated content of 30.5% petalite at an SG of 2.6) .
| 23.3 | EASTERNPEGMATITESUBGROUP |
| 23.3.1 | Marko’s Pegmatite |
Marko’s Pegmatite was explored by Champion Bear Resources Ltd. (Champion Bear) and described by Breaks and Tindle, 2001, who noted that it is the largest petalite-bearing pegmatite in the Eastern Pegmatitite Subgroup. They emphasize the strong zoning with the Marko’s Pegmatite noting that the wall zone is pollucite-bearing, unique to the area, but has no petalite, while the core zone contains strong petalite enrichment. It is about 5 km east of the SRLD system.
The ground immediately east and west of Marko’s Pegmatite is now optioned by Power Metals Corp from Exiro Resources. Power Metals refers to the area as the Paterson Lake Property.
In a report prepared for Champion Bear, Hinzer, 2003, stated that:
“Detailed surface sampling and initial diamond drilling has identified anomalouslithium, tantalum, rubidium, cesium, tin and beryllium values at the Marco’s [sic]pegmatite.“Early exploration at the main Marcos zone showed the 170 m long pegmatite tobe made up of two to 12 m wide boudinaged lens, dipping steeply to the south andwith a shallow plunge to the west. Petalite was encountered both on surface andin drilling over width of up to 5.3 m. The parallel, north Marcos pegmatite, a 10to 30 m wide pegmatite dyke, unmineralized at surface, also contains severalpetalite lenses of similar dimensions. The north Marcos dyke at depth appears tobe of larger dimension than the main Marcos dyke.“Diamond drilling shows an apparent flattening to approximately 20° of thepegmatite down dip and to the east. The pegmatite is zoned with two petalitehorizons and two oxide-bearing zones.” |
Early exploration reported by Hinzer, 2003, encountered 0.1 to 0.2% Li over up to 5.3 m in surface samples. Hinzer also, at an uncertain date, but possibly in 1977, reported higher grades from previous drilling including drill holes:
| • | SR-11 1.48% LiO over 3.5 m. | |
| • | SR-13 3.76% LiO over 4 m and 3.9% LiO over 1.5 m. | |
| • | SR-16 1.89% LiO over 3.9 m. | |
| • | SR-17 1.02% LiO over 7.9 m. | |
| • | SR-20 1.09% LiO over 1.5 m, 1.05% LiO over 2.1 m and 1.11% LiO over 2.8 m. |
256
It should be noted that Hinzer quotes lithium values consistently as LiO, as opposed to the conventional Li2O, and it is not known whether this is a typographical or conversion error. Holes not listed did not have significant lithium values greater than 1% LiO. The 2002 program added four more drill holes, none of which indicated greater than 1% lithium intercepts.
| 23.3.2 | Lou’s Pegmatite and Other Pegmatites |
The Ontario Mineral Deposit Inventory (www.geologyontario.mndm.gov.on.ca, Mineral Deposits and Occurrences/Mineral Deposit Inventory (MDI)) notes that the minerals present at Lou’s Pegmatite include “abundant” petalite, ferrocolumbite, ferrotantalite, wodginite, cassiterite and beryl. Alteration types observed include lithium metasomatism, biotitization and tourmalinization.
Breaks and Tindle (2001), note that among the eight other known pegmatites within the Eastern Pegmatite Subgroup, most tend to display ductile shear fabrics that makes petalite difficult to recognise in hand specimen as their Pegmatites 10 and 11. They also state that Pegmatite 8 of the Eastern Pegmatite Subgroup has unique second generation petalite with deformation and recrystallization.
There are notes on the Eastern Pegmatite Subgroup in Breaks and Tindle, (1998), on the Gossan Resources Ltd. (Gossan) property. According to this poster reference, the subgroup has preliminary indications of the highest potential for tantalum and rock grab values reportedly range from 0.07 to 0.22% TaO. Note that the publication refers to TaO and not Ta2O5 as the tantalum content. The reference also notes significant Li, Cs and Rb values.
| 23.4 | SOUTHWESTERNPEGMATITESUBGROUP |
Breaks and Tindle, 2001, describe the Southwestern Pegmatite Subgroup of approximately 30 beryl-type and complex-type pegmatites that occupy and area of 0.3 to 0.8 by 6.5 km adjacent to the southwestern part of the Separation Rapids Pluton. Within this subgroup they defined two zones that respectively contain beryl-type and complex-type (petalite subtype) pegmatites. Note that in Breaks and Tindle, 2001, the Southwestern Pegmatite Subgroup as published includes the SRLD and also extends immediately east of it. As a result, the Gossan property immediately east of the Avalon Mine Lease would also be included within the Southwestern Subgroup of Breaks and Tindle, 2001.
The “Beryl zone” is said to consist of a profusion of narrow dykes of aplite and albitite up to 3 m thick and larger dikes and ovoid masses, up to 250 by 300 m that are composed of pegmatitic leucogranite, subordinate potassic pegmatite and quartz-rich patches with blocky potassium feldspar and sparse green beryl. Despite the beryl in the name, Breaks and Tindle, 2001, state that beryl, chrysoberyl, gahnite and ferrowodginite are rare. They state that the “Petalite zone” has nine relatively large, deformed pegmatite lenses, and incorporates, as the largest, the SRLD pegmatite. A swarm of much smaller petalite pegmatites accompanies the larger lenses. The majority of petalite pegmatites, regardless of size, display an internal zonation. This zonation comprises a relatively narrow wall, zone rich in plagioclase and a core unit of muscovite-quartz-potassium feldspar-petalite.
257
The SRLD system continues to the east from the main outcrop, also with narrow petalite bearing pegmatite dykes on ground owned currently by Gossan Resources.
258
24.0 OTHER RELEVANT DATA AND INFORMATION
Micon and Avalon believe that no additional information or explanation is necessary to make this Technical Report understandable and not misleading. Any requests for clarification should be addressed to Avalon atoffice@AvalonAM.com.
259
25.0 INTERPRETATION AND CONCLUSIONS
| 25.1 | INTRODUCTION |
The PEA suggests that the Separation Rapids Project can be developed as an economically viable supplier of the lithium minerals petalite and lepidolite into the ceramics and lithium chemical industries for almost 20 years. Production of a third, feldspar concentrate further enhances the Project economics by supplying product into various industrial mineral markets.
The initial capital estimate for the Project is CAD77.7 million with a further CAD10 million required for initial working capital. The addition of the feldspar recovery circuit in Years 5/6 (or potentially sooner if funding is available) requires an additional CAD13.7 million.
Capital costs have been reduced by treating the 2 different types of lithium mineralization on a campaign basis rather than having 2 parallel processing plants.
The Project is relatively small and low in capex for a mining Project, but the economic performance estimated by this report indicates a post-tax IRR of 22.7% and an NPV of CAD102 million. A sensitivity analysis suggests that the Project is most sensitive to revenue drivers, namely price and recovery (identical), and also quite sensitive to changes in operating cost while sensitivity to capex is relatively low.
The Project will provide over 70 full time employment opportunities, as well as a number of additional opportunities for local industries to grow through the provision of support services.
Consideration has been given in the design to the number and nature of the chemicals used in the flotation process and how best to minimise their consumption through recovery and recycling, as well as via water treatment to remove dissolved metals.
The site layout takes into account the various waste streams produced by the processes with all being relatively inert and free from toxic materials and sulphides. Flotation tailings are filtered and washed before being dry-stacked so as not to present a source of future ground and run-off water contamination.
| 25.2 | RISKS ANDOPPORTUNITIES |
The risks and opportunities of the Project in its current format are discussed below.
| 25.2.1 | Control of Plant Feed Composition |
The processing of lepidolite mineralization requires significantly different flotation conditions and reagents to that of petalite and so it is key that the two types of material are processed separately otherwise there will be a loss in concentrate recovery. This will require a tight control of the mining operation and the management of the various materials delivered to the ore stockpile. Separate stockpiles for the 2 materials are planned.
260
| 25.2.2 | Ore Sorting |
The removal of as much amphibolite as possible from the petalite mineralization is key to being able to produce high purity petalite concentrate. Consequently, all crusher feed material will be passed through the optical sorters plant and where possible, any larger amphibolite seams will be selectively mined, and the material sent straight to the waste stockpile. The crushing plant has been sized such that it can process a much higher tonnage than expected in order to accommodate any feed material with unusually high levels of amphibolite while still providing the required mill feed tonnage.
| 25.2.3 | Resources |
There is significant up-side potential with regards additional resources through development of known outcrops not currently included in the Project, mining deeper either through extending the pit or going underground, and through identifying new, currently un-detected mineralization.
| 25.2.4 | Products, Prices and Demand |
Available information on lepidolite and petalite pricing is very limited but Avalon has carried out its own assessment of the markets based on purchased reports, information presented at conferences, discussions with industry participants and more importantly, with potential off-takers as part of on-going off-take agreement negotiations. Micon has reviewed the volume and pricing information prepared by Avalon and has independently confirmed that Avalon’s projections are reasonable for the purpose of this PEA.
As lithium price forecasts appear to remain at current levels (or higher) and the availability of lithium feed materials for the ceramics industry tightens it is not expected that prices for either of the lithium concentrates will drop (if at all) below those used in the study.
The proposed feldspar production schedule is based around the supply into a number of markets which provides a great deal of flexibility for off-take and expansion possibilities, particularly as the targeted feldspar production level is only about 40% of the potentially recoverable product. Introducing the feldspar circuit earlier into the Project could also generate an additional CAD11 million per year in pre-tax revenue.
The final flotation tails after the recovery of petalite and feldspar from the petalite mineralized material is a very low impurity silica product which could be suitable for a number of applications within the ceramics/glass industry. This marketing opportunity has not yet been fully explored by Avalon, but it could provide an additional, small (probably) source of revenue as well as reducing the amount of tailings material to be accommodated at site.
261
| 25.2.5 | Process Performance |
The Project economics are greatly driven by the petalite recovery. The flotation processes involved are quite complex particularly when making the very low impurity product (Super Petalite). Reagent dosage control will be key as will maintaining the separate water circuits and preventing cross-contamination. Both of these aspects have received considerable attention when developing the process flowsheets
| 25.2.6 | Mining |
The forecast mining cost represents around 30% of total production costs and is estimated using typical industry contractor rates for open pit operations of this scale. Further mine design work is required before final tonnages of material (plant feed plus waste) to be mined can be more accurately defined. As indicated above, the potential for mining underground warrants further investigation as it could not only provide additional feed resources but also reduce the volumes of waste rock generated.
| 25.2.7 | Purchasing Used/Refurbished Equipment |
The capital cost estimate has assumed all equipment is purchased new, but there are significant opportunities to reduce equipment costs, particularly for the mill, by purchasing used/refurbished items. In addition, there is the potential for significant savings through sourcing equipment and modular “plants” direct from China, particularly for the crushing plant.
| 25.2.8 | Foreign Exchange Rate |
A lot of the mechanical equipment is being sourced from outside Canada and is priced in American dollars. Similarly, all revenue is in USD. An exchange rate of CAD1.30:USD1 has been used. Should the Canadian dollar strengthen this would be positive in terms of initial capex, but then negative with respect to subsequent revenue once in production.
| 25.3 | CONCLUSIONS |
Avalon has the opportunity to produce feed materials (petalite, lepidolite and feldspar) into a wide range of industrial, ceramics and chemical markets through the development of the Separation Rapids Lithium Project. The estimated capital cost is low for a mining project (CAD77.7 million) and economic returns attractive with a post-tax IRR of 22.7% and an NPV of CAD102 million. Undiscounted payback is just under 6 years leaving a tail of 14 years of planned production there-after with a number of options available for potentially extending the Project life. Post-tax, undiscounted net cash flow from the 20 years operation is almost CAD330 million.
Market demand for the lithium mineral products is increasing as more and more lithium is required for the expanding battery and energy storage industries and this is resulting in a squeeze on supply into the ceramics industry – a void Avalon hopes to help resolve. Avalon already has a non-binding letter of intent for the lepidolite concentrate from a Canadian based customer and a number of potential markets for the feldspar have been identified. Avalon is also in discussions with 4 potential major petalite customers.
262
The Project enjoys strong support from the community as well as from local politicians, First Nations and environmental NGOs. Avalon is also in discussions with a number of local businesses towards collaboration on future opportunities including contractor mining, power supply, local fabrication and product transportation.
The start of operations is not anticipated to be subject to approvals under the Canadian Environmental Assessment Act 2012 (CEAA) as the mine does not exceed any of the CEAA triggers including mine and mill tonnages. The Project will not have any new impacts to fish or fish habitat, nor will it impact on any Federal Wildlife Areas or Migratory Bird Sanctuaries. Final Permitting and Approval for the Project is therefore expected to be relatively short and simple.
263
26.0 RECOMMENDATIONS
| 26.1 | OVERVIEW |
The preliminary economic assessment presents an attractive Project and the opportunity to generate significant revenue for Avalon – it is recommended, therefore, that the Project continues to the next stage of development which should be the completion of a full FS.
| 26.2 | RECOMMENDATIONS FOR THENEXTPHASE OFPROJECTDEVELOPMENT |
| 26.2.1 | Feasibility Study |
The next step in developing the Project should be the completion of a full economic and technical FS in order to confirm these initial findings and to help source the necessary capital required for project implementation.
If possible, this FS should be conducted by an EPCM/Engineering group and other specialist consultants capable of designing and implementing the final project. In so doing engineering costs and implementation time will likely be reduced.
| 26.2.2 | Resources |
In order to maintain the proposed production levels and mine life, additional measured and indicated resources are required for an FS. It is probable that this requirement can largely be achieved by up-grading the inferred material through further, in-fill drilling and by mining deeper.
However, additional exploration drilling is also recommended in order to evaluate the potential for further, new near surface material in order to potentially reduce waste quantities and reduce mining costs.
| 26.2.3 | Mining |
The FS will require a more detailed mine plan and mining contract proposal based upon the revised mineral resource resulting from the above recommended work. A trade-off study for open pit vs. underground mining should also be conducted to determine if underground mining can be made economically viable and at what depth.
| 26.2.4 | Processing Plant |
Further “mini-pilot” flotation work is recommended to confirm petalite recovery figures from the lepidolite mineralization and to better define the composition of the feldspar product from this material.
264
Additional reagent recovery and water treatment investigations are also proposed in order to maximise recycling potential and to confirm the quality of the recycled water.
The equipment cost for the crusher plant and flotation circuits (petalite/lepidolite and feldspar) are both based on the concept of being modular, pre-assembled/containerized packages in order to minimize, as far as possible, on-site construction activities. This concept should be carried forward into the FS although a trade-off study may be warranted just to confirm and quantify the economic benefits of such an approach.
| 26.2.5 | Environmental and Permitting |
Completion of the validation and update of the 2007 baseline data is required and anticipated in the near future. Additional drilling to further develop and finalize the site hydrology and groundwater management plan is needed. Based on the results of the ongoing humidity cell and other test work on the anticipated waste materials and the plant and site water balance, a final design of the water management facilities is required. In consultation with regulators and other stakeholders, limited ongoing monitoring for surface and groundwater quality and quantity is recommended.
Based on the above and this PEA, a Certified Closure Plan is required for submission to the MNDMorder to expedite the permitting process, the recommended trade off study and feasibility level design for the TMF containment structures should be initiated for the ECA permit applications for these structures. The route for the power line must be finalized and obtaining all required information for permitting should be initiated in consultation with MNRF. Similarly, detailed engineering for the air and water emissions equipment are required to initiate the MECP air and water ECAs.
| 26.3 | BUDGET |
The budget prepared by Avalon for the next phase of the project development for the Separation Rapids Project is presented in Table 26.1 below.
Table 26.1
Budget for the Next Phase of the Project
| Expense | Amount (CAD’000) |
| Drilling | |
| Geotech & Hydrology | 450 |
| Testwork | |
| Process | 350 |
| Water Treatment | 50 |
| Engineering | |
| Mine Design | 75 |
| Process Plant & Site | 175 |
| Studies | |
| Power Supply | 50 |
265
| Expense | Amount (CAD’000) |
| Market Studies | 30 |
| Hydrology | 175 |
| Tailings & Waste Rock | 120 |
| Environmental Permitting | 140 |
| Final Report Compilation | 75 |
| Avalon Expenses | 30 |
| Total | 1,720 |
266
27.0 DATE AND SIGNATURE PAGE
| “Richard Gowans” {signed and sealed as of report date} | |
| Richard Gowans, P.Eng. | Report Date: September 26, 2018 |
| President & Principal Metallurgist | Effective Date of PEA: August 21, 2018 |
| Effective Date of Updated Mineral | |
| Resource Estimates: May 23, 2018 | |
| “Christopher Jacobs” {signed and sealed as of report date} | |
| Christopher Jacobs, CEng., MIMMM | Report Date: September 26, 2018 |
| Vice President & Mining Economist | Effective Date of PEA: August 21, 2018 |
| Effective Date of Updated Mineral | |
| Resource Estimates: May 23, 2018 | |
| “Bruce Pilcher” {signed and sealed as of report date} | |
| EurIng, Bruce Pilcher, CEng, FIMMM, FAusIMM(CP) | |
| Senior Mining Engineer | Report Date: September 26, 2018 |
| Effective Date of PEA: August 21, 2018 | |
| Effective Date of Updated Mineral | |
| Resource Estimates: May 23, 2018 | |
| “Jane Spooner” {signed and sealed as of report date} | |
| Jane Spooner, P.Geo. | Report Date: September 26, 2018 |
| Vice President | Effective Date: August 21, 2018 |
| Effective Date of Updated Mineral | |
| Resource Estimates: May 23, 2018 | |
267
| “William Mercer” {signed and sealed as of report date} | |
| William Mercer, PhD, P. Geo. | Report Date: September 26, 2018 |
| Effective Date: August 21, 2018 | |
| Effective Date of Updated Mineral | |
| Resource Estimates: May 23, 2018 | |
| “Steven R. Aiken” {signed and sealed as of report date} | |
| Steven R. Aiken, P.Eng. | Report Date: September 26, 2018 |
| Effective Date: August 21, 2018 | |
| Effective Date of Updated Mineral | |
| Resource Estimates: May 23, 2018 | |
| “Kevin E. Hawton” {signed and sealed as of report date} | |
| Kevin E. Hawton, P.Eng. | Report Date: September 26, 2018 |
| Effective Date: August 21, 2018 | |
| Effective Date of Updated Mineral | |
| Resource Estimates: May 23, 2018 | |
268
28.0 REFERENCES
Adams Heritage Consultants conducted on behalf of Knight Piesold, 1998: “An Archaeological Assessment (Stages 1 & 2) of the proposed Avalon Ventures Ltd. Separation Rapids Project, English River, Ontario”, 34 pages, October, 1998.
ALS, 2016: Whole rock geochemistry from holes 97-02 and 98-52 (Spreadsheet with whole rock data for about 50 samples in two drill holes).
Anzaplan. (2014). Flowsheet and Core Machinery. Hirschau.
Anzaplan. (2014). Locked Cycle Petalite Flotation Tests on Fine Grained Ore (FGO). Hirschau.
Anzaplan. (2014). Physical Processing of Fine-Grained Ore from Separation Rapids. Hirschau.
Anzaplan. (2014). Processing of Petalite Ceramic Application Tests. Hirschau.
Anzaplan. (2014). Processing of Petalite Ore from Separation Rapids. Hirschau.
Anzaplan. (2014). Sample Production of Petalite and Feldspar Concentrate. Hirschau.
Anzaplan. (2015). Analysis of Nb/Ta in Magnetic Fraction of Separation Rapids Ore. Hirschau.
Anzaplan. (2015). Pretests Pilot Scale Sample Production of Petalite and Feldspar Concentrates. Hirschau.
Anzaplan. (2015). Testing and characterization of a feldspar filler. Hirschau.
Anzaplan. (2016). Evaluation of HPQ Potential of Flotation Tailings from the Big Whopper Pegmatite. Hirschau.
Anzaplan. (2016). Parameter Study Petalite Flotation – Part 1 Flotation Tailings. Hirschau.
Anzaplan. (2016). Pilot Scale Sample Production of 1 t Petalite Concentrate. Hirschau.
Anzaplan. (2016). Sample Production – Feldspar Filler. Hirschau.
Anzaplan. (2016). Testing of Feldspar sample as potential paint filler. Hirschau.
Anzaplan. (2017). Parameter Study Petalite Flotation – Part 2. Hirschau.
Anzaplan. (2017). Support and Test Work for Separation Rapids Project. Hirschau.
269
Anzaplan. (2018). Flotation of Lithium Mica. Hirschau.
Anzaplan. (2018). Sodium and Potassium Reduction in Petalite Concentrate. Hirschau.
Avalon Ventures Ltd: (1998) 1997-1998 Exploration Program: The Big Whopper Rare Metals Pegmatite, Separation Rapids Property, Kenora Mining Division, Ontario (NTS 52 L7/SE) Thunder Bay, 34 pp.
Avalon Rare Metals Inc., 2009: Report on Work – Claim 4221036, Separation Rapids Property, Kenora Mining Division, Assessment report filed with Ontario Government 7 December, 2009.
Avalon Advanced Materials Inc., 2001: “Exploration Update: Drilling Commences on Raleigh Lake Tantalum Project, New PGE Prospect Acquired”, news release, 25 July, 2001.
Avalon Advanced Materials Inc., 2017: “Testwork Confirms Potential to Recover Battery Grade Lithium Carbonate Product from Lepidolite Mineralization at Avalon’s Separation Rapids Lithium Project, Kenora, Ontario”, news release, 6 February, 2017.
Avalon Advanced Materials Inc., 2018: “Avalon Announces Updated Resource Estimate and Development Plans for Separation Rapids Lithium Project, Kenora, Ontario”, news release, 23 May, 2018.
Avalon Advanced Materials Inc., 2018: “Avalon announces completion of updated PEA for the Separation Rapids Lithium Project, Kenora, ON”, news release, 21 August, 2018.
Avalon Advanced Materials Inc., 2018: “Avalon discovers new lithium pegmatite with grades over 2.5% Li2O at Separation Rapids Lithium Project, Kenora, ON”, news release, 4 September, 2018.
Bradley, D. and McCauley, A., 2013: A preliminary Deposit Model for Lithium-Cesium-Tantalum (LCT) Pegmatites, USGS Open File Report 2013-1008.
Breaks, F. and Tindle, A.G., 1996: New discovery of rare-element pegmatite mineralization, Separation Lake area, Northwestern Ontario. Ontario Geological Survey, Open File Report 5946.
Breaks, F. and Tindle, A.G., 1997: Rare-metal Exploration Potential of the Separation Lake Area: An Emerging Target for Bikita-type Mineralization in the Superior Province of Ontario. Ontario Geological Survey, Open File Report 5966.
Breaks, F. and Tindle, A.G., 1998: Discovery of the Big Whopper Pegmatite, Separation Lake Area of the Kenora District. Poster presented at PDAC Convention. Download at http://www.geologyontario.mndm.gov.on.ca/mndmaccess/mndm_dir.asp?type=pub&id=MR D037.
270
Breaks, F.W. and Tindle A.G., 2001: Rare-element mineralization of the Separation Lake area, northwest Ontario: characteristics of a new discovery of complex-type, petalite subtype, Li-Rb-Cs-Ta pegmatite. CIM Special Volume 53, Industrial Minerals in Canada Vol 1.
Breaks, F., Tindle, A.G., and Smith, S.R., 1999: Geology, Mineralogy and Exploration Potential of the Big Mac Pegmatite System: A Newly Discovered Western Extension of the Separation Rapids Pegmatite Group, NW Ontario. Ontario Geological Survey Open File 6000 Summary of Field Work and Other Activities.
CIM, (Undated), Exploration Best Practices Guidelines, 3 p.
CIM, (2003), Estimation of Mineral Resources and Mineral Reserves, Best Practice Guidelines, 53 p.
CIM, (2014), CIM Definition Standards - For Mineral Resources and Mineral Reserves, 9 p.
erný, P., and Ercit, T.S., 1989: Mineralogy of Niobium and Tantalum: Crystal Chemical Relationships, Paragenetic Aspects and Their Economic Implications. In: Lanthanides, Tantalum and Niobium, Springer-Verlag.
erný, P., and Ercit, T.S., 2005: The Classification of Granitic Pegmatites Revisited, The Canadian Mineralogist, Vol. 43, pp. 2005-2026.
Chastko, L.C., 2001: Report on Rare Element Pegmatite Properties in the Separation, Huston and Linklater Lakes Areas of Northwestern Ontario, Rush Lake-Birse Lake of Southeastern Manitoba for Emerald Fields Resource Corporation.
Clark, J.G. and Siemieniuk, S., 2016: NI 43-101 Technical Report on the Paterson Lake Property, Prepared for GoldON Resources Ltd., 29 March, 2016.
Garrett, D., 2004. Handbook of Lithium and Natural Calcium Chloride: Their Deposits, Processing, Uses and Properties. Elsevier Academic Press, p. 651.
Global Industry Analysts, Inc., 2016: Feldspar, a Global Strategic Business Report, April, 2016.
GoldON Resources, 2016: NI 43-101 Technical Report on the Paterson Lake Property, March 29, 2016.
Hains Technology Associates, 2015: Feldspar Markets and Applications Separation Rapids Petalite Project, July 2015, prepared for Avalon Rare Metals Inc.
271
Hinzer, J.B., 2003: Report on the July 2002 Diamond Drilling Program on the Marcos Pegmatite Zone, Separation Rapids Property of Champion Bear Resources Ltd., 9 October, 2003.
Jaskula, B.W., 2010. Lithium. U.S. geological survey minerals yearbook. http://minerals.usgs.gov/minerals/pubs/commodity/lithium/myb1-2010-lithi.pdf Referenced in Kesler et al (2012).
Kesler, S.E. et al: (2012) Global lithium resources: Relative importance of pegmatite, brine and other deposits, Ore Geology Reviews, Vol. 48, pp 55-69.
Knight Piésold Ltd., 2001: Determination of Feasibility Level Pit Slope Design Parameters”, Ref. No. D2392/1, 9 July 2001.
Knight Piésold Ltd., 2007: “Avalon Ventures Ltd. Separation Rapids Rare Metals Project, Project Description and Environmental Baseline Study Report”, 330 pages, March 16, 2007.
Knight Piésold Ltd., 2013: “Species at Risk Assessment for the Separation Rapids Project”, 11 pages, September 25, 2013.
Knight Piésold Ltd., 2016a, Separation Rapids PEA Conceptual Closure Plan, 16 pages, September 21, 2016.
Knight Piésold Ltd., 2016b: “Separation Rapids Lithium Project – PEA for Tailings, Waste Rock and Water Management, 79 pages, September 28, 2016.
Lakefield Research Limited, 1998: An Investigation of the Recovery of Petalite & Spodumene from the Big Whopper Deposit ore samples submitted by Avalon, Progress Report No.1, December 16, 1998
Lakefield Research Limited, 1999: An Investigation of the Recovery of Soda and Potassium Feldspars from the Big Whopper Deposit Petalite Tailings Submitted by Avalon Ventures Limited, Progress Report 2, 18 May, 1999.
Lepidico Ltd., 2017: “Engineering for Phase 1 Plant Feasibility Study Highlights Potential for Higher Throughput Rates”, ASX/Media Announcement, 22 December, 2017.
Micon International Limited, 1999: Prefeasibility Study, The Big Whopper Petalite Deposit, Separation Rapids Project, Kenora, Ontario, prepared for Avalon Ventures Ltd.
Micon International Limited, 2016: NI 43-101 Technical Report on the Preliminary Economic Assessment of Lithium Hydroxide Production, Separation Rapids Lithium Project, Kenora, Ontario, 10 November, 2016.
272
Mulligan, R., 1965: Geology of Canadian lithium deposits. Geological Survey of Canada, Economic Geology Report 21.
Pearse, G., 1998: Market Study for Separation Rapids Rare-Metal Pegmatite Products. Confidential Report for Avalon. Prepared by Equapolar Resources Consultants, Ottawa.
Pearson, Hoffman and Associates (1999) Big Whopper Project Separation Rapids Ontario, Canada
Pedersen, J.C., 1997: X-ray Diffraction and Electron Microprobe Analysis of Four Samples of Petalite Pegmatite from the Big Whopper Pegmatite; internal company report for Avalon Ventures Ltd.
Pedersen, J.C., 1998a: Geological Report 1997-98 Volume 1, Exploration Program, The Big Whopper Rare Metals Pegmatite, Separation Rapids Property, Kenora Mining Division, Ontario, Volumes II-VI appendices.
Pedersen, J.C., 1998b: Detailed Outcrop Map of Separation Rapids Lithium Deposit. Unpublished map.
Pedersen, J.C., 2016a: Compilation of estimated mineral contents for Unit 6, Subunits 6a, 6b, 6c, 6d, Internal Avalon Confidential Information.
Pedersen, J.C., 2016b: Personal communication.
Pedersen, J.C., 2016c: Memo on Acid Rock Drainage (ARD) Core Samples from Separation Rapids, January, 2016.
Ramsay, J.G., 1962: Interference patterns produced by the superposition of folds of similar types, J. Geol., 70: 466-481.
SGS Canada Inc., 2013: An Investigation by High Definition Mineralogy into the Mineralogical Characteristics of one REE [sic, incorrect] Sample, Prepared for Avalon Rare Metals -Separation Rapids, (Report on One Bulk Sample 0274 With Qemscan) Project CALR-14051-001, MI5010-MAR13.
SRC. (2015/2016). Various Flotation Tests' Analyses. Saskatoon.
Taylor, R. P., 1998: A preliminary mineralogical and geochemical study of the Big Whopper Pegmatite. Confidential report for Avalon.
Taylor, R.P., (1999a): Modal Mineralogy of Selected Drill Core Samples from Big Whopper Pegmatite. Date of report: May 31st, 1999 (Mineralogy of 11 drill core samples).
273
Taylor, R.P., (1999b): Feldspar Analyses from Samples of the Megacrystic Feldspar Zone (Unit 4) and the Wall Zone and Related Albite-rich Dykes (Unit 3A,B), internal memo to Avalon Ventures, dated May 18, 1999.
Taylor, R.P., 2001. A preliminary mineralogical and geochemical study of the Big Whopper pegmatite.
U.S. Geological Survey, 2017: Lithium in 2015 Minerals Yearbook, November, 2017.
U.S. Geological Survey, 2018a: Lithium in Mineral Commodity Summaries, January, 2018.
U.S. Geological Survey, 2018b: Feldspar in 2015 Minerals Yearbook, January, 2018.
U.S. Geological Survey, 2018c: Feldspar in Mineral Commodity Summaries, January, 2018.
Websites
NRCAN calculatorhttp://geomag.nrcan.gc.ca/calc/mfcal-en.php.
The Mineral Deposits and Occurrences/Mineral Deposit Inventory (MDI) of Ontariowww.geologyontario.mndm.gov.on.ca.
Ontario Government Online Claim Databasewww.mci.mndm.gov.on.ca/claims.
Talison Lithium Website (November, 2017):
http://www.marketwired.com/press-release/talison-lithium-more-than-doubles-mineral-reserves-significantly-increases-mine-life-tsx-tlh-1509842.htm (March 31, 2011).
http://www.marketwired.com/press-release/talison-lithium-reports-first-quarter-fiscal-year-2013-results-tsx-tlh-1726151.htm (2013).
http://www.ga.gov.au/data-pubs/data-and-publications-search/publications/aimr/lithium Australia’s Identified Mineral Resources (2012).
United States Geological Surveywww.water.usgs.gov/osw/gps/.
274
| 29.0 | CERTIFICATES |
275
CERTIFICATE OF QUALIFIED PERSON
Christopher Jacobs, CEng, MIMMM
As the co-author of this report for Avalon Advanced Materials Inc. (Avalon) entitled “NI 43-101 Technical Report on the Preliminary Economic Assessment of the Production of Petalite Concentrate from the Separation Rapids Lithium Project Kenora, Ontario”, effective dated August 21, 2018, I, Christopher Jacobs, do hereby certify that:
| 1. | I am employed as a Vice President and Mining Economist by, and carried out this assignment for, Micon International Limited, 900 – 390 Bay Street, Toronto, Ontario M5H 2Y2. tel. (416) 362-5135, email:cjacobs@micon-international.com. | |
| 2. | I hold the following academic qualifications: |
B.Sc. (Hons) Geochemistry, University of Reading, 1980;
M.B.A., Gordon Institute of Business Science, University of Pretoria, 2004.
| 3. | I am a Chartered Engineer registered with the Engineering Council of the U.K. |
(registration number 369178).
| 4. | Also, I am a professional member in good standing of: The Institute of Materials, Minerals and Mining; and The Canadian Institute of Mining, Metallurgy and Petroleum (Member). | |
| 5. | I have worked in the minerals industry for more than 35 years; my work experience includes 10 years as an exploration and mining geologist on gold, platinum, copper/nickel and chromite deposits; 10 years as a technical/operations manager in both open-pit and underground mines; 3 years as strategic (mine) planning manager and the remainder as an independent consultant when I have worked on a variety of deposits including cobalt, copper and gold. | |
| 6. | I have not visited the Property that is the subject of this report. | |
| 7. | I am responsible for Section 22 of this Technical Report. | |
| 8. | I am independent of Avalon and related entities, as defined in Section 1.5 of NI 43-101. | |
| 9. | I was a QP for the previous PEA on the Separation Rapids Project dated 10 November, 2016. | |
| 10. | I have read NI 43-101 and the Sections of this report for which I am responsible have been prepared in compliance with the instrument. | |
| 11. | As of the date of this certificate to the best of my knowledge, information and belief, the sections of this Technical Report for which I am responsible contain all scientific and technical information that is required to be disclosed to make this report not misleading. |
Report Date: September 26, 2018
Effective Date of PEA: August 21, 2018
Effective Date of Updated Mineral Resource Estimates: May 23, 2018
“Christopher Jacobs” {signed and sealed}
Christopher Jacobs, CEng, MIMMM
276
CERTIFICATE OF QUALIFIED PERSON
Richard Gowans, P.Eng.
As the co-author of this report for Avalon Advanced Materials Inc. (Avalon) entitled “NI 43-101 Technical Report on the Preliminary Economic Assessment of the Production of Petalite Concentrate from the Separation Rapids Lithium Project Kenora, Ontario”, effective dated August 21, 2018, I, Richard Gowans, do hereby certify that:
| 1. | I am employed as the President and Principal Metallurgist by, and carried out this assignment for Micon International Limited, Suite 900, 390 Bay Street Toronto, Ontario, M5H 2Y2. tel. (416) 362- 5135 fax (416) 362-5763 e-mail:rgowans@micon-international.com | |
| 2. | I hold the following academic qualifications: |
B.Sc. (Hons) Minerals Engineering, The University of Birmingham, U.K., 1980
| 3. | I am a registered Professional Engineer of Ontario (membership number 90529389); as well, I am a member in good standing of the Canadian Institute of Mining, Metallurgy and Petroleum. | |
| 4. | I have worked as an extractive metallurgist in the minerals industry for over 35 years. Throughout my career I have worked on and managed a wide assortment of feasibility studies and technical audits on international industrial mineral, precious and base metal projects. | |
| 5. | I do, by reason of education, experience and professional registration, fulfill the requirements of a Qualified Person as defined in NI 43-101. My work experience includes the management of technical studies and design of numerous metallurgical testwork programs and metallurgical processing plants. | |
| 6. | I visited the Property on 21 July, 2016. | |
| 7. | I am responsible for Sections 1, 2, 3, 4, 5, 13, 17, 18, 21, 25 and 26 of this Technical Report. | |
| 8. | I am independent of Avalon and related entities, as defined in Section 1.5 of NI 43-101. | |
| 9. | I was a QP for the previous PEA on the Separation Rapids Project dated 10 November, 2016... | |
| 10. | I have read NI 43-101 and the Sections of this report for which I am responsible have been prepared in compliance with the instrument. | |
| 11. | As of the date of this certificate to the best of my knowledge, information and belief, the sections of this Technical Report for which I am responsible contain all scientific and technical information that is required to be disclosed to make this report not misleading. |
Report Date: September 26, 2018
Effective Date of PEA: August 21, 2018
Effective Date of Updated Mineral Resource Estimates: May 23, 2018
“Richard Gowans” {signed and sealed}
Richard Gowans, B.Sc., P.Eng.
277
CERTIFICATE OF QUALIFIED PERSON
Bruce Pilcher, CEng, FIMMM, FAusIMMCP(Min)
As the co-author of this report for Avalon Advanced Materials Inc. (Avalon) entitled “NI 43-101 Technical Report on the Preliminary Economic Assessment of the Production of Petalite Concentrate from the Separation Rapids Lithium Project Kenora, Ontario”, effective dated August 21, 2018, I, Bruce Pilcher, do hereby certify that:
| 1. | I am employed as a Senior Mining Engineer by, and carried out this assignment for, Micon International Co Limited, Tremough Innovation Centre, Tremough Campus, Penryn, Cornwall, UK TR10 9TA. tel. +44 1326 567 338 e-mail:bpilcher@micon-international.com | |
| 2. | I hold the following academic qualifications: |
Bachelor of Engineering (Mining), University of Sydney.
| 3. | I am a Chartered Mining Engineer in UK and Australia (CEng & CP(Min)), as well as a European Engineer (Eur Ing). I am also a fellow of Australasian Institute of Mining & Metallurgy (FAusIMM), the Institution of Materials, Minerals & Mining U.K. (FIMMM). | |
| 4. | I have worked in the minerals industry for over 20 years across the coal, iron ore, industrial minerals, and base and precious metals sectors. | |
| 5. | I do, by reason of education, experience and professional registration, fulfill the requirements of a Qualified Person as defined in NI 43-101. My work experience includes 30 years’ experience in underground and surface mining operations in South Africa, Australia and UK. As a consultant, I have been involved in numerous due diligence and Independent Engineer assignments relating to gold, uranium and base metal projects in Australia, UK, France, Spain, Germany, Poland and Kyrgyzstan. | |
| 6. | I have not visited the Property that is the subject of this report. | |
| 7. | I am responsible for Sections 15 and 16 of this Technical Report. | |
| 8. | I am independent of Avalon and related entities, as defined in Section 1.5 of NI 43-101. | |
| 9. | I was a QP for the previous PEA on the Separation Rapids Project dated 10 November, 2016. | |
| 10. | I have read NI 43-101 and the Sections of this report for which I am responsible have been prepared in compliance with the instrument. | |
| 11. | As of the date of this certificate to the best of my knowledge, information and belief, the sections of this Technical Report for which I am responsible contain all scientific and technical information that is required to be disclosed to make this report not misleading. |
Report Date: September 26, 2018
Effective Date of PEA: August 21, 2018
Effective Date of Updated Mineral Resource Estimates: May 23, 2018
“Bruce Pilcher” {signed and sealed}
Bruce Pilcher, CEng, FIMMM, FAusIMMCP(Min)
278
CERTIFICATE OF QUALIFIED PERSON
William Mercer, PhD, P. Geo.
As the co-author of this report for Avalon Advanced Materials Inc. (Avalon) entitled “NI 43-101 Technical Report on the Preliminary Economic Assessment of the Production of Petalite Concentrate from the Separation Rapids Lithium Project Kenora, Ontario”, effective dated August 21, 2018, I, William Mercer, do hereby certify that:
| 1. | I am employed as the Vice President, Exploration by Avalon Advanced Materials Inc. (Avalon) at Suite 1901, 130 Adelaide Street West, Toronto, Ontario, M5H 3P5, telephone 416 364 4938, email bmercer@avalonam.com | |
| 2. | I hold the following academic qualifications: |
BSc (Geology), Edinburgh University, 1968
PhD (Geology), McMaster University, 1975
| 3. | I am a member of the Association of Professional Geoscientists of Nova Scotia (membership number 166) and the Association of Professional Geoscientists of Ontario (membership number 0186). | |
| 4. | I have worked in mineral exploration for over 40 years. | |
| 5. | I do, by reason of education, experience and professional registration, fulfill the requirements of a Qualified Person as defined in NI 43-101. My work experience includes field exploration and senior level supervision as manager and chief geologist of exploration in Canada, Latin America and elsewhere for commodities including base and precious metals, industrial and specialty minerals, bauxite and uranium; operating mine due diligence assessments and project management. | |
| 6. | I visited the Property that is the subject of this report on numerous occasions between 2014 and 2017. | |
| 7. | I am responsible for Section 14 of this Technical Report. | |
| 8. | I am not independent of Avalon and related entities, as defined in Section 1.5 of NI 43-101. | |
| 9. | I have worked on or been associated with the Property since 2007. | |
| 10. | I have read NI 43-101 and the Sections of this report for which I am responsible have been prepared in compliance with the instrument. | |
| 11. | As of the date of this certificate to the best of my knowledge, information and belief, the sections of this Technical Report for which I am responsible contain all scientific and technical information that is required to be disclosed to make this report not misleading. |
Report Date: September 26,
2018 Effective Date of PEA: August 21, 2018
Effective Date of Updated Mineral Resource Estimates: May 23, 2018
“William Mercer” {signed and sealed}
William Mercer, PhD, P.Geo.
279
CERTIFICATE OF QUALIFIED PERSON
Jane Spooner, M.Sc., P.Geo.
As the co-author of this report for Avalon Advanced Materials Inc. (Avalon) entitled “NI 43-101 Technical Report on the Preliminary Economic Assessment of the Production of Petalite Concentrate from the Separation Rapids Lithium Project Kenora, Ontario”, effective dated August 21, 2018, I, Jane Spooner, do hereby certify that:
| 1. | I am employed as an Associate Specialist in Mineral Market Analysis and carried out this assignment for |
Micon International Limited
Suite 900, 390 Bay Street
Toronto, Ontario M5H 2Y2
tel. (416) 362-5135 fax (416) 362-5763
e-mail:jspooner@micon-international.com
| 2. | I hold the following academic qualifications: |
B.Sc. (Hons) Geology, University of Manchester, U.K. 1972
M.Sc. Environmental Resources, University of Salford, U.K. 1973
| 3. | I am a member of the Association of Professional Geoscientists of Ontario (membership number 0990); as well, I am a member in good standing of the Canadian Institute of Mining, Metallurgy and Petroleum. | |
| 4. | I have worked as a specialist in mineral market analysis for over 30 years. | |
| 5. | I do, by reason of education, experience and professional registration, fulfill the requirements of a Qualified Person as defined in NI 43-101. My work experience includes the analysis of markets for base and precious metals, industrial and specialty minerals, coal and uranium; project due diligence assessments and project management. | |
| 6. | I have not visited the Property that is the subject of this report. | |
| 7. | I am responsible for Section 19 of this Technical Report. | |
| 8. | I am independent of Avalon and related entities, as defined in Section 1.5 of NI 43-101. | |
| 9. | I was a QP for the previous PEA on the Separation Rapids Project dated 10 November, 2016. | |
| 10. | I have read NI 43-101 and the Sections of this report for which I am responsible have been prepared in compliance with the instrument. | |
| 11. | As of the date of this certificate to the best of my knowledge, information and belief, the sections of this Technical Report for which I am responsible contain all scientific and technical information that is required to be disclosed to make this report not misleading. |
Report Date: September 26, 2018
Effective Date of PEA: August 21, 2018
Effective Date of Updated Mineral Resource Estimates: May 23, 2018
“Jane Spooner” {signed and sealed}
Jane Spooner, M.Sc., P.Geo.
280
CERTIFICATE OF QUALIFIED PERSON
Steven R. Aiken, P.Eng.
As the co-author of this report for Avalon Advanced Materials Inc. (Avalon) entitled “NI 43-101 Technical Report on the Preliminary Economic Assessment of the Production of Petalite Concentrate from the Separation Rapids Lithium Project Kenora, Ontario”, effective dated August 21, 2018, I, Steven R. Aiken, do hereby certify that:
| 1. | I am employed by, and carried out this assignment for Knight Piésold Ltd, 1650 Main Street West, North Bay, Ontario P1B 8G5, tel. (705) 476-2165 fax (705) 474-8095, e-mail:saiken@knightpiesold.com. | |
| 2. | I hold the following academic qualifications: |
B.A.Sc. (Honours) Geological Engineering, University of Waterloo, Waterloo, ON. 1990
| 3. | I am a licenced member of the Association of Professional Engineers of Ontario (Registration No. 90340902) and with The Association of Professional Engineers, Geologists and Geophysicists of the Northwest Territories (Registration No. LI651); as well, I am a member in good standing of the following organizations; Prospectors and Developers Association of Canada (PDAC) and the Ontario Mining Association (OMA). | |
| 4. | I have worked as an engineer servicing the mining industry for over 24 years. | |
| 5. | I do, by reason of education, experience and professional registration, fulfill the requirements of a Qualified Person as defined in NI 43-101. My work experience includes engineering, environmental site assessments, waste characterization studies, contaminated site remediation, hydrogeological studies, environmental baseline studies, community consultation, landfill design and monitoring, environmental permitting, mine closure planning, ESIAs, site supervision and project management. | |
| 6. | I have not visited the project site. | |
| 7. | I am responsible for the preparation of Sections 1.15, 20.1, 20.2, 20.3, 20.4, 20.5, 20.6, 20.7, 20.8, 20.9, 20.10, 20.11, 20.12, 20.14, 20.16, 20.17 and parts of 26.2.5 of this report entitled '”NI 43-101 Technical Report on the Preliminary Economic Assessment for the Production of Petalite Concentrate from the Separation Rapids Lithium Deposit, Kenora, Ontario”, dated September, 2018. | |
| 8. | I am independent of Avalon Advanced Materials Inc., as described in Section 1.5 of NI 43-101. | |
| 9. | I have had no prior involvement with the mineral property in question. | |
| 10. | I have read NI 43-101 and the portions of this report for which I am responsible have been prepared in compliance with the instrument. | |
| 11. | As of the date of this certificate, to the best of my knowledge, information and belief, the sections of this Technical Report for which I am responsible contain all scientific and technical information that is required to be disclosed to make this report not misleading. |
Report Date: September 26, 2018
Effective Date of PEA: August 21, 2018
Effective Date of Updated Mineral Resource Estimates: May 23, 2018
“Steven R. Aiken” {signed and sealed}
Steven R. Aiken, P.Eng.
281
CERTIFICATE OF QUALIFIED PERSON
Kevin E. Hawton, P.Eng.
As the co-author of this report for Avalon Advanced Materials Inc. (Avalon) entitled “NI 43-101 Technical Report on the Preliminary Economic Assessment of the Production of Petalite Concentrate from the Separation Rapids Lithium Project Kenora, Ontario”, effective dated August 21, 2018, I, Kevin E. Hawton, do hereby certify that:
| 1. | I am employed by, and carried out this assignment for Knight Piésold Ltd, 1650 Main Street West, North Bay, Ontario P1B 8G5, tel. (705) 476-2165 fax (705) 474-8095, e-mail:khawton@knightoiesold.com | |
| 2. | I hold the following academic qualifications: |
B.Eng., Civil Engineering, Ryerson University, Toronto, ON. 1993
| 3. | I am a licenced member of the Association of Professional Engineers of Ontario (Registration No. 90402694) and with The Association of Professional Engineers, Geologists and Geophysicists of the Northwest Territories (Registration No. L1733); as well, I am a member in good standing of the following organizations; The Canadian Geotechnical Society (CGS), Canadian Society for Civil Engineering (CSCE), Prospectors and Developers Association of Canada, International Society for Soil Mechanics and Geotechnical Engineering (ISSMGE) and International Permafrost Association (IP A). | |
| 4. | I have worked as a consultant engineer servicing the mining industry for over 24 years. | |
| 5. | I do, by reason of education, experience and professional registration, fulfill the requirements of a Qualified Person as defined in NI 43-101. My work experience includes geotechnical engineering for the mining industry and the planning, design and construction of tailings and water management facilities. | |
| 6. | I have not visited the project site. | |
| 7. | I am responsible for the preparation of Sections 20.13, 20.15 and parts of 26.2.5 of this report entitled ''NI 43-101 Technical Report on the Preliminary Economic Assessment for the Production of Petalite Concentrate from the Separation Rapids Lithium Deposit, Kenora, Ontario", dated September ,2018. | |
| 8. | I am independent of Avalon Advanced Materials Inc., as described in Section 1.5 of NI 43-101. | |
| 9. | I have had no prior involvement with the mineral property in question. | |
| 10. | I have read NI 43-101 and the portions of this report for which lam responsible have been prepared in compliance with the instrument. | |
| 11. | As of the date of this certificate, to the best of my knowledge, information and belief, the sections of this Technical Report for which I am responsible contain all scientific and technical information that is required to be disclosed to make this report not misleading. |
Report Date: September 26, 2018
Effective Date of PEA: August 21, 2018
Effective Date of Updated Mineral Resource Estimates: May 23, 2018
“Kevin E. Hawton” {signed and sealed}
Kevin E. Hawton, P.Eng.
282