United States
Securities and Exchange Commission
Washington, D.C. 20549
Form N-CSR
Certified Shareholder Report of Registered Management Investment Companies
811-21904
(Investment Company Act File Number)
Federated MDT Series
_______________________________________________________________
(Exact Name of Registrant as Specified in Charter)
Federated Investors Funds
4000 Ericsson Drive
Warrendale, Pennsylvania 15086-7561
(Address of Principal Executive Offices)
(412) 288-1900
(Registrant's Telephone Number)
Peter J. Germain, Esquire
Federated Investors Tower
1001 Liberty Avenue
Pittsburgh, Pennsylvania 15222-3779
(Name and Address of Agent for Service)
(Notices should be sent to the Agent for Service)
Date of Fiscal Year End: 07/31/18
Date of Reporting Period: 07/31/18
| Item 1. | Reports to Stockholders |

| Share Class | Ticker | A | QAACX | C | QCACX | Institutional | QIACX | R6 | QKACX |

| 1 | Please see the footnotes to the line graphs below for definitions of, and further information about, the Russell 3000® Index. |
| 2 | Morningstar has assigned the Fund to the Morningstar Large Cap Value Funds Average peer group, however, the MLBFA is being used for comparison purposes. The Fund invests in both value and growth stocks and therefore the Fund's Adviser believes that the MLBFA is more reflective of the Fund's investment style. Please see the footnotes to the line graphs below for definitions of, and further information about, the MLBFA. |
| 3 | Small-cap stocks may be less liquid and subject to greater price volatility than large-cap stocks. |
| 4 | The Russell Microcap® Index measures the performance of the microcap segment of the U.S. equity market. Microcap stocks make up less than 3% of the U.S. equity market (by market cap) and consist of the smallest 1,000 securities in the small-cap Russell 2000® Index, plus the next 1,000 smallest eligible securities by market cap. The Russell Microcap® Index is constructed to provide a comprehensive and unbiased barometer for the microcap segment trading on national exchanges and is completely reconstituted annually to ensure new and growing equities are reflected and companies continue to reflect appropriate capitalization and value characteristics.* |
| 5 | The Russell 2000® Index measures the performance of the small-cap segment of the U.S. equity universe. The Russell 2000® Index is a subset of the Russell 3000® Index representing approximately 10% of the total market capitalization of that index. It includes approximately 2000 of the smallest securities based on a combination of their market cap and current index membership. The Russell 2000® Index is constructed to provide a comprehensive and unbiased small-cap barometer and is completely reconstituted annually to ensure larger stocks do not distort the performance and characteristics of the true small-cap opportunity set.* |
| 6 | The Russell Top 200® Index measures the performance of the largest cap segment of the U.S. equity universe. The Russell Top 200® Index is a subset of the Russell 3000® Index. It includes approximately 200 of the largest securities based on a combination of their market cap and current index membership and represents approximately 68% of the U.S. market. The Russell Top 200® Index is constructed to provide a comprehensive and unbiased barometer for this very large cap segment and is completely reconstituted annually to ensure new and growing equities are reflected.* |
| 7 | The Russell Midcap® Index measures the performance of the mid-cap segment of the U.S. equity universe. The Russell Midcap® Index is a subset of the Russell 1000® Index. It includes approximately 800 of the smallest securities based on a combination of their market cap and current index membership. The Russell Midcap® Index represents approximately 31% of the total market capitalization of the Russell 1000® companies. The Russell Midcap® Index is constructed to provide a comprehensive and unbiased barometer for the mid-cap segment. The Russell Midcap Index is completely reconstituted annually to ensure larger stocks do not distort the performance and characteristics of the true mid-cap opportunity set.* |
| 8 | The Russell 3000® Growth Index measures the performance of the broad growth segment of the U.S. equity universe. It includes those Russell 3000® Index companies with higher price-to-book ratios and higher forecasted growth values. The Russell 3000® Growth Index is constructed to provide a comprehensive, unbiased and stable barometer of the broad growth market. The Russell 3000 Growth Index is completely reconstituted annually to ensure new and growing equities are included and that the represented companies continue to reflect growth characteristics.* |
| 9 | The Russell 3000® Value Index measures the performance of the broad value segment of U.S. equity value universe. It includes those Russell 3000® Index companies with lower price-to-book ratios and lower forecasted growth values. The Russell 3000® Value Index is constructed to provide a comprehensive, unbiased and stable barometer of the broad value market. The Russell 3000 Value Index is completely reconstituted annually to ensure new and growing equities are included and that the represented companies continue to reflect value characteristics.* |
| * | The index is unmanaged, and it is not possible to invest directly in an index. |
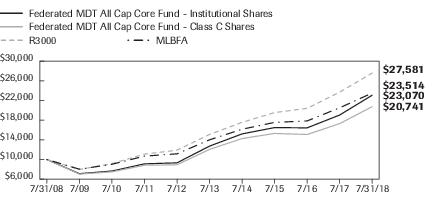
| Federated MDT All Cap Core Fund - | Institutional Shares | Class C Shares | R3000 | MLBFA |
| F | F | I | I | |
| 7/31/2008 | 10,000 | 10,000 | 10,000 | 10,000 |
| 7/31/2009 | 7,116 | 7,036 | 7,979 | 8,024 |
| 7/31/2010 | 7,652 | 7,481 | 9,161 | 9,024 |
| 7/31/2011 | 9,116 | 8,828 | 11,079 | 10,684 |
| 7/31/2012 | 9,320 | 8,930 | 11,891 | 11,150 |
| 7/31/2013 | 12,718 | 12,055 | 15,086 | 14,000 |
| 7/31/2014 | 15,203 | 14,255 | 17,555 | 16,152 |
| 7/31/2015 | 16,487 | 15,297 | 19,536 | 17,545 |
| 7/31/2016 | 16,431 | 15,078 | 20,405 | 17,839 |
| 7/31/2017 | 19,042 | 17,297 | 23,697 | 20,510 |
| 7/31/2018 | 23,070 | 20,741 | 27,581 | 23,514 |
| ■ | Total returns shown for the Class C Shares include the maximum contingent deferred sales charge of 1.00% as applicable. |
| 1 Year | 5 Years | 10 Years | |
| Class A Shares | 14.15% | 11.06% | 7.80% |
| Class C Shares | 18.91% | 11.46% | 7.57% |
| Institutional Shares | 21.15% | 12.65% | 8.72% |
| Class R6 Shares4 | 21.17% | 12.14% | 8.06% |
| R3000 | 16.39% | 12.83% | 10.68% |
| MLBFA | 14.60% | 11.39% | 9.60% |
| 1 | Represents a hypothetical investment of $10,000 in the Fund after deducting applicable sales charges: for Class A Shares, the maximum sales charge of 5.50% ($10,000 investment minus $550 sales charge = $9,450); for Class C Shares a 1.00% contingent deferred sales charge would be applied on any redemption less than one year from the purchase date. The Fund's performance assumes the reinvestment of all dividends and distributions. The R3000 and MLBFA have been adjusted to reflect reinvestment of dividends of securities. |
| 2 | The R3000 measures the performance of the largest 3,000 U.S. companies representing approximately 98% of the investable U.S. equity market. The R3000 is constructed to provide a comprehensive, unbiased, and stable barometer of the broad market and is completely reconstituted annually to ensure new and growing equities are reflected. The index is unmanaged and, unlike the Fund, is not affected by cash flows. It is not possible to invest directly in an index. The R3000 is not adjusted to reflect sales charges, expenses or other fees that the Securities and Exchange Commission requires to be reflected in the Fund's performance. |
| 3 | Morningstar figures represent the average of the total returns reported by all the funds designated by Morningstar as falling into the respective category indicated. They do not reflect sales charges. The Morningstar figures in the Growth of $10,000 line graph are based on historical return information published by Morningstar and reflect the return of the funds comprising the category in the year of publication. Because the funds designated by Morningstar as falling into the category can change over time, the Morningstar figures in the line graph may not match the Morningstar figures in the Average Annual Total Returns table, which reflect the return of the funds that currently comprise the category. |
| 4 | Prior to September 1, 2016, Class R6 Shares were known as Class R Shares and included 12b-1 fees and certain other expenses. As of September 1, 2016, Class R6 does not include such 12b-1 fees and certain other expenses, and the performance shown above for Class R6 prior to September 1, 2016, reflects the higher Class R expenses. |
| Sector Composition | Percentage of Total Net Assets |
| Information Technology | 23.8% |
| Financials | 15.3% |
| Health Care | 14.8% |
| Consumer Discretionary | 12.0% |
| Industrials | 11.3% |
| Energy | 6.7% |
| Consumer Staples | 6.2% |
| Utilities | 3.7% |
| Materials | 2.0% |
| Telecommunication Services | 1.5% |
| Securities Lending Collateral2 | 0.4% |
| Cash Equivalents3 | 2.5% |
| Other Assets and Liabilities—Net4 | (0.2)% |
| TOTAL | 100.0% |
| 1 | Except for Cash Equivalents and Other Assets and Liabilities, sector classifications are based upon, and individual portfolio securities are assigned to, the classifications of the Global Industry Classification Standard (GICS) except that the Adviser assigns a classification to securities not classified by the GICS and to securities for which the Adviser does not have access to the classification made by the GICS. |
| 2 | Represents cash collateral received for portfolio securities on loan that may be invested in affiliated money market funds, other money market instruments and/or repurchase agreements. |
| 3 | Cash Equivalents include any investments in money market mutual funds and/or overnight repurchase agreements other than those representing cash collateral for securities lending. |
| 4 | Assets, other than investments in securities, less liabilities. See Statement of Assets and Liabilities. |
| Shares | Value | ||
| COMMON STOCKS—97.3% | |||
| Consumer Discretionary—12.0% | |||
| 8,000 | Abercrombie & Fitch Co., Class A | $189,520 | |
| 2,100 | 1 | Adtalem Global Education, Inc. | 114,555 |
| 4,970 | 1 | American Outdoor Brands Corp. | 47,066 |
| 2,528 | 1 | AutoZone, Inc. | 1,783,580 |
| 16,403 | Bed Bath & Beyond, Inc. | 307,228 | |
| 2,900 | Big Lots, Inc. | 125,947 | |
| 72 | 1 | Booking Holdings, Inc. | 146,068 |
| 2,381 | 1 | Burlington Stores, Inc. | 363,841 |
| 1,019 | Children's Place, Inc./The | 125,235 | |
| 30,934 | D. R. Horton, Inc. | 1,351,816 | |
| 20,541 | 1 | DISH Network Corp., Class A | 648,274 |
| 5,980 | 2 | Dillards, Inc., Class A | 480,015 |
| 768 | 1 | Five Below, Inc. | 74,619 |
| 3,583 | Foot Locker, Inc. | 174,886 | |
| 35,900 | Ford Motor Co. | 360,436 | |
| 9,671 | 1 | Fossil, Inc. | 253,380 |
| 10,736 | 1,2 | GNC Holdings, Inc. | 34,140 |
| 5,982 | 2 | GameStop Corp. | 86,201 |
| 15,020 | Gap (The), Inc. | 453,153 | |
| 15,062 | Goodyear Tire & Rubber Co. | 364,651 | |
| 3,481 | 1 | Helen of Troy Ltd. | 398,749 |
| 10,569 | 1 | Iconix Brand Group, Inc. | 5,496 |
| 17,820 | Kohl's Corp. | 1,316,363 | |
| 21,015 | Las Vegas Sands Corp. | 1,510,979 | |
| 3,734 | Lear Corp. | 672,605 | |
| 3,400 | Libbey, Inc. | 32,572 | |
| 7,361 | 1 | Live Nation Entertainment, Inc. | 362,750 |
| 5,708 | 1 | Lululemon Athletica, Inc. | 684,675 |
| 43,653 | 1 | MSG Networks, Inc. | 1,028,028 |
| 17,948 | Macy's, Inc. | 713,074 | |
| 3,853 | 1 | NetFlix, Inc. | 1,300,195 |
| 10,017 | Royal Caribbean Cruises Ltd. | 1,129,517 | |
| 8,631 | 1 | Skechers USA, Inc., Class A | 239,251 |
| 4,151 | Tailored Brands, Inc. | 83,684 | |
| 6,386 | Target Corp. | 515,222 |
| Shares | Value | ||
| COMMON STOCKS—continued | |||
| Consumer Discretionary—continued | |||
| 8,419 | Toll Brothers, Inc. | $296,854 | |
| 7,554 | Tupperware Brands Corp. | 277,307 | |
| 704 | 1 | Ulta Beauty, Inc. | 172,051 |
| 1,754 | V.F. Corp. | 161,491 | |
| 4,631 | Vail Resorts, Inc. | 1,282,185 | |
| 29,963 | Viacom, Inc., Class B | 870,425 | |
| 20,815 | Walt Disney Co. | 2,363,751 | |
| 12,489 | Wyndham Destinations, Inc. | 575,993 | |
| TOTAL | 23,477,828 | ||
| Consumer Staples—6.2% | |||
| 8,425 | Dean Foods Co. | 82,734 | |
| 23,511 | Estee Lauder Cos., Inc., Class A | 3,172,574 | |
| 7,300 | Fresh Del Monte Produce, Inc. | 264,990 | |
| 1,189 | Ingredion, Inc. | 120,446 | |
| 775 | Kellogg Co. | 55,048 | |
| 34,736 | McCormick & Co., Inc. | 4,082,869 | |
| 26,497 | PepsiCo, Inc. | 3,047,155 | |
| 4,791 | 1 | Post Holdings, Inc. | 414,709 |
| 10,225 | Procter & Gamble Co. | 826,998 | |
| TOTAL | 12,067,523 | ||
| Energy—6.7% | |||
| 22,200 | 1,2 | Chesapeake Energy Corp. | 104,784 |
| 39,112 | Chevron Corp. | 4,938,672 | |
| 44,879 | ConocoPhillips | 3,238,917 | |
| 7,312 | EOG Resources, Inc. | 942,809 | |
| 37,921 | Exxon Mobil Corp. | 3,090,941 | |
| 4,966 | HollyFrontier Corp. | 370,364 | |
| 15,800 | Nabors Industries Ltd. | 94,484 | |
| 11,813 | 1 | Noble Corp. PLC | 68,988 |
| 1,017 | Occidental Petroleum Corp. | 85,357 | |
| 956 | Phillips 66 | 117,913 | |
| 8,200 | 1 | Superior Energy Services, Inc. | 80,688 |
| TOTAL | 13,133,917 | ||
| Financials—15.3% | |||
| 20,225 | Allstate Corp. | 1,923,802 | |
| 26,745 | Ally Financial, Inc. | 715,696 | |
| 21,412 | Assured Guaranty Ltd. | 833,355 | |
| 7,499 | 1 | Athene Holding Ltd. | 343,979 |
| Shares | Value | ||
| COMMON STOCKS—continued | |||
| Financials—continued | |||
| 927 | BB&T Corp. | $47,101 | |
| 19,891 | Bank of America Corp. | 614,234 | |
| 2,395 | Capital One Financial Corp. | 225,896 | |
| 8,388 | Citizens Financial Group, Inc. | 333,675 | |
| 518 | Comerica, Inc. | 50,215 | |
| 17,442 | 1 | E*Trade Group, Inc. | 1,043,206 |
| 1,876 | Everest Re Group Ltd. | 409,625 | |
| 29,600 | Fifth Third Bancorp | 875,864 | |
| 17,200 | Huntington Bancshares, Inc. | 265,568 | |
| 35,447 | JPMorgan Chase & Co. | 4,074,633 | |
| 30,200 | KeyCorp | 630,274 | |
| 3,716 | M & T Bank Corp. | 644,169 | |
| 25,900 | Navient Corp. | 342,139 | |
| 6,638 | Northern Trust Corp. | 725,002 | |
| 17,228 | PNC Financial Services Group | 2,495,131 | |
| 9,100 | Popular, Inc. | 451,633 | |
| 46,283 | Prudential Financial, Inc. | 4,670,417 | |
| 12,555 | State Street Corp. | 1,108,732 | |
| 29,199 | SunTrust Banks, Inc. | 2,104,372 | |
| 38,985 | The Travelers Cos., Inc. | 5,073,508 | |
| TOTAL | 30,002,226 | ||
| Health Care—14.8% | |||
| 4,459 | 1 | Abiomed, Inc. | 1,580,849 |
| 10,573 | 1 | Align Technology, Inc. | 3,770,861 |
| 982 | 1 | Athenahealth, Inc. | 147,997 |
| 27,067 | Baxter International, Inc. | 1,961,004 | |
| 1,750 | 1 | Bio-Rad Laboratories, Inc., Class A | 536,638 |
| 29,693 | 1 | Celgene Corp. | 2,675,042 |
| 3,336 | Chemed Corp. | 1,054,276 | |
| 27,966 | 1,2 | Community Health Systems, Inc. | 93,406 |
| 2,304 | Dentsply Sirona, Inc. | 110,845 | |
| 49,165 | Eli Lilly & Co. | 4,857,994 | |
| 5,363 | Humana, Inc. | 1,684,947 | |
| 1,701 | 1 | IDEXX Laboratories, Inc. | 416,626 |
| 3,804 | 1 | Illumina, Inc. | 1,233,865 |
| 1,779 | 1 | Inogen, Inc. | 354,466 |
| 21,178 | Johnson & Johnson | 2,806,509 | |
| 8,831 | Merck & Co., Inc. | 581,698 |
| Shares | Value | ||
| COMMON STOCKS—continued | |||
| Health Care—continued | |||
| 3,753 | 1 | Molina Healthcare, Inc. | $390,650 |
| 1,633 | 1 | Orthofix International NV | 98,780 |
| 73,754 | Pfizer, Inc. | 2,944,997 | |
| 10,091 | 1 | Vertex Pharmaceuticals, Inc. | 1,766,430 |
| TOTAL | 29,067,880 | ||
| Industrials—11.3% | |||
| 9,100 | AGCO Corp. | 573,482 | |
| 12,952 | Allison Transmission Holdings, Inc. | 608,744 | |
| 4,639 | 1 | Atlas Air Worldwide Holdings, Inc. | 311,045 |
| 7,800 | 1 | Avis Budget Group, Inc. | 271,830 |
| 1,992 | C.H. Robinson Worldwide, Inc. | 183,722 | |
| 12,874 | CSX Corp. | 909,934 | |
| 12,127 | Caterpillar, Inc. | 1,743,863 | |
| 20,883 | Cintas Corp. | 4,270,156 | |
| 15,252 | 1 | Colfax Corp. | 492,640 |
| 6,577 | 1 | Copart, Inc. | 377,454 |
| 5,789 | 1 | CoStar Group, Inc. | 2,407,356 |
| 2,753 | Cummins, Inc. | 393,156 | |
| 5,086 | Deluxe Corp. | 299,718 | |
| 5,902 | Emerson Electric Co. | 426,596 | |
| 2,386 | Ennis, Inc. | 51,895 | |
| 2,752 | Fortive Corp. | 225,884 | |
| 1,696 | GATX Corp. | 139,649 | |
| 1,509 | Grainger (W.W.), Inc. | 522,959 | |
| 392 | Huntington Ingalls Industries, Inc. | 91,356 | |
| 1,125 | Ingersoll-Rand PLC, Class A | 110,824 | |
| 21,800 | 1 | Jet Blue Airways Corp. | 392,400 |
| 6,829 | Kennametal, Inc. | 266,058 | |
| 65,524 | Paccar, Inc. | 4,306,237 | |
| 14,800 | Pitney Bowes, Inc. | 129,204 | |
| 7,001 | R.R. Donnelley & Sons Co. | 41,306 | |
| 619 | Raytheon Co. | 122,581 | |
| 1,705 | Roper Technologies, Inc. | 514,739 | |
| 14,360 | 1 | SPX Corp. | 532,756 |
| 3,016 | SkyWest, Inc. | 180,658 | |
| 3,898 | 1 | Verisk Analytics, Inc. | 431,197 |
| 3,060 | 1 | WESCO International, Inc. | 186,660 |
| 772 | 1 | XPO Logistics, Inc. | 76,984 |
| Shares | Value | ||
| COMMON STOCKS—continued | |||
| Industrials—continued | |||
| 8,042 | Xylem, Inc. | $615,695 | |
| TOTAL | 22,208,738 | ||
| Information Technology—23.8% | |||
| 13,110 | 1 | Adobe Systems, Inc. | 3,207,755 |
| 7,064 | 1 | Akamai Technologies, Inc. | 531,637 |
| 3,441 | 1 | Alphabet, Inc. | 4,222,864 |
| 1,373 | Analog Devices, Inc. | 132,000 | |
| 25,774 | Apple, Inc. | 4,904,535 | |
| 40,007 | Applied Materials, Inc. | 1,945,540 | |
| 1,025 | 1 | Arrow Electronics, Inc. | 77,736 |
| 4,392 | 1 | eBay, Inc. | 146,912 |
| 20,698 | 1 | Facebook, Inc. | 3,572,061 |
| 9,424 | 1 | First Solar, Inc. | 493,346 |
| 13,957 | 1 | Fortinet, Inc. | 878,035 |
| 44,378 | Hewlett-Packard Co. | 1,024,244 | |
| 9,832 | 1 | IAC Interactive Corp. | 1,447,762 |
| 1,274 | 1 | IPG Photonics Corp. | 208,987 |
| 54,047 | Intel Corp. | 2,599,661 | |
| 3,528 | Intuit, Inc. | 720,559 | |
| 29,317 | Juniper Networks, Inc. | 772,210 | |
| 11,293 | Lam Research Corp. | 2,152,898 | |
| 22,244 | Mastercard, Inc. | 4,404,312 | |
| 3,140 | Nvidia Corp. | 768,860 | |
| 12,774 | NetApp, Inc. | 990,241 | |
| 4,844 | 1 | Palo Alto Networks, Inc. | 960,371 |
| 3,368 | 1 | Paycom Software, Inc. | 357,850 |
| 12,483 | 1 | Red Hat, Inc. | 1,762,974 |
| 27,331 | 1 | Salesforce.com, Inc. | 3,748,447 |
| 4,200 | 1 | Sanmina Corp. | 122,220 |
| 7,265 | 1 | ServiceNow, Inc. | 1,278,349 |
| 22,570 | 1 | Synopsys, Inc. | 2,018,435 |
| 27,428 | Vishay Intertechnology, Inc. | 685,700 | |
| 18,900 | Western Union Co. | 381,024 | |
| 4,425 | Xerox Corp. | 114,917 | |
| TOTAL | 46,632,442 | ||
| Materials—2.0% | |||
| 5,600 | Domtar, Corp. | 270,032 | |
| 10,933 | Ecolab, Inc. | 1,538,273 |
| Shares | Value | ||
| COMMON STOCKS—continued | |||
| Materials—continued | |||
| 12,966 | Newmont Mining Corp. | $475,593 | |
| 2,471 | Reliance Steel & Aluminum Co. | 222,884 | |
| 3,001 | Sherwin-Williams Co. | 1,322,631 | |
| TOTAL | 3,829,413 | ||
| Telecommunication Services—1.5% | |||
| 24,694 | AT&T, Inc. | 789,467 | |
| 27,436 | 1 | T-Mobile USA, Inc. | 1,646,160 |
| 8,412 | Verizon Communications, Inc. | 434,396 | |
| TOTAL | 2,870,023 | ||
| Utilities—3.7% | |||
| 24,600 | AES Corp. | 328,656 | |
| 1,264 | Ameren Corp. | 78,444 | |
| 2,648 | Consolidated Edison Co. | 209,007 | |
| 35,406 | Entergy Corp. | 2,877,800 | |
| 24,001 | Exelon Corp. | 1,020,042 | |
| 37,502 | NiSource, Inc. | 981,802 | |
| 40,564 | P G & E Corp. | 1,747,497 | |
| 1,374 | Pinnacle West Capital Corp. | 110,511 | |
| TOTAL | 7,353,759 | ||
| TOTAL COMMON STOCKS (IDENTIFIED COST $171,032,246) | 190,643,749 | ||
| INVESTMENT COMPANIES—2.9% | |||
| 740,143 | Federated Government Obligations Fund, Premier Shares, 1.80%3 | 740,143 | |
| 4,824,255 | Federated Institutional Prime Value Obligations Fund, Institutional Shares, 2.08%3 | 4,825,220 | |
| TOTAL INVESTMENT COMPANIES (IDENTIFIED COST $5,565,282) | 5,565,363 | ||
| TOTAL INVESTMENT IN SECURITIES—100.2% (IDENTIFIED COST $176,597,528)4 | 196,209,112 | ||
| OTHER ASSETS AND LIABILITIES - NET—(0.2)%5 | (330,155) | ||
| TOTAL NET ASSETS—100% | $195,878,957 |
| Federated Government Obligations Fund, Premier Shares* | Federated Institutional Prime Value Obligations Fund, Institutional Shares | Total of Affiliated Transactions | |
| Balance of Shares Held 7/31/2017 | — | 2,025,076 | 2,025,076 |
| Purchases/Additions | 6,306,108 | 57,557,426 | 63,863,534 |
| Sales/Reductions | (5,565,965) | (54,758,247) | (60,324,212) |
| Balance of Shares Held 7/31/2018 | 740,143 | 4,824,255 | 5,564,398 |
| Value | $740,143 | $4,825,220 | $5,565,363 |
| Change in Unrealized Appreciation/Depreciation | N/A | $99 | $99 |
| Net Realized Gain/(Loss) | N/A | $25 | $25 |
| Dividend Income | $5,469 | $50,864 | $56,333 |
| * | All or a portion of the balance/activity for the fund relates to cash collateral received on securities lending transactions. |
| 1 | Non-income-producing security. |
| 2 | All or a portion of these securities are temporarily on loan to unaffiliated broker/dealers. |
| 3 | 7-day net yield. |
| 4 | The cost of investments for federal tax purposes amounts to $176,640,156. |
| 5 | Assets, other than investments in securities, less liabilities. See Statement of Assets and Liabilities. |
| Year Ended July 31 | 2018 | 2017 | 2016 | 2015 | 2014 |
| Net Asset Value, Beginning of Period | $24.95 | $21.77 | $22.10 | $20.47 | $17.26 |
| Income From Investment Operations: | |||||
| Net investment income (loss) | 0.091 | 0.26 | 0.191 | 0.111 | 0.081 |
| Net realized and unrealized gain (loss) | 5.08 | 3.11 | (0.33) | 1.55 | 3.23 |
| TOTAL FROM INVESTMENT OPERATIONS | 5.17 | 3.37 | (0.14) | 1.66 | 3.31 |
| Less Distributions: | |||||
| Distributions from net investment income | (0.11) | (0.19) | (0.19) | (0.03) | (0.10) |
| Net Asset Value, End of Period | $30.01 | $24.95 | $21.77 | $22.10 | $20.47 |
| Total Return2 | 20.78% | 15.56% | (0.61)% | 8.10% | 19.21% |
| Ratios to Average Net Assets: | |||||
| Net expenses | 1.36% | 1.38% | 1.35% | 1.35% | 1.35% |
| Net investment income | 0.31% | 0.69% | 0.94% | 0.51% | 0.41% |
| Expense waiver/reimbursement3 | 0.00%4 | 0.00%4 | 0.03% | 0.00%4 | 0.08% |
| Supplemental Data: | |||||
| Net assets, end of period (000 omitted) | $40,539 | $33,799 | $33,753 | $40,433 | $44,678 |
| Portfolio turnover | 82% | 77% | 62% | 76% | 31% |
| 1 | Per share numbers have been calculated using the average shares method. |
| 2 | Based on net asset value, which does not reflect the sales charge, redemption fee or contingent deferred sales charge, if applicable. |
| 3 | This expense decrease is reflected in both the net expense and the net investment income ratios shown above. |
| 4 | Represents less than 0.01%. |
| Year Ended July 31 | 2018 | 2017 | 2016 | 2015 | 2014 |
| Net Asset Value, Beginning of Period | $23.66 | $20.66 | $21.00 | $19.57 | $16.55 |
| Income From Investment Operations: | |||||
| Net investment income (loss) | (0.11)1 | (0.19) | 0.031 | (0.05)1 | (0.07)1 |
| Net realized and unrealized gain (loss) | 4.82 | 3.23 | (0.33) | 1.48 | 3.09 |
| TOTAL FROM INVESTMENT OPERATIONS | 4.71 | 3.04 | (0.30) | 1.43 | 3.02 |
| Less Distributions: | |||||
| Distributions from net investment income | — | (0.04) | (0.04) | — | — |
| Net Asset Value, End of Period | $28.37 | $23.66 | $20.66 | $21.00 | $19.57 |
| Total Return2 | 19.91% | 14.72% | (1.43)% | 7.31% | 18.25% |
| Ratios to Average Net Assets: | |||||
| Net expenses | 2.09% | 2.13% | 2.14% | 2.11% | 2.15% |
| Net investment income (loss) | (0.41)% | (0.06)% | 0.15% | (0.26)% | (0.38)% |
| Expense waiver/reimbursement3 | 0.00%4 | 0.00%4 | 0.00%4 | 0.00%4 | 0.06% |
| Supplemental Data: | |||||
| Net assets, end of period (000 omitted) | $39,625 | $36,440 | $36,846 | $41,509 | $35,052 |
| Portfolio turnover | 82% | 77% | 62% | 76% | 31% |
| 1 | Per share numbers have been calculated using the average shares method. |
| 2 | Based on net asset value, which does not reflect the sales charge, redemption fee or contingent deferred sales charge, if applicable. |
| 3 | This expense decrease is reflected in both the net expense and the net investment income (loss) ratios shown above. |
| 4 | Represents less than 0.01%. |
| Year Ended July 31 | 2018 | 2017 | 2016 | 2015 | 2014 |
| Net Asset Value, Beginning of Period | $25.24 | $22.02 | $22.37 | $20.71 | $17.45 |
| Income From Investment Operations: | |||||
| Net investment income (loss) | 0.161 | 0.39 | 0.251 | 0.181 | 0.131 |
| Net realized and unrealized gain (loss) | 5.16 | 3.09 | (0.34) | 1.57 | 3.27 |
| TOTAL FROM INVESTMENT OPERATIONS | 5.32 | 3.48 | (0.09) | 1.75 | 3.40 |
| Less Distributions: | |||||
| Distributions from net investment income | (0.19) | (0.26) | (0.26) | (0.09) | (0.14) |
| Net Asset Value, End of Period | $30.37 | $25.24 | $22.02 | $22.37 | $20.71 |
| Total Return2 | 21.15% | 15.90% | (0.34)% | 8.45% | 19.54% |
| Ratios to Average Net Assets: | |||||
| Net expenses | 1.07% | 1.08% | 1.07% | 1.05% | 1.10% |
| Net investment income | 0.57% | 1.01% | 1.22% | 0.80% | 0.65% |
| Expense waiver/reimbursement3 | 0.00%4 | 0.00%4 | 0.00%4 | 0.00%4 | 0.00%4 |
| Supplemental Data: | |||||
| Net assets, end of period (000 omitted) | $95,290 | $52,169 | $65,435 | $76,242 | $62,770 |
| Portfolio turnover | 82% | 77% | 62% | 76% | 31% |
| 1 | Per share numbers have been calculated using the average shares method. |
| 2 | Based on net asset value. |
| 3 | This expense decrease is reflected in both the net expense and the net investment income ratios shown above. |
| 4 | Represents less than 0.01%. |
| Year Ended July 31 | 2018 | 2017 | 2016 | 2015 | 2014 |
| Net Asset Value, Beginning of Period | $24.85 | $21.46 | $21.80 | $20.25 | $17.09 |
| Income From Investment Operations: | |||||
| Net investment income (loss) | 0.182 | 0.21 | 0.102 | 0.022 | (0.01)2 |
| Net realized and unrealized gain (loss) | 5.06 | 3.18 | (0.33) | 1.53 | 3.20 |
| TOTAL FROM INVESTMENT OPERATIONS | 5.24 | 3.39 | (0.23) | 1.55 | 3.19 |
| Less Distributions: | |||||
| Distributions from net investment income | (0.20) | — | (0.11) | — | (0.03) |
| Net Asset Value, End of Period | $29.89 | $24.85 | $21.46 | $21.80 | $20.25 |
| Total Return3 | 21.17% | 15.80% | (1.05)% | 7.65% | 18.68% |
| Ratios to Average Net Assets: | |||||
| Net expenses | 1.02% | 1.07% | 1.80% | 1.76% | 1.81% |
| Net investment income (loss) | 0.65% | 0.95% | 0.49% | 0.09% | (0.05)% |
| Expense waiver/reimbursement4 | 0.00%5 | 0.00%5 | 0.00%5 | 0.00%5 | 0.00%5 |
| Supplemental Data: | |||||
| Net assets, end of period (000 omitted) | $20,425 | $17,363 | $5,717 | $6,300 | $5,467 |
| Portfolio turnover | 82% | 77% | 62% | 76% | 31% |
| 1 | Prior to September 1, 2016, the Fund's Class R6 Shares were designated as Class R Shares. |
| 2 | Per share numbers have been calculated using the average shares method. |
| 3 | Based on net asset value. |
| 4 | This expense decrease is reflected in both the net expense and the net investment income (loss) ratios shown above. |
| 5 | Represents less than 0.01%. |
| Assets: | ||
| Investment in securities, at value including $704,703 of securities loaned and including $5,565,363 of investment in affiliated holdings (identified cost $176,597,528) | $196,209,112 | |
| Income receivable | 95,450 | |
| Income receivable from an affiliated holding | 9,773 | |
| Receivable for investments sold | 1,192,879 | |
| Receivable for shares sold | 1,121,487 | |
| TOTAL ASSETS | 198,628,701 | |
| Liabilities: | ||
| Payable for investments purchased | $1,790,044 | |
| Payable for shares redeemed | 82,647 | |
| Payable for collateral due to broker for securities lending | 740,143 | |
| Payable for investment adviser fee (Note 5) | 3,974 | |
| Payable for administrative fees (Note 5) | 426 | |
| Payable for distribution services fee (Note 5) | 25,059 | |
| Payable for other service fees (Notes 2 and 5) | 17,129 | |
| Accrued expenses (Note 5) | 90,322 | |
| TOTAL LIABILITIES | 2,749,744 | |
| Net assets for 6,567,673 shares outstanding | $195,878,957 | |
| Net Assets Consist of: | ||
| Paid-in capital | $176,146,747 | |
| Net unrealized appreciation | 19,611,584 | |
| Accumulated net realized loss | (41,309) | |
| Undistributed net investment income | 161,935 | |
| TOTAL NET ASSETS | $195,878,957 | |
| Net Asset Value, Offering Price and Redemption Proceeds Per Share | ||
| Class A Shares: | ||
| Net asset value per share ($40,538,924 ÷ 1,350,641 shares outstanding), no par value, unlimited shares authorized | $30.01 | |
| Offering price per share (100/94.50 of $30.01) | $31.76 | |
| Redemption proceeds per share | $30.01 | |
| Class C Shares: | ||
| Net asset value per share ($39,624,673 ÷ 1,396,475 shares outstanding), no par value, unlimited shares authorized | $28.37 | |
| Offering price per share | $28.37 | |
| Redemption proceeds per share (99.00/100 of $28.37) | $28.09 |
| Institutional Shares: | ||
| Net asset value per share ($95,290,396 ÷ 3,137,304 shares outstanding), no par value, unlimited shares authorized | $30.37 | |
| Offering price per share | $30.37 | |
| Redemption proceeds per share | $30.37 | |
| Class R6 Shares: | ||
| Net asset value per share ($20,424,964 ÷ 683,253 shares outstanding), no par value, unlimited shares authorized | $29.89 | |
| Offering price per share | $29.89 | |
| Redemption proceeds per share | $29.89 |
| Investment Income: | ||
| Dividends (including $50,864 received from affiliated holdings* and net of foreign taxes withheld of $910) | $2,534,954 | |
| Net income on securities loaned (includes $5,469 received from affiliated holdings related to cash collateral balances*) | 4,023 | |
| TOTAL INCOME | 2,538,977 | |
| Expenses: | ||
| Investment adviser fee (Note 5) | $1,147,235 | |
| Administrative fee (Note 5) | 122,462 | |
| Custodian fees | 20,002 | |
| Transfer agent fee | 133,509 | |
| Directors'/Trustees' fees (Note 5) | 2,657 | |
| Auditing fees | 26,700 | |
| Legal fees | 8,668 | |
| Portfolio accounting fees | 74,632 | |
| Distribution services fee (Note 5) | 283,385 | |
| Other service fees (Notes 2 and 5) | 185,532 | |
| Share registration costs | 58,907 | |
| Printing and postage | 31,155 | |
| Miscellaneous (Note 5) | 25,535 | |
| TOTAL EXPENSES | 2,120,379 | |
| Reimbursement of investment adviser fee (Note 5) | (2,387) | |
| Net expenses | 2,117,992 | |
| Net investment income | 420,985 | |
| Realized and Unrealized Gain (Loss) on Investments: | ||
| Net realized gain on investments (including net realized gain of $25 on sales of investments in affiliated holdings*) | 17,219,025 | |
| Net change in unrealized appreciation of investments (including net change in unrealized depreciation of $99 on investments in affiliated holdings*) | 10,538,220 | |
| Net realized and unrealized gain on investments | 27,757,245 | |
| Change in net assets resulting from operations | $28,178,230 |
| * | See information listed after the Fund's Portfolio of Investments. |
| Year Ended July 31 | 2018 | 2017 |
| Increase (Decrease) in Net Assets | ||
| Operations: | ||
| Net investment income | $420,985 | $900,715 |
| Net realized gain | 17,219,025 | 13,356,886 |
| Net change in unrealized appreciation/depreciation | 10,538,220 | 5,750,189 |
| CHANGE IN NET ASSETS RESULTING FROM OPERATIONS | 28,178,230 | 20,007,790 |
| Distributions to Shareholders: | ||
| Distributions from net investment income | ||
| Class A Shares | (150,867) | (281,217) |
| Class C Shares | — | (65,140) |
| Institutional Shares | (353,878) | (754,521) |
| Class R6 Shares1 | (139,150) | — |
| CHANGE IN NET ASSETS RESULTING FROM DISTRIBUTIONS TO SHAREHOLDERS | (643,895) | (1,100,878) |
| Share Transactions: | ||
| Proceeds from sale of shares | 67,281,847 | 39,731,276 |
| Net asset value of shares issued to shareholders in payment of distributions declared | 596,689 | 1,043,477 |
| Cost of shares redeemed | (39,304,708) | (61,662,149) |
| CHANGE IN NET ASSETS RESULTING FROM SHARE TRANSACTIONS | 28,573,828 | (20,887,396) |
| Change in net assets | 56,108,163 | (1,980,484) |
| Net Assets: | ||
| Beginning of period | 139,770,794 | 141,751,278 |
| End of period (including undistributed net investment income of $161,935 and $462,446, respectively) | $195,878,957 | $139,770,794 |
| 1 | Prior to September 1, 2016, the Fund's Class R6 Shares were designated as Class R Shares. |
| ■ | Equity securities listed on an exchange or traded through a regulated market system are valued at their last reported sale price or official closing price in their principal exchange or market. |
| ■ | Shares of other mutual funds or non-exchange-traded investment companies are valued based upon their reported NAVs. |
| ■ | Fixed-income securities are fair valued using price evaluations provided by a pricing service approved by the Fund's Board of Trustees (the “Trustees”). |
| ■ | Derivative contracts listed on exchanges are valued at their reported settlement or closing price, except that options are valued at the mean of closing bid and asked quotations. |
| ■ | Over-the-counter (OTC) derivative contracts are fair valued using price evaluations provided by a pricing service approved by the Trustees. |
| ■ | For securities that are fair valued in accordance with procedures established by and under the general supervision of the Trustees, certain factors may be considered, such as: the last traded or purchase price of the security, information obtained by contacting the issuer or dealers, analysis of the issuer's financial statements or other available documents, fundamental analytical data, the nature and duration of restrictions on disposition, the movement of the market in which the security is normally traded, public trading in similar securities or derivative contracts of the issuer or comparable issuers, movement of a relevant index, or other factors including but not limited to industry changes and relevant government actions. |
| Transfer Agent Fees Incurred | |
| Class A Shares | $43,029 |
| Class C Shares | 37,877 |
| Institutional Shares | 46,243 |
| Class R6 Shares | 6,360 |
| TOTAL | $133,509 |
| Other Service Fees Incurred | |
| Class A Shares | $91,070 |
| Class C Shares | 94,462 |
| TOTAL | $185,532 |
| Market Value of Securities Loaned | Market Value of Collateral |
| $704,703 | $740,143 |
| Year Ended July 31 | 2018 | 2017 | ||
| Class A Shares: | Shares | Amount | Shares | Amount |
| Shares sold | 239,832 | $6,766,765 | 238,856 | $5,600,940 |
| Shares issued to shareholders in payment of distributions declared | 5,033 | 139,021 | 11,576 | 265,655 |
| Shares redeemed | (248,870) | (6,806,136) | (446,290) | (10,342,947) |
| NET CHANGE RESULTING FROM CLASS A SHARE TRANSACTIONS | (4,005) | $99,650 | (195,858) | $(4,476,352) |
| Year Ended July 31 | 2018 | 2017 | ||
| Class C Shares: | Shares | Amount | Shares | Amount |
| Shares sold | 261,516 | $7,009,390 | 274,783 | $6,059,213 |
| Shares issued to shareholders in payment of distributions declared | — | — | 2,697 | 58,957 |
| Shares redeemed | (405,082) | (10,646,392) | (520,492) | (11,483,866) |
| NET CHANGE RESULTING FROM CLASS C SHARE TRANSACTIONS | (143,566) | $(3,637,002) | (243,012) | $(5,365,696) |
| Year Ended July 31 | 2018 | 2017 | ||
| Institutional Shares: | Shares | Amount | Shares | Amount |
| Shares sold | 1,752,574 | $51,491,570 | 513,112 | $12,168,267 |
| Shares issued to shareholders in payment of distributions declared | 11,422 | 318,781 | 31,013 | 718,865 |
| Shares redeemed | (693,414) | (19,281,770) | (1,449,097) | (34,263,696) |
| NET CHANGE RESULTING FROM INSTITUTIONAL SHARE TRANSACTIONS | 1,070,582 | $32,528,581 | (904,972) | $(21,376,564) |
| Year Ended July 31 | 2018 | 20171 | ||
| Class R6 Shares: | Shares | Amount | Shares | Amount |
| Shares sold | 72,607 | $2,014,122 | 689,644 | $15,902,856 |
| Shares issued to shareholders in payment of distributions declared | 5,058 | 138,887 | — | — |
| Shares redeemed | (93,249) | (2,570,410) | (257,198) | (5,571,640) |
| NET CHANGE RESULTING FROM CLASS R6 SHARE TRANSACTIONS | (15,584) | $(417,401) | 432,446 | $10,331,216 |
| NET CHANGE RESULTING FROM TOTAL FUND SHARE TRANSACTIONS | 907,427 | $28,573,828 | (911,396) | $(20,887,396) |
| 1 | Prior to September 1, 2016, the Fund's Class R6 Shares were designated as Class R Shares. |
| Increase (Decrease) | ||
| Paid-In Capital | Undistributed Net Investment Income (Loss) | Accumulated Net Realized Gain (Loss) |
| $(37,254,849) | $(77,601) | $37,332,450 |
| 2018 | 2017 | |
| Ordinary income | $643,895 | $1,100,878 |
| Undistributed ordinary income | $163,254 |
| Net unrealized appreciation | $19,568,956 |
| Administrative Fee | Average Daily Net Assets of the Investment Complex |
| 0.100% | on assets up to $50 billion |
| 0.075% | on assets over $50 billion |
| Administrative Fee | Average Daily Net Assets of the Investment Complex |
| 0.150% | on the first $5 billion |
| 0.125% | on the next $5 billion |
| 0.100% | on the next $10 billion |
| 0.075% | on assets in excess of $20 billion |
| Percentage of Average Daily Net Assets of Class | |
| Class A Shares | 0.05% |
| Class C Shares | 0.75% |
| Distribution Services Fees Incurred | |
| Class C Shares | $283,385 |
| Purchases | $150,245,764 |
| Sales | $124,604,495 |
September 24, 2018
| Beginning Account Value 2/1/2018 | Ending Account Value 7/31/2018 | Expenses Paid During Period1 | |
| Actual: | |||
| Class A Shares | $1,000 | $1,028.40 | $6.79 |
| Class C Shares | $1,000 | $1,024.90 | $10.39 |
| Institutional Shares | $1,000 | $1,030.20 | $5.29 |
| Class R6 Shares | $1,000 | $1,030.30 | $5.08 |
| Hypothetical (assuming a 5% return before expenses): | |||
| Class A Shares | $1,000 | $1,018.10 | $6.76 |
| Class C Shares | $1,000 | $1,014.50 | $10.34 |
| Institutional Shares | $1,000 | $1,019.60 | $5.26 |
| Class R6 Shares | $1,000 | $1,019.80 | $5.06 |
| 1 | Expenses are equal to the Fund's annualized net expense ratios, multiplied by the average account value over the period, multiplied by 181/365 (to reflect the one-half-year period). The annualized net expense ratios are as follows: |
| Class A Shares | 1.35% |
| Class C Shares | 2.07% |
| Institutional Shares | 1.05% |
| Class R6 Shares | 1.01% |
| Name Birth Date Positions Held with Trust Date Service Began | Principal Occupation(s) for Past Five Years, Other Directorships Held and Previous Position(s) |
| J. Christopher Donahue* Birth Date: April 11, 1949 President and Trustee Indefinite Term Began serving: May 2006 | Principal Occupations: Principal Executive Officer and President of certain of the Funds in the Federated Fund Family; Director or Trustee of the Funds in the Federated Fund Family; President, Chief Executive Officer and Director, Federated Investors, Inc.; Chairman and Trustee, Federated Investment Management Company; Trustee, Federated Investment Counseling; Chairman and Director, Federated Global Investment Management Corp.; Chairman and Trustee, Federated Equity Management Company of Pennsylvania; Trustee, Federated Shareholder Services Company; Director, Federated Services Company. Previous Positions: President, Federated Investment Counseling; President and Chief Executive Officer, Federated Investment Management Company, Federated Global Investment Management Corp. and Passport Research, Ltd; Chairman, Passport Research, Ltd. |
| Name Birth Date Positions Held with Trust Date Service Began | Principal Occupation(s) for Past Five Years, Other Directorships Held and Previous Position(s) |
| John B. Fisher* Birth Date: May 16, 1956 Trustee Indefinite Term Began serving: May 2016 | Principal Occupations: Principal Executive Officer and President of certain of the Funds in the Federated Fund Family; Director or Trustee of certain of the Funds in the Federated Fund Family; Vice President, Federated Investors, Inc.; President, Director/Trustee and CEO, Federated Advisory Services Company, Federated Equity Management Company of Pennsylvania, Federated Global Investment Management Corp., Federated Investment Counseling, Federated Investment Management Company; President of some of the Funds in the Federated Fund Complex and Director, Federated Investors Trust Company. Previous Positions: President and Director of the Institutional Sales Division of Federated Securities Corp.; President and Director of Federated Investment Counseling; President and CEO of Passport Research, Ltd.; Director, Edgewood Securities Corp.; Director, Federated Services Company; Director, Federated Investors, Inc.; Chairman and Director, Southpointe Distribution Services, Inc. and President, Technology, Federated Services Company. |
| * | Reasons for “interested” status: J. Christopher Donahue and John B. Fisher are interested due to their beneficial ownership of shares of Federated Investors, Inc. and due to positions they hold with Federated and its subsidiaries. |
| Name Birth Date Positions Held with Trust Date Service Began | Principal Occupation(s) for Past Five Years, Other Directorships Held, Previous Position(s) and Qualifications |
| John T. Collins Birth Date: January 24, 1947 Trustee Indefinite Term Began serving: October 2013 | Principal Occupations: Director or Trustee of the Federated Fund Family; formerly, Chairman and CEO, The Collins Group, Inc. (a private equity firm) (Retired). Other Directorships Held: Director, Current Chair of the Compensation Committee, KLX Corp. Qualifications: Mr. Collins has served in several business and financial management roles and directorship positions throughout his career. Mr. Collins previously served as Chairman and CEO, The Collins Group, Inc. (a private equity firm). Mr. Collins serves as Chairman Emeriti, Bentley University. Mr. Collins previously served as Director and Audit Committee Member, Bank of America Corp.; Director, FleetBoston Financial Corp.; and Director, Beth Israel Deaconess Medical Center (Harvard University Affiliate Hospital). |
| Name Birth Date Positions Held with Trust Date Service Began | Principal Occupation(s) for Past Five Years, Other Directorships Held, Previous Position(s) and Qualifications |
| G. Thomas Hough Birth Date: February 28, 1955 Trustee Indefinite Term Began serving: August 2015 | Principal Occupations: Director or Trustee of the Federated Fund Family; formerly, Vice Chair, Ernst & Young LLP (public accounting firm) (Retired). Other Directorships Held: Director, Chair of the Audit Committee, Governance Committee, Publix Super Markets, Inc.; Director, Member of the Audit Committee and Technology Committee of Equifax, Inc. Qualifications: Mr. Hough has served in accounting, business management and directorship positions throughout his career. Mr. Hough most recently held the position of Americas Vice Chair of Assurance with Ernst & Young LLP (public accounting firm). Mr. Hough is an Executive Committee member of the United States Golf Association, he serves on the President's Cabinet and Business School Board of Visitors for the University of Alabama and is on the Business School Board of Visitors for Wake Forest University. |
| Maureen Lally-Green Birth Date: July 5, 1949 Trustee Indefinite Term Began serving: August 2009 | Principal Occupations: Director or Trustee of the Federated Fund Family; Dean of the Duquesne University School of Law; Professor and Adjunct Professor of Law, Duquesne University School of Law; formerly, Interim Dean of the Duquesne University School of Law; formerly, Associate General Secretary and Director, Office of Church Relations, Diocese of Pittsburgh. Other Directorships Held: Director, CNX Resources Corporation (formerly known as CONSOL Energy Inc.). Qualifications: Judge Lally-Green has served in various legal and business roles and directorship positions throughout her career. Judge Lally-Green previously served as a member of the Superior Court of Pennsylvania and as a Professor of Law, Duquesne University School of Law. Judge Lally-Green also currently holds the positions on not for profit or for profit boards of directors as follows: Director and Chair, UPMC Mercy Hospital; Director and Vice Chair, Our Campaign for the Church Alive!, Inc.; Director, Saint Vincent College; Member, Pennsylvania State Board of Education (public); and Director CNX Resources Corporation (formerly known as CONSOL Energy Inc.). Judge Lally-Green has held the positions of: Director, Auberle; Director, Epilepsy Foundation of Western and Central Pennsylvania; Director, Ireland Institute of Pittsburgh; Director, Saint Thomas More Society; Director and Chair, Catholic High Schools of the Diocese of Pittsburgh, Inc.; Director, Pennsylvania Bar Institute; Regent, St. Vincent Seminary; and Director and Chair, North Catholic High School, Inc. |
| Charles F. Mansfield, Jr. Birth Date: April 10, 1945 Trustee Indefinite Term Began serving: June 2006 | Principal Occupations: Director or Trustee of the Federated Fund Family; Management Consultant. Other Directorships Held: None. Qualifications: Mr. Mansfield has served as a Marine Corps officer and in several banking, business management, educational roles and directorship positions throughout his long career. He remains active as a Management Consultant. |
| Name Birth Date Positions Held with Trust Date Service Began | Principal Occupation(s) for Past Five Years, Other Directorships Held, Previous Position(s) and Qualifications |
| Thomas M. O'Neill Birth Date: June 14, 1951 Trustee Indefinite Term Began serving: August 2006 | Principal Occupations: Director or Trustee, Chair of the Audit Committee of the Federated Fund Family; Sole Proprietor, Navigator Management Company (investment and strategic consulting). Other Directorships Held: None. Qualifications: Mr. O'Neill has served in several business, mutual fund and financial management roles and directorship positions throughout his career. Mr. O'Neill serves as Director, Medicines for Humanity and Director, The Golisano Children's Museum of Naples, Florida. Mr. O'Neill previously served as Chief Executive Officer and President, Managing Director and Chief Investment Officer, Fleet Investment Advisors; President and Chief Executive Officer, Aeltus Investment Management, Inc.; General Partner, Hellman, Jordan Management Co., Boston, MA; Chief Investment Officer, The Putnam Companies, Boston, MA; Credit Analyst and Lending Officer, Fleet Bank; Director and Consultant, EZE Castle Software (investment order management software); and Director, Midway Pacific (lumber). |
| P. Jerome Richey Birth Date: February 23, 1949 Trustee Indefinite Term Began serving: October 2013 | Principal Occupations: Director or Trustee of the Federated Fund Family; Management Consultant; formerly, Senior Vice Chancellor and Chief Legal Officer, University of Pittsburgh and Executive Vice President and Chief Legal Officer, CNX Resources Corporation (formerly known as CONSOL Energy Inc.) Other Directorships Held: None. Qualifications: Mr. Richey has served in several business and legal management roles and directorship positions throughout his career. Mr. Richey most recently held the positions of Senior Vice Chancellor and Chief Legal Officer, University of Pittsburgh. Mr. Richey previously served as Chairman of the Board, Epilepsy Foundation of Western Pennsylvania and Chairman of the Board, World Affairs Council of Pittsburgh. Mr. Richey previously served as Chief Legal Officer and Executive Vice President, CNX Resources Corporation (formerly known as CONSOL Energy Inc.); and Board Member, Ethics Counsel and Shareholder, Buchanan Ingersoll & Rooney PC (a law firm). |
| John S. Walsh Birth Date: November 28, 1957 Trustee Indefinite Term Began serving: June 2006 | Principal Occupations: Director or Trustee, and Chair of the Board of Directors or Trustees, of the Federated Fund Family; President and Director, Heat Wagon, Inc. (manufacturer of construction temporary heaters); President and Director, Manufacturers Products, Inc. (distributor of portable construction heaters); President, Portable Heater Parts, a division of Manufacturers Products, Inc. Other Directorships Held: None. Qualifications: Mr. Walsh has served in several business management roles and directorship positions throughout his career. Mr. Walsh previously served as Vice President, Walsh & Kelly, Inc. (paving contractors). |
| Name Birth Date Address Positions Held with Trust Date Service Began | Principal Occupation(s) for Past Five Years and Previous Position(s) |
| Lori A. Hensler Birth Date: January 6, 1967 TREASURER Officer since: April 2013 | Principal Occupations: Principal Financial Officer and Treasurer of the Federated Fund Family; Senior Vice President, Federated Administrative Services; Financial and Operations Principal for Federated Securities Corp. and Edgewood Services, Inc.; and Assistant Treasurer, Federated Investors Trust Company. Ms. Hensler has received the Certified Public Accountant designation. Previous Positions: Controller of Federated Investors, Inc.; Senior Vice President and Assistant Treasurer, Federated Investors Management Company; Treasurer, Federated Investors Trust Company; Assistant Treasurer, Federated Administrative Services, Federated Administrative Services, Inc., Federated Securities Corp., Edgewood Services, Inc., Federated Advisory Services Company, Federated Equity Management Company of Pennsylvania, Federated Global Investment Management Corp., Federated Investment Counseling, Federated Investment Management Company, Passport Research, Ltd., and Federated MDTA, LLC; Financial and Operations Principal for Federated Securities Corp., Edgewood Services, Inc. and Southpointe Distribution Services, Inc. |
| Peter J. Germain Birth Date: September 3, 1959 CHIEF LEGAL OFFICER, SECRETARY and EXECUTIVE VICE PRESIDENT Officer since: June 2006 | Principal Occupations: Mr. Germain is Chief Legal Officer, Secretary and Executive Vice President of the Federated Fund Family. He is General Counsel, Chief Legal Officer, Secretary and Executive Vice President, Federated Investors, Inc.; Trustee and Senior Vice President, Federated Investors Management Company; Trustee and President, Federated Administrative Services; Director and President, Federated Administrative Services, Inc.; Director and Vice President, Federated Securities Corp.; Director and Secretary, Federated Private Asset Management, Inc.; Secretary, Federated Shareholder Services Company; and Secretary, Retirement Plan Service Company of America. Mr. Germain joined Federated in 1984 and is a member of the Pennsylvania Bar Association. Previous Positions: Deputy General Counsel, Special Counsel, Managing Director of Mutual Fund Services, Federated Investors, Inc.; Senior Vice President, Federated Services Company; and Senior Corporate Counsel, Federated Investors, Inc. |
| Stephen F. Auth Birth Date: September 13, 1956 101 Park Avenue 41st Floor New York, NY 10178 CHIEF INVESTMENT OFFICER Officer since: June 2012 | Principal Occupations: Stephen F. Auth is Chief Investment Officer of various Funds in the Federated Fund Family; Executive Vice President, Federated Investment Counseling, Federated Global Investment Management Corp. and Federated Equity Management Company of Pennsylvania. Previous Positions: Executive Vice President, Federated Investment Management Company and Passport Research, Ltd. (investment advisory subsidiary of Federated); Senior Vice President, Global Portfolio Management Services Division; Senior Vice President, Federated Investment Management Company and Passport Research, Ltd.; Senior Managing Director and Portfolio Manager, Prudential Investments. |
| Name Birth Date Address Positions Held with Trust Date Service Began | Principal Occupation(s) for Past Five Years and Previous Position(s) |
| Stephen Van Meter Birth Date: June 5, 1975 CHIEF COMPLIANCE OFFICER AND SENIOR VICE PRESIDENT Officer since: July 2015 | Principal Occupations: Senior Vice President and Chief Compliance Officer of the Federated Fund Family; Vice President and Chief Compliance Officer of Federated Investors, Inc. and Chief Compliance Officer of certain of its subsidiaries. Mr. Van Meter joined Federated in October 2011. He holds FINRA licenses under Series 3, 7, 24 and 66. Previous Positions: Mr. Van Meter previously held the position of Compliance Operating Officer, Federated Investors, Inc. Prior to joining Federated, Mr. Van Meter served at the United States Securities and Exchange Commission in the positions of Senior Counsel, Office of Chief Counsel, Division of Investment Management and Senior Counsel, Division of Enforcement. |

4000 Ericsson Drive
Warrendale, PA 15086-7561
or call 1-800-341-7400.
CUSIP 31421R205
CUSIP 31421R304
CUSIP 31421R718
2018 ©Federated Investors, Inc.
| Share Class | Ticker | A | QABGX | C | QCBGX | Institutional | QIBGX | R6 | QKBGX |
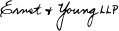
| 1 | The Fund's Blended Index, which reflects 60% of the S&P 500 and 40% of the BAB, is being used for comparison purposes because, although it is not the Fund's broad-based securities market index, the Fund's Adviser believes it is more reflective of the Fund's balanced investment style. |
| 2 | Please see the footnotes to the line graphs below for definitions of, and further information about, the S&P 500 Index, one of the Fund's broad-based securities market indices. The S&P 500's return for the 12-month reporting period was 16.24%. |
| 3 | Please see the footnotes to the line graphs below for definitions of, and further information about, the BAB, one of the Fund's broad-based securities market indices. The BAB's return for the 12-month reporting period was -0.80%. |
| 4 | Please see the footnotes to the line graphs below for definitions of, and further information about, the MA50-70. |
| 5 | The Russell 3000® Index measures the performance of the largest 3,000 U.S. companies representing approximately 98% of the investable U.S. equity market. The Russell 3000® Index is constructed to provide a comprehensive, unbiased, and stable barometer of the broad market and is completely reconstituted annually to ensure new and growing equities are reflected.* |
| 6 | Small-cap stocks may be less liquid and subject to greater price volatility than large-cap stocks. |
| 7 | The Russell Microcap® Index measures the performance of the microcap segment of the U.S. equity market. Microcap stocks make up less than 3% of the U.S. equity market (by market cap) and consist of the smallest 1,000 securities in the small-cap Russell 2000® Index, plus the next 1,000 smallest eligible securities by market cap. The Russell Microcap® Index is constructed to provide a comprehensive and |
| unbiased barometer for the microcap segment trading on national exchanges and is completely reconstituted annually to ensure new and growing equities are reflected and companies continue to reflect appropriate capitalization and value characteristics.* | |
| 8 | The Russell 2000® Index measures the performance of the small-cap segment of the U.S. equity universe. The Russell 2000® Index is a subset of the Russell 3000® Index representing approximately 10% of the total market capitalization of that index. It includes approximately 2000 of the smallest securities based on a combination of their market cap and current index membership. The Russell 2000® Index is constructed to provide a comprehensive and unbiased small-cap barometer and is completely reconstituted annually to ensure larger stocks do not distort the performance and characteristics of the true small-cap opportunity set.* |
| 9 | The Russell Top 200® Index measures the performance of the largest cap segment of the U.S. equity universe. The Russell Top 200® Index is a subset of the Russell 3000® Index. It includes approximately 200 of the largest securities based on a combination of their market cap and current index membership and represents approximately 68% of the U.S. market. The Russell Top 200® Index is constructed to provide a comprehensive and unbiased barometer for this very large cap segment and is completely reconstituted annually to ensure new and growing equities are reflected.* |
| 10 | The Russell Midcap® Index measures the performance of the mid-cap segment of the U.S. equity universe. The Russell Midcap® Index is a subset of the Russell 1000® Index. It includes approximately 800 of the smallest securities based on a combination of their market cap and current index membership. The Russell Midcap® Index represents approximately 31% of the total market capitalization of the Russell 1000® companies. The Russell Midcap® Index is constructed to provide a comprehensive and unbiased barometer for the mid-cap segment. The Russell Midcap Index is completely reconstituted annually to ensure larger stocks do not distort the performance and characteristics of the true mid-cap opportunity set.* |
| 11 | The Russell 3000® Growth Index measures the performance of the broad growth segment of the U.S. equity universe. It includes those Russell 3000® Index companies with higher price-to-book ratios and higher forecasted growth values. The Russell 3000® Growth Index is constructed to provide a comprehensive, unbiased and stable barometer of the broad growth market. The Russell 3000® Growth Index is completely reconstituted annually to ensure new and growing equities are included and that the represented companies continue to reflect growth characteristics.* |
| 12 | The Russell 3000® Value Index measures the performance of the broad value segment of U.S. equity value universe. It includes those Russell 3000® Index companies with lower price-to-book ratios and lower forecasted growth values. The Russell 3000® Value Index is constructed to provide a comprehensive, unbiased and stable barometer of the broad value market. The Russell 3000® Value Index is completely reconstituted annually to ensure new and growing equities are included and that the represented companies continue to reflect value characteristics.* |
| 13 | International investing involves special risks including currency risk, increased volatility of foreign securities, political risks and differences in auditing and other financial standards. |
| 14 | The MSCI EAFE Index is an equity index which captures large- and mid-cap representation across developed markets countries around the world, excluding the US and Canada.* |
| 15 | Prices of emerging markets securities can be significantly more volatile than the prices of securities in developed countries, and currency risks and political risks are accentuated in emerging markets. |
| 16 | The MSCI Emerging Markets Index captures large- and mid-cap representation across 24 emerging markets countries.* |
| 17 | Bond prices are sensitive to changes in interest rates and a rise in interest rates can cause a decline in their prices. |
| 18 | The MSCI REIT Index is a free float-adjusted market capitalization weighted index that is comprised of equity Real Estate Investment Trusts (REITs). The index is based on the MSCI USA Investable Market Index (IMI), its parent index, which captures the large, mid and small cap segments of the USA market.* |
| * | The index is unmanaged, and it is not possible to invest directly in an index. |
| Federated MDT Balanced Fund - | Institutional Shares | Class C Shares | S&P 500 | BAB | Blended Index | MA50-70 |
| F | F | I | I | I | I | |
| 7/31/2008 | 10,000 | 10,000 | 10,000 | 10,000 | 10,000 | 10,000 |
| 7/31/2009 | 8,387 | 8,305 | 8,004 | 10,785 | 9,105 | 8,834 |
| 7/31/2010 | 9,120 | 8,939 | 9,111 | 11,745 | 10,218 | 9,883 |
| 7/31/2011 | 10,396 | 10,088 | 10,902 | 12,266 | 11,609 | 11,215 |
| 7/31/2012 | 10,590 | 10,181 | 11,897 | 13,156 | 12,631 | 11,574 |
| 7/31/2013 | 12,669 | 12,055 | 14,872 | 12,906 | 14,348 | 13,219 |
| 7/31/2014 | 14,353 | 13,520 | 17,391 | 13,418 | 16,026 | 14,580 |
| 7/31/2015 | 15,233 | 14,212 | 19,340 | 13,797 | 17,291 | 15,161 |
| 7/31/2016 | 15,223 | 14,056 | 20,426 | 14,616 | 18,329 | 15,430 |
| 7/31/2017 | 16,648 | 15,213 | 23,702 | 14,540 | 20,013 | 16,886 |
| 7/31/2018 | 18,671 | 16,900 | 27,551 | 14,424 | 21,860 | 18,047 |
| ■ | Total returns shown for Class C Shares include the maximum contingent deferred sales charge of 1.00% as applicable. |
| 1 Year | 5 Years | 10 Years | |
| Class A Shares | 5.77% | 6.59% | 5.58% |
| Class C Shares | 10.09% | 6.99% | 5.39% |
| Institutional Shares | 12.15% | 8.07% | 6.44% |
| Class R6 Shares5 | 12.24% | 7.75% | 5.91% |
| S&P 500 | 16.24% | 13.12% | 10.67% |
| BAB | (0.80)% | 2.25% | 3.73% |
| Blended Index | 9.23% | 8.79% | 8.13% |
| MA50-70 | 7.08% | 6.55% | 6.62% |
| 1 | Represents a hypothetical investment of $10,000 in the Fund after deducting applicable sales charges: for Class A Shares, the maximum sales charge of 5.50% ($10,000 investment minus $550 sales charge = $9,450); for Class C Shares, a 1.00% contingent deferred sales charge would be applied on any redemption less than one year from the purchase date. The Fund's performance assumes the reinvestment of all dividends and distributions. The S&P 500, BAB and MA50-70 have been adjusted to reflect reinvestment of dividends on securities in the indexes. |
| 2 | The S&P 500 Index, a broad-based securities market index of the Fund, is an unmanaged capitalization-weighted index of 500 stocks designed to measure performance of the broad domestic economy through changes in the aggregate market value of 500 stocks representing all major industries. The S&P 500 is unmanaged and, unlike the Fund, is not affected by cash flows. It is not possible to invest directly in an index. The S& P 500 is not adjusted to reflect sales charges, expenses or other fees that the Securities and Exchange Commission (SEC) requires to be reflected in the Fund's performance. |
| 3 | The BAB Index, a broad-based securities market index of the Fund, is a broad-based benchmark that measures the investment-grade, U.S. dollar-denominated, fixed-rate taxable bond market. The BAB is unmanaged and, unlike the Fund, is not affected by cash flows. It is not possible to invest directly in an index. The BAB is not adjusted to reflect sales charges, expenses or other fees that the SEC requires to be reflected in the Fund's performance. |
| 4 | Morningstar figures represent the average of the total returns reported by all the funds designated by Morningstar as falling into the respective category indicated. They do not reflect sales charges. The Morningstar figures in the Growth of $10,000 line graph are based on historical return information published by Morningstar and reflect the return of the funds comprising the category in the year of publication. Because the funds designated by Morningstar as falling into the category can change over time, the Morningstar figures in the line graph may not match the Morningstar figures in the Average Annual Total Returns table, which reflect the return of the funds that currently comprise the category. |
| 5 | Prior to September 1, 2016, Class R6 Shares were known as Class R Shares and included 12b-1 fees and certain other expenses. As of September 1, 2016, Class R6 does not include such 12b-1 fees and certain other expenses, and the performance shown above for Class R6 prior to September 1, 2016, reflects the higher Class R expenses. |
| Security Type | Percentage of Total Net Assets |
| Domestic Equity Securities | 58.5% |
| Corporate Debt Securities | 12.1% |
| Federated Mortgage Core Portfolio | 7.3% |
| International Equity Securities (including International Exchange-Traded Fund) | 7.0% |
| U.S. Treasury Securities2 | 2.7% |
| Federated Project and Trade Finance Core Fund | 2.0% |
| High Yield Bond Portfolio | 1.9% |
| Collateralized Mortgage Obligations | 1.8% |
| Emerging Markets Core Fund | 1.5% |
| Federated Bank Loan Core Fund | 1.4% |
| Asset-Backed Securities | 0.5% |
| Securities Lending Collateral3 | 0.4% |
| Derivative Contracts4 | 0.0%5 |
| Cash Equivalents6 | 3.2% |
| Other Assets and Liabilities—Net7 | (0.3)% |
| TOTAL | 100.0% |
| 1 | See the Fund's Prospectus and Statement of Additional Information for a description of the types of securities in which the Fund invests. As of the date specified above, the Fund owned shares of one or more affiliated investment companies. For purposes of this table, affiliated investment companies (other than an affiliated money market mutual fund) in which the Fund invested less than 10% of its net assets, are listed individually in the table. |
| 2 | Includes U.S. Treasuries pledged as collateral to ensure the Fund is able to satisfy the obligations of its outstanding futures contracts. |
| 3 | Represents cash collateral received for portfolio securities on loan that may be invested in affiliated money market funds, other money market instruments and/or repurchase agreements. |
| 4 | Based upon net unrealized appreciation (depreciation) or value of the derivative contracts as applicable. Derivative contracts may consist of futures, forwards, options and swaps. The impact of a derivative contract on the Fund's performance may be larger than its unrealized appreciation (depreciation) or value may indicate. In many cases, the notional value or amount of a derivative contract may provide a better indication of the contract's significance to the portfolio. More complete information regarding the Fund's direct investments in derivative contracts, including unrealized appreciation (depreciation), value and notional values or amounts of such contracts, can be found in the table at the end of the Portfolio of Investments included in this Report. |
| 5 | Represents less than 0.1%. |
| 6 | Cash Equivalents include any investments in money market mutual funds and/or overnight repurchase agreements other than those representing cash collateral for securities lending. |
| 7 | Assets, other than investments in securities and derivative contracts, less liabilities. See Statement of Assets and Liabilities. |
| Sector Composition | Percentage of Equity Securities |
| Information Technology | 22.9% |
| Financials | 15.7% |
| Health Care | 14.7% |
| Consumer Discretionary | 12.2% |
| Industrials | 11.5% |
| Consumer Staples | 6.7% |
| Energy | 6.7% |
| Utilities | 3.8% |
| Real Estate | 2.3% |
| Materials | 2.0% |
| Telecommunication Services | 1.5% |
| TOTAL | 100.0% |
| 8 | Sector classifications are based upon, and individual portfolio securities are assigned to, the classifications of the Global Industry Classification Standard (GICS) except that the Adviser assigns a classification to securities not classified by the GICS and to securities for which the Adviser does not have access to the classification made by the GICS. |
| Shares or Principal Amount | Value | ||
| COMMON STOCKS—58.8% | |||
| Consumer Discretionary—7.2% | |||
| 5,200 | Abercrombie & Fitch Co., Class A | $123,188 | |
| 211 | 1 | America's Car-Mart, Inc. | 13,504 |
| 1,208 | 1 | AutoZone, Inc. | 852,280 |
| 397 | BJ's Restaurants, Inc. | 25,110 | |
| 612 | 1 | Beazer Homes USA, Inc. | 7,840 |
| 7,113 | Bed Bath & Beyond, Inc. | 133,226 | |
| 826 | Big 5 Sporting Goods Corp. | 5,328 | |
| 2,400 | Big Lots, Inc. | 104,232 | |
| 458 | 2 | Buckle, Inc. | 11,015 |
| 192 | 1 | Burlington Stores, Inc. | 29,340 |
| 1,586 | Chicos Fas, Inc. | 13,798 | |
| 630 | Children's Place, Inc./The | 77,427 | |
| 26 | Churchill Downs, Inc. | 7,435 | |
| 758 | 1 | Cooper-Standard Holding, Inc. | 102,178 |
| 13,017 | D. R. Horton, Inc. | 568,843 | |
| 7,966 | 1 | DISH Network Corp., Class A | 251,407 |
| 84 | 1 | Deckers Outdoor Corp. | 9,478 |
| 2,405 | Dillards, Inc., Class A | 193,049 | |
| 125 | 1 | Five Below, Inc. | 12,145 |
| 24,635 | Ford Motor Co. | 247,335 | |
| 3,861 | 1 | Fossil Group, Inc. | 101,158 |
| 6,386 | 1,2 | GNC Holdings, Inc. | 20,307 |
| 5,192 | 2 | GameStop Corp. | 74,817 |
| 6,450 | Gap (The), Inc. | 194,597 | |
| 4,741 | Goodyear Tire & Rubber Co. | 114,780 | |
| 3,800 | Guess ?, Inc. | 86,108 | |
| 745 | 1 | Helen of Troy Ltd. | 85,340 |
| 142 | 1,2 | IRobot Corp. | 11,254 |
| 1,306 | KB Home | 31,018 | |
| 352 | 1 | K12, Inc. | 5,759 |
| 9,031 | Kohl's Corp. | 667,120 | |
| 11,059 | Las Vegas Sand Corp. | 795,142 | |
| 881 | Lear Corp. | 158,695 | |
| 2,435 | Libbey, Inc. | 23,327 |
| Shares or Principal Amount | Value | ||
| COMMON STOCKS—continued | |||
| Consumer Discretionary—continued | |||
| 3,881 | 1 | Live Nation Entertainment, Inc. | $191,256 |
| 2,080 | 1 | Lululemon Athletica, Inc. | 249,496 |
| 442 | M.D.C. Holdings, Inc. | 12,836 | |
| 28,128 | 1 | MSG Networks, Inc. | 662,414 |
| 10,944 | Macy's, Inc. | 434,805 | |
| 64 | Marriott Vacations Worldwide Corp. | 7,623 | |
| 198 | Movado Group, Inc. | 9,860 | |
| 647 | 1 | Murphy USA, Inc. | 51,268 |
| 1,750 | National CineMedia, Inc. | 14,455 | |
| 2,093 | 1 | NetFlix, Inc. | 706,283 |
| 243 | Nexstar Media Group, Inc. | 18,091 | |
| 463 | Nutri/System, Inc. | 18,520 | |
| 141 | 2 | PetMed Express, Inc. | 5,235 |
| 268 | 1 | Planet Fitness, Inc. | 12,735 |
| 320 | Pool Corp. | 49,040 | |
| 90 | 1,2 | RH | 12,227 |
| 5,750 | Royal Caribbean Cruises, Ltd. | 648,370 | |
| 3,900 | 1,2 | Sally Beauty Holdings, Inc. | 64,311 |
| 812 | 1 | SeaWorld Entertainment, Inc. | 17,296 |
| 387 | 1 | Shutterfly, Inc | 31,835 |
| 7,184 | 1 | Skechers USA, Inc., Class A | 199,140 |
| 1,382 | 1 | TRI Pointe Group, Inc. | 19,583 |
| 604 | Tailored Brands, Inc. | 12,177 | |
| 551 | Target Corp. | 44,455 | |
| 1,105 | Tile Shop Hldgs., Inc. | 9,172 | |
| 3,515 | Toll Brothers, Inc. | 123,939 | |
| 298 | 1 | TopBuild Corp. - W/I | 22,135 |
| 5,423 | Tupperware Brands Corp. | 199,078 | |
| 106 | 1 | Ulta Beauty, Inc. | 25,905 |
| 1,953 | Vail Resorts, Inc. | 540,727 | |
| 9,289 | Viacom, Inc., Class B - New | 269,845 | |
| 8,758 | Walt Disney Co. | 994,558 | |
| 119 | 1 | Weight Watchers International, Inc. | 10,654 |
| 216 | World Wrestling Entertainment, Inc. | 17,088 | |
| 5,188 | Wyndham Destinations, Inc. | 239,271 | |
| 212 | Wynn Resorts Ltd. | 35,357 |
| Shares or Principal Amount | Value | ||
| COMMON STOCKS—continued | |||
| Consumer Discretionary—continued | |||
| 1,135 | 1 | Zumiez, Inc. | $25,708 |
| TOTAL | 11,164,328 | ||
| Consumer Staples—3.9% | |||
| 2,708 | 1 | Cal-Maine Foods, Inc. | 121,860 |
| 675 | Church and Dwight, Inc. | 37,732 | |
| 3,483 | Dean Foods Co. | 34,203 | |
| 12,024 | Estee Lauder Cos., Inc., Class A | 1,622,518 | |
| 4,289 | Fresh Del Monte Produce, Inc. | 155,691 | |
| 18,052 | McCormick & Co., Inc. | 2,121,832 | |
| 191 | Medifast, Inc. | 32,791 | |
| 13,626 | PepsiCo, Inc. | 1,566,990 | |
| 3,953 | 1 | Post Holdings, Inc. | 342,172 |
| 87 | 1 | The Boston Beer Co., Inc., Class A | 23,921 |
| 163 | 1 | USANA Health Sciences, Inc. | 21,557 |
| 172 | 1 | United Natural Foods, Inc. | 5,538 |
| 226 | Universal Corp. | 15,617 | |
| 63 | WD 40 Co. | 10,089 | |
| TOTAL | 6,112,511 | ||
| Energy—3.9% | |||
| 17,723 | Chevron Corp. | 2,237,883 | |
| 2,907 | 1 | Cloud Peak Energy, Inc. | 7,587 |
| 21,593 | ConocoPhillips | 1,558,367 | |
| 182 | 1 | Dril-Quip, Inc. | 9,382 |
| 3,569 | EOG Resources, Inc. | 460,187 | |
| 442 | 1 | Exterran Corp. | 12,252 |
| 13,068 | Exxon Mobil Corp. | 1,065,173 | |
| 446 | Gulf Island Fabrication, Inc. | 4,036 | |
| 5,581 | HollyFrontier Corp. | 416,231 | |
| 603 | 1 | Key Energy Services, Inc. | 10,106 |
| 352 | 1 | McDermott International, Inc. | 6,340 |
| 10,600 | 1 | Noble Corp. PLC | 61,904 |
| 1,524 | 1 | Oasis Petroleum, Inc. | 18,623 |
| 1,388 | Occidental Petroleum Corp. | 116,495 | |
| 2,311 | 1 | Overseas Shipholding Group, Inc. | 8,320 |
| 419 | 1 | PDC Energy, Inc. | 26,389 |
| 3,698 | 1 | Rowan Companies PLC | 53,547 |
| Shares or Principal Amount | Value | ||
| COMMON STOCKS—continued | |||
| Energy—continued | |||
| 2,649 | 1 | W&T Offshore, Inc. | $18,384 |
| TOTAL | 6,091,206 | ||
| Financials—9.3% | |||
| 11,110 | Allstate Corp. | 1,056,783 | |
| 169 | American Equity Investment Life Holding Co. | 6,038 | |
| 1,152 | 1 | Arch Capital Group Ltd. | 35,205 |
| 13,202 | Assured Guaranty Ltd. | 513,822 | |
| 3,734 | 1 | Athene Holding Ltd. | 171,279 |
| 759 | BancorpSouth Bank | 24,971 | |
| 11,267 | Bank of America Corp. | 347,925 | |
| 319 | Beneficial Mutual Bancorp | 5,184 | |
| 4,700 | 2 | Blackstone Mortgage Trust, Inc., Class A | 155,758 |
| 1,309 | CNO Financial Group, Inc. | 26,638 | |
| 485 | Cadence BanCorporation | 13,207 | |
| 415 | Cathay Bancorp, Inc. | 17,260 | |
| 2,010 | Citizens Financial Group, Inc. | 79,958 | |
| 4,570 | Comerica, Inc. | 443,016 | |
| 5,189 | 1 | E*Trade Financial Corp. | 310,354 |
| 705 | 1 | Enova International, Inc. | 21,855 |
| 158 | Enterprise Financial Services Corp. | 8,888 | |
| 792 | Everest Re Group Ltd. | 172,933 | |
| 1,592 | 1,2 | Ezcorp, Inc., Class A | 18,228 |
| 115 | Federal Agricultural Mortgage Association, Class C | 10,843 | |
| 20,900 | Fifth Third Bancorp | 618,431 | |
| 618 | First Bancorp, Inc. | 25,598 | |
| 244 | First Business Financial Services, Inc. | 5,797 | |
| 700 | First Defiance Financial Corp. | 22,512 | |
| 319 | First Guaranty Bancshares, Inc. | 8,422 | |
| 346 | First Merchants Corp. | 16,331 | |
| 1,166 | 1 | First NBC Bank Holding Co. | 50 |
| 528 | Fulton Financial Corp. | 9,161 | |
| 333 | Hancock Whitney Corp. | 16,733 | |
| 236 | 1 | Hometrust Bancshares, Inc. | 6,868 |
| 13,300 | Huntington Bancshares, Inc. | 205,352 | |
| 485 | Iberiabank Corp. | 40,304 | |
| 2,768 | Investors Bancorp, Inc. | 34,655 | |
| 17,097 | JPMorgan Chase & Co. | 1,965,300 |
| Shares or Principal Amount | Value | ||
| COMMON STOCKS—continued | |||
| Financials—continued | |||
| 16,358 | KeyCorp | $341,392 | |
| 1,424 | M & T Bank Corp. | 246,850 | |
| 1,091 | 1 | MGIC Investment Corp. | 13,616 |
| 115 | Mercantile Bank Corp. | 4,085 | |
| 473 | Meridian Bancorp, Inc. | 8,656 | |
| 121 | Midland States Bancorp, Inc. | 4,075 | |
| 468 | National Bank Holdings Corp., Class A | 18,523 | |
| 17,976 | Navient Corp. | 237,463 | |
| 15,700 | New Residential Investment Corp. | 280,873 | |
| 86 | 1 | Nicolet Bankshares, Inc. | 4,760 |
| 4,544 | Northern Trust Corp. | 496,296 | |
| 6,815 | PNC Financial Services Group | 987,016 | |
| 517 | Peapack-Gladstone Financial Corp. | 16,999 | |
| 6,300 | Popular, Inc. | 312,669 | |
| 93 | Preferred Bank Los Angeles, CA | 5,788 | |
| 22,418 | Prudential Financial | 2,262,200 | |
| 280 | Republic Bancorp, Inc. | 13,404 | |
| 138 | Sandy Spring Bancorp, Inc. | 5,397 | |
| 355 | Sierra Bancorp | 10,487 | |
| 204 | Simmons 1st National Corp., Class A | 6,079 | |
| 3,404 | State Street Corp. | 300,607 | |
| 689 | SunTrust Banks, Inc. | 49,656 | |
| 128 | 1 | Texas Capital Bancshares, Inc. | 11,622 |
| 16,974 | The Travelers Cos, Inc. | 2,208,996 | |
| 277 | TriCo Bancshares | 10,753 | |
| 223 | UMB Financial Corp. | 16,032 | |
| 299 | Universal Insurance Holdings, Inc. | 13,276 | |
| 271 | WSFS Financial Corp. | 15,366 | |
| 640 | Washington Federal, Inc. | 21,472 | |
| 1,722 | Waterstone Financial, Inc. | 29,274 | |
| 544 | Western New England Bancorp, Inc. | 5,902 | |
| 196 | Wintrust Financial Corp. | 17,195 | |
| TOTAL | 14,392,438 | ||
| Health Care—8.7% | |||
| 282 | 1,2 | AMAG Pharmaceutical, Inc. | 6,218 |
| 800 | AbbVie, Inc. | 73,784 | |
| 2,526 | 1 | Abiomed, Inc. | 895,543 |
| Shares or Principal Amount | Value | ||
| COMMON STOCKS—continued | |||
| Health Care—continued | |||
| 5,606 | 1 | Align Technology, Inc. | $1,999,380 |
| 199 | 1 | Amedisys, Inc. | 18,632 |
| 1,138 | 1 | athenahealth, Inc. | 171,508 |
| 227 | 1 | Audentes Therapeutics, Inc. | 8,546 |
| 9,573 | Baxter International, Inc. | 693,564 | |
| 685 | 1 | Bio Rad Laboratories, Inc., Class A | 210,055 |
| 15,586 | 1 | Celgene Corp. | 1,404,143 |
| 1,032 | Chemed Corp. | 326,143 | |
| 152 | 1 | Coherus Biosciences, Inc. | 2,896 |
| 15,524 | 1 | Community Health Systems, Inc. | 51,850 |
| 776 | Dentsply Sirona, Inc. | 37,333 | |
| 1,324 | 1 | DepoMed, Inc. | 11,731 |
| 146 | 1 | Enanta Pharmaceuticals, Inc. | 14,238 |
| 563 | 1 | Endo International PLC | 7,004 |
| 216 | 1,2 | G1 Therapeutics, Inc. | 11,092 |
| 320 | 1 | Genomic Health, Inc. | 17,178 |
| 336 | 1 | Globus Medical, Inc. | 17,297 |
| 629 | HCA Healthcare, Inc. | 78,141 | |
| 278 | 1 | Haemonetics Corp. | 27,144 |
| 354 | 1 | HealthEquity, Inc. | 26,727 |
| 327 | 1 | Heron Therapeutics, Inc. | 12,246 |
| 957 | 1 | Horizon Pharma PLC | 16,872 |
| 2,214 | Humana, Inc. | 695,594 | |
| 132 | 1 | ICU Medical, Inc. | 37,858 |
| 266 | 1 | IDEXX Laboratories, Inc. | 65,151 |
| 1,606 | 1 | Illumina, Inc. | 520,922 |
| 393 | 1 | Immunomedics, Inc. | 9,404 |
| 168 | 1 | Inogen, Inc. | 33,474 |
| 254 | 1 | Integer Holdings Corp. | 18,148 |
| 381 | 1 | Iradimed Corp. | 8,763 |
| 10,941 | Johnson & Johnson | 1,449,901 | |
| 140 | 1 | Ligand Pharmaceuticals, Inc., Class B | 30,566 |
| 22,002 | Lilly (Eli) & Co. | 2,174,018 | |
| 101 | 1 | Loxo Oncology, Inc. | 16,927 |
| 806 | Luminex Corp. | 27,291 | |
| 1,427 | Merck & Co., Inc. | 93,996 | |
| 130 | 1 | Mirati Therapeutics, Inc. | 7,982 |
| Shares or Principal Amount | Value | ||
| COMMON STOCKS—continued | |||
| Health Care—continued | |||
| 131 | 1 | Molina Healthcare, Inc. | $13,636 |
| 266 | 1 | Novocure Ltd. | 9,044 |
| 231 | 1 | NuVasive, Inc. | 13,409 |
| 544 | 1 | Orthofix International NV | 32,907 |
| 8,770 | 1 | PDL BioPharma, Inc. | 22,013 |
| 32,154 | Pfizer, Inc. | 1,283,909 | |
| 228 | 1 | Supernus Pharmaceuticals, Inc. | 12,073 |
| 345 | 1 | Ultragenyx Pharmaceutical, Inc. | 27,293 |
| 4,139 | 1 | Vertex Pharmaceuticals, Inc. | 724,532 |
| TOTAL | 13,468,076 | ||
| Industrials—6.8% | |||
| 2,951 | AGCO Corp. | 185,972 | |
| 571 | 1 | ASGN, Inc. | 51,561 |
| 1,448 | Acco Brands Corp. | 18,534 | |
| 120 | 1 | Aerovironment, Inc. | 8,833 |
| 17,704 | Allison Transmission Holdings, Inc. | 832,088 | |
| 2,035 | 1 | Atlas Air Worldwide Holdings, Inc. | 136,447 |
| 804 | C.H. Robinson Worldwide, Inc. | 74,153 | |
| 5,391 | CSX Corp. | 381,036 | |
| 280 | 1 | Caesarstone Ltd. | 4,410 |
| 6,473 | Caterpillar, Inc. | 930,817 | |
| 417 | 1 | Chart Industries, Inc. | 32,563 |
| 145 | 1 | Cimpress NV | 21,180 |
| 9,950 | Cintas Corp. | 2,034,576 | |
| 8,376 | 1 | Colfax Corp. | 270,545 |
| 3,106 | 1 | Copart, Inc. | 178,253 |
| 2,263 | 1 | CoStar Group, Inc. | 941,068 |
| 1,829 | Cummins, Inc. | 261,199 | |
| 1,577 | Deluxe Corp. | 92,933 | |
| 305 | Dover Corp. | 25,309 | |
| 1,032 | Ennis, Inc. | 22,446 | |
| 359 | Essendant, Inc. | 5,970 | |
| 241 | 1 | FTI Consulting, Inc. | 19,029 |
| 727 | Fortive Corp. | 59,672 | |
| 404 | Greenbrier Cos., Inc. | 22,887 | |
| 714 | 1 | Harsco Corp. | 18,100 |
| 202 | 1 | Herc Holdings, Inc. | 11,478 |
| Shares or Principal Amount | Value | ||
| COMMON STOCKS—continued | |||
| Industrials—continued | |||
| 472 | Hurco Cos., Inc. | $20,910 | |
| 407 | Ingersoll-Rand PLC | 40,094 | |
| 232 | Insperity, Inc. | 22,063 | |
| 3,004 | 1 | Jet Blue Airways Corp. | 54,072 |
| 727 | Kennametal, Inc. | 28,324 | |
| 261 | MSA Safety, Inc. | 26,330 | |
| 600 | Miller Herman, Inc. | 22,710 | |
| 874 | 1 | Nexeo Solutions, Inc. | 7,936 |
| 29,987 | Paccar, Inc. | 1,970,746 | |
| 10,000 | Pitney Bowes, Inc. | 87,300 | |
| 156 | 1 | Proto Labs, Inc. | 19,445 |
| 243 | Quad Graphics, Inc. | 4,996 | |
| 3,514 | R.R. Donnelley & Sons Co. | 20,733 | |
| 134 | Raytheon Co. | 26,430 | |
| 783 | Republic Services, Inc. | 56,752 | |
| 424 | Roper Technologies, Inc. | 128,006 | |
| 552 | Rush enterprises, Inc., Class A | 24,890 | |
| 10,666 | 1 | SPX Corp. | 395,709 |
| 247 | SkyWest, Inc. | 14,795 | |
| 642 | Spartan Motors, Inc. | 9,469 | |
| 316 | 1 | Taser International, Inc. | 21,466 |
| 1,105 | 1 | Titan Machinery, Inc. | 16,730 |
| 3,342 | Trinity Industries, Inc. | 127,330 | |
| 101 | Unifirst Corp. | 18,902 | |
| 442 | 1 | Univar, Inc. | 12,151 |
| 1,945 | 1 | Verisk Analytics, Inc. | 215,156 |
| 880 | W. W. Grainger, Inc. | 304,973 | |
| 607 | Waste Management, Inc. | 54,630 | |
| 262 | Werner Enterprises, Inc. | 9,759 | |
| 437 | 1 | XPO Logistics, Inc. | 43,578 |
| 1,161 | Xylem, Inc. | 88,886 | |
| TOTAL | 10,536,330 | ||
| Information Technology—13.4% | |||
| 5,610 | 1 | Adobe Systems, Inc. | 1,372,655 |
| 1,568 | 1 | Advanced Energy Industries, Inc. | 96,024 |
| 1,753 | 1 | Akamai Technologies, Inc. | 131,931 |
| 1,828 | 1 | Alphabet, Inc., Class A Shares | 2,243,358 |
| Shares or Principal Amount | Value | ||
| COMMON STOCKS—continued | |||
| Information Technology—continued | |||
| 6,503 | Apple, Inc. | $1,237,456 | |
| 10,107 | Applied Materials, Inc. | 491,503 | |
| 149 | 1 | Aspen Technology, Inc. | 14,273 |
| 90 | Blackbaud, Inc. | 8,983 | |
| 169 | 1 | CACI International, Inc., Class A | 29,609 |
| 105 | Cabot Microelectronics Corp. | 12,647 | |
| 624 | 1 | Care.com, Inc. | 11,244 |
| 327 | 1 | Cornerstone OnDemand, Inc. | 16,154 |
| 346 | 1 | Coupa Software, Inc. | 21,213 |
| 269 | 1 | Cray, Inc. | 6,712 |
| 570 | 1 | Diodes, Inc. | 21,181 |
| 620 | 1 | Etsy, Inc. | 25,333 |
| 9,745 | 1 | Facebook, Inc. | 1,681,792 |
| 1,006 | 1 | First Solar, Inc. | 52,664 |
| 452 | 1 | Five9, Inc. | 14,419 |
| 3,796 | 1 | Fortinet, Inc. | 238,806 |
| 127 | 1 | GrubHub, Inc. | 15,480 |
| 12,808 | HP, Inc. | 295,609 | |
| 6,300 | 1 | IAC Interactive Corp. | 927,675 |
| 1,900 | 1 | Insight Enterprises, Inc. | 95,513 |
| 37,097 | Intel Corp. | 1,784,366 | |
| 186 | Intuit, Inc. | 37,989 | |
| 17,511 | Juniper Networks, Inc. | 461,240 | |
| 650 | 1 | Kimball Electronics, Inc. | 13,228 |
| 4,136 | Lam Research Corp. | 788,487 | |
| 22 | Littelfuse, Inc. | 4,770 | |
| 78 | MKS Instruments, Inc. | 7,355 | |
| 10,686 | Mastercard, Inc., Class A | 2,115,828 | |
| 88 | Monolithic Power Systems | 11,676 | |
| 1,889 | Nvidia Corp. | 462,541 | |
| 7,425 | NetApp, Inc. | 575,586 | |
| 265 | 1 | New Relic, Inc. | 25,890 |
| 2,424 | 1 | Palo Alto Networks, Inc. | 480,582 |
| 344 | 1 | Paylocity Holding Corp. | 19,952 |
| 140 | Progress Software Corp. | 5,151 | |
| 70 | 1 | Proofpoint, Inc. | 7,984 |
| 245 | 1 | Qualys, Inc. | 21,339 |
| Shares or Principal Amount | Value | ||
| COMMON STOCKS—continued | |||
| Information Technology—continued | |||
| 4,037 | 1 | Red Hat, Inc. | $570,146 |
| 146 | 1 | RingCentral, Inc. | 10,768 |
| 319 | 1 | SPS Commerce, Inc. | 27,367 |
| 602 | 1 | SailPoint Technologies Holding | 14,502 |
| 14,910 | 1 | Salesforce.com, Inc. | 2,044,906 |
| 7,000 | 1 | Sanmina Corp. | 203,700 |
| 2,479 | 1 | ServiceNow, Inc. | 436,205 |
| 73 | 1 | Silicon Laboratories, Inc. | 6,953 |
| 1,164 | 1 | Splunk, Inc. | 111,860 |
| 26 | 1 | Stamps.com, Inc. | 6,786 |
| 7,975 | 1 | Synopsys, Inc. | 713,204 |
| 419 | 1 | TTM Technologies | 7,274 |
| 174 | 1 | Trade Desk, Inc./The | 14,672 |
| 567 | Travelport Worldwide Ltd. | 10,716 | |
| 129 | 1 | Verint Systems, Inc. | 5,792 |
| 23,570 | Vishay Intertechnology, Inc. | 589,250 | |
| 10,000 | Western Union Co. | 201,600 | |
| 209 | 1 | Yelp, Inc. | 7,708 |
| 190 | 1 | Zebra Technologies Co., Class A | 26,207 |
| 156 | 1 | Zendesk, Inc. | 8,497 |
| TOTAL | 20,904,311 | ||
| Materials—1.2% | |||
| 814 | 1 | AgroFresh Solutions, Inc. | 5,788 |
| 458 | Boise Cascade Co. | 19,808 | |
| 649 | Carpenter Technology Corp. | 35,546 | |
| 576 | Commercial Metals Corp. | 12,868 | |
| 3,600 | Domtar Corp. | 173,592 | |
| 4,179 | Ecolab, Inc. | 587,985 | |
| 1,392 | Gold Resource Corp. | 9,118 | |
| 892 | 1 | Intrepid Potash, Inc. | 3,809 |
| 890 | Louisiana-Pacific Corp. | 23,959 | |
| 8,026 | Newmont Mining Corp. | 294,394 | |
| 450 | Schnitzer Steel Industries, Inc., Class A | 14,827 | |
| 1,539 | Sherwin-Williams Co. | 678,283 | |
| 63 | Stepan Co. | 5,518 | |
| 195 | Trinseo SA | 14,566 | |
| TOTAL | 1,880,061 |
| Shares or Principal Amount | Value | ||
| COMMON STOCKS—continued | |||
| Real Estate—1.3% | |||
| 800 | Alexandria Real Estate Equities, Inc. | $101,952 | |
| 763 | 1 | Altisource Portfolio Solutions S.A. | 25,415 |
| 1,200 | American Tower Corp. | 177,888 | |
| 8,500 | DiamondRock Hospitality Co. | 101,320 | |
| 1,200 | EastGroup Properties, Inc. | 114,384 | |
| 3,500 | First Industrial Realty Trust | 113,925 | |
| 7,200 | Host Hotels & Resorts, Inc. | 150,768 | |
| 8,600 | Invitation Homes, Inc. | 198,746 | |
| 2,500 | Liberty Property Trust | 107,150 | |
| 4,100 | 2 | Pebblebrook Hotel Trust | 158,055 |
| 4,000 | Rexford Industrial Realty, Inc. | 122,560 | |
| 3,000 | STORE Capital Corp. | 82,350 | |
| 800 | Simon Property Group, Inc. | 140,968 | |
| 2,100 | Sun Communities, Inc. | 203,616 | |
| 9,000 | Sunstone Hotel Investors, Inc. | 146,430 | |
| 3,400 | Terreno Realty Corp. | 125,494 | |
| TOTAL | 2,071,021 | ||
| Telecommunication Services—0.9% | |||
| 8,238 | AT&T, Inc. | 263,369 | |
| 2,448 | 2 | Frontier Communications Corp. | 12,779 |
| 12,534 | 1 | T-Mobile USA, Inc. | 752,040 |
| 6,657 | Verizon Communications | 343,767 | |
| 2,031 | 1 | Vonage Holdings Corp. | 26,017 |
| TOTAL | 1,397,972 | ||
| Utilities—2.2% | |||
| 15,600 | AES Corp. | 208,416 | |
| 668 | Consolidated Edison Co. | 52,725 | |
| 17,125 | Entergy Corp. | 1,391,920 | |
| 8,645 | Exelon Corp. | 367,413 | |
| 447 | Northwestern Corp. | 26,521 | |
| 213 | New Jersey Resources Corp. | 9,851 | |
| 5,346 | NiSource, Inc. | 139,958 | |
| 99 | ONE Gas, Inc. | 7,627 | |
| 27,224 | P G & E Corp. | 1,172,810 | |
| 746 | PNM Resources, Inc. | 29,355 | |
| 767 | Portland General Electric Co. | 34,791 |
| Shares or Principal Amount | Value | ||
| COMMON STOCKS—continued | |||
| Utilities—continued | |||
| 179 | Southwest Gas Holdings, Inc. | $13,998 | |
| TOTAL | 3,455,385 | ||
| TOTAL COMMON STOCKS (IDENTIFIED COST $82,210,717) | 91,473,639 | ||
| ASSET-BACKED SECURITIES—0.5% | |||
| Auto Receivables—0.1% | |||
| $100,000 | Santander Drive Auto Receivables Trust 2016-2, Class C, 2.66%, 11/15/2021 | 99,621 | |
| Credit Card—0.2% | |||
| 350,000 | 3 | Capital One Multi-Asset Execution Trust 2004-B3, Class B3, 2.802%, (1-month USLIBOR +0.730%) 1/18/2022 | 351,217 |
| Home Equity Loan—0.0% | |||
| 17,926 | CS First Boston Mortgage Securities Corp. 2002-HE4, Class AF, 5.51%, 8/25/2032 | 18,277 | |
| Other—0.2% | |||
| 115,000 | 3 | Navistar Financial Dealer Note Master Trust 2016-1, Class A, 3.414%, (1-month USLIBOR +1.350%) 9/27/2021 | 115,182 |
| 128,000 | PFS Financing Corp. 2016-BA, Class A, 1.87%, 10/15/2021 | 126,252 | |
| TOTAL | 241,434 | ||
| TOTAL ASSET-BACKED SECURITIES (IDENTIFIED COST $711,809) | 710,549 | ||
| COLLATERALIZED MORTGAGE OBLIGATIONS—1.8% | |||
| Commercial Mortgage—1.8% | |||
| 170,000 | Banc of America Commercial Mortgage Trust 2016-UBS10, Class A4, 3.17%, 7/15/2049 | 163,383 | |
| 190,000 | Bank, Class A4, 3.488%, 11/15/2050 | 185,214 | |
| 447 | 4 | Bear Stearns Mortgage Securities, Inc. 1997-6, Class 1A, 6.209%, 3/25/2031 | 451 |
| 190,000 | CD Commercial Mortgage Trust 2016-CD1, Class A4, 2.724%, 8/10/2049 | 177,269 | |
| 200,000 | Citigroup Commercial Mortgage Trust 2013-GC11, Class B, 3.732%, 4/10/2046 | 199,048 | |
| 70,000 | Commercial Mortgage Pass-Through Certificates 2012-CR1, Class AM, 3.912%, 5/15/2045 | 70,903 | |
| 125,000 | Commercial Mortgage Pass-Through Certificates 2012-CR1, Class B, 4.612%, 5/15/2045 | 127,011 | |
| 200,000 | Commercial Mortgage Trust 2013-CR8, Class B, 4.0938% 6/10/2046 | 200,354 | |
| 200,000 | Commercial Mortgage Trust 2014-LC17, Class B, 4.49% 10/10/2047 | 204,641 | |
| 300,000 | Commercial Mortgage Trust 2015-DC1, Class AM, 3.724%, 2/10/2048 | 297,185 | |
| 200,000 | FREMF Mortgage Trust 2013-K25, Class B, 3.619%, 11/25/2045 | 198,452 |
| Shares or Principal Amount | Value | ||
| COLLATERALIZED MORTGAGE OBLIGATIONS—continued | |||
| Commercial Mortgage—continued | |||
| $1,344 | Federal Home Loan Mortgage Corp. REMIC 1311 K, 7.000%, 7/15/2022 | $1,417 | |
| 1,694 | Federal Home Loan Mortgage Corp. REMIC 1384 D, 7.000%, 9/15/2022 | 1,784 | |
| 4,962 | Federal Home Loan Mortgage Corp. REMIC 2497 JH, 6.000%, 9/15/2032 | 5,367 | |
| 73,715 | Federal Home Loan Mortgage Corp., 2.263%, 4/25/2025 | 71,124 | |
| 299,898 | Federal Home Loan Mortgage Corp., 2.566%, 9/25/2020 | 297,191 | |
| 4,946 | 3 | Federal National Mortgage Association REMIC 1993-113 SB, 9.749% (10-year Constant Maturity Treasury +48.285%), 7/25/2023 | 5,291 |
| 1,163 | Federal National Mortgage Association REMIC 2003-35 UC, 3.750%, 5/25/2033 | 1,175 | |
| 100,000 | GS Mortgage Securities Corp. II 2012-GCJ7, Class AS, 4.085%, 5/10/2045 | 101,678 | |
| 5,264 | Government National Mortgage Association REMIC 2002-17 B, 6.000%, 3/20/2032 | 5,712 | |
| 200,000 | JPMDB Commercial Mortgage Securities Trust 2016-C4, Class A3, 3.1413%, 12/15/2049 | 191,819 | |
| 50,000 | JPMDB Commercial Mortgage Securities Trust 2017-C5, Class A5, 3.6939%, 3/15/2050 | 49,737 | |
| 100,000 | Morgan Stanley Capital I 2012-C4, Class AS, 3.773%, 3/15/2045 | 101,180 | |
| 150,000 | UBS-Barclays Commercial Mortgage Trust 2013-C6, Class B, 3.875%, 4/10/2046 | 149,139 | |
| 25,000 | WF-RBS Commercial Mortgage Trust 2012-C6, Class B, 4.697%, 4/15/2045 | 25,812 | |
| TOTAL COLLATERALIZED MORTGAGE OBLIGATIONS (IDENTIFIED COST $2,938,071) | 2,832,337 | ||
| CORPORATE BONDS—12.1% | |||
| Basic Industry - Chemicals—0.0% | |||
| 35,000 | Incitec Pivot Finance LLC, Company Guarantee, Series 144A, 6.000%, 12/10/2019 | 36,055 | |
| 20,000 | RPM International, Inc., Sr. Unsecd. Note, 6.125%, 10/15/2019 | 20,661 | |
| TOTAL | 56,716 | ||
| Basic Industry - Metals & Mining—0.3% | |||
| 15,000 | Anglogold Ashanti Holdings PLC, Sr. Note, 6.500%, 4/15/2040 | 15,206 | |
| 62,000 | Carpenter Technology Corp., Sr. Unsecd. Note, 4.450%, 3/1/2023 | 61,954 | |
| 40,000 | Carpenter Technology Corp., Sr. Unsecd. Note, 5.200%, 7/15/2021 | 40,814 | |
| 20,000 | Newcrest Finance Property Ltd., Sr. Unsecd. Note, Series 144A, 4.200%, 10/1/2022 | 19,984 | |
| 100,000 | Reliance Steel & Aluminum Co., Sr. Unsecd. Note, 4.500%, 4/15/2023 | 101,951 | |
| 20,000 | Southern Copper Corp., Sr. Unsecd. Note, 6.75%, 4/16/2040 | 23,935 |
| Shares or Principal Amount | Value | ||
| CORPORATE BONDS—continued | |||
| Basic Industry - Metals & Mining—continued | |||
| $160,000 | Worthington Industries, Inc., Sr. Unsecd. Note, 6.500%, 4/15/2020 | $167,607 | |
| TOTAL | 431,451 | ||
| Basic Industry - Paper—0.0% | |||
| 10,000 | Weyerhaeuser Co., Sr. Unsecd. Note, 3.25%, 3/15/2023 | 9,764 | |
| 20,000 | Weyerhaeuser Co., Sr. Unsecd. Note, 4.700%, 3/15/2021 | 20,625 | |
| TOTAL | 30,389 | ||
| Capital Goods - Aerospace & Defense—0.2% | |||
| 100,000 | Arconic, Inc., 5.870%, 2/23/2022 | 103,750 | |
| 11,000 | Embraer Overseas Ltd., Sr. Unsecd. Note, Series 144A, 5.696%, 9/16/2023 | 11,499 | |
| 20,000 | Raytheon Co., Sr. Note, 4.400%, 2/15/2020 | 20,459 | |
| 10,000 | Rockwell Collins, Inc., Sr. Unsecd. Note, 3.100%, 11/15/2021 | 9,846 | |
| 40,000 | 3 | Textron Financial Corp., Jr. Sub. Note, Series 144A, 4.078%, (3-month USLIBOR +1.735%) 2/15/2042 | 36,300 |
| 50,000 | Textron, Inc., Sr. Unsecd. Note, 4.000%, 3/15/2026 | 49,402 | |
| 50,000 | Textron, Inc., Sr. Unsecd. Note, 4.300%, 3/1/2024 | 50,924 | |
| TOTAL | 282,180 | ||
| Capital Goods - Building Materials—0.2% | |||
| 200,000 | Allegion US Holdings Co., Inc., Sr. Unsecd. Note, 3.200%, 10/1/2024 | 188,666 | |
| 80,000 | Masco Corp., Sr. Unsecd. Note, 4.375%, 4/1/2026 | 79,652 | |
| TOTAL | 268,318 | ||
| Capital Goods - Diversified Manufacturing—0.1% | |||
| 15,000 | Avery Dennison Corp., Sr. Unsecd. Note, 5.375%, 4/15/2020 | 15,431 | |
| 30,000 | General Electric Capital Corp., Sr. Unsecd. Note, Series GMTN, 3.100%, 1/9/2023 | 29,428 | |
| 15,000 | Thomas & Betts Corp., Sr. Unsecd. Note, 5.625%, 11/15/2021 | 16,017 | |
| 200,000 | Valmont Industries, Inc., 5.25%, 10/1/2054 | 179,401 | |
| TOTAL | 240,277 | ||
| Capital Goods - Environmental—0.1% | |||
| 85,000 | Republic Services, Inc., Company Guarantee, 5.500%, 9/15/2019 | 87,369 | |
| Capital Goods - Packaging—0.0% | |||
| 45,000 | Packaging Corp. of America, Sr. Unsecd. Note, 3.900%, 6/15/2022 | 45,502 | |
| 10,000 | WestRock Co., Sr. Unsecd. Note, 4.45%, 3/1/2019 | 10,094 | |
| TOTAL | 55,596 | ||
| Communications - Cable & Satellite—0.2% | |||
| 200,000 | CCO Safari II LLC, 4.908%, 7/23/2025 | 204,042 | |
| 90,000 | NBC Universal, Inc., Sr. Unsecd. Note, 5.150%, 4/30/2020 | 93,175 |
| Shares or Principal Amount | Value | ||
| CORPORATE BONDS—continued | |||
| Communications - Cable & Satellite—continued | |||
| $30,000 | Time Warner Cable, Inc., Company Guarantee, 8.250%, 4/1/2019 | $31,007 | |
| TOTAL | 328,224 | ||
| Communications - Media & Entertainment—0.4% | |||
| 75,000 | 21st Century Fox America, Inc., Sr. Unsecd. Note, 5.400%, 10/1/2043 | 86,532 | |
| 30,000 | Grupo Televisa S.A., Sr. Unsecd. Note, 6.125%, 1/31/2046 | 33,060 | |
| 25,000 | Moody's Corp., Sr. Unsecd. Note, 5.500%, 9/1/2020 | 26,130 | |
| 250,000 | Omnicom Group, Inc., Sr. Unsecd. Note, 3.600%, 4/15/2026 | 239,211 | |
| 20,000 | Omnicom Group, Inc., Sr. Unsecd. Note, 3.625%, 5/1/2022 | 19,897 | |
| 150,000 | WPP Finance 2010, Sr. Unsecd. Note, 5.625%, 11/15/2043 | 155,845 | |
| TOTAL | 560,675 | ||
| Communications - Telecom Wireless—0.2% | |||
| 100,000 | American Tower Corp., Sr. Unsecd. Note, 3.400%, 2/15/2019 | 100,378 | |
| 150,000 | Crown Castle International Corp., Sr. Unsecd. Note, 3.700%, 6/15/2026 | 142,228 | |
| TOTAL | 242,606 | ||
| Communications - Telecom Wirelines—0.1% | |||
| 90,000 | Verizon Communications, Inc., Sr. Unsecd. Note, 4.150%, 3/15/2024 | 92,093 | |
| Consumer Cyclical - Automotive—0.6% | |||
| 175,000 | American Honda Finance Corp., Unsecd. Deb., Series MTN, 2.25%, 8/15/2019 | 174,297 | |
| 10,000 | DaimlerChrysler North America Holding Corp., Company Guarantee, 8.500%, 1/18/2031 | 14,142 | |
| 100,000 | Ford Motor Co., Sr. Unsecd. Note, 4.750%, 1/15/2043 | 86,546 | |
| 200,000 | Ford Motor Credit Co. LLC, Sr. Unsecd. Note, 3.336%, 3/18/2021 | 198,087 | |
| 160,000 | General Motors Financial Co., Inc., Sr. Unsecd. Note, 3.200%, 7/6/2021 | 157,848 | |
| 150,000 | General Motors Financial Company, Inc., Sr. Unsecd. Note, 3.100%, 1/15/2019 | 150,323 | |
| 100,000 | Hyundai Capital America, Sr. Unsecd. Note, Series 144A, 2.875%, 8/9/2018 | 100,007 | |
| TOTAL | 881,250 | ||
| Consumer Cyclical - Leisure—0.1% | |||
| 200,000 | Football Trust V, Pass Thru Cert., 5.35%, 10/5/2020 | 207,676 | |
| Consumer Cyclical - Lodging—0.1% | |||
| 30,000 | Hyatt Hotels Corp., Sr. Unsecd. Note, 3.375%, 7/15/2023 | 29,356 | |
| 50,000 | Marriott International, Inc., Sr. Unsecd. Note, 3.000%, 3/1/2019 | 49,993 | |
| TOTAL | 79,349 | ||
| Consumer Cyclical - Retailers—0.4% | |||
| 50,000 | Advance Auto Parts, Inc., 4.500%, 12/1/2023 | 50,971 | |
| 40,000 | AutoZone, Inc., Sr. Unsecd. Note, 3.125%, 4/21/2026 | 37,253 |
| Shares or Principal Amount | Value | ||
| CORPORATE BONDS—continued | |||
| Consumer Cyclical - Retailers—continued | |||
| $250,000 | AutoZone, Inc., Sr. Unsecd. Note, 3.250%, 4/15/2025 | $238,291 | |
| 175,000 | CVS Health Corp., Sr. Unsecd. Note, 2.875%, 6/1/2026 | 160,321 | |
| 10,000 | O'Reilly Automotive, Inc., Company Guarantee, 4.875%, 1/14/2021 | 10,340 | |
| 80,000 | Under Armour, Inc., Sr. Unsecd. Note, 3.25%, 6/15/2026 | 72,410 | |
| TOTAL | 569,586 | ||
| Consumer Cyclical - Services—0.3% | |||
| 200,000 | Alibaba Group Holding Ltd., Sr. Unsecd. Note, 2.800%, 6/6/2023 | 193,067 | |
| 125,000 | Amazon.com, Inc., Sr. Unsecd. Note, 3.800%, 12/5/2024 | 128,451 | |
| 65,000 | Expedia, Inc., Company Guarantee, 5.950%, 8/15/2020 | 68,101 | |
| 10,000 | University of Southern California, Sr. Unsecd. Note, 5.250%, 10/1/2111 | 11,719 | |
| 70,000 | Visa, Inc., Sr. Unsecd. Note, 3.15%, 12/14/2025 | 68,110 | |
| TOTAL | 469,448 | ||
| Consumer Non-Cyclical - Food/Beverage—0.8% | |||
| 100,000 | Anheuser-Busch InBev Worldwide, Inc., Sr. Unsecd. Note, 4.600%, 4/15/2048 | 100,943 | |
| 300,000 | Danone SA, Sr. Unsecd. Note, Series 144A, 2.947%, 11/2/2026 | 277,585 | |
| 140,000 | Flowers Foods, Inc., Sr. Unsecd. Note, 3.500%, 10/1/2026 | 130,913 | |
| 80,000 | General Mills, Inc., Sr. Unsecd. Note, 4.700%, 4/17/2048 | 79,133 | |
| 270,000 | Heineken NV, Sr. Unsecd. Note, Series 144A, 3.500%, 1/29/2028 | 261,302 | |
| 200,000 | Kerry Group Financial Services, Sr. Unsecd. Note, Series 144A, 3.200%, 4/9/2023 | 195,382 | |
| 60,000 | McCormick & Co., Inc., Sr. Unsecd. Note, 3.400%, 8/15/2027 | 57,270 | |
| 50,000 | Mead Johnson Nutrition Co., Sr. Unsecd. Note, 4.125%, 11/15/2025 | 50,857 | |
| 125,000 | Tyson Foods, Inc., Sr. Unsecd. Note, 3.55%, 6/2/2027 | 119,182 | |
| TOTAL | 1,272,567 | ||
| Consumer Non-Cyclical - Health Care—0.2% | |||
| 15,000 | Agilent Technologies, Inc., Sr. Unsecd. Note, 3.200%, 10/1/2022 | 14,671 | |
| 300,000 | Becton Dickinson & Co., Sr. Unsecd. Note, 4.685%, 12/15/2044 | 295,263 | |
| 10,000 | Laboratory Corp. of America Holdings, Sr. Unsecd. Note, 3.750%, 8/23/2022 | 10,058 | |
| TOTAL | 319,992 | ||
| Consumer Non-Cyclical - Pharmaceuticals—0.2% | |||
| 300,000 | Abbott Laboratories, Sr. Unsecd. Note, 3.75%, 11/30/2026 | 298,380 | |
| Consumer Non-Cyclical - Products—0.1% | |||
| 200,000 | Newell Rubbermaid, Inc., Sr. Unsecd. Note, 4.200%, 4/1/2026 | 193,173 | |
| Consumer Non-Cyclical - Tobacco—0.0% | |||
| 24,000 | Altria Group, Inc., 9.250%, 8/6/2019 | 25,495 |
| Shares or Principal Amount | Value | ||
| CORPORATE BONDS—continued | |||
| Energy - Independent—0.3% | |||
| $250,000 | Canadian Natural Resources Ltd., 3.900%, 2/1/2025 | $248,426 | |
| 125,000 | Cimarex Energy Co., Sr. Unsecd. Note, 3.900%, 5/15/2027 | 120,540 | |
| 30,000 | EOG Resources, Inc., Note, 5.625%, 6/1/2019 | 30,653 | |
| 100,000 | Marathon Oil Corp., Sr. Unsecd. Note, 3.85%, 6/1/2025 | 98,318 | |
| TOTAL | 497,937 | ||
| Energy - Integrated—0.2% | |||
| 135,000 | BP Capital Markets PLC, 3.119%, 5/4/2026 | 129,616 | |
| 75,000 | Husky Energy, Inc., 4.000%, 4/15/2024 | 74,909 | |
| 53,000 | Petrobras Global Finance BV, Sr. Unsecd. Note, Series 144A, 5.299%, 1/27/2025 | 50,814 | |
| 25,000 | Petroleos Mexicanos, Sr. Unsecd. Note, 4.875%, 1/18/2024 | 24,750 | |
| TOTAL | 280,089 | ||
| Energy - Midstream—0.6% | |||
| 100,000 | Energy Transfer Partners LP, Sr. Unsecd. Note, 4.05%, 3/15/2025 | 97,752 | |
| 75,000 | Energy Transfer Partners LP, Sr. Unsecd. Note, 4.900%, 2/1/2024 | 76,858 | |
| 170,000 | Enterprise Products Operating LLC, Sr. Unsecd. Note, 3.95%, 2/15/2027 | 170,086 | |
| 10,000 | Florida Gas Transmission Co. LLC, Sr. Unsecd. Note, Series 144A, 5.450%, 7/15/2020 | 10,347 | |
| 150,000 | Kinder Morgan Energy Partners LP, Sr. Unsecd. Note, 5.000%, 3/1/2043 | 145,010 | |
| 100,000 | Kinder Morgan, Inc., 5.05%, 2/15/2046 | 98,180 | |
| 40,000 | MPLX LP, Sr. Unsecd. Note, 4.125%, 3/1/2027 | 39,313 | |
| 195,000 | ONEOK, Inc., Sr Unsecured Note, 4.95%, 7/13/2047 | 198,644 | |
| 20,000 | Texas Eastern Transmission LP, Sr. Unsecd. Note, Series 144A, 2.800%, 10/15/2022 | 19,175 | |
| 30,000 | Williams Partners LP, Sr. Unsecd. Note, 4.125%, 11/15/2020 | 30,357 | |
| TOTAL | 885,722 | ||
| Energy - Oil Field Services—0.1% | |||
| 15,000 | Nabors Industries, Inc., Company Guarantee, 5.000%, 9/15/2020 | 15,150 | |
| 20,000 | Nabors Industries, Inc., Sr. Unsecd. Note, 4.625%, 9/15/2021 | 19,750 | |
| 50,000 | Nabors Industries, Inc., Sr. Unsecd. Note, 5.100%, 9/15/2023 | 47,000 | |
| TOTAL | 81,900 | ||
| Energy - Refining—0.0% | |||
| 10,000 | Marathon Petroleum Corp., Sr. Unsecd. Note, 6.500%, 3/1/2041 | 11,793 | |
| Financial Institution - Banking—2.7% | |||
| 74,000 | American Express Co., 2.650%, 12/2/2022 | 71,282 |
| Shares or Principal Amount | Value | ||
| CORPORATE BONDS—continued | |||
| Financial Institution - Banking—continued | |||
| $250,000 | American Express Credit Corp., Sr. Unsecd. Note, Series MTN, 2.25%, 5/5/2021 | $243,846 | |
| 50,000 | BB&T Corp., Sr. Unsecd. Note, Series MTN, 2.250%, 2/1/2019 | 49,925 | |
| 300,000 | Bank of America Corp., Sr. Unsecd. Note, Series GMTN, 3.500%, 4/19/2026 | 291,009 | |
| 250,000 | 3 | Bank of America Corp., Sr. Unsecd. Note, Series MTN, 2.987%, (3-month USLIBOR +0.650%) 10/1/2021 | 251,311 |
| 100,000 | Bank of America Corp., Sr. Unsecd. Note, Series MTN, 5.00%, 5/13/2021 | 104,633 | |
| 200,000 | Bank of America Corp., Sub. Note, Series L, 3.95%, 4/21/2025 | 196,519 | |
| 200,000 | Citigroup, Inc., Sr. Unsecd. Note, 2.700%, 3/30/2021 | 196,136 | |
| 250,000 | Citigroup, Inc., Sr. Unsecd. Note, 3.300%, 4/27/2025 | 239,826 | |
| 170,000 | Citigroup, Inc., Sr. Unsecd. Note, 3.400%, 5/1/2026 | 162,570 | |
| 25,000 | City National Corp., Sr. Unsecd. Note, 5.250%, 09/15/2020 | 26,063 | |
| 30,000 | Comerica, Inc., 3.800%, 7/22/2026 | 29,061 | |
| 80,000 | Fifth Third Bancorp, Sr. Unsecd. Note, 2.875%, 7/27/2020 | 79,556 | |
| 275,000 | Goldman Sachs Group, Inc., Sr. Unsecd. Note, 3.625%, 1/22/2023 | 274,484 | |
| 25,000 | Goldman Sachs Group, Inc., Sr. Unsecd. Note, 6.125%, 2/15/2033 | 29,238 | |
| 150,000 | Goldman Sachs Group, Inc., Sr. Unsecd. Note, 6.250%, 2/01/2041 | 181,424 | |
| 50,000 | HSBC Holdings PLC, Sr. Unsecd. Note, 5.100%, 4/5/2021 | 52,118 | |
| 250,000 | Huntington National Bank, Sr. Unsecd. Note, 2.200%, 4/1/2019 | 249,198 | |
| 400,000 | J.P. Morgan Chase & Co., Sub. Note, 3.375%, 5/1/2023 | 391,359 | |
| 325,000 | JPMorgan Chase & Co., Sr. Unsecd. Note, 5.400%, 1/6/2042 | 366,326 | |
| 300,000 | Morgan Stanley, 4.300%, 01/27/2045 | 293,295 | |
| 120,000 | Morgan Stanley, Sr. Unsecd. Note, Series GMTN, 2.500%, 4/21/2021 | 117,224 | |
| 210,000 | Regions Financial Corp., Sr. Unsecd. Note, 3.200%, 2/8/2021 | 208,942 | |
| 130,000 | SunTrust Banks, Inc., Sr. Unsecd. Note, 2.900%, 3/3/2021 | 128,596 | |
| TOTAL | 4,233,941 | ||
| Financial Institution - Broker/Asset Mgr/Exchange—0.1% | |||
| 80,000 | Invesco Finance PLC, Sr. Unsecd. Note, 3.75%, 1/15/2026 | 79,207 | |
| 125,000 | Jefferies Group LLC, Sr. Unsecd. Note, 6.875%, 4/15/2021 | 134,611 | |
| 13,000 | Raymond James Financial, Inc., Sr. Unsecd. Note, 5.625%, 4/1/2024 | 14,011 | |
| TOTAL | 227,829 | ||
| Financial Institution - Finance Companies—0.3% | |||
| 170,000 | AerCap Ireland Capital Ltd / AerCap Global Aviation Trust, Sr. Unsecd. Note, 3.95%, 2/1/2022 | 169,704 | |
| 250,000 | GE Capital International Funding, Inc., Sr. Unsecd. Note, 4.418%, 11/15/2035 | 243,669 | |
| TOTAL | 413,373 |
| Shares or Principal Amount | Value | ||
| CORPORATE BONDS—continued | |||
| Financial Institution - Insurance - Health—0.1% | |||
| $100,000 | UnitedHealth Group, Inc., Sr. Unsecd. Note, 4.25%, 6/15/2048 | $102,474 | |
| 45,000 | UnitedHealth Group, Inc., Sr. Unsecd. Note, 4.75%, 7/15/2045 | 49,029 | |
| TOTAL | 151,503 | ||
| Financial Institution - Insurance - Life—0.7% | |||
| 200,000 | Aflac, Inc., Sr. Unsecd. Note, 3.625%, 6/15/2023 | 201,044 | |
| 25,000 | American International Group, Inc., 4.500%, 7/16/2044 | 23,990 | |
| 35,000 | American International Group, Inc., Sr. Unsecd. Note, 4.125%, 2/15/2024 | 35,339 | |
| 125,000 | American International Group, Inc., Sr. Unsecd. Note, 4.200%, 4/1/2028 | 124,976 | |
| 10,000 | Lincoln National Corp., Sr. Unsecd. Note, 4.200%, 3/15/2022 | 10,210 | |
| 275,000 | Mass Mutual Global Funding II, Series 144A, 2.000%, 4/15/2021 | 265,419 | |
| 10,000 | MetLife, Inc., Jr. Sub. Note, 10.75%, 8/1/2039 | 15,388 | |
| 250,000 | MetLife, Inc., Sr. Unsecd. Note, 3.600%, 4/10/2024 | 249,277 | |
| 15,000 | Penn Mutual Life Insurance Co., Sr. Note, Series 144A, 7.625%, 6/15/2040 | 20,066 | |
| 10,000 | Principal Financial Group, Inc., Sr. Unsecd. Note, 3.125%, 5/15/2023 | 9,786 | |
| 10,000 | Principal Financial Group, Inc., Sr. Unsecd. Note, 3.300%, 9/15/2022 | 9,907 | |
| 50,000 | Prudential Financial, Inc., Sr. Unsecd. Note, Series MTN, 6.200%, 11/15/2040 | 60,250 | |
| TOTAL | 1,025,652 | ||
| Financial Institution - Insurance - P&C—0.1% | |||
| 100,000 | Liberty Mutual Group, Inc., 4.85%, Series 144A, 8/1/2044 | 100,078 | |
| 65,000 | Nationwide Mutual Insurance Co., Sub. Note, Series 144A, 9.375%, 8/15/2039 | 101,322 | |
| TOTAL | 201,400 | ||
| Financial Institution - REIT - Apartment—0.1% | |||
| 20,000 | Post Apartment Homes LP, Sr. Unsecd. Note, 3.375%, 12/1/2022 | 19,680 | |
| 10,000 | UDR, Inc., Company Guarantee, Series 0001, 4.625%, 1/10/2022 | 10,282 | |
| 70,000 | UDR, Inc., Sr. Unsecd. Note, Series MTN, 2.95%, 9/1/2026 | 64,126 | |
| TOTAL | 94,088 | ||
| Financial Institution - REIT - Healthcare—0.1% | |||
| 40,000 | Health Care REIT, Inc., Sr. Unsecd. Note, 6.125%, 04/15/2020 | 41,802 | |
| 50,000 | Healthcare Trust of America, 3.700%, 4/15/2023 | 49,064 | |
| TOTAL | 90,866 | ||
| Financial Institution - REIT - Office—0.1% | |||
| 50,000 | Alexandria Real Estate Equities, Inc., Sr. Unsecd. Note, 3.900%, 6/15/2023 | 50,102 |
| Shares or Principal Amount | Value | ||
| CORPORATE BONDS—continued | |||
| Financial Institution - REIT - Office—continued | |||
| $70,000 | Alexandria Real Estate Equities, Inc., Sr. Unsecd. Note, 3.95%, 1/15/2028 | $67,343 | |
| 50,000 | Alexandria Real Estate Equities, Inc., Sr. Unsecd. Note, 4.600%, 4/1/2022 | 51,491 | |
| 55,000 | Boston Properties LP, Sr. Unsecd. Note, 5.875%, 10/15/2019 | 56,456 | |
| TOTAL | 225,392 | ||
| Financial Institution - REIT - Other—0.0% | |||
| 75,000 | WP Carey, Inc., Sr. Unsecd. Note, 4.600%, 4/1/2024 | 75,761 | |
| Financial Institution - REIT - Retail—0.0% | |||
| 50,000 | Kimco Realty Corp., Sr. Unsecd. Note, 3.400%, 11/1/2022 | 49,263 | |
| 20,000 | Regency Centers LP, Company Guarantee, 4.800%, 4/15/2021 | 20,511 | |
| TOTAL | 69,774 | ||
| Sovereign—0.0% | |||
| 30,000 | Corp Andina De Fomento, Sr. Unsecd. Note, 4.375%, 6/15/2022 | 30,941 | |
| Technology—0.5% | |||
| 30,000 | Apple, Inc., Sr. Unsecd. Note, 2.400%, 5/3/2023 | 28,969 | |
| 140,000 | Automatic Data Processing, Inc., 3.375%, 9/15/2025 | 139,436 | |
| 20,000 | Corning, Inc., Unsecd. Note, 4.750%, 3/15/2042 | 20,155 | |
| 240,000 | Diamond 1 Finance Corp./Diamond 2 Finance Corp., Sr. Secd. Note, Series 144A, 6.02%, 6/15/2026 | 253,803 | |
| 125,000 | Equifax, Inc., Sr. Unsecd. Note, 2.300%, 6/1/2021 | 120,530 | |
| 53,000 | Fidelity National Information Services, Inc., Sr. Unsecd. Note, 3.500%, 4/15/2023 | 52,545 | |
| 70,000 | Hewlett Packard Enterprise Co., Sr. Unsecd. Note, 3.600%, 10/15/2020 | 70,428 | |
| 20,000 | Ingram Micro, Inc., Sr. Unsecd. Note, 5.000%, 8/10/2022 | 19,817 | |
| 50,000 | Total System Services, Inc., Sr. Unsecd. Note, 4.800%, 4/1/2026 | 51,753 | |
| 10,000 | Verisk Analytics, Inc., Sr. Unsecd. Note, 4.125%, 9/12/2022 | 10,116 | |
| 25,000 | Verisk Analytics, Inc., Sr. Unsecd. Note, 4.875%, 1/15/2019 | 25,190 | |
| 50,000 | Verisk Analytics, Inc., Sr. Unsecd. Note, 5.500%, 6/15/2045 | 51,160 | |
| TOTAL | 843,902 | ||
| Transportation - Railroads—0.2% | |||
| 50,000 | Burlington Northern Santa Fe Corp., Deb., 5.750%, 5/1/2040 | 59,818 | |
| 30,000 | Kansas City Southern Industries, Inc., Sr. Unsecd. Note, 3.00%, 5/15/2023 | 28,738 | |
| 225,000 | Kansas City Southern Industries, Inc., Sr. Unsecd. Note, 3.125%, 6/1/2026 | 206,901 | |
| TOTAL | 295,457 |
| Shares or Principal Amount | Value | ||
| CORPORATE BONDS—continued | |||
| Transportation - Services—0.2% | |||
| $50,000 | Ryder System, Inc., Sr. Unsecd. Note, Series MTN, 2.450%, 11/15/2018 | $49,983 | |
| 70,000 | Ryder System, Inc., Sr. Unsecd. Note, Series MTN, 2.800%, 3/1/2022 | 68,280 | |
| 200,000 | Ryder System, Inc., Sr. Unsecd. Note, Series MTN, 3.75%, 6/9/2023 | 200,067 | |
| 30,000 | United Parcel Service, Inc., Sr. Unsecd. Note, 3.125%, 1/15/2021 | 30,059 | |
| TOTAL | 348,389 | ||
| Utility - Electric—1.0% | |||
| 5,000 | Consolidated Edison Co., Sr. Unsecd. Note, 6.650%, 4/1/2019 | 5,127 | |
| 110,000 | Duke Energy Corp., Sr. Unsecd. Note, 2.65%, 9/1/2026 | 100,085 | |
| 70,000 | Electricite de France SA, Note, Series 144A, 5.600%, 1/27/2040 | 76,113 | |
| 140,000 | Emera US Finance LP, Sr. Unsecd. Note, 4.75%, 6/15/2046 | 139,892 | |
| 170,000 | EverSource Energy, Sr. Unsecd. Note, 3.350%, 3/15/2026 | 163,114 | |
| 200,000 | Exelon Corp., Sr. Unsecd. Note, 3.400%, 4/15/2026 | 191,568 | |
| 100,000 | Exelon Generation Co. LLC, Sr. Unsecd. Note, 4.250%, 6/15/2022 | 102,181 | |
| 10,000 | Great Plains Energy, Inc., Note, 4.850%, 6/1/2021 | 10,245 | |
| 20,000 | Indiana Michigan Power Co., Sr Unsecured Note, Series L, 3.75%, 7/1/2047 | 18,518 | |
| 70,000 | Indiana Michigan Power Co., Sr. Unsecd. Note, Series K, 4.55%, 3/15/2046 | 73,066 | |
| 110,000 | National Rural Utilities Cooperative Finance Corp., Sr. Sub., 5.250%, 4/20/2046 | 112,550 | |
| 25,000 | National Rural Utilities Cooperative Finance Corp., Sr. Unsecd. Note, Series MTNC, 8.00%, 3/1/2032 | 34,605 | |
| 50,000 | NextEra Energy Capital Holdings, Inc., Sr. Unsecd. Note, 2.700%, 9/15/2019 | 49,842 | |
| 250,000 | PPL Capital Funding, Inc., Sr. Unsecd. Note, 3.100%, 5/15/2026 | 232,786 | |
| 50,000 | Progress Energy, Inc., 7.050%, 3/15/2019 | 51,292 | |
| 175,000 | Southern Co., Sr. Unsecd. Note, 3.25%, 7/1/2026 | 166,361 | |
| 10,000 | TECO Finance, Inc., Company Guarantee, 5.150%, 3/15/2020 | 10,257 | |
| 40,000 | UIL Holdings Corp., Sr. Unsecd. Note, 4.625%, 10/1/2020 | 40,864 | |
| TOTAL | 1,578,466 | ||
| Utility - Natural Gas—0.1% | |||
| 20,000 | Atmos Energy Corp., 8.500%, 3/15/2019 | 20,688 | |
| 50,000 | Enbridge Energy Partners LP, Sr. Unsecd. Note, 4.200%, 9/15/2021 | 50,478 | |
| 65,000 | National Fuel Gas Co., Sr. Unsecd. Note, 3.750%, 3/1/2023 | 64,129 | |
| TOTAL | 135,295 | ||
| TOTAL CORPORATE BONDS (IDENTIFIED COST $18,873,740) | 18,792,280 |
| Shares or Principal Amount | Value | ||
| U.S. TREASURY—2.7% | |||
| $134,920 | U.S. Treasury Inflation-Protected Bond, 1.375%, 2/15/2044 | $148,426 | |
| 106,138 | 5 | U.S. Treasury Inflation-Protected Note, 0.125%, 4/15/2021 | 103,798 |
| 166,715 | U.S. Treasury Inflation-Protected Note, 0.125%, 1/15/2022 | 162,541 | |
| 101,982 | U.S. Treasury Inflation-Protected Note, 0.500%, 1/15/2028 | 98,535 | |
| 268,373 | U.S. Treasury Inflation-Protected Note, 0.625%, 4/15/2023 | 265,624 | |
| 85,000 | United States Treasury Bond, 2.500%, 2/15/2045 | 76,032 | |
| 125,000 | United States Treasury Bond, 3.125%, 5/15/2048 | 126,074 | |
| 30,000 | United States Treasury Note, 1.875%, 3/31/2022 | 29,029 | |
| 10,000 | United States Treasury Note, 2.250%, 11/15/2024 | 9,621 | |
| 200,000 | United States Treasury Note, 2.250%, 2/29/2020 | 198,965 | |
| 45,000 | United States Treasury Note, 2.250%, 2/15/2027 | 42,616 | |
| 125,000 | United States Treasury Note, 2.250%, 11/15/2027 | 117,775 | |
| 700,000 | United States Treasury Note, 2.500%, 6/30/2020 | 697,791 | |
| 1,300,000 | United States Treasury Note, 2.625%, 6/30/2023 | 1,286,899 | |
| 185,000 | United States Treasury Note, 2.750%, 5/31/2023 | 184,247 | |
| 525,000 | United States Treasury Note, 2.750%, 6/30/2025 | 519,283 | |
| 200,000 | United States Treasury Note, 2.875%, 5/31/2025 | 199,385 | |
| TOTAL U.S. TREASURY (IDENTIFIED COST $4,295,967) | 4,266,641 | ||
| EXCHANGE-TRADED FUNDS—6.8% | |||
| 132,100 | iShares MSCI EAFE ETF | 9,099,048 | |
| 27,800 | iShares Core MSCI Emerging Markets ETF | 1,503,980 | |
| TOTAL EXCHANGE-TRADED FUNDS (IDENTIFIED COST $10,381,810) | 10,603,028 | ||
| INVESTMENT COMPANIES—17.6% | |||
| 235,533 | Emerging Markets Core Fund | 2,254,055 | |
| 218,141 | Federated Bank Loan Core Fund | 2,194,495 | |
| 593,845 | Federated Government Obligations Fund, Premier Shares, 1.80%6 | 593,845 | |
| 4,928,376 | Federated Institutional Prime Value Obligations Fund, Institutional Shares, 2.08%6 | 4,929,361 | |
| 1,196,190 | Federated Mortgage Core Portfolio | 11,411,649 | |
| 335,486 | Federated Project and Trade Finance Core Fund | 3,052,926 | |
| 482,388 | High Yield Bond Portfolio | 3,010,100 | |
| TOTAL INVESTMENT COMPANIES (IDENTIFIED COST $28,388,121) | 27,446,431 | ||
| TOTAL INVESTMENT IN SECURITIES—100.3% (IDENTIFIED COST $147,800,235)7 | 156,124,905 | ||
| OTHER ASSETS AND LIABILITIES - NET—(0.3)%8 | (459,130) | ||
| TOTAL NET ASSETS—100% | $155,665,775 |
| Description | Number of Contracts | Notional Value | Expiration Date | Value and Unrealized Appreciation (Depreciation) |
| 1United States Treasury Note 2-Year Long Futures | 18 | $3,804,750 | September 2018 | $(6,750) |
| 1United States Treasury Note 10-Year Ultra Long Futures | 1 | $127,109 | September 2018 | $(1,143) |
| 1United States Treasury Ultra Bond Long Futures | 12 | $1,882,875 | September 2018 | $28,866 |
| 1United States Treasury Note 5-Year Short Futures | 1 | $113,125 | September 2018 | $349 |
| 1United States Treasury Note 10-Year Short Futures | 23 | $2,746,703 | September 2018 | $(403) |
| NET UNREALIZED APPRECIATION ON FUTURES CONTRACTS | $20,919 | |||
| Affiliates | Balance of Shares Held 7/31/2017 | Purchases/ Additions | Sales/ Reductions |
| Emerging Markets Core Fund | 121,734 | 131,568 | (17,769) |
| Federated Bank Loan Core Fund | 167,174 | 129,660 | (78,693) |
| Federated Government Obligations Fund, Premier Shares* | — | 3,220,212 | (2,626,367) |
| Federated Institutional Prime Value Obligations Fund, Institutional Shares | 3,984,935 | 44,258,080 | (43,314,639) |
| Federated Mortgage Core Portfolio | 819,800 | 682,814 | (306,424) |
| Federated Project and Trade Finance Core Fund | 320,743 | 14,743 | — |
| High Yield Bond Portfolio | 482,432 | 235,945 | (235,989) |
| TOTAL OF AFFILIATED TRANSACTIONS | 5,896,818 | 48,673,022 | (46,579,881) |
| Balance of Shares Held 7/31/2018 | Value | Change in Unrealized Appreciation/ Depreciation | Net Realized Gain/(Loss) | Dividend Income | Gain Distribution Received |
| 235,533 | $2,254,055 | $(92,092) | $(1,056) | $97,672 | $2,133 |
| 218,141 | $2,194,495 | $(20,943) | $8,023 | $94,471 | $— |
| 593,845 | $593,845 | N/A | N/A | $1,462 | $— |
| 4,928,376 | $4,929,361 | $709 | $(571) | $48,146 | $— |
| 1,196,190 | $11,411,649 | $(196,751) | $(59,595) | $251,028 | $— |
| 335,486 | $3,052,926 | $(22,272) | $— | $133,977 | $— |
| 482,388 | $3,010,100 | $(77,875) | $(25,638) | $177,790 | $— |
| 7,989,959 | $27,446,431 | $(409,224) | $(78,837) | $804,546 | $2,133 |
| * | All or a portion of the balance/activity for the fund relates to cash collateral received on securities lending transactions. |
| 1 | Non-income-producing security. |
| 2 | All or a portion of these securities are temporarily on loan to unaffiliated broker/dealers. |
| 3 | Floating/variable note with current rate and current maturity or next reset date shown. |
| 4 | JPMorgan Chase & Co. has fully and unconditionally guaranteed Bear Stearns' outstanding registered debt securities. |
| 5 | All or a portion of this security is pledged as collateral to ensure the Fund is able to satisfy the obligations of its outstanding futures contracts. |
| 6 | 7-day net yield. |
| 7 | The cost of investments for federal tax purposes amounts to $147,724,409. |
| 8 | Assets, other than investments in securities, less liabilities. See Statement of Assets and Liabilities. |
| Valuation Inputs | ||||
| Level 1— Quoted Prices | Level 2— Other Significant Observable Inputs | Level 3— Significant Unobservable Inputs | Total | |
| Equity Securities: | ||||
| Common Stocks | ||||
| Domestic | $89,331,465 | $— | $— | $89,331,465 |
| International | 2,142,174 | — | — | 2,142,174 |
| Debt Securities: | ||||
| Asset-Backed Securities | — | 710,549 | — | 710,549 |
| Collateralized Mortgage Obligations | — | 2,832,337 | — | 2,832,337 |
| Corporate Bonds | — | 18,792,280 | — | 18,792,280 |
| U.S. Treasury | — | 4,266,641 | — | 4,266,641 |
| Exchange-Traded Funds | 10,603,028 | — | — | 10,603,028 |
| Investment Companies1 | 5,523,206 | — | — | 27,446,431 |
| TOTAL SECURITIES | $107,599,873 | $26,601,807 | $— | $156,124,905 |
| Other Financial Instruments2 | ||||
| Assets | $29,215 | $— | $— | $29,215 |
| Liabilities | (8,296) | — | — | (8,296) |
| TOTAL OTHER FINANCIAL INSTRUMENTS | $20,919 | $— | $— | $20,919 |
| 1 | As permitted by U.S. generally accepted accounting principles (GAAP), Investment Companies valued at $21,923,225 are measured at fair value using the net asset value (NAV) per share practical expedient and have not been categorized in the chart above but are included in the Total column. The amount included herein is intended to permit reconciliation of the fair value classifications to the amounts presented on the Statement of Assets and Liabilities. The price of shares redeemed in Emerging Markets Core Fund, Federated Bank Loan Core Fund, Federated Mortgage Core Portfolio and High Yield Bond Portfolio is the next determined NAV after receipt of a shareholder redemption request. The price of shares redeemed of Federated Project and Trade Finance Core Fund may be determined as of the closing NAV of the fund up to twenty-four days after receipt of a shareholder redemption request. |
| 2 | Other Financial Instruments are futures contracts. |
| ETF | —Exchange-Traded Fund |
| FREMF | —Freddie Mac Multifamily K-Deals |
| GMTN | —Global Medium Term Note |
| LIBOR | —London Interbank Offered Rate |
| MTN | —Medium Term Note |
| REIT | —Real Estate Investment Trust |
| REMIC | —Real Estate Mortgage Investment Conduit |
| Year Ended July 31 | 2018 | 2017 | 2016 | 2015 | 2014 |
| Net Asset Value, Beginning of Period | $17.74 | $16.52 | $16.83 | $16.07 | $14.35 |
| Income From Investment Operations: | |||||
| Net investment income (loss) | 0.211 | 0.261 | 0.241 | 0.201 | 0.171 |
| Net realized and unrealized gain (loss) | 1.89 | 1.23 | (0.31) | 0.74 | 1.70 |
| TOTAL FROM INVESTMENT OPERATIONS | 2.10 | 1.49 | (0.07) | 0.94 | 1.87 |
| Less Distributions: | |||||
| Distributions from net investment income | (0.25) | (0.27) | (0.24) | (0.18) | (0.15) |
| Net Asset Value, End of Period | $19.59 | $17.74 | $16.52 | $16.83 | $16.07 |
| Total Return2 | 11.91% | 9.11% | (0.37)% | 5.89% | 13.06% |
| Ratios to Average Net Assets: | |||||
| Net expenses | 1.32% | 1.26% | 1.30% | 1.30% | 1.30% |
| Net investment income | 1.11% | 1.51% | 1.51% | 1.21% | 1.10% |
| Expense waiver/reimbursement3 | 0.06% | 0.15% | 0.10% | 0.09% | 0.10% |
| Supplemental Data: | |||||
| Net assets, end of period (000 omitted) | $61,553 | $61,405 | $61,245 | $62,555 | $55,634 |
| Portfolio turnover | 89% | 82% | 98% | 89% | 34% |
| 1 | Per share numbers have been calculated using the average shares method. |
| 2 | Based on net asset value, which does not reflect the sales charge, redemption fee or contingent deferred sales charge, if applicable. |
| 3 | This expense decrease is reflected in both the net expense and the net investment income ratios shown above. |
| Year Ended July 31 | 2018 | 2017 | 2016 | 2015 | 2014 |
| Net Asset Value, Beginning of Period | $17.49 | $16.30 | $16.59 | $15.84 | $14.16 |
| Income From Investment Operations: | |||||
| Net investment income (loss) | 0.061 | 0.131 | 0.121 | 0.071 | 0.051 |
| Net realized and unrealized gain (loss) | 1.87 | 1.20 | (0.31) | 0.74 | 1.67 |
| TOTAL FROM INVESTMENT OPERATIONS | 1.93 | 1.33 | (0.19) | 0.81 | 1.72 |
| Less Distributions: | |||||
| Distributions from net investment income | (0.11) | (0.14) | (0.10) | (0.06) | (0.04) |
| Net Asset Value, End of Period | $19.31 | $17.49 | $16.30 | $16.59 | $15.84 |
| Total Return2 | 11.09% | 8.23% | (1.10)% | 5.12% | 12.14% |
| Ratios to Average Net Assets: | |||||
| Net expenses | 2.07% | 2.01% | 2.05% | 2.05% | 2.05% |
| Net investment income | 0.35% | 0.75% | 0.76% | 0.45% | 0.34% |
| Expense waiver/reimbursement3 | 0.04% | 0.13% | 0.08% | 0.06% | 0.07% |
| Supplemental Data: | |||||
| Net assets, end of period (000 omitted) | $27,577 | $29,007 | $29,152 | $31,571 | $34,522 |
| Portfolio turnover | 89% | 82% | 98% | 89% | 34% |
| 1 | Per share numbers have been calculated using the average shares method. |
| 2 | Based on net asset value, which does not reflect the sales charge, redemption fee or contingent deferred sales charge, if applicable. |
| 3 | This expense decrease is reflected in both the net expense and the net investment income ratios shown above. |
| Year Ended July 31 | 2018 | 2017 | 2016 | 2015 | 2014 |
| Net Asset Value, Beginning of Period | $17.79 | $16.57 | $16.87 | $16.11 | $14.39 |
| Income From Investment Operations: | |||||
| Net investment income (loss) | 0.261 | 0.301 | 0.281 | 0.241 | 0.211 |
| Net realized and unrealized gain (loss) | 1.89 | 1.23 | (0.30) | 0.74 | 1.69 |
| TOTAL FROM INVESTMENT OPERATIONS | 2.15 | 1.53 | (0.02) | 0.98 | 1.90 |
| Less Distributions: | |||||
| Distributions from net investment income | (0.30) | (0.31) | (0.28) | (0.22) | (0.18) |
| Net Asset Value, End of Period | $19.64 | $17.79 | $16.57 | $16.87 | $16.11 |
| Total Return2 | 12.15% | 9.36% | (0.07)% | 6.13% | 13.30% |
| Ratios to Average Net Assets: | |||||
| Net expenses | 1.07% | 1.00% | 1.05% | 1.05% | 1.05% |
| Net investment income | 1.35% | 1.77% | 1.76% | 1.46% | 1.35% |
| Expense waiver/reimbursement3 | 0.02% | 0.12% | 0.05% | 0.04% | 0.06% |
| Supplemental Data: | |||||
| Net assets, end of period (000 omitted) | $54,358 | $39,136 | $47,757 | $53,291 | $49,667 |
| Portfolio turnover | 89% | 82% | 98% | 89% | 34% |
| 1 | Per share numbers have been calculated using the average shares method. |
| 2 | Based on net asset value. |
| 3 | This expense decrease is reflected in both the net expense and the net investment income ratios shown above. |
| Year Ended July 31 | 2018 | 20171 | 2016 | 2015 | 2014 |
| Net Asset Value, Beginning of Period | $17.76 | $16.49 | $16.80 | $16.05 | $14.33 |
| Income From Investment Operations: | |||||
| Net investment income (loss) | 0.262 | 0.282 | 0.202 | 0.162 | 0.132 |
| Net realized and unrealized gain (loss) | 1.90 | 1.24 | (0.31) | 0.74 | 1.69 |
| TOTAL FROM INVESTMENT OPERATIONS | 2.16 | 1.52 | (0.11) | 0.90 | 1.82 |
| Less Distributions: | |||||
| Distributions from net investment income | (0.30) | (0.25) | (0.20) | (0.15) | (0.10) |
| Net Asset Value, End of Period | $19.62 | $17.76 | $16.49 | $16.80 | $16.05 |
| Total Return3 | 12.24% | 9.32% | (0.59)% | 5.61% | 12.72% |
| Ratios to Average Net Assets: | |||||
| Net expenses | 1.06% | 1.05% | 1.56% | 1.56% | 1.57% |
| Net investment income | 1.36% | 1.64% | 1.27% | 0.96% | 0.84% |
| Expense waiver/reimbursement4 | 0.02% | 0.06% | 0.04% | 0.03% | 0.05% |
| Supplemental Data: | |||||
| Net assets, end of period (000 omitted) | $12,178 | $10,439 | $577 | $532 | $464 |
| Portfolio turnover | 89% | 82% | 98% | 89% | 34% |
| 1 | Effective September 1, 2016, the Fund's Class R Shares were redesignated as Class R6 Shares. |
| 2 | Per share numbers have been calculated using the average shares method. |
| 3 | Based on net asset value. |
| 4 | This expense decrease is reflected in both the net expense and the net investment income ratios shown above. |
| Assets: | ||
| Investment in securities, at value including $575,490 of securities loaned and including $27,446,431 of investment in affiliated holdings (identified cost $147,800,235) | $156,124,905 | |
| Cash | 7,639 | |
| Income receivable | 257,225 | |
| Income receivable from affiliated holdings | 86,914 | |
| Receivable for investments sold | 2,469,192 | |
| Receivable for shares sold | 502,087 | |
| Receivable for daily variation margin on futures contracts | 6,915 | |
| TOTAL ASSETS | 159,454,877 | |
| Liabilities: | ||
| Payable for investments purchased | $2,603,805 | |
| Payable for shares redeemed | 396,144 | |
| Payable for collateral due to broker for securities lending | 593,845 | |
| Payable for investment adviser fee (Note 5) | 3,179 | |
| Payable for administrative fees (Note 5) | 341 | |
| Payable for distribution services fee (Note 5) | 17,565 | |
| Payable for other service fees (Notes 2 and 5) | 39,411 | |
| Accrued expenses (Note 5) | 134,812 | |
| TOTAL LIABILITIES | 3,789,102 | |
| Net assets for 7,958,717 shares outstanding | $155,665,775 | |
| Net Assets Consist of: | ||
| Paid-in capital | $139,933,839 | |
| Net unrealized appreciation | 8,345,589 | |
| Accumulated net realized gain | 6,614,657 | |
| Undistributed net investment income | 771,690 | |
| TOTAL NET ASSETS | $155,665,775 |
| Net Asset Value, Offering Price and Redemption Proceeds Per Share | ||
| Class A Shares: | ||
| Net asset value per share ($61,553,032 ÷ 3,142,766 shares outstanding), no par value, unlimited shares authorized | $19.59 | |
| Offering price per share (100/94.50 of $19.59) | $20.73 | |
| Redemption proceeds per share | $19.59 | |
| Class C Shares: | ||
| Net asset value per share ($27,576,676 ÷ 1,427,826 shares outstanding), no par value, unlimited shares authorized | $19.31 | |
| Offering price per share | $19.31 | |
| Redemption proceeds per share (99.00/100 of $19.31) | $19.12 | |
| Institutional Shares: | ||
| Net asset value per share ($54,357,940 ÷ 2,767,321 shares outstanding), no par value, unlimited shares authorized | $19.64 | |
| Offering price per share | $19.64 | |
| Redemption proceeds per share | $19.64 | |
| Class R6 Shares: | ||
| Net asset value per share ($12,178,127 ÷ 620,804 shares outstanding), no par value, unlimited shares authorized | $19.62 | |
| Offering price per share | $19.62 | |
| Redemption proceeds per share | $19.62 |
| Investment Income: | |||
| Dividends (including $803,084 received from affiliated holdings* and net of foreign taxes withheld of $648) | $2,559,506 | ||
| Interest | 870,552 | ||
| Net income on securities loaned (includes $1,462 received from affiliated holdings related to cash collateral balances*) | 1,249 | ||
| TOTAL INCOME | 3,431,307 | ||
| Expenses: | |||
| Investment adviser fee (Note 5) | $1,063,652 | ||
| Administrative fee (Note 5) | 113,529 | ||
| Custodian fees | 43,162 | ||
| Transfer agent fee (Note 2) | 128,012 | ||
| Directors'/Trustees' fees (Note 5) | 2,617 | ||
| Auditing fees | 32,910 | ||
| Legal fees | 8,668 | ||
| Portfolio accounting fees | 75,738 | ||
| Distribution services fee (Note 5) | 216,329 | ||
| Other service fees (Notes 2 and 5) | 209,974 | ||
| Share registration costs | 60,448 | ||
| Printing and postage | 31,129 | ||
| Miscellaneous (Note 5) | 26,448 | ||
| TOTAL EXPENSES | 2,012,616 |
| Waiver and Reimbursements: | |||
| Waiver/reimbursement of investment adviser fee (Note 5) | $(29,905) | ||
| Reimbursement of other operating expenses (Notes 2 and 5) | (33,528) | ||
| TOTAL WAIVER AND REIMBURSEMENTS | $(63,433) | ||
| Net expenses | $1,949,183 | ||
| Net investment income | $1,482,124 | ||
| Realized and Unrealized Gain (Loss) on Investments and Futures Contracts: | |||
| Net realized gain on investments (including net realized loss of $(78,837) on sales of investments in affiliated holdings*) | $10,643,612 | ||
| Net realized loss on futures contracts | (2,319) | ||
| Realized gain distribution from affiliated investment company shares* | 2,133 | ||
| Net change in unrealized appreciation of investments (including net change in unrealized depreciation of $(409,224) on investments in affiliated holdings*) | 3,807,280 | ||
| Net change in unrealized appreciation of futures contracts | 19,647 | ||
| Net realized and unrealized gain on investments and futures contracts | 14,470,353 | ||
| Change in net assets resulting from operations | $15,952,477 |
| * | See information listed after the Fund's Portfolio of Investments. |
| Year Ended July 31 | 2018 | 2017 |
| Increase (Decrease) in Net Assets | ||
| Operations: | ||
| Net investment income | $1,482,124 | $1,964,146 |
| Net realized gain | 10,643,426 | 7,012,040 |
| Net change in unrealized appreciation/depreciation | 3,826,927 | 2,792,760 |
| CHANGE IN NET ASSETS RESULTING FROM OPERATIONS | 15,952,477 | 11,768,946 |
| Distributions to Shareholders: | ||
| Distributions from net investment income | ||
| Class A Shares | (820,337) | (931,700) |
| Class C Shares | (182,113) | (247,434) |
| Institutional Shares | (590,928) | (864,627) |
| Class R6 Shares1 | (175,714) | (7,781) |
| CHANGE IN NET ASSETS RESULTING FROM DISTRIBUTIONS TO SHAREHOLDERS | (1,769,092) | (2,051,542) |
| Share Transactions: | ||
| Proceeds from sale of shares | 34,844,213 | 27,978,026 |
| Net asset value of shares issued to shareholders in payment of distributions declared | 1,616,876 | 1,893,320 |
| Cost of shares redeemed | (34,966,647) | (38,332,541) |
| CHANGE IN NET ASSETS RESULTING FROM SHARE TRANSACTIONS | 1,494,442 | (8,461,195) |
| Change in net assets | 15,677,827 | 1,256,209 |
| Net Assets: | ||
| Beginning of period | 139,987,948 | 138,731,739 |
| End of period (including undistributed net investment income of $771,690 and $1,097,073, respectively) | $155,665,775 | $139,987,948 |
| 1 | Effective September 1, 2016, the Fund's Class R Shares were redesignated as Class R6 Shares. |
| ■ | Equity securities listed on an exchange or traded through a regulated market system are valued at their last reported sale price or official closing price in their principal exchange or market. |
| ■ | Fixed-income securities are fair valued using price evaluations provided by a pricing service approved by the Fund's Board of Trustees (the “Trustees”). |
| ■ | Shares of other mutual funds or non-exchange-traded investment companies are valued based upon their reported NAVs. |
| ■ | Derivative contracts listed on exchanges are valued at their reported settlement or closing price, except that options are valued at the mean of closing bid and asked quotations. |
| ■ | Over-the-counter (OTC) derivative contracts are fair valued using price evaluations provided by a pricing service approved by the Trustees. |
| ■ | For securities that are fair valued in accordance with procedures established by and under the general supervision of the Trustees, certain factors may be considered, such as: the last traded or purchase price of the security, information obtained by contacting the issuer or dealers, analysis of the issuer's financial statements or other available documents, fundamental analytical data, the nature and duration of restrictions on disposition, the movement of the market in which the security is normally traded, public trading in similar securities or derivative contracts of the issuer or comparable issuers, movement of a relevant index, or other factors including but not limited to industry changes and relevant government actions. |
| ■ | With respect to securities traded principally in foreign markets, significant trends in U.S. equity markets or in the trading of foreign securities index futures contracts; |
| ■ | Political or other developments affecting the economy or markets in which an issuer conducts its operations or its securities are traded; |
| ■ | Announcements concerning matters such as acquisitions, recapitalizations, litigation developments, or a natural disaster affecting the issuer's operations or regulatory changes or market developments affecting the issuer's industry. |
| Transfer Agent Fees Incurred | Transfer Agent Fees Reimbursed | |
| Class A Shares | $72,512 | $(25,563) |
| Class C Shares | 24,223 | (6,453) |
| Institutional Shares | 25,820 | (1,512) |
| Class R6 Shares | 5,457 | — |
| TOTAL | $128,012 | $(33,528) |
| Other Service Fees Incurred | |
| Class A Shares | $138,660 |
| Class C Shares | 71,314 |
| TOTAL | $209,974 |
| Market Value of Securities Loaned | Market Value of Collateral |
| $575,490 | $593,845 |
| Fair Value of Derivative Instruments | ||
| Assets | ||
| Statement of Assets and Liabilities Location | Fair Value | |
| Derivatives not accounted for as hedging instruments under ASC Topic 815 | ||
| Interest rate contracts | Receivable for daily variation margin on futures contracts | $20,919* |
| * | Includes cumulative net appreciation of futures contracts as reported in the footnotes to the Portfolio of Investments. Only the current day's variation margin is reported within the Statement of Assets and Liabilities. |
| Amount of Realized Gain or (Loss) on Derivatives Recognized in Income | |
| Futures Contracts | |
| Interest rate contracts | $(2,319) |
| Change in Unrealized Appreciation or (Depreciation) on Derivatives Recognized in Income | |
| Futures Contracts | |
| Interest rate contracts | $19,647 |
| Year Ended July 31 | 2018 | 2017 | ||
| Class A Shares: | Shares | Amount | Shares | Amount |
| Shares sold | 616,086 | $11,426,201 | 686,635 | $11,650,848 |
| Shares issued to shareholders in payment of distributions declared | 37,690 | 704,802 | 49,513 | 823,409 |
| Shares redeemed | (973,306) | (17,952,970) | (980,711) | (16,503,614) |
| NET CHANGE RESULTING FROM CLASS A SHARE TRANSACTIONS | (319,530) | $(5,821,967) | (244,563) | $(4,029,357) |
| Year Ended July 31 | 2018 | 2017 | ||
| Class C Shares: | Shares | Amount | Shares | Amount |
| Shares sold | 94,955 | $1,762,067 | 158,017 | $2,631,546 |
| Shares issued to shareholders in payment of distributions declared | 9,123 | 168,962 | 13,630 | 224,489 |
| Shares redeemed | (334,347) | (6,217,117) | (301,945) | (5,040,678) |
| NET CHANGE RESULTING FROM CLASS C SHARE TRANSACTIONS | (230,269) | $(4,286,088) | (130,298) | $(2,184,643) |
| Year Ended July 31 | 2018 | 2017 | ||
| Institutional Shares: | Shares | Amount | Shares | Amount |
| Shares sold | 1,033,047 | $19,682,314 | 200,258 | $3,374,083 |
| Shares issued to shareholders in payment of distributions declared | 30,373 | 568,576 | 50,388 | 838,960 |
| Shares redeemed | (496,465) | (9,266,521) | (932,430) | (15,716,444) |
| NET CHANGE RESULTING FROM INSTITUTIONAL SHARE TRANSACTIONS | 566,955 | $10,984,369 | (681,784) | $(11,503,401) |
| Year Ended July 31 | 2018 | 20171 | ||
| Class R6 Shares: | Shares | Amount | Shares | Amount |
| Shares sold | 104,828 | $1,973,631 | 614,503 | $10,321,549 |
| Shares issued to shareholders in payment of distributions declared | 9,333 | 174,536 | 389 | 6,462 |
| Shares redeemed | (81,103) | (1,530,039) | (62,139) | (1,071,805) |
| NET CHANGE RESULTING FROM CLASS R6 SHARE TRANSACTIONS | 33,058 | $618,128 | 552,753 | $9,256,206 |
| NET CHANGE RESULTING FROM TOTAL FUND SHARE TRANSACTIONS | 50,214 | $1,494,442 | (503,892) | $(8,461,195) |
| 1 | Effective September 1, 2016, the Fund's Class R Shares were redesignated as Class R6 Shares. |
| Increase (Decrease) | |
| Undistributed Net Investment Income (Loss) | Accumulated Net Realized Gain (Loss) |
| $(38,415) | $38,415 |
| 2018 | 2017 | |
| Ordinary income | $1,769,092 | $2,051,542 |
| Undistributed ordinary income | $3,313,891 |
| Net unrealized appreciation | $8,400,496 |
| Undistributed long-term capital gains | $4,017,549 |
| Administrative Fee | Average Daily Net Assets of the Investment Complex |
| 0.100% | on assets up to $50 billion |
| 0.075% | on assets over $50 billion |
| Administrative Fee | Average Daily Net Assets of the Investment Complex |
| 0.150% | on the first $5 billion |
| 0.125% | on the next $5 billion |
| 0.100% | on the next $10 billion |
| 0.075% | on assets in excess of $20 billion |
| Percentage of Average Daily Net Assets of Class | |
| Class A Shares | 0.05% |
| Class C Shares | 0.75% |
| Distribution Services Fees Incurred | |
| Class C Shares | $216,329 |
| Purchases | $110,347,393 |
| Sales | $112,685,270 |
September 24, 2018
| Beginning Account Value 2/1/2018 | Ending Account Value 7/31/2018 | Expenses Paid During Period1 | |
| Actual: | |||
| Class A Shares | $1,000 | $1,011.40 | $6.58 |
| Class C Shares | $1,000 | $1,007.30 | $10.30 |
| Institutional Shares | $1,000 | $1,011.80 | $5.34 |
| Class R6 Shares | $1,000 | $1,012.40 | $5.29 |
| Hypothetical (assuming a 5% return before expenses): | |||
| Class A Shares | $1,000 | $1,018.30 | $6.61 |
| Class C Shares | $1,000 | $1,014.50 | $10.34 |
| Institutional Shares | $1,000 | $1,019.50 | $5.36 |
| Class R6 Shares | $1,000 | $1,019.50 | $5.31 |
| 1 | Expenses are equal to the Fund's annualized net expense ratios, multiplied by the average account value over the period, multiplied by 181/365 (to reflect the one-half-year period). The annualized net expense ratios are as follows: |
| Class A Shares | 1.32% |
| Class C Shares | 2.07% |
| Institutional Shares | 1.07% |
| Class R6 Shares | 1.06% |
| Name Birth Date Positions Held with Trust Date Service Began | Principal Occupation(s) for Past Five Years, Other Directorships Held and Previous Position(s) |
| J. Christopher Donahue* Birth Date: April 11, 1949 President and Trustee Indefinite Term Began serving: May 2006 | Principal Occupations: Principal Executive Officer and President of certain of the Funds in the Federated Fund Family; Director or Trustee of the Funds in the Federated Fund Family; President, Chief Executive Officer and Director, Federated Investors, Inc.; Chairman and Trustee, Federated Investment Management Company; Trustee, Federated Investment Counseling; Chairman and Director, Federated Global Investment Management Corp.; Chairman and Trustee, Federated Equity Management Company of Pennsylvania; Trustee, Federated Shareholder Services Company; Director, Federated Services Company. Previous Positions: President, Federated Investment Counseling; President and Chief Executive Officer, Federated Investment Management Company, Federated Global Investment Management Corp. and Passport Research, Ltd; Chairman, Passport Research, Ltd. |
| Name Birth Date Positions Held with Trust Date Service Began | Principal Occupation(s) for Past Five Years, Other Directorships Held and Previous Position(s) |
| John B. Fisher* Birth Date: May 16, 1956 Trustee Indefinite Term Began serving: May 2016 | Principal Occupations: Principal Executive Officer and President of certain of the Funds in the Federated Fund Family; Director or Trustee of certain of the Funds in the Federated Fund Family; Vice President, Federated Investors, Inc.; President, Director/Trustee and CEO, Federated Advisory Services Company, Federated Equity Management Company of Pennsylvania, Federated Global Investment Management Corp., Federated Investment Counseling, Federated Investment Management Company; President of some of the Funds in the Federated Fund Complex and Director, Federated Investors Trust Company. Previous Positions: President and Director of the Institutional Sales Division of Federated Securities Corp.; President and Director of Federated Investment Counseling; President and CEO of Passport Research, Ltd.; Director, Edgewood Securities Corp.; Director, Federated Services Company; Director, Federated Investors, Inc.; Chairman and Director, Southpointe Distribution Services, Inc. and President, Technology, Federated Services Company. |
| * | Reasons for “interested” status: J. Christopher Donahue and John B. Fisher are interested due to their beneficial ownership of shares of Federated Investors, Inc. and due to positions they hold with Federated and its subsidiaries. |
| Name Birth Date Positions Held with Trust Date Service Began | Principal Occupation(s) for Past Five Years, Other Directorships Held, Previous Position(s) and Qualifications |
| John T. Collins Birth Date: January 24, 1947 Trustee Indefinite Term Began serving: October 2013 | Principal Occupations: Director or Trustee of the Federated Fund Family; formerly, Chairman and CEO, The Collins Group, Inc. (a private equity firm) (Retired). Other Directorships Held: Director, Current Chair of the Compensation Committee, KLX Corp. Qualifications: Mr. Collins has served in several business and financial management roles and directorship positions throughout his career. Mr. Collins previously served as Chairman and CEO, The Collins Group, Inc. (a private equity firm). Mr. Collins serves as Chairman Emeriti, Bentley University. Mr. Collins previously served as Director and Audit Committee Member, Bank of America Corp.; Director, FleetBoston Financial Corp.; and Director, Beth Israel Deaconess Medical Center (Harvard University Affiliate Hospital). |
| Name Birth Date Positions Held with Trust Date Service Began | Principal Occupation(s) for Past Five Years, Other Directorships Held, Previous Position(s) and Qualifications |
| G. Thomas Hough Birth Date: February 28, 1955 Trustee Indefinite Term Began serving: August 2015 | Principal Occupations: Director or Trustee of the Federated Fund Family; formerly, Vice Chair, Ernst & Young LLP (public accounting firm) (Retired). Other Directorships Held: Director, Chair of the Audit Committee, Governance Committee, Publix Super Markets, Inc.; Director, Member of the Audit Committee and Technology Committee of Equifax, Inc. Qualifications: Mr. Hough has served in accounting, business management and directorship positions throughout his career. Mr. Hough most recently held the position of Americas Vice Chair of Assurance with Ernst & Young LLP (public accounting firm). Mr. Hough is an Executive Committee member of the United States Golf Association, he serves on the President's Cabinet and Business School Board of Visitors for the University of Alabama and is on the Business School Board of Visitors for Wake Forest University. |
| Maureen Lally-Green Birth Date: July 5, 1949 Trustee Indefinite Term Began serving: August 2009 | Principal Occupations: Director or Trustee of the Federated Fund Family; Dean of the Duquesne University School of Law; Professor and Adjunct Professor of Law, Duquesne University School of Law; formerly, Interim Dean of the Duquesne University School of Law; formerly, Associate General Secretary and Director, Office of Church Relations, Diocese of Pittsburgh. Other Directorships Held: Director, CNX Resources Corporation (formerly known as CONSOL Energy Inc.). Qualifications: Judge Lally-Green has served in various legal and business roles and directorship positions throughout her career. Judge Lally-Green previously served as a member of the Superior Court of Pennsylvania and as a Professor of Law, Duquesne University School of Law. Judge Lally-Green also currently holds the positions on not for profit or for profit boards of directors as follows: Director and Chair, UPMC Mercy Hospital; Director and Vice Chair, Our Campaign for the Church Alive!, Inc.; Director, Saint Vincent College; Member, Pennsylvania State Board of Education (public); and Director CNX Resources Corporation (formerly known as CONSOL Energy Inc.). Judge Lally-Green has held the positions of: Director, Auberle; Director, Epilepsy Foundation of Western and Central Pennsylvania; Director, Ireland Institute of Pittsburgh; Director, Saint Thomas More Society; Director and Chair, Catholic High Schools of the Diocese of Pittsburgh, Inc.; Director, Pennsylvania Bar Institute; Regent, St. Vincent Seminary; and Director and Chair, North Catholic High School, Inc. |
| Charles F. Mansfield, Jr. Birth Date: April 10, 1945 Trustee Indefinite Term Began serving: June 2006 | Principal Occupations: Director or Trustee of the Federated Fund Family; Management Consultant. Other Directorships Held: None. Qualifications: Mr. Mansfield has served as a Marine Corps officer and in several banking, business management, educational roles and directorship positions throughout his long career. He remains active as a Management Consultant. |
| Name Birth Date Positions Held with Trust Date Service Began | Principal Occupation(s) for Past Five Years, Other Directorships Held, Previous Position(s) and Qualifications |
| Thomas M. O'Neill Birth Date: June 14, 1951 Trustee Indefinite Term Began serving: August 2006 | Principal Occupations: Director or Trustee, Chair of the Audit Committee of the Federated Fund Family; Sole Proprietor, Navigator Management Company (investment and strategic consulting). Other Directorships Held: None. Qualifications: Mr. O'Neill has served in several business, mutual fund and financial management roles and directorship positions throughout his career. Mr. O'Neill serves as Director, Medicines for Humanity and Director, The Golisano Children's Museum of Naples, Florida. Mr. O'Neill previously served as Chief Executive Officer and President, Managing Director and Chief Investment Officer, Fleet Investment Advisors; President and Chief Executive Officer, Aeltus Investment Management, Inc.; General Partner, Hellman, Jordan Management Co., Boston, MA; Chief Investment Officer, The Putnam Companies, Boston, MA; Credit Analyst and Lending Officer, Fleet Bank; Director and Consultant, EZE Castle Software (investment order management software); and Director, Midway Pacific (lumber). |
| P. Jerome Richey Birth Date: February 23, 1949 Trustee Indefinite Term Began serving: October 2013 | Principal Occupations: Director or Trustee of the Federated Fund Family; Management Consultant; formerly, Senior Vice Chancellor and Chief Legal Officer, University of Pittsburgh and Executive Vice President and Chief Legal Officer, CNX Resources Corporation (formerly known as CONSOL Energy Inc.) Other Directorships Held: None. Qualifications: Mr. Richey has served in several business and legal management roles and directorship positions throughout his career. Mr. Richey most recently held the positions of Senior Vice Chancellor and Chief Legal Officer, University of Pittsburgh. Mr. Richey previously served as Chairman of the Board, Epilepsy Foundation of Western Pennsylvania and Chairman of the Board, World Affairs Council of Pittsburgh. Mr. Richey previously served as Chief Legal Officer and Executive Vice President, CNX Resources Corporation (formerly known as CONSOL Energy Inc.); and Board Member, Ethics Counsel and Shareholder, Buchanan Ingersoll & Rooney PC (a law firm). |
| John S. Walsh Birth Date: November 28, 1957 Trustee Indefinite Term Began serving: June 2006 | Principal Occupations: Director or Trustee, and Chair of the Board of Directors or Trustees, of the Federated Fund Family; President and Director, Heat Wagon, Inc. (manufacturer of construction temporary heaters); President and Director, Manufacturers Products, Inc. (distributor of portable construction heaters); President, Portable Heater Parts, a division of Manufacturers Products, Inc. Other Directorships Held: None. Qualifications: Mr. Walsh has served in several business management roles and directorship positions throughout his career. Mr. Walsh previously served as Vice President, Walsh & Kelly, Inc. (paving contractors). |
| Name Birth Date Address Positions Held with Trust Date Service Began | Principal Occupation(s) for Past Five Years and Previous Position(s) |
| Lori A. Hensler Birth Date: January 6, 1967 TREASURER Officer since: April 2013 | Principal Occupations: Principal Financial Officer and Treasurer of the Federated Fund Family; Senior Vice President, Federated Administrative Services; Financial and Operations Principal for Federated Securities Corp. and Edgewood Services, Inc.; and Assistant Treasurer, Federated Investors Trust Company. Ms. Hensler has received the Certified Public Accountant designation. Previous Positions: Controller of Federated Investors, Inc.; Senior Vice President and Assistant Treasurer, Federated Investors Management Company; Treasurer, Federated Investors Trust Company; Assistant Treasurer, Federated Administrative Services, Federated Administrative Services, Inc., Federated Securities Corp., Edgewood Services, Inc., Federated Advisory Services Company, Federated Equity Management Company of Pennsylvania, Federated Global Investment Management Corp., Federated Investment Counseling, Federated Investment Management Company, Passport Research, Ltd., and Federated MDTA, LLC; Financial and Operations Principal for Federated Securities Corp., Edgewood Services, Inc. and Southpointe Distribution Services, Inc. |
| Peter J. Germain Birth Date: September 3, 1959 CHIEF LEGAL OFFICER, SECRETARY and EXECUTIVE VICE PRESIDENT Officer since: June 2006 | Principal Occupations: Mr. Germain is Chief Legal Officer, Secretary and Executive Vice President of the Federated Fund Family. He is General Counsel, Chief Legal Officer, Secretary and Executive Vice President, Federated Investors, Inc.; Trustee and Senior Vice President, Federated Investors Management Company; Trustee and President, Federated Administrative Services; Director and President, Federated Administrative Services, Inc.; Director and Vice President, Federated Securities Corp.; Director and Secretary, Federated Private Asset Management, Inc.; Secretary, Federated Shareholder Services Company; and Secretary, Retirement Plan Service Company of America. Mr. Germain joined Federated in 1984 and is a member of the Pennsylvania Bar Association. Previous Positions: Deputy General Counsel, Special Counsel, Managing Director of Mutual Fund Services, Federated Investors, Inc.; Senior Vice President, Federated Services Company; and Senior Corporate Counsel, Federated Investors, Inc. |
| Stephen Van Meter Birth Date: June 5, 1975 CHIEF COMPLIANCE OFFICER AND SENIOR VICE PRESIDENT Officer since: July 2015 | Principal Occupations: Senior Vice President and Chief Compliance Officer of the Federated Fund Family; Vice President and Chief Compliance Officer of Federated Investors, Inc. and Chief Compliance Officer of certain of its subsidiaries. Mr. Van Meter joined Federated in October 2011. He holds FINRA licenses under Series 3, 7, 24 and 66. Previous Positions: Mr. Van Meter previously held the position of Compliance Operating Officer, Federated Investors, Inc. Prior to joining Federated, Mr. Van Meter served at the United States Securities and Exchange Commission in the positions of Senior Counsel, Office of Chief Counsel, Division of Investment Management and Senior Counsel, Division of Enforcement. |
| Name Birth Date Address Positions Held with Trust Date Service Began | Principal Occupation(s) for Past Five Years and Previous Position(s) |
| Stephen F. Auth Birth Date: September 13, 1956 101 Park Avenue 41st Floor New York, NY 10178 CHIEF INVESTMENT OFFICER Officer since: June 2012 | Principal Occupations: Stephen F. Auth is Chief Investment Officer of various Funds in the Federated Fund Family; Executive Vice President, Federated Investment Counseling, Federated Global Investment Management Corp. and Federated Equity Management Company of Pennsylvania. Previous Positions: Executive Vice President, Federated Investment Management Company and Passport Research, Ltd. (investment advisory subsidiary of Federated); Senior Vice President, Global Portfolio Management Services Division; Senior Vice President, Federated Investment Management Company and Passport Research, Ltd.; Senior Managing Director and Portfolio Manager, Prudential Investments. |
4000 Ericsson Drive
Warrendale, PA 15086-7561
or call 1-800-341-7400.
CUSIP 31421R833
CUSIP 31421R825
CUSIP 31421R692
2018 ©Federated Investors, Inc.
| Share Class | Ticker | A | QALGX | B | QBLGX | C | QCLGX | Institutional | QILGX |
| 1 | Please see the footnotes to the line graphs below for definitions of, and further information about, the R1000G. |
| 2 | Morningstar has assigned the Fund to the Morningstar Large Blend Funds Average peer group, however, the MLGFA is being used for comparison purposes. The Fund invests in growth stocks, and therefore, the Fund's Adviser believes that the MLGFA is more reflective of the Fund's investment style. Please see the footnotes to the line graphs below for definitions of, and further information about, the MLGFA. |
| 3 | The Russell 3000® Index measures the performance of the largest 3,000 U.S. companies representing approximately 98% of the investable U.S. equity market. The Russell 3000® Index is constructed to provide a comprehensive, unbiased and stable barometer of the broad market, and is completely reconstituted annually to ensure new and growing equities are reflected.* |
| 4 | Small-cap stocks may be less liquid and subject to greater price volatility than large-cap stocks. |
| 5 | The Russell Microcap® Index measures the performance of the microcap segment of the U.S. equity market. Microcap stocks make up less than 3% of the U.S. equity market (by market cap) and consist of the smallest 1,000 securities in the small-cap Russell 2000® Index, plus the next 1,000 smallest eligible securities by market cap. The Russell Microcap® Index is constructed to provide a comprehensive and unbiased barometer for the microcap segment trading on national exchanges and is completely reconstituted annually to ensure new and growing equities are reflected and companies continue to reflect appropriate capitalization and value characteristics.* |
| 6 | The Russell 2000® Index measures the performance of the small-cap segment of the U.S. equity universe. The Russell 2000® Index is a subset of the Russell 3000® Index representing approximately 10% of the total market capitalization of that index. It includes approximately 2000 of the smallest securities based on a combination of their market cap and current index membership. The Russell 2000® Index is constructed to provide a comprehensive and unbiased small-cap barometer and is completely reconstituted annually to ensure larger stocks do not distort the performance and characteristics of the true small-cap opportunity set.* |
| 7 | The Russell Top 200® Index measures the performance of the largest cap segment of the U.S. equity universe. The Russell Top 200® Index is a subset of the Russell 3000® Index. It includes approximately 200 of the largest securities based on a combination of their market cap and current index membership and represents approximately 68% of the U.S. market. The Russell Top 200® Index is constructed to provide a comprehensive and unbiased barometer for this very large cap segment and is completely reconstituted annually to ensure new and growing equities are reflected.* |
| 8 | The Russell Midcap® Index measures the performance of the mid-cap segment of the U.S. equity universe. The Russell Midcap® Index is a subset of the Russell 1000® Index. It includes approximately 800 of the smallest securities based on a combination of their market cap and current index membership. The Russell Midcap® Index represents approximately 31% of the total market capitalization of the Russell 1000® companies. The Russell Midcap® Index is constructed to provide a comprehensive and unbiased barometer for the mid-cap segment. The Russell Midcap Index is completely reconstituted annually to ensure larger stocks do not distort the performance and characteristics of the true mid-cap opportunity set.* |
| 9 | The Russell 3000® Growth Index measures the performance of the broad growth segment of the U.S. equity universe. It includes those Russell 3000® Index companies with higher price-to-book ratios and higher forecasted growth values. The Russell 3000® Growth Index is constructed to provide a comprehensive, unbiased and stable barometer of the broad growth market. The Russell 3000 Growth Index is completely reconstituted annually to ensure new and growing equities are included and that the represented companies continue to reflect growth characteristics.* |
| 10 | The Russell 3000® Value Index measures the performance of the broad value segment of U.S. equity value universe. It includes those Russell 3000® Index companies with lower price-to-book ratios and lower forecasted growth values. The Russell 3000® Value Index is constructed to provide a comprehensive, unbiased and stable barometer of the broad value market. The Russell 3000 Value Index is completely reconstituted annually to ensure new and growing equities are included and that the represented companies continue to reflect value characteristics.* |
| * | The index is unmanaged, and it is not possible to invest directly in an index. |
| Federated MDT Large Cap Growth Fund - | Institutional Shares | Class C Shares | NA | R1000G | MLGFA |
| F | F | NA | I | I | |
| 7/31/2008 | 10,000 | 10,000 | 10,000 | 10,000 | |
| 7/31/2009 | 7,454 | 7,377 | 8,243 | 8,005 | |
| 7/31/2010 | 8,296 | 8,128 | 9,368 | 8,945 | |
| 7/31/2011 | 10,339 | 10,030 | 11,687 | 10,993 | |
| 7/31/2012 | 10,455 | 10,040 | 12,653 | 11,270 | |
| 7/31/2013 | 13,437 | 12,773 | 15,391 | 13,893 | |
| 7/31/2014 | 16,021 | 15,085 | 18,267 | 16,337 | |
| 7/31/2015 | 17,551 | 16,356 | 21,205 | 18,668 | |
| 7/31/2016 | 16,955 | 15,638 | 22,127 | 18,591 | |
| 7/31/2017 | 19,665 | 17,956 | 26,121 | 21,833 | |
| 7/31/2018 | 25,101 | 22,700 | 32,088 | 26,258 |
| ■ | Total returns shown for Class C Shares include the maximum contingent deferred sales charge of 1.00% as applicable. |
| 1 Year | 5 Years | 10 Years | |
| Class A Shares | 20.35% | 11.76% | 8.75% |
| Class B Shares | 20.88% | 11.92% | 8.71% |
| Class C Shares | 25.42% | 12.19% | 8.54% |
| Institutional Shares | 27.65% | 13.31% | 9.64% |
| R1000G | 22.84% | 15.83% | 12.37% |
| MLGFA | 20.31% | 13.68% | 10.72% |
| 1 | Represents a hypothetical investment of $10,000 in the Fund after deducting applicable sales charges: for Class A Shares, the maximum sales charge of 5.50% ($10,000 investment minus $550 sales charges = $9,450); for Class B Shares, the maximum contingent deferred sales charge is 5.50% on any redemption less than one year from the purchase date; for Class C Shares, a 1.00% contingent deferred sales charge would be applied to any redemption less than one year from the purchase date. The Fund's performance assumes the reinvestment of all dividends and distributions. The R1000G and MLGFA have been adjusted to reflect reinvestment of dividends on securities. |
| 2 | The R1000G measures the performance of the large-cap growth segment of the U.S. equity universe. It includes those Russell 1000® Index companies with higher price-to-book ratios and higher forecasted growth values. The R1000G is constructed to provide a comprehensive and unbiased barometer for the large-cap growth segment. The R1000G is completely reconstituted annually to ensure new and growing equities are included and that the represented companies continue to reflect growth characteristics. The R1000G is unmanaged and, unlike the Fund, is not affected by cash flows. It is not possible to invest directly in an index. The R1000G is not adjusted to reflect sales charges, expenses or other fees that the Securities and Exchange Commission requires to be reflected in the Fund's performance. |
| 3 | Morningstar figures represent the average of the total returns reported by all the funds designated by Morningstar as falling into the respective category indicated. They do not reflect sales charges. The Morningstar figures in the Growth of $10,000 line graph are based on historical return information published by Morningstar and reflect the return of the funds comprising the category in the year of publication. Because the funds designated by Morningstar as falling into the category can change over time, the Morningstar figures in the line graph may not match the Morningstar figures in the Average Annual Total Returns table, which reflect the return of the funds that currently comprise the category. |
| Sector Composition | Percentage of Total Net Assets |
| Information Technology | 39.6% |
| Consumer Discretionary | 18.6% |
| Health Care | 13.6% |
| Industrials | 13.4% |
| Consumer Staples | 6.3% |
| Financials | 4.6% |
| Materials | 2.0% |
| Telecommunication Services | 1.1% |
| Securities Lending Collateral2 | 0.3% |
| Cash Equivalents3 | 1.2% |
| Other Assets and Liabilities—Net4 | (0.7)% |
| TOTAL | 100.0% |
| 1 | Except for Cash Equivalents and Other Assets and Liabilities, sector classifications are based upon, and individual portfolio securities are assigned to, the classifications of the Global Industry Classification Standard (GICS) except that the Adviser assigns a classification to securities not classified by the GICS and to securities for which the Adviser does not have access to the classification made by the GICS. |
| 2 | Represents cash collateral received for portfolio securities on loan that may be invested in affiliated money market funds, other money market instruments and/or repurchase agreements. |
| 3 | Cash Equivalents include any investments in money market mutual funds and/or overnight repurchase agreements other than those representing cash collateral for securities lending. |
| 4 | Assets, other than investments in securities, less liabilities. See Statement of Assets and Liabilities. |
| Shares | Value | ||
| COMMON STOCKS—99.2% | |||
| Consumer Discretionary—18.6% | |||
| 2,746 | 1 | Amazon.com, Inc. | $4,880,850 |
| 1,139 | 1 | AutoZone, Inc. | 803,599 |
| 14,365 | Bed Bath & Beyond, Inc. | 269,056 | |
| 5,900 | Big Lots, Inc. | 256,237 | |
| 3,283 | Block (H&R), Inc. | 82,600 | |
| 77 | 1 | Booking Holdings, Inc. | 156,211 |
| 4,975 | 1 | Burlington Stores, Inc. | 760,230 |
| 11,142 | D. R. Horton, Inc. | 486,905 | |
| 3,670 | 1 | DISH Network Corp., Class A | 115,825 |
| 2,873 | Dillards, Inc., Class A | 230,616 | |
| 9,100 | 1,2 | Discovery, Inc. | 241,878 |
| 1,414 | Foot Locker, Inc. | 69,017 | |
| 25,317 | Ford Motor Co. | 254,183 | |
| 5,804 | 1 | Fossil, Inc. | 152,065 |
| 4,516 | 1,2 | GNC Holdings, Inc. | 14,361 |
| 679 | 1 | Hilton Grand Vacations, Inc. | 23,487 |
| 6,753 | Las Vegas Sands Corp. | 485,541 | |
| 1,349 | Lear Corp. | 242,995 | |
| 5,528 | 1 | Live Nation Entertainment, Inc. | 272,420 |
| 2,435 | 1 | Lululemon Athletica, Inc. | 292,078 |
| 72,797 | 1 | MSG Networks, Inc. | 1,714,369 |
| 8,123 | Macy's, Inc. | 322,727 | |
| 5,520 | 1 | NetFlix, Inc. | 1,862,724 |
| 5,600 | 1 | Sally Beauty Holdings, Inc. | 92,344 |
| 5,620 | 1 | Skechers USA, Inc., Class A | 155,786 |
| 2,169 | Toll Brothers, Inc. | 76,479 | |
| 9,449 | Tupperware Brands Corp. | 346,873 | |
| 848 | 1 | Ulta Beauty, Inc. | 207,243 |
| 3,571 | Vail Resorts, Inc. | 988,703 | |
| 8,636 | Walt Disney Co. | 980,704 | |
| 1,921 | 1 | Weight Watchers International, Inc. | 171,987 |
| 13,966 | Wyndham Destinations, Inc. | 644,112 | |
| 442 | Wynn Resorts Ltd. | 73,717 | |
| 2,081 | Yum! Brands, Inc. | 165,003 | |
| TOTAL | 17,892,925 |
| Shares | Value | ||
| COMMON STOCKS—continued | |||
| Consumer Staples—6.3% | |||
| 996 | Church and Dwight, Inc. | $55,676 | |
| 9,612 | Estee Lauder Cos., Inc., Class A | 1,297,043 | |
| 12,348 | Flowers Foods, Inc. | 251,899 | |
| 18,327 | McCormick & Co., Inc. | 2,154,156 | |
| 20,388 | PepsiCo, Inc. | 2,344,620 | |
| TOTAL | 6,103,394 | ||
| Financials—4.6% | |||
| 11,777 | Ally Financial, Inc. | 315,152 | |
| 28,222 | Citizens Financial Group, Inc. | 1,122,671 | |
| 414 | LPL Investment Holdings, Inc. | 27,444 | |
| 20,756 | Progressive Corp., OH | 1,245,568 | |
| 12,000 | Prudential Financial, Inc. | 1,210,920 | |
| 1,395 | 1 | SVB Financial Group | 429,493 |
| 2,300 | 2 | Waddell & Reed Financial, Inc., Class A | 47,633 |
| TOTAL | 4,398,881 | ||
| Health Care—13.6% | |||
| 2,599 | 1 | Abiomed, Inc. | 921,424 |
| 6,525 | 1 | Align Technology, Inc. | 2,327,141 |
| 2,459 | Baxter International, Inc. | 178,155 | |
| 427 | Bristol-Myers Squibb Co. | 25,086 | |
| 19,502 | 1 | Celgene Corp. | 1,756,935 |
| 1,367 | Chemed Corp. | 432,013 | |
| 24,698 | Eli Lilly & Co. | 2,440,409 | |
| 3,824 | Humana, Inc. | 1,201,424 | |
| 99 | 1 | ICU Medical, Inc. | 28,393 |
| 3,052 | 1 | Illumina, Inc. | 989,947 |
| 399 | 1 | Intuitive Surgical, Inc. | 202,768 |
| 1,818 | 1 | Molina Healthcare, Inc. | 189,236 |
| 3,637 | 1 | Myriad Genetics, Inc. | 159,119 |
| 604 | 1 | Penumbra, Inc. | 85,919 |
| 1,583 | UnitedHealth Group, Inc. | 400,847 | |
| 1,761 | 1 | Veeva Systems, Inc. | 133,184 |
| 6,257 | 1 | Vertex Pharmaceuticals, Inc. | 1,095,288 |
| 2,085 | 1 | Wellcare Health Plans, Inc. | 557,571 |
| TOTAL | 13,124,859 |
| Shares | Value | ||
| COMMON STOCKS—continued | |||
| Industrials—13.4% | |||
| 1,174 | Allegion PLC | $95,728 | |
| 17,348 | Allison Transmission Holdings, Inc. | 815,356 | |
| 1,008 | Boeing Co. | 359,150 | |
| 4,801 | C.H. Robinson Worldwide, Inc. | 442,796 | |
| 7,950 | CSX Corp. | 561,906 | |
| 10,172 | Caterpillar, Inc. | 1,462,734 | |
| 9,198 | Cintas Corp. | 1,880,807 | |
| 7,204 | 1 | Copart, Inc. | 413,437 |
| 2,849 | 1 | CoStar Group, Inc. | 1,184,757 |
| 669 | Cummins, Inc. | 95,540 | |
| 8,595 | Emerson Electric Co. | 621,247 | |
| 4,020 | Fortive Corp. | 329,962 | |
| 2,586 | Grainger (W.W.), Inc. | 896,204 | |
| 685 | Huntington Ingalls Industries, Inc. | 159,639 | |
| 6,243 | Ingersoll-Rand PLC, Class A | 614,998 | |
| 13,961 | 1 | Jet Blue Airways Corp. | 251,298 |
| 242 | Landstar System, Inc. | 26,898 | |
| 303 | Lincoln Electric Holdings | 28,464 | |
| 28,428 | Pitney Bowes, Inc. | 248,176 | |
| 3,882 | R.R. Donnelley & Sons Co. | 22,904 | |
| 1,471 | Raytheon Co. | 291,302 | |
| 2,704 | Roper Technologies, Inc. | 816,338 | |
| 6,262 | 1 | Verisk Analytics, Inc. | 692,702 |
| 1,843 | 1 | XPO Logistics, Inc. | 183,784 |
| 5,003 | Xylem, Inc. | 383,030 | |
| TOTAL | 12,879,157 | ||
| Information Technology—39.6% | |||
| 9,986 | 1 | Adobe Systems, Inc. | 2,443,374 |
| 2,061 | 1 | Akamai Technologies, Inc. | 155,111 |
| 4,098 | 1 | Alphabet, Inc. | 5,029,148 |
| 34,030 | Apple, Inc. | 6,475,569 | |
| 23,651 | Applied Materials, Inc. | 1,150,148 | |
| 4,295 | Automatic Data Processing, Inc. | 579,782 | |
| 16,398 | 1 | Facebook, Inc. | 2,829,967 |
| 12,457 | 1 | Fortinet, Inc. | 783,670 |
| Shares | Value | ||
| COMMON STOCKS—continued | |||
| Information Technology—continued | |||
| 4,928 | Global Payments, Inc. | $554,745 | |
| 2,106 | 1 | GoDaddy, Inc. | 155,044 |
| 6,103 | 1 | IAC Interactive Corp. | 898,667 |
| 2,339 | 1 | IPG Photonics Corp. | 383,690 |
| 18,872 | Intel Corp. | 907,743 | |
| 10,293 | Intuit, Inc. | 2,102,242 | |
| 6,112 | Lam Research Corp. | 1,165,192 | |
| 12,180 | Mastercard, Inc. | 2,411,640 | |
| 2,681 | Microsoft Corp. | 284,400 | |
| 663 | Monolithic Power Systems | 87,967 | |
| 3,155 | Nvidia Corp. | 772,533 | |
| 12,754 | NetApp, Inc. | 988,690 | |
| 1,497 | 1 | Palo Alto Networks, Inc. | 296,795 |
| 5,684 | 1 | Red Hat, Inc. | 802,751 |
| 17,224 | 1 | Salesforce.com, Inc. | 2,362,272 |
| 5,646 | 1 | ServiceNow, Inc. | 993,470 |
| 2,839 | Total System Services, Inc. | 259,882 | |
| 250 | 1 | Tyler Technologies, Inc. | 56,247 |
| 16,893 | Visa, Inc., Class A | 2,309,949 | |
| 44,090 | Western Union Co. | 888,854 | |
| 779 | Xilinx, Inc. | 56,143 | |
| TOTAL | 38,185,685 | ||
| Materials—2.0% | |||
| 2,401 | Avery Dennison Corp. | 275,347 | |
| 4,503 | 1 | Berry Global Group, Inc. | 219,971 |
| 8,761 | Ecolab, Inc. | 1,232,673 | |
| 216 | Sherwin-Williams Co. | 95,198 | |
| 1,138 | Westlake Chemical Corp. | 122,016 | |
| TOTAL | 1,945,205 | ||
| Telecommunication Services—1.1% | |||
| 463 | 1 | T-Mobile USA, Inc. | 27,780 |
| 20,898 | Verizon Communications, Inc. | 1,079,173 | |
| TOTAL | 1,106,953 | ||
| TOTAL COMMON STOCKS (IDENTIFIED COST $76,408,278) | 95,637,059 |
| Shares | Value | ||
| INVESTMENT COMPANIES—1.5% | |||
| 280,960 | Federated Government Obligations Fund, Premier Shares, 1.80%3 | $280,960 | |
| 1,197,370 | Federated Institutional Prime Value Obligations Fund, Institutional Shares, 2.08%3 | 1,197,609 | |
| TOTAL INVESTMENT COMPANIES (IDENTIFIED COST $1,478,207) | 1,478,569 | ||
| TOTAL INVESTMENT IN SECURITIES—100.7% (IDENTIFIED COST $77,886,485)4 | 97,115,628 | ||
| OTHER ASSETS AND LIABILITIES - NET—(0.7)%5 | (678,700) | ||
| TOTAL NET ASSETS—100% | $96,436,928 |
| Federated Government Obligations Fund, Premier Shares* | Federated Institutional Prime Value Obligations Fund, Institutional Shares | Total Affiliated Transactions | |
| Balance of Shares Held 7/31/2017 | — | 1,319,861 | 1,319,861 |
| Purchases/Additions | 2,992,532 | 20,555,665 | 23,548,197 |
| Sales/Reductions | (2,711,572) | (20,678,156) | (23,389,728) |
| Balance of Shares Held 7/31/2018 | 280,960 | 1,197,370 | 1,478,330 |
| Value | $280,960 | $1,197,609 | $1,478,569 |
| Change in Unrealized Appreciation/Depreciation | N/A | $163 | $163 |
| Net Realized Gain/(Loss) | N/A | $(2) | $(2) |
| Dividend Income | $2,212 | $26,221 | $28,433 |
| 1 | Non-income-producing security. |
| 2 | All or a portion of these securities are temporarily on loan to unaffiliated broker/dealers. |
| 3 | 7-day net yield. |
| 4 | The cost of investments for federal tax purposes amounts to $77,956,868. |
| 5 | Assets, other than investments in securities, less liabilities. See Statement of Assets and Liabilities. |
| Year Ended July 31 | 2018 | 2017 | 2016 | 2015 | 2014 |
| Net Asset Value, Beginning of Period | $17.46 | $15.18 | $17.64 | $16.15 | $13.58 |
| Income From Investment Operations: | |||||
| Net investment income (loss)1 | (0.07) | 0.01 | 0.04 | 0.02 | 0.03 |
| Net realized and unrealized gain (loss) | 4.67 | 2.36 | (0.70) | 1.47 | 2.54 |
| TOTAL FROM INVESTMENT OPERATIONS | 4.60 | 2.37 | (0.66) | 1.49 | 2.57 |
| Less Distributions: | |||||
| Distributions from net realized gain | (1.40) | (0.09) | (1.80) | — | — |
| Net Asset Value, End of Period | $20.66 | $17.46 | $15.18 | $17.64 | $16.15 |
| Total Return2 | 27.38% | 15.66% | (3.62)% | 9.23% | 18.92% |
| Ratios to Average Net Assets: | |||||
| Net expenses | 1.52% | 1.52% | 1.50% | 1.50% | 1.50% |
| Net investment income (loss) | (0.38)% | 0.02% | 0.28% | 0.13% | 0.17% |
| Expense waiver/reimbursement3 | 0.02% | 0.08% | 0.07% | 0.03% | 0.11% |
| Supplemental Data: | |||||
| Net assets, end of period (000 omitted) | $59,355 | $49,794 | $45,661 | $55,033 | $54,573 |
| Portfolio turnover | 104% | 104% | 69% | 91% | 51% |
| 1 | Per share numbers have been calculated using the average shares method. |
| 2 | Based on net asset value, which does not reflect the sales charge, redemption fee or contingent deferred sales charge, if applicable. |
| 3 | This expense decrease is reflected in both the net expense and the net investment income (loss) ratios shown above. |
| Year Ended July 31 | 2018 | 2017 | 2016 | 2015 | 2014 |
| Net Asset Value, Beginning of Period | $16.16 | $14.16 | $16.71 | $15.41 | $13.05 |
| Income From Investment Operations: | |||||
| Net investment income (loss)1 | (0.20) | (0.11) | (0.07) | (0.11) | (0.09) |
| Net realized and unrealized gain (loss) | 4.29 | 2.20 | (0.68) | 1.41 | 2.45 |
| TOTAL FROM INVESTMENT OPERATIONS | 4.09 | 2.09 | (0.75) | 1.30 | 2.36 |
| Less Distributions: | |||||
| Distributions from net realized gain | (1.40) | (0.09) | (1.80) | — | — |
| Net Asset Value, End of Period | $18.85 | $16.16 | $14.16 | $16.71 | $15.41 |
| Total Return2 | 26.38% | 14.81% | (4.41)% | 8.44% | 18.08% |
| Ratios to Average Net Assets: | |||||
| Net expenses | 2.27% | 2.27% | 2.25% | 2.25% | 2.25% |
| Net investment income (loss) | (1.13)% | (0.71)% | (0.49)% | (0.65)% | (0.59)% |
| Expense waiver/reimbursement3 | 0.02% | 0.08% | 0.08% | 0.03% | 0.11% |
| Supplemental Data: | |||||
| Net assets, end of period (000 omitted) | $14,432 | $13,654 | $14,925 | $16,175 | $10,519 |
| Portfolio turnover | 104% | 104% | 69% | 91% | 51% |
| 1 | Per share numbers have been calculated using the average shares method. |
| 2 | Based on net asset value, which does not reflect the sales charge, redemption fee or contingent deferred sales charge, if applicable. |
| 3 | This expense decrease is reflected in both the net expense and the net investment income (loss) ratios shown above. |
| Year Ended July 31 | 2018 | 2017 | 2016 | 2015 | 2014 |
| Net Asset Value, Beginning of Period | $15.76 | $13.81 | $16.34 | $15.07 | $12.76 |
| Income From Investment Operations: | |||||
| Net investment income (loss)1 | (0.19) | (0.11) | (0.06) | (0.10) | (0.08) |
| Net realized and unrealized gain (loss) | 4.18 | 2.15 | (0.67) | 1.37 | 2.39 |
| TOTAL FROM INVESTMENT OPERATIONS | 3.99 | 2.04 | (0.73) | 1.27 | 2.31 |
| Less Distributions: | |||||
| Distributions from net realized gain | (1.40) | (0.09) | (1.80) | — | — |
| Net Asset Value, End of Period | $18.35 | $15.76 | $13.81 | $16.34 | $15.07 |
| Total Return2 | 26.42% | 14.82% | (4.39)% | 8.43% | 18.10% |
| Ratios to Average Net Assets: | |||||
| Net expenses | 2.27% | 2.27% | 2.25% | 2.25% | 2.25% |
| Net investment income (loss) | (1.13)% | (0.72)% | (0.46)% | (0.63)% | (0.59)% |
| Expense waiver/reimbursement3 | 0.02% | 0.08% | 0.07% | 0.03% | 0.11% |
| Supplemental Data: | |||||
| Net assets, end of period (000 omitted) | $10,685 | $9,672 | $10,052 | $12,904 | $11,991 |
| Portfolio turnover | 104% | 104% | 69% | 91% | 51% |
| 1 | Per share numbers have been calculated using the average shares method. |
| 2 | Based on net asset value, which does not reflect the sales charge, redemption fee or contingent deferred sales charge, if applicable. |
| 3 | This expense decrease is reflected in both the net expense and the net investment income (loss) ratios shown above. |
| Year Ended July 31 | 2018 | 2017 | 2016 | 2015 | 2014 |
| Net Asset Value, Beginning of Period | $18.10 | $15.69 | $18.13 | $16.55 | $13.88 |
| Income From Investment Operations: | |||||
| Net investment income (loss)1 | (0.03) | 0.05 | 0.08 | 0.07 | 0.06 |
| Net realized and unrealized gain (loss) | 4.85 | 2.45 | (0.72) | 1.51 | 2.61 |
| TOTAL FROM INVESTMENT OPERATIONS | 4.82 | 2.50 | (0.64) | 1.58 | 2.67 |
| Less Distributions: | |||||
| Distributions from net realized gain | (1.40) | (0.09) | (1.80) | — | — |
| Net Asset Value, End of Period | $21.52 | $18.10 | $15.69 | $18.13 | $16.55 |
| Total Return2 | 27.65% | 15.98% | (3.40)% | 9.55% | 19.24% |
| Ratios to Average Net Assets: | |||||
| Net expenses | 1.27% | 1.27% | 1.25% | 1.25% | 1.25% |
| Net investment income (loss) | (0.14)% | 0.27% | 0.52% | 0.37% | 0.40% |
| Expense waiver/reimbursement3 | 0.02% | 0.08% | 0.07% | 0.03% | 0.10% |
| Supplemental Data: | |||||
| Net assets, end of period (000 omitted) | $11,966 | $7,649 | $7,469 | $7,888 | $7,502 |
| Portfolio turnover | 104% | 104% | 69% | 91% | 51% |
| 1 | Per share numbers have been calculated using the average shares method. |
| 2 | Based on net asset value. |
| 3 | This expense decrease is reflected in both the net expense and the net investment income (loss) ratios shown above. |
| Assets: | ||
| Investment in securities, at value including $276,854 of securities loaned and including $1,478,569 of investment in affiliated holdings (identified cost $77,886,485) | $97,115,628 | |
| Income receivable | 38,828 | |
| Income receivable from affiliated holdings | 3,546 | |
| Receivable for investments sold | 1,452,205 | |
| Receivable for shares sold | 62,610 | |
| TOTAL ASSETS | 98,672,817 | |
| Liabilities: | ||
| Payable for investments purchased | $1,622,012 | |
| Payable for shares redeemed | 164,506 | |
| Payable for collateral due to broker for securities lending | 280,960 | |
| Payable for investment adviser fee (Note 5) | 1,963 | |
| Payable for administrative fees (Note 5) | 210 | |
| Payable for distribution services fee (Note 5) | 16,131 | |
| Payable for other service fees (Notes 2 and 5) | 31,085 | |
| Payable for share registration costs | 32,434 | |
| Accrued expenses (Note 5) | 86,588 | |
| TOTAL LIABILITIES | 2,235,889 | |
| Net assets for 4,776,668 shares outstanding | $96,436,928 | |
| Net Assets Consist of: | ||
| Paid-in capital | $67,642,184 | |
| Net unrealized appreciation | 19,229,143 | |
| Accumulated net realized gain | 9,566,926 | |
| Accumulated net investment income (loss) | (1,325) | |
| TOTAL NET ASSETS | $96,436,928 |
| Net Asset Value, Offering Price and Redemption Proceeds Per Share | ||
| Class A Shares: | ||
| Net asset value per share ($59,354,568 ÷ 2,873,072 shares outstanding), no par value, unlimited shares authorized | $20.66 | |
| Offering price per share (100/94.50 of $20.66) | $21.86 | |
| Redemption proceeds per share | $20.66 | |
| Class B Shares: | ||
| Net asset value per share ($14,431,861 ÷ 765,425 shares outstanding), no par value, unlimited shares authorized | $18.85 | |
| Offering price per share | $18.85 | |
| Redemption proceeds per share (94.50/100 of $18.85) | $17.81 | |
| Class C Shares: | ||
| Net asset value per share ($10,684,747 ÷ 582,169 shares outstanding), no par value, unlimited shares authorized | $18.35 | |
| Offering price per share | $18.35 | |
| Redemption proceeds per share (99.00/100 of $18.35) | $18.17 | |
| Institutional Shares: | ||
| Net asset value per share ($11,965,752 ÷ 556,002 shares outstanding), no par value, unlimited shares authorized | $21.52 | |
| Offering price per share | $21.52 | |
| Redemption proceeds per share | $21.52 |
| Investment Income: | |||
| Dividends (including $26,221 received from affiliated holdings*) | $997,373 | ||
| Net income on securities loaned (includes $2,212 received from affiliated holdings related to cash collateral balances*) | 1,246 | ||
| TOTAL INCOME | 998,619 | ||
| Expenses: | |||
| Investment adviser fee (Note 5) | $657,420 | ||
| Administrative fee (Note 5) | 70,176 | ||
| Custodian fees | 18,723 | ||
| Transfer agent fee | 155,649 | ||
| Directors'/Trustees' fees (Note 5) | 2,162 | ||
| Auditing fees | 26,700 | ||
| Legal fees | 8,669 | ||
| Portfolio accounting fees | 73,894 | ||
| Distribution services fee (Note 5) | 183,177 | ||
| Other service fees (Notes 2 and 5) | 199,448 | ||
| Share registration costs | 59,890 | ||
| Printing and postage | 37,599 | ||
| Miscellaneous (Note 5) | 23,282 | ||
| TOTAL EXPENSES | 1,516,789 | ||
| Waiver/reimbursement of investment adviser fee (Note 5) | (18,388) | ||
| Net expenses | 1,498,401 | ||
| Net investment income (loss) | (499,782) | ||
| Realized and Unrealized Gain (Loss) on Investments: | |||
| Net realized gain on investments (including net realized loss of $(2) on sales of investments in affiliated holdings*) | 10,083,407 | ||
| Net change in unrealized appreciation of investments (including net change in unrealized appreciation of $163 of investments in affiliated holdings*) | 11,109,591 | ||
| Net realized and unrealized gain on investments | 21,192,998 | ||
| Change in net assets resulting from operations | $20,693,216 |
| Year Ended July 31 | 2018 | 2017 |
| Increase (Decrease) in Net Assets | ||
| Operations: | ||
| Net investment income (loss) | $(499,782) | $(148,080) |
| Net realized gain | 10,083,407 | 6,784,048 |
| Net change in unrealized appreciation/depreciation | 11,109,591 | 4,468,540 |
| CHANGE IN NET ASSETS RESULTING FROM OPERATIONS | 20,693,216 | 11,104,508 |
| Distributions to Shareholders: | ||
| Distributions from net realized gain | ||
| Class A Shares | (4,029,431) | (251,151) |
| Class B Shares | (1,111,920) | (89,003) |
| Class C Shares | (797,120) | (63,861) |
| Institutional Shares | (476,552) | (34,298) |
| CHANGE IN NET ASSETS RESULTING FROM DISTRIBUTIONS TO SHAREHOLDERS | (6,415,023) | (438,313) |
| Share Transactions: | ||
| Proceeds from sale of shares | 18,205,541 | 14,714,896 |
| Net asset value of shares issued to shareholders in payment of distributions declared | 5,896,339 | 400,439 |
| Cost of shares redeemed | (22,712,943) | (23,117,921) |
| CHANGE IN NET ASSETS RESULTING FROM SHARE TRANSACTIONS | 1,388,937 | (8,002,586) |
| Change in net assets | 15,667,130 | 2,663,609 |
| Net Assets: | ||
| Beginning of period | 80,769,798 | 78,106,189 |
| End of period (including accumulated net investment income (loss) of $(1,325) and $0, respectively) | $96,436,928 | $80,769,798 |
| ■ | Equity securities listed on an exchange or traded through a regulated market system are valued at their last reported sale price or official closing price in their principal exchange or market. |
| ■ | Shares of other mutual funds or non-exchange-traded investment companies are valued based upon their reported NAVs. |
| ■ | Fixed-income securities are fair valued using price evaluations provided by a pricing service approved by the Fund's Board of Trustees (the “Trustees”). |
| ■ | Derivative contracts listed on exchanges are valued at their reported settlement or closing price, except that options are valued at the mean of closing bid and asked quotations. |
| ■ | Over-the-counter (OTC) derivative contracts are fair valued using price evaluations provided by a pricing service approved by the Trustees. |
| ■ | For securities that are fair valued in accordance with procedures established by and under the general supervision of the Trustees, certain factors may be considered, such as: the last traded or purchase price of the security, information obtained by contacting the issuer or dealers, analysis of the issuer's financial statements or other available documents, fundamental analytical data, the nature and duration of restrictions on disposition, the movement of the market in which the security is normally traded, public trading in similar securities or derivative contracts of the issuer or comparable issuers, movement of a relevant index, or other factors including but not limited to industry changes and relevant government actions. |
| Other Service Fees Incurred | |
| Class A Shares | $138,388 |
| Class B Shares | 35,594 |
| Class C Shares | 25,466 |
| TOTAL | $199,448 |
| Market Value of Securities Loaned | Market Value of Collateral |
| $276,854 | $280,960 |
| Year Ended July 31 | 2018 | 2017 | ||
| Class A Shares: | Shares | Amount | Shares | Amount |
| Shares sold | 467,958 | $8,917,991 | 475,321 | $7,859,250 |
| Shares issued to shareholders in payment of distributions declared | 197,851 | 3,618,696 | 14,088 | 224,849 |
| Shares redeemed | (644,382) | (12,286,884) | (646,470) | (10,387,402) |
| NET CHANGE RESULTING FROM CLASS A SHARE TRANSACTIONS | 21,427 | $249,803 | (157,061) | $(2,303,303) |
| Year Ended July 31 | 2018 | 2017 | ||
| Class B Shares: | Shares | Amount | Shares | Amount |
| Shares sold | 66,852 | $1,147,577 | 163,083 | $2,410,420 |
| Shares issued to shareholders in payment of distributions declared | 64,836 | 1,087,294 | 5,885 | 87,332 |
| Shares redeemed | (211,128) | (3,561,428) | (378,313) | (5,664,410) |
| NET CHANGE RESULTING FROM CLASS B SHARE TRANSACTIONS | (79,440) | $(1,326,557) | (209,345) | $(3,166,658) |
| Year Ended July 31 | 2018 | 2017 | ||
| Class C Shares: | Shares | Amount | Shares | Amount |
| Shares sold | 141,746 | $2,436,968 | 154,856 | $2,275,523 |
| Shares issued to shareholders in payment of distributions declared | 47,820 | 780,418 | 4,050 | 58,646 |
| Shares redeemed | (220,940) | (3,759,274) | (273,138) | (4,082,380) |
| NET CHANGE RESULTING FROM CLASS C SHARE TRANSACTIONS | (31,374) | $(541,888) | (114,232) | $ (1,748,211) |
| Year Ended July 31 | 2018 | 2017 | ||
| Institutional Shares: | Shares | Amount | Shares | Amount |
| Shares sold | 267,065 | $5,703,005 | 129,360 | $2,169,703 |
| Shares issued to shareholders in payment of distributions declared | 21,553 | 409,931 | 1,793 | 29,612 |
| Shares redeemed | (155,328) | (3,105,357) | (184,606) | (2,983,729) |
| NET CHANGE RESULTING FROM INSTITUTIONAL SHARE TRANSACTIONS | 133,290 | $3,007,579 | (53,453) | $(784,414) |
| NET CHANGE RESULTING FROM TOTAL FUND SHARE TRANSACTIONS | 43,903 | $1,388,937 | (534,091) | $ (8,002,586) |
| Increase (Decrease) | |
| Undistributed Net Investment Income (Loss) | Accumulated Net Realized Gain (Loss) |
| $498,457 | $(498,457) |
| 2018 | 2017 | |
| Ordinary income1 | $3,734,212 | $— |
| Long-term capital gains | $2,680,811 | $438,313 |
| 1 | For tax purposes, short term capital gains distributions are considered ordinary income distributions. |
| Undistributed ordinary income2 | $5,514,491 |
| Net unrealized appreciation | $19,158,760 |
| Undistributed long-term capital gains | $4,121,493 |
| 2 | For tax purposes, short term capital gains are considered ordinary income in determining distributable earnings. |
| Administrative Fee | Average Daily Net Assets of the Investment Complex |
| 0.100% | on assets up to $50 billion |
| 0.075% | on assets over $50 billion |
| Administrative Fee | Average Daily Net Assets of the Investment Complex |
| 0.150% | on the first $5 billion |
| 0.125% | on the next $5 billion |
| 0.100% | on the next $10 billion |
| 0.075% | on assets in excess of $20 billion |
| Share Class Name | Percentage of Average Daily Net Assets of Class |
| Class A Shares | 0.05% |
| Class B Shares | 0.75% |
| Class C Shares | 0.75% |
| Distribution Services Fees Incurred | |
| Class B Shares | $106,781 |
| Class C Shares | 76,396 |
| TOTAL | $183,177 |
| Purchases | $89,360,663 |
| Sales | $94,186,371 |
September 24, 2018
| Beginning Account Value 2/1/2018 | Ending Account Value 7/31/2018 | Expenses Paid During Period1 | |
| Actual: | |||
| Class A Shares | $1,000 | $1,053.00 | $7.74 |
| Class B Shares | $1,000 | $1,049.00 | $11.53 |
| Class C Shares | $1,000 | $1,048.60 | $11.53 |
| Institutional Shares | $1,000 | $1,054.40 | $6.47 |
| Hypothetical (assuming a 5% return before expenses): | |||
| Class A Shares | $1,000 | $1,017.30 | $7.60 |
| Class B Shares | $1,000 | $1,013.50 | $11.33 |
| Class C Shares | $1,000 | $1,013.50 | $11.33 |
| Institutional Shares | $1,000 | $1,018.50 | $6.36 |
| 1 | Expenses are equal to the Fund's annualized net expense ratios, multiplied by the average account value over the period, multiplied by 184/365 (to reflect the one-half-year period). The annualized net expense ratios are as follows: |
| Class A Shares | 1.52% |
| Class B Shares | 2.27% |
| Class C Shares | 2.27% |
| Institutional Shares | 1.27% |
| Name Birth Date Positions Held with Trust Date Service Began | Principal Occupation(s) for Past Five Years, Other Directorships Held and Previous Position(s) |
| J. Christopher Donahue* Birth Date: April 11, 1949 President and Trustee Indefinite Term Began serving: May 2006 | Principal Occupations: Principal Executive Officer and President of certain of the Funds in the Federated Fund Family; Director or Trustee of the Funds in the Federated Fund Family; President, Chief Executive Officer and Director, Federated Investors, Inc.; Chairman and Trustee, Federated Investment Management Company; Trustee, Federated Investment Counseling; Chairman and Director, Federated Global Investment Management Corp.; Chairman and Trustee, Federated Equity Management Company of Pennsylvania; Trustee, Federated Shareholder Services Company; Director, Federated Services Company. Previous Positions: President, Federated Investment Counseling; President and Chief Executive Officer, Federated Investment Management Company, Federated Global Investment Management Corp. and Passport Research, Ltd; Chairman, Passport Research, Ltd. |
| Name Birth Date Positions Held with Trust Date Service Began | Principal Occupation(s) for Past Five Years, Other Directorships Held and Previous Position(s) |
| John B. Fisher* Birth Date: May 16, 1956 Trustee Indefinite Term Began serving: May 2016 | Principal Occupations: Principal Executive Officer and President of certain of the Funds in the Federated Fund Family; Director or Trustee of certain of the Funds in the Federated Fund Family; Vice President, Federated Investors, Inc.; President, Director/Trustee and CEO, Federated Advisory Services Company, Federated Equity Management Company of Pennsylvania, Federated Global Investment Management Corp., Federated Investment Counseling, Federated Investment Management Company; President of some of the Funds in the Federated Fund Complex and Director, Federated Investors Trust Company. Previous Positions: President and Director of the Institutional Sales Division of Federated Securities Corp.; President and Director of Federated Investment Counseling; President and CEO of Passport Research, Ltd.; Director, Edgewood Securities Corp.; Director, Federated Services Company; Director, Federated Investors, Inc.; Chairman and Director, Southpointe Distribution Services, Inc. and President, Technology, Federated Services Company. |
| * | Reasons for “interested” status: J. Christopher Donahue and John B. Fisher are interested due to their beneficial ownership of shares of Federated Investors, Inc. and due to positions they hold with Federated and its subsidiaries. |
| Name Birth Date Positions Held with Trust Date Service Began | Principal Occupation(s) for Past Five Years, Other Directorships Held, Previous Position(s) and Qualifications |
| John T. Collins Birth Date: January 24, 1947 Trustee Indefinite Term Began serving: October 2013 | Principal Occupations: Director or Trustee of the Federated Fund Family; formerly, Chairman and CEO, The Collins Group, Inc. (a private equity firm) (Retired). Other Directorships Held: Director, Current Chair of the Compensation Committee, KLX Corp. Qualifications: Mr. Collins has served in several business and financial management roles and directorship positions throughout his career. Mr. Collins previously served as Chairman and CEO, The Collins Group, Inc. (a private equity firm). Mr. Collins serves as Chairman Emeriti, Bentley University. Mr. Collins previously served as Director and Audit Committee Member, Bank of America Corp.; Director, FleetBoston Financial Corp.; and Director, Beth Israel Deaconess Medical Center (Harvard University Affiliate Hospital). |
| Name Birth Date Positions Held with Trust Date Service Began | Principal Occupation(s) for Past Five Years, Other Directorships Held, Previous Position(s) and Qualifications |
| G. Thomas Hough Birth Date: February 28, 1955 Trustee Indefinite Term Began serving: August 2015 | Principal Occupations: Director or Trustee of the Federated Fund Family; formerly, Vice Chair, Ernst & Young LLP (public accounting firm) (Retired). Other Directorships Held: Director, Chair of the Audit Committee, Governance Committee, Publix Super Markets, Inc.; Director, Member of the Audit Committee and Technology Committee of Equifax, Inc. Qualifications: Mr. Hough has served in accounting, business management and directorship positions throughout his career. Mr. Hough most recently held the position of Americas Vice Chair of Assurance with Ernst & Young LLP (public accounting firm). Mr. Hough is an Executive Committee member of the United States Golf Association, he serves on the President's Cabinet and Business School Board of Visitors for the University of Alabama and is on the Business School Board of Visitors for Wake Forest University. |
| Maureen Lally-Green Birth Date: July 5, 1949 Trustee Indefinite Term Began serving: August 2009 | Principal Occupations: Director or Trustee of the Federated Fund Family; Dean of the Duquesne University School of Law; Professor and Adjunct Professor of Law, Duquesne University School of Law; formerly, Interim Dean of the Duquesne University School of Law; formerly, Associate General Secretary and Director, Office of Church Relations, Diocese of Pittsburgh. Other Directorships Held: Director, CNX Resources Corporation (formerly known as CONSOL Energy Inc.). Qualifications: Judge Lally-Green has served in various legal and business roles and directorship positions throughout her career. Judge Lally-Green previously served as a member of the Superior Court of Pennsylvania and as a Professor of Law, Duquesne University School of Law. Judge Lally-Green also currently holds the positions on not for profit or for profit boards of directors as follows: Director and Chair, UPMC Mercy Hospital; Director and Vice Chair, Our Campaign for the Church Alive!, Inc.; Director, Saint Vincent College; Member, Pennsylvania State Board of Education (public); and Director CNX Resources Corporation (formerly known as CONSOL Energy Inc.). Judge Lally-Green has held the positions of: Director, Auberle; Director, Epilepsy Foundation of Western and Central Pennsylvania; Director, Ireland Institute of Pittsburgh; Director, Saint Thomas More Society; Director and Chair, Catholic High Schools of the Diocese of Pittsburgh, Inc.; Director, Pennsylvania Bar Institute; Regent, St. Vincent Seminary; and Director and Chair, North Catholic High School, Inc. |
| Charles F. Mansfield, Jr. Birth Date: April 10, 1945 Trustee Indefinite Term Began serving: June 2006 | Principal Occupations: Director or Trustee of the Federated Fund Family; Management Consultant. Other Directorships Held: None. Qualifications: Mr. Mansfield has served as a Marine Corps officer and in several banking, business management, educational roles and directorship positions throughout his long career. He remains active as a Management Consultant. |
| Name Birth Date Positions Held with Trust Date Service Began | Principal Occupation(s) for Past Five Years, Other Directorships Held, Previous Position(s) and Qualifications |
| Thomas M. O'Neill Birth Date: June 14, 1951 Trustee Indefinite Term Began serving: August 2006 | Principal Occupations: Director or Trustee, Chair of the Audit Committee of the Federated Fund Family; Sole Proprietor, Navigator Management Company (investment and strategic consulting). Other Directorships Held: None. Qualifications: Mr. O'Neill has served in several business, mutual fund and financial management roles and directorship positions throughout his career. Mr. O'Neill serves as Director, Medicines for Humanity and Director, The Golisano Children's Museum of Naples, Florida. Mr. O'Neill previously served as Chief Executive Officer and President, Managing Director and Chief Investment Officer, Fleet Investment Advisors; President and Chief Executive Officer, Aeltus Investment Management, Inc.; General Partner, Hellman, Jordan Management Co., Boston, MA; Chief Investment Officer, The Putnam Companies, Boston, MA; Credit Analyst and Lending Officer, Fleet Bank; Director and Consultant, EZE Castle Software (investment order management software); and Director, Midway Pacific (lumber). |
| P. Jerome Richey Birth Date: February 23, 1949 Trustee Indefinite Term Began serving: October 2013 | Principal Occupations: Director or Trustee of the Federated Fund Family; Management Consultant; formerly, Senior Vice Chancellor and Chief Legal Officer, University of Pittsburgh and Executive Vice President and Chief Legal Officer, CNX Resources Corporation (formerly known as CONSOL Energy Inc.) Other Directorships Held: None. Qualifications: Mr. Richey has served in several business and legal management roles and directorship positions throughout his career. Mr. Richey most recently held the positions of Senior Vice Chancellor and Chief Legal Officer, University of Pittsburgh. Mr. Richey previously served as Chairman of the Board, Epilepsy Foundation of Western Pennsylvania and Chairman of the Board, World Affairs Council of Pittsburgh. Mr. Richey previously served as Chief Legal Officer and Executive Vice President, CNX Resources Corporation (formerly known as CONSOL Energy Inc.); and Board Member, Ethics Counsel and Shareholder, Buchanan Ingersoll & Rooney PC (a law firm). |
| John S. Walsh Birth Date: November 28, 1957 Trustee Indefinite Term Began serving: June 2006 | Principal Occupations: Director or Trustee, and Chair of the Board of Directors or Trustees, of the Federated Fund Family; President and Director, Heat Wagon, Inc. (manufacturer of construction temporary heaters); President and Director, Manufacturers Products, Inc. (distributor of portable construction heaters); President, Portable Heater Parts, a division of Manufacturers Products, Inc. Other Directorships Held: None. Qualifications: Mr. Walsh has served in several business management roles and directorship positions throughout his career. Mr. Walsh previously served as Vice President, Walsh & Kelly, Inc. (paving contractors). |
| Name Birth Date Address Positions Held with Trust Date Service Began | Principal Occupation(s) for Past Five Years and Previous Position(s) |
| Lori A. Hensler Birth Date: January 6, 1967 TREASURER Officer since: April 2013 | Principal Occupations: Principal Financial Officer and Treasurer of the Federated Fund Family; Senior Vice President, Federated Administrative Services; Financial and Operations Principal for Federated Securities Corp. and Edgewood Services, Inc.; and Assistant Treasurer, Federated Investors Trust Company. Ms. Hensler has received the Certified Public Accountant designation. Previous Positions: Controller of Federated Investors, Inc.; Senior Vice President and Assistant Treasurer, Federated Investors Management Company; Treasurer, Federated Investors Trust Company; Assistant Treasurer, Federated Administrative Services, Federated Administrative Services, Inc., Federated Securities Corp., Edgewood Services, Inc., Federated Advisory Services Company, Federated Equity Management Company of Pennsylvania, Federated Global Investment Management Corp., Federated Investment Counseling, Federated Investment Management Company, Passport Research, Ltd., and Federated MDTA, LLC; Financial and Operations Principal for Federated Securities Corp., Edgewood Services, Inc. and Southpointe Distribution Services, Inc. |
| Peter J. Germain Birth Date: September 3, 1959 CHIEF LEGAL OFFICER, SECRETARY and EXECUTIVE VICE PRESIDENT Officer since: June 2006 | Principal Occupations: Mr. Germain is Chief Legal Officer, Secretary and Executive Vice President of the Federated Fund Family. He is General Counsel, Chief Legal Officer, Secretary and Executive Vice President, Federated Investors, Inc.; Trustee and Senior Vice President, Federated Investors Management Company; Trustee and President, Federated Administrative Services; Director and President, Federated Administrative Services, Inc.; Director and Vice President, Federated Securities Corp.; Director and Secretary, Federated Private Asset Management, Inc.; Secretary, Federated Shareholder Services Company; and Secretary, Retirement Plan Service Company of America. Mr. Germain joined Federated in 1984 and is a member of the Pennsylvania Bar Association. Previous Positions: Deputy General Counsel, Special Counsel, Managing Director of Mutual Fund Services, Federated Investors, Inc.; Senior Vice President, Federated Services Company; and Senior Corporate Counsel, Federated Investors, Inc. |
| Stephen F. Auth Birth Date: September 13, 1956 101 Park Avenue 41st Floor New York, NY 10178 CHIEF INVESTMENT OFFICER Officer since: June 2012 | Principal Occupations: Stephen F. Auth is Chief Investment Officer of various Funds in the Federated Fund Family; Executive Vice President, Federated Investment Counseling, Federated Global Investment Management Corp. and Federated Equity Management Company of Pennsylvania. Previous Positions: Executive Vice President, Federated Investment Management Company and Passport Research, Ltd. (investment advisory subsidiary of Federated); Senior Vice President, Global Portfolio Management Services Division; Senior Vice President, Federated Investment Management Company and Passport Research, Ltd.; Senior Managing Director and Portfolio Manager, Prudential Investments. |
| Name Birth Date Address Positions Held with Trust Date Service Began | Principal Occupation(s) for Past Five Years and Previous Position(s) |
| Stephen Van Meter Birth Date: June 5, 1975 CHIEF COMPLIANCE OFFICER AND SENIOR VICE PRESIDENT Officer since: July 2015 | Principal Occupations: Senior Vice President and Chief Compliance Officer of the Federated Fund Family; Vice President and Chief Compliance Officer of Federated Investors, Inc. and Chief Compliance Officer of certain of its subsidiaries. Mr. Van Meter joined Federated in October 2011. He holds FINRA licenses under Series 3, 7, 24 and 66. Previous Positions: Mr. Van Meter previously held the position of Compliance Operating Officer, Federated Investors, Inc. Prior to joining Federated, Mr. Van Meter served at the United States Securities and Exchange Commission in the positions of Senior Counsel, Office of Chief Counsel, Division of Investment Management and Senior Counsel, Division of Enforcement. |
4000 Ericsson Drive
Warrendale, PA 15086-7561
or call 1-800-341-7400.
CUSIP 31421R684
CUSIP 31421R809
CUSIP 31421R882
2018 ©Federated Investors, Inc.
| Share Class | Ticker | A | QASCX | C | QCSCX | Institutional | QISCX | R6 | QLSCX |
| 1 | Please see the footnotes to the line graphs below for definitions of, and further information about, the R2000. |
| 2 | Please see the footnotes to the line graphs below for definitions of, and further information about, the MSBFA. |
| 3 | The Russell 3000® Index measures the performance of the largest 3,000 U.S. companies representing approximately 98% of the investable U.S. equity market. The Russell 3000® Index is constructed to provide a comprehensive, unbiased and stable barometer of the broad market and is completely reconstituted annually to ensure new and growing equities are reflected.* |
| 4 | Small-cap stocks may be less liquid and subject to greater price volatility than large-cap stocks. |
| 5 | The Russell Microcap® Index measures the performance of the microcap segment of the U.S. equity market. Microcap stocks make up less than 3% of the U.S. equity market (by market cap) and consist of the smallest 1,000 securities in the small-cap Russell 2000® Index, plus the next 1,000 smallest eligible securities by market cap. The Russell Microcap® Index is constructed to provide a comprehensive and unbiased barometer for the microcap segment trading on national exchanges and is completely reconstituted annually to ensure new and growing equities are reflected and companies continue to reflect appropriate capitalization and value characteristics.* |
| 6 | The Russell Top 200® Index measures the performance of the largest cap segment of the U.S. equity universe. The Russell Top 200® Index is a subset of the Russell 3000® Index. It includes approximately 200 of the largest securities based on a combination of their market cap and current index membership, and represents approximately 68% of the U.S. market. The Russell Top 200® Index is constructed to provide a comprehensive and unbiased barometer for this very large cap segment, and is completely reconstituted annually to ensure new and growing equities are reflected.* |
| 7 | The Russell Midcap® Index measures the performance of the mid-cap segment of the U.S. equity universe. The Russell Midcap® Index is a subset of the Russell 1000® Index. It includes approximately 800 of the smallest securities based on a combination of their market cap and current index membership. The Russell Midcap® Index represents approximately 31% of the total market capitalization of the Russell 1000® companies. The Russell Midcap® Index is constructed to provide a comprehensive and unbiased barometer for the mid-cap segment. The Russell Midcap® Index is completely reconstituted annually to ensure larger stocks do not distort the performance and characteristics of the true mid-cap opportunity set.* |
| 8 | The Russell 3000® Growth Index measures the performance of the broad growth segment of the U.S. equity universe. It includes those Russell 3000® Index companies with higher price-to-book ratios and higher forecasted growth values. The Russell 3000® Growth Index is constructed to provide a comprehensive, unbiased and stable barometer of the broad growth market. The Russell 3000® Growth Index is completely reconstituted annually to ensure new and growing equities are included, and that the represented companies continue to reflect growth characteristics.* |
| 9 | The Russell 3000® Value Index measures the performance of the broad value segment of the U.S. equity value universe. It includes those Russell 3000® Index companies with lower price-to-book ratios and lower forecasted growth values. The Russell 3000® Value Index is constructed to provide a comprehensive, unbiased and stable barometer of the broad value market. The Russell 3000® Value Index is completely reconstituted annually to ensure new and growing equities are included and that the represented companies continue to reflect value characteristics.* |
| * | The index is unmanaged, and it is not possible to invest directly in an index. |
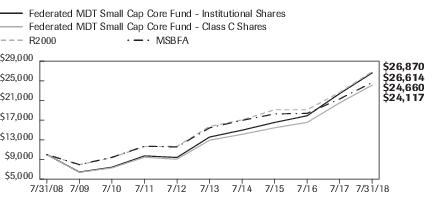
| Federated MDT Small Cap Core Fund - | Institutional Shares | Class C Shares | R2000 | MSBFA |
| F | F | I | I | |
| 7/31/2008 | 10,000 | 10,000 | 10,000 | 10,000 |
| 7/31/2009 | 6,449 | 6,396 | 7,928 | 7,959 |
| 7/31/2010 | 7,422 | 7,287 | 9,389 | 9,439 |
| 7/31/2011 | 9,728 | 9,459 | 11,635 | 11,699 |
| 7/31/2012 | 9,407 | 9,049 | 11,657 | 11,548 |
| 7/31/2013 | 13,560 | 12,923 | 15,709 | 15,431 |
| 7/31/2014 | 14,961 | 14,114 | 17,054 | 16,955 |
| 7/31/2015 | 16,529 | 15,442 | 19,105 | 18,263 |
| 7/31/2016 | 17,891 | 16,541 | 19,105 | 18,370 |
| 7/31/2017 | 22,406 | 20,508 | 22,631 | 21,313 |
| 7/31/2018 | 26,614 | 24,117 | 26,870 | 24,660 |
| ■ | Total returns shown for Class C Shares include the maximum contingent deferred sales charge of 1.00%, as applicable. |
| 1 Year | 5 Years | 10 Years | |
| Class A Shares | 11.96% | 12.85% | 9.41% |
| Class C Shares | 16.60% | 13.29% | 9.20% |
| Institutional Shares | 18.78% | 14.44% | 10.28% |
| Class R6 Shares4 | 18.78% | 14.28% | 8.40% |
| R2000 | 18.73% | 11.33% | 10.39% |
| MSBFA | 15.80% | 10.01% | 9.80% |
| 1 | Represents a hypothetical investment of $10,000 in the Fund after deducting applicable sales charges: for Class A Shares, the maximum sales charge of 5.50% ($10,000 investment minus $550 sales charge = $9,450); for Class C Shares, a 1.00% contingent deferred sales charge would be applied on any redemption less than one year from the purchase date. The Fund's performance assumes the reinvestment of all dividends and distributions. The R2000 and MSBFA have been adjusted to reflect reinvestment of dividends on securities. |
| 2 | The R2000 measures the performance of the small-cap segment of the U.S. equity universe. The R2000 is a subset of the Russell 3000® Index representing approximately 10% of the total market capitalization of that index. It includes approximately 2000 of the smallest securities based on a combination of their market cap and current index membership. The R2000 is constructed to provide a comprehensive and unbiased small-cap barometer, and is completely reconstituted annually to ensure larger stocks do not distort the performance and characteristics of the true small-cap opportunity set. The R2000 is unmanaged and, unlike the Fund, is not affected by cash flows. It is not possible to invest directly in an index. The R2000 is not adjusted to reflect sales charges, expenses or other fees that the Securities and Exchange Commission requires to be reflected in the Fund's performance. |
| 3 | Morningstar figures represent the average of the total returns reported by all the funds designated by Morningstar as falling into the respective category indicated. They do not reflect sales charges. The Morningstar figures in the Growth of $10,000 line graph are based on historical return information published by Morningstar and reflect the return of the funds comprising the category in the year of publication. Because the funds designated by Morningstar as falling into the category can change over time, the Morningstar figures in the line graph may not match the Morningstar figures in the Average Annual Total Returns table, which reflect the return of the funds that currently comprise the category. |
| 4 | The Fund's R6 Class commenced operations on June 29, 2016. It is anticipated that this class will have the lowest net expenses of all outstanding share classes. For the period prior to the commencement of operations of the R6 class, the R6 class performance information shown is for the Institutional Share class, adjusted to reflect the expenses of the Fund's R6 class for each period for which the Fund's R6 class gross expenses would have exceeded the actual expense paid by the Fund's Institutional Share class. |
| Sector Composition | Percentage of Total Net Assets |
| Financials | 18.7% |
| Industrials | 16.1% |
| Health Care | 15.9% |
| Information Technology | 15.3% |
| Consumer Discretionary | 14.0% |
| Materials | 5.1% |
| Energy | 4.0% |
| Utilities | 3.8% |
| Consumer Staples | 3.4% |
| Telecommunication Services | 1.2% |
| Securities Lending Collateral2 | 13.0% |
| Cash Equivalents3 | 3.0% |
| Other Assets and Liabilities—Net4 | (13.5)% |
| TOTAL | 100.0% |
| 1 | Except for Cash Equivalents and Other Assets and Liabilities, sector classifications are based upon, and individual portfolio securities are assigned to, the classifications of the Global Industry Classification Standard (GICS) except that the Adviser assigns a classification to securities not classified by the GICS and to securities for which the Adviser does not have access to the classification made by the GICS. |
| 2 | Represents cash collateral received for portfolio securities on loan that may be invested in affiliated money market funds, other money market instruments and/or repurchase agreements. |
| 3 | Cash Equivalents include any investments in money market mutual funds and/or overnight repurchase agreements other than those representing cash collateral for securities lending. |
| 4 | Assets, other than investments in securities, less liabilities. See Statement of Assets and Liabilities. |
| Shares | Value | ||
| COMMON STOCKS—97.5% | |||
| Consumer Discretionary—14.0% | |||
| 110,625 | BJ's Restaurants, Inc. | $6,997,031 | |
| 120,824 | 1 | Beazer Homes USA, Inc. | 1,547,755 |
| 162,734 | 2 | Buckle, Inc. | 3,913,753 |
| 250,536 | 2 | Chico's Fas, Inc. | 2,179,663 |
| 10,581 | 2 | Children's Place, Inc./The | 1,300,405 |
| 26,066 | 1 | Cooper-Standard Holding, Inc. | 3,513,697 |
| 43,913 | 1 | Deckers Outdoor Corp. | 4,954,704 |
| 99,418 | 1,2 | Fossil, Inc. | 2,604,752 |
| 186,387 | 1,2 | Francesca's Holdings Corp. | 1,517,190 |
| 51,776 | 1,2 | iRobot Corp. | 4,103,248 |
| 383,119 | KB HOME | 9,099,076 | |
| 208,044 | 1 | K12, Inc. | 3,403,600 |
| 45,521 | Movado Group, Inc. | 2,266,946 | |
| 103,526 | Nexstar Media Group, Inc., Class A | 7,707,511 | |
| 142,033 | 2 | Nutri/System, Inc. | 5,681,320 |
| 58,520 | 2 | PetMed Express, Inc. | 2,172,848 |
| 30,096 | 1,2 | RH | 4,088,843 |
| 43,895 | 1,2 | Scientific Games Corp. | 2,109,155 |
| 206,985 | 1 | SeaWorld Entertainment, Inc. | 4,408,780 |
| 122,584 | 1 | Shutterfly, Inc. | 10,083,760 |
| 534,089 | 1 | TRI Pointe Group, Inc. | 7,568,041 |
| 200,243 | 2 | Tailored Brands, Inc. | 4,036,899 |
| 331,290 | 2 | Tile Shop Hldgs., Inc. | 2,749,707 |
| 103,094 | 1 | TopBuild Corp. | 7,657,822 |
| 38,234 | 1,2 | Weight Watchers International, Inc. | 3,423,090 |
| 81,614 | 2 | World Wrestling Entertainment, Inc. | 6,456,483 |
| TOTAL | 115,546,079 | ||
| Consumer Staples—3.4% | |||
| 51,643 | Cal-Maine Foods, Inc. | 2,323,935 | |
| 40,460 | Medifast, Inc. | 6,946,173 | |
| 23,308 | 1,2 | The Boston Beer Co., Inc., Class A | 6,408,534 |
| 41,241 | 1 | USANA Health Sciences, Inc. | 5,454,122 |
| 100,208 | 1,2 | United Natural Foods, Inc. | 3,226,698 |
| 25,920 | 2 | WD 40 Co. | 4,151,088 |
| TOTAL | 28,510,550 |
| Shares | Value | ||
| COMMON STOCKS—continued | |||
| Energy—4.0% | |||
| 24,043 | 2 | Arch Coal, Inc. | $2,033,797 |
| 227,467 | Archrock, Inc. | 3,104,924 | |
| 49,129 | 2 | CVR Energy, Inc. | 1,930,278 |
| 50,281 | 1,2 | Dril-Quip, Inc. | 2,591,986 |
| 121,493 | 1 | Exterran Corp. | 3,367,786 |
| 118,854 | 2 | Gulf Island Fabrication, Inc. | 1,075,629 |
| 133,181 | 1 | Key Energy Services, Inc. | 2,232,114 |
| 388,298 | 1 | Oasis Petroleum, Inc. | 4,745,002 |
| 108,912 | 1 | PDC Energy, Inc. | 6,859,278 |
| 680,881 | 1,2 | W&T Offshore, Inc. | 4,725,314 |
| 12,612 | 1 | Westmoreland Coal Co. | 2,270 |
| TOTAL | 32,668,378 | ||
| Financials—18.7% | |||
| 30,552 | 1st Source Corp. | 1,728,021 | |
| 44,688 | American Equity Investment Life Holding Co. | 1,596,702 | |
| 228,938 | 2 | BancorpSouth Bank | 7,532,060 |
| 360,369 | CNO Financial Group, Inc. | 7,333,509 | |
| 141,265 | 2 | Cadence BanCorporation | 3,846,646 |
| 57,924 | 1,2 | Enova International, Inc. | 1,795,644 |
| 56,195 | 2 | Enterprise Financial Services Corp. | 3,160,969 |
| 259,664 | 1,2 | Ezcorp, Inc., Class A | 2,973,153 |
| 20,428 | Federal Agricultural Mortgage Association, Class C | 1,926,156 | |
| 28,122 | Financial Institutions, Inc. | 891,467 | |
| 99,671 | First Bancorp, Inc. | 4,128,373 | |
| 46,068 | First Busey Corp. | 1,461,277 | |
| 170,742 | First Defiance Financial Corp. | 5,491,063 | |
| 74,985 | First Financial Bancorp | 2,275,795 | |
| 48,448 | First Guaranty Bancshares, Inc. | 1,279,027 | |
| 124,151 | 1 | First NBC Bank Holding Co. | 5,276 |
| 154,200 | Fulton Financial Corp. | 2,675,370 | |
| 102,557 | Hancock Whitney Corp. | 5,153,489 | |
| 71,246 | 1 | Hometrust Bancshares, Inc. | 2,073,259 |
| 132,424 | Iberiabank Corp. | 11,004,434 | |
| 803,266 | Investors Bancorp, Inc. | 10,056,890 | |
| 214,953 | 1 | MGIC Investment Corp. | 2,682,613 |
| 156,105 | Meridian Bancorp, Inc. | 2,856,722 | |
| 173,822 | National Bank Holdings Corp. | 6,879,875 | |
| 19,683 | 1 | Nicolet Bankshares, Inc. | 1,089,454 |
| Shares | Value | ||
| COMMON STOCKS—continued | |||
| Financials—continued | |||
| 252,478 | 2 | Old National Bancorp | $4,910,697 |
| 118,289 | Peapack-Gladstone Financial Corp. | 3,889,342 | |
| 13,446 | 2 | Preferred Bank Los Angeles, CA | 836,879 |
| 112,685 | QCR Holdings, Inc. | 4,896,163 | |
| 21,857 | Republic Bancorp, Inc. | 1,046,295 | |
| 40,214 | Sandy Spring Bancorp, Inc. | 1,572,770 | |
| 81,367 | Simmons 1st National Corp., Class A | 2,424,737 | |
| 23,516 | 1 | Texas Capital Bancshares, Inc. | 2,135,253 |
| 158,307 | TowneBank | 5,113,316 | |
| 32,882 | TriCo Bancshares | 1,276,479 | |
| 76,270 | 2 | UMB Financial Corp. | 5,483,050 |
| 42,943 | Union Bankshares Corp. | 1,739,621 | |
| 60,176 | 2 | Universal Insurance Holdings, Inc. | 2,671,814 |
| 268,161 | Valley National Bancorp | 3,124,076 | |
| 56,326 | WSFS Financial Corp. | 3,193,684 | |
| 132,707 | 2 | Waddell & Reed Financial, Inc., Class A | 2,748,362 |
| 184,301 | 2 | Washington Federal, Inc. | 6,183,299 |
| 227,145 | Waterstone Financial, Inc. | 3,861,465 | |
| 108,805 | Western New England Bancorp, Inc. | 1,180,534 | |
| 47,820 | Wintrust Financial Corp. | 4,195,249 | |
| TOTAL | 154,380,329 | ||
| Health Care—15.9% | |||
| 66,205 | 1,3 | Adeptus Health, Inc., Class A | 0 |
| 78,928 | 1,2 | AMAG Pharmaceutical, Inc. | 1,740,362 |
| 48,366 | 1,2 | Amedisys, Inc. | 4,528,509 |
| 72,793 | 1 | American Renal Associates Holdings, Inc. | 1,171,239 |
| 79,565 | 1,2 | Audentes Therapeutics, Inc. | 2,995,622 |
| 361,657 | 1,2 | DepoMed, Inc. | 3,204,281 |
| 48,368 | 1 | Enanta Pharmaceuticals, Inc. | 4,716,847 |
| 238,840 | 1 | Endo International PLC | 2,971,170 |
| 87,345 | 1 | Genomic Health, Inc. | 4,688,680 |
| 142,734 | 1 | Globus Medical, Inc. | 7,347,946 |
| 80,758 | 1 | Haemonetics Corp. | 7,885,211 |
| 87,234 | 1 | HealthEquity, Inc. | 6,586,167 |
| 91,069 | 1,2 | Heron Therapeutics, Inc. | 3,410,534 |
| 260,696 | 1 | Horizon Pharma PLC | 4,596,070 |
| 33,654 | 1 | ICU Medical, Inc. | 9,651,967 |
| 101,688 | 1,2 | Immunomedics, Inc. | 2,433,394 |
| Shares | Value | ||
| COMMON STOCKS—continued | |||
| Health Care—continued | |||
| 40,959 | 1 | Inogen, Inc. | $8,161,081 |
| 21,778 | 2 | LeMaitre Vascular, Inc. | 784,008 |
| 42,575 | 1,2 | Ligand Pharmaceuticals, Inc., Class B | 9,295,400 |
| 27,001 | 1 | Loxo Oncology, Inc. | 4,525,098 |
| 45,308 | 1,2 | Merit Medical Systems, Inc. | 2,460,224 |
| 45,115 | 1,2 | Merrimack Pharmaceuticals, Inc. | 233,245 |
| 11,558 | 1,2 | Mirati Therapeutics, Inc. | 709,661 |
| 44,721 | 1,2 | Molina Healthcare, Inc. | 4,655,009 |
| 121,590 | 1,2 | Myriad Genetics, Inc. | 5,319,562 |
| 102,926 | 1 | Novocure Ltd. | 3,499,484 |
| 82,310 | 1,2 | NuVasive, Inc. | 4,778,096 |
| 60,932 | 1 | Orthofix International NV | 3,685,777 |
| 24,110 | 1,2 | Penumbra, Inc. | 3,429,648 |
| 81,409 | 1 | Supernus Pharmaceuticals, Inc. | 4,310,607 |
| 93,004 | 1 | Ultragenyx Pharmaceutical, Inc. | 7,357,546 |
| TOTAL | 131,132,445 | ||
| Industrials—16.1% | |||
| 90,844 | 1,2 | ASGN, Inc. | 8,203,213 |
| 155,374 | Acco Brands Corp. | 1,988,787 | |
| 81,750 | 1,2 | AXON Enterprise, Inc. | 5,553,278 |
| 208,195 | CECO Environmental Corp. | 1,430,300 | |
| 99,129 | 1,2 | Caesarstone Ltd. | 1,561,282 |
| 111,392 | 1 | Chart Industries, Inc. | 8,698,601 |
| 47,096 | 1,2 | Cimpress NV | 6,879,313 |
| 108,249 | 2 | DMC Global, Inc. | 4,443,622 |
| 93,413 | Deluxe Corp. | 5,504,828 | |
| 172,264 | Essendant, Inc. | 2,864,750 | |
| 16,167 | 1 | FTI Consulting, Inc. | 1,276,546 |
| 40,864 | 1 | Generac Holdings, Inc. | 2,196,440 |
| 89,265 | 2 | Greenbrier Cos., Inc. | 5,056,862 |
| 146,419 | 1 | Harsco Corp. | 3,711,722 |
| 58,149 | 1 | Herc Holdings, Inc. | 3,304,026 |
| 79,039 | Hurco Co., Inc. | 3,501,428 | |
| 65,089 | Insperity, Inc. | 6,189,964 | |
| 102,335 | 1,2 | JELD-WEN Holding, Inc. | 2,808,072 |
| 237,496 | Kennametal, Inc. | 9,252,844 | |
| 65,491 | 2 | MSA Safety, Inc. | 6,606,732 |
| 33,211 | 1 | Mastec, Inc. | 1,545,972 |
| Shares | Value | ||
| COMMON STOCKS—continued | |||
| Industrials—continued | |||
| 177,780 | Miller Herman, Inc. | $6,728,973 | |
| 51,704 | 1 | Proto Labs, Inc. | 6,444,904 |
| 65,497 | Quad Graphics, Inc. | 1,346,618 | |
| 92,288 | Rush Enterprises, Inc. | 4,161,266 | |
| 75,492 | SkyWest, Inc. | 4,521,971 | |
| 158,366 | 1 | Titan Machinery, Inc. | 2,397,661 |
| 24,150 | 1 | Trex Co., Inc. | 1,877,421 |
| 32,422 | Unifirst Corp. | 6,067,777 | |
| 68,149 | 1 | Univar, Inc. | 1,873,416 |
| 39,898 | 1,2 | Veritiv Corp. | 1,528,093 |
| 31,747 | 1 | XPO Logistics, Inc. | 3,165,811 |
| TOTAL | 132,692,493 | ||
| Information Technology—15.3% | |||
| 64,627 | 1 | Advanced Energy Industries, Inc. | 3,957,758 |
| 35,836 | 1 | Aspen Technology, Inc. | 3,432,730 |
| 38,449 | 2 | Belden, Inc. | 2,489,573 |
| 21,103 | 2 | Blackbaud, Inc. | 2,106,290 |
| 48,042 | 1 | Blucora, Inc. | 1,669,460 |
| 38,374 | 1 | CACI International, Inc., Class A | 6,723,125 |
| 42,780 | Cabot Microelectronics Corp. | 5,152,851 | |
| 102,623 | 1 | Cornerstone OnDemand, Inc. | 5,069,576 |
| 102,777 | 1,2 | Coupa Software, Inc. | 6,301,258 |
| 108,577 | 1,2 | Cray, Inc. | 2,708,996 |
| 156,486 | 1 | Diodes, Inc. | 5,815,020 |
| 147,472 | 1 | Etsy, Inc. | 6,025,706 |
| 143,019 | 1 | Everi Holdings, Inc. | 1,051,190 |
| 124,850 | 1,2 | Five9, Inc. | 3,982,715 |
| 24,352 | 1,2 | GrubHub, Inc. | 2,968,265 |
| 57,846 | 1 | Kimball Electronics, Inc. | 1,177,166 |
| 33,081 | MKS Instruments, Inc. | 3,119,538 | |
| 25,376 | Monolithic Power Systems | 3,366,888 | |
| 70,121 | 1 | New Relic, Inc. | 6,850,822 |
| 75,546 | 1 | Paylocity Corp. | 4,381,668 |
| 46,036 | Progress Software Corp. | 1,693,664 | |
| 60,859 | 1 | Qualys, Inc. | 5,300,819 |
| 21,202 | 1 | RealPage, Inc. | 1,168,230 |
| 40,143 | 1 | RingCentral, Inc. | 2,960,546 |
| 83,752 | 1 | SPS Commerce, Inc. | 7,185,084 |
| Shares | Value | ||
| COMMON STOCKS—continued | |||
| Information Technology—continued | |||
| 178,799 | 1,2 | SailPoint Technologies Holding | $4,307,268 |
| 9,040 | 1,2 | Stamps.com, Inc. | 2,359,440 |
| 33,730 | 1 | Syntel, Inc. | 1,369,101 |
| 180,654 | 1,2 | TTM Technologies | 3,136,153 |
| 44,939 | 1 | Trade Desk, Inc./The | 3,789,256 |
| 118,513 | Travelport Worldwide Ltd. | 2,239,896 | |
| 46,411 | 1 | Verint Systems, Inc. | 2,083,854 |
| 266,015 | 2 | Vishay Intertechnology, Inc. | 6,650,375 |
| 48,000 | 1 | Yelp, Inc. | 1,770,240 |
| 42,752 | 1 | Zendesk, Inc. | 2,328,701 |
| TOTAL | 126,693,222 | ||
| Materials—5.1% | |||
| 182,208 | 1,2 | AgroFresh Solutions, Inc. | 1,295,499 |
| 121,399 | Boise Cascade Co. | 5,250,507 | |
| 147,740 | Carpenter Technology Corp. | 8,091,720 | |
| 157,170 | Commercial Metals Corp. | 3,511,178 | |
| 322,378 | Gold Resource Corp. | 2,111,576 | |
| 32,200 | Kaiser Aluminum Corp. | 3,594,164 | |
| 213,039 | Louisiana-Pacific Corp. | 5,735,010 | |
| 121,607 | Schnitzer Steel Industries, Inc., Class A | 4,006,950 | |
| 40,305 | 2 | Stepan Co. | 3,529,912 |
| 39,190 | Trinseo SA | 2,927,493 | |
| 62,350 | 1 | UFP Technologies, Inc. | 2,038,845 |
| TOTAL | 42,092,854 | ||
| Telecommunication Services—1.2% | |||
| 628,118 | 2 | Frontier Communications Corp. | 3,278,776 |
| 525,467 | 1 | Vonage Holdings Corp. | 6,731,232 |
| TOTAL | 10,010,008 | ||
| Utilities—3.8% | |||
| 78,329 | New Jersey Resources Corp. | 3,622,716 | |
| 126,902 | Northwestern Corp. | 7,529,096 | |
| 214,551 | PNM Resources, Inc. | 8,442,582 | |
| 184,408 | Portland General Electric Co. | 8,364,747 | |
| 49,246 | Southwest Gas Holdings, Inc. | 3,851,037 | |
| TOTAL | 31,810,178 | ||
| TOTAL COMMON STOCKS (IDENTIFIED COST $733,934,300) | 805,536,536 |
| Shares | Value | ||
| INVESTMENT COMPANIES—16.0% | |||
| 43,276,939 | Federated Government Obligations Fund, Premier Shares, 1.80%4 | $43,276,939 | |
| 89,106,925 | Federated Institutional Prime Value Obligations Fund, Institutional Shares, 2.08%4 | 89,124,747 | |
| TOTAL INVESTMENT COMPANIES (IDENTIFIED COST $132,395,077) | 132,401,686 | ||
| TOTAL INVESTMENT IN SECURITIES—113.5% (IDENTIFIED COST $866,329,377)5 | 937,938,222 | ||
| OTHER ASSETS AND LIABILITIES - NET—(13.5)%6 | (111,291,097) | ||
| TOTAL NET ASSETS—100% | $826,647,125 |
| Federated Government Obligations Fund, Premier Shares* | Federated Institutional Prime Value Obligations Fund, Institutional Shares* | Total Affiliated Transactions | |
| Balance of Shares Held 7/31/2017 | — | 7,980,640 | 7,980,640 |
| Purchases/Additions | 181,353,939 | 504,099,656 | 685,453,595 |
| Sales/Reductions | (138,077,000) | (422,973,371) | (561,050,371) |
| Balance of Shares Held 7/31/2018 | 43,276,939 | 89,106,925 | 132,383,864 |
| Value | $43,276,939 | $89,124,747 | $132,401,686 |
| Change in Unrealized Appreciation/Depreciation | N/A | $6,558 | $6,558 |
| Net Realized Gain/(Loss) | N/A | $(3,108) | $(3,108) |
| Dividend Income | $108,630 | $442,925 | $551,555 |
| * | All or a portion of the balance/activity for the fund relates to cash collateral received on securities lending transactions. |
| 1 | Non-income-producing security. |
| 2 | All or a portion of these securities are temporarily on loan to unaffiliated broker/dealers. |
| 3 | Market quotations and price evaluations are not available. Fair value determined using significant unobservable inputs in accordance with procedures established by and under the general supervision of the Fund's Board of Trustees (the “Trustees”). |
| 4 | 7-day net yield. |
| 5 | The cost of investments for federal tax purposes amounts to $867,687,694. |
| 6 | Assets, other than investments in securities, less liabilities. See Statement of Assets and Liabilities. A significant portion of this balance represents loans to unaffiliated qualified brokers for securities lending. The Fund receives cash from the broker as collateral for the loaned securities and reinvests the collateral in certain short-term securities such as affiliated money market funds, other money market instruments and/or repurchase agreements. |
| Valuation Inputs | ||||
| Level 1— Quoted Prices | Level 2— Other Significant Observable Inputs | Level 3— Significant Unobservable Inputs | Total | |
| Equity Securities: | ||||
| Common Stocks | ||||
| Domestic | $798,657,223 | $— | $0 | $798,657,223 |
| International | 6,879,313 | — | — | 6,879,313 |
| Investment Companies | 132,401,686 | — | — | 132,401,686 |
| TOTAL SECURITIES | $937,938,222 | $— | $0 | $937,938,222 |
| Year Ended July 31 | 2018 | 2017 | 2016 | 2015 | 2014 |
| Net Asset Value, Beginning of Period | $18.69 | $15.08 | $15.66 | $15.07 | $13.70 |
| Income From Investment Operations: | |||||
| Net investment income (loss) | (0.01)1 | (0.02)1 | 0.031 | (0.05)1 | (0.12)1 |
| Net realized and unrealized gain (loss) | 3.38 | 3.78 | 1.02 | 1.57 | 1.49 |
| TOTAL FROM INVESTMENT OPERATIONS | 3.37 | 3.76 | 1.05 | 1.52 | 1.37 |
| Less Distributions: | |||||
| Distributions from net realized gain | (0.87) | (0.15) | (1.63) | (0.93) | — |
| Net Asset Value, End of Period | $21.19 | $18.69 | $15.08 | $15.66 | $15.07 |
| Total Return2 | 18.49% | 24.97% | 7.90% | 10.22% | 10.00% |
| Ratios to Average Net Assets: | |||||
| Net expenses | 1.14% | 1.14% | 1.13% | 1.48% | 1.70% |
| Net investment income (loss) | (0.06)% | (0.13)% | 0.19% | (0.35)% | (0.77)% |
| Expense waiver/reimbursement3 | 0.37% | 0.55% | 1.10% | 0.76% | 0.52% |
| Supplemental Data: | |||||
| Net assets, end of period (000 omitted) | $74,396 | $37,031 | $13,035 | $7,160 | $5,346 |
| Portfolio turnover | 88% | 91% | 189% | 166% | 174% |
| 1 | Per share numbers have been calculated using the average shares method. |
| 2 | Based on net asset value, which does not reflect the sales charge, redemption fee or contingent deferred sales charge, if applicable. |
| 3 | This expense decrease is reflected in both the net expense and the net investment income (loss) ratios shown above. |
| Year Ended July 31 | 2018 | 2017 | 2016 | 2015 | 2014 |
| Net Asset Value, Beginning of Period | $16.83 | $13.70 | $14.48 | $14.10 | $12.91 |
| Income From Investment Operations: | |||||
| Net investment income (loss) | (0.14)1 | (0.14)1 | (0.07)1 | (0.16)1 | (0.21)1 |
| Net realized and unrealized gain (loss) | 3.02 | 3.42 | 0.92 | 1.47 | 1.40 |
| TOTAL FROM INVESTMENT OPERATIONS | 2.88 | 3.28 | 0.85 | 1.31 | 1.19 |
| Less Distributions: | |||||
| Distributions from net realized gain | (0.87) | (0.15) | (1.63) | (0.93) | — |
| Net Asset Value, End of Period | $18.84 | $16.83 | $13.70 | $14.48 | $14.10 |
| Total Return2 | 17.60% | 23.98% | 7.12% | 9.41% | 9.22% |
| Ratios to Average Net Assets: | |||||
| Net expenses | 1.89% | 1.89% | 1.88% | 2.28% | 2.45% |
| Net investment income (loss) | (0.81)% | (0.89)% | (0.56)% | (1.11)% | (1.50)% |
| Expense waiver/reimbursement3 | 0.38% | 0.57% | 1.11% | 0.72% | 0.54% |
| Supplemental Data: | |||||
| Net assets, end of period (000 omitted) | $30,072 | $15,223 | $3,422 | $3,031 | $3,338 |
| Portfolio turnover | 88% | 91% | 189% | 166% | 174% |
| 1 | Per share numbers have been calculated using the average shares method. |
| 2 | Based on net asset value, which does not reflect the sales charge, redemption fee or contingent deferred sales charge, if applicable. |
| 3 | This expense decrease is reflected in both the net expense and the net investment income (loss) ratios shown above. |
| Year Ended July 31 | 2018 | 2017 | 2016 | 2015 | 2014 |
| Net Asset Value, Beginning of Period | $19.30 | $15.54 | $16.04 | $15.38 | $13.94 |
| Income From Investment Operations: | |||||
| Net investment income (loss) | 0.031 | 0.021 | 0.061 | (0.02)1 | (0.08)1 |
| Net realized and unrealized gain (loss) | 3.50 | 3.90 | 1.07 | 1.61 | 1.52 |
| TOTAL FROM INVESTMENT OPERATIONS | 3.53 | 3.92 | 1.13 | 1.59 | 1.44 |
| Less Distributions: | |||||
| Distributions from net investment income | (0.02) | — | — | — | — |
| Distributions from net realized gain | (0.87) | (0.16) | (1.63) | (0.93) | — |
| TOTAL DISTRIBUTIONS | (0.89) | (0.16) | (1.63) | (0.93) | — |
| Net Asset Value, End of Period | $21.94 | $19.30 | $15.54 | $16.04 | $15.38 |
| Total Return2 | 18.78% | 25.24% | 8.24% | 10.48% | 10.33% |
| Ratios to Average Net Assets: | |||||
| Net expenses | 0.89% | 0.89% | 0.88% | 1.26% | 1.45% |
| Net investment income (loss) | 0.13% | 0.10% | 0.43% | (0.11)% | (0.51)% |
| Expense waiver/reimbursement3 | 0.34% | 0.53% | 1.11% | 0.74% | 0.52% |
| Supplemental Data: | |||||
| Net assets, end of period (000 omitted) | $708,805 | $179,219 | $24,529 | $20,504 | $21,486 |
| Portfolio turnover | 88% | 91% | 189% | 166% | 174% |
| 1 | Per share numbers have been calculated using the average shares method. |
| 2 | Based on net asset value. |
| 3 | This expense decrease is reflected in both the net expense and the net investment income (loss) ratios shown above. |
| Year Ended July 31, | Period Ended 7/31/20161 | ||
| 2018 | 2017 | ||
| Net Asset Value, Beginning of Period | $19.30 | $15.54 | $13.88 |
| Income From Investment Operations: | |||
| Net investment income (loss) | 0.02 | 0.01 | (0.01)2 |
| Net realized and unrealized gain (loss) | 3.51 | 3.91 | 1.67 |
| TOTAL FROM INVESTMENT OPERATIONS | 3.53 | 3.92 | 1.66 |
| Less Distributions: | |||
| Distributions from net investment income | (0.02) | — | — |
| Distributions from net realized gain | (0.87) | (0.16) | — |
| TOTAL DISTRIBUTIONS | (0.89) | (0.16) | — |
| Net Asset Value, End of Period | $21.94 | $19.30 | $15.54 |
| Total Return3 | 18.78% | 25.24% | 11.96% |
| Ratios to Average Net Assets: | |||
| Net expenses | 0.88% | 0.88% | 0.87%4 |
| Net investment income (loss) | 0.08% | 0.04% | (0.04)%4 |
| Expense waiver/reimbursement5 | 0.26% | 0.41% | 0.97%4 |
| Supplemental Data: | |||
| Net assets, end of period (000 omitted) | $13,374 | $1,017 | $06 |
| Portfolio turnover | 88% | 91% | 189%7 |
| 1 | Reflects operations for the period from June 29, 2016 (date of initial investment) to July 31, 2016. |
| 2 | Per share numbers have been calculated using the average shares method. |
| 3 | Based on net asset value. |
| 4 | Computed on an annualized basis. |
| 5 | This expense decrease is reflected in both the net expense and the net investment income (loss) ratios shown above. |
| 6 | Represents less than $1,000. |
| 7 | Portfolio turnover is calculated at the Fund level. Percentage indicated was calculated for the year ended July 31, 2016. |
| Assets: | ||
| Investment in securities, at value including $105,260,770 of securities loaned and including $132,401,686 of investment in affiliated holdings (identified cost $866,329,377) | $937,938,222 | |
| Income receivable | 131,288 | |
| Income receivable from affiliated holdings | 41,811 | |
| Receivable for investments sold | 6,545,446 | |
| Receivable for shares sold | 3,442,604 | |
| TOTAL ASSETS | 948,099,371 | |
| Liabilities: | ||
| Payable for investments purchased | $13,039,572 | |
| Payable for shares redeemed | 818,054 | |
| Payable for collateral due to broker for securities lending | 107,326,939 | |
| Payable for investment adviser fee (Note 5) | 15,910 | |
| Payable for administrative fee (Note 5) | 1,797 | |
| Payable for distribution services fee (Note 5) | 18,962 | |
| Payable for other service fees (Notes 2 and 5) | 46,554 | |
| Accrued expenses (Note 5) | 184,458 | |
| TOTAL LIABILITIES | 121,452,246 | |
| Net assets for 38,024,852 shares outstanding | $826,647,125 | |
| Net Assets Consist of: | ||
| Paid-in capital | $742,584,610 | |
| Net unrealized appreciation | 71,608,845 | |
| Accumulated net realized gain | 12,453,670 | |
| TOTAL NET ASSETS | $826,647,125 |
| Net Asset Value, Offering Price and Redemption Proceeds Per Share | ||
| Class A Shares: | ||
| Net asset value per share ($74,396,196 ÷ 3,511,549 shares outstanding), no par value, unlimited shares authorized | $21.19 | |
| Offering price per share (100/94.50 of $21.19) | $22.42 | |
| Redemption proceeds per share | $21.19 | |
| Class C Shares: | ||
| Net asset value per share ($30,072,152 ÷ 1,595,972 shares outstanding), no par value, unlimited shares authorized | $18.84 | |
| Offering price per share | $18.84 | |
| Redemption proceeds per share (99.00/100 of $18.84) | $18.65 | |
| Institutional Shares: | ||
| Net asset value per share ($708,804,711 ÷ 32,307,834 shares outstanding), no par value, unlimited shares authorized | $21.94 | |
| Offering price per share | $21.94 | |
| Redemption proceeds per share | $21.94 | |
| Class R6 Shares: | ||
| Net asset value per share ($13,374,066 ÷ 609,497 shares outstanding), no par value, unlimited shares authorized | $21.94 | |
| Offering price per share | $21.94 | |
| Redemption proceeds per share | $21.94 |
| Investment Income: | |||
| Dividends (including $244,437 received from affiliated holdings* and net of foreign taxes withheld of $4,274) | $4,607,785 | ||
| Net income on securities loaned (includes $307,118 received from affiliated holdings related to cash collateral balances*) | 165,990 | ||
| TOTAL INCOME | 4,773,775 | ||
| Expenses: | |||
| Investment adviser fee (Note 5) | $4,499,418 | ||
| Administrative fee (Note 5) | 372,528 | ||
| Custodian fees | 24,374 | ||
| Transfer agent fee (Note 2) | 476,388 | ||
| Directors'/Trustees' fees (Note 5) | 3,883 | ||
| Auditing fees | 26,700 | ||
| Legal fees | 8,669 | ||
| Portfolio accounting fees | 117,902 | ||
| Distribution services fee (Note 5) | 155,950 | ||
| Other service fees (Notes 2 and 5) | 194,853 | ||
| Share registration costs | 133,414 | ||
| Printing and postage | 52,060 | ||
| Miscellaneous (Note 5) | 26,348 | ||
| TOTAL EXPENSES | 6,092,487 | ||
| Waiver and Reimbursements: | |||
| Waiver/reimbursement of investment adviser fee (Note 5) | $(1,235,464) | ||
| Reimbursement of other operating expenses (Notes 2 and 5) | (375,066) | ||
| TOTAL WAIVER AND REIMBURSEMENTS | (1,610,530) | ||
| Net expenses | 4,481,957 | ||
| Net investment income | 291,818 | ||
| Realized and Unrealized Gain (Loss) on Investments: | |||
| Net realized gain on investments (including net realized loss of $(3,108) on sales of investments in affiliated holdings*) | 18,755,103 | ||
| Net change in unrealized appreciation of investments (including net change in unrealized appreciation of $6,558 on investments in affiliated holdings*) | 57,705,393 | ||
| Net realized and unrealized gain on investments | 76,460,496 | ||
| Change in net assets resulting from operations | $76,752,314 |
| * | See information listed after the Fund's Portfolio of Investments. |
| Year Ended July 31 | 2018 | 2017 |
| Increase (Decrease) in Net Assets | ||
| Operations: | ||
| Net investment income (loss) | $291,818 | $(29,946) |
| Net realized gain | 18,755,103 | 10,729,386 |
| Net change in unrealized appreciation/depreciation | 57,705,393 | 10,955,971 |
| CHANGE IN NET ASSETS RESULTING FROM OPERATIONS | 76,752,314 | 21,655,411 |
| Distributions to Shareholders: | ||
| Distributions from net investment income | ||
| Institutional Shares | (287,325) | — |
| Class R6 Shares | (4,493) | — |
| Distributions from net realized gain | ||
| Class A Shares | (2,298,928) | (229,905) |
| Class C Shares | (898,230) | (64,270) |
| Institutional Shares | (11,856,739) | (525,114) |
| Class R6 Shares | (184,805) | (1) |
| CHANGE IN NET ASSETS RESULTING FROM DISTRIBUTIONS TO SHAREHOLDERS | (15,530,520) | (819,290) |
| Share Transactions: | ||
| Proceeds from sale of shares | 637,054,717 | 234,400,654 |
| Net asset value of shares issued to shareholders in payment of distributions declared | 15,027,304 | 801,641 |
| Cost of shares redeemed | (119,146,419) | (64,535,560) |
| CHANGE IN NET ASSETS RESULTING FROM SHARE TRANSACTIONS | 532,935,602 | 170,666,735 |
| Change in net assets | 594,157,396 | 191,502,856 |
| Net Assets: | ||
| Beginning of period | 232,489,729 | 40,986,873 |
| End of period | $826,647,125 | $232,489,729 |
| ■ | Equity securities listed on an exchange or traded through a regulated market system are valued at their last reported sale price or official closing price in their principal exchange or market. |
| ■ | Shares of other mutual funds or non-exchange-traded investment companies are valued based upon their reported NAVs. |
| ■ | Fixed-income securities are fair valued using price evaluations provided by a pricing service approved by the Trustees. |
| ■ | Derivative contracts listed on exchanges are valued at their reported settlement or closing price, except that options are valued at the mean of closing bid and asked quotations. |
| ■ | Over-the-counter (OTC) derivative contracts are fair valued using price evaluations provided by a pricing service approved by the Trustees. |
| ■ | For securities that are fair valued in accordance with procedures established by and under the general supervision of the Trustees, certain factors may be considered, such as: the last traded or purchase price of the security, information obtained by contacting the issuer or dealers, analysis of the issuer's financial statements or other available documents, fundamental analytical data, the nature and duration of restrictions on disposition, the movement of the market in which the security is normally traded, public trading in similar securities or derivative contracts of the issuer or comparable issuers, movement of a relevant index, or other factors including but not limited to industry changes and relevant government actions. |
| Transfer Agent Fees Incurred | Transfer Agent Fees Reimbursed | |
| Class A Shares | $67,492 | $(54,946) |
| Class C Shares | 27,528 | (22,441) |
| Institutional Shares | 380,640 | (297,679) |
| Class R6 Shares | 728 | — |
| TOTAL | $476,388 | $(375,066) |
| Other Service Fees Incurred | |
| Class A Shares | $143,395 |
| Class C Shares | 51,458 |
| TOTAL | $194,853 |
| Market Value of Securities Loaned | Market Value of Collateral |
| $105,260,770 | $107,326,939 |
| Year Ended July 31 | 2018 | 2017 | ||
| Class A Shares: | Shares | Amount | Shares | Amount |
| Shares sold | 2,701,057 | $54,055,165 | 2,543,276 | $44,263,084 |
| Shares issued to shareholders in payment of distributions declared | 114,322 | 2,215,556 | 12,847 | 227,778 |
| Shares redeemed | (1,285,487) | (26,118,919) | (1,438,730) | (25,497,861) |
| NET CHANGE RESULTING FROM CLASS A SHARE TRANSACTIONS | 1,529,892 | $30,151,802 | 1,117,393 | $18,993,001 |
| Year Ended July 31 | 2018 | 2017 | ||
| Class C Shares: | Shares | Amount | Shares | Amount |
| Shares sold | 895,916 | $16,153,794 | 844,369 | $13,376,009 |
| Shares issued to shareholders in payment of distributions declared | 51,304 | 888,075 | 3,710 | 59,508 |
| Shares redeemed | (255,648) | (4,525,472) | (193,490) | (3,060,689) |
| NET CHANGE RESULTING FROM CLASS C SHARE TRANSACTIONS | 691,572 | $12,516,397 | 654,589 | $10,374,828 |
| Year Ended July 31 | 2018 | 2017 | ||
| Institutional Shares: | Shares | Amount | Shares | Amount |
| Shares sold | 26,620,440 | $553,678,973 | 9,680,146 | $175,632,372 |
| Shares issued to shareholders in payment of distributions declared | 584,818 | 11,734,158 | 28,142 | 514,355 |
| Shares redeemed | (4,184,409) | (86,776,222) | (2,000,149) | (35,852,755) |
| NET CHANGE RESULTING FROM INSTITUTIONAL SHARE TRANSACTIONS | 23,020,849 | $478,636,909 | 7,708,139 | $140,293,972 |
| Year Ended July 31 | 2018 | 2017 | ||
| Class R6 Shares: | Shares | Amount | Shares | Amount |
| Shares sold | 631,723 | $13,166,785 | 59,333 | $1,129,189 |
| Shares issued to shareholders in payment of distributions declared | 9,445 | 189,515 | — | — |
| Shares redeemed | (84,376) | (1,725,806) | (6,635) | (124,255) |
| NET CHANGE RESULTING FROM CLASS R6 SHARE TRANSACTIONS | 556,792 | $11,630,494 | 52,698 | $1,004,934 |
| NET CHANGE RESULTING FROM TOTAL FUND SHARE TRANSACTIONS | 25,799,105 | $532,935,602 | 9,532,819 | $170,666,735 |
| 2018 | 2017 | |
| Ordinary income1 | $13,627,453 | $819,290 |
| Long-term capital gains | $1,903,067 | $— |
| 1 | For tax purposes, short-term capital gain distributions are considered ordinary income distributions. |
| Undistributed ordinary income2 | $12,099,427 |
| Net unrealized appreciation | $70,250,528 |
| Undistributed long-term capital gains | $1,712,560 |
| 2 | For tax purposes, short-term capital gains are considered ordinary income in determining distributable earnings. |
| Administrative Fee | Average Daily Net Assets of the Investment Complex |
| 0.100% | on assets up to $50 billion |
| 0.075% | on assets over $50 billion |
| Administrative Fee | Average Daily Net Assets of the Investment Complex |
| 0.150% | on the first $5 billion |
| 0.125% | on the next $5 billion |
| 0.100% | on the next $10 billion |
| 0.075% | on assets in excess of $20 billion |
| Share Class Name | Percentage of Average Daily Net Assets of Class |
| Class A Shares | 0.05% |
| Class C Shares | 0.75% |
| Distribution Services Fees Incurred | |
| Class C Shares | $155,950 |
| Purchases | $903,217,735 |
| Sales | $397,947,783 |
September 24, 2018
| Beginning Account Value 2/1/2018 | Ending Account Value 7/31/2018 | Expenses Paid During Period1 | |
| Actual: | |||
| Class A Shares | $1,000 | $1,062.70 | $5.83 |
| Class C Shares | $1,000 | $1,058.40 | $9.65 |
| Institutional Shares | $1,000 | $1,064.00 | $4.55 |
| Class R6 Shares | $1,000 | $1,064.00 | $4.50 |
| Hypothetical (assuming a 5% return before expenses): | |||
| Class A Shares | $1,000 | $1,019.10 | $5.71 |
| Class C Shares | $1,000 | $1,015.40 | $9.44 |
| Institutional Shares | $1,000 | $1,020.40 | $4.46 |
| Class R6 Shares | $1,000 | $1,020.40 | $4.41 |
| 1 | Expenses are equal to the Fund's annualized net expense ratios, multiplied by the average account value over the period, multiplied by 181/365 (to reflect the one-half-year period). The annualized net expense ratios are as follows: |
| Class A Shares | 1.14% |
| Class C Shares | 1.89% |
| Institutional Shares | 0.89% |
| Class R6 Shares | 0.88% |
| Name Birth Date Positions Held with Trust Date Service Began | Principal Occupation(s) for Past Five Years, Other Directorships Held and Previous Position(s) |
| J. Christopher Donahue* Birth Date: April 11, 1949 President and Trustee Indefinite Term Began serving: May 2006 | Principal Occupations: Principal Executive Officer and President of certain of the Funds in the Federated Fund Family; Director or Trustee of the Funds in the Federated Fund Family; President, Chief Executive Officer and Director, Federated Investors, Inc.; Chairman and Trustee, Federated Investment Management Company; Trustee, Federated Investment Counseling; Chairman and Director, Federated Global Investment Management Corp.; Chairman and Trustee, Federated Equity Management Company of Pennsylvania; Trustee, Federated Shareholder Services Company; Director, Federated Services Company. Previous Positions: President, Federated Investment Counseling; President and Chief Executive Officer, Federated Investment Management Company, Federated Global Investment Management Corp. and Passport Research, Ltd; Chairman, Passport Research, Ltd. |
| Name Birth Date Positions Held with Trust Date Service Began | Principal Occupation(s) for Past Five Years, Other Directorships Held and Previous Position(s) |
| John B. Fisher* Birth Date: May 16, 1956 Trustee Indefinite Term Began serving: May 2016 | Principal Occupations: Principal Executive Officer and President of certain of the Funds in the Federated Fund Family; Director or Trustee of certain of the Funds in the Federated Fund Family; Vice President, Federated Investors, Inc.; President, Director/Trustee and CEO, Federated Advisory Services Company, Federated Equity Management Company of Pennsylvania, Federated Global Investment Management Corp., Federated Investment Counseling, Federated Investment Management Company; President of some of the Funds in the Federated Fund Complex and Director, Federated Investors Trust Company. Previous Positions: President and Director of the Institutional Sales Division of Federated Securities Corp.; President and Director of Federated Investment Counseling; President and CEO of Passport Research, Ltd.; Director, Edgewood Securities Corp.; Director, Federated Services Company; Director, Federated Investors, Inc.; Chairman and Director, Southpointe Distribution Services, Inc. and President, Technology, Federated Services Company. |
| * | Reasons for “interested” status: J. Christopher Donahue and John B. Fisher are interested due to their beneficial ownership of shares of Federated Investors, Inc. and due to positions they hold with Federated and its subsidiaries. |
| Name Birth Date Positions Held with Trust Date Service Began | Principal Occupation(s) for Past Five Years, Other Directorships Held, Previous Position(s) and Qualifications |
| John T. Collins Birth Date: January 24, 1947 Trustee Indefinite Term Began serving: October 2013 | Principal Occupations: Director or Trustee of the Federated Fund Family; formerly, Chairman and CEO, The Collins Group, Inc. (a private equity firm) (Retired). Other Directorships Held: Director, Current Chair of the Compensation Committee, KLX Corp. Qualifications: Mr. Collins has served in several business and financial management roles and directorship positions throughout his career. Mr. Collins previously served as Chairman and CEO, The Collins Group, Inc. (a private equity firm). Mr. Collins serves as Chairman Emeriti, Bentley University. Mr. Collins previously served as Director and Audit Committee Member, Bank of America Corp.; Director, FleetBoston Financial Corp.; and Director, Beth Israel Deaconess Medical Center (Harvard University Affiliate Hospital). |
| Name Birth Date Positions Held with Trust Date Service Began | Principal Occupation(s) for Past Five Years, Other Directorships Held, Previous Position(s) and Qualifications |
| G. Thomas Hough Birth Date: February 28, 1955 Trustee Indefinite Term Began serving: August 2015 | Principal Occupations: Director or Trustee of the Federated Fund Family; formerly, Vice Chair, Ernst & Young LLP (public accounting firm) (Retired). Other Directorships Held: Director, Chair of the Audit Committee, Governance Committee, Publix Super Markets, Inc.; Director, Member of the Audit Committee and Technology Committee of Equifax, Inc. Qualifications: Mr. Hough has served in accounting, business management and directorship positions throughout his career. Mr. Hough most recently held the position of Americas Vice Chair of Assurance with Ernst & Young LLP (public accounting firm). Mr. Hough is an Executive Committee member of the United States Golf Association, he serves on the President's Cabinet and Business School Board of Visitors for the University of Alabama and is on the Business School Board of Visitors for Wake Forest University. |
| Maureen Lally-Green Birth Date: July 5, 1949 Trustee Indefinite Term Began serving: August 2009 | Principal Occupations: Director or Trustee of the Federated Fund Family; Dean of the Duquesne University School of Law; Professor and Adjunct Professor of Law, Duquesne University School of Law; formerly, Interim Dean of the Duquesne University School of Law; formerly, Associate General Secretary and Director, Office of Church Relations, Diocese of Pittsburgh. Other Directorships Held: Director, CNX Resources Corporation (formerly known as CONSOL Energy Inc.). Qualifications: Judge Lally-Green has served in various legal and business roles and directorship positions throughout her career. Judge Lally-Green previously served as a member of the Superior Court of Pennsylvania and as a Professor of Law, Duquesne University School of Law. Judge Lally-Green also currently holds the positions on not for profit or for profit boards of directors as follows: Director and Chair, UPMC Mercy Hospital; Director and Vice Chair, Our Campaign for the Church Alive!, Inc.; Director, Saint Vincent College; Member, Pennsylvania State Board of Education (public); and Director CNX Resources Corporation (formerly known as CONSOL Energy Inc.). Judge Lally-Green has held the positions of: Director, Auberle; Director, Epilepsy Foundation of Western and Central Pennsylvania; Director, Ireland Institute of Pittsburgh; Director, Saint Thomas More Society; Director and Chair, Catholic High Schools of the Diocese of Pittsburgh, Inc.; Director, Pennsylvania Bar Institute; Regent, St. Vincent Seminary; and Director and Chair, North Catholic High School, Inc. |
| Charles F. Mansfield, Jr. Birth Date: April 10, 1945 Trustee Indefinite Term Began serving: June 2006 | Principal Occupations: Director or Trustee of the Federated Fund Family; Management Consultant. Other Directorships Held: None. Qualifications: Mr. Mansfield has served as a Marine Corps officer and in several banking, business management, educational roles and directorship positions throughout his long career. He remains active as a Management Consultant. |
| Name Birth Date Positions Held with Trust Date Service Began | Principal Occupation(s) for Past Five Years, Other Directorships Held, Previous Position(s) and Qualifications |
| Thomas M. O'Neill Birth Date: June 14, 1951 Trustee Indefinite Term Began serving: August 2006 | Principal Occupations: Director or Trustee, Chair of the Audit Committee of the Federated Fund Family; Sole Proprietor, Navigator Management Company (investment and strategic consulting). Other Directorships Held: None. Qualifications: Mr. O'Neill has served in several business, mutual fund and financial management roles and directorship positions throughout his career. Mr. O'Neill serves as Director, Medicines for Humanity and Director, The Golisano Children's Museum of Naples, Florida. Mr. O'Neill previously served as Chief Executive Officer and President, Managing Director and Chief Investment Officer, Fleet Investment Advisors; President and Chief Executive Officer, Aeltus Investment Management, Inc.; General Partner, Hellman, Jordan Management Co., Boston, MA; Chief Investment Officer, The Putnam Companies, Boston, MA; Credit Analyst and Lending Officer, Fleet Bank; Director and Consultant, EZE Castle Software (investment order management software); and Director, Midway Pacific (lumber). |
| P. Jerome Richey Birth Date: February 23, 1949 Trustee Indefinite Term Began serving: October 2013 | Principal Occupations: Director or Trustee of the Federated Fund Family; Management Consultant; formerly, Senior Vice Chancellor and Chief Legal Officer, University of Pittsburgh and Executive Vice President and Chief Legal Officer, CNX Resources Corporation (formerly known as CONSOL Energy Inc.) Other Directorships Held: None. Qualifications: Mr. Richey has served in several business and legal management roles and directorship positions throughout his career. Mr. Richey most recently held the positions of Senior Vice Chancellor and Chief Legal Officer, University of Pittsburgh. Mr. Richey previously served as Chairman of the Board, Epilepsy Foundation of Western Pennsylvania and Chairman of the Board, World Affairs Council of Pittsburgh. Mr. Richey previously served as Chief Legal Officer and Executive Vice President, CNX Resources Corporation (formerly known as CONSOL Energy Inc.); and Board Member, Ethics Counsel and Shareholder, Buchanan Ingersoll & Rooney PC (a law firm). |
| John S. Walsh Birth Date: November 28, 1957 Trustee Indefinite Term Began serving: June 2006 | Principal Occupations: Director or Trustee, and Chair of the Board of Directors or Trustees, of the Federated Fund Family; President and Director, Heat Wagon, Inc. (manufacturer of construction temporary heaters); President and Director, Manufacturers Products, Inc. (distributor of portable construction heaters); President, Portable Heater Parts, a division of Manufacturers Products, Inc. Other Directorships Held: None. Qualifications: Mr. Walsh has served in several business management roles and directorship positions throughout his career. Mr. Walsh previously served as Vice President, Walsh & Kelly, Inc. (paving contractors). |
| Name Birth Date Address Positions Held with Trust Date Service Began | Principal Occupation(s) for Past Five Years and Previous Position(s) |
| Lori A. Hensler Birth Date: January 6, 1967 TREASURER Officer since: April 2013 | Principal Occupations: Principal Financial Officer and Treasurer of the Federated Fund Family; Senior Vice President, Federated Administrative Services; Financial and Operations Principal for Federated Securities Corp. and Edgewood Services, Inc.; and Assistant Treasurer, Federated Investors Trust Company. Ms. Hensler has received the Certified Public Accountant designation. Previous Positions: Controller of Federated Investors, Inc.; Senior Vice President and Assistant Treasurer, Federated Investors Management Company; Treasurer, Federated Investors Trust Company; Assistant Treasurer, Federated Administrative Services, Federated Administrative Services, Inc., Federated Securities Corp., Edgewood Services, Inc., Federated Advisory Services Company, Federated Equity Management Company of Pennsylvania, Federated Global Investment Management Corp., Federated Investment Counseling, Federated Investment Management Company, Passport Research, Ltd., and Federated MDTA, LLC; Financial and Operations Principal for Federated Securities Corp., Edgewood Services, Inc. and Southpointe Distribution Services, Inc. |
| Peter J. Germain Birth Date: September 3, 1959 CHIEF LEGAL OFFICER, SECRETARY and EXECUTIVE VICE PRESIDENT Officer since: June 2006 | Principal Occupations: Mr. Germain is Chief Legal Officer, Secretary and Executive Vice President of the Federated Fund Family. He is General Counsel, Chief Legal Officer, Secretary and Executive Vice President, Federated Investors, Inc.; Trustee and Senior Vice President, Federated Investors Management Company; Trustee and President, Federated Administrative Services; Director and President, Federated Administrative Services, Inc.; Director and Vice President, Federated Securities Corp.; Director and Secretary, Federated Private Asset Management, Inc.; Secretary, Federated Shareholder Services Company; and Secretary, Retirement Plan Service Company of America. Mr. Germain joined Federated in 1984 and is a member of the Pennsylvania Bar Association. Previous Positions: Deputy General Counsel, Special Counsel, Managing Director of Mutual Fund Services, Federated Investors, Inc.; Senior Vice President, Federated Services Company; and Senior Corporate Counsel, Federated Investors, Inc. |
| Stephen Van Meter Birth Date: June 5, 1975 CHIEF COMPLIANCE OFFICER AND SENIOR VICE PRESIDENT Officer since: July 2015 | Principal Occupations: Senior Vice President and Chief Compliance Officer of the Federated Fund Family; Vice President and Chief Compliance Officer of Federated Investors, Inc. and Chief Compliance Officer of certain of its subsidiaries. Mr. Van Meter joined Federated in October 2011. He holds FINRA licenses under Series 3, 7, 24 and 66. Previous Positions: Mr. Van Meter previously held the position of Compliance Operating Officer, Federated Investors, Inc. Prior to joining Federated, Mr. Van Meter served at the United States Securities and Exchange Commission in the positions of Senior Counsel, Office of Chief Counsel, Division of Investment Management and Senior Counsel, Division of Enforcement. |
| Name Birth Date Address Positions Held with Trust Date Service Began | Principal Occupation(s) for Past Five Years and Previous Position(s) |
| Stephen F. Auth Birth Date: September 13, 1956 101 Park Avenue 41st Floor New York, NY 10178 CHIEF INVESTMENT OFFICER Officer since: June 2012 | Principal Occupations: Stephen F. Auth is Chief Investment Officer of various Funds in the Federated Fund Family; Executive Vice President, Federated Investment Counseling, Federated Global Investment Management Corp. and Federated Equity Management Company of Pennsylvania. Previous Positions: Executive Vice President, Federated Investment Management Company and Passport Research, Ltd. (investment advisory subsidiary of Federated); Senior Vice President, Global Portfolio Management Services Division; Senior Vice President, Federated Investment Management Company and Passport Research, Ltd.; Senior Managing Director and Portfolio Manager, Prudential Investments. |
4000 Ericsson Drive
Warrendale, PA 15086-7561
or call 1-800-341-7400.
CUSIP 31421R791
CUSIP 31421R783
CUSIP 31421R627
2018 ©Federated Investors, Inc.
| Share Class | Ticker | A | QASGX | C | QCSGX | |
| Institutional | QISGX | R6 | QLSGX |
| 1 | Please see the footnotes to the line graphs below for definitions of, and further information about, the R2000G. |
| 2 | Please see the footnotes to the line graphs below for definitions of, and further information about, the MSGFA. |
| 3 | The Russell 3000® Index measures the performance of the largest 3,000 U.S. companies representing approximately 98% of the investable U.S. equity market. The Russell 3000® Index is constructed to provide a comprehensive, unbiased, and stable barometer of the broad market and is completely reconstituted annually to ensure new and growing equities are reflected.* |
| 4 | Small-cap stocks may be less liquid and subject to greater price volatility than large-cap stocks. |
| 5 | The Russell Microcap® Index measures the performance of the microcap segment of the U.S. equity market. Microcap stocks make up less than 3% of the U.S. equity market (by market cap) and consist of the smallest 1,000 securities in the small-cap Russell 2000® Index, plus the next 1,000 smallest eligible securities by market cap. The Russell Microcap® Index is constructed to provide a comprehensive and unbiased barometer for the microcap segment trading on national exchanges and is completely reconstituted annually to ensure new and growing equities are reflected and companies continue to reflect appropriate capitalization and value characteristics.* |
| 6 | The Russell 2000® Index measures the performance of the small-cap segment of the U.S. equity universe. The Russell 2000® Index is a subset of the Russell 3000® Index representing approximately 10% of the total market capitalization of that index. It includes approximately 2000 of the smallest securities based on a combination of their market cap and current index membership. The Russell 2000® Index is constructed to provide a comprehensive and unbiased small-cap barometer and is completely reconstituted annually to ensure larger stocks do not distort the performance and characteristics of the true small-cap opportunity set.* |
| 7 | The Russell Top 200® Index measures the performance of the largest cap segment of the U.S. equity universe. The Russell Top 200® Index is a subset of the Russell 3000® Index. It includes approximately 200 of the largest securities based on a combination of their market cap and current index membership and represents approximately 68% of the U.S. market. The Russell Top 200® Index is constructed to provide a comprehensive and unbiased barometer for this very large cap segment and is completely reconstituted annually to ensure new and growing equities are reflected.* |
| 8 | The Russell Midcap® Index measures the performance of the mid-cap segment of the U.S. equity universe. The Russell Midcap® Index is a subset of the Russell 1000® Index. It includes approximately 800 of the smallest securities based on a combination of their market cap and current index membership. The Russell Midcap® Index represents approximately 31% of the total market capitalization of the Russell 1000® companies. The Russell Midcap® Index is constructed to provide a comprehensive and unbiased barometer for the mid-cap segment. The Russell Midcap Index is completely reconstituted annually to ensure larger stocks do not distort the performance and characteristics of the true mid-cap opportunity set.* |
| 9 | The Russell 3000® Growth Index measures the performance of the broad growth segment of the U.S. equity universe. It includes those Russell 3000® Index companies with higher price-to-book ratios and higher forecasted growth values. The Russell 3000® Growth Index is constructed to provide a comprehensive, unbiased and stable barometer of the broad growth market. The Russell 3000 Growth Index is completely reconstituted annually to ensure new and growing equities are included and that the represented companies continue to reflect growth characteristics.* |
| 10 | The Russell 3000® Value Index measures the performance of the broad value segment of U.S. equity value universe. It includes those Russell 3000® Index companies with lower price-to-book ratios and lower forecasted growth values. The Russell 3000® Value Index is constructed to provide a comprehensive, unbiased and stable barometer of the broad value market. The Russell 3000 Value Index is completely reconstituted annually to ensure new and growing equities are included and that the represented companies continue to reflect value characteristics.* |
| * | The index is unmanaged, and it is not possible to invest directly in an index. |
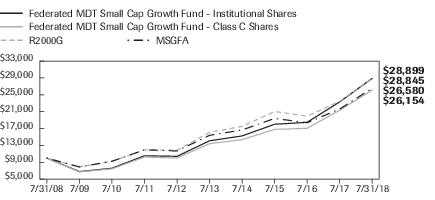
| Federated MDT Small Cap Growth Fund - | Institutional Shares | Class C Shares | NA | R2000G | MSGFA |
| F | F | NA | I | I | |
| 7/31/2008 | 10,000 | 10,000 | 10,000 | 10,000 | |
| 7/31/2009 | 6,801 | 6,731 | 7,914 | 7,889 | |
| 7/31/2010 | 7,590 | 7,447 | 9,237 | 9,242 | |
| 7/31/2011 | 10,557 | 10,247 | 11,945 | 11,962 | |
| 7/31/2012 | 10,412 | 10,009 | 11,884 | 11,693 | |
| 7/31/2013 | 14,099 | 13,419 | 16,090 | 15,398 | |
| 7/31/2014 | 15,257 | 14,373 | 17,527 | 16,664 | |
| 7/31/2015 | 18,019 | 16,811 | 21,045 | 19,406 | |
| 7/31/2016 | 18,480 | 17,064 | 19,929 | 18,386 | |
| 7/31/2017 | 23,334 | 21,343 | 23,468 | 21,633 | |
| 7/31/2018 | 28,899 | 26,154 | 28,845 | 26,580 |
| ■ | Total returns shown for Class C Shares include the maximum contingent deferred sales charge of 1.00% as applicable. |
| 1 Year | 5 Years | 10 Years | |
| Class A Shares | 16.73% | 13.84% | 10.30% |
| Class C Shares | 21.54% | 14.28% | 10.09% |
| Institutional Shares | 23.85% | 15.43% | 11.20% |
| Class R6 Shares4 | 23.81% | 15.35% | 10.94% |
| R2000G | 22.91% | 12.38% | 11.17% |
| MSGFA | 22.76% | 11.55% | 10.96% |
| 1 | Represents a hypothetical investment of $10,000 in the Fund after deducting applicable sales charges: for Class A Shares, the maximum sales charge of 5.50% ($10,000 investment minus $550 sales charges = $9,450); for Class C Shares, a 1.00% contingent deferred sales charge would be applied to any redemption less than one year from the purchase date. The Fund's performance assumes the reinvestment of all dividends and distributions. The R2000G and MSGFA have been adjusted to reflect reinvestment of dividends on securities. |
| 2 | The R2000G measures the performance of the small-cap growth segment of the U.S. equity universe. It includes those Russell 2000® Index companies with higher price-to-value ratios and higher forecasted growth values. The R2000G is constructed to provide a comprehensive and unbiased barometer for the small-cap growth segment. The R2000G is completely reconstituted annually to ensure larger stocks do not distort the performance and characteristics of the true small-cap opportunity set and that the represented companies continue to reflect growth characteristics. The R2000G is unmanaged and, unlike the Fund, is not affected by cash flows. It is not possible to invest directly in an index. The R2000G is not adjusted to reflect sales charges, expenses or other fees that the Securities and Exchange Commission requires to be reflected in the Fund's performance. |
| 3 | Morningstar figures represent the average of the total returns reported by all the funds designated by Morningstar as falling into the respective category indicated. They do not reflect sales charges. The Morningstar figures in the Growth of $10,000 line graph are based on historical return information published by Morningstar and reflect the return of the funds comprising the category in the year of publication. Because the funds designated by Morningstar as falling into the category can change over time, the Morningstar figures in the line graph may not match the Morningstar figures in the Average Annual Total Returns table, which reflect the return of the funds that currently comprise the category. |
| 4 | The Fund's Class R6 Shares commenced operations on June 29, 2016. It is anticipated that this class will have the lowest net expenses of all outstanding share classes. For the period prior to the commencement of operations of Class R6 Shares, the performance information shown is for the Fund's Institutional Shares adjusted to reflect expenses of the Class R6 Shares for each year for which the gross expenses of Class R6 Shares would have exceeded the actual expenses paid by Institutional Shares. |
| Sector Composition | Percentage of Total Net Assets |
| Health Care | 25.9% |
| Information Technology | 19.4% |
| Industrials | 19.3% |
| Consumer Discretionary | 15.9% |
| Financials | 7.3% |
| Materials | 4.3% |
| Consumer Staples | 3.2% |
| Energy | 1.2% |
| Telecommunication Services | 1.2% |
| Securities Lending Collateral2 | 2.9% |
| Cash Equivalents3 | 3.0% |
| Other Assets and Liabilities—Net4 | (3.6)% |
| TOTAL | 100.0% |
| 1 | Except for Cash Equivalents and Other Assets and Liabilities, sector classifications are based upon, and individual portfolio securities are assigned to, the classifications of the Global Industry Classification Standard (GICS) except that the Adviser assigns a classification to securities not classified by the GICS and to securities for which the Adviser does not have access to the classification made by the GICS. |
| 2 | Represents cash collateral received for portfolio securities on loan that may be invested in affiliated money market funds, other money market instruments and/or repurchase agreements. |
| 3 | Cash Equivalents include any investments in money market mutual funds and/or overnight repurchase agreements other than those representing cash collateral for securities lending. |
| 4 | Assets, other than investments in securities, less liabilities. See Statement of Assets and Liabilities. |
| Shares | Value | ||
| COMMON STOCKS—97.7% | |||
| Consumer Discretionary—15.9% | |||
| 81,166 | American Eagle Outfitters, Inc. | $2,043,760 | |
| 63,651 | 1 | At Home Group, Inc. | 2,308,622 |
| 95,306 | BJ's Restaurants, Inc. | 6,028,104 | |
| 42,884 | Big Lots, Inc. | 1,862,452 | |
| 13,764 | 1 | Cavco Industries, Inc. | 2,924,162 |
| 262,979 | Chicos Fas, Inc. | 2,287,917 | |
| 9,247 | Churchill Downs, Inc. | 2,644,180 | |
| 7,051 | 1 | Cooper-Standard Holding, Inc. | 950,475 |
| 180,294 | 1 | CROCs, Inc. | 3,265,124 |
| 8,880 | 1 | Deckers Outdoor Corp. | 1,001,930 |
| 55,137 | 2 | Dine Brands Global, Inc. | 3,916,381 |
| 29,537 | 1 | Five Below, Inc. | 2,869,815 |
| 33,934 | 1,2 | iRobot Corp. | 2,689,269 |
| 55,581 | La-Z-Boy, Inc. | 1,695,221 | |
| 69,754 | 1 | Lumber Liquidators, Inc. | 1,349,042 |
| 152,067 | M.D.C. Holdings, Inc. | 4,416,026 | |
| 16,106 | Marriott Vacations Worldwide Corp. | 1,918,386 | |
| 62,304 | Nexstar Media Group, Inc., Class A | 4,638,533 | |
| 87,965 | Nutri/System, Inc. | 3,518,600 | |
| 48,557 | 1 | Penn National Gaming, Inc. | 1,556,252 |
| 42,808 | 1 | Planet Fitness, Inc. | 2,034,236 |
| 18,244 | 1 | RH | 2,478,630 |
| 29,270 | 1 | Scientific Games Corp. | 1,406,424 |
| 153,925 | 1 | SeaWorld Entertainment, Inc. | 3,278,602 |
| 77,805 | 1 | Shutterfly, Inc. | 6,400,239 |
| 34,698 | 1 | Sothebys Holdings, Inc., Class A | 1,842,811 |
| 120,964 | Tailored Brands, Inc. | 2,438,634 | |
| 122,257 | 1 | Taylor Morrison Home Corp., Class A | 2,387,679 |
| 51,319 | 1 | TopBuild Corp. | 3,811,975 |
| 34,373 | 1 | Weight Watchers International, Inc. | 3,077,415 |
| 61,715 | World Wrestling Entertainment, Inc. | 4,882,274 | |
| TOTAL | 87,923,170 | ||
| Consumer Staples—3.2% | |||
| 57,640 | 1 | Chefs Warehouse, Inc. | 1,553,398 |
| 25,868 | Medifast, Inc. | 4,441,018 |
| Shares | Value | ||
| COMMON STOCKS—continued | |||
| Consumer Staples—continued | |||
| 22,194 | 1 | The Boston Beer Co., Inc., Class A | $6,102,241 |
| 38,896 | 1 | USANA Health Sciences, Inc. | 5,143,996 |
| 3,247 | WD 40 Co. | 520,007 | |
| TOTAL | 17,760,660 | ||
| Energy—1.2% | |||
| 45,493 | 2 | CVR Energy, Inc. | 1,787,420 |
| 48,516 | 1 | Carrizo Oil & Gas, Inc. | 1,367,181 |
| 426,237 | 1 | Denbury Resources, Inc. | 1,922,329 |
| 86,464 | 1 | Par Petroleum Corp. | 1,513,984 |
| TOTAL | 6,590,914 | ||
| Financials—7.3% | |||
| 49,687 | 1 | Allegiance Bancshares, Inc. | 2,233,431 |
| 148,959 | Blue Hills Bancorp, Inc. | 3,262,202 | |
| 47,972 | 1 | Eagle Bancorp, Inc. | 2,592,887 |
| 92,663 | 1 | Enova International, Inc. | 2,872,553 |
| 23,892 | Evercore, Inc., Class A | 2,699,796 | |
| 24,870 | First Cash, Inc. | 2,019,444 | |
| 36,015 | 1 | Green Dot Corp. | 2,856,710 |
| 44,292 | Guaranty Bancshares, Inc. | 1,388,997 | |
| 4,050 | Hingham Institution for Savings | 895,333 | |
| 44,947 | 1 | NMI Holdings, Inc. | 939,392 |
| 102,498 | National Bank Holdings Corp. | 4,056,871 | |
| 65,437 | 1 | National Commerce Corp. | 2,853,053 |
| 53,123 | 1 | Texas Capital Bancshares, Inc. | 4,823,568 |
| 70,164 | The Bank of NT Butterfield & Son Ltd. | 3,470,311 | |
| 78,879 | Universal Insurance Holdings, Inc. | 3,502,228 | |
| TOTAL | 40,466,776 | ||
| Health Care—25.9% | |||
| 51,904 | 1,3 | Adeptus Health, Inc. | 0 |
| 12,569 | 1 | Aerie Pharmaceuticals, Inc. | 849,036 |
| 36,534 | 1 | Amedisys, Inc. | 3,420,678 |
| 81,786 | 1 | American Renal Associates Holdings, Inc. | 1,315,937 |
| 108,498 | 1 | Amicus Therapeutics, Inc. | 1,578,646 |
| 83,501 | 1,2 | Arrowhead Pharmaceuticals, Inc. | 1,216,610 |
| 58,846 | 1 | Audentes Therapeutics, Inc. | 2,215,552 |
| 8,884 | 1 | BioTelemetry, Inc. | 466,410 |
| 9,119 | Chemed Corp. | 2,881,878 | |
| 65,761 | 1 | ChemoCentryx, Inc. | 760,197 |
| Shares | Value | ||
| COMMON STOCKS—continued | |||
| Health Care—continued | |||
| 129,983 | 1 | Coherus Biosciences, Inc. | $2,476,176 |
| 32,651 | 1 | Concert Pharmaceuticals, Inc. | 522,089 |
| 170,895 | 1 | DepoMed, Inc. | 1,514,130 |
| 38,388 | 1 | Editas Medicine, Inc. | 1,141,659 |
| 32,944 | 1 | Enanta Pharmaceuticals, Inc. | 3,212,699 |
| 41,775 | 1 | Epizyme, Inc. | 538,898 |
| 24,457 | 1 | FibroGen, Inc. | 1,543,237 |
| 69,270 | 1,2 | G1 Therapeutics, Inc. | 3,557,014 |
| 75,169 | 1 | Genomic Health, Inc. | 4,035,072 |
| 97,154 | 1 | Globus Medical, Inc. | 5,001,488 |
| 55,934 | 1 | Haemonetics Corp. | 5,461,396 |
| 77,350 | 1 | Halozyme Therapeutics, Inc. | 1,400,035 |
| 75,425 | 1 | HealthEquity, Inc. | 5,694,587 |
| 99,212 | 1 | Heron Therapeutics, Inc. | 3,715,489 |
| 171,951 | 1 | Horizon Pharma PLC | 3,031,496 |
| 24,350 | 1 | ICU Medical, Inc. | 6,983,580 |
| 85,578 | 1,2 | Immunomedics, Inc. | 2,047,882 |
| 130,595 | 1 | Innoviva, Inc. | 1,847,919 |
| 31,683 | 1 | Inogen, Inc. | 6,312,838 |
| 34,899 | 1 | Ligand Pharmaceuticals, Inc., Class B | 7,619,499 |
| 29,717 | 1 | Loxo Oncology, Inc. | 4,980,272 |
| 170,141 | Luminex Corp. | 5,760,974 | |
| 4,082 | 1 | Madrigal Pharmaceuticals, Inc. | 1,049,196 |
| 55,947 | 1 | Merit Medical Systems, Inc. | 3,037,922 |
| 18,838 | 1 | Mirati Therapeutics, Inc. | 1,156,653 |
| 15,171 | 1 | Molina Healthcare, Inc. | 1,579,149 |
| 64,507 | 1 | Myriad Genetics, Inc. | 2,822,181 |
| 134,457 | 1 | NeoGenomics, Inc. | 1,882,398 |
| 82,753 | 1 | Novocure Ltd. | 2,813,602 |
| 50,253 | 1 | NuVasive, Inc. | 2,917,187 |
| 50,473 | 1 | Orthofix International NV | 3,053,112 |
| 11,980 | 1 | Penumbra, Inc. | 1,704,155 |
| 43,541 | 1 | Prestige Brands Holdings, Inc. | 1,555,720 |
| 48,529 | 1 | Quidel Corp. | 3,293,178 |
| 27,200 | 1 | REGENXBIO, Inc. | 1,912,160 |
| 60,485 | 1 | Staar Surgical Co. | 1,865,962 |
| 69,496 | 1 | Supernus Pharmaceuticals, Inc. | 3,679,813 |
| 71,057 | 1 | SurModics, Inc. | 4,178,152 |
| Shares | Value | ||
| COMMON STOCKS—continued | |||
| Health Care—continued | |||
| 96,619 | 1 | Ultragenyx Pharmaceutical, Inc. | $7,643,529 |
| 78,610 | 1 | Xencor, Inc. | 2,925,864 |
| 25,201 | 1 | Zogenix, Inc. | 1,430,157 |
| TOTAL | 143,603,463 | ||
| Industrials—19.3% | |||
| 65,214 | 1 | ASGN, Inc. | 5,888,824 |
| 118,379 | Advanced Drainage System, Inc. | 3,308,693 | |
| 60,704 | Astec Industries, Inc. | 2,982,387 | |
| 50,034 | 1 | Avis Budget Group, Inc. | 1,743,685 |
| 25,992 | Brady (W.H.) Co. | 994,194 | |
| 47,264 | 1,2 | Caesarstone Ltd. | 744,408 |
| 55,104 | 1 | Chart Industries, Inc. | 4,303,071 |
| 34,970 | 1,2 | Cimpress NV | 5,108,068 |
| 37,605 | Comfort Systems USA, Inc. | 2,088,958 | |
| 83,146 | 1 | Commercial Vehicle Group, Inc. | 582,853 |
| 37,693 | 1 | DXP Enterprises, Inc. | 1,558,229 |
| 54,624 | Deluxe Corp. | 3,218,992 | |
| 27,502 | 1 | Echo Global Logistics, Inc. | 947,444 |
| 26,918 | 1 | Generac Holdings, Inc. | 1,446,842 |
| 55,785 | Granite Construction, Inc. | 3,009,601 | |
| 159,142 | 1 | Harsco Corp. | 4,034,250 |
| 36,709 | 1 | Herc Holdings, Inc. | 2,085,805 |
| 44,428 | Insperity, Inc. | 4,225,103 | |
| 187,018 | Interface, Inc. | 4,189,203 | |
| 69,653 | 1 | JELD-WEN Holding, Inc. | 1,911,278 |
| 23,906 | KForce Com, Inc. | 903,647 | |
| 27,545 | Kaman Corp., Class A | 1,824,030 | |
| 187,186 | Kennametal, Inc. | 7,292,767 | |
| 44,569 | Knoll, Inc. | 1,005,031 | |
| 51,638 | Korn/Ferry International | 3,407,075 | |
| 46,106 | MSA Safety, Inc. | 4,651,173 | |
| 59,714 | 1 | Mastec, Inc. | 2,779,687 |
| 134,157 | Miller Herman, Inc. | 5,077,842 | |
| 164,005 | 1 | NCI Building System, Inc. | 2,615,880 |
| 14,538 | 1 | PGT, Inc. | 348,912 |
| 32,834 | 1 | Proto Labs, Inc. | 4,092,758 |
| 37,196 | Quad Graphics, Inc. | 764,750 | |
| 79,047 | Rush Enterprises, Inc. | 3,564,229 |
| Shares | Value | ||
| COMMON STOCKS—continued | |||
| Industrials—continued | |||
| 22,900 | 1 | Saia, Inc. | $1,725,515 |
| 33,911 | Schneider National, Inc. | 886,434 | |
| 66,302 | 1 | Taser International, Inc. | 4,503,895 |
| 19,770 | 1 | Trex Co., Inc. | 1,536,920 |
| 26,449 | 1 | TriNet Group, Inc. | 1,424,279 |
| 33,080 | 1 | Univar, Inc. | 909,369 |
| 55,670 | Universal Forest Products, Inc. | 2,050,883 | |
| 39,656 | Werner Enterprises, Inc. | 1,477,186 | |
| TOTAL | 107,214,150 | ||
| Information Technology—19.4% | |||
| 48,958 | 1 | Advanced Energy Industries, Inc. | 2,998,188 |
| 44,985 | 1,2 | Alteryx, Inc. | 1,753,965 |
| 57,947 | 1 | Apptio, Inc. | 1,945,281 |
| 24,080 | 1 | Aspen Technology, Inc. | 2,306,623 |
| 21,431 | Blackbaud, Inc. | 2,139,028 | |
| 66,284 | 1 | Ciena Corp. | 1,683,614 |
| 66,440 | CSG Systems International, Inc. | 2,702,115 | |
| 20,558 | Cabot Microelectronics Corp. | 2,476,211 | |
| 94,579 | 1 | Care.com, Inc. | 1,704,314 |
| 90,981 | 1 | Cornerstone OnDemand, Inc. | 4,494,461 |
| 76,477 | 1 | Coupa Software, Inc. | 4,688,805 |
| 91,243 | Entegris, Inc. | 3,207,191 | |
| 151,090 | 1 | Etsy, Inc. | 6,173,537 |
| 10,815 | 1 | Everbridge, Inc. | 486,459 |
| 75,994 | 1 | Everi Holdings, Inc. | 558,556 |
| 6,741 | 1 | Fair Isaac & Co., Inc. | 1,358,042 |
| 104,453 | 1 | Five9, Inc. | 3,332,051 |
| 30,603 | 1 | GrubHub, Inc. | 3,730,200 |
| 13,663 | 1 | HubSpot, Inc. | 1,695,578 |
| 3,577 | 1 | Imperva, Inc. | 165,436 |
| 10,787 | Littelfuse, Inc. | 2,338,837 | |
| 11,271 | MKS Instruments, Inc. | 1,062,855 | |
| 9,625 | Monolithic Power Systems | 1,277,045 | |
| 56,152 | 1 | Nanometrics, Inc. | 2,114,684 |
| 44,640 | 1 | New Relic, Inc. | 4,361,328 |
| 63,764 | 1 | Paylocity Corp. | 3,698,312 |
| 15,687 | Plantronics, Inc. | 1,077,069 | |
| 91,835 | Progress Software Corp. | 3,378,610 |
| Shares | Value | ||
| COMMON STOCKS—continued | |||
| Information Technology—continued | |||
| 35,055 | 1 | Qualys, Inc. | $3,053,290 |
| 10,130 | 1 | RealPage, Inc. | 558,163 |
| 33,174 | 1 | RingCentral, Inc. | 2,446,583 |
| 29,270 | 1,2 | SMART Global Holdings, Inc. | 893,613 |
| 67,682 | 1 | SPS Commerce, Inc. | 5,806,439 |
| 127,095 | 1 | SailPoint Technologies Holding | 3,061,719 |
| 12,801 | Science Applications International Corp. | 1,080,020 | |
| 17,412 | 1 | Shutterstock, Inc. | 802,171 |
| 45,982 | 1 | Silicon Laboratories, Inc. | 4,379,785 |
| 7,561 | 1 | Stamps.com, Inc. | 1,973,421 |
| 68,878 | 1,2 | Stratasys, Inc. | 1,337,611 |
| 43,003 | 1 | Trade Desk, Inc./The | 3,626,013 |
| 62,112 | Travelport Worldwide Ltd. | 1,173,917 | |
| 17,904 | 1 | Twilio, Inc., Class A | 1,036,463 |
| 42,120 | 1 | Varonis Systems, Inc. | 2,517,723 |
| 49,167 | 1 | Yelp, Inc. | 1,813,279 |
| 52,589 | 1 | Zendesk, Inc. | 2,864,523 |
| TOTAL | 107,333,128 | ||
| Materials—4.3% | |||
| 67,413 | Boise Cascade Co. | 2,915,612 | |
| 28,291 | 1 | Ingevity Corp. | 2,819,764 |
| 62,865 | 1 | Kraton Corp. | 3,023,178 |
| 195,691 | Louisiana-Pacific Corp. | 5,268,002 | |
| 180,594 | Myers Industries, Inc. | 3,891,801 | |
| 86,100 | 1,3 | Rentech, Inc. | 0 |
| 6,345 | Stepan Co. | 555,695 | |
| 46,226 | Trinseo SA | 3,453,082 | |
| 44,643 | Worthington Industries, Inc. | 2,090,185 | |
| TOTAL | 24,017,319 | ||
| Telecommunication Services—1.2% | |||
| 50,472 | Shenandoah Telecommunications Co. | 1,665,576 | |
| 400,376 | 1 | Vonage Holdings Corp. | 5,128,817 |
| TOTAL | 6,794,393 | ||
| TOTAL COMMON STOCKS (IDENTIFIED COST $480,615,621) | 541,703,973 |
| Shares | Value | ||
| INVESTMENT COMPANIES—5.9% | |||
| 11,851,038 | Federated Government Obligations Fund, Premier Shares, 1.80%4 | $11,851,038 | |
| 20,756,726 | Federated Institutional Prime Value Obligations Fund, Institutional Shares, 2.08%4 | 20,760,878 | |
| TOTAL INVESTMENT COMPANIES (IDENTIFIED COST $32,608,314) | 32,611,916 | ||
| TOTAL INVESTMENT IN SECURITIES—103.6% (IDENTIFIED COST $513,223,935)5 | 574,315,889 | ||
| OTHER ASSETS AND LIABILITIES - NET—(3.6)%6 | (19,799,841) | ||
| TOTAL NET ASSETS—100% | $554,516,048 |
| Federated Government Obligations Fund, Premier Shares* | Federated Institutional Prime Value Obligations Fund, Institutional Shares* | Total of Affiliated Transactions | |
| Balance of Shares Held 7/31/2017 | — | 5,448,430 | 5,448,430 |
| Purchases/Additions | 54,481,050 | 209,292,259 | 263,773,309 |
| Sales/Reductions | (42,630,012) | (193,983,963) | (236,613,975) |
| Balance of Shares Held 7/31/2018 | 11,851,038 | 20,756,726 | 32,607,764 |
| Value | $11,851,038 | $20,760,878 | $32,611,916 |
| Change in Unrealized Appreciation/Depreciation | N/A | $3,560 | $3,560 |
| Net Realized Gain/(Loss) | N/A | $(3,551) | $(3,551) |
| Dividend Income | $40,520 | $177,997 | $218,517 |
| * | All or a portion of the balance/activity for the fund relates to cash collateral received on securities lending transactions. |
| 1 | Non-income-producing security. |
| 2 | All or a portion of these securities are temporarily on loan to unaffiliated broker/dealers. |
| 3 | Market quotations and price evaluations are not available. Fair value determined using significant unobservable inputs in accordance with procedures established by and under the general supervision of the Fund's Board of Trustees (the “Trustees”). |
| 4 | 7-day net yield. |
| 5 | The cost of investments for federal tax purposes amounts to $514,194,703. |
| 6 | Assets, other than investments in securities, less liabilities. See Statement of Assets and Liabilities. |
| Valuation Inputs | ||||
| Level 1— Quoted Prices | Level 2— Other Significant Observable Inputs | Level 3— Significant Unobservable Inputs | Total | |
| Equity Securities: | ||||
| Common Stocks | ||||
| Domestic | $530,553,551 | $— | $0 | $530,553,551 |
| International | 11,150,422 | — | — | 11,150,422 |
| Investment Companies | 32,611,916 | — | — | 32,611,916 |
| TOTAL SECURITIES | $574,315,889 | $— | $0 | $574,315,889 |
| Year Ended July 31 | 2018 | 2017 | 2016 | 2015 | 2014 |
| Net Asset Value, Beginning of Period | $21.89 | $17.66 | $20.49 | $17.39 | $16.12 |
| Income From Investment Operations: | |||||
| Net investment income (loss) | (0.11)1 | (0.08)1 | (0.06)1 | (0.12)1 | (0.18)1 |
| Net realized and unrealized gain (loss) | 5.09 | 4.63 | 0.32 | 3.22 | 1.45 |
| TOTAL FROM INVESTMENT OPERATIONS | 4.98 | 4.55 | 0.26 | 3.10 | 1.27 |
| Less Distributions: | |||||
| Distributions from net realized gain | (1.20) | (0.32) | (3.09) | — | — |
| Net Asset Value, End of Period | $25.67 | $21.89 | $17.66 | $20.49 | $17.39 |
| Total Return2 | 23.50% | 26.00% | 2.30% | 17.83% | 7.88% |
| Ratios to Average Net Assets: | |||||
| Net expenses | 1.14% | 1.15% | 1.13% | 1.54% | 1.75% |
| Net investment income (loss) | (0.48)% | (0.39)% | (0.34)% | (0.66)% | (1.05)% |
| Expense waiver/reimbursement3 | 0.44% | 0.70% | 1.00% | 0.61% | 0.43% |
| Supplemental Data: | |||||
| Net assets, end of period (000 omitted) | $82,953 | $47,681 | $29,707 | $32,136 | $29,690 |
| Portfolio turnover | 129% | 118% | 198% | 121% | 61% |
| 1 | Per share numbers have been calculated using the average shares method. |
| 2 | Based on net asset value, which does not reflect the sales charge, redemption fee or contingent deferred sales charge, if applicable. |
| 3 | This expense decrease is reflected in both the net expense and the net investment income (loss) ratios shown above. |
| Year Ended July 31 | 2018 | 2017 | 2016 | 2015 | 2014 |
| Net Asset Value, Beginning of Period | $19.69 | $16.03 | $19.03 | $16.27 | $15.19 |
| Income From Investment Operations: | |||||
| Net investment income (loss) | (0.26)1 | (0.21)1 | (0.17)1 | (0.25)1 | (0.30)1 |
| Net realized and unrealized gain (loss) | 4.54 | 4.19 | 0.26 | 3.01 | 1.38 |
| TOTAL FROM INVESTMENT OPERATIONS | 4.28 | 3.98 | 0.09 | 2.76 | 1.08 |
| Less Distributions: | |||||
| Distributions from net realized gain | (1.20) | (0.32) | (3.09) | — | — |
| Net Asset Value, End of Period | $22.77 | $19.69 | $16.03 | $19.03 | $16.27 |
| Total Return2 | 22.54% | 25.08% | 1.51% | 16.96% | 7.11% |
| Ratios to Average Net Assets: | |||||
| Net expenses | 1.89% | 1.90% | 1.88% | 2.31% | 2.50% |
| Net investment income (loss) | (1.23)% | (1.15)% | (1.09)% | (1.44)% | (1.79)% |
| Expense waiver/reimbursement3 | 0.41% | 0.66% | 1.00% | 0.59% | 0.43% |
| Supplemental Data: | |||||
| Net assets, end of period (000 omitted) | $18,008 | $10,007 | $3,941 | $3,571 | $4,608 |
| Portfolio turnover | 129% | 118% | 198% | 121% | 61% |
| 1 | Per share numbers have been calculated using the average shares method. |
| 2 | Based on net asset value, which does not reflect the sales charge, redemption fee or contingent deferred sales charge, if applicable. |
| 3 | This expense decrease is reflected in both the net expense and the net investment income (loss) ratios shown above. |
| Year Ended July 31 | 2018 | 2017 | 2016 | 2015 | 2014 |
| Net Asset Value, Beginning of Period | $22.67 | $18.24 | $21.01 | $17.79 | $16.44 |
| Income From Investment Operations: | |||||
| Net investment income (loss) | (0.06)1 | (0.03)1 | (0.02)1 | (0.08)1 | (0.14)1 |
| Net realized and unrealized gain (loss) | 5.30 | 4.78 | 0.34 | 3.30 | 1.49 |
| TOTAL FROM INVESTMENT OPERATIONS | 5.24 | 4.75 | 0.32 | 3.22 | 1.35 |
| Less Distributions: | |||||
| Distributions from net realized gain | (1.20) | (0.32) | (3.09) | — | — |
| Net Asset Value, End of Period | $26.71 | $22.67 | $18.24 | $21.01 | $17.79 |
| Total Return2 | 23.85% | 26.27% | 2.56% | 18.10% | 8.21% |
| Ratios to Average Net Assets: | |||||
| Net expenses | 0.89% | 0.90% | 0.88% | 1.30% | 1.50% |
| Net investment income (loss) | (0.25)% | (0.15)% | (0.09)% | (0.43)% | (0.80)% |
| Expense waiver/reimbursement3 | 0.41% | 0.63% | 0.99% | 0.60% | 0.43% |
| Supplemental Data: | |||||
| Net assets, end of period (000 omitted) | $364,248 | $112,742 | $43,337 | $36,706 | $37,253 |
| Portfolio turnover | 129% | 118% | 198% | 121% | 61% |
| 1 | Per share numbers have been calculated using the average shares method. |
| 2 | Based on net asset value. |
| 3 | This expense decrease is reflected in both the net expense and the net investment income (loss) ratios shown above. |
| Year Ended July 31, | Period Ended 7/31/20161 | ||
| 2018 | 2017 | ||
| Net Asset Value, Beginning of Period | $22.67 | $18.24 | $16.25 |
| Income From Investment Operations: | |||
| Net investment income (loss) | (0.06)2 | (0.01)2 | (0.07)2 |
| Net realized and unrealized gain (loss) | 5.29 | 4.76 | 2.06 |
| TOTAL FROM INVESTMENT OPERATIONS | 5.23 | 4.75 | 1.99 |
| Less Distributions: | |||
| Distributions from net realized gain | (1.20) | (0.32) | — |
| Net Asset Value, End of Period | $26.70 | $22.67 | $18.24 |
| Total Return3 | 23.81% | 26.27% | 12.25% |
| Ratios to Average Net Assets: | |||
| Net expenses | 0.88% | 0.88% | 0.87%4 |
| Net investment income (loss) | (0.24)% | (0.04)% | (0.41)%4 |
| Expense waiver/reimbursement5 | 0.30% | 0.42% | 0.66%4 |
| Supplemental Data: | |||
| Net assets, end of period (000 omitted) | $89,307 | $24,795 | $06 |
| Portfolio turnover | 129% | 118% | 198%7 |
| 1 | Reflects operations for the period from June 29, 2016 (date of initial investment) to July 31, 2016. |
| 2 | Per share numbers have been calculated using the average shares method. |
| 3 | Based on net asset value. Total returns for periods of less than one year are not annualized. |
| 4 | Computed on an annualized basis. |
| 5 | This expense decrease is reflected in both the net expense and the net investment income (loss) ratios shown above. |
| 6 | Represents less than $1,000. |
| 7 | Portfolio turnover is calculated at the Fund level. Percentage indicated was calculated for the year ended July 31, 2016. |
| Assets: | ||
| Investment in securities, at value including $15,710,319 of securities loaned and including $32,611,916 of investment in affiliated holdings (identified cost $513,223,935) | $574,315,889 | |
| Income receivable | 17,407 | |
| Income receivable from an affiliated holding | 26,457 | |
| Receivable for investments sold | 7,285,150 | |
| Receivable for shares sold | 2,196,440 | |
| TOTAL ASSETS | 583,841,343 | |
| Liabilities: | ||
| Payable for investments purchased | $12,876,567 | |
| Payable for shares redeemed | 437,546 | |
| Payable for collateral due to broker for securities lending | 15,770,038 | |
| Payable to adviser (Note 5) | 10,586 | |
| Payable for administrative fees (Note 5) | 1,204 | |
| Payable for distribution services fee (Note 5) | 11,257 | |
| Payable for other service fees (Notes 2 and 5) | 45,847 | |
| Accrued expenses (Note 5) | 172,250 | |
| TOTAL LIABILITIES | 29,325,295 | |
| Net assets for 21,004,669 shares outstanding | $554,516,048 | |
| Net Assets Consist of: | ||
| Paid-in capital | $464,388,934 | |
| Net unrealized appreciation | 61,091,954 | |
| Accumulated net realized gain | 29,039,780 | |
| Accumulated net investment income (loss) | (4,620) | |
| TOTAL NET ASSETS | $554,516,048 |
| Net Asset Value, Offering Price and Redemption Proceeds Per Share | ||
| Class A Shares: | ||
| Net asset value per share ($82,952,963 ÷ 3,231,426 shares outstanding), no par value, unlimited shares authorized | $25.67 | |
| Offering price per share (100/94.50 of $25.67) | $27.16 | |
| Redemption proceeds per share | $25.67 | |
| Class C Shares: | ||
| Net asset value per share ($18,007,517 ÷ 790,748 shares outstanding), no par value, unlimited shares authorized | $22.77 | |
| Offering price per share | $22.77 | |
| Redemption proceeds per share (99.00/100 of $22.77) | $22.54 | |
| Institutional Shares: | ||
| Net asset value per share ($364,248,151 ÷ 13,637,699 shares outstanding), no par value, unlimited shares authorized | $26.71 | |
| Offering price per share | $26.71 | |
| Redemption proceeds per share | $26.71 | |
| Class R6 Shares: | ||
| Net asset value per share ($89,307,417 ÷ 3,344,796 shares outstanding), no par value, unlimited shares authorized | $26.70 | |
| Offering price per share | $26.70 | |
| Redemption proceeds per share | $26.70 |
| Investment Income: | |||
| Dividends (including $165,609 received from affiliated holdings* and net of foreign taxes withheld of $1,270) | $2,173,356 | ||
| Net income on securities loaned (includes $52,908 received from affiliated holdings related to cash collateral balances*) | 122,925 | ||
| TOTAL INCOME | 2,296,281 | ||
| Expenses: | |||
| Investment adviser fee (Note 5) | $3,440,052 | ||
| Administrative fee (Note 5) | 284,073 | ||
| Custodian fees | 22,674 | ||
| Transfer agent fee (Note 2) | 493,795 | ||
| Directors'/Trustees' fees (Note 5) | 3,452 | ||
| Auditing fees | 26,700 | ||
| Legal fees | 8,824 | ||
| Portfolio accounting fees | 112,625 | ||
| Distribution services fee (Note 5) | 103,220 | ||
| Other service fees (Notes 2 and 5) | 211,086 | ||
| Share registration costs | 86,715 | ||
| Printing and postage | 60,040 | ||
| Miscellaneous (Note 5) | 26,103 | ||
| TOTAL EXPENSES | 4,879,359 | ||
| Waiver and Reimbursements: | |||
| Waiver/reimbursement of investment adviser fee (Note 5) | $(1,062,208) | ||
| Reimbursement of other operating expenses (Notes 2 and 5) | (353,075) | ||
| TOTAL WAIVER AND REIMBURSEMENTS | (1,415,283) | ||
| Net expenses | 3,464,076 | ||
| Net investment income (loss) | (1,167,795) | ||
| Realized and Unrealized Gain (Loss) on Investments: | |||
| Net realized gain on investments (including net realized loss of $(3,551) on sales of investments in affiliated holdings*) | 32,205,200 | ||
| Net change in unrealized appreciation of investments (including net change in unrealized appreciation of $3,560 on investments in affiliated holdings*) | 41,745,166 | ||
| Net realized and unrealized gain on investments | 73,950,366 | ||
| Change in net assets resulting from operations | $72,782,571 |
| * | See information listed after the Fund's Portfolio of Investments. |
| Year Ended July 31 | 2018 | 2017 |
| Increase (Decrease) in Net Assets | ||
| Operations: | ||
| Net investment income (loss) | $(1,167,795) | $(337,046) |
| Net realized gain | 32,205,200 | 13,281,149 |
| Net change in unrealized appreciation/depreciation | 41,745,166 | 14,277,460 |
| CHANGE IN NET ASSETS RESULTING FROM OPERATIONS | 72,782,571 | 27,221,563 |
| Distributions to Shareholders: | ||
| Distributions from net realized gain | ||
| Class A Shares | (3,459,083) | (608,834) |
| Class B Shares | (70,571) | (28,737) |
| Class C Shares | (676,386) | (90,792) |
| Institutional Shares | (8,159,743) | (885,123) |
| Class R6 Shares | (2,195,623) | (1,745) |
| CHANGE IN NET ASSETS RESULTING FROM DISTRIBUTIONS TO SHAREHOLDERS | (14,561,406) | (1,615,231) |
| Share Transactions: | ||
| Proceeds from sale of shares | 385,727,221 | 137,690,879 |
| Net asset value of shares issued to shareholders in payment of distributions declared | 14,092,088 | 1,552,186 |
| Cost of shares redeemed | (100,121,714) | (47,136,532) |
| CHANGE IN NET ASSETS RESULTING FROM SHARE TRANSACTIONS | 299,697,595 | 92,106,533 |
| Change in net assets | 357,918,760 | 117,712,865 |
| Net Assets: | ||
| Beginning of period | 196,597,288 | 78,884,423 |
| End of period (including accumulated net investment income (loss) of $(4,620) and $0, respectively) | $554,516,048 | $196,597,288 |
| ■ | Equity securities listed on an exchange or traded through a regulated market system are valued at their last reported sale price or official closing price in their principal exchange or market. |
| ■ | Shares of other mutual funds or non-exchange-traded investment companies are valued based upon their reported NAVs. |
| ■ | Fixed-income securities are fair valued using price evaluations provided by a pricing service approved by the Trustees. |
| ■ | Derivative contracts listed on exchanges are valued at their reported settlement or closing price, except that options are valued at the mean of closing bid and asked quotations. |
| ■ | Over-the-counter (OTC) derivative contracts are fair valued using price evaluations provided by a pricing service approved by the Trustees. |
| ■ | For securities that are fair valued in accordance with procedures established by and under the general supervision of the Trustees, certain factors may be considered, such as: the last traded or purchase price of the security, information obtained by contacting the issuer or dealers, analysis of the issuer's financial statements or other available documents, fundamental analytical data, the nature and duration of restrictions on disposition, the movement of the market in which the security is normally traded, public trading in similar securities or derivative contracts of the issuer or comparable issuers, movement of a relevant index, or other factors including but not limited to industry changes and relevant government actions. |
| Transfer Agent Fees Incurred | Transfer Agent Fees Reimbursed | |
| Class A Shares | $126,074 | $(95,749) |
| Class B Shares | 918 | (608) |
| Class C Shares | 19,036 | (13,576) |
| Institutional Shares | 331,555 | (243,142) |
| Class R6 Shares | 16,212 | — |
| TOTAL | $493,795 | $(353,075) |
| Other Service Fees Incurred | |
| Class A Shares | $176,680 |
| Class B Shares | 1,652 |
| Class C Shares | 32,754 |
| TOTAL | $211,086 |
| Market Value of Securities Loaned | Market Value of Collateral |
| $15,710,319 | $15,770,038 |
| Year Ended July 31 | 2018 | 2017 | ||
| Class A Shares: | Shares | Amount | Shares | Amount |
| Shares sold | 2,037,550 | $47,226,003 | 1,398,965 | $28,165,070 |
| Shares issued to shareholders in payment of distributions declared | 141,059 | 3,180,877 | 28,970 | 558,546 |
| Shares redeemed | (1,125,462) | (26,908,372) | (931,549) | (18,494,456) |
| NET CHANGE RESULTING FROM CLASS A SHARE TRANSACTIONS | 1,053,147 | $23,498,508 | 496,386 | $10,229,160 |
| Year Ended July 31 | 2018 | 2017 | ||
| Class B Shares: | Shares | Amount | Shares | Amount |
| Shares sold | 127 | $2,647 | – | $– |
| Shares issued to shareholders in payment of distributions declared | 3,272 | 67,924 | 1,600 | 28,737 |
| Shares redeemed | (71,006) | (1,527,679) | (48,901) | (874,335) |
| NET CHANGE RESULTING FROM CLASS B SHARE TRANSACTIONS | (67,607) | $(1,457,108) | (47,301) | $(845,598) |
| Year Ended July 31 | 2018 | 2017 | ||
| Class C Shares: | Shares | Amount | Shares | Amount |
| Shares sold | 337,143 | $7,291,692 | 359,777 | $6,510,134 |
| Shares issued to shareholders in payment of distributions declared | 33,322 | 669,436 | 4,784 | 83,338 |
| Shares redeemed | (88,072) | (1,851,406) | (102,050) | (1,845,146) |
| NET CHANGE RESULTING FROM CLASS C SHARE TRANSACTIONS | 282,393 | $6,109,722 | 262,511 | $4,748,326 |
| Year Ended July 31 | 2018 | 2017 | ||
| Institutional Shares: | Shares | Amount | Shares | Amount |
| Shares sold | 10,867,286 | 270,992,063 | 3,776,089 | $78,624,940 |
| Shares issued to shareholders in payment of distributions declared | 340,659 | 7,978,235 | 44,123 | 879,822 |
| Shares redeemed | (2,542,321) | (63,240,851) | (1,223,969) | (25,449,962) |
| NET CHANGE RESULTING FROM INSTITUTIONAL SHARE TRANSACTIONS | 8,665,624 | $215,729,447 | 2,596,243 | $54,054,800 |
| Year Ended July 31 | 2018 | 2017 | ||
| Class R6 Shares: | Shares | Amount | Shares | Amount |
| Shares sold | 2,418,806 | $60,214,816 | 1,116,388 | $24,390,735 |
| Shares issued to shareholders in payment of distributions declared | 93,789 | 2,195,616 | 87 | 1,743 |
| Shares redeemed | (261,695) | (6,593,406) | (22,585) | (472,633) |
| NET CHANGE RESULTING FROM CLASS R6 SHARE TRANSACTIONS | 2,250,900 | $55,817,026 | 1,093,890 | $23,919,845 |
| NET CHANGE RESULTING FROM TOTAL FUND SHARE TRANSACTIONS | 12,184,457 | $299,697,595 | 4,401,729 | $92,106,533 |
| Increase (Decrease) | |
| Undistributed Net Investment Income (Loss) | Accumulated Net Realized Gain (Loss) |
| $1,163,175 | $(1,163,175) |
| 2018 | 2017 | |
| Ordinary income1 | $11,703,942 | $568,066 |
| Long-term capital gains | $2,857,464 | $1,047,165 |
| 1 | For tax purposes, short-term capital gain distributions are considered ordinary income distributions. |
| Undistributed ordinary income2 | $19,115,501 |
| Net unrealized appreciation | $60,121,186 |
| Undistributed long-term capital gains | $10,890,427 |
| 2 | For tax purposes, short-term capital gains are considered ordinary income in determining distributable earnings. |
| Administrative Fee | Average Daily Net Assets of the Investment Complex |
| 0.100% | on assets up to $50 billion |
| 0.075% | on assets over $50 billion |
| Administrative Fee | Average Daily Net Assets of the Investment Complex |
| 0.150% | on the first $5 billion |
| 0.125% | on the next $5 billion |
| 0.100% | on the next $10 billion |
| 0.075% | on assets in excess of $20 billion |
| Percentage of Average Daily Net Assets of Class | |
| Class A Shares | 0.05% |
| Class B Shares | 0.75% |
| Class C Shares | 0.75% |
| Distribution Services Fees Incurred | |
| Class B Shares | $4,958 |
| Class C Shares | 98,262 |
| TOTAL | $103,220 |
| Purchases | $722,125,378 |
| Sales | $445,435,260 |
September 24, 2018
| Beginning Account Value 2/1/2018 | Ending Account Value 7/31/2018 | Expenses Paid During Period1 | |
| Actual: | |||
| Class A Shares | $1,000 | $1,079.00 | $5.88 |
| Class C Shares | $1,000 | $1,075.10 | $9.72 |
| Institutional Shares | $1,000 | $1,080.50 | $4.59 |
| Class R6 Shares | $1,000 | $1,080.50 | $4.54 |
| Hypothetical (assuming a 5% return before expenses): | |||
| Class A Shares | $1,000 | $1,019.10 | $5.71 |
| Class C Shares | $1,000 | $1,015.40 | $9.44 |
| Institutional Shares | $1,000 | $1,020.40 | $4.46 |
| Class R6 Shares | $1,000 | $1,020.40 | $4.41 |
| 1 | Expenses are equal to the Fund's annualized net expense ratios, multiplied by the average account value over the period, multiplied by 181/365 (to reflect the one-half-year period). The annualized net expense ratios are as follows: |
| Class A Shares | 1.14% |
| Class C Shares | 1.89% |
| Institutional Shares | 0.89% |
| Class R6 Shares | 0.88% |
| Name Birth Date Positions Held with Trust Date Service Began | Principal Occupation(s) for Past Five Years, Other Directorships Held and Previous Position(s) |
| J. Christopher Donahue* Birth Date: April 11, 1949 President and Trustee Indefinite Term Began serving: June 2006 | Principal Occupations: Principal Executive Officer and President of certain of the Funds in the Federated Fund Family; Director or Trustee of the Funds in the Federated Fund Family; President, Chief Executive Officer and Director, Federated Investors, Inc.; Chairman and Trustee, Federated Investment Management Company; Trustee, Federated Investment Counseling; Chairman and Director, Federated Global Investment Management Corp.; Chairman and Trustee, Federated Equity Management Company of Pennsylvania; Trustee, Federated Shareholder Services Company; Director, Federated Services Company. Previous Positions: President, Federated Investment Counseling; President and Chief Executive Officer, Federated Investment Management Company, Federated Global Investment Management Corp. and Passport Research, Ltd; Chairman, Passport Research, Ltd. |
| Name Birth Date Positions Held with Trust Date Service Began | Principal Occupation(s) for Past Five Years, Other Directorships Held and Previous Position(s) |
| John B. Fisher* Birth Date: May 16, 1956 Trustee Indefinite Term Began serving: May 2016 | Principal Occupations: Principal Executive Officer and President of certain of the Funds in the Federated Fund Family; Director or Trustee of certain of the Funds in the Federated Fund Family; Vice President, Federated Investors, Inc.; President, Director/Trustee and CEO, Federated Advisory Services Company, Federated Equity Management Company of Pennsylvania, Federated Global Investment Management Corp., Federated Investment Counseling, Federated Investment Management Company; President of some of the Funds in the Federated Fund Complex and Director, Federated Investors Trust Company. Previous Positions: President and Director of the Institutional Sales Division of Federated Securities Corp.; President and Director of Federated Investment Counseling; President and CEO of Passport Research, Ltd.; Director, Edgewood Securities Corp.; Director, Federated Services Company; Director, Federated Investors, Inc.; Chairman and Director, Southpointe Distribution Services, Inc. and President, Technology, Federated Services Company. |
| * | Reasons for “interested” status: J. Christopher Donahue and John B. Fisher are interested due to their beneficial ownership of shares of Federated Investors, Inc. and due to positions they hold with Federated and its subsidiaries. |
| Name Birth Date Positions Held with Trust Date Service Began | Principal Occupation(s) for Past Five Years, Other Directorships Held, Previous Position(s) and Qualifications |
| John T. Collins Birth Date: January 24, 1947 Trustee Indefinite Term Began serving: October 2013 | Principal Occupations: Director or Trustee of the Federated Fund Family; formerly, Chairman and CEO, The Collins Group, Inc. (a private equity firm) (Retired). Other Directorships Held: Director, Current Chair of the Compensation Committee, KLX Corp. Qualifications: Mr. Collins has served in several business and financial management roles and directorship positions throughout his career. Mr. Collins previously served as Chairman and CEO, The Collins Group, Inc. (a private equity firm). Mr. Collins serves as Chairman Emeriti, Bentley University. Mr. Collins previously served as Director and Audit Committee Member, Bank of America Corp.; Director, FleetBoston Financial Corp.; and Director, Beth Israel Deaconess Medical Center (Harvard University Affiliate Hospital). |
| Name Birth Date Positions Held with Trust Date Service Began | Principal Occupation(s) for Past Five Years, Other Directorships Held, Previous Position(s) and Qualifications |
| G. Thomas Hough Birth Date: February 28, 1955 Trustee Indefinite Term Began serving: August 2015 | Principal Occupations: Director or Trustee of the Federated Fund Family; formerly, Vice Chair, Ernst & Young LLP (public accounting firm) (Retired). Other Directorships Held: Director, Chair of the Audit Committee, Governance Committee, Publix Super Markets, Inc.; Director, Member of the Audit Committee and Technology Committee of Equifax, Inc. Qualifications: Mr. Hough has served in accounting, business management and directorship positions throughout his career. Mr. Hough most recently held the position of Americas Vice Chair of Assurance with Ernst & Young LLP (public accounting firm). Mr. Hough is an Executive Committee member of the United States Golf Association, he serves on the President's Cabinet and Business School Board of Visitors for the University of Alabama and is on the Business School Board of Visitors for Wake Forest University. |
| Maureen Lally-Green Birth Date: July 5, 1949 Trustee Indefinite Term Began serving: August 2009 | Principal Occupations: Director or Trustee of the Federated Fund Family; Dean of the Duquesne University School of Law; Professor and Adjunct Professor of Law, Duquesne University School of Law; formerly, Interim Dean of the Duquesne University School of Law; formerly, Associate General Secretary and Director, Office of Church Relations, Diocese of Pittsburgh. Other Directorships Held: Director, CNX Resources Corporation (formerly known as CONSOL Energy Inc.). Qualifications: Judge Lally-Green has served in various legal and business roles and directorship positions throughout her career. Judge Lally-Green previously served as a member of the Superior Court of Pennsylvania and as a Professor of Law, Duquesne University School of Law. Judge Lally-Green also currently holds the positions on not for profit or for profit boards of directors as follows: Director and Chair, UPMC Mercy Hospital; Director and Vice Chair, Our Campaign for the Church Alive!, Inc.; Director, Saint Vincent College; Member, Pennsylvania State Board of Education (public); and Director CNX Resources Corporation (formerly known as CONSOL Energy Inc.). Judge Lally-Green has held the positions of: Director, Auberle; Director, Epilepsy Foundation of Western and Central Pennsylvania; Director, Ireland Institute of Pittsburgh; Director, Saint Thomas More Society; Director and Chair, Catholic High Schools of the Diocese of Pittsburgh, Inc.; Director, Pennsylvania Bar Institute; Regent, St. Vincent Seminary; and Director and Chair, North Catholic High School, Inc. |
| Charles F. Mansfield, Jr. Birth Date: April 10, 1945 Trustee Indefinite Term Began serving: June 2006 | Principal Occupations: Director or Trustee of the Federated Fund Family; Management Consultant. Other Directorships Held: None. Qualifications: Mr. Mansfield has served as a Marine Corps officer and in several banking, business management, educational roles and directorship positions throughout his long career. He remains active as a Management Consultant. |
| Name Birth Date Positions Held with Trust Date Service Began | Principal Occupation(s) for Past Five Years, Other Directorships Held, Previous Position(s) and Qualifications |
| Thomas M. O'Neill Birth Date: June 14, 1951 Trustee Indefinite Term Began serving: August 2006 | Principal Occupations: Director or Trustee, Chair of the Audit Committee of the Federated Fund Family; Sole Proprietor, Navigator Management Company (investment and strategic consulting). Other Directorships Held: None. Qualifications: Mr. O'Neill has served in several business, mutual fund and financial management roles and directorship positions throughout his career. Mr. O'Neill serves as Director, Medicines for Humanity and Director, The Golisano Children's Museum of Naples, Florida. Mr. O'Neill previously served as Chief Executive Officer and President, Managing Director and Chief Investment Officer, Fleet Investment Advisors; President and Chief Executive Officer, Aeltus Investment Management, Inc.; General Partner, Hellman, Jordan Management Co., Boston, MA; Chief Investment Officer, The Putnam Companies, Boston, MA; Credit Analyst and Lending Officer, Fleet Bank; Director and Consultant, EZE Castle Software (investment order management software); and Director, Midway Pacific (lumber). |
| P. Jerome Richey Birth Date: February 23, 1949 Trustee Indefinite Term Began serving: October 2013 | Principal Occupations: Director or Trustee of the Federated Fund Family; Management Consultant; formerly, Senior Vice Chancellor and Chief Legal Officer, University of Pittsburgh and Executive Vice President and Chief Legal Officer, CNX Resources Corporation (formerly known as CONSOL Energy Inc.) Other Directorships Held: None. Qualifications: Mr. Richey has served in several business and legal management roles and directorship positions throughout his career. Mr. Richey most recently held the positions of Senior Vice Chancellor and Chief Legal Officer, University of Pittsburgh. Mr. Richey previously served as Chairman of the Board, Epilepsy Foundation of Western Pennsylvania and Chairman of the Board, World Affairs Council of Pittsburgh. Mr. Richey previously served as Chief Legal Officer and Executive Vice President, CNX Resources Corporation (formerly known as CONSOL Energy Inc.); and Board Member, Ethics Counsel and Shareholder, Buchanan Ingersoll & Rooney PC (a law firm). |
| John S. Walsh Birth Date: November 28, 1957 Trustee Indefinite Term Began serving: June 2006 | Principal Occupations: Director or Trustee, and Chair of the Board of Directors or Trustees, of the Federated Fund Family; President and Director, Heat Wagon, Inc. (manufacturer of construction temporary heaters); President and Director, Manufacturers Products, Inc. (distributor of portable construction heaters); President, Portable Heater Parts, a division of Manufacturers Products, Inc. Other Directorships Held: None. Qualifications: Mr. Walsh has served in several business management roles and directorship positions throughout his career. Mr. Walsh previously served as Vice President, Walsh & Kelly, Inc. (paving contractors). |
| Name Birth Date Address Positions Held with Trust Date Service Began | Principal Occupation(s) for Past Five Years and Previous Position(s) |
| Lori A. Hensler Birth Date: January 6, 1967 TREASURER Officer since: April 2013 | Principal Occupations: Principal Financial Officer and Treasurer of the Federated Fund Family; Senior Vice President, Federated Administrative Services; Financial and Operations Principal for Federated Securities Corp. and Edgewood Services, Inc.; and Assistant Treasurer, Federated Investors Trust Company. Ms. Hensler has received the Certified Public Accountant designation. Previous Positions: Controller of Federated Investors, Inc.; Senior Vice President and Assistant Treasurer, Federated Investors Management Company; Treasurer, Federated Investors Trust Company; Assistant Treasurer, Federated Administrative Services, Federated Administrative Services, Inc., Federated Securities Corp., Edgewood Services, Inc., Federated Advisory Services Company, Federated Equity Management Company of Pennsylvania, Federated Global Investment Management Corp., Federated Investment Counseling, Federated Investment Management Company, Passport Research, Ltd., and Federated MDTA, LLC; Financial and Operations Principal for Federated Securities Corp., Edgewood Services, Inc. and Southpointe Distribution Services, Inc. |
| Peter J. Germain Birth Date: September 3, 1959 CHIEF LEGAL OFFICER, SECRETARY and EXECUTIVE VICE PRESIDENT Officer since: June 2006 | Principal Occupations: Mr. Germain is Chief Legal Officer, Secretary and Executive Vice President of the Federated Fund Family. He is General Counsel, Chief Legal Officer, Secretary and Executive Vice President, Federated Investors, Inc.; Trustee and Senior Vice President, Federated Investors Management Company; Trustee and President, Federated Administrative Services; Director and President, Federated Administrative Services, Inc.; Director and Vice President, Federated Securities Corp.; Director and Secretary, Federated Private Asset Management, Inc.; Secretary, Federated Shareholder Services Company; and Secretary, Retirement Plan Service Company of America. Mr. Germain joined Federated in 1984 and is a member of the Pennsylvania Bar Association. Previous Positions: Deputy General Counsel, Special Counsel, Managing Director of Mutual Fund Services, Federated Investors, Inc.; Senior Vice President, Federated Services Company; and Senior Corporate Counsel, Federated Investors, Inc. |
| Stephen F. Auth Birth Date: September 13, 1956 101 Park Avenue 41st Floor New York, NY 10178 CHIEF INVESTMENT OFFICER Officer since: June 2012 | Principal Occupations: Stephen F. Auth is Chief Investment Officer of various Funds in the Federated Fund Family; Executive Vice President, Federated Investment Counseling, Federated Global Investment Management Corp. and Federated Equity Management Company of Pennsylvania. Previous Positions: Executive Vice President, Federated Investment Management Company and Passport Research, Ltd. (investment advisory subsidiary of Federated); Senior Vice President, Global Portfolio Management Services Division; Senior Vice President, Federated Investment Management Company and Passport Research, Ltd.; Senior Managing Director and Portfolio Manager, Prudential Investments. |
| Name Birth Date Address Positions Held with Trust Date Service Began | Principal Occupation(s) for Past Five Years and Previous Position(s) |
| Stephen Van Meter Birth Date: June 5, 1975 CHIEF COMPLIANCE OFFICER AND SENIOR VICE PRESIDENT Officer since: July 2015 | Principal Occupations: Senior Vice President and Chief Compliance Officer of the Federated Fund Family; Vice President and Chief Compliance Officer of Federated Investors, Inc. and Chief Compliance Officer of certain of its subsidiaries. Mr. Van Meter joined Federated in October 2011. He holds FINRA licenses under Series 3, 7, 24 and 66. Previous Positions: Mr. Van Meter previously held the position of Compliance Operating Officer, Federated Investors, Inc. Prior to joining Federated, Mr. Van Meter served at the United States Securities and Exchange Commission in the positions of Senior Counsel, Office of Chief Counsel, Division of Investment Management and Senior Counsel, Division of Enforcement. |
4000 Ericsson Drive
Warrendale, PA 15086-7561
or call 1-800-341-7400.
CUSIP 31421R767
CUSIP 31421R759
CUSIP 31421R619
2018 ©Federated Investors, Inc.
| Item 2. | Code of Ethics |
(a) As of the end of the period covered by this report, the registrant has adopted a code of ethics (the "Section 406 Standards for Investment Companies - Ethical Standards for Principal Executive and Financial Officers") that applies to the registrant's Principal Executive Officer and Principal Financial Officer; the registrant's Principal Financial Officer also serves as the Principal Accounting Officer.
(c) There was no amendment to the registrant’s code of ethics described in Item 2(a) above during the period covered by the report.
(d) There was no waiver granted, either actual or implicit, from a provision to the registrant’s code of ethics described in Item 2(a) above during the period covered by the report.
(e) Not Applicable
(f)(3) The registrant hereby undertakes to provide any person, without charge, upon request, a copy of the code of ethics. To request a copy of the code of ethics, contact the registrant at 1-800-341-7400, and ask for a copy of the Section 406 Standards for Investment Companies - Ethical Standards for Principal Executive and Financial Officers.
Item 3. Audit Committee Financial Expert
The registrant's Board has determined that each of the following members of the Board's Audit Committee is an “audit committee financial expert,” and is "independent," for purposes of this Item: John T. Collins, G. Thomas Hough and Thomas M. O'Neill.
| Item 4. | Principal Accountant Fees and Services |
(a) Audit Fees billed to the registrant for the two most recent fiscal years:
Fiscal year ended 2018 - $139,710
Fiscal year ended 2017 – $135,000
(b) Audit-Related Fees billed to the registrant for the two most recent fiscal years:
Fiscal year ended 2018 - $0
Fiscal year ended 2017 – $13,429
Fiscal year ended 2017- - Audit consents issued for N-1A filings.
Amount requiring approval of the registrant’s audit committee pursuant to paragraph (c)(7)(ii) of Rule 2-01 of Regulation S-X, $0 and $0, respectively.
(c) Tax Fees billed to the registrant for the two most recent fiscal years:
Fiscal year ended 2018 - $0
Fiscal year ended 2017 - $0
Amount requiring approval of the registrant’s audit committee pursuant to paragraph (c)(7)(ii) of Rule 2-01 of Regulation S-X, $0 and $0, respectively.
(d) All Other Fees billed to the registrant for the two most recent fiscal years:
Fiscal year ended 2017 - $0
Fiscal year ended 2016 - $0
Amount requiring approval of the registrant’s audit committee pursuant to paragraph (c)(7)(ii) of Rule 2-01 of Regulation S-X, $32,377 and $33,951, respectively. Fiscal year ended 2018- Service fee for analysis of potential Passive Foreign Investment Company holdings. Fiscal year ended 2017- Service fee for analysis of potential Passive Foreign Investment Company holdings.
(e)(1) Audit Committee Policies regarding Pre-approval of Services.
The Audit Committee is required to pre-approve audit and non-audit services performed by the independent auditor in order to assure that the provision of such services do not impair the auditor’s independence. Unless a type of service to be provided by the independent auditor has received general pre-approval, it will require specific pre-approval by the Audit Committee. Any proposed services exceeding pre-approved cost levels will require specific pre-approval by the Audit Committee.
Certain services have the general pre-approval of the Audit Committee. The term of the general pre-approval is 12 months from the date of pre-approval, unless the Audit Committee specifically provides for a different period. The Audit Committee will annually review the services that may be provided by the independent auditor without obtaining specific pre-approval from the Audit Committee and may grant general pre-approval for such services. The Audit Committee will revise the list of general pre-approved services from time to time, based on subsequent determinations. The Audit Committee will not delegate its responsibilities to pre-approve services performed by the independent auditor to management.
The Audit Committee has delegated pre-approval authority to its Chairman. The Chairman will report any pre-approval decisions to the Audit Committee at its next scheduled meeting. The Committee will designate another member with such pre-approval authority when the Chairman is unavailable.
AUDIT SERVICES
The annual Audit services engagement terms and fees will be subject to the specific pre-approval of the Audit Committee. The Audit Committee must approve any changes in terms, conditions and fees resulting from changes in audit scope, registered investment company (RIC) structure or other matters.
In addition to the annual Audit services engagement specifically approved by the Audit Committee, the Audit Committee may grant general pre-approval for other Audit Services, which are those services that only the independent auditor reasonably can provide. The Audit Committee has pre-approved certain Audit services, all other Audit services must be specifically pre-approved by the Audit Committee.
AUDIT-RELATED SERVICES
Audit-related services are assurance and related services that are reasonably related to the performance of the audit or review of the Company’s financial statements or that are traditionally performed by the independent auditor. The Audit Committee believes that the provision of Audit-related services does not impair the independence of the auditor, and has pre-approved certain Audit-related services, all other Audit-related services must be specifically pre-approved by the Audit Committee.
TAX SERVICES
The Audit Committee believes that the independent auditor can provide Tax services to the Company such as tax compliance, tax planning and tax advice without impairing the auditor’s independence. However, the Audit Committee will not permit the retention of the independent auditor in connection with a transaction initially recommended by the independent auditor, the purpose of which may be tax avoidance and the tax treatment of which may not be supported in the Internal Revenue Code and related regulations. The Audit Committee has pre-approved certain Tax services, all Tax services involving large and complex transactions must be specifically pre-approved by the Audit Committee.
ALL OTHER SERVICES
With respect to the provision of services other than audit, review or attest services the pre-approval requirement is waived if:
| (1) | The aggregate amount of all such services provided constitutes no more than five percent of the total amount of revenues paid by the registrant, the registrant’s adviser (not including any sub-adviser whose role is primarily portfolio management and is subcontracted with or overseen by another investment adviser), and any entity controlling, controlled by, or under common control with the investment adviser that provides ongoing services to the registrant to its accountant during the fiscal year in which the services are provided; |
| (2) | Such services were not recognized by the registrant, the registrant’s adviser (not including any sub-adviser whose role is primarily portfolio management and is subcontracted with or overseen by another investment adviser), and any entity controlling, controlled by, or under common control with the investment adviser that provides ongoing services to the registrant at the time of the engagement to be non-audit services; and |
| (3) | Such services are promptly brought to the attention of the Audit Committee of the issuer and approved prior to the completion of the audit by the Audit Committee or by one or more members of the Audit Committee who are members of the board of directors to whom authority to grant such approvals has been delegated by the Audit Committee. |
The Audit Committee may grant general pre-approval to those permissible non-audit services classified as All Other services that it believes are routine and recurring services, and would not impair the independence of the auditor.
The SEC’s rules and relevant guidance should be consulted to determine the precise definitions of prohibited non-audit services and the applicability of exceptions to certain of the prohibitions.
PRE-APPROVAL FEE LEVELS
Pre-approval fee levels for all services to be provided by the independent auditor will be established annually by the Audit Committee. Any proposed services exceeding these levels will require specific pre-approval by the Audit Committee.
PROCEDURES
Requests or applications to provide services that require specific approval by the Audit Committee will be submitted to the Audit Committee by both the independent auditor and the Principal Accounting Officer and/or Internal Auditor, and must include a joint statement as to whether, in their view, the request or application is consistent with the SEC’s rules on auditor independence.
(e)(2) Percentage of services identified in items 4(b) through 4(d) that were approved by the registrants audit committee pursuant to paragraph (c)(7)(i)(C) of Rule 2-01 of Regulation S-X:
4(b)
Fiscal year ended 2018 – 0%
Fiscal year ended 2017 – 0%
Percentage of services provided to the registrants investment adviser and any entity controlling, controlled by, or under common control with the investment adviser that provides ongoing services to the registrant that were approved by the registrants audit committee pursuant to paragraph (c)(7)(i)(C) of Rule 2-01 of Regulation S-X, 0% and 0% respectively.
4(c)
Fiscal year ended 2018 – 0%
Fiscal year ended 2017 – 0%
Percentage of services provided to the registrants investment adviser and any entity controlling, controlled by, or under common control with the investment adviser that provides ongoing services to the registrant that were approved by the registrants audit committee pursuant to paragraph (c)(7)(i)(C) of Rule 2-01 of Regulation S-X, 0% and 0% respectively.
4(d)
Fiscal year ended 2018 – 0%
Fiscal year ended 2017 – 0%
Percentage of services provided to the registrants investment adviser and any entity controlling, controlled by, or under common control with the investment adviser that provides ongoing services to the registrant that were approved by the registrants audit committee pursuant to paragraph (c)(7)(i)(C) of Rule 2-01 of Regulation S-X, 0% and 0% respectively.
| (f) | NA |
| (g) | Non-Audit Fees billed to the registrant, the registrant’s investment adviser, and certain entities controlling, controlled by or under common control with the investment adviser: |
Fiscal year ended 2018 - $1,155,615
Fiscal year ended 2017 - $290,365
| (h) | The registrant’s Audit Committee has considered that the provision of non-audit services that were rendered to the registrant’s adviser (not including any sub-adviser whose role is primarily portfolio management and is subcontracted with or overseen by another investment adviser), and any entity controlling, controlled by, or under common control with the investment adviser that provides ongoing services to the registrant that were not pre-approved pursuant to paragraph (c)(7)(ii) of Rule 2-01 of Regulation S-X is compatible with maintaining the principal accountant’s independence. |
The registrant’s management and Audit Committee continue to believe that the registrant’s registered public accounting firm, Ernst & Young LLP (“EY”), has the ability to exercise objective and impartial judgment on all issues encompassed within their audit services. EY is required to make a determination that it satisfies certain independence requirements under the federal securities laws. Like other registrants, there is a risk that activities or relationships of EY, or its partners or employees, can prevent a determination from being made that it satisfies such independence requirements with respect to the registrant, which could render it ineligible to serve as the registrant’s independent public accountant.
In its required communications to the Audit Committee of the registrant’s Board, EY informed the Audit Committee that EY and/ or covered person professionals within EY maintain lending relationships with certain owners of greater than 10% of the shares of the registrant and/or certain investment companies within the “investment company complex” as defined under Rule 2-01(f)(14) of Regulation S-X, which are affiliates of the registrant. EY has advised the Audit Committee that these lending relationships implicate Rule 2-01(c)(1)(ii)(A) of Regulation S-X (referred to as the “Loan Rule”). The Loan Rule prohibits an independent public accountant, or covered person professionals at such firm, from having a financial relationship (such as a loan) with a lender that is a record or beneficial owner of more than 10% of an audit client’s equity securities. For purposes of the Loan Rule, audit clients include the registrant, as well as all registered investment companies advised by advisory subsidiaries of Federated Investors, Inc., the Adviser (for which EY serves as independent public accountant), and their respective affiliates (collectively, the “Federated Fund Complex”).
EY informed the Audit Committee that EY believes that these lending relationships described above do not and will not impair EY’s ability to exercise objective and impartial judgment in connection with the audits of the financial statements for the registrant and a reasonable investor with knowledge of all relevant facts and circumstances would conclude that EY has been and is capable of objective and impartial judgment on all issues encompassed within EY’s audits.
On June 20, 2016, the Division of Investment Management of the Securities and Exchange Commission (“SEC”) issued a no-action letter to another mutual fund complex (see Fidelity Management & Research Company et al., No-Action Letter) related to similar Loan Rule matters as those described above (the “Letter”). In the Letter, the SEC Staff confirmed that it would not recommend enforcement action against an investment company that relied on the audit services performed by an independent public accountant where the Loan Rule was implicated in certain specified circumstances provided that: (1) the auditor has complied with PCAOB Rule 3526(b)(1) and 3526(b)(2); (2) the Loan Rule is implicated because of lending relationships; and (3) notwithstanding such lending relationships that implicate the Loan Rule, the auditor has concluded that it is objective and impartial with respect to the issues encompassed within its engagement as auditor of the funds. The circumstances described in the Letter are substantially similar to the circumstances that implicated the Loan Rule with respect to EY and the registrant. On September 22, 2017, the SEC extended the expiration of the Letter until the effectiveness of any amendments to the Loan Rule designed to address the concerns in the Letter. On May 2, 2018, the SEC proposed amendments to the Loan Rule, which, if adopted as proposed, would refocus the analysis that must be conducted to determine whether an auditor is independent when the auditor has a lending relationship with certain shareholders of an audit client at any time during an audit or professional engagement period.
Additionally, on July 18, 2018, EY informed the registrant that Rule 2-01(c)(1)(i)(A) of Regulation S-X (“Investment Rule”) also has been implicated since July 2, 2018. The Investment Rule prohibits public accounting firms, or covered person professionals and their immediate family members, from having certain direct financial investments in their audit clients and affiliated entities. EY informed the registrant that a pension trust of a non-US affiliated entity of EY had previously made, and as of July 18, 2018 maintained, an investment in a fund (“Hermes Fund”) managed by Hermes Alternative Investment Management Limited (“HAIML”), which is a wholly owned subsidiary of Hermes Fund Managers Limited (“HFML”). The pension trust’s investment in the Hermes Fund involves the Investment Rule because an indirect wholly owned subsidiary of Federated Investors, Inc. (an affiliate of the registrant’s adviser), acquired a 60% majority interest in HFML on July 2, 2018, effective July 1, 2018 (“Hermes Acquisition”). The pension trust first invested in the Hermes Fund in 2007, well prior to the Hermes Acquisition. The pension trust’s investment represented less than 3.3% of the Hermes Fund’s assets as of July 18, 2018. EY subsequently informed the registrant that EY’s affiliated entity’s pension trust had submitted an irrevocable redemption notice to redeem its investment in the Hermes Fund. Pursuant to the redemption terms of the Hermes Fund, the pension trust’s redemption would not be effected until December 26, 2018 at the earliest. The redemption notice could not be revoked by the pension trust. The redemption notice would only be revoked by HAIML, as the adviser for Hermes Fund, if, and to the extent, the pension trust successfully sold its interest in the Hermes Fund in a secondary market transaction. EY also informed the registrant that the pension trust simultaneously submitted a request to HAIML to conduct a secondary market auction for the pension trust’s interests in the Hermes Fund. In addition, the only voting rights shareholders of the Hermes Fund had under the Hermes Fund’s governing documents relate to key appointments, including the election of the non-executive members of the Hermes Fund’s committee, the appointment of the Hermes Fund’s trustee and the adoption of the Hermes Fund’s financial statements. The next meeting of the Hermes Fund at which shareholders can vote on the election of members to the Hermes Fund’s committee is not until June 2019, and the size of the pension trust’s investment in the Hermes Fund would not allow it to unilaterally elect a committee member or the trustee. EY does not audit the Hermes Fund and the Hermes Fund’s assets and operations are not consolidated in the registrant’s financial statements that are subject to audit by EY. Finally, no member of EY’s audit team that provides audit services to the registrant is a beneficiary of EY’s affiliated entity’s pension trust. Management reviewed this matter with the registrant’s Audit Committee, and, based on that review, as well as a letter from EY to the registrant dated July 26, 2018, in which EY indicated that it had determined that this matter does not impair EY’s ability to exercise objective and impartial judgment in connection with the audit of the financial statements for the registrant and the belief that a reasonable investor with knowledge of all relevant facts and circumstances would conclude that EY has been and is capable of exercising objective and impartial judgment on all issues encompassed within EY’s audit, the registrant’s management and Audit Committee made a determination that such matter does not impair EY’s ability to exercise objective and impartial judgment in connection with the audit of the financial statements for the registrant. On August 29, 2018, EY informed the registrant that EY’s affiliated entity’s pension trust sold its entire interest in the Hermes Fund, effective as of August 29, 2018.
If it were to be determined that, with respect to the Loan Rule, the relief available under the Letter was improperly relied upon, or that the independence requirements under the federal securities laws were not complied with regarding the registrant, for certain periods, and/or given the implication of the Investment Rule for certain periods, any of the registrant’s filings with the SEC which contain financial statements of the registrant for such periods may be determined not to be consistent with or comply with applicable federal securities laws, the registrant’s ability to offer shares under its current registration statement may be impacted, and certain financial reporting and/or other covenants with, and representations and warranties to, the registrant’s lender under its committed line of credit may be impacted. Such events could have a material adverse effect on the registrant and the Federated Fund Complex.
| Item 5. | Audit Committee of Listed Registrants |
Not Applicable
| Item 6. | Schedule of Investments |
(a) The registrant’s Schedule of Investments is included as part of the Report to Stockholders filed under Item 1 of this form.
(b) Not Applicable; Fund had no divestments during the reporting period covered since the previous Form N-CSR filing.
| Item 7. | Disclosure of Proxy Voting Policies and Procedures for Closed-End Management Investment Companies |
Not Applicable
| Item 8. | Portfolio Managers of Closed-End Management Investment Companies |
Not Applicable
| Item 9. | Purchases of Equity Securities by Closed-End Management Investment Company and Affiliated Purchasers |
Not Applicable
| Item 10. | Submission of Matters to a Vote of Security Holders |
No Changes to Report
| Item 11. | Controls and Procedures |
(a) The registrant’s President and Treasurer have concluded that the
registrant’s disclosure controls and procedures (as defined in rule 30a-3(c) under the Act) are effective in design and operation and are sufficient to form the basis of the certifications required by Rule 30a-(2) under the Act, based on their evaluation of these disclosure controls and procedures within 90 days of the filing date of this report on Form N-CSR.
(b) There were no changes in the registrant’s internal control over financial reporting (as defined in rule 30a-3(d) under the Act) during the second fiscal quarter of the period covered by this report that have materially affected, or are reasonably likely to materially affect, the registrant’s internal control over financial reporting.
| Item 12. | Disclosure of Securities Lending Activities for Closed-End Management Investment Companies |
Not Applicable
| Item 13. | Exhibits |
(a)(1) Code of Ethics- Not Applicable to this Report.
(a)(2) Certifications of Principal Executive Officer and Principal Financial Officer.
(a)(3) Not Applicable.
(b) Certifications pursuant to 18 U.S.C. Section 1350.
SIGNATURES
Pursuant to the requirements of the Securities Exchange Act of 1934 and the Investment Company Act of 1940, the registrant has duly caused this report to be signed on its behalf by the undersigned, thereunto duly authorized.
Registrant Federated MDT Series
By /S/ Lori A. Hensler
Lori A. Hensler, Principal Financial Officer
Date September 24, 2018
Pursuant to the requirements of the Securities Exchange Act of 1934 and the Investment Company Act of 1940, this report has been signed below by the following persons on behalf of the registrant and in the capacities and on the dates indicated.
By /S/ J. Christopher Donahue
J. Christopher Donahue, Principal Executive Officer
Date September 24, 2018
By /S/ Lori A. Hensler
Lori A. Hensler, Principal Financial Officer
Date September 24, 2018