
Realising Value Enstar Group Limited Investor Update March 2, 2020 ENSTARGROUP.COM

Disclaimer IMPORTANT INFORMATION REGARDING FORWARD‐LOOKING STATEMENTS This presentation, and oral statements made with respect to information contained in this presentation, may include certain forward‐looking statements regarding our views with respect to our business, operations, loss reserves, strategy, investment portfolio, economic model, and our expected performance for future periods, as well as the insurance market and industry conditions. These statements are intended as “forward‐looking statements” under the Private Securities Litigation Reform Act of 1995. Actual results may materially differ from those set forth in the forward‐looking statements. You may identify forward‐looking statements by the use of words such as “believe,” “expect,” “plan,” “intend,” “anticipate,” “estimate,” “predict,” “potential,” “may,” “should,” “could,” “will” or other words or expressions of similar meaning, although not all forward‐looking statements contain such terms. Forward‐looking statements involve significant risks and uncertainties, including risks of changing and uncertain economic conditions, the success of implementing our business strategies, the adequacy of our loss reserves, ongoing and future regulatory developments disrupting our business, lengthy and unpredictable litigation, risks relating to our acquisitions, increasing competitive pressures, loss of key personnel, risks relating to our active underwriting businesses, the performance of our investment portfolio and liquidity and other factors detailed in our Annual Report on Form 10‐K for the year ended December 31, 2019 and our other reports filed from time to time with the Securities and Exchange Commission (“SEC”). Any forward‐looking statement you see or hear during the presentation reflects Enstar Group Limited’s current views with respect to future events and is subject to these and other risks, uncertainties and assumptions. If any of these risks or uncertainties materialize, or if our underlying assumptions prove to be incorrect, actual results may vary significantly from what we projected. You are cautioned not to place undue reliance on these forward‐looking statements, which speak only as of the date on which they are made. The date of this presentation is listed on the cover page and Enstar does not undertake to update or keep it accurate after such date. NON‐GAAP MEASURES AND ADDITIONAL INFORMATION Our non‐GAAP operating income (loss) attributable to Enstar Group Limited ordinary shareholders and fully diluted non‐GAAP operating income (loss) per ordinary share are non‐ GAAP financial measures as defined by Regulation G. We use these figures to enable readers of the consolidated financial statements to more easily analyze our results in a manner more aligned with the way management analyzes our underlying performance. Reconciliations to the most directly comparable GAAP financial measures are provided in the Appendices at the end of this presentation. Unless indicated otherwise, the company based the information concerning its markets/industry contained herein on its general knowledge of and expectations concerning those markets/industry, on data from various industry analysis, on its internal research, and on adjustments and assumptions that it believes to be reasonable. However, it has not independently verified data from market/industry analysis and cannot guarantee their accuracy or completeness. Long‐term issuer ratings are provided by third parties, Standard and Poor's and Fitch Ratings, and are subject to certain limitations and disclaimers. Form information on these ratings, refer to the rating agencies' websites and other publications. • The company has an effective shelf registration statement (including a prospectus) on file with the SEC. Any offering of securities will be made only by means of a prospectus supplement, which will be filed with the SEC. In the event that the company undertakes an offering, you may obtain a copy of the prospectus supplement and accompanying prospectus for the offering by visiting EDGAR on the SEC website at www.sec.gov. For more complete information about Enstar Group Limited, you should read our reports filed with the SEC. You may get these documents for free through EDGAR on the SEC website at www.sec.gov, or through our website at https://investor.enstargroup.com/sec‐filings. enstargroup.com 2
Agenda 1 Highlights 2 About Enstar 3 Non‐Life Run‐off 4 Active Underwriting 5 Investments 6 Capital Management 7 Management, Governance and Operations 3
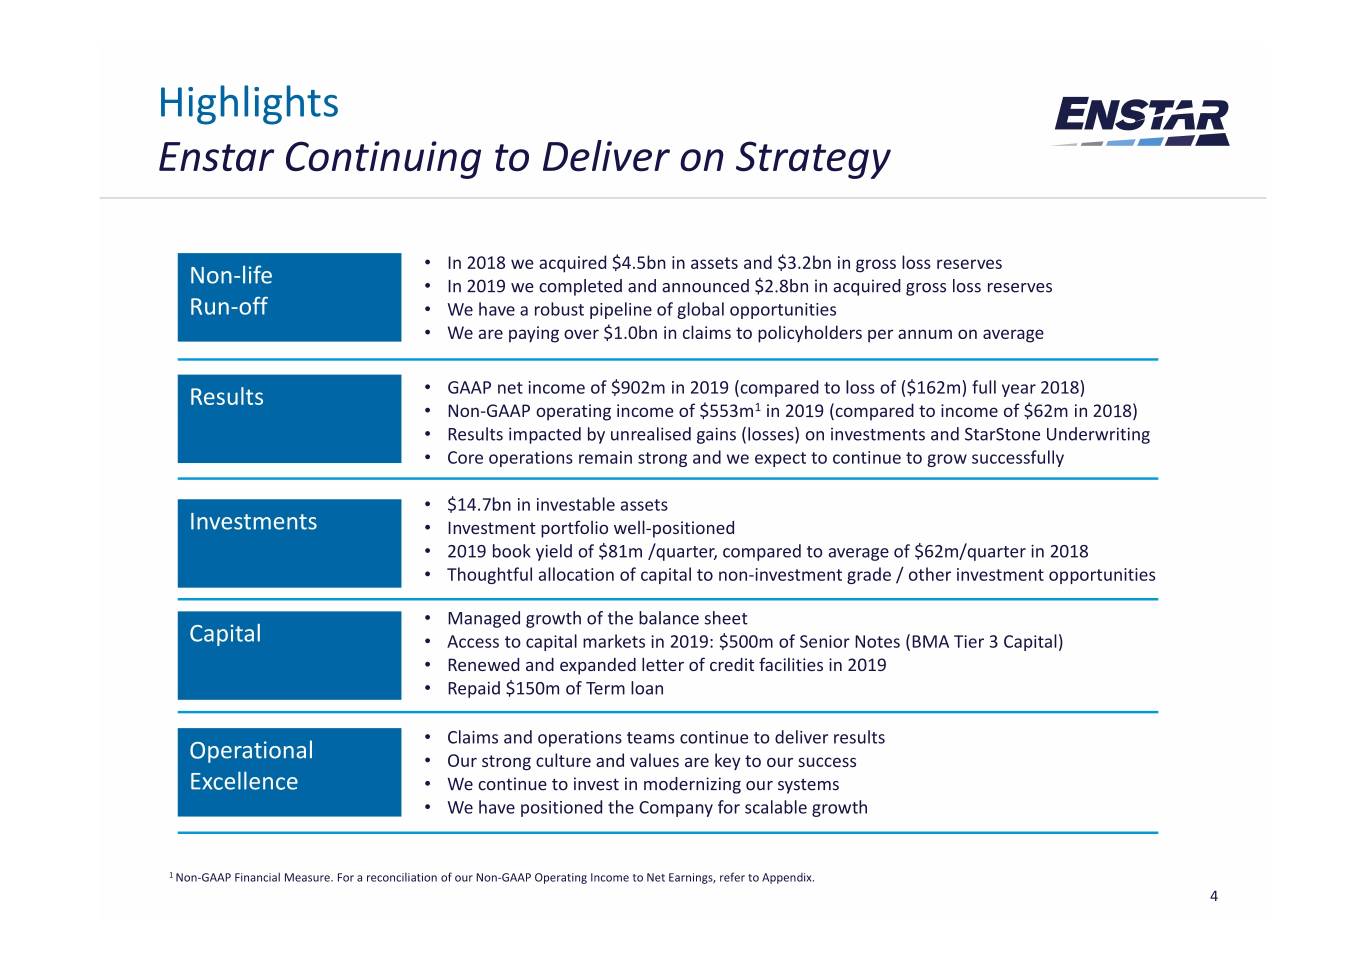
Highlights Enstar Continuing to Deliver on Strategy • In 2018 we acquired $4.5bn in assets and $3.2bn in gross loss reserves Non‐life • In 2019 we completed and announced $2.8bn in acquired gross loss reserves Run‐off • We have a robust pipeline of global opportunities • We are paying over $1.0bn in claims to policyholders per annum on average Results • GAAP net income of $902m in 2019 (compared to loss of ($162m) full year 2018) • Non‐GAAP operating income of $553m1 in 2019 (compared to income of $62m in 2018) • Results impacted by unrealised gains (losses) on investments and StarStone Underwriting • Core operations remain strong and we expect to continue to grow successfully • $14.7bn in investable assets Investments • Investment portfolio well‐positioned • 2019 book yield of $81m /quarter, compared to average of $62m/quarter in 2018 • Thoughtful allocation of capital to non‐investment grade / other investment opportunities • Managed growth of the balance sheet Capital • Access to capital markets in 2019: $500m of Senior Notes (BMA Tier 3 Capital) • Renewed and expanded letter of credit facilities in 2019 • Repaid $150m of Term loan • Claims and operations teams continue to deliver results Operational • Our strong culture and values are key to our success Excellence • We continue to invest in modernizing our systems • We have positioned the Company for scalable growth 1 Non‐GAAP Financial Measure. For a reconciliation of our Non‐GAAP Operating Income to Net Earnings, refer to Appendix. 4

Highlights Financial Metrics Growth in Assets and Reserves ($m) Net Earnings ($m) $902 $19,363 $16,556 $13,606 $12,866 $11,773 $11,176 $9,937 $10,357 $8,620 $8,109 $7,568 $7,793 $6,606 $312 $5,878 $6,199 $5,236 $5,564 $265 $4,283 $209 $214 $220 $3,291 $3,661 $174 $154 $168 2010 2011 2012 2013 2014 2015 2016 2017 2018 2019 2010 2011 2012 2013 2014 2015 2016 2017 2018 2019 Total Assets Insurance Liabilities ($162) Total Equity (Common and Preferred) ($m) Debt to Capital Ratio ($m) 25.0% $1,400 20.5% 20.5% 19.2% 19.4% $1,200 20.0% 18.1% 19.7% $4,842 17.1% 14.9% $1,000 $3,902 15.0% 12.2% $800 $3,137 $2,8027.0% $2,517 $600 $2,305 10.0% $1,756 6.5% $1,554 $400 $1,386 $948 5.0% $200 0.0% $0 2010 2011 2012 2013 2014 2015 2016 2017 2018 2019 2010 2011 2012 2013 2014 2015 2016 2017 2018 2019 1 Total Debt Debt Capital Ratio (Debt +Total Shareholders Equity) 1 Total capital attributable to Enstar includes shareholders’ and debt obligations and excludes noncontrolling interest and redeemable noncontrolling interest 5

About Enstar Introduction Leading Global Insurance Group • Diversified mix of innovative risk transfer solutions • Well‐positioned for profitability across insurance cycles • Geographically diversified across the United States, United Kingdom, Europe, Australia and Rest of World • Specialty underwriting capabilities Premier Acquirer and Manager of Run‐Off Insurance Blocks • Disciplined approach to buying businesses; ability to manage run‐off and active blocks • Proven ability to continuously acquire and source run‐off business with over 100 total acquisitive transactions/new business since founding 26 years ago • Institutionalized processes for the lifetime of run‐off blocks (acquisition to value extraction) Strong Capital and Liquidity Position • Total assets of $19.4bn and total shareholders’ equity of $4.9bn as of December 31, 2019 • High quality fixed income investment portfolio supporting policyholder obligations • Strong holding company, group capital management and liquidity available • Solid operational cash flows, reserve releases, and capital position contribute to robust financial model Seasoned Management Team with Extensive Industry Experience 6

About Enstar A Global Group With 30 offices across 12 countries, and 1,400+ staff Enstar Group offers global solutions Canada Active Europe Run‐off, Active, Life Belgium France Germany United States Ireland Run‐off, Active, Life Italy Bermuda 13 Offices Liechtenstein Executive Team, Run‐off & Active Netherlands UK Australia Run‐off, Active 7

About Enstar Company Overview $19.4bn $197.93 $4.9bn Enstar Group Limited is a Bermuda‐ based holding company, listed on NASDAQ: Assets Fully Diluted Book Value Shareholders’ Equity December 31, 2019 Per Share December 31, 2019 • Common Shares (ESGR) December 31, 2019 • Preferred Shares (ESGRO, ESGRP) Enstar is a multi‐faceted insurance $14.7bn $10.4bn 19.7% group that provides: • Innovative risk transfer solutions Investable Assets 1 Total Reserves Debt to Capital Ratio 2 • Specialty underwriting December 31, 2019 December 31, 2019 December 31, 2019 capabilities Credit Ratings Enstar’s core segment, Non‐Life $553.4m $902.2m Run‐Off, acquires and manages run‐ off insurance and reinsurance liabilities Non‐GAAP operating income 3 GAAP Net Earnings Long‐term Issuer Ratings December 31, 2019 December 31, 2019 S&P BBB (stable) Fitch BBB‐ (stable) 1 Includes total investments, cash and cash equivalents, restricted cash and cash equivalents and funds held 2 Total capital attributable to Enstar includes shareholders’ equity and debt obligations and excludes noncontrolling interest and redeemable noncontrolling interest 3 Non‐GAAP Financial Measure. For a reconciliation of our Non‐GAAP Operating Income to Net Earnings, refer to Appendix. 8

About Enstar Operating Segment Overview Loss & LAE Reserves • Premier market leader in the run‐off space As of December 31, 2019 • Acquires P&C companies or portfolios in run‐off and manages the acquired 2.2% 0.2% businesses, generating profits through loss reserve savings, operational efficiencies, and investment income 18.2% Run‐ Non‐Life • Highly selective underwriting process for Run‐Off potential acquisition targets, focusing on Off investigating risk exposures, claims practices, reserve requirements and outstanding claims $10.4bn • Also manages third‐party run‐off portfolios through service companies for fixed or incentive‐based fees 79.4% • Active specialty underwriting platform, AM StarStone Best A‐ rated, operating worldwide Non‐life Run‐off: $8.3bn StarStone Segment: $1.9bn Active • Active underwriting operations at Lloyd’s, which manages Syndicate 609 and Atrium Atrium Segment: $231.7m provides 25% of the underwriting capacity Other: $23.1m and capital to Syndicate 609 9

About Enstar Successful Track Record Acquired Total Assets and Gross Reserves By Year Assets Gross Reserves Acquired $31.8bn $m $m of total assets acquired 2009 and prior $6,720 $4,868 2010 $1,577 $1,358 2011 $2,098 $1,966 2012 $411 $411 $25.0bn 2013 $3,660 $2,635 2014 $2,547 $1,292 of total gross loss reserves 2015 $2,967 $2,357 acquired 2016 $1,846 $1,627 2017 $2,110 $2,097 of which 2018 $4,478 $3,216 2019 $3,060 $2,772 $14.5bn 2020 (Pending) $372 $385 have been successfully Total $31,846 $24,984 run‐off 10

Non‐Life Run‐off Acquisitions ‐ The Cornerstone of our Business 101 Dedicated, cross‐ total acquisitive transactions/new functional acquisition business since formation review teams 51 Secure business companies / portfolios acquired through stock purchase or merger partner 50 Focused on companies / portfolios of insurance execution or reinsurance business 11
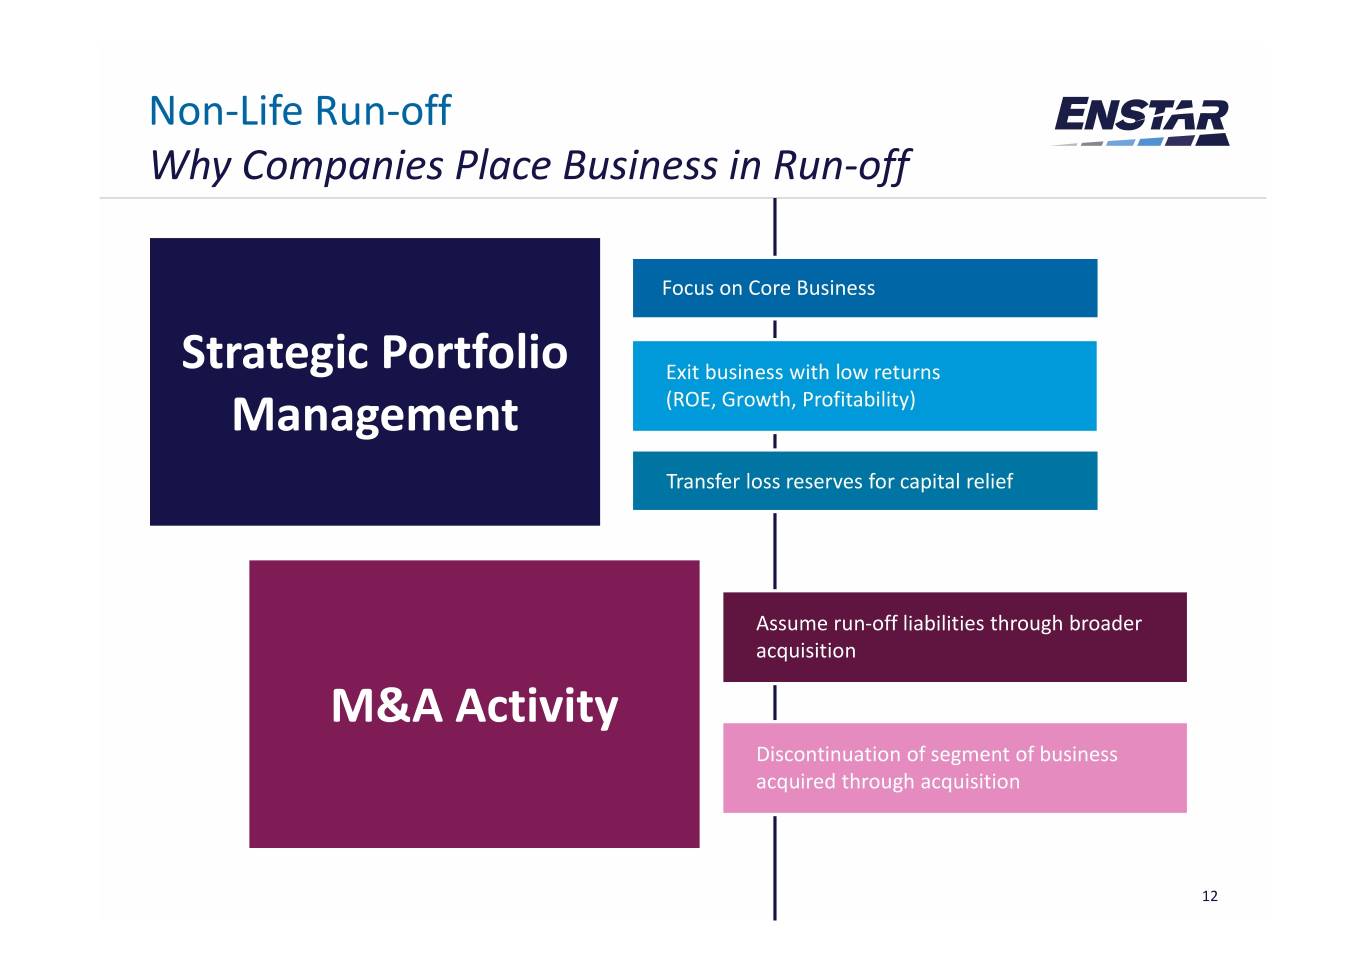
Non‐Life Run‐off Why Companies Place Business in Run‐off Focus on Core Business Strategic Portfolio Exit business with low returns Management (ROE, Growth, Profitability) Transfer loss reserves for capital relief Assume run‐off liabilities through broader acquisition M&A Activity Discontinuation of segment of business acquired through acquisition 12
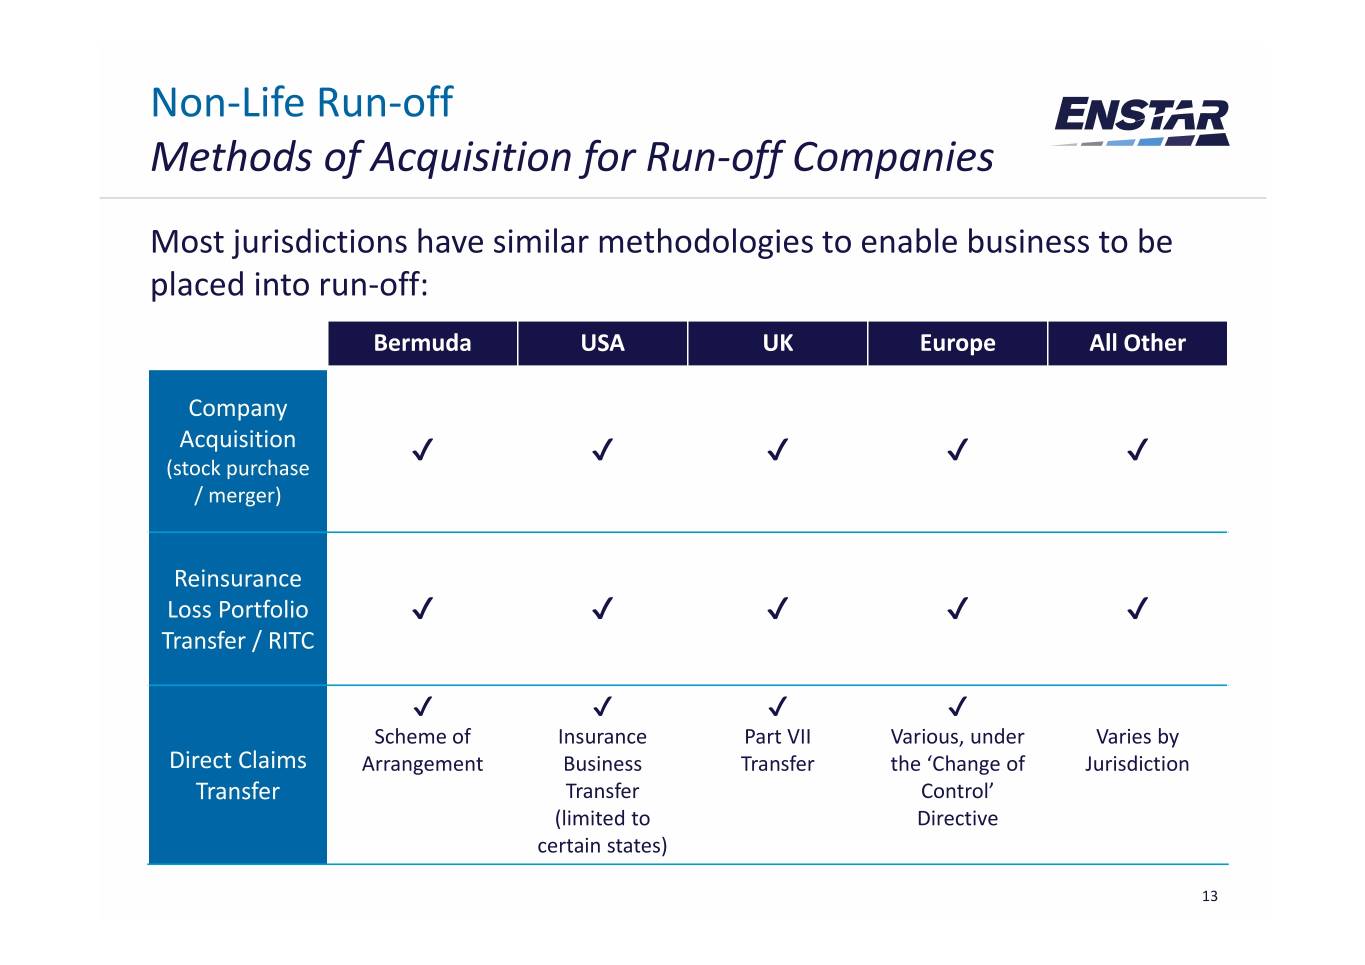
Non‐Life Run‐off Methods of Acquisition for Run‐off Companies Most jurisdictions have similar methodologies to enable business to be placed into run‐off: Bermuda USA UK Europe All Other Company Acquisition ✔✔✔✔✔ (stock purchase / merger) Reinsurance Loss Portfolio ✔✔✔✔✔ Transfer / RITC ✔ ✔ ✔ ✔ Scheme of Insurance Part VII Various, under Varies by Direct Claims Arrangement Business Transfer the ‘Change of Jurisdiction Transfer Transfer Control’ (limited to Directive certain states) 13

Non‐Life Run‐off Re‐Underwriting the Liabilities on Acquisitions Run‐off acquirers re‐underwrite risk with more information than the original underwriter: • Loss trends generally are known when liabilities are acquired and can be re‐underwritten • Claims have a degree of maturity and typically have more predictable payout patterns • Limited catastrophic or single event risk • By the time liabilities come to the legacy market, they may be reserved at multiples of the original planned loss ratio when the policy was first underwritten Professional run‐off acquirers, such as Enstar, will reset loss reserves (and reinsurance recoverables) upon acquisition. This is part of the acquisition due diligence process. Typically acquired reserves will be set equal to the ceding company, or else at a higher amount if the run‐off company’s actuaries think the ceding company has been under‐reserved. Traditionally, the legacy market has had less focus from the industry than the traditional (re)insurance market. Premier operators such as Enstar have efficient corporate structures and operating platforms that set them apart. 14

Non‐Life Run‐off Outlook: Economic Factors and Trends Our expectation is that a number of insurance and global economic factors and trends will continue to support an active market for run‐off transactions: Prolonged Low Solvency II & Capital Brexit Interest Rate Reserve Releases Efficiency Environment Declining Business Transfer Increased Major Cat Loss Legislation Consolidation 15
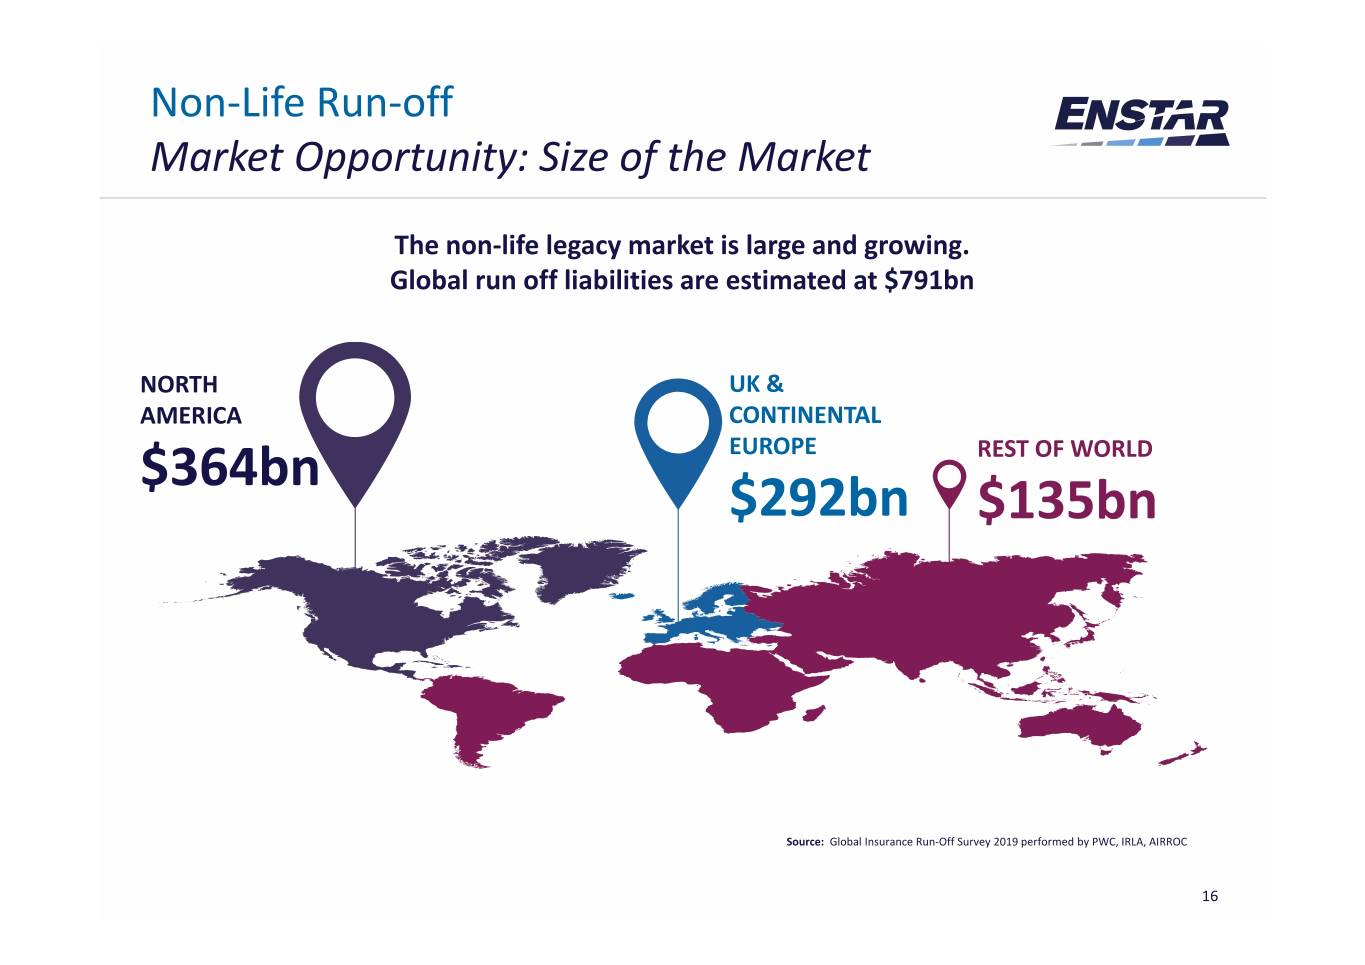
Non‐Life Run‐off Market Opportunity: Size of the Market The non‐life legacy market is large and growing. Global run off liabilities are estimated at $791bn NORTH UK & AMERICA CONTINENTAL $364bn EUROPE REST OF WORLD $292bn $135bn Source: Global Insurance Run‐Off Survey 2019 performed by PWC, IRLA, AIRROC 16
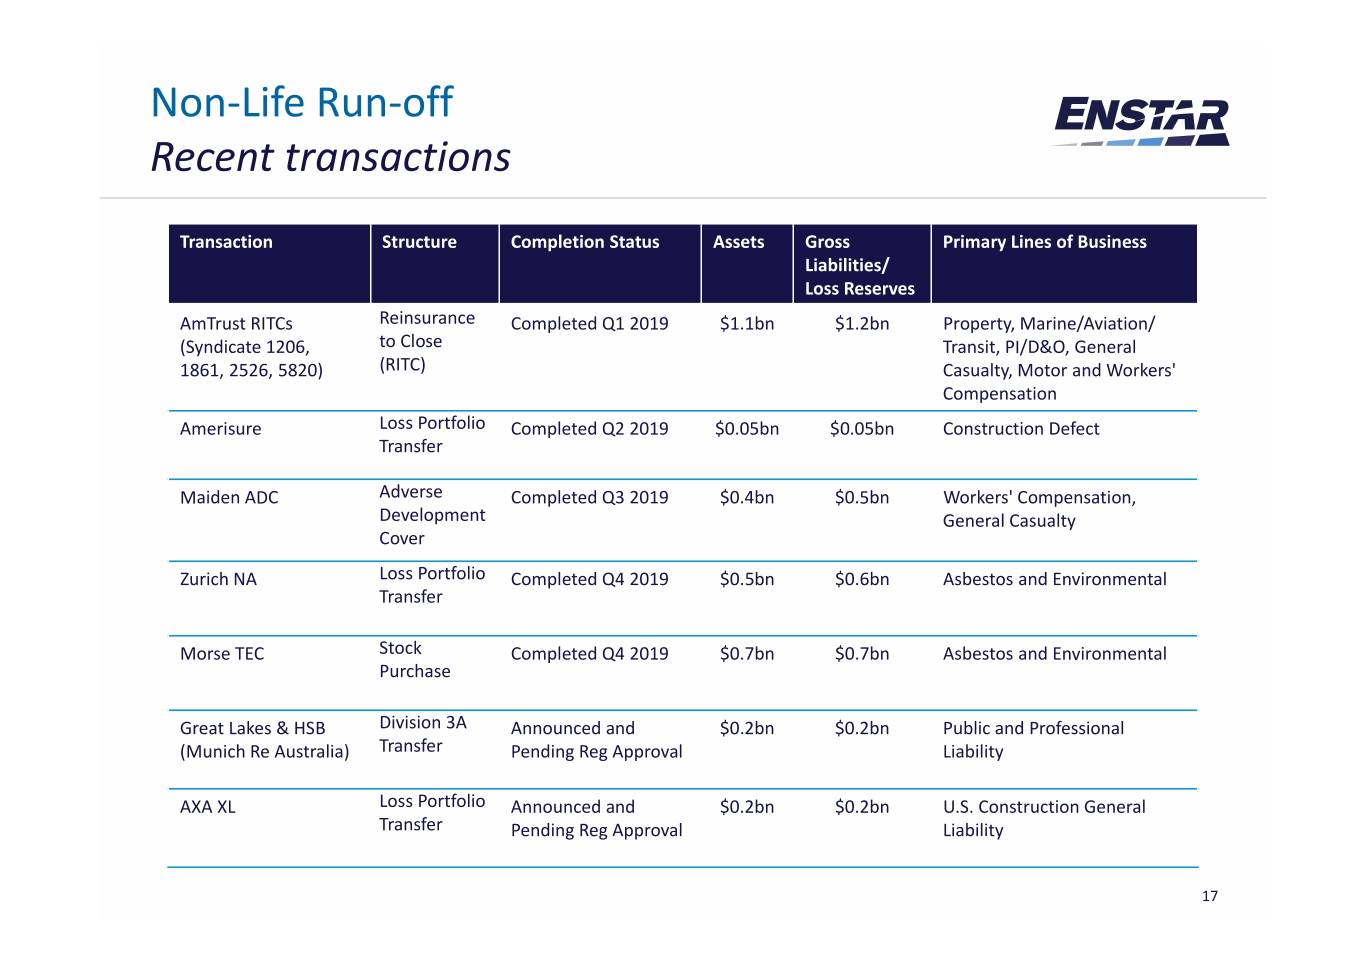
Non‐Life Run‐off Recent transactions Transaction Structure Completion Status Assets Gross Primary Lines of Business Liabilities/ Loss Reserves AmTrust RITCs Reinsurance Completed Q1 2019 $1.1bn $1.2bn Property, Marine/Aviation/ (Syndicate 1206, to Close Transit, PI/D&O, General 1861, 2526, 5820) (RITC) Casualty, Motor and Workers' Compensation Amerisure Loss Portfolio Completed Q2 2019 $0.05bn $0.05bn Construction Defect Transfer Maiden ADC Adverse Completed Q3 2019 $0.4bn $0.5bn Workers' Compensation, Development General Casualty Cover Zurich NA Loss Portfolio Completed Q4 2019 $0.5bn $0.6bn Asbestos and Environmental Transfer Morse TEC Stock Completed Q4 2019 $0.7bn $0.7bn Asbestos and Environmental Purchase Great Lakes & HSB Division 3A Announced and $0.2bn $0.2bn Public and Professional (Munich Re Australia) Transfer Pending Reg Approval Liability AXA XL Loss Portfolio Announced and $0.2bn $0.2bn U.S. Construction General Transfer Pending Reg Approval Liability 17

Non‐Life Run‐off Illustrative Economics of a Run‐off Transaction Settling claims for a lower amount than the claims were purchased for and redeploying released capital We model a range of Internal Rate of Returns (IRR) for every transaction in our pipeline Settling claims faster than the original claims payment pattern, thereby incurring lower ultimate claims handling costs Each transaction is bespoke, tailored to achieve both the de‐risking strategies of Investing the “float”/premium that we are the seller and Enstar’s return paid to assume the liabilities expectations Leveraging our efficient global operating platform 18

Non‐Life Run‐off Enstar’s Record of Effective Liability Management For most insurance companies, claims experience is an expense item For Enstar’s non‐life run‐off business, claims experience generates core earnings Non‐life Run‐off: Reduction in Net Ultimate Losses (prior period) $450 $400 $428 $350 $300 $286 $250 $278 $248 $236 $243 $200 $218 $215 $220 $196 $150 $100 $50 $0 2010 2011 2012 2013 2014 2015 2016 2017 2018 2019 Average Annual Net Reserve Savings of $250m (most recent 10 years)1 1 Reduction in Net Ultimate Losses (prior period), also referred to as “Reserve Savings” above, is a component of Net Incurred Losses and LAE in our Non‐Life Run‐off segment. Please refer to the Appendix for a reconciliation. 19

Non‐Life Run‐off Claims Consultancy and Advisory Insurance & Reinsurance Proactive Management Managed Care Audit & Consultancy Strategies Services Established in 1999, Cranmore is a Managing Third Party Established in 2000, acquired specialist insurance and reinsurance Administrators (TPAs) in 2013 SeaBright transaction consultancy group Loss cost mitigation programs Provider of medical bill review, Provides due diligence to Enstar’s utilization review, physician case Mergers & Acquisitions team Comprehensive quality management and related services assurance program Talent resource for ad‐hoc projects Servicing $2bn of Enstar’s and oversight of existing portfolios workers’ compensation reserves and liability management Enstar Group paid net claims of $1.9 billion to policyholders during 2019 20

Active Underwriting Overview Gross Written Premiums by Product 2019 Gross Written Premiums by Product 2019 8% 13% Binding Authorities Casualty 13% Marine, Aviation and Marine 11% Transit 39% 41% $917.6m Property Reinsurance 13% $192.4m Corporate member Workers' 9% (25% of S609) Accident and Health Compensation Aerospace Non‐Marine Direct and 27% 26% Facultative Acquired April 2014 Acquired November 2013 • Global specialty insurer • Managing agency for Lloyd’s Syndicate 609 • AM Best A‐ (Excellent) rated, stable outlook (£525m capacity for 2020) • Valued insurance portal and European distribution • Provides diverse specialty insurance offerings network • Disciplined underwriting approach • 90.6% combined ratio for 2019 • 47.1% loss ratio for 2019 21

Active Underwriting StarStone: Recent Developments StarStone Recent Developments • Strengthened management team in late 2018 • Shareholders provided strong support through 2018 and 2019 • In early 2019, the underwriting portfolio was segmented into Continuing and Discontinued Lines 2019 Results 2018 Results • Underwriting actions taken at StarStone Group: Net COR 103% 119% • 25% GWP Reduction during 2019 (Discontinued Lines), Continuing Lines mostly in Construction, Aviation, Property • Certain smaller offices closed (Australia, Hong Kong, Dubai) Discontinued • Line sizes decreased on certain accounts Lines COR 169% 143% • Reinsurance program restructured • Strengthened U.S. casualty reserving and loss picks StarStone Group Post‐tax loss ($11m) ($121m) • Refreshed group underwriting framework narrowed • Implemented additional underwriting performance measures Profit (Loss) ($100.7m) ($158.6m) • Enhanced ERM Framework before tax Segment • In 2020, we are seeing improving rates across most lines The “StarStone segment" differs from the StarStone Group because it represents only Enstar's 59.1% share of StarStone's results and includes StarStone's internal reinsurance • New business opportunities are being evaluated across arrangements with Enstar companies related to discontinued lines and classes of business. all locations 22

Active Underwriting Atrium: Top Tier Lloyd’s Underwriting Atrium is a long established leading specialist insurance and reinsurance business, underwriting through Syndicate 609 at Lloyds. • Acquired in November 2013; Atrium has a 2019 Results 2018 Results history dating back to the 1930’s • Provides diverse speciality insurance Profit £72.3m £30.0m offerings • Disciplined underwriting approach Combined 90.6% 93.3% • Consistent top quartile profitable Ratio performance within Lloyd’s market Syndicate • Atrium provides ~25% of the capital for GWP £590.7m £503.0m Syndicate 609, with the other 75% being provided by traditional Lloyd’s names Investment • As well as receiving full economics on the return 3.7% 1.0% 25% share of the Syndicate, Atrium receives fees and profit commission Profit income on managing the 75% share before tax $24.6m $19.0m Segment Syndicate 609 figures and combined ratio reported at syndicate level in GBP (£) after tax. Segment result figures reported on US ($) GAAP basis, before tax expense of $4.0m and $3.7m and net earnings attributable to noncontrolling interest of $8.4m and $6.3m for the year ended December 31 , 2019 and 2018, respectively. 23

Investments Overview Enstar maintains a high‐quality, duration‐matched portfolio that emphasizes on the preservation of capital, liquidity and prudent diversification of portfolio assets Portfolio Metrics 2019 2018 Credit Quality (Fixed income) A+ A+ Duration (Fixed income and Cash) 4.76 4.86 Leverage (Investments / Equity) 2.7 2.9 Other investments / Equity % 74% 65% Investment Portfolio Change YoY $ thousands 2019 2018 Change Fixed income increased YoY due to Non‐ life Run‐off acquisitions and cash deployed Fixed income investments1 $ 9,627,095 $ 8,712,672 $ 914,423 to investments, partially offset by paid Other investments: claims Equities, at fair value 729,721 367,125 362,596 Other investments increased primarily Other investments 2,524,420 1,957,757 566,663 due to Maiden ADC transition, unrealized Equity method investments 326,277 204,507 121,770 gains in 2019 and additional strategic investments Subtotal, other investments $ 3,580,418 $ 2,529,389 $ 1,051,029 Total investments $ 13,207,513 $ 11,242,061 $ 1,965,452 1Fixed income investments include Short‐term, Trading, Available‐for‐Sale and Managed Funds held. 24

Investments Portfolio composition $14.7bn 4.8yrs A+ 2.8% Total Investments Average Duration Average Credit Rating Book Yield Investment Portfolio Composition by Asset Class Equities & Fixed Income, Trading and AFS Alternatives other 72.8% 19.1% 8.1% Fixed Income, Trading and AFS Alternatives U.S. Government & Agency 5.6% Private equity 2.5% U.K. Government 1.2% Fixed income funds 3.6% Other Government 5.3% Hedge funds 8.5% Corporate 43.1% Equity funds 3.1% Municipal 1.3% CLO equities 0.7% Residential Mortgage‐backed 3.6% CLO equity fund 0.7% Commercial Mortgage‐backed 6.8% Total 19.1% Asset‐backed 5.9% Total 72.8% * Fair Value as of December 31, 2019 25

Investments Strategic Investments We have selectively invested our capital in these businesses for longer‐term returns or capabilities that may be complementary to our business. Enhanzed Re ‐ Joint venture between Enstar, Allianz SE and Hillhouse Capital Management, Ltd. Enhanzed Re will reinsure life, non‐life run‐off, and P&C insurance Enhanzed Re $183m business. Enhanzed Re intends to write business sourced from Allianz SE and Enstar by maximizing diversification by risk and geography. AmTrust Investment ‐ Invested $225.9 million in an 8.5% interest in a privatized AmTrust, AmTrust $240m alongside our long‐time partner Stone Point Capital, whose funds own 21.8%. Eagle Point Income Company invests primarily in junior debt tranches of CLOs, to generate high current income, with secondary objective to generate capital appreciation. In addition, Eagle Point $70m they may invest up to 20% of assets in CLO equity securities and related securities. It is a traded on the New York Stock Exchange under the symbol “EIC”. Monument Re is a Bermuda based reinsurer, focused on annuity, guaranteed savings or protection product lines, with a proven track‐record of successfully acquiring and Monument Re $61m operating portfolios or direct insurers in Europe, primarily those in run‐off. Citco is the world’s largest administrator of services to alternative asset managers, with $1 trillion in assets under administration and 7,000 staff in 60 offices globally. Citco Citco $52m provides fund services, governance services, and treasury & lending services to its global clients. Mitchell provides technology, connectivity, and information solutions to simplify and Mitchell $25m accelerate claims management and auto collision repair processes through technology solutions, networks, and partners in the P&C industry. * Carrying value as of December 31, 2019. 26

Capital Management Capital, Liquidity & Leverage We invest funds from self‐generated capital and borrowed financing to pursue strategic growth opportunities • Total capital under management of $6.5 billion as of December 31, 2019 • Strong Capital Base Group holds capital for regulated insurers based at or in excess of the local regulatory requirement • Excess capital in our subsidiaries is available to be distributed to Enstar Group Limited through dividends; strong track record of achieving dividends for funds in excess of required capital levels Commitment to • “BBB” (stable outlook) S&P Issuer Credit Rating for Enstar Group Limited Investment Grade • “BBB‐” (stable outlook) Fitch Issuer Credit Rating for Enstar Group Limited Ratings • Debt to total capital ratio of 19.7% as of December 31, 20191 Manageable Maturity • Revolving credit facility of $600 million (with $0.0 million drawn as of December 31, 2019) Profile and Strong • Senior Notes due 2022 ‐ $350 million and Senior Notes due 2029 ‐ $500 million Liquidity Position • Term loan due 2021 ‐ $349 million • Profitable track record of reserve releases since inception Solid Reserve Position • Diversified loss reserves • Paying over $1 billion of non‐life run‐off claims per annum High‐Quality, Highly • Total cash and investments of $14.7 billion as of December 31, 2019 Liquid Investment Portfolio • Average Investment Portfolio Credit Rating of “A+” 1Total Capital in the Debt/Capital ratio includes shareholders equity and debt obligations, but excludes noncontrolling interest and redeemable noncontrolling interest 27
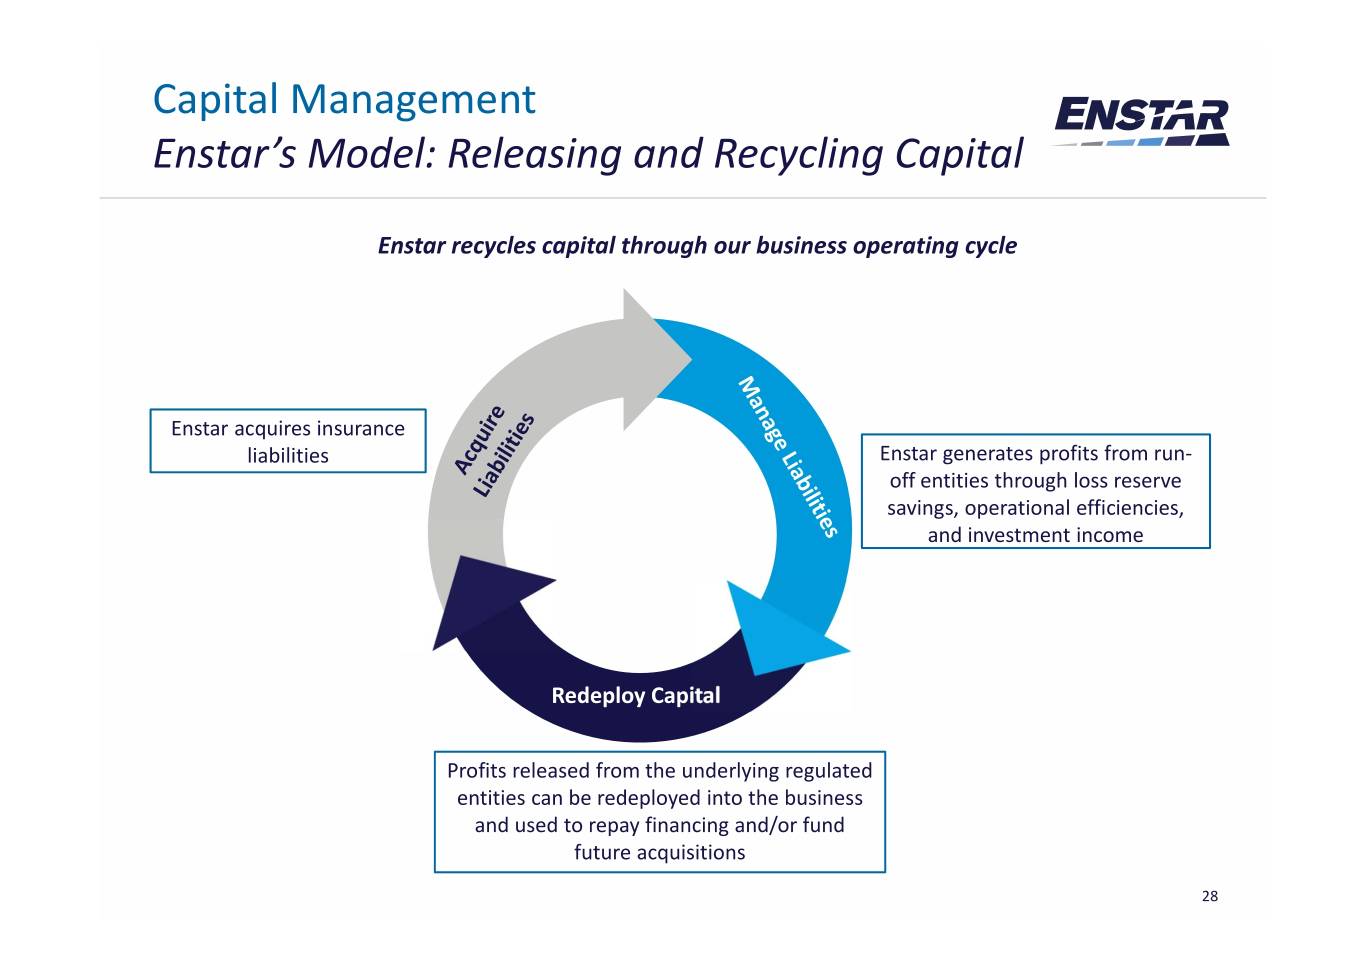
Capital Management Enstar’s Model: Releasing and Recycling Capital Enstar recycles capital through our business operating cycle Enstar acquires insurance liabilities Enstar generates profits from run‐ off entities through loss reserve savings, operational efficiencies, and investment income Redeploy Capital Profits released from the underlying regulated entities can be redeployed into the business and used to repay financing and/or fund future acquisitions 28
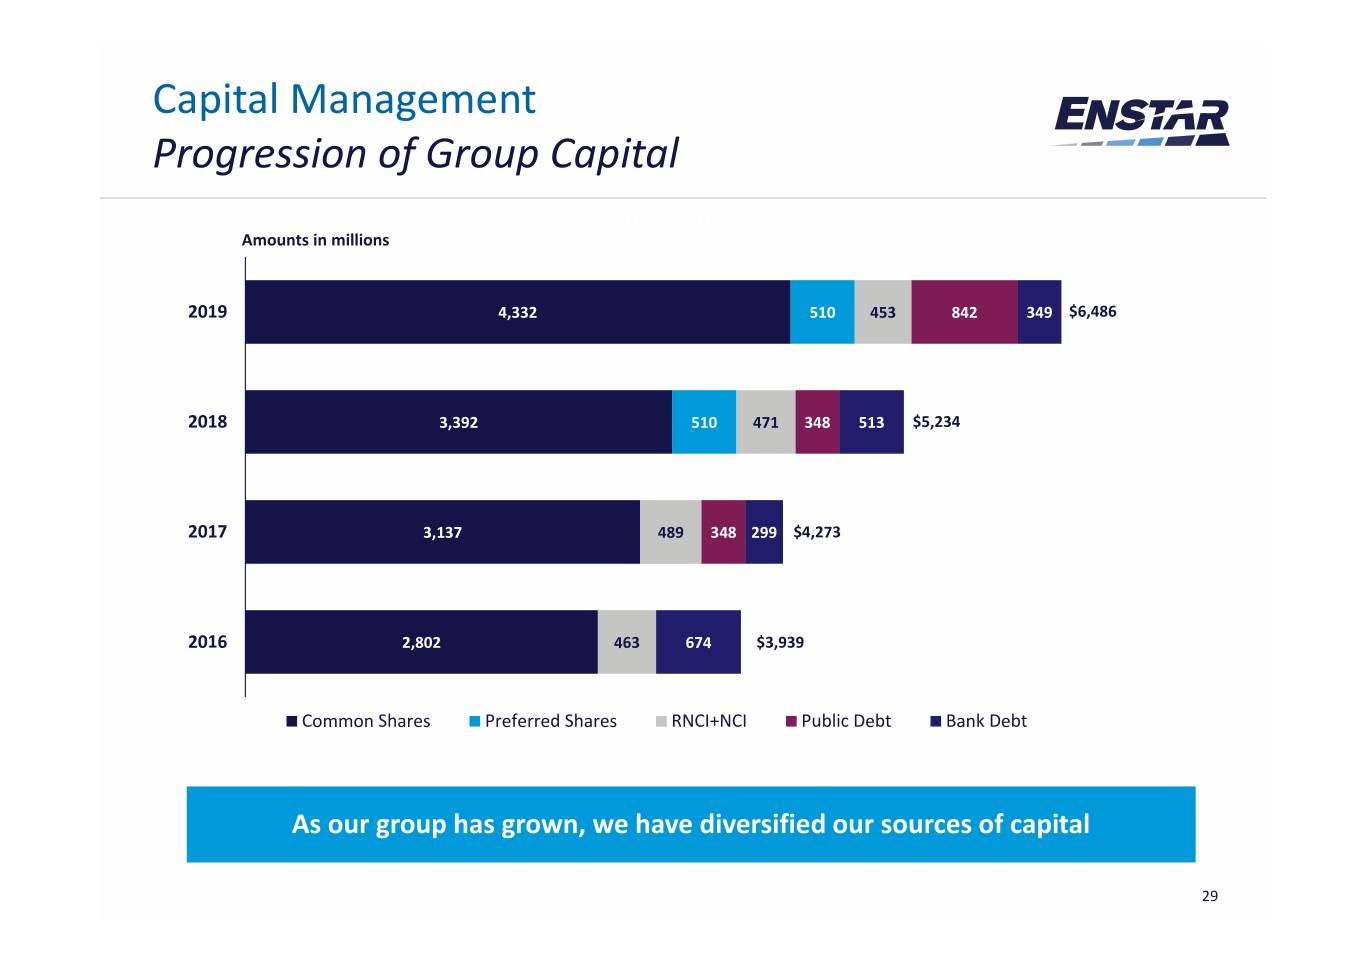
Capital Management Progression of Group Capital Chart Title Amounts in millions 2019 4,332 510 453 842 349 $6,486 2018 3,392 510 471 348 513 $5,234 2017 3,137 489 348 299 $4,273 2016 2,802 463 674 $3,939 0Common Shares 1,000 2,000Preferred Shares 3,000RNCI+NCI 4,000Public Debt 5,000Bank Debt 6,000 7,000 As our group has grown, we have diversified our sources of capital 29

Management, Governance and Operations Our Executive Officers Dominic Silvester Paul O’Shea Orla Gregory Chief Executive Officer President, Co‐founder Chief Operating Officer & Co‐founder Years at Enstar: 24 Years at Enstar: 24 Years at Enstar: 16 Industry Experience: 25+ years Industry Experience: 25+ years Industry Experience: 20+ years Age: 59 Age: 62 Age: 45 Guy Bowker Paul Brockman David Atkins Chief Financial Officer President & CEO, Enstar Europe CEO, Enstar US Years at Enstar: 5 Years at Enstar: 7 Years at Enstar: 16 Industry Experience: 20+ years Industry Experience: 25+ years Industry Experience: 20+ years Age: 42 Age: 47 Age: 45 Nazar Alobaidat John Hendrickson Chief Investment Officer Director of Strategy & StarStone CEO Years at Enstar: 3 Years at Enstar: 1 year+ Industry Experience: 20+ years Industry Experience: 35+ years Age: 42 Age: 58 Average Industry Experience: 24+ years Collective Industry Experience: 190+ years Average Years at Enstar: 12+ years 30
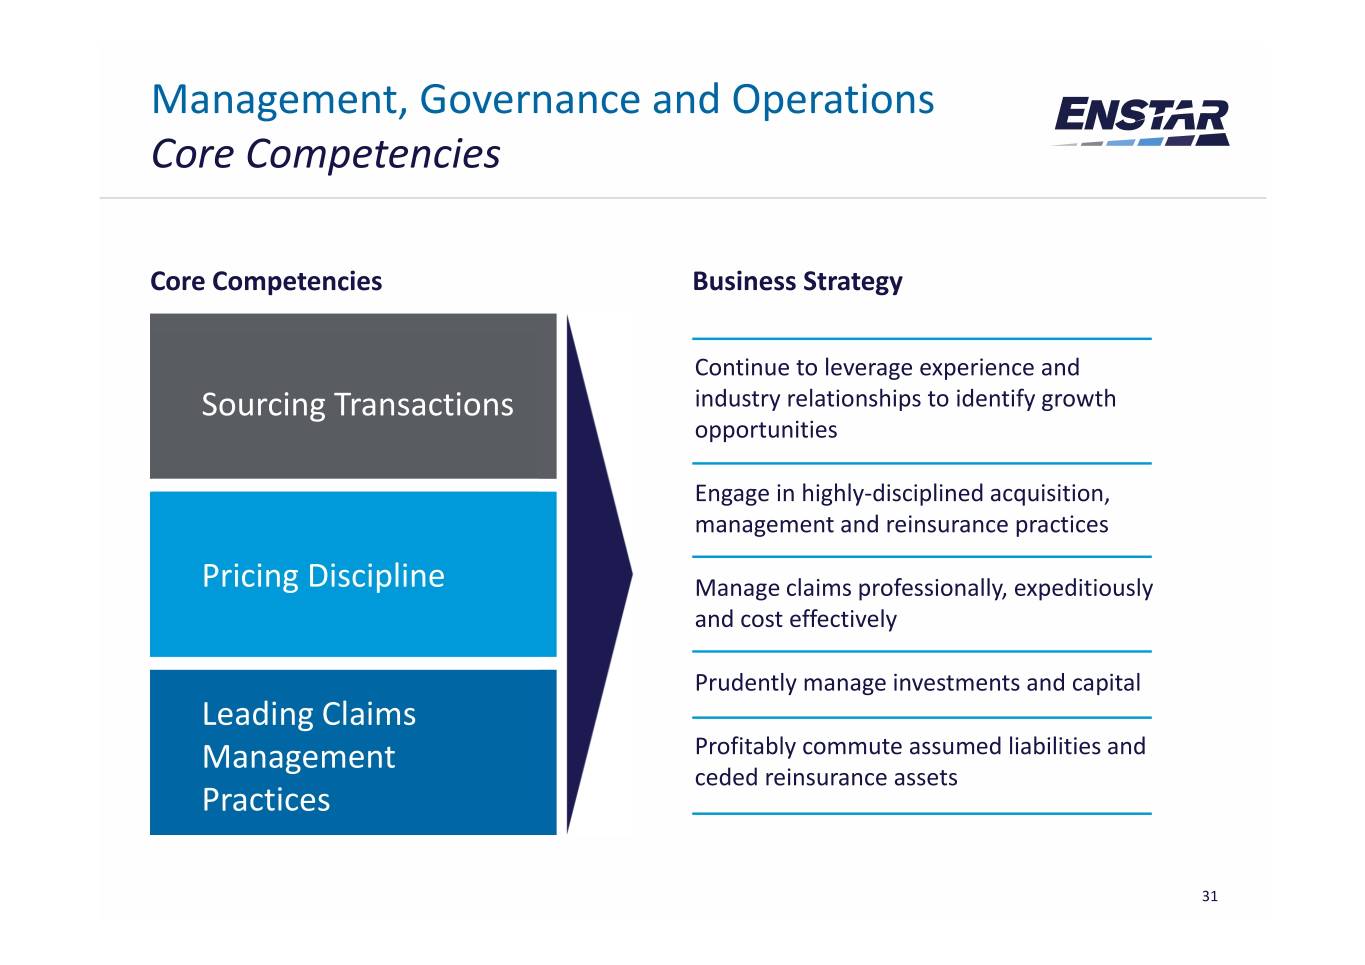
Management, Governance and Operations Core Competencies Core Competencies Business Strategy Continue to leverage experience and Sourcing Transactions industry relationships to identify growth opportunities Engage in highly‐disciplined acquisition, management and reinsurance practices Pricing Discipline Manage claims professionally, expeditiously and cost effectively Prudently manage investments and capital Leading Claims Management Profitably commute assumed liabilities and ceded reinsurance assets Practices 31

Management, Governance and Operations M&A Expertise and Due Diligence Appetite for Growth – Our objective is to continue to grow our run‐off business in order to provide an opportunity for future earnings and replenish our Price and reserves as they successfully run off Return Strategic Fit – We determine whether the transaction Operational Risk in line with, or complementary to, our capabilities, requirements (uncertainty & or whether it provides other long‐term competitive & synergies volatility) advantages Grow Due Diligence – We conduct significant due diligence to shareholder assess quality of the reserves, investment potential, and value to identify risks and other potential value‐detractors Regulatory & Reserves Capital (type, Pricing – We determine our pricing through our sufficiency, implications payout) proprietary modelling process and enter into negotiations with the seller Asset and Investment Patience & Discipline – We remain disciplined with a potential long‐term view. We are not driven to price based on more aggressive positions taken by competitors 32

Management, Governance and Operations Disciplined Claims Management Utilize effective claims management & commutation capabilities and strategies to settle liabilities Capabilities • Large team of dedicated professionals • Specialized by major claims type: workers compensation, asbestos, engineering, etc. • Wholly‐owned subsidiaries specializing in claims Acquires P&C companies or management portfolios in run‐off and manages the acquired businesses, generating profits Primary • Settling litigation (where appropriate) through loss reserve savings, Aims • Disciplined claims management handling operational efficiencies, and procedures investment income • Commuting policies with individual policyholders • Effective recovery of reinsurance assets Disciplined • Analyzes the acquired exposures and reinsurance Claims receivables on a policy‐by‐policy basis Highly selective underwriting process for Also manages third‐party Management • Claims handling guidelines along with claims potential acquisition run‐off portfolios through reporting and control procedures in all claims targets, focusing on service companies for units investigating risk fixed or incentive‐based exposures, claims fees Commuting • Commutation refers to the one‐time settlement practices, reserve Policies requirements and of all liabilities under the policies written by the outstanding claims acquired company • Primarily relates to reinsurance contracts or policy buy‐backs from direct insureds 33
Appendix 34

Financial Historical Data Summary Income Statement December 31 2014 2015 2016 2017 2018 2019 $ millions Net premiums earned $ 543.0 $ 753.7 $ 823.5 $ 613.1 $ 895.6 $ 1,154.9 Fees & commission income 34.9 39.3 39.4 66.1 35.1 28.5 Net investment income 66.0 122.6 185.5 208.8 270.7 321.3 Net realized and unrealized gains (losses) 52.0 (41.5) 77.8 190.3 (412.9) 1,031.4 Net incurred losses and LAE liabilities (9.1) (104.3) (174.1) (193.6) (454.0) (872.6) Acquisition costs (117.5) (163.7) (186.6) (96.9) (192.8) (306.0) Interest expense (12.9) (19.4) (20.6) (28.1) (26.2) (52.5) General and administrative and other total expenses (334.7) (374.3) (452.4) (438.9) (327.7) (376.7) (net) Net earnings from continuing operations 221.7 212.4 292.5 320.8 (212.3) 928.2 Net earnings (loss) from discontinuing operations, net 5.5 (2.1) 11.9 11.0 — — of income tax expense Net earnings 227.2 210.3 304.4 331.8 (212.3) 928.2 Net earnings attributable to noncontrolling interest (13.5) 10.0 (39.6) (20.3) 62.1 9.9 Dividends on preferred shares — — — — 12.1 (35.9) Net earnings attributable to Enstar Group Limited $ 213.7 $ 220.3 $ 264.8 $ 311.5 $ (162.4) $ 902.2 * Prior periods have been reclassified to reflect discontinuing operations. Refer to Note 5 – “Divestitures, Held‐for‐Sale Businesses and Discontinuing Operations” in the notes of our Consolidated Financial Statements included within Item 8 of our Annual Report on Form 10‐K for the year ended 2019. 35

Financial Historical Data Summary Balance Sheet December 31 $ millions 2014 2015 2016 2017 2018 2019 Assets Investable assets1 6,392.4 7,728.7 8,733.1 10,143.3 12,545.9 14,672.0 Reinsurance balances recoverable 1,305.5 1,451.9 1,460.7 2,021.0 2,029.7 2,379.9 Other 2,239.0 2,591.9 2,671.9 1,442.0 1,980.7 2,311.4 Total Assets 9,936.9 11,772.5 12,865.7 13,606.4 16,556.3 19,363.3 Liabilities Losses and loss adjustment expense 4,518.4 5,846.5 6,100.0 7,515.3 9,514.6 10,429.0 Defendant asbestos and environmental liabilities — — 234.0 219.2 203.3 847.7 Debt obligations 320.0 599.8 673.6 646.7 861.5 1,191.2 Other 2,201.0 2,387.8 2,592.8 1,599.7 1,604.3 1600.3 Total Liabilities 7,039.4 8,834.1 9,600.4 9,980.9 12,183.7 14,068.2 Redeemable noncontrolling interest (“RNCI”) 374.6 417.7 454.5 479.6 458.5 438.8 Enstar Group Limited Shareholders’ Equity 2,304.9 2,516.9 2,802.3 3,136.7 3,901.9 4,842.2 Noncontrolling Interest 218.0 3.9 8.5 9.3 12.1 14.2 Total 2,522.8 2,520.8 2,810.8 3,145.9 3,914.0 4,856.4 Total Liabilities, RNCI & Shareholders’ Equity 9,936.9 11,772.5 12,865.7 13,606.4 16,556.3 19,363.3 1 Investable assets include total investments, funds held by reinsured companies, cash and cash equivalents and restricted cash and cash equivalents. 36

Financial Historical Data Reconciliation of Non‐GAAP Financial Measures Non‐GAAP operating income (loss) attributable to Enstar Group Limited ordinary shareholders is calculated by the addition or subtraction of certain items from within our consolidated statements of earnings to or from net earnings (loss) attributable to Enstar Group Limited ordinary shareholders, the most directly comparable GAAP financial measure, as illustrated in the table below: December 31, 2019 December 31, 2018 (expressed in thousands of U.S. dollars, except share and per share data) Net earnings (loss) attributable to Enstar Group Limited ordinary shareholders $ 902,175 $ (162,354) Adjustments: Net realized and unrealized (gains) losses on fixed maturity investments and funds held ‐ (534,730) 243,093 directly managed (1) Change in fair value of insurance contracts for which we have elected the fair value option 117,181 6,664 Tax effects of adjustments (2) 51,102 (16,588) Adjustments attributable to noncontrolling interest (3) 17,689 (9,166) Non‐GAAP operating income (loss) attributable to Enstar Group Limited ordinary shareholders (4) $ 553,417 $ 61,649 Diluted net earnings (loss) per ordinary share $ 41.43 $ (7.84) Adjustments: Net realized and unrealized (gains) losses on fixed maturity investments and funds held ‐ (24.55) 11.70 directly managed (1) Change in fair value of insurance contracts for which we have elected the fair value option 5.38 0.32 Tax effects of adjustments (2) 2.35 (0.79) Adjustments attributable to noncontrolling interest (3) 0.81 (0.44) Diluted non‐GAAP operating income (loss) per ordinary share (4) $ 25.42 $ 2.95 Weighted average ordinary shares outstanding ‐ diluted 21,775,066 20,904,176 (1) Represents the net realized and unrealized gains and losses related to fixed maturity securities. Our fixed maturity securities are held directly on our balance sheet and also within the "Funds held ‐ directly managed“ balance. The changes in the value of these managed funds held balances are described in our financial statement notes as: (i) funds held ‐ directly managed, (ii) embedded derivative on funds held ‐ directly managed, and (iii) the fair value option on funds held ‐ directly managed. Refer to (i) Note 3 ‐ "Investments" in the notes to our consolidated financial statements included within Item 1 of our Quarterly Report on Form 10‐Q or (ii) Note 6 ‐ "Investments" in the notes to our consolidated financial statements included within Item 8 of our Annual Report on Form 10‐K for further details on our net realized and unrealized gains and losses. (2) Represents an aggregation of the tax expense or benefit associated with the specific country to which the pre‐tax adjustment relates, calculated at the applicable jurisdictional tax rate. (3) Represents the impact of the adjustments on the net earnings (loss) attributable to noncontrolling interest associated with the specific subsidiaries to which the adjustments relate. (4)Non‐GAAP financial measure. 37

Financial Historical Data Reconciliation of Net Favorable Loss Reserve Development December 31 $ millions Notes 2010 2011 2012 2013 2014 2015 2016 2017 2018 2019 Assets Net incurred Losses (311,834) (293,461) (237,953) (182,975) (264,711) (270,830) (285,881) (190,674) (306,067) 51,625 (per NLRO income statement) Add‐back: Change in provisions for bad debt 1 (49,556) (42,822) (3,111) 1,999 (7,700) (25,271) (13,822) (1,536) — — Change in provisions for unallocated LAE 2 (39,651) (45,102) (39,298) (49,580) (49,445) (62,653) (44,190) (54,071) (65,401) (57,844) Amortization of deferred charges 3 ——————168,827 14,359 13,781 38,627 Amortization of fair value adjustments 4 55,438 42,693 22,572 5,947 3,982 19,908 25,432 10,114 12,877 50,070 Changes in fair value ‐ fair value option 5 ———————30,256 6,664 117,181 Net incurred losses ‐ current period 6 — — — 74,139 24,235 39,924 5,829 5,866 12,451 123,559 Reduction in net ultimate losses ‐ prior period (278,065) (248,230) (218,116) (215,480) (235,783) (242,738) (427,957) (195,662) (286,439) (219,968) Notes: 1. Change in bad debt relates to the release of a bad debt provision for a collection that we had previously provided against. 2. Change in ULAE relates to the lifetime claims handling provision being amortized for paid claims and incurred development. This is partially offset in P&L by the claims handling costs including within the G&A line. 3. Deferred charges are recognized when the premium for a deal is less than the loss reserves. As the deferred charge is amortized, it is offset by net investment income in the P&L. 4. Amortization of fair value adjustments: when we acquire a company we fair value the loss reserves. The discount and risk margin are amortized over the lifetime of the claims pattern. 5. For certain deals (RSA, QBE, Novae, Neon) we elected to measure the liabilities at fair value. This line represents the change in fair value. Day 1 fair value adjustments are amortized over the lifetime of the claims. This line also includes the quarterly revaluations of the liability, mostly due to interest rate change. The changes in the interest rate assumption are generally offset by unrealized gains (losses) on our fixed income portfolio. 6. Current period incurred losses relate to the release of acquired unearned premium, so there is generally no significant P&L impact as this amount is largely offset by premiums earned. 38

Thank you Please send any enquiries to communications@enstargroup.com 39 |enstargroup.com Property of Enstar Group Limited – Not for Distribution