
Enstargroup.com Enstargroup.com Realising Value Investor Financial Supplement September 30, 2023 ENSTAR GROUP LIMITED
| enstargroup.com 2 Table of Contents Page Explanatory Notes 3 Financial Highlights 5 Consolidated Results by Segment 6 Capital Position & Credit Ratings 10 Non-GAAP Measures 11 Reconciliation to Adjusted Book Value per Share 13 Reconciliation to Adjusted Return on Equity 14 Reconciliation to Adjusted Run-off Liability Earnings 16 Reconciliation to Adjusted Total Investment Return 18 Investment Composition 20
| enstargroup.com 3 Explanatory Notes About Enstar Enstar is a NASDAQ-listed leading global (re)insurance group that offers capital release solutions through its network of group companies in Bermuda, the United States, the United Kingdom, Continental Europe and Australia. A market leader in completing legacy acquisitions, Enstar has acquired over 115 companies and portfolios since its formation. For further information about Enstar, see www.enstargroup.com. Basis of Presentation In this Investor Financial Supplement, the terms "we," "us," "our," "Enstar," or "the Company" refer to Enstar Group Limited and its consolidated subsidiaries. All information contained herein is unaudited. Unless otherwise noted, amounts are in millions of U.S. Dollars, except for share and per share amounts. This Investor Financial Supplement is being provided for informational purposes only. It should be read in conjunction with documents filed by Enstar with the U.S. Securities and Exchange Commission, including its Annual Reports on Form 10-K and its Quarterly Reports on Form 10-Q. Non-GAAP Financial Measures In addition to our key financial measures presented in accordance with GAAP, we present other non-GAAP financial measures that we use to manage our business, compare our performance against prior periods and against our peers, and as performance measures in our incentive compensation program. These non-GAAP financial measures provide an additional view of our operational performance over the long-term and provide the opportunity to analyze our results in a way that is more aligned with the manner in which our management measures our underlying performance. The presentation of these non-GAAP financial measures, which may be defined and calculated differently by other companies, is used to enhance the understanding of certain aspects of our financial performance. It is not meant to be considered in isolation, superior to, or as a substitute for the directly comparable financial measures prepared in accordance with GAAP. Some of the adjustments reflected in our non-GAAP measures are recurring items, such as the exclusion of adjustments to net realized and unrealized (gains)/losses on fixed income securities recognized in our income statement, the fair value of certain of our loss reserve liabilities for which we have elected the fair value option, and the amortization of fair value adjustments. Management makes these adjustments in assessing our performance so that the changes in fair value due to interest rate movements, which are applied to some but not all of our assets and liabilities as a result of preexisting accounting elections, do not impair comparability across reporting periods. It is important for the readers of our periodic filings to understand that these items will recur from period to period. However, we exclude these items for the purpose of presenting a comparable view across reporting periods of the impact of our underlying claims management and investments without the effect of interest rate fluctuations on assets that we anticipate to hold to maturity and non-cash changes to the fair value of our reserves. Similarly, our non-GAAP measures reflect the exclusion of certain items that we deem to be nonrecurring, unusual or infrequent when the nature of the charge or gain is such that it is not reasonably likely that such item may recur within two years, nor was there a similar charge or gain in the preceding two years. This includes adjustments related to bargain purchase gains on acquisitions of businesses, net gains or losses on sales of subsidiaries, net assets of held for sale or disposed subsidiaries classified as discontinued operations, and other items that we separately disclose. Refer to pages 11 to 19 for further details.
4 Explanatory Notes (continued) Investment Composition In certain instances, U.S. GAAP requires, in part, that invested assets be classified based upon the legal form of the investment which may not correspond to management’s view of the underlying economic exposure. For example: 1. Enstar has certain investments in public shares of exchange traded funds (“ETFs”) where the underlying exposure of the ETF is investment grade fixed income securities, and Enstar also has certain privately held equities which management evaluates based on the underlying economic exposures. U.S. GAAP requires that these investments be classified as “Equities”. 2. Enstar has certain private equity funds that are collectively held in a limited partnership, which management evaluates based on the nature of the underlying investments within these funds. U.S. GAAP requires that the investment be classified as “Private equity funds” within “Other Investments”. Where relevant, we have disclosed the underlying economic exposure of our investments in order to be consistent with the manner in which management views the underlying portfolio composition. Refer to pages 20 and 21 for further details. Cautionary Statement This Investor Financial Supplement contains certain forward-looking statements within the meaning of the Private Securities Litigation Reform Act of 1995. These statements include statements regarding the intent, belief or current expectations of Enstar and its management team. Investors are cautioned that any such forward- looking statements speak only as of the date they are made, are not guarantees of future performance and involve risks and uncertainties, and that actual results may differ materially from those projected in the forward-looking statements as a result of various factors. Important risk factors regarding Enstar can be found under the heading "Risk Factors" in our Form 10-K for the year ended December 31, 2022 and are incorporated herein by reference. Furthermore, Enstar undertakes no obligation to update any written or oral forward-looking statements or publicly announce any updates or revisions to any of the forward-looking statements contained herein, to reflect any change in its expectations with regard thereto or any change in events, conditions, circumstances or assumptions underlying such statements, except as required by law.
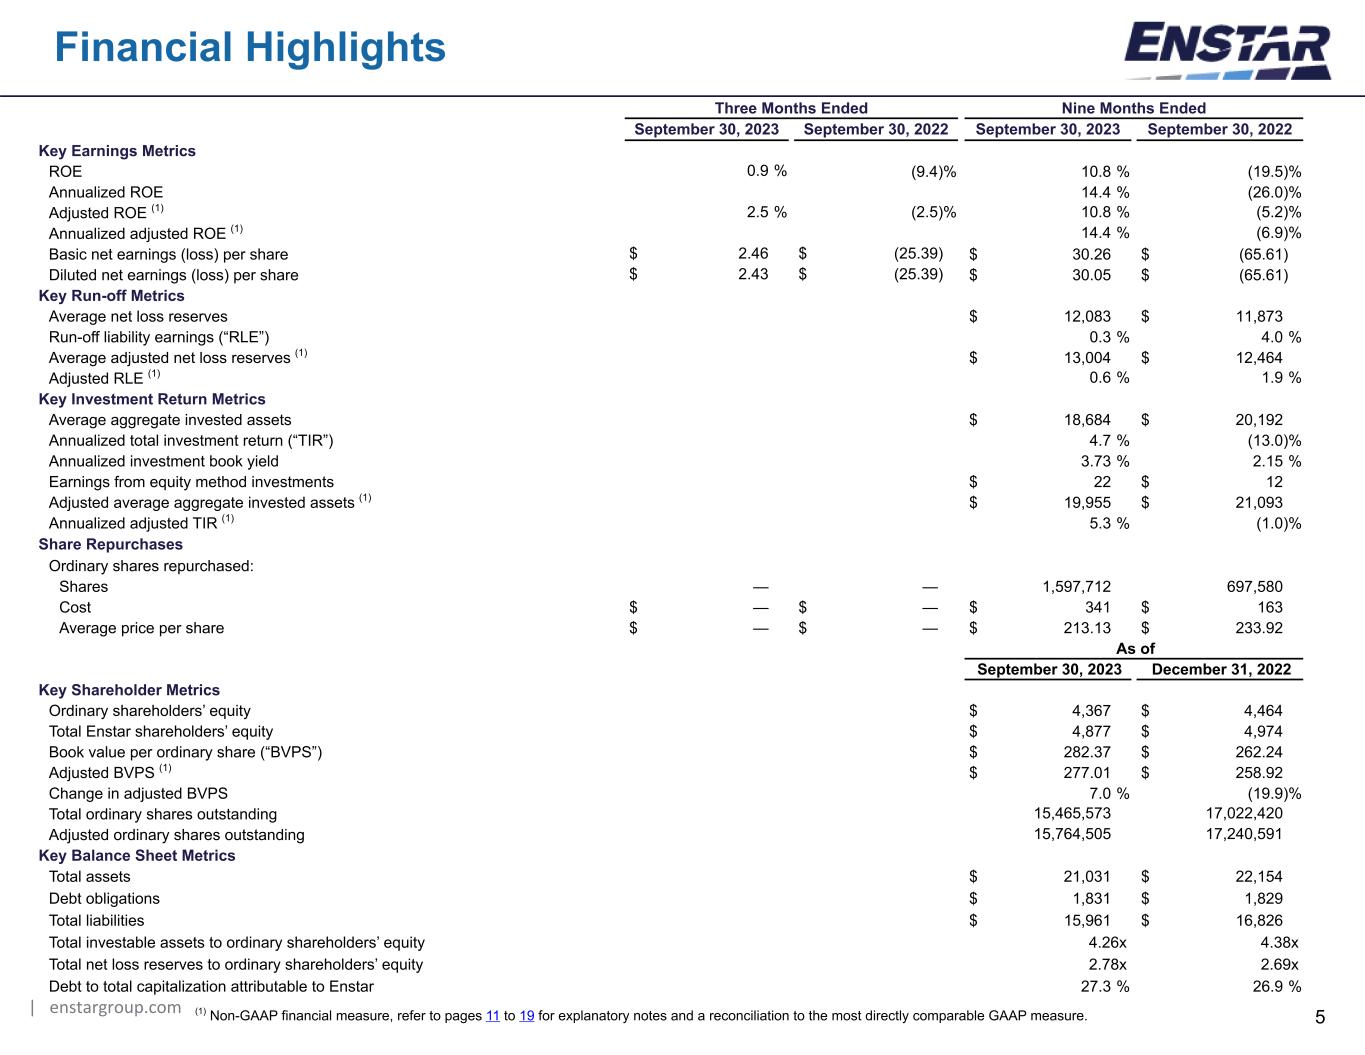
| enstargroup.com 5 Three Months Ended Nine Months Ended September 30, 2023 September 30, 2022 September 30, 2023 September 30, 2022 Key Earnings Metrics ROE 0.9 % (9.4) % 10.8 % (19.5) % Annualized ROE 14.4 % (26.0) % Adjusted ROE (1) 2.5 % (2.5) % 10.8 % (5.2) % Annualized adjusted ROE (1) 14.4 % (6.9) % Basic net earnings (loss) per share $ 2.46 $ (25.39) $ 30.26 $ (65.61) Diluted net earnings (loss) per share $ 2.43 $ (25.39) $ 30.05 $ (65.61) Key Run-off Metrics Average net loss reserves $ 12,083 $ 11,873 Run-off liability earnings (“RLE”) 0.3 % 4.0 % Average adjusted net loss reserves (1) $ 13,004 $ 12,464 Adjusted RLE (1) 0.6 % 1.9 % Key Investment Return Metrics Average aggregate invested assets $ 18,684 $ 20,192 Annualized total investment return (“TIR”) 4.7 % (13.0) % Annualized investment book yield 3.73 % 2.15 % Earnings from equity method investments $ 22 $ 12 Adjusted average aggregate invested assets (1) $ 19,955 $ 21,093 Annualized adjusted TIR (1) 5.3 % (1.0) % Share Repurchases Ordinary shares repurchased: Shares — — 1,597,712 697,580 Cost $ — $ — $ 341 $ 163 Average price per share $ — $ — $ 213.13 $ 233.92 As of September 30, 2023 December 31, 2022 Key Shareholder Metrics Ordinary shareholders’ equity $ 4,367 $ 4,464 Total Enstar shareholders’ equity $ 4,877 $ 4,974 Book value per ordinary share (“BVPS”) $ 282.37 $ 262.24 Adjusted BVPS (1) $ 277.01 $ 258.92 Change in adjusted BVPS 7.0 % (19.9) % Total ordinary shares outstanding 15,465,573 17,022,420 Adjusted ordinary shares outstanding 15,764,505 17,240,591 Key Balance Sheet Metrics Total assets $ 21,031 $ 22,154 Debt obligations $ 1,831 $ 1,829 Total liabilities $ 15,961 $ 16,826 Total investable assets to ordinary shareholders’ equity 4.26x 4.38x Total net loss reserves to ordinary shareholders’ equity 2.78x 2.69x Debt to total capitalization attributable to Enstar 27.3 % 26.9 % Financial Highlights (1) Non-GAAP financial measure, refer to pages 11 to 19 for explanatory notes and a reconciliation to the most directly comparable GAAP measure.
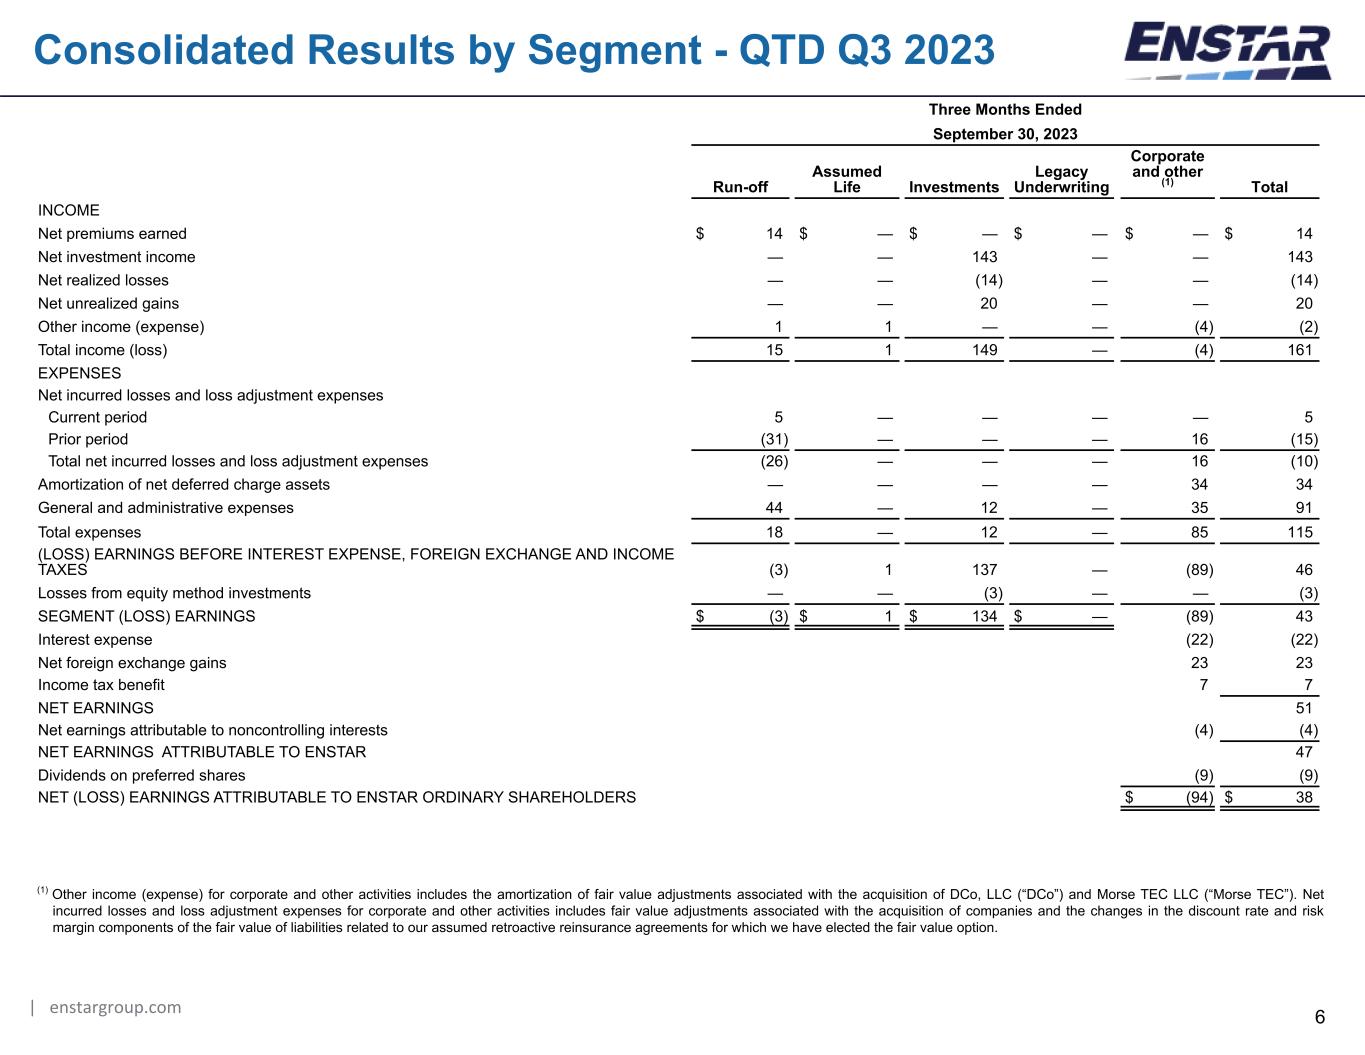
| enstargroup.com 6 Consolidated Results by Segment - QTD Q3 2023 Three Months Ended September 30, 2023 Run-off Assumed Life Investments Legacy Underwriting Corporate and other (1) Total INCOME Net premiums earned $ 14 $ — $ — $ — $ — $ 14 Net investment income — — 143 — — 143 Net realized losses — — (14) — — (14) Net unrealized gains — — 20 — — 20 Other income (expense) 1 1 — — (4) (2) Total income (loss) 15 1 149 — (4) 161 EXPENSES Net incurred losses and loss adjustment expenses Current period 5 — — — — 5 Prior period (31) — — — 16 (15) Total net incurred losses and loss adjustment expenses (26) — — — 16 (10) Amortization of net deferred charge assets — — — — 34 34 General and administrative expenses 44 — 12 — 35 91 Total expenses 18 — 12 — 85 115 (LOSS) EARNINGS BEFORE INTEREST EXPENSE, FOREIGN EXCHANGE AND INCOME TAXES (3) 1 137 — (89) 46 Losses from equity method investments — — (3) — — (3) SEGMENT (LOSS) EARNINGS $ (3) $ 1 $ 134 $ — (89) 43 Interest expense (22) (22) Net foreign exchange gains 23 23 Income tax benefit 7 7 NET EARNINGS 51 Net earnings attributable to noncontrolling interests (4) (4) NET EARNINGS ATTRIBUTABLE TO ENSTAR 47 Dividends on preferred shares (9) (9) NET (LOSS) EARNINGS ATTRIBUTABLE TO ENSTAR ORDINARY SHAREHOLDERS $ (94) $ 38 (1) Other income (expense) for corporate and other activities includes the amortization of fair value adjustments associated with the acquisition of DCo, LLC (“DCo”) and Morse TEC LLC (“Morse TEC”). Net incurred losses and loss adjustment expenses for corporate and other activities includes fair value adjustments associated with the acquisition of companies and the changes in the discount rate and risk margin components of the fair value of liabilities related to our assumed retroactive reinsurance agreements for which we have elected the fair value option.
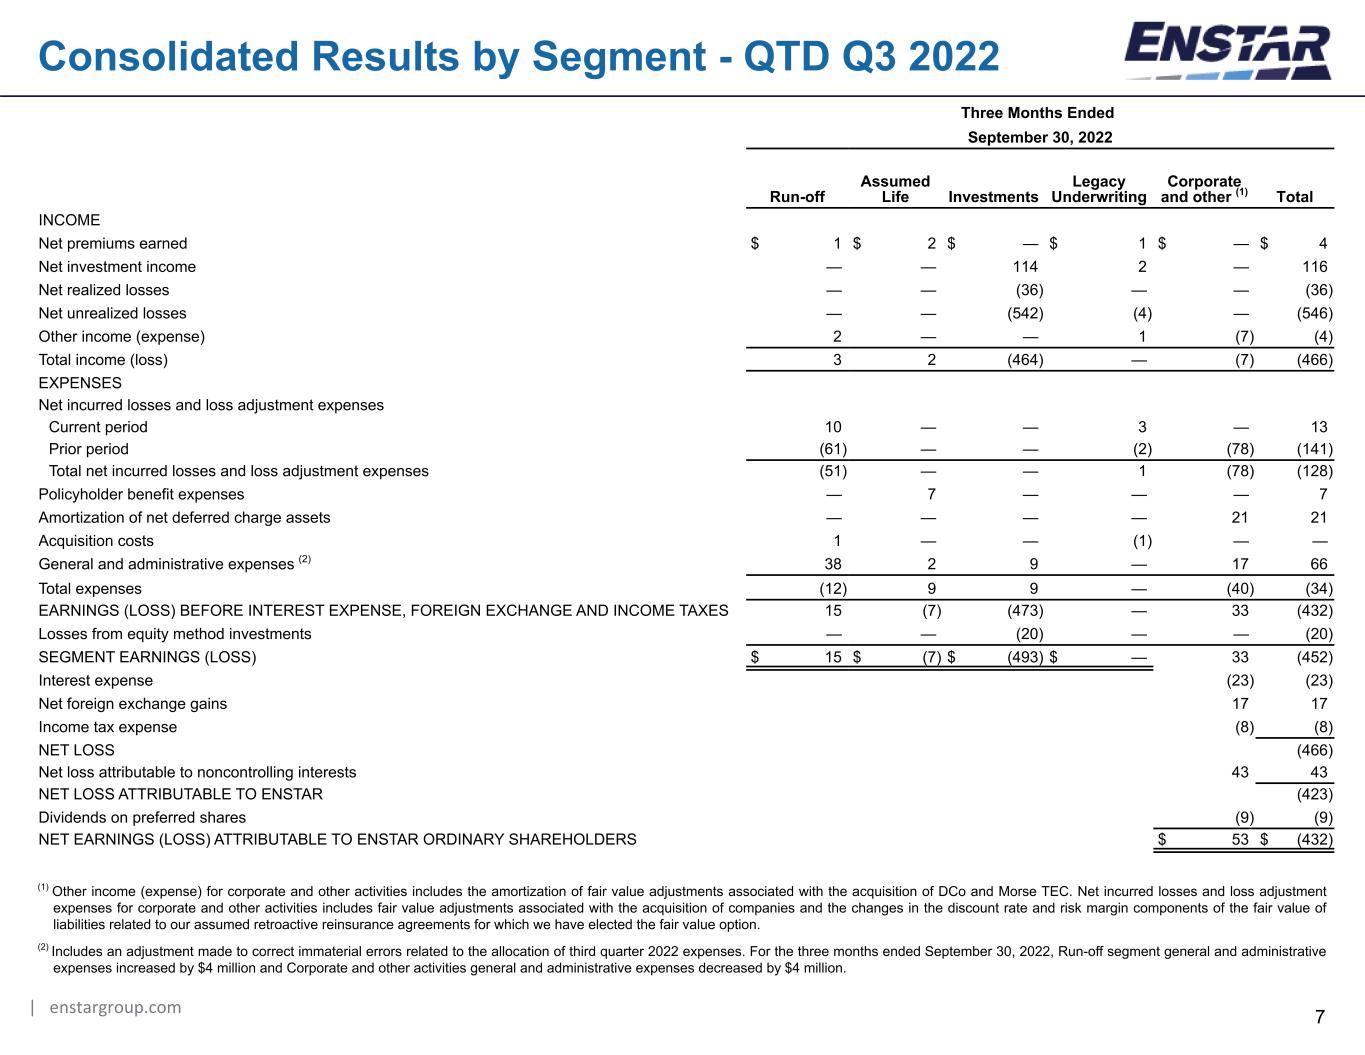
| enstargroup.com 7 Consolidated Results by Segment - QTD Q3 2022 Three Months Ended September 30, 2022 Run-off Assumed Life Investments Legacy Underwriting Corporate and other (1) Total INCOME Net premiums earned $ 1 $ 2 $ — $ 1 $ — $ 4 Net investment income — — 114 2 — 116 Net realized losses — — (36) — — (36) Net unrealized losses — — (542) (4) — (546) Other income (expense) 2 — — 1 (7) (4) Total income (loss) 3 2 (464) — (7) (466) EXPENSES Net incurred losses and loss adjustment expenses Current period 10 — — 3 — 13 Prior period (61) — — (2) (78) (141) Total net incurred losses and loss adjustment expenses (51) — — 1 (78) (128) Policyholder benefit expenses — 7 — — — 7 Amortization of net deferred charge assets — — — — 21 21 Acquisition costs 1 — — (1) — — General and administrative expenses (2) 38 2 9 — 17 66 Total expenses (12) 9 9 — (40) (34) EARNINGS (LOSS) BEFORE INTEREST EXPENSE, FOREIGN EXCHANGE AND INCOME TAXES 15 (7) (473) — 33 (432) Losses from equity method investments — — (20) — — (20) SEGMENT EARNINGS (LOSS) $ 15 $ (7) $ (493) $ — 33 (452) Interest expense (23) (23) Net foreign exchange gains 17 17 Income tax expense (8) (8) NET LOSS (466) Net loss attributable to noncontrolling interests 43 43 NET LOSS ATTRIBUTABLE TO ENSTAR (423) Dividends on preferred shares (9) (9) NET EARNINGS (LOSS) ATTRIBUTABLE TO ENSTAR ORDINARY SHAREHOLDERS $ 53 $ (432) (1) Other income (expense) for corporate and other activities includes the amortization of fair value adjustments associated with the acquisition of DCo and Morse TEC. Net incurred losses and loss adjustment expenses for corporate and other activities includes fair value adjustments associated with the acquisition of companies and the changes in the discount rate and risk margin components of the fair value of liabilities related to our assumed retroactive reinsurance agreements for which we have elected the fair value option. (2) Includes an adjustment made to correct immaterial errors related to the allocation of third quarter 2022 expenses. For the three months ended September 30, 2022, Run-off segment general and administrative expenses increased by $4 million and Corporate and other activities general and administrative expenses decreased by $4 million.
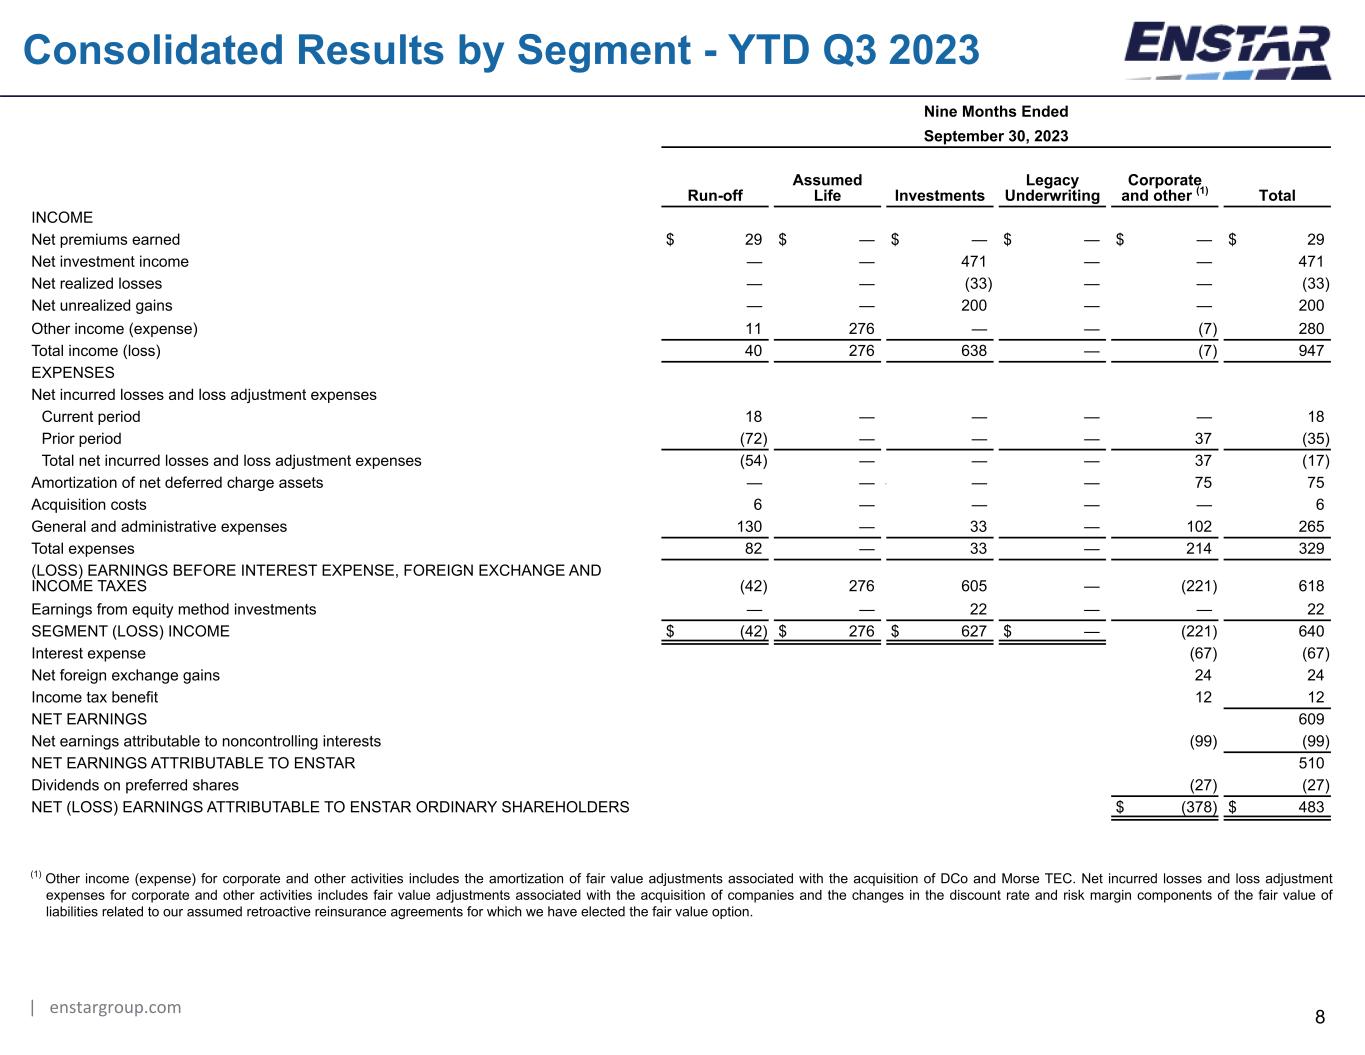
| enstargroup.com 8 Consolidated Results by Segment - YTD Q3 2023 Nine Months Ended September 30, 2023 Run-off Assumed Life Investments Legacy Underwriting Corporate and other (1) Total INCOME Net premiums earned $ 29 $ — $ — $ — $ — $ 29 Net investment income — — 471 — — 471 Net realized losses — — (33) — — (33) Net unrealized gains — — 200 — — 200 Other income (expense) 11 276 — — (7) 280 Total income (loss) 40 276 638 — (7) 947 EXPENSES Net incurred losses and loss adjustment expenses Current period 18 — — — — 18 Prior period (72) — — — 37 (35) Total net incurred losses and loss adjustment expenses (54) — — — 37 (17) Amortization of net deferred charge assets — — — — — 75 75 Acquisition costs 6 — — — — 6 General and administrative expenses 130 — 33 — 102 265 Total expenses 82 — 33 — 214 329 (LOSS) EARNINGS BEFORE INTEREST EXPENSE, FOREIGN EXCHANGE AND INCOME TAXES (42) 276 605 — (221) 618 Earnings from equity method investments — — 22 — — 22 SEGMENT (LOSS) INCOME $ (42) $ 276 $ 627 $ — (221) 640 Interest expense (67) (67) Net foreign exchange gains 24 24 Income tax benefit 12 12 NET EARNINGS 609 Net earnings attributable to noncontrolling interests (99) (99) NET EARNINGS ATTRIBUTABLE TO ENSTAR 510 Dividends on preferred shares (27) (27) NET (LOSS) EARNINGS ATTRIBUTABLE TO ENSTAR ORDINARY SHAREHOLDERS $ (378) $ 483 (1) Other income (expense) for corporate and other activities includes the amortization of fair value adjustments associated with the acquisition of DCo and Morse TEC. Net incurred losses and loss adjustment expenses for corporate and other activities includes fair value adjustments associated with the acquisition of companies and the changes in the discount rate and risk margin components of the fair value of liabilities related to our assumed retroactive reinsurance agreements for which we have elected the fair value option.

| enstargroup.com 9 Consolidated Results by Segment - YTD Q3 2022 Nine Months Ended September 30, 2022 Run-off Assumed Life Investments Legacy Underwriting Corporate and other (1) Total INCOME Net premiums earned $ 27 $ 17 $ — $ 8 $ — $ 52 Net investment income — — 294 8 — 302 Net realized losses — — (111) — — (111) Net unrealized losses — — (1,506) (12) — (1,518) Other income 19 — — 4 10 33 Total income (loss) 46 17 (1,323) 8 10 (1,242) EXPENSES Net incurred losses and loss adjustment expenses Current period 35 — — 4 — 39 Prior period (232) (29) — 2 (217) (476) Total net incurred losses and loss adjustment expenses (197) (29) — 6 (217) (437) Policyholder benefit expenses — 25 — — — 25 Amortization of net deferred charge assets — — — — 60 60 Acquisition costs 18 — — 2 — 20 General and administrative expenses (2) 123 6 26 — 79 234 Total expenses (56) 2 26 8 (78) (98) EARNINGS (LOSS) BEFORE INTEREST EXPENSE, FOREIGN EXCHANGE AND INCOME TAXES 102 15 (1,349) — 88 (1,144) Earnings from equity method investments — — 12 — — 12 SEGMENT INCOME (LOSS) $ 102 $ 15 $ (1,337) $ — 88 (1,132) Interest expense (71) (71) Net foreign exchange gains 27 27 Income tax expense (4) (4) NET LOSS (1,180) Net loss attributable to noncontrolling interests 74 74 NET LOSS ATTRIBUTABLE TO ENSTAR (1,106) Dividends on preferred shares (27) (27) NET EARNINGS (LOSS) ATTRIBUTABLE TO ENSTAR ORDINARY SHAREHOLDERS $ 87 $ (1,133) (1) Other income (expense) for corporate and other activities includes the amortization of fair value adjustments associated with the acquisition of DCo and Morse TEC. Net incurred losses and loss adjustment expenses for corporate and other activities includes fair value adjustments associated with the acquisition of companies and the changes in the discount rate and risk margin components of the fair value of liabilities related to our assumed retroactive reinsurance agreements for which we have elected the fair value option. (2) Includes an adjustment made to correct immaterial errors related to the allocation of third quarter 2022 expenses. For the nine months ended September 30, 2022, Run-off segment general and administrative expenses increased by $14 million and Investment segment and Corporate and other activities general and administrative expenses decreased by $2 million and $12 million, respectively.
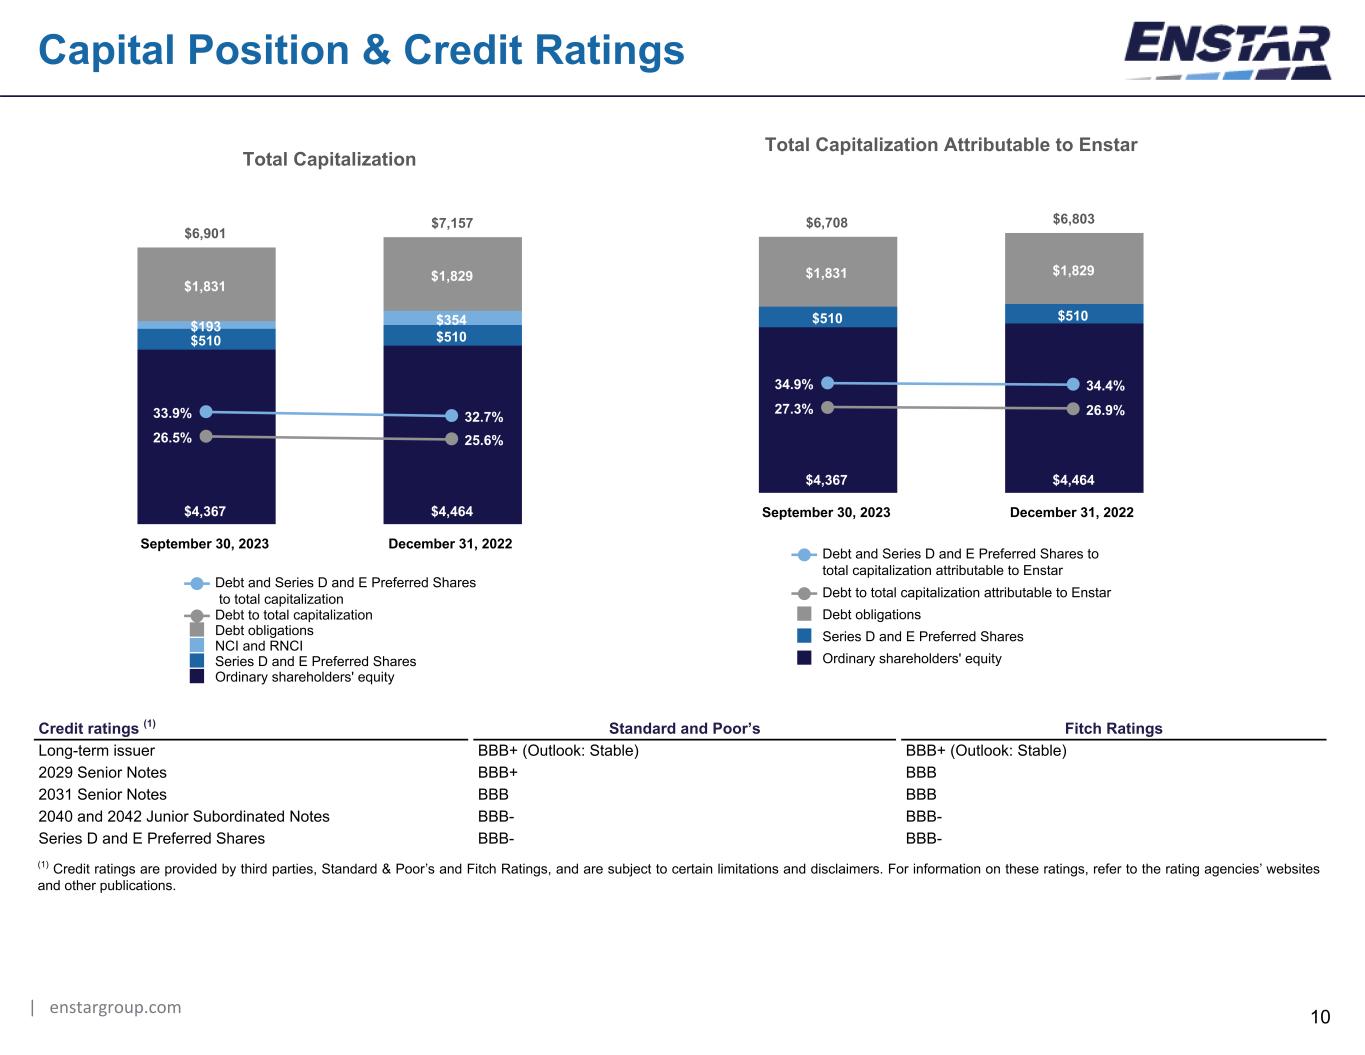
| enstargroup.com 10 Capital Position & Credit Ratings Credit ratings (1) Standard and Poor’s Fitch Ratings Long-term issuer BBB+ (Outlook: Stable) BBB+ (Outlook: Stable) 2029 Senior Notes BBB+ BBB 2031 Senior Notes BBB BBB 2040 and 2042 Junior Subordinated Notes BBB- BBB- Series D and E Preferred Shares BBB- BBB- (1) Credit ratings are provided by third parties, Standard & Poor’s and Fitch Ratings, and are subject to certain limitations and disclaimers. For information on these ratings, refer to the rating agencies’ websites and other publications. Total Capitalization Attributable to Enstar $6,708 $6,803 $4,367 $4,464 $510 $510 $1,831 $1,829 27.3% 26.9% 34.9% 34.4% Debt and Series D and E Preferred Shares to total capitalization attributable to Enstar Debt to total capitalization attributable to Enstar Debt obligations Series D and E Preferred Shares Ordinary shareholders' equity September 30, 2023 December 31, 2022 Total Capitalization $6,901 $7,157 $4,367 $4,464 $510 $510 $193 $354 $1,831 $1,829 26.5% 25.6% 33.9% 32.7% Debt and Series D and E Preferred Shares to total capitalization Debt to total capitalization Debt obligations NCI and RNCI Series D and E Preferred Shares Ordinary shareholders' equity September 30, 2023 December 31, 2022
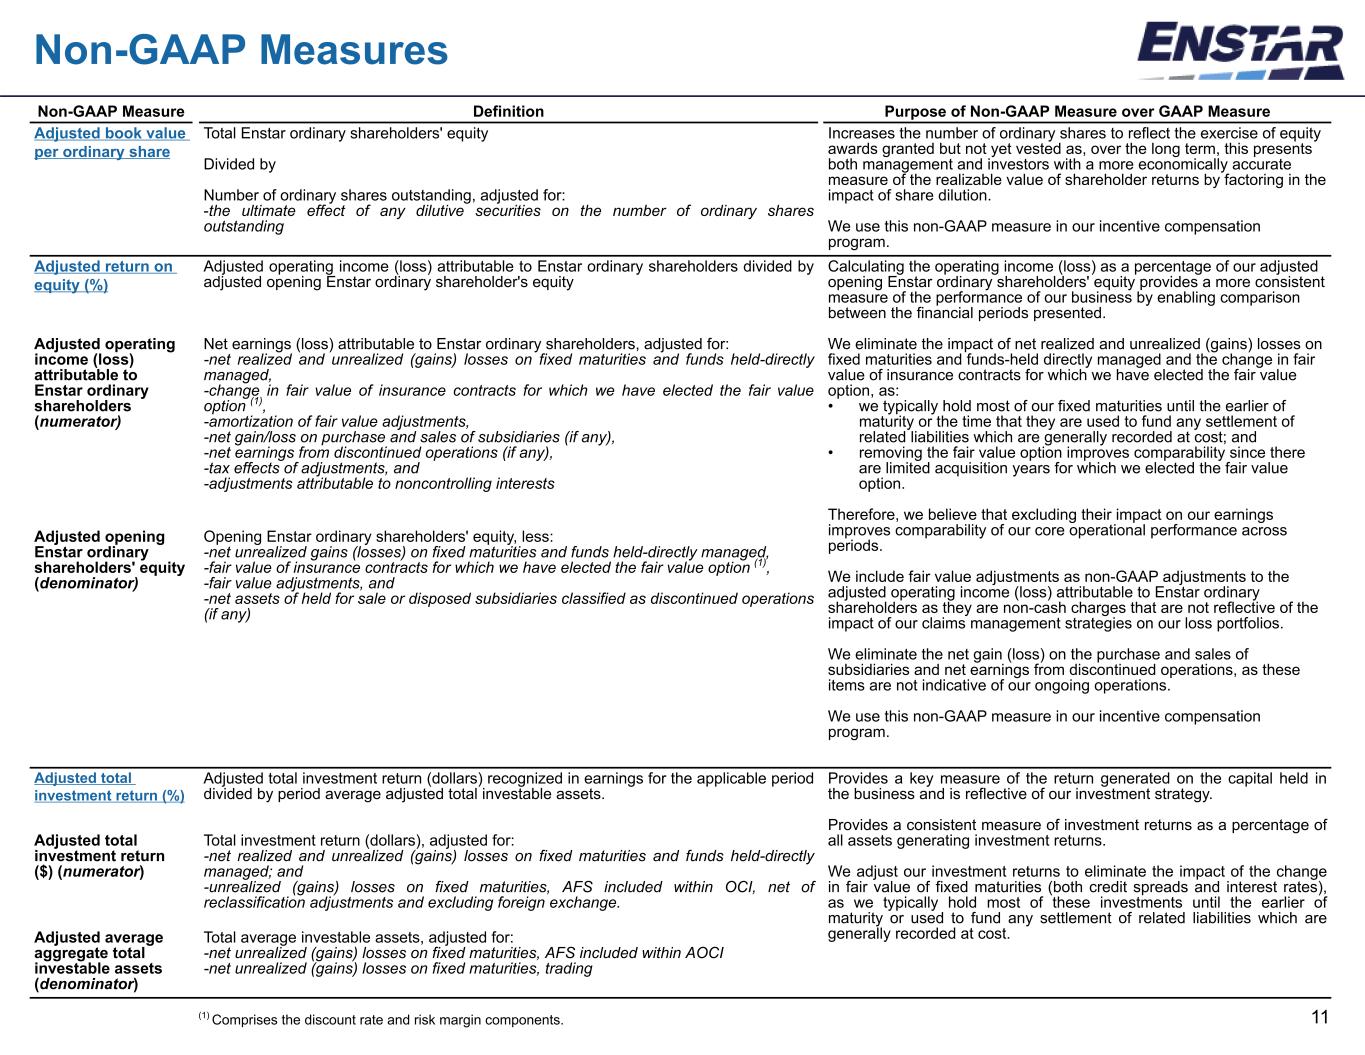
11 Non-GAAP Measures Non-GAAP Measure Definition Purpose of Non-GAAP Measure over GAAP Measure Adjusted book value per ordinary share Total Enstar ordinary shareholders' equity Divided by Number of ordinary shares outstanding, adjusted for: -the ultimate effect of any dilutive securities on the number of ordinary shares outstanding Increases the number of ordinary shares to reflect the exercise of equity awards granted but not yet vested as, over the long term, this presents both management and investors with a more economically accurate measure of the realizable value of shareholder returns by factoring in the impact of share dilution. We use this non-GAAP measure in our incentive compensation program. Adjusted return on equity (%) Adjusted operating income (loss) attributable to Enstar ordinary shareholders divided by adjusted opening Enstar ordinary shareholder's equity Calculating the operating income (loss) as a percentage of our adjusted opening Enstar ordinary shareholders' equity provides a more consistent measure of the performance of our business by enabling comparison between the financial periods presented. We eliminate the impact of net realized and unrealized (gains) losses on fixed maturities and funds-held directly managed and the change in fair value of insurance contracts for which we have elected the fair value option, as: • we typically hold most of our fixed maturities until the earlier of maturity or the time that they are used to fund any settlement of related liabilities which are generally recorded at cost; and • removing the fair value option improves comparability since there are limited acquisition years for which we elected the fair value option. Therefore, we believe that excluding their impact on our earnings improves comparability of our core operational performance across periods. We include fair value adjustments as non-GAAP adjustments to the adjusted operating income (loss) attributable to Enstar ordinary shareholders as they are non-cash charges that are not reflective of the impact of our claims management strategies on our loss portfolios. We eliminate the net gain (loss) on the purchase and sales of subsidiaries and net earnings from discontinued operations, as these items are not indicative of our ongoing operations. We use this non-GAAP measure in our incentive compensation program. Adjusted operating income (loss) attributable to Enstar ordinary shareholders (numerator) Net earnings (loss) attributable to Enstar ordinary shareholders, adjusted for: -net realized and unrealized (gains) losses on fixed maturities and funds held-directly managed, -change in fair value of insurance contracts for which we have elected the fair value option (1), -amortization of fair value adjustments, -net gain/loss on purchase and sales of subsidiaries (if any), -net earnings from discontinued operations (if any), -tax effects of adjustments, and -adjustments attributable to noncontrolling interests Adjusted opening Enstar ordinary shareholders' equity (denominator) Opening Enstar ordinary shareholders' equity, less: -net unrealized gains (losses) on fixed maturities and funds held-directly managed, -fair value of insurance contracts for which we have elected the fair value option (1), -fair value adjustments, and -net assets of held for sale or disposed subsidiaries classified as discontinued operations (if any) Adjusted total investment return (%) Adjusted total investment return (dollars) recognized in earnings for the applicable period divided by period average adjusted total investable assets. Provides a key measure of the return generated on the capital held in the business and is reflective of our investment strategy. Provides a consistent measure of investment returns as a percentage of all assets generating investment returns. We adjust our investment returns to eliminate the impact of the change in fair value of fixed maturities (both credit spreads and interest rates), as we typically hold most of these investments until the earlier of maturity or used to fund any settlement of related liabilities which are generally recorded at cost. Adjusted total investment return ($) (numerator) Total investment return (dollars), adjusted for: -net realized and unrealized (gains) losses on fixed maturities and funds held-directly managed; and -unrealized (gains) losses on fixed maturities, AFS included within OCI, net of reclassification adjustments and excluding foreign exchange. Adjusted average aggregate total investable assets (denominator) Total average investable assets, adjusted for: -net unrealized (gains) losses on fixed maturities, AFS included within AOCI -net unrealized (gains) losses on fixed maturities, trading (1) Comprises the discount rate and risk margin components.
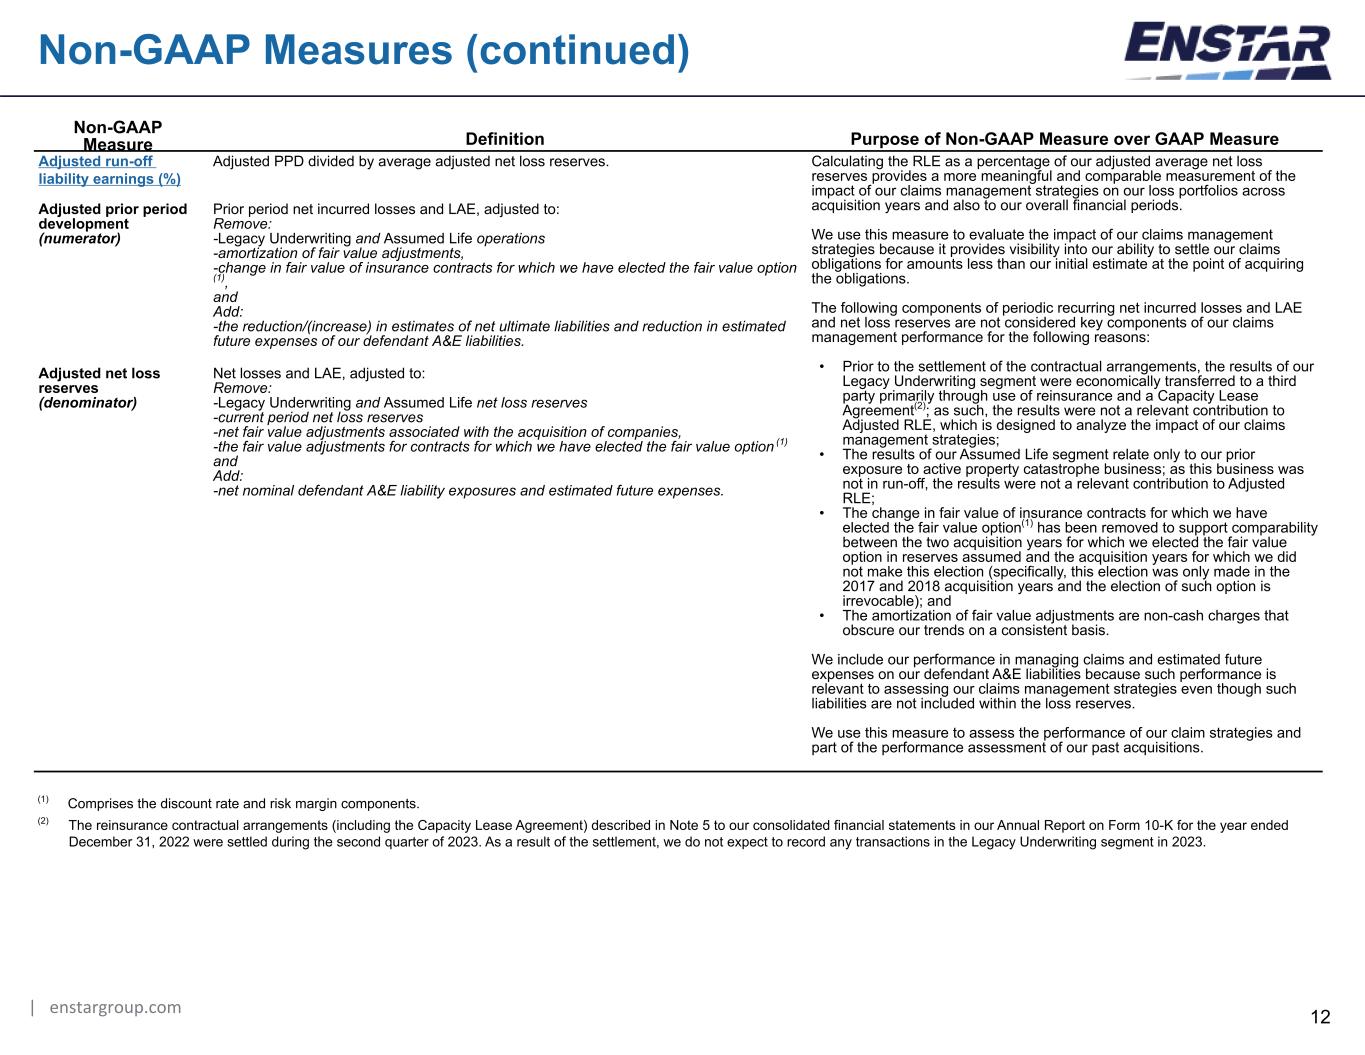
| enstargroup.com 12 Non-GAAP Measures (continued) Non-GAAP Measure Definition Purpose of Non-GAAP Measure over GAAP Measure Adjusted run-off liability earnings (%) Adjusted PPD divided by average adjusted net loss reserves. Calculating the RLE as a percentage of our adjusted average net loss reserves provides a more meaningful and comparable measurement of the impact of our claims management strategies on our loss portfolios across acquisition years and also to our overall financial periods. We use this measure to evaluate the impact of our claims management strategies because it provides visibility into our ability to settle our claims obligations for amounts less than our initial estimate at the point of acquiring the obligations. The following components of periodic recurring net incurred losses and LAE and net loss reserves are not considered key components of our claims management performance for the following reasons: • Prior to the settlement of the contractual arrangements, the results of our Legacy Underwriting segment were economically transferred to a third party primarily through use of reinsurance and a Capacity Lease Agreement(2); as such, the results were not a relevant contribution to Adjusted RLE, which is designed to analyze the impact of our claims management strategies; • The results of our Assumed Life segment relate only to our prior exposure to active property catastrophe business; as this business was not in run-off, the results were not a relevant contribution to Adjusted RLE; • The change in fair value of insurance contracts for which we have elected the fair value option(1) has been removed to support comparability between the two acquisition years for which we elected the fair value option in reserves assumed and the acquisition years for which we did not make this election (specifically, this election was only made in the 2017 and 2018 acquisition years and the election of such option is irrevocable); and • The amortization of fair value adjustments are non-cash charges that obscure our trends on a consistent basis. We include our performance in managing claims and estimated future expenses on our defendant A&E liabilities because such performance is relevant to assessing our claims management strategies even though such liabilities are not included within the loss reserves. We use this measure to assess the performance of our claim strategies and part of the performance assessment of our past acquisitions. Adjusted prior period development (numerator) Prior period net incurred losses and LAE, adjusted to: Remove: -Legacy Underwriting and Assumed Life operations -amortization of fair value adjustments, -change in fair value of insurance contracts for which we have elected the fair value option (1), and Add: -the reduction/(increase) in estimates of net ultimate liabilities and reduction in estimated future expenses of our defendant A&E liabilities. Adjusted net loss reserves (denominator) Net losses and LAE, adjusted to: Remove: -Legacy Underwriting and Assumed Life net loss reserves -current period net loss reserves -net fair value adjustments associated with the acquisition of companies, -the fair value adjustments for contracts for which we have elected the fair value option (1) and Add: -net nominal defendant A&E liability exposures and estimated future expenses. (1) Comprises the discount rate and risk margin components. (2) The reinsurance contractual arrangements (including the Capacity Lease Agreement) described in Note 5 to our consolidated financial statements in our Annual Report on Form 10-K for the year ended December 31, 2022 were settled during the second quarter of 2023. As a result of the settlement, we do not expect to record any transactions in the Legacy Underwriting segment in 2023.
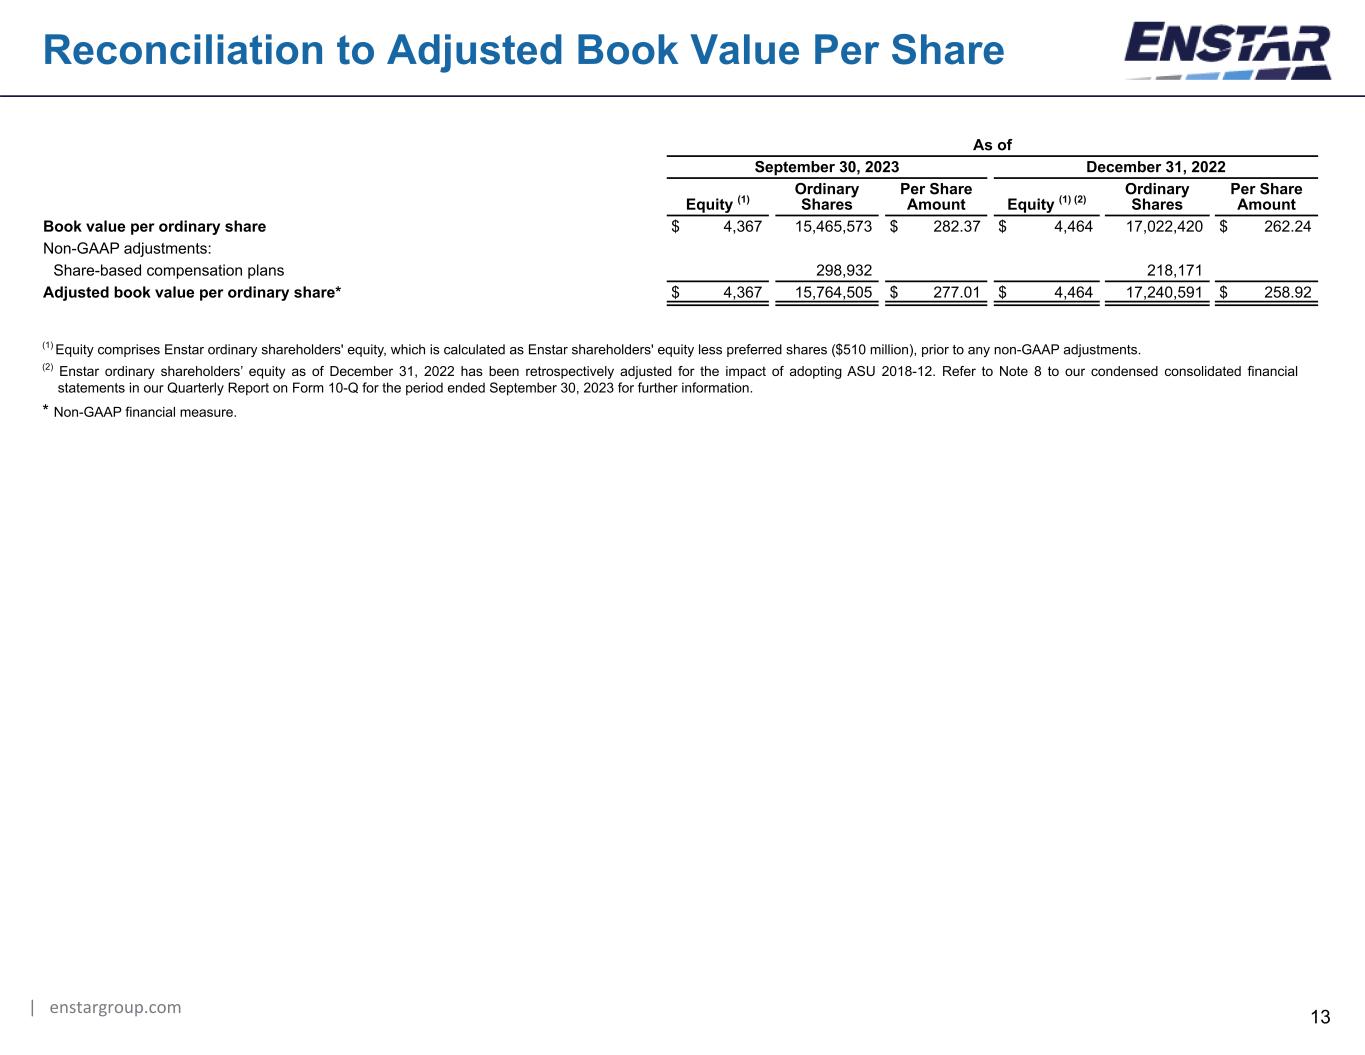
| enstargroup.com 13 Reconciliation to Adjusted Book Value Per Share As of September 30, 2023 December 31, 2022 Equity (1) Ordinary Shares Per Share Amount Equity (1) (2) Ordinary Shares Per Share Amount Book value per ordinary share $ 4,367 15,465,573 $ 282.37 $ 4,464 17,022,420 $ 262.24 Non-GAAP adjustments: Share-based compensation plans 298,932 218,171 Adjusted book value per ordinary share* $ 4,367 15,764,505 $ 277.01 $ 4,464 17,240,591 $ 258.92 (1) Equity comprises Enstar ordinary shareholders' equity, which is calculated as Enstar shareholders' equity less preferred shares ($510 million), prior to any non-GAAP adjustments. (2) Enstar ordinary shareholders’ equity as of December 31, 2022 has been retrospectively adjusted for the impact of adopting ASU 2018-12. Refer to Note 8 to our condensed consolidated financial statements in our Quarterly Report on Form 10-Q for the period ended September 30, 2023 for further information. * Non-GAAP financial measure.

| enstargroup.com 14 Reconciliation to Adjusted Return on Equity - QTD Q3 2023 and 2022 (1) Net (loss) earnings comprises net (loss) earnings attributable to Enstar ordinary shareholders, prior to any non-GAAP adjustments. Opening equity comprises Enstar ordinary shareholders' equity, which is calculated as opening Enstar shareholders' equity less preferred shares ($510 million), prior to any non-GAAP adjustments. (2) Represents the net realized and unrealized losses (gains) related to fixed maturity securities. Our fixed maturity securities are held directly on our balance sheet and also within the "Funds held - directly managed" balance. (3) Comprises the discount rate and risk margin components. (4) Represents an aggregation of the tax expense or benefit associated with the specific country to which the pre-tax adjustment relates, calculated at the applicable jurisdictional tax rate. (5) Represents the impact of the adjustments on the net earnings (loss) attributable to noncontrolling interests associated with the specific subsidiaries to which the adjustments relate. * Non-GAAP financial measure. (1) Net earnings (loss) comprises net earnings (loss) attributable to Enstar ordinary shareholders, prior to any non-GAAP adjustments. Opening equity comprises Enstar ordinary shareholders' equity, which is calculated as opening Enstar shareholders' equity less preferred shares ($510 million), prior to any non-GAAP adjustments. (2) Net realized gains (losses) on fixed maturities, AFS and funds held - directly managed are included in net realized gains (losses) in our condensed consolidated statements of earnings. Net unrealized gains (losses) on fixed maturities, trading and funds held - directly managed are included in net unrealized gains (losses) in our condensed consolidated statements of earnings. (3) Our fixed maturities are held directly on our balance sheet and also within the "Funds held - directly managed" balance. (4) Comprises the discount rate and risk margin components. (5) Represents an aggregation of the tax expense or benefit associated with the specific country to which the pre-tax adjustment relates, calculated at the applicable jurisdictional tax rate. (6) Represents the impact of the adjustments on the net earnings (loss) attributable to noncontrolling interests associated with the specific subsidiaries to which the adjustments relate. * Non-GAAP financial measure. Three Months Ended September 30, 2023 September 30, 2022 Net earnings (loss) (1) Opening equity (1) (Adj) ROE Annualized (Adj) ROE Net earnings (loss) (1) Opening equity (1) (Adj) ROE Annualized (Adj) ROE Net earnings (loss)/Opening equity/ROE/ Annualized ROE (1) $ 38 $ 4,403 0.9 % 3.5 % $ (432) $ 4,619 (9.4) % (37.4) % Non-GAAP adjustments: Net realized losses on fixed maturities, AFS (2) / Net unrealized losses on fixed maturities, AFS (3) 12 550 23 574 Net unrealized losses on fixed maturities, trading (2) / Net unrealized losses on fixed maturities, trading (3) 22 337 157 329 Net realized and unrealized losses on funds held - directly managed (2) / Net unrealized losses on funds held - directly managed (3) 46 166 238 342 Change in fair value of insurance contracts for which we have elected the fair value option / Fair value of insurance contracts for which we have elected the fair value option (4) 12 (312) (82) (239) Amortization of fair value adjustments / Fair value adjustments 4 (116) 4 (99) Tax effects of adjustments (5) (6) — (2) — Adjustments attributable to noncontrolling interests (6) — — (42) — Adjusted operating income (loss)/Adjusted opening equity/Adjusted ROE/Annualized adjusted ROE* $ 128 $ 5,028 2.5 % 10.2 % $ (136) $ 5,526 (2.5) % (9.8) %

| enstargroup.com 15 Reconciliation to Adjusted Return on Equity - YTD Q3 2023 and 2022 1) Net earnings (loss) comprises net earnings (loss) attributable to Enstar ordinary shareholders, prior to any non-GAAP adjustments. Opening equity comprises Enstar ordinary shareholders' equity, which is calculated as opening Enstar shareholders' equity less preferred shares ($510 million), prior to any non-GAAP adjustments. (2) Enstar ordinary shareholders’ equity as of December 31, 2022 has been retrospectively adjusted for the impact of adopting ASU 2018-12. Refer to Note 8 to our condensed consolidated financial statements for further information. (3) Net realized gains (losses) on fixed maturities, AFS and funds held - directly managed are included in net realized gains (losses) in our condensed consolidated statements of earnings. Net unrealized gains (losses) on fixed maturities, trading and funds held - directly managed are included in net unrealized gains (losses) in our condensed consolidated statements of earnings. (4) Our fixed maturities are held directly on our balance sheet and also within the "Funds held - directly managed" balance. (5) Comprises the discount rate and risk margin components. (6) Represents an aggregation of the tax expense or benefit associated with the specific country to which the pre-tax adjustment relates, calculated at the applicable jurisdictional tax rate. (7) Represents the impact of the adjustments on the net earnings (loss) attributable to noncontrolling interests associated with the specific subsidiaries to which the adjustments relate. *Non-GAAP measure. Nine Months Ended September 30, 2023 September 30, 2022 Net earnings (loss) (1) Opening equity (1)(2) (Adj) ROE Annualized (Adj) ROE Net earnings (loss) (1) Opening equity (1) (Adj) ROE Annualized (Adj) ROE Net earnings (loss)/Opening equity/ROE/ Annualized ROE (1) $ 483 $ 4,464 10.8 % 14.4 % $ (1,133) $ 5,813 (19.5) % (26.0) % Non-GAAP adjustments: Net realized losses on fixed maturities, AFS (3) / Net unrealized losses on fixed maturities, AFS (4) 55 647 88 36 Net unrealized losses on fixed maturities, trading (3) / Net unrealized losses on fixed maturities, trading (4) 24 400 556 (134) Net realized and unrealized losses on funds held - directly managed (3) / Net unrealized losses on funds held - directly managed (4) 49 780 517 9 Change in fair value of insurance contracts for which we have elected the fair value option / Fair value of insurance contracts for which we have elected the fair value option (5) 24 (294) (228) (107) Amortization of fair value adjustments / Fair value adjustments 13 (124) 11 (106) Tax effects of adjustments (6) (12) — (6) — Adjustments attributable to noncontrolling interests (7) (2) — (90) — Adjusted operating income (loss)/Adjusted opening equity/Adjusted ROE/Annualized adjusted ROE* $ 634 $ 5,873 10.8 % 14.4 % $ (285) $ 5,511 (5.2) % (6.9) %

| enstargroup.com 16 Reconciliation to Adjusted Run-off Liability Earnings - QTD Q3 2023 and 2022 Three Months Ended As of Three Months Ended September 30, 2023 September 30, 2023 June 30, 2023 September 30, 2023 September 30, 2023 RLE / PPD Net loss reserves Net loss reserves Average net loss reserves RLE % Annualized RLE % PPD/net loss reserves/RLE/Annualized RLE $ 15 $ 12,155 $ 12,939 $ 12,547 0.1 % 0.5 % Non-GAAP Adjustments: Net loss reserves - current period — (15) (11) (13) Amortization of fair value adjustments / Net fair value adjustments associated with the acquisition of companies 4 112 116 114 Changes in fair value - fair value option / Net fair value adjustments for contracts for which we have elected the fair value option (1) 12 292 312 302 Change in estimate of net ultimate liabilities - defendant A&E / Net nominal defendant A&E liabilities — 533 550 542 Reduction in estimated future expenses - defendant A&E / Estimated future expenses - defendant A&E 1 33 34 33 Adjusted PPD/Adjusted net loss reserves/ Adjusted RLE/Annualized Adjusted RLE* $ 32 $ 13,110 $ 13,940 $ 13,525 0.2 % 0.9 % (1) Comprises the discount rate and risk margin components. * Non-GAAP financial measure. Three Months Ended As of Three Months Ended September 30, 2022 September 30, 2022 June 30, 2022 September 30, 2022 September 30, 2022 RLE / PPD Net loss reserves Net loss reserves Average net loss reserves RLE % Annualized RLE % PPD/net loss reserves/RLE/Annualized RLE $ 141 $ 11,819 $ 12,524 $ 12,172 1.2 % 4.6 % Non-GAAP Adjustments: Net loss reserves - current period — (36) (25) (31) Assumed Life — (141) (149) (145) Legacy Underwriting (2) (137) (140) (139) Amortization of fair value adjustments / Net fair value adjustments associated with the acquisition of companies 4 95 99 97 Changes in fair value - fair value option / Net fair value adjustments for contracts for which we have elected the fair value option (1) (82) 305 239 272 Change in estimate of net ultimate liabilities - defendant A&E / Net nominal defendant A&E liabilities — 572 574 573 Reduction in estimated future expenses - defendant A&E / Estimated future expenses - defendant A&E — 35 36 36 Adjusted PPD/Adjusted net loss reserves/Adjusted RLE/Annualized Adjusted RLE* $ 61 $ 12,512 $ 13,158 $ 12,835 0.5 % 1.9 %
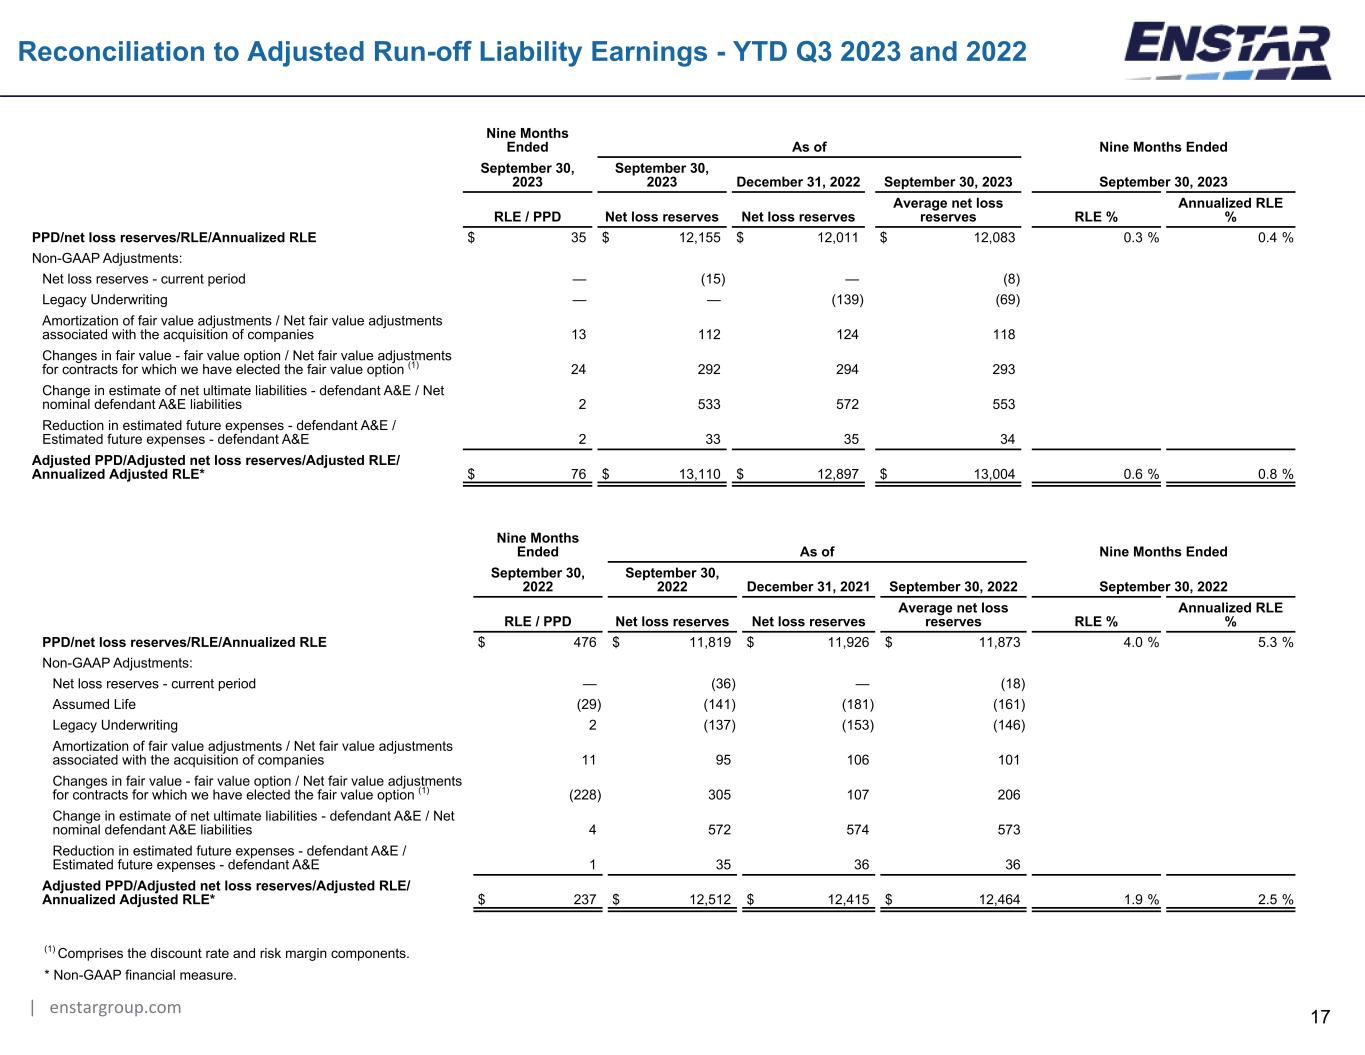
| enstargroup.com 17 Reconciliation to Adjusted Run-off Liability Earnings - YTD Q3 2023 and 2022 Nine Months Ended As of Nine Months Ended September 30, 2022 September 30, 2022 December 31, 2021 September 30, 2022 September 30, 2022 RLE / PPD Net loss reserves Net loss reserves Average net loss reserves RLE % Annualized RLE % PPD/net loss reserves/RLE/Annualized RLE $ 476 $ 11,819 $ 11,926 $ 11,873 4.0 % 5.3 % Non-GAAP Adjustments: Net loss reserves - current period — (36) — (18) Assumed Life (29) (141) (181) (161) Legacy Underwriting 2 (137) (153) (146) Amortization of fair value adjustments / Net fair value adjustments associated with the acquisition of companies 11 95 106 101 Changes in fair value - fair value option / Net fair value adjustments for contracts for which we have elected the fair value option (1) (228) 305 107 206 Change in estimate of net ultimate liabilities - defendant A&E / Net nominal defendant A&E liabilities 4 572 574 573 Reduction in estimated future expenses - defendant A&E / Estimated future expenses - defendant A&E 1 35 36 36 Adjusted PPD/Adjusted net loss reserves/Adjusted RLE/ Annualized Adjusted RLE* $ 237 $ 12,512 $ 12,415 $ 12,464 1.9 % 2.5 % (1) Comprises the discount rate and risk margin components. * Non-GAAP financial measure. Nine Months Ended As of Nine Months Ended September 30, 2023 September 30, 2023 December 31, 2022 September 30, 2023 September 30, 2023 RLE / PPD Net loss reserves Net loss reserves Average net loss reserves RLE % Annualized RLE % PPD/net loss reserves/RLE/Annualized RLE $ 35 $ 12,155 $ 12,011 $ 12,083 0.3 % 0.4 % Non-GAAP Adjustments: Net loss reserves - current period — (15) — (8) Legacy Underwriting — — (139) (69) Amortization of fair value adjustments / Net fair value adjustments associated with the acquisition of companies 13 112 124 118 Changes in fair value - fair value option / Net fair value adjustments for contracts for which we have elected the fair value option (1) 24 292 294 293 Change in estimate of net ultimate liabilities - defendant A&E / Net nominal defendant A&E liabilities 2 533 572 553 Reduction in estimated future expenses - defendant A&E / Estimated future expenses - defendant A&E 2 33 35 34 Adjusted PPD/Adjusted net loss reserves/Adjusted RLE/ Annualized Adjusted RLE* $ 76 $ 13,110 $ 12,897 $ 13,004 0.6 % 0.8 %
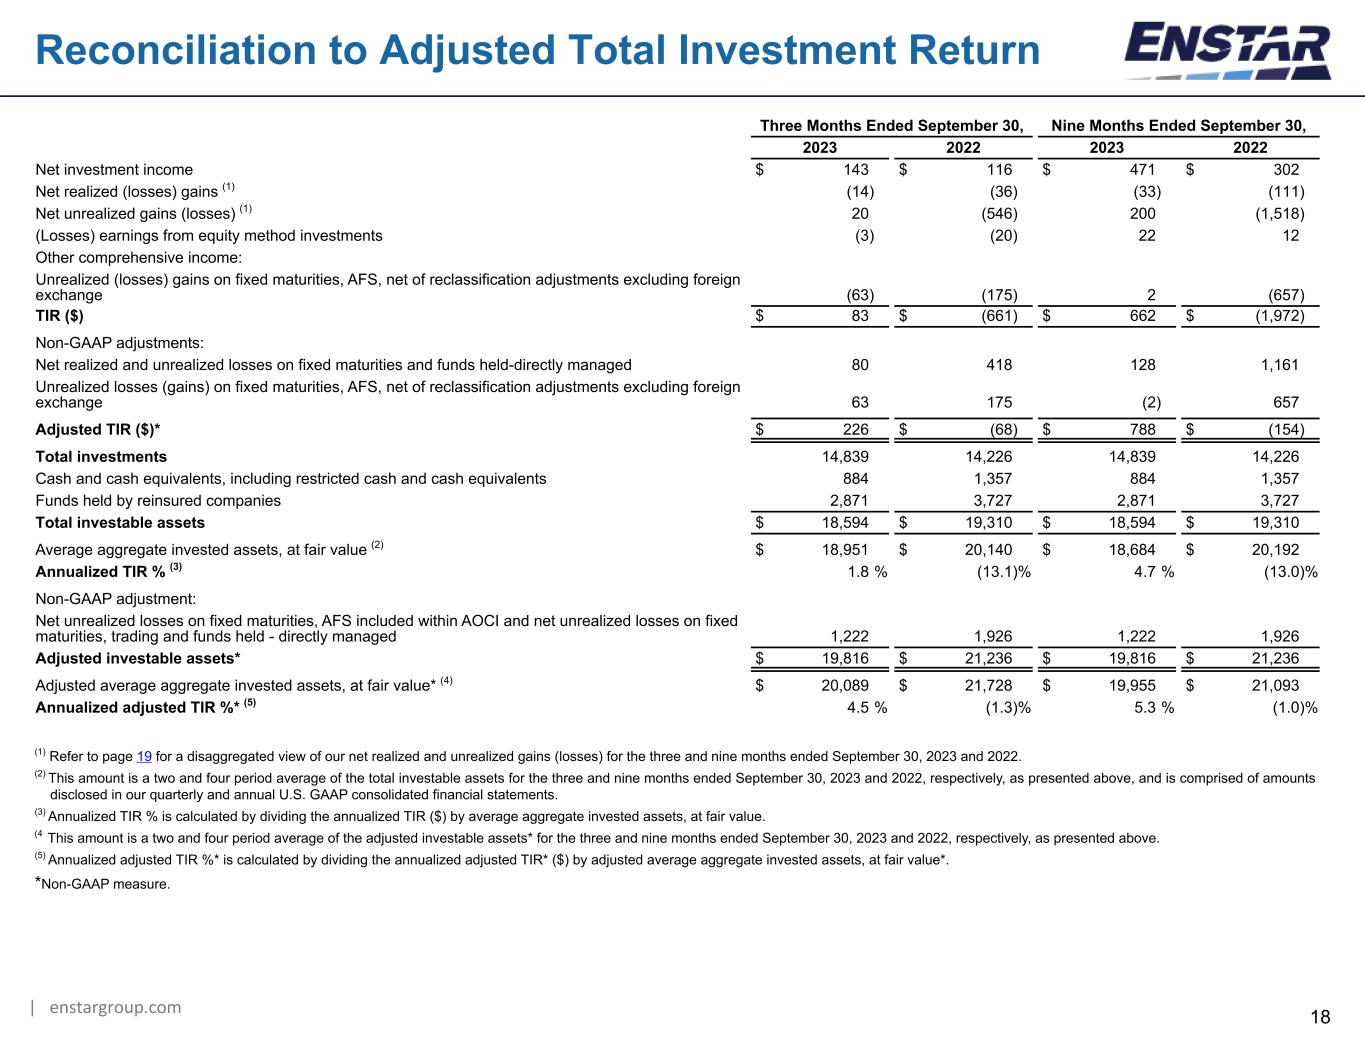
| enstargroup.com 18 Reconciliation to Adjusted Total Investment Return Three Months Ended September 30, Nine Months Ended September 30, 2023 2022 2023 2022 Net investment income $ 143 $ 116 $ 471 $ 302 Net realized (losses) gains (1) (14) (36) (33) (111) Net unrealized gains (losses) (1) 20 (546) 200 (1,518) (Losses) earnings from equity method investments (3) (20) 22 12 Other comprehensive income: Unrealized (losses) gains on fixed maturities, AFS, net of reclassification adjustments excluding foreign exchange (63) (175) 2 (657) TIR ($) $ 83 $ (661) $ 662 $ (1,972) Non-GAAP adjustments: Net realized and unrealized losses on fixed maturities and funds held-directly managed 80 418 128 1,161 Unrealized losses (gains) on fixed maturities, AFS, net of reclassification adjustments excluding foreign exchange 63 175 (2) 657 Adjusted TIR ($)* $ 226 $ (68) $ 788 $ (154) Total investments 14,839 14,226 14,839 14,226 Cash and cash equivalents, including restricted cash and cash equivalents 884 1,357 884 1,357 Funds held by reinsured companies 2,871 3,727 2,871 3,727 Total investable assets $ 18,594 $ 19,310 $ 18,594 $ 19,310 Average aggregate invested assets, at fair value (2) $ 18,951 $ 20,140 $ 18,684 $ 20,192 Annualized TIR % (3) 1.8 % (13.1) % 4.7 % (13.0) % Non-GAAP adjustment: Net unrealized losses on fixed maturities, AFS included within AOCI and net unrealized losses on fixed maturities, trading and funds held - directly managed 1,222 1,926 1,222 1,926 Adjusted investable assets* $ 19,816 $ 21,236 $ 19,816 $ 21,236 Adjusted average aggregate invested assets, at fair value* (4) $ 20,089 $ 21,728 $ 19,955 $ 21,093 Annualized adjusted TIR %* (5) 4.5 % (1.3) % 5.3 % (1.0) % (1) Refer to page 19 for a disaggregated view of our net realized and unrealized gains (losses) for the three and nine months ended September 30, 2023 and 2022. (2) This amount is a two and four period average of the total investable assets for the three and nine months ended September 30, 2023 and 2022, respectively, as presented above, and is comprised of amounts disclosed in our quarterly and annual U.S. GAAP consolidated financial statements. (3) Annualized TIR % is calculated by dividing the annualized TIR ($) by average aggregate invested assets, at fair value. (4 This amount is a two and four period average of the adjusted investable assets* for the three and nine months ended September 30, 2023 and 2022, respectively, as presented above. (5) Annualized adjusted TIR %* is calculated by dividing the annualized adjusted TIR* ($) by adjusted average aggregate invested assets, at fair value*. *Non-GAAP measure.
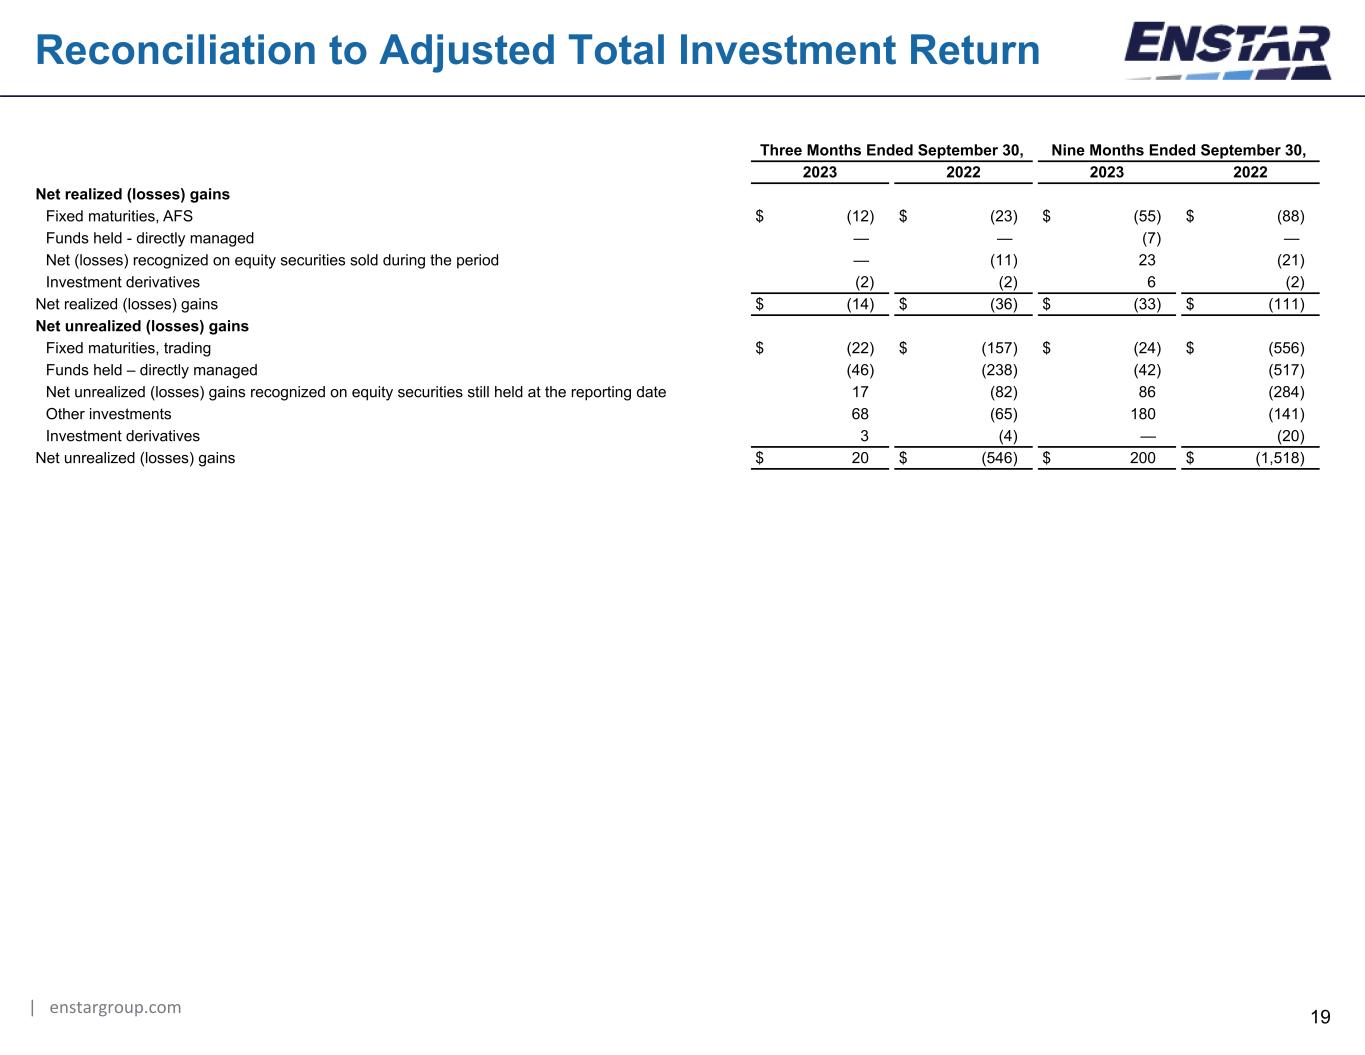
| enstargroup.com 19 Reconciliation to Adjusted Total Investment Return Three Months Ended September 30, Nine Months Ended September 30, 2023 2022 2023 2022 Net realized (losses) gains Fixed maturities, AFS $ (12) $ (23) $ (55) $ (88) Funds held - directly managed — — (7) — Net (losses) recognized on equity securities sold during the period — (11) 23 (21) Investment derivatives (2) (2) 6 (2) Net realized (losses) gains $ (14) $ (36) $ (33) $ (111) Net unrealized (losses) gains Fixed maturities, trading $ (22) $ (157) $ (24) $ (556) Funds held – directly managed (46) (238) (42) (517) Net unrealized (losses) gains recognized on equity securities still held at the reporting date 17 (82) 86 (284) Other investments 68 (65) 180 (141) Investment derivatives 3 (4) — (20) Net unrealized (losses) gains $ 20 $ (546) $ 200 $ (1,518)

| enstargroup.com 20 Investment Composition - September 30, 2023 Other Investments Equities Cash (2) Funds Held September 30, 2023 Hedge Funds Fixed income funds Equity funds Private equity funds CLO equities CLO equity funds Private credit funds Real estate debt fund Other (1) Publicly traded equities Exchange- traded funds Privately held equities Short-term and fixed maturity investments, trading and AFS and funds held - directly managed $ 9,450 50.8 % Other assets included within funds held - directly managed 462 2.5 % 97 68 297 Equities Publicly traded equities 239 1.3 % 239 Exchange-traded funds 276 1.4 % 66 210 Privately held equities 366 2.0 % 54 17 43 252 Total 881 4.7 % — % 13.6 % — % — % 1.9 % — % 4.9 % — % — % 27.1 % 23.8 % 28.6 % — % — % Other investments Hedge funds 515 2.8 % 432 83 Fixed income funds 504 2.7 % 504 Equity funds 4 — % 4 Private equity funds 1,559 8.5 % 3 1,128 108 65 90 14 40 6 105 CLO equities 59 0.3 % 59 CLO equity funds 208 1.1 % 208 Private credit funds 548 2.9 % 548 Real estate debt fund 240 1.3 % 240 Total 3,637 19.6 % 11.9 % 16.2 % — % 31.0 % 7.3 % — % 18.0 % 8.4 % 2.5 % 0.5 % 1.1 % 0.2 % 2.9 % — % Equity method investments 409 2.2 % Total investments 14,839 79.8 % Cash and cash equivalents (including restricted cash) 884 4.8 % 884 Funds held by reinsured companies 2,871 15.4 % 2,871 Total investable assets $ 18,594 100.0 % (1) Infrastructure in fund format. (2) Cash and cash equivalents.
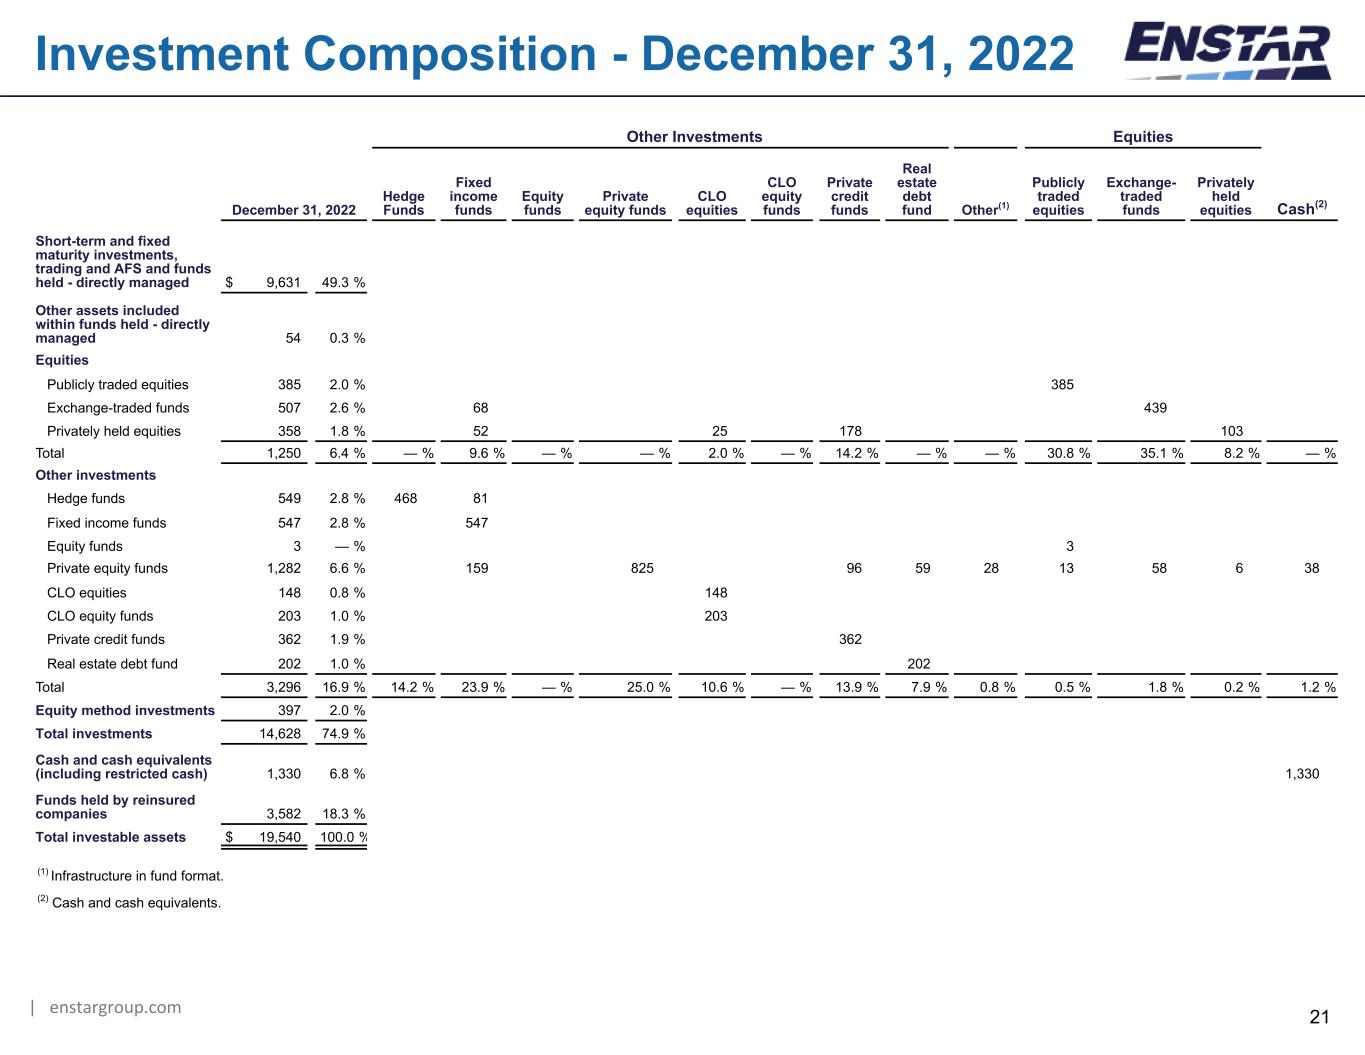
| enstargroup.com 21 Investment Composition - December 31, 2022 Other Investments Equities December 31, 2022 Hedge Funds Fixed income funds Equity funds Private equity funds CLO equities CLO equity funds Private credit funds Real estate debt fund Other(1) Publicly traded equities Exchange- traded funds Privately held equities Cash(2) Short-term and fixed maturity investments, trading and AFS and funds held - directly managed $ 9,631 49.3 % Other assets included within funds held - directly managed 54 0.3 % Equities Publicly traded equities 385 2.0 % 385 Exchange-traded funds 507 2.6 % 68 439 Privately held equities 358 1.8 % 52 25 178 103 Total 1,250 6.4 % — % 9.6 % — % — % 2.0 % — % 14.2 % — % — % 30.8 % 35.1 % 8.2 % — % Other investments Hedge funds 549 2.8 % 468 81 Fixed income funds 547 2.8 % 547 Equity funds 3 — % 3 Private equity funds 1,282 6.6 % 159 825 96 59 28 13 58 6 38 CLO equities 148 0.8 % 148 CLO equity funds 203 1.0 % 203 Private credit funds 362 1.9 % 362 Real estate debt fund 202 1.0 % 202 Total 3,296 16.9 % 14.2 % 23.9 % — % 25.0 % 10.6 % — % 13.9 % 7.9 % 0.8 % 0.5 % 1.8 % 0.2 % 1.2 % Equity method investments 397 2.0 % Total investments 14,628 74.9 % Cash and cash equivalents (including restricted cash) 1,330 6.8 % 1,330 Funds held by reinsured companies 3,582 18.3 % Total investable assets $ 19,540 100.0 % (1) Infrastructure in fund format. (2) Cash and cash equivalents.


