Exhibit 99.2

Cal Dive International
4th Quarter 2010 Earnings Conference Call
Forward-Looking Statements
This presentation may include “forward-looking” statements that are generally identifiable
through our use of words such as “believe,” “expect,” “anticipate,” “intend,” “plan,” “estimate,”
“project” and similar expressions and include any statements that we make regarding our earnings
expectations. The forward-looking statements speak only as of the date of this presentation, and
we undertake no obligation to update or revise such statements to reflect new information or
events as they occur. Our actual future results may differ materially due to a variety of factors,
including current economic and financial market conditions, changes in commodity prices for
natural gas and oil and in the level of offshore exploration, development and production activity in
the oil and natural gas industry, the impact on the market and regulatory environment in the U.S.
Gulf of Mexico resulting from the Macondo well blowout, our inability to obtain contracts with
favorable pricing terms if there is a downturn on our business cycle, intense competition in our
industry, the operational risks inherent in our business, and other risks detailed in our Form 10-K
on file with the Securities and Exchange Commission.
2
Presentation Outline
Summary of 4Q 2010 Results
Backlog
Discussion of Financial Results
Non-GAAP Reconciliations
Questions & Answers
3

Summary of 4Q Results
4
Higher utilization levels
compared to 4Q 09 but fewer
large construction projects.
Solid backlog at end of 2010.
No outstanding borrowings
under revolver at year-end.
Debt to EBITDA at 2x.

Backlog
Financial Results
6
(all amounts in thousands, except per share amounts and percentages) |
(1) See reconciliation on Non-GAAP financial measures at the end of the presentation.
(2) Tax effected.
Three Months | Twelve Months | ||||||
Ended December 31, | Ended December 31, | ||||||
2010 | 2009 | 2010 | 2009 | ||||
$161,040 | $147,396 | $536,468 | $829,362 | ||||
23,673 | 36,188 | 62,442 | 215,885 | ||||
Margins | 15% | 25% | 12% | 26% | |||
Net Income (Loss) | ($2,382) | $2,840 | ($315,849) | $76,627 | |||
Margins | (1%) | 2% | (59%) | 9% | |||
Diluted Earnings (Loss) Per Share | (0.03) | 0.03 | (3.47) | 0.81 | |||
Net Loss | ($315,849) | ||||||
Non-cash fixed asset impairments (2) | 15,048 | ||||||
Non-cash goodwill impairments (2) | 287,464 | ||||||
Non-GAAP Net Income (Loss) | ($13,337) | ||||||
Margins | (2%) | ||||||
Non-GAAP Diluted Earnings (Loss) Per Share | ($0.15) | ||||||
EBITDA (1) | $27,683 | $34,178 | $79,867 | $216,453 | |||
Margins | 17% | 23% | 15% | 26% | |||

Utilization
7
(1) Effective vessel utilization is calculated by dividing the total number of days the vessels generated revenues by the total number of days the vessels were available
for operation in each period excluding days in which the vessels were in drydock or taken out of service for upgrades.
for operation in each period excluding days in which the vessels were in drydock or taken out of service for upgrades.
Three Months | Twelve Months | |||||
Ended December 31, | Ended December 31, | |||||
2010 | 2009 | 2010 | 2009 | |||
Effective Utilization(1) - | ||||||
Saturation Diving Vessels | 66% | 58% | 65% | 79% | ||
Surface Diving Vessels | 46% | 34% | 51% | 57% | ||
Total Fleet | 47% | 40% | 47% | 57% | ||
Calendar Day Utilization - | ||||||
Saturation Diving Vessels | 64% | 57% | 61% | 68% | ||
Surface Diving Vessels | 43% | 34% | 49% | 53% | ||
Total Fleet | 46% | 39% | 45% | 52% | ||
(The following statistics are for owned and operated vessels only) |
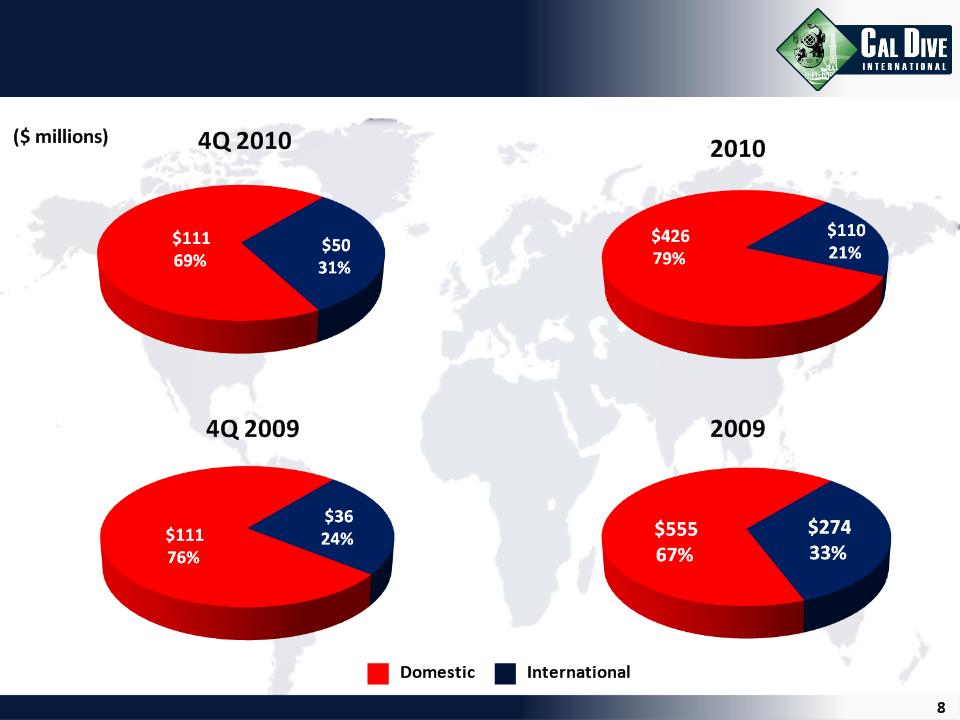
Revenue Split
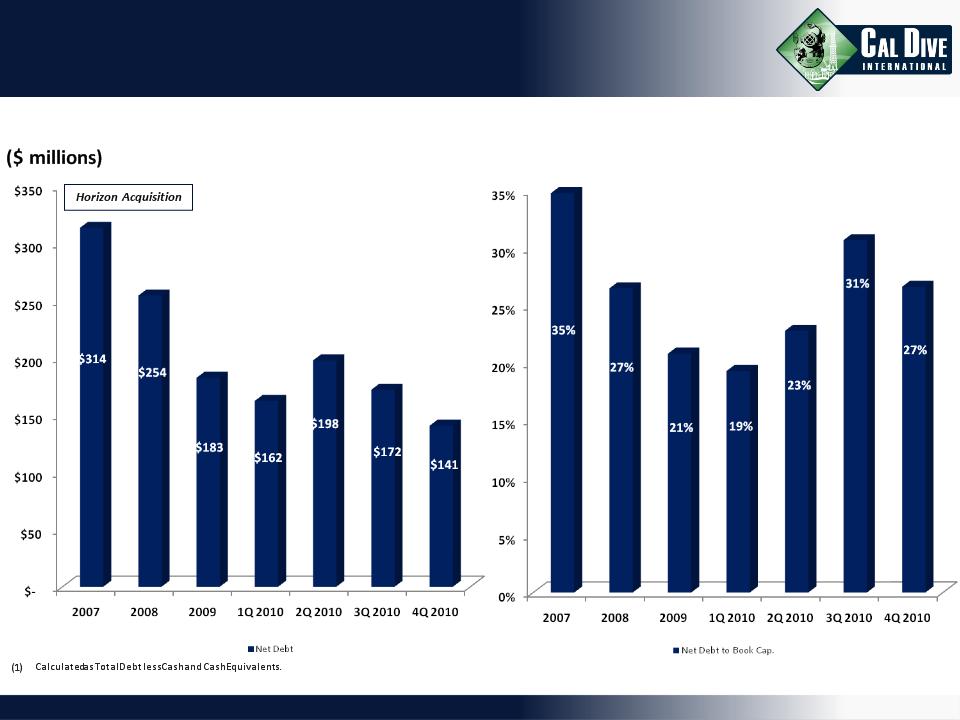
Debt Levels
9
Net Debt Levels (1) |
Net Debt to Book Cap. % (2) |
(2) Calculated as Net Debt divided by Stockholders’ Equity plus Net Debt.
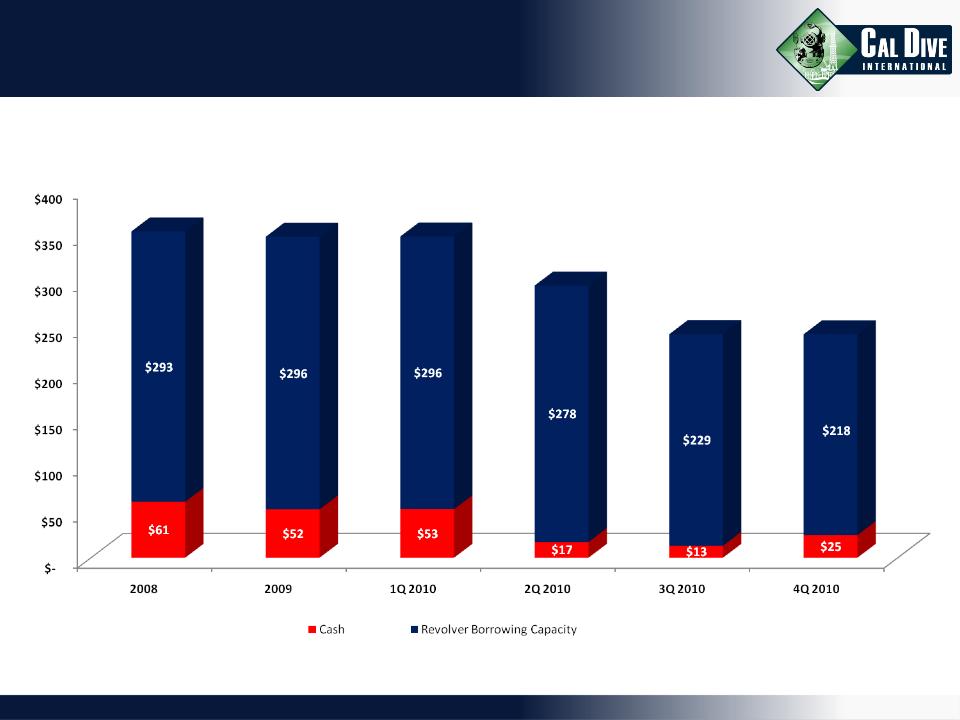
Liquidity
10
Liquidity Position |
$348
$354
($ millions)
$243
$349
$295
$242
(1) Pro forma impact of amendment to credit facility.
(2) Unborrowed revolver borrowing capacity calculated based on max allowed Debt to EBITDA ratio and maximum revolver capacity of $300 million less LC's outstanding.

Non-GAAP Reconciliations
11
EBITDA Reconciliations
12
(all amounts in thousands) |
The following table presents a reconciliation of EBITDA to net income, which is the most directly comparable GAAP financial measure of our operating results:
Three Months | Twelve Months | ||||||
Ended December 31, | Ended December 31, | ||||||
2010 | 2009 | 2010 | 2009 | ||||
EBITDA (unaudited) | $27,683 | $34,178 | $79,867 | $216,453 | |||
Less: Depreciation & Amortization | 17,008 | 18,469 | 68,961 | 76,313 | |||
Less: Non-Cash Stock Comp. Expense | 2,061 | 1,943 | 7,427 | 7,272 | |||
Less: Interest Expense, net | 2,225 | 3,203 | 9,060 | 13,801 | |||
Less: Income Tax Expense (Benefit) | 8,680 | 7,193 | (5,443) | 41,910 | |||
Less: Non-Cash Goodwill Impairment Charge | - | - | 292,469 | - | |||
Less: Non-Cash Fixed Asset Impairment Charge | 91 | 530 | 23,242 | 530 | |||
Net Income (Loss) | ($2,382) | $2,840 | ($315,849) | $76,627 | |||