Exhibit 99.2
Cal Dive International 2nd Quarter 2012 Earnings Conference Call
Forward-Looking Statements This presentation may include “forward-looking” statements that are generally identifiable through the use of words such as “believe,” “expect,” “anticipate,” “intend,” “plan,” “estimate,” “project” and similar expressions and include any statements that are made regarding earnings expectations. The forward-looking statements speak only as of the date of this presentation, and we undertake no obligation to update or revise such statements to reflect new information or events as they occur. Actual future results may differ materially due to a variety of factors, including current economic and financial market conditions, changes in commodity prices for oil and natural gas and in the level of offshore exploration, development and production activity in the oil and natural gas industry, the impact on the market and regulatory environment in the U.S. Gulf of Mexico resulting from the Macondo well blowout, the inability to obtain contracts with favorable pricing terms if there is a downturn in our business cycle, intense competition in our industry, the operational risks inherent in our business, and other risks detailed in our most recently filed Annual Report on Form 10-K. *
Presentation Outline * Summary of 2Q 2012 Backlog Discussion of Financial Results Non-GAAP Reconciliations Q & A
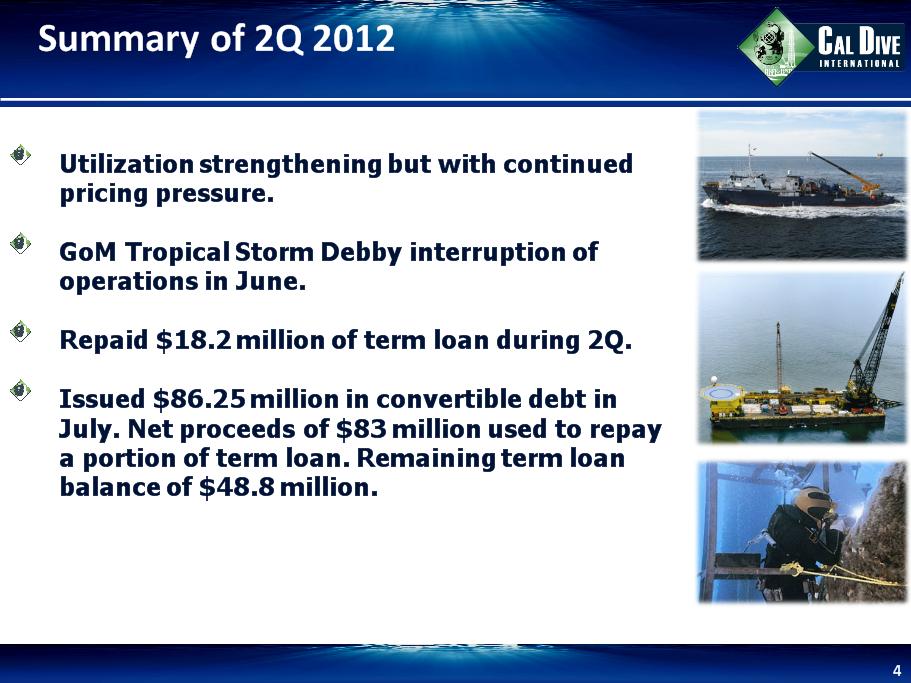
Summary of 2Q 2012 * Utilization strengthening but with continued pricing pressure. GoM Tropical Storm Debby interruption of operations in June. Repaid $18.2 million of term loan during 2Q. Issued $86.25 million in convertible debt in July. Net proceeds of $83 million used to repay a portion of term loan. Remaining term loan balance of $48.8 million.
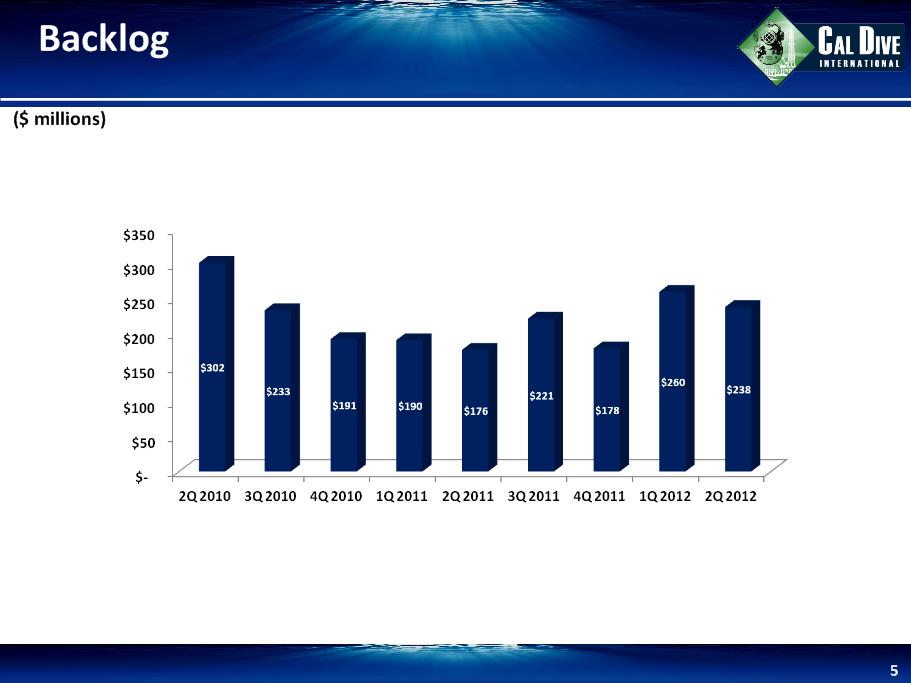
Backlog * ($ millions)
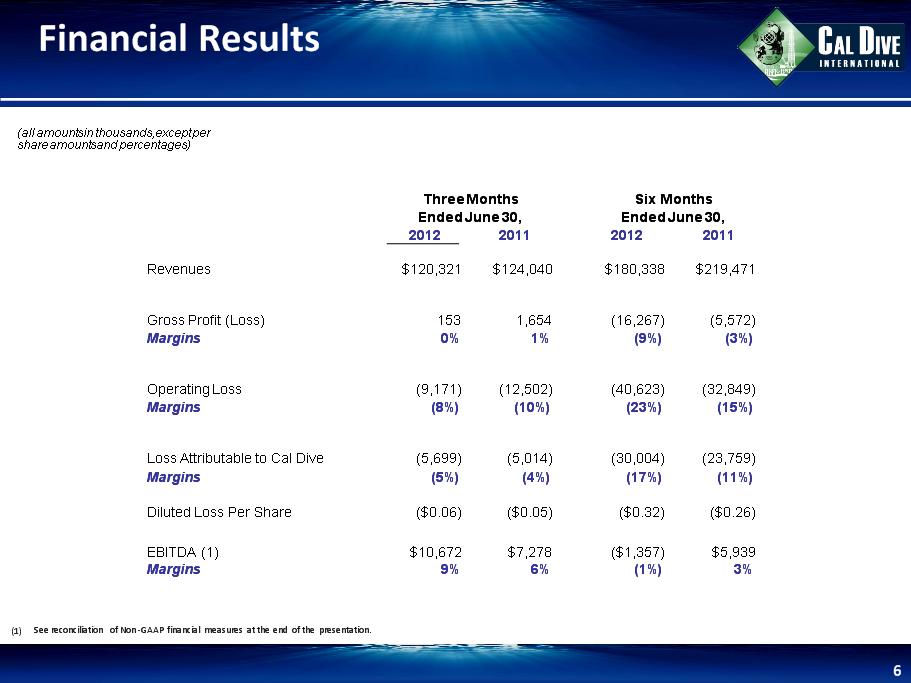
Financial Results * See reconciliation of Non-GAAP financial measures at the end of the presentation. (all amounts in thousands, except per share amounts and percentages) Three Months Three Months Three Months Six Months Six Months Six Months Ended June 30, Ended June 30, Ended June 30, Ended June 30, Ended June 30, Ended June 30, 2012 2011 2012 2011 Revenues $120,321 $124,040 $180,338 $219,471 Gross Profit (Loss) 153 1,654 (16,267) (5,572) Margins 0% 1% (9%) (3%) Operating Loss (9,171) (12,502) (40,623) (32,849) Margins (8%) (10%) (23%) (15%) Loss Attributable to Cal Dive (5,699) (5,014) (30,004) (23,759) Margins (5%) (4%) (17%) (11%) Diluted Loss Per Share ($0.06) ($0.05) ($0.32) ($0.26) EBITDA (1) $10,672 $7,278 ($1,357) $5,939 Margins 9% 6% (1%) 3%
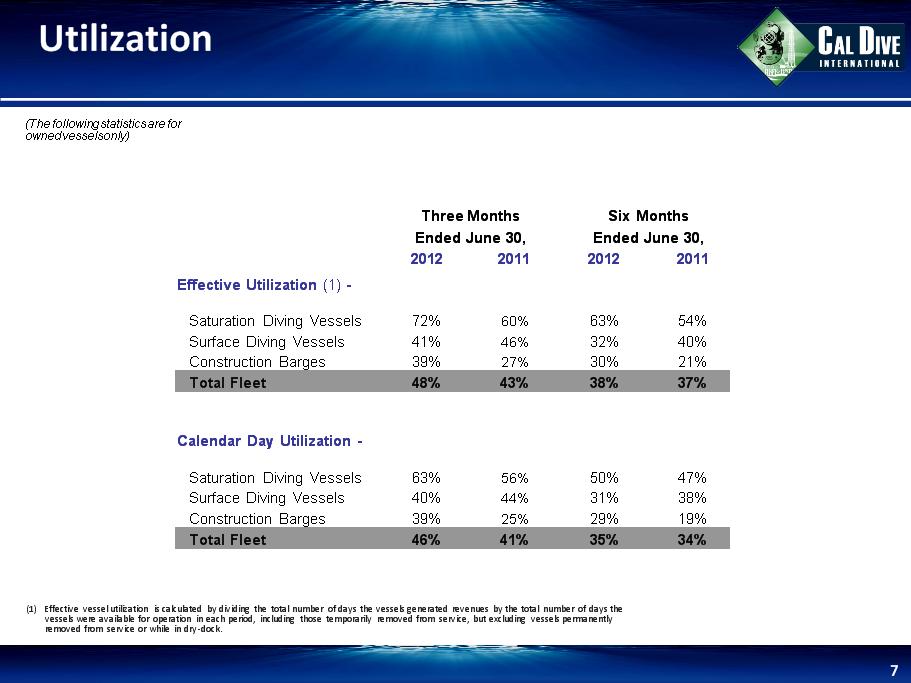
Utilization * (1) Effective vessel utilization is calculated by dividing the total number of days the vessels generated revenues by the total number of days the vessels were available for operation in each period, including those temporarily removed from service, but excluding vessels permanently removed from service or while in dry-dock. (The following statistics are for owned vessels only) Three Months Three Months Three Months Six Months Six Months Six Months Ended June 30, Ended June 30, Ended June 30, Ended June 30, Ended June 30, Ended June 30, 2012 2011 2012 2011 Effective Utilization (1) - Saturation Diving Vessels 72% 60% 63% 54% Surface Diving Vessels 41% 46% 32% 40% Construction Barges 39% 27% 30% 21% Total Fleet 48% 43% 38% 37% Calendar Day Utilization - Saturation Diving Vessels 63% 56% 50% 47% Surface Diving Vessels 40% 44% 31% 38% Construction Barges 39% 25% 29% 19% Total Fleet 46% 41% 35% 34%
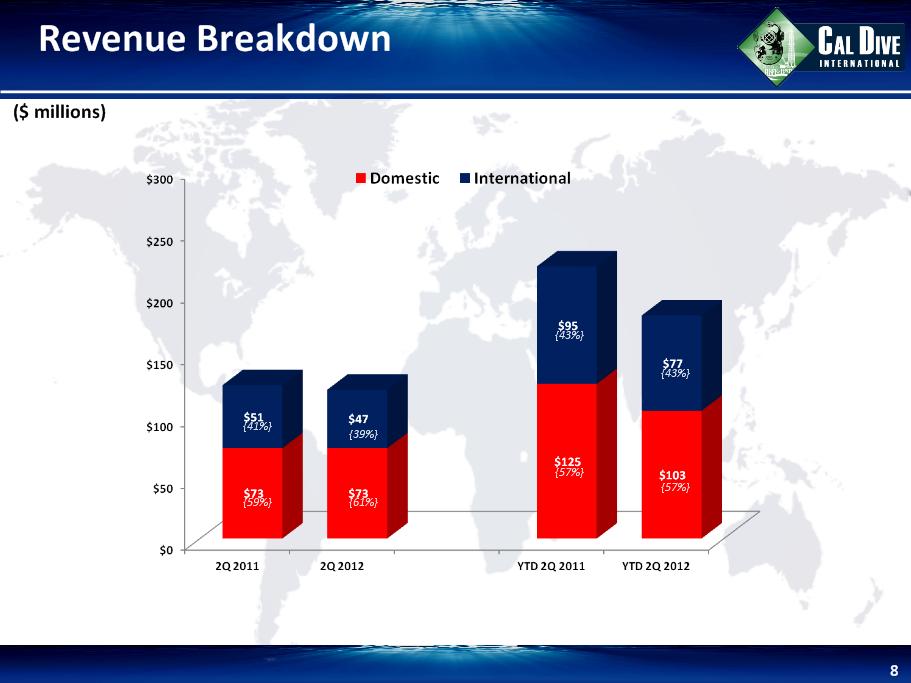
Revenue Breakdown * ($ millions) {46%} {54%} {48%} {52%} {41%} {59%} {39%} {61%} {43%} {57%} {43%} {57%}
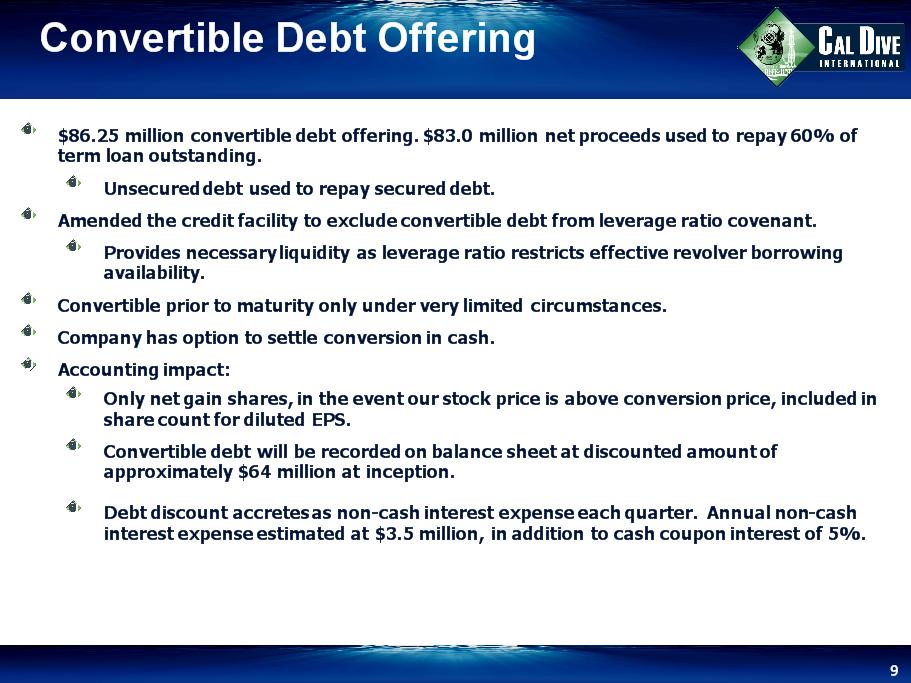
* Convertible Debt Offering $86.25 million convertible debt offering. $83.0 million net proceeds used to repay 60% of term loan outstanding. Unsecured debt used to repay secured debt. Amended the credit facility to exclude convertible debt from leverage ratio covenant. Provides necessary liquidity as leverage ratio restricts effective revolver borrowing availability. Convertible prior to maturity only under very limited circumstances. Company has option to settle conversion in cash. Accounting impact: Only net gain shares, in the event our stock price is above conversion price, included in share count for diluted EPS. Convertible debt will be recorded on balance sheet at discounted amount of approximately $64 million at inception. Debt discount accretes as non-cash interest expense each quarter. Annual non-cash interest expense estimated at $3.5 million, in addition to cash coupon interest of 5%.
Debt Levels * Net Debt Levels (1) Net Debt to Book Cap. % (2) Horizon Acquisition ($ millions) Calculated as Total Debt less Cash and Cash Equivalents. Calculated as Net Debt divided by Equity plus Net Debt.

Debt Levels * Net Debt Levels (1) Net Debt to Book Cap. % (2) Horizon Acquisition ($ millions) Calculated as Total Debt less Cash and Cash Equivalents. Calculated as Net Debt divided by Equity plus Net Debt.
Debt Levels * Net Debt Levels (1) Net Debt to Book Cap. % (2) Horizon Acquisition ($ millions) Calculated as Total Debt less Cash and Cash Equivalents. Calculated as Net Debt divided by Equity plus Net Debt.
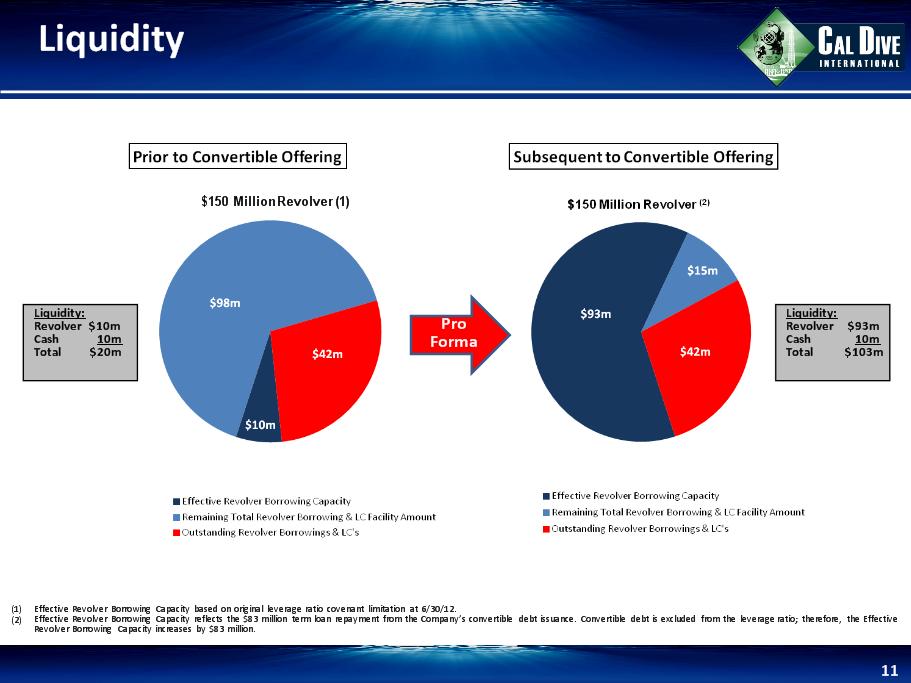
Liquidity * Liquidity: Revolver $10m Cash 10m Total $20m Effective Revolver Borrowing Capacity based on original leverage ratio covenant limitation at 6/30/12. Effective Revolver Borrowing Capacity reflects the $83 million term loan repayment from the Company’s convertible debt issuance. Convertible debt is excluded from the leverage ratio; therefore, the Effective Revolver Borrowing Capacity increases by $83 million. Pro Forma Liquidity: Revolver $93m Cash 10m Total $103m $150 Million Revolver (1)
Non-GAAP Reconciliations *
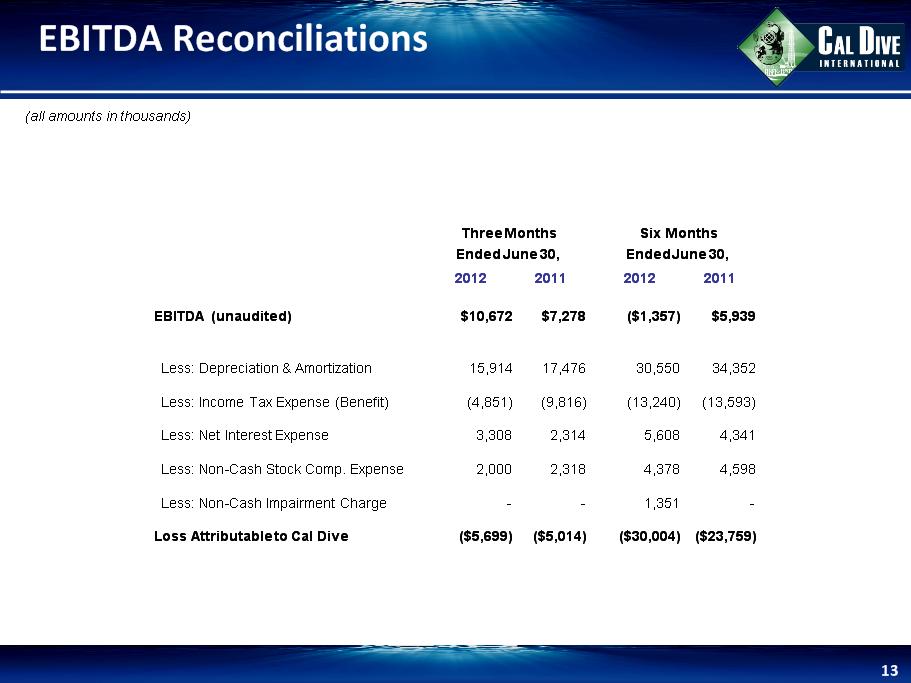
EBITDA Reconciliations * (all amounts in thousands) Three Months Three Months Three Months Six Months Six Months Six Months Ended June 30, Ended June 30, Ended June 30, Ended June 30, Ended June 30, Ended June 30, 2012 2011 2012 2011 EBITDA (unaudited) $10,672 $7,278 ($1,357) $5,939 Less: Depreciation & Amortization 15,914 17,476 30,550 34,352 Less: Income Tax Expense (Benefit) (4,851) (9,816) (13,240) (13,593) Less: Net Interest Expense 3,308 2,314 5,608 4,341 Less: Non-Cash Stock Comp. Expense 2,000 2,318 4,378 4,598 Less: Non-Cash Impairment Charge - - 1,351 - Loss Attributable to Cal Dive ($5,699) ($5,014) ($30,004) ($23,759)
EBITDA Reconciliations * (all amounts in thousands) Three Months Three Months Three Months Six Months Six Months Six Months Ended June 30, Ended June 30, Ended June 30, Ended June 30, Ended June 30, Ended June 30, 2012 2011 2012 2011 EBITDA (unaudited) $10,672 $7,278 ($1,357) $5,939 Less: Depreciation & Amortization 15,914 17,476 30,550 34,352 Less: Income Tax Expense (Benefit) (4,851) (9,816) (13,240) (13,593) Less: Net Interest Expense 3,308 2,314 5,608 4,341 Less: Non-Cash Stock Comp. Expense 2,000 2,318 4,378 4,598 Less: Non-Cash Impairment Charge - - 1,351 - Loss Attributable to Cal Dive ($5,699) ($5,014) ($30,004) ($23,759)