
Cal Dive International 1st Quarter 2013 Earnings Conference Call

Cautionary Statement This presentation may include "forward-looking" statements that are generally identifiable through the use of words such as "believe," "expect," "anticipate," "intend," "plan," "estimate," "project" and similar expressions and include any statements that are made regarding earnings expectations. The forward-looking statements speak only as of the date of this release, and the Company undertakes no obligation to update or revise such statements to reflect new information or events as they occur. These statements are based on a number of assumptions, risks and uncertainties, many of which are beyond the control of the Company. Investors are cautioned that any such statements are not guarantees of future performance and that actual future results may differ materially due to a variety of factors, including intense competition and pricing pressure in the Company's industry, the risks of cost overruns on fixed price contracts, the uncertainties inherent in competitive bidding for work, the operational risks inherent in the Company's business, risks associated with the Company's increasing presence internationally, and other risks detailed in the Company's most recently filed Annual Report on Form 10-K. *
Presentation Outline * Summary of 1Q 2013 Backlog Discussion of Financial Results Non-GAAP Reconciliations Q & A

Summary of 1Q 2013 * International markets remain strong; 73% of total revenues.Mexico – large project win; strong bidding activity.Australia – strong diving activity, although loss on lump sum project.Strong utilization for Uncle John.Typical winter seasonality in Gulf of Mexico with pricing pressure on diving services.Asset sales in April:Louisiana shore-based facility - $6.1 million.Dive equipment - $1.7 million.

Backlog * ($ millions)
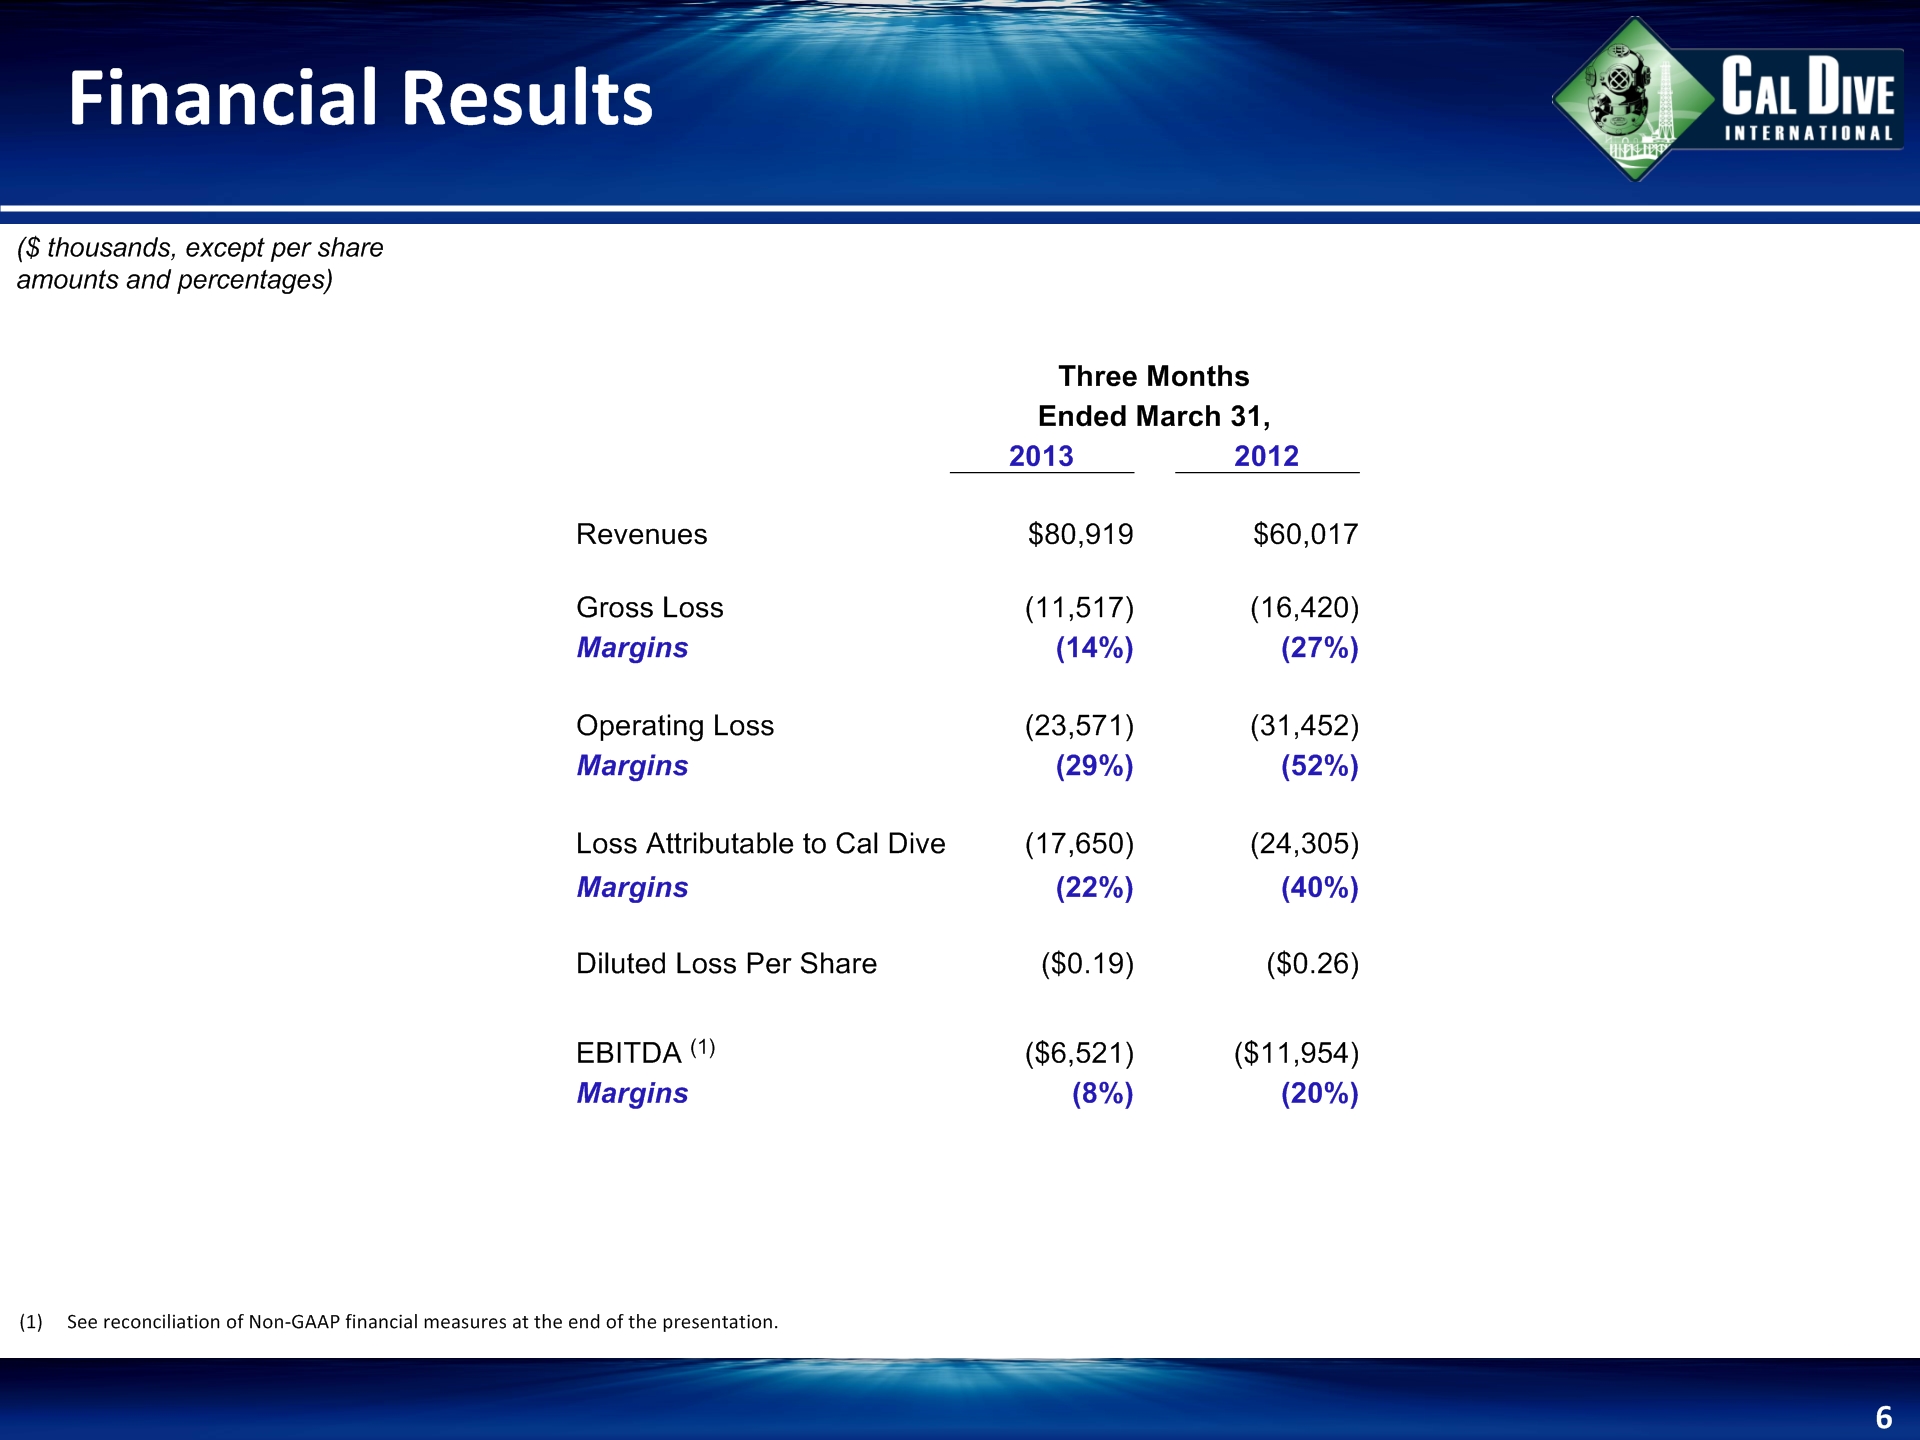
Financial Results * See reconciliation of Non-GAAP financial measures at the end of the presentation. ($ thousands, except per share amounts and percentages) Three Months Three Months Three Months Ended March 31, Ended March 31, Ended March 31, 2013 2012 Revenues $80,919 $60,017 Gross Loss (11,517) (16,420) Margins (14%) (27%) Operating Loss (23,571) (31,452) Margins (29%) (52%) Loss Attributable to Cal Dive (17,650) (24,305) Margins (22%) (40%) Diluted Loss Per Share ($0.19) ($0.26) EBITDA (1) ($6,521) ($11,954) Margins (8%) (20%)
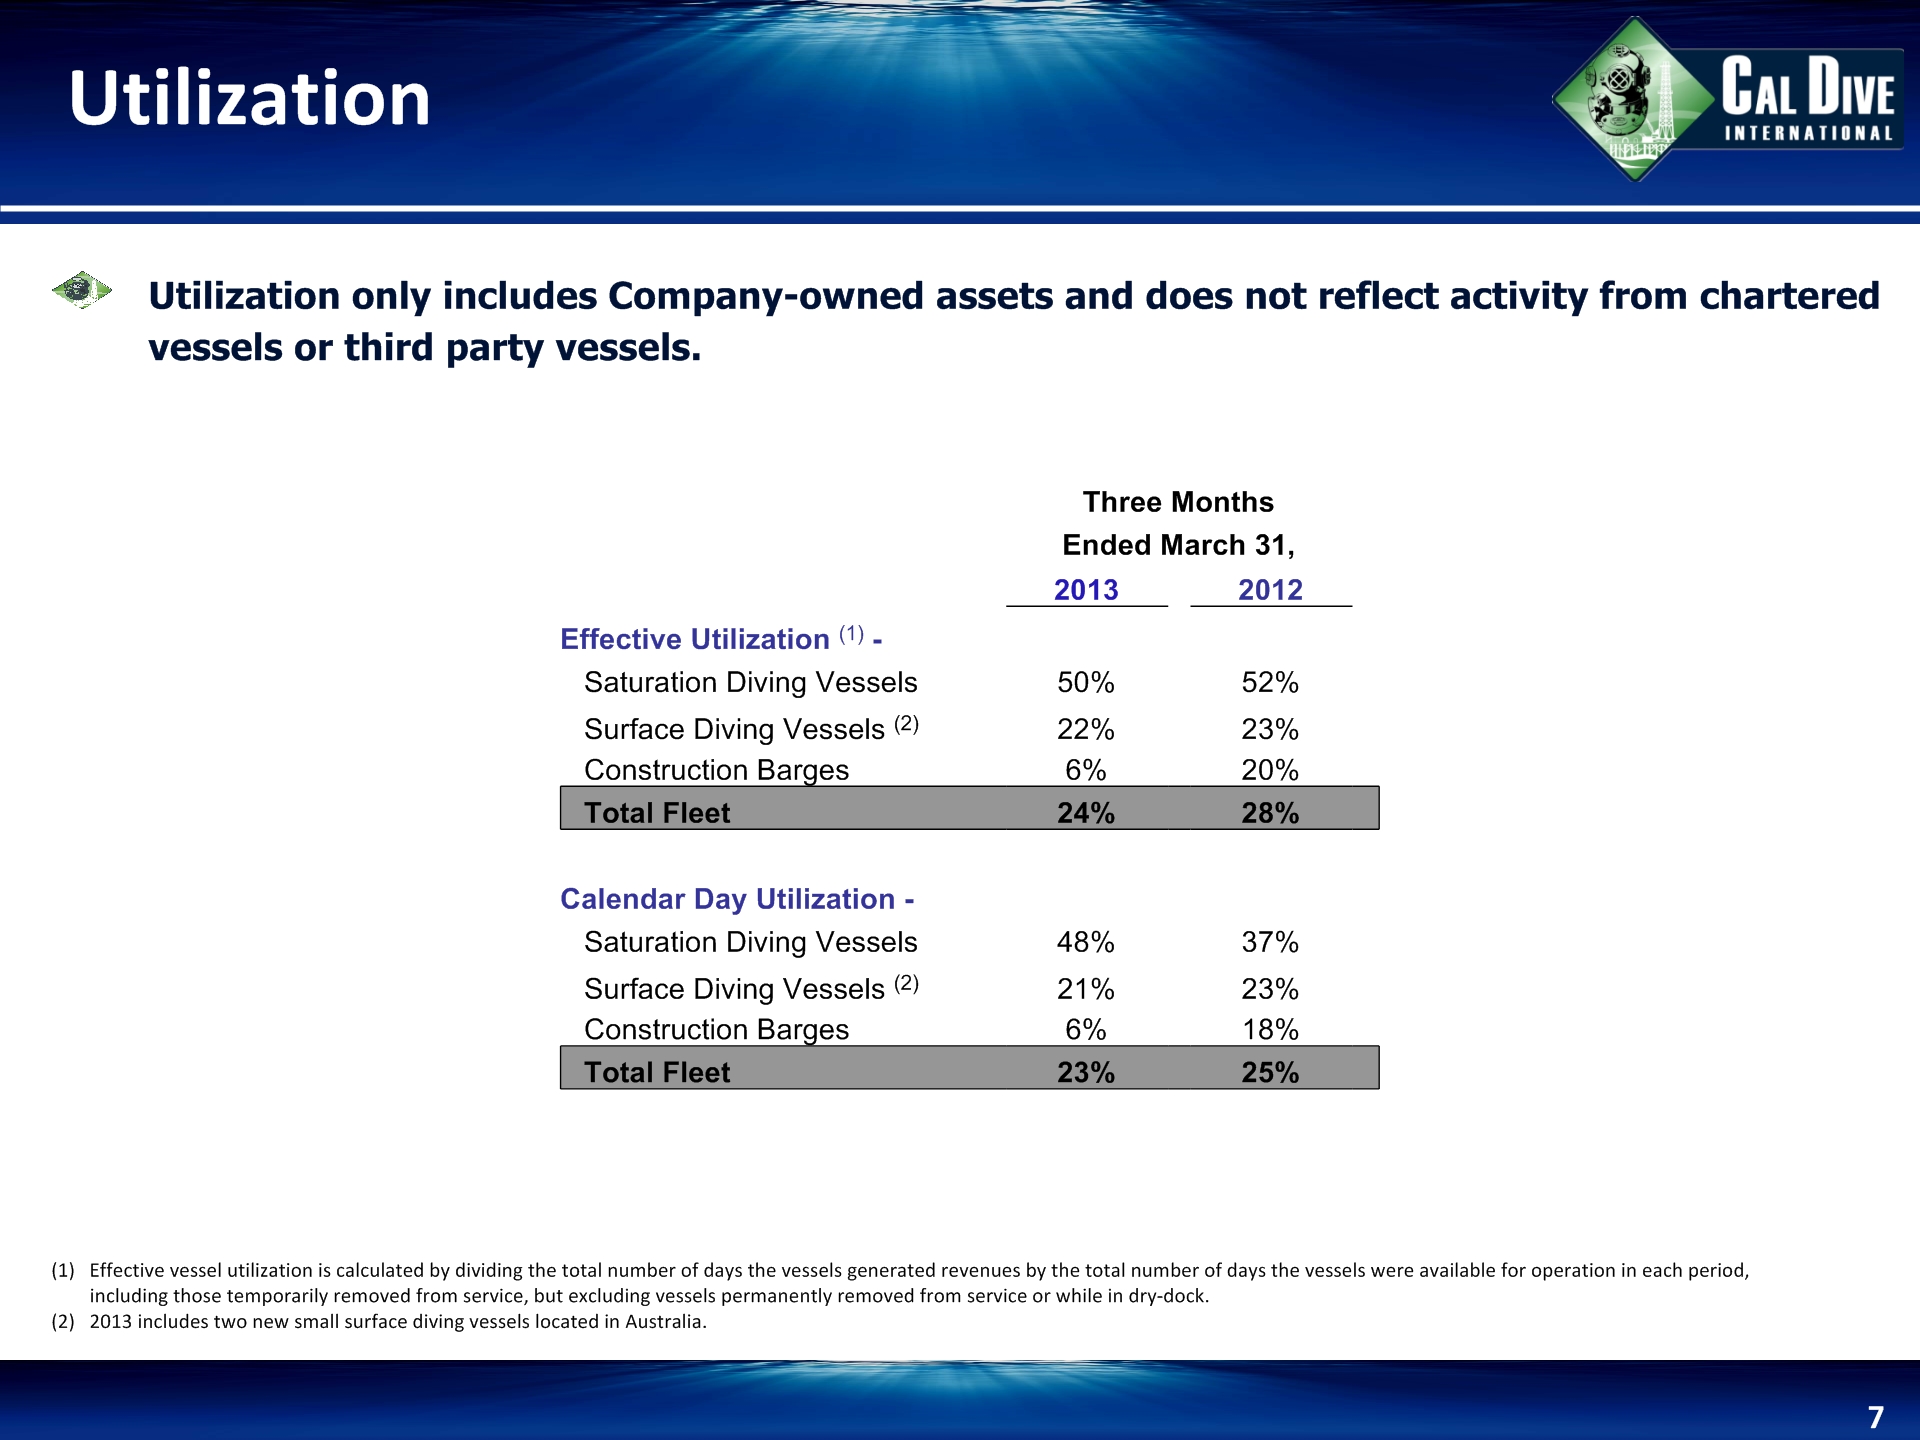
Utilization * (1) Effective vessel utilization is calculated by dividing the total number of days the vessels generated revenues by the total number of days the vessels were available for operation in each period, including those temporarily removed from service, but excluding vessels permanently removed from service or while in dry-dock.(2) 2013 includes two new small surface diving vessels located in Australia. Utilization only includes Company-owned assets and does not reflect activity from chartered vessels or third party vessels. Three Months Three Months Three Months Ended March 31, Ended March 31, Ended March 31, 2013 2012 Effective Utilization (1) - Saturation Diving Vessels 50% 52% Surface Diving Vessels (2) 22% 23% Construction Barges 6% 20% Total Fleet 24% 28% Calendar Day Utilization - Saturation Diving Vessels 48% 37% Surface Diving Vessels (2) 21% 23% Construction Barges 6% 18% Total Fleet 23% 25%

Revenue Breakdown * ($ millions) {55%} {45%} {47%} {53%} {55%} $81 {73%} {27%} {51%} {49%} $60
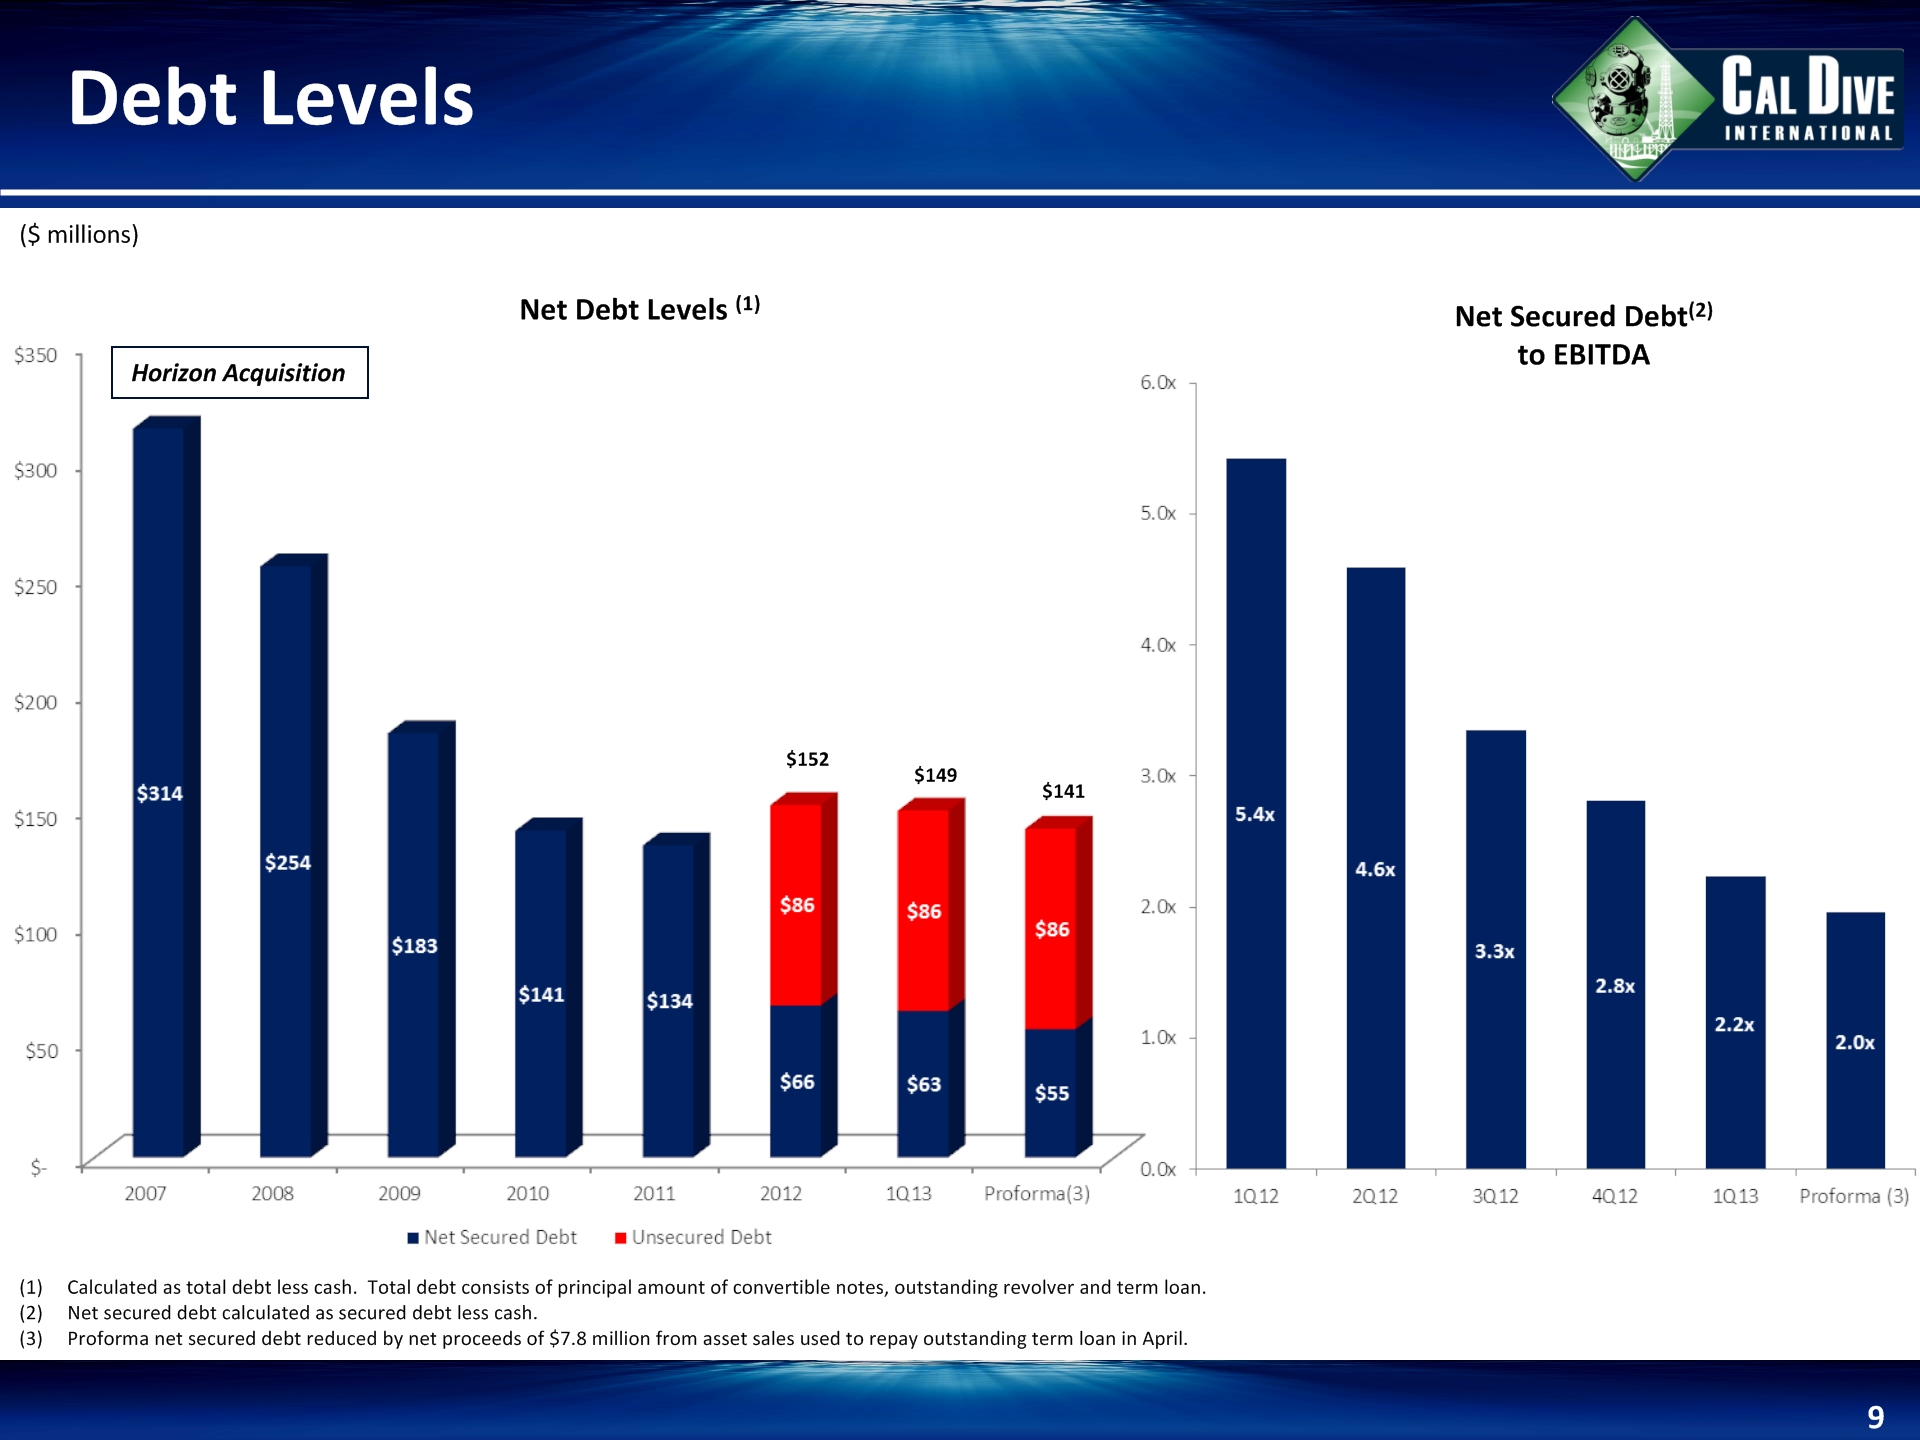
Debt Levels * Net Debt Levels (1) Net Secured Debt(2) to EBITDA ($ millions) Calculated as total debt less cash. Total debt consists of principal amount of convertible notes, outstanding revolver and term loan.Net secured debt calculated as secured debt less cash.Proforma net secured debt reduced by net proceeds of $7.8 million from asset sales used to repay outstanding term loan in April. $149 $141 $152 Horizon Acquisition

Revolver Capacity * Company in compliance with all financial covenants as of March 31, 2013.

Non-GAAP Reconciliations *

EBITDA Reconciliations * ($ thousands) Three Months Three Months Three Months Ended March 31, Ended March 31, Ended March 31, 2013 2012 EBITDA (unaudited) ($6,521) ($11,954) Less: Depreciation & amortization 14,180 14,636 Less: Income tax benefit (9,319) (8,389) Less: Net interest expense 4,632 2,300 Less: Interest expense - conversion feature adjustment 63 - Less: Non-cash stock compensation expense 1,448 2,378 Less: Severance charges - 75 Less: Non-cash impairment charges 125 1,351 Loss attributable to Cal Dive ($17,650) ($24,305)