Exhibit 99.2

k

Cautionary Statement This presentation may include "forward-looking" statements that are generally identifiable through the use of words such as "believe," "expect," "anticipate," "intend," "plan," "estimate," "project" and similar expressions and include any statements that are made regarding earnings expectations. The forward-looking statements speak only as of the date of this release, and the Company undertakes no obligation to update or revise such statements to reflect new information or events as they occur. These statements are based on a number of assumptions, risks and uncertainties, many of which are beyond the control of the Company. Investors are cautioned that any such statements are not guarantees of future performance and that actual future results may differ materially due to a variety of factors, including intense competition and pricing pressure in the Company's industry, the risks of cost overruns on fixed price contracts, the uncertainties inherent in competitive bidding for work, the operational risks inherent in the Company's business, risks associated with the Company's increasing presence internationally, and other risks detailed in the Company's most recently filed Annual Report on Form 10-K. *
Presentation Outline * Summary of 2Q 2013 Backlog Discussion of Financial Results Non-GAAP Reconciliations Q & A

Summary of 2Q 2013 * 65% of total revenues from international markets.Awarded two new contracts in Mexico totalling $187 million, in addition to the $63 million contract award in 1Q.Projects won at higher margins compared to last few years.Awarded fourth contract in Mexico on August 6th for $40 million.Backlog at June 30, 2013 - $400 million; highest since 3Q 2008.Does not include recent $40 million award in Mexico.Late start to good weather season in U.S. Gulf of Mexico; market continues to be sluggish.Delay in decommissioning and salvage projects due to permitting delays. Asset sales in April – $7.8 million proceeds used to pay down term loan.

Backlog * ($ millions) (1) Backlog for second quarter 2013 does not include $40 million Mexico project awarded on August 6, 2013. Backlog related to Macondo cleanup activities. (1)

Financial Results * See reconciliation of Non-GAAP financial measures at the end of the presentation. ($ thousands, except per share amounts and percentages) Three Months Three Months Three Months Six Months Six Months Six Months Ended June 30, Ended June 30, Ended June 30, Ended June 30, Ended June 30, Ended June 30, 2013 2012 2013 2012 Revenues $120,986 $120,321 $201,905 $180,338 Gross Profit (Loss) 2,630 153 (8,887) (16,267) Margins 2% 0% (4%) (9%) Operating Loss (5,029) (9,171) (28,600) (40,623) Margins (4%) (8%) (14%) (23%) Loss Attributable to Cal Dive (1,668) (5,699) (19,318) (30,004) Margins (1%) (5%) (10%) (17%) Diluted Loss Per Share ($0.02) ($0.06) ($0.21) ($0.32) EBITDA (1) $10,202 $10,672 $3,681 ($1,282) Margins 8% 9% 2% (1%)
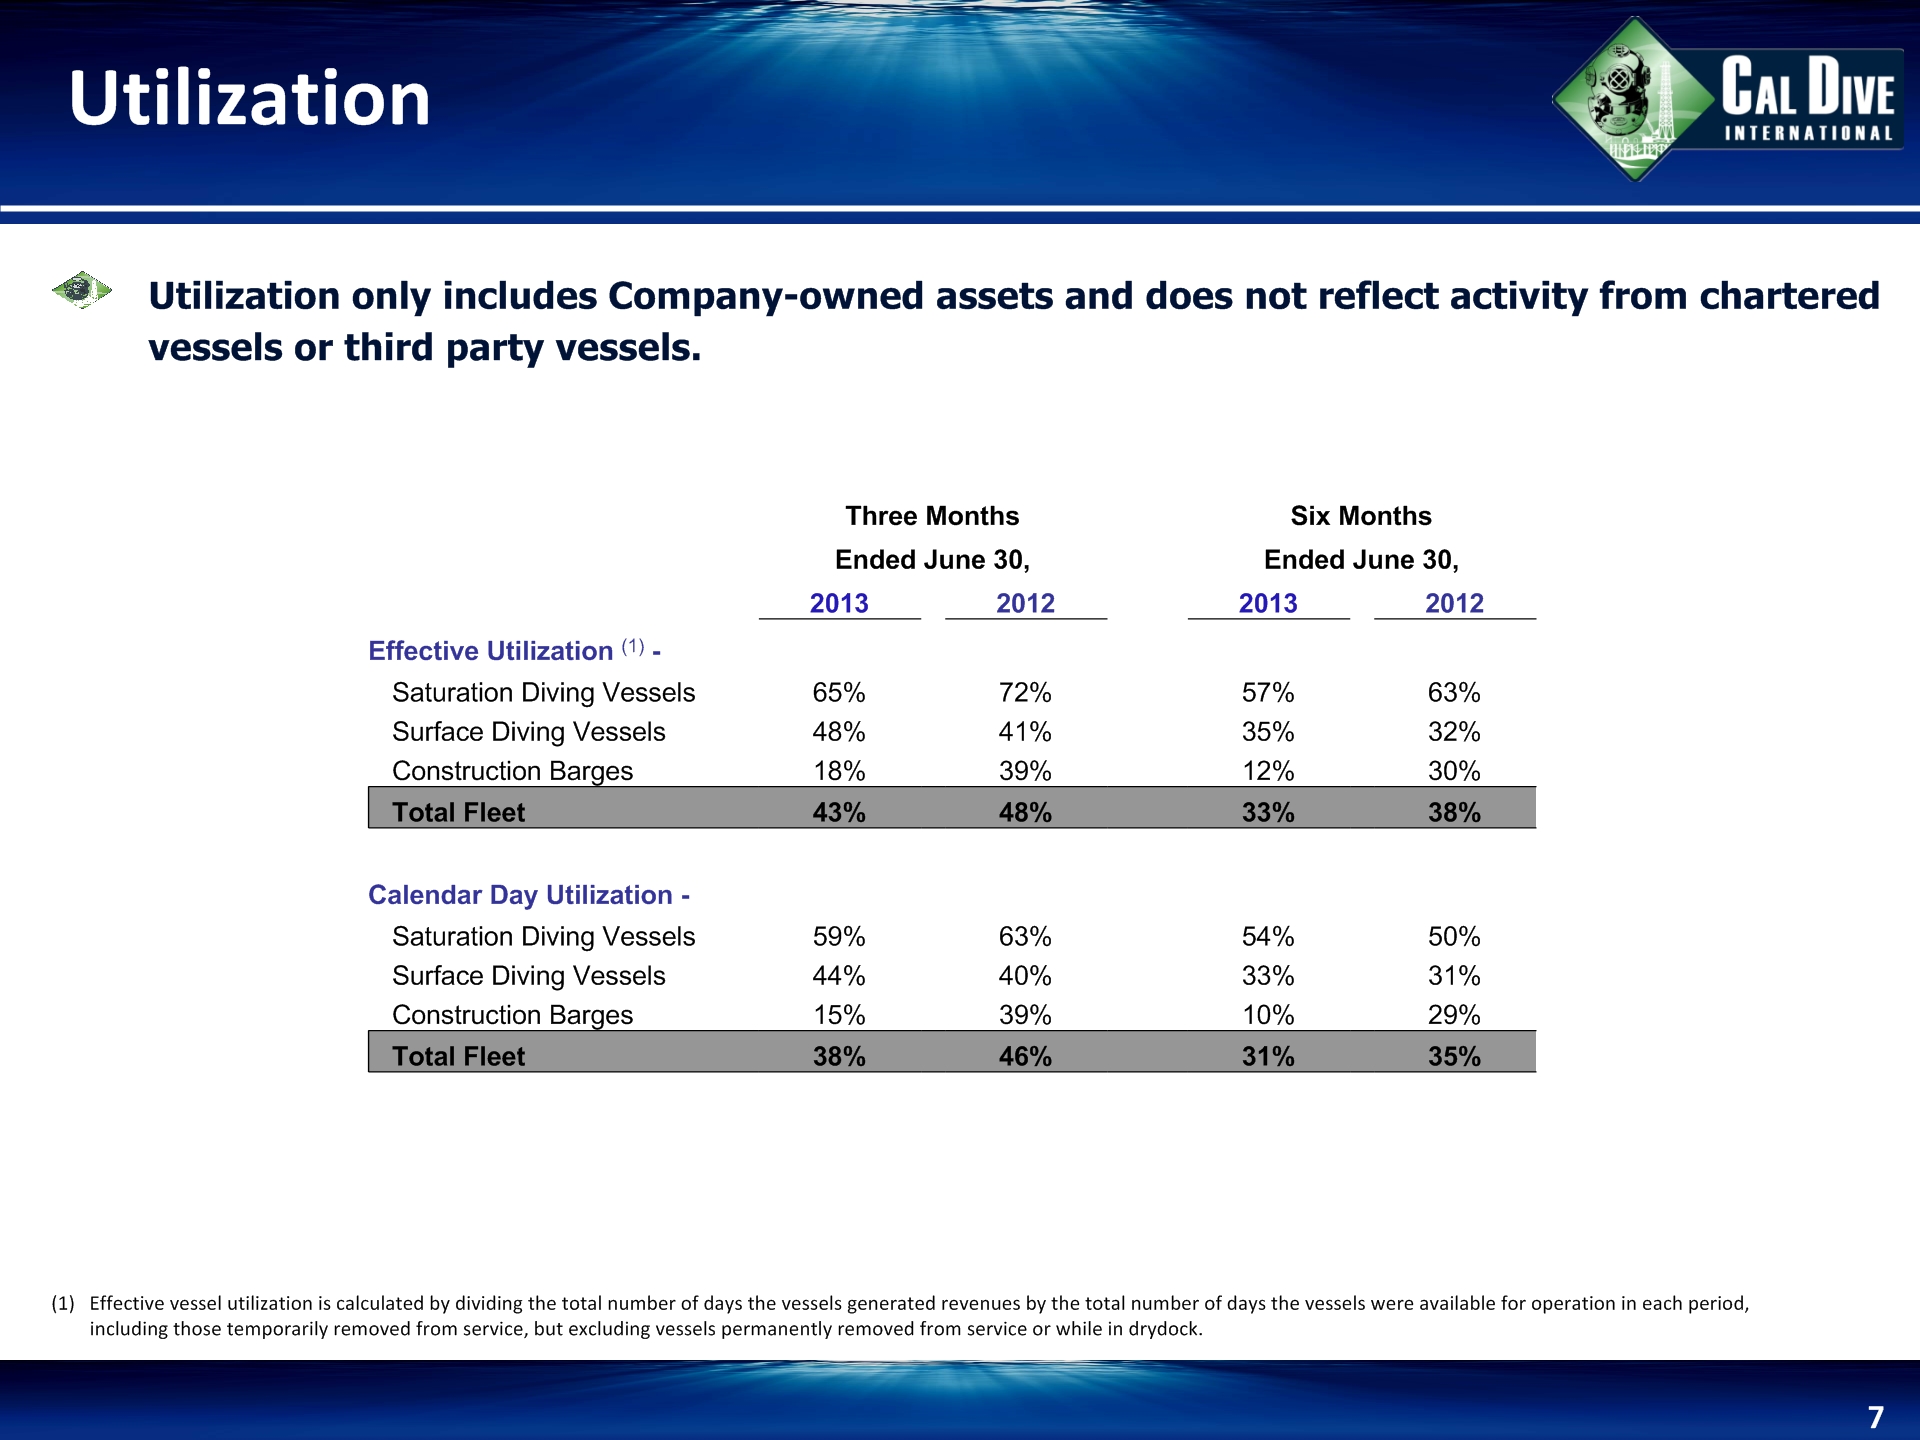
Utilization * (1) Effective vessel utilization is calculated by dividing the total number of days the vessels generated revenues by the total number of days the vessels were available for operation in each period, including those temporarily removed from service, but excluding vessels permanently removed from service or while in drydock. Utilization only includes Company-owned assets and does not reflect activity from chartered vessels or third party vessels. Three Months Three Months Three Months Six Months Six Months Six Months Ended June 30, Ended June 30, Ended June 30, Ended June 30, Ended June 30, Ended June 30, 2013 2012 2013 2012 Effective Utilization (1) - Saturation Diving Vessels 65% 72% 57% 63% Surface Diving Vessels 48% 41% 35% 32% Construction Barges 18% 39% 12% 30% Total Fleet 43% 48% 33% 38% Calendar Day Utilization - Saturation Diving Vessels 59% 63% 54% 50% Surface Diving Vessels 44% 40% 33% 31% Construction Barges 15% 39% 10% 29% Total Fleet 38% 46% 31% 35%

Revenue Breakdown * ($ millions) {55%} {45%} {47%} {53%} {55%} {73%} {27%} {51%} {49%} {35%} {39%} {65%} {43%} {57%} {61%} {68%} {32%}

Debt & Liquidity * Secured Term Loan ($ millions) Net secured debt calculated as secured debt less cash.Secured debt consists of $61.9 million outstanding revolver borrowings and $32.7 million outstanding term loan. Unsecured debt consists of $86.3 million principal amount of convertible debt and $20 million term loan for working capital requirements related to Mexico awards. Total Debt (2) Net Secured Debt (1) to EBITDA Wtd. Avg Interest Rate 6-7% Liquidity$125 Million Revolver & $8 Million Cash

Non-GAAP Reconciliations *

EBITDA Reconciliations * ($ thousands) Three Months Three Months Three Months Six Months Six Months Six Months Ended June 30, Ended June 30, Ended June 30, Ended June 30, Ended June 30, Ended June 30, 2013 2012 2013 2012 EBITDA (unaudited) $10,202 $10,672 $3,681 ($1,282) Less: Depreciation & amortization 13,631 15,914 27,811 30,550 Less: Income tax benefit (1,372) (4,851) (10,691) (13,240) Less: Net interest expense 4,630 3,308 9,262 5,608 Less: Interest expense - conversion feature adjustment (6,425) - (6,362) - Less: Non-cash stock compensation expense 1,406 2,000 2,854 4,378 Less: Severance charges - - - 75 Less: Non-cash impairment charges - - 125 1,351 Loss attributable to Cal Dive ($1,668) ($5,699) ($19,318) ($30,004)