Exhibit 99.2

Cal Dive International 4th Quarter 2013 Earnings Conference Call

Cautionary Statement This presentation and related commentary may include “forward-looking” statements that are generally identifiable through the use of words such as “believe,” “expect,” “anticipate,” “intend,” “plan,” “estimate,” “project” and similar expressions and include any statements that are made regarding earnings expectations. The forward-looking statements speak only as of the date of this presentation, and the Company undertakes no obligation to update or revise such statements to reflect new information or events as they occur. These statements are based on a number of assumptions, risks and uncertainties, many of which are beyond the control of the Company. Investors are cautioned that any such statements are not guarantees of future performance and that actual future results may differ materially due to a variety of factors, including intense competition and pricing pressure in the Company’s industry, the risks of cost overruns on fixed price contracts, the uncertainties inherent in competitive bidding for work, the operational risks inherent in the Company’s business, risks associated with the Company’s increasing presence internationally, and other risks detailed in the Company’s most recently filed Annual Report on Form 10-K. *

Presentation Outline * Summary of 4Q 2013 Backlog Discussion of Financial Results Non-GAAP Reconciliations Q & A

Summary of 4Q 2013 * Significant contribution from Pemex contracts.60% complete on four large Pemex projects at year-end.Remaining 40% provides good visibility during first half 2014.Harsh weather in Gulf of Mexico during fourth quarter.Lower utilization on Domestic fleet.Year-end backlog of $249 million highest fourth quarter backlog in five years.

Backlog * ($ millions)

Financial Results * Tax effected.See reconciliation of Non-GAAP financial measures at the end of the presentation. ($ thousands, except per share amounts and percentages) Three Months Three Months Three Months Twelve Months Twelve Months Twelve Months Ended December 31, Ended December 31, Ended December 31, Ended December 31, Ended December 31, Ended December 31, 2013 2012 2013 2012 Revenues $159,807 $146,396 $516,958 $464,847 Gross Profit (Loss) 10,497 10,078 12,056 (2,288) Margins 7% 7% 2% (0%) Operating Loss (938) (9,154) (49,959) (80,615) Margins (1%) (6%) (10%) (17%) Loss Attributable to Cal Dive (516) (19,092) (36,634) (65,029) Margins (0%) (13%) (7%) (14%) Diluted Loss Per Share ($0.01) ($0.21) ($0.39) ($0.70) Loss Attributable to Cal Dive ($516) ($19,092) ($36,634) ($65,029) Non-cash asset impairments (1) 549 4,046 13,657 19,704 Non-cash derivative liability adjustments (1) - 4,042 (4,135) (1,390) Non-cash income tax adjustments (1) - 6,558 - 6,477 Adjusted Income (Loss) Attributable to Cal Dive $33 ($4,446) ($27,112) ($40,238) Margins 0% (3%) (5%) (9%) Adjusted Diluted Earnings (Loss) Per Share $0.00 ($0.05) ($0.29) ($0.43) EBITDA 2 $17,052 $13,533 $34,175 $23,267 Margins 11% 9% 7% 5%

Utilization * (1) Effective vessel utilization is calculated by dividing the total number of days the vessels generated revenues by the total number of days the vessels were available for operation in each period, including those temporarily removed from service, but excluding vessels permanently removed from service or while in drydock. Utilization only includes Company-owned assets and does not reflect activity from chartered vessels or third party vessels. Three Months Three Months Three Months Twelve Months Twelve Months Twelve Months Ended December 31, Ended December 31, Ended December 31, Ended December 31, Ended December 31, Ended December 31, 2013 2012 2013 2012 Effective Utilization (1) - Saturation Diving Vessels 64% 75% 63% 69% Surface Diving Vessels 36% 33% 39% 36% Construction Barges 38% 39% 24% 35% Total Fleet 44% 46% 40% 44% Calendar Day Utilization - Saturation Diving Vessels 60% 75% 57% 62% Surface Diving Vessels 36% 33% 36% 35% Construction Barges 38% 39% 23% 34% Total Fleet 44% 46% 37% 42%
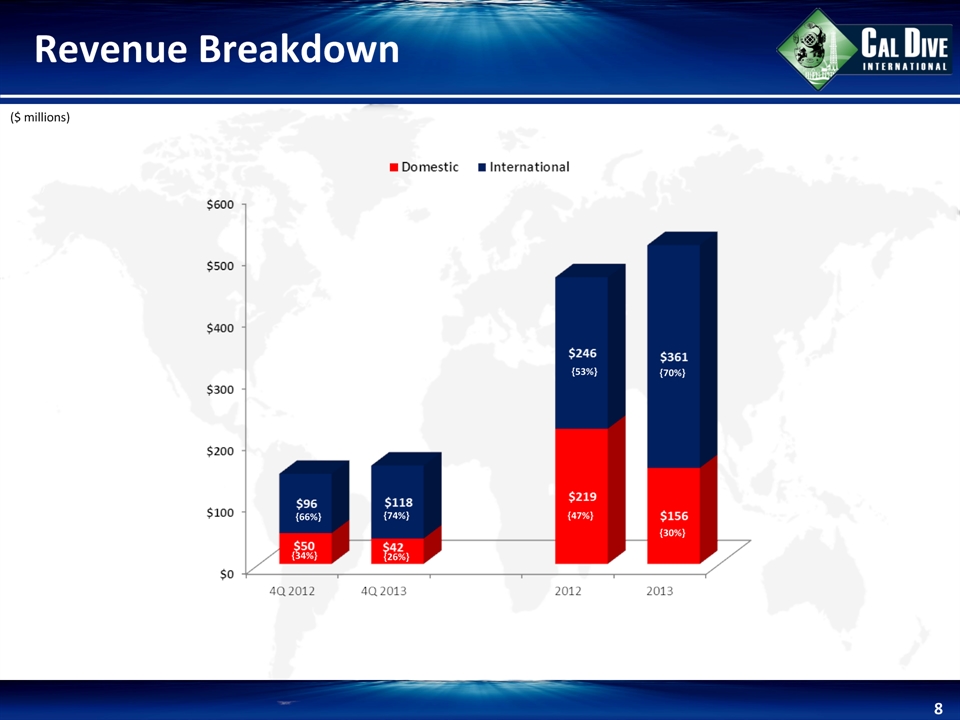
Revenue Breakdown * ($ millions) {55%} {45%} {47%} {53%} {55%} {73%} {27%} {51%} {49%} {32%} {52%} {68%} {47%} {53%} {48%} {68%} {32%} {26%} {66%} {74%} {53%} {47%} {34%} {70%} {30%}
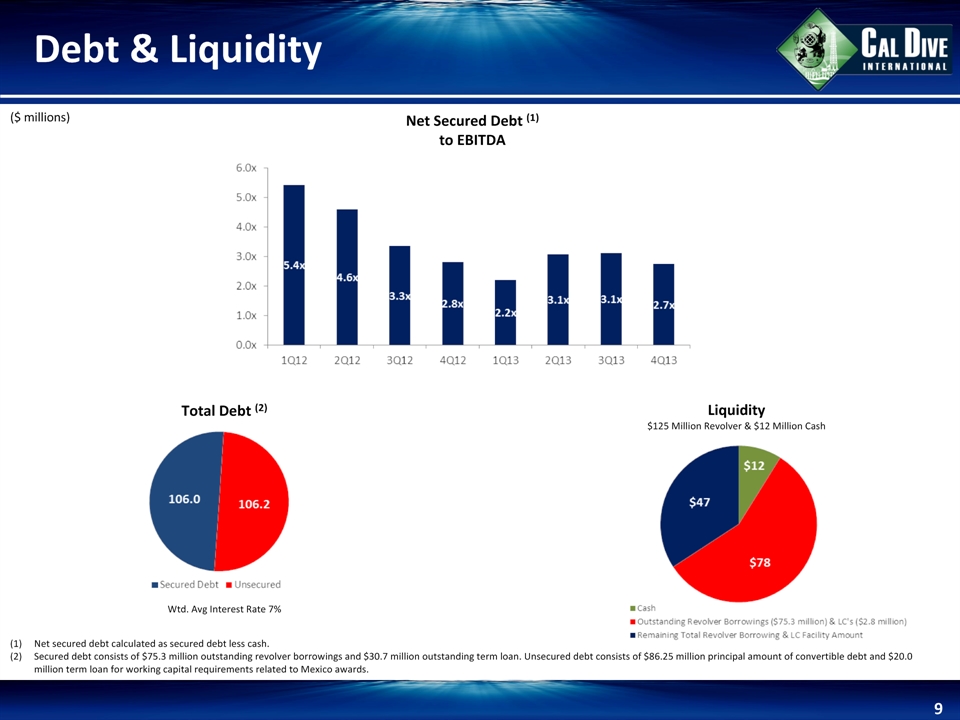
Debt & Liquidity * ($ millions) Net secured debt calculated as secured debt less cash.Secured debt consists of $75.3 million outstanding revolver borrowings and $30.7 million outstanding term loan. Unsecured debt consists of $86.25 million principal amount of convertible debt and $20.0 million term loan for working capital requirements related to Mexico awards. Total Debt (2) Net Secured Debt (1) to EBITDA Liquidity$125 Million Revolver & $12 Million Cash Wtd. Avg Interest Rate 7%

Non-GAAP Reconciliations *

EBITDA Reconciliations * ($ thousands) Three Months Three Months Three Months Twelve Months Twelve Months Twelve Months Ended December 31, Ended December 31, Ended December 31, Ended December 31, Ended December 31, Ended December 31, 2013 2012 2013 2012 EBITDA (unaudited) $17,052 $13,533 $34,175 $23,267 Less: Depreciation & amortization 14,258 15,037 55,779 61,581 Less: Income tax benefit (4,916) (834) (26,250) (24,739) Less: Net interest expense 6,336 4,643 21,275 14,786 Less: Interest expense - conversion feature adjustment - 6,218 (6,362) (2,139) Less: Non-cash stock compensation expense 1,046 1,277 5,357 7,762 Less: Severance charges - 60 - 2,289 Less: Non-cash impairment charges 844 6,224 21,010 28,756 Loss attributable to Cal Dive ($516) ($19,092) ($36,634) ($65,029)