![]()
CONTENTS
| CEO’s Letter to Shareholders | 2 |
| Interview with the President & COO | 4 |
| Property Overview | 6 |
| Reserve & Resource Tables | 12 |
| MD&A | 18 |
| Financial Statements | 32 |
| OWNERSHIP | 100% |
| RESERVES | 976 Mt Mill @ 0.50% CuEq (0.20% Cu, 0.24 g/t Au, 1.73 g/t Ag) 82 Mt Heap @ 0.37 g/t Au, 2.55 g/t Ag |
| PROCESS | Conventional flotation and gold heap leach |
| MINE TYPE | Open pit |
| MINE LIFE | 23 years |
| LOCATION | 380 km (240 mi) northwest of Whitehorse, Yukon 560 km (350 mi) from year-round port at Skagway, Alaska |
| STATUS | Pre-feasibility study completed/Permitting Preparation/Exploration |
WESTERN COPPER IS A CANADIAN MINING EXPLORATION AND DEVELOPMENT COMPANY WITH A FULL PIPELINE OF PROJECTS, A STRONG CASH POSITION, NO DEBT AND AN EXPERIENCED MANAGEMENT TEAM.
 | CEO’S LETTER TO THE SHAREHOLDERS |
Dear Shareholders,
2010 turned out to be a very good year for Western Copper Corporation. Our market capitalization, which was around $70 million mid-year, increased to $245 million by year-end and currently stands at $350 million.
After 2 years of intensive work at Casino, our flagship property, we more than doubled the size of the deposit to 2.8 billion tonnes. The numbers speak for themselves: measured, indicated and inferred resources consisting of 18 million ounces of gold, 10 billion pounds of copper, 1.3 billion pounds of molybdenum and 140 million ounces of silver. These numbers, most notably the 18 million ounces of gold, are impressive to say the least.
Throughout much of 2010, our engineering team worked on overhauling the existing pre-feasibility study for Casino. We released a significantly updated pre-feasibility study in early April 2011, which demonstrated the excellent economics of the project. At long term metal prices the project has an internal rate of return of 16.2 %, and 26.8 % at current metal prices. The project will cost $2.1 billion and will re-pay its capital in 3.3 years at long term metal prices and 2.1 years at current metal prices.
Casino is truly one of the world’s largest undeveloped copper, gold and molybdenum deposits. I am very proud of the great work that our technical team, including consultants, have done in bringing this project to its current level. The same team will now focus on the next step of completing a full feasibility and getting the project ready for permitting.
We are also continuing to advance our Carmacks copper project. Studies are underway that will address the concerns of the Water Board and it is our intent to re-submit our application later this year or early next year.
At Island Copper we are planning a comprehensive evaluation which will include a new resource estimate, a new geophysical survey and additional diamond drilling to better define the deposit; this information will be used to prepare a Preliminary Economic Assessment.
At Redstone, the geologic department of the University of British Columbia will be back in the field for their third year of assessing the potential of this exciting deposit.
Last year I noted that metal demand and prices were back to where they were prior to the 2009 financial crisis. This year it is safe to say that demand for all metalsand commodities in general has been remarkable.
| 02 | OVERVIEW |
| 2010 ANNUAL REPORT |
The major copper producers and producing nations are predicting that copper supplies will fall short of demand by 500,000 tonnes in 2011 and 2012 with little hope that supply and demand will be in balance in the foreseeable future. This is due to an unprecedented demand from China and other developing countries. Copper inventories currently stand at just under 600,000 tonnes; in China alone, total consumption is expected to reach over 7 million tonnes this year.
At the current projected world growth rate of 4%, it will require that 8 projects the size of Casino be built every year to meet demand. In other words, we expect that copper prices will continue to rise and that the current copper price will eventually prove to be conservative.
Western Copper has truly broken out in 2010, reaching new heights and entering anew league of development companies
As we work together to increase the company’s value even more so, the team is as focused and committed as ever to moving our projects forward to the benefit of our shareholders.
On behalf of the Board of Directors,
Dale CormanChairman and CEO
April 22, 2011
"AT THE CURRENT
PROJECTED WORLD
GROWTH RATE OF 4%,
IT WILL REQUIRE THAT
8 PROJECTS THE SIZE
OF CASINO BE BUILT
EVERY YEAR TO MEET
DEMAND"
| OVERVIEW | 03 | |
| 2010 ANNUAL REPORT |
| INTERVIEW WITH THEPRESIDENT& COO |  |
Q:What were the biggest high-lights of 2010, in your mind?
A:The key highlights from 2010 centered around our Casino project.
The new resource we issued in November was the result of an extensive program of drilling, re-logging, and re-modeling the deposit. The current resource figures raise the Casino project into a select group of very large world class copper-gold projects. The release of the new resource was followed by the pre-feasibility study update we released in early 2011, which cemented the robustness of the economics of Casino.
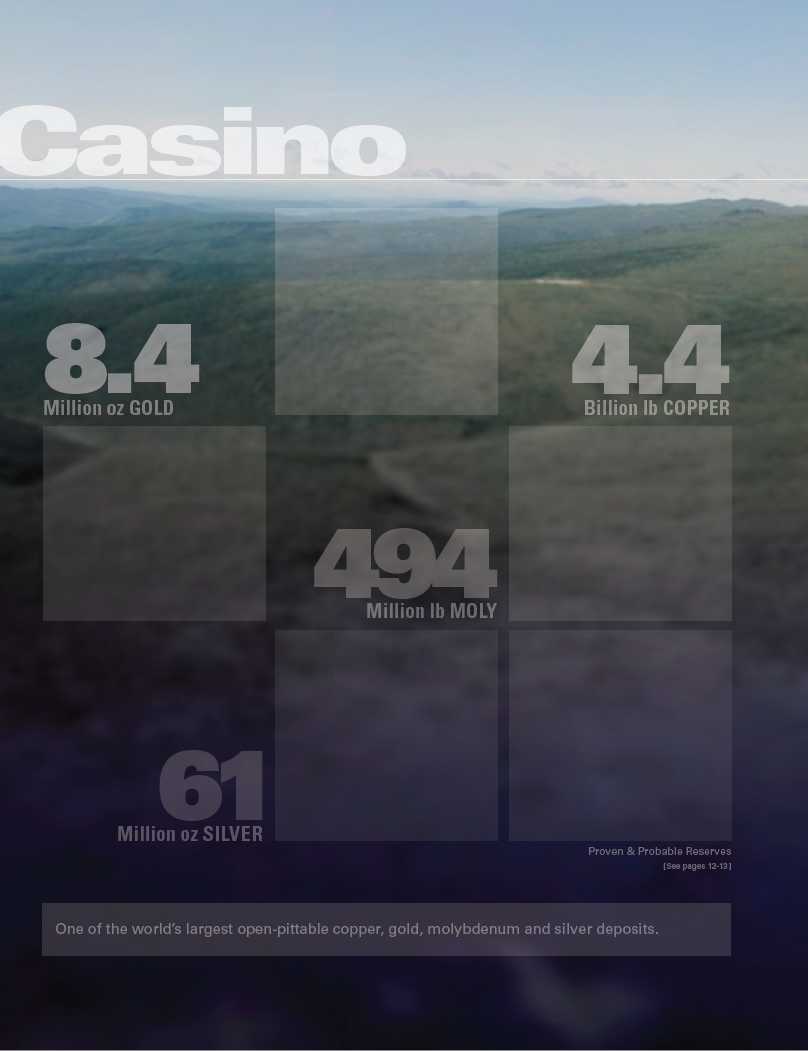
The other big highlight of 2010 was metal prices, with both copper and gold having a very strong year in 2010. Casino with 4.4 billion pounds of copper and 8.4 million ounces of gold in reserve is certainly an asset we are glad to have in this metal price environment.
Q:What was the biggest challenge of 2010?
A:Our biggest challenge during 2010 was keeping the company focused on Casino as our key project.
Having four excellent projects in our portfolio is certainly one of our strengths, but work on these projects needs to be managed carefully to ensure that our energies are directed on what will realize the most value to shareholders.
Q:What do you foresee as your biggest challenge for 2011?
A:For 2011, I see the key challenge as bringing the Island Copper project into active exploration while keeping the Casino project moving forward.
We think that the Island Copper project looks as strong as the Casino project; it’s just a couple of years behind.
We’ve got a great team in place already and we’re excited about bringing a second copper-gold project forward.
| 04 | OVERVIEW |
| 2010 ANNUAL REPORT |
Q:You ended the year by raising capital – how far will that take you and do you foresee another financing this year?
A:We may do a small flow-through financing this year to support the Island Copper project exploration program, but I don’t expect to do another large financing.
The $23 million we raised last year should easily support what we have planned for 2011 and bring us well into 2012.
Q:What distinguishes Western Copper from other companies in the junior copper space?
A:There are several things that distinguish Western Copper from other companies in the junior space.
First, is our rich portfolio of projects.
Not many junior mining companies can boast of having four excellent projects—particularly in the copper space.
Second is our team.
We have a strong internal team of engineers and geologists that can pick the right projects and move them forward quickly.
Last, is our track history.
Going back to the predecessor company, Western Silver, we’ve shown that we can build great shareholder value by taking projects from drill holes to feasibility and beyond, and we’re going to just keep working in that direction.
"NOT MANY JUNIOR
MINING COMPANIES CAN
BOAST OF HAVING FOUR
EXCELLENT PROJECTS
— PARTICULARLY IN THE
COPPER SPACE"
| OVERVIEW | 05 | |
| 2010 ANNUAL REPORT |
WORLD CLASS PROJECT IN THE YUKON
Casino
OVERVIEW
The Casino project is located 380 km northwest of Whitehorse, Yukon, within Selkirk First Nation traditional territory. Based on an updated pre-feasibility study completed in April 2011, the deposit will be developed as an open pit mine and a mill processing 120,000 tpd and producing an average of 435,000 ounces of gold, 234 million pounds of copper, 13 million pounds of molybdenum and 1.6 million ounces of silver per year over the first four years of production.
The pre-feasibility study recommends development of the Casino deposit as a conventional, electrified truck-shovel open pit mine. The initial development will focus on the deposit’s oxide cap as a heap leach operation to recover gold and silver in doré form. The main sulphide deposit will be processed using a conventional concentrator to produce copper-gold and molybdenum concentrates. Additionally, a pyrite rich stream from the concentrator will be leached in a CIL circuit for recovery of gold and silver. Copper-gold and molybdenum concentrates will be transported to the port of Skagway, Alaska for shipping to smelters.
NEXT STEPS
ADVANCE PROJECT FORWARD
- Initiate steps towards full feasibilitystudy
- Begin application for environmentalassessment
SECURE FINANCING
- Evaluate funding options
| 06 | OVERVIEW |
| 2010 ANNUAL REPORT |
PROVEN + PROBABLE RESERVE
| GOLD | COPPER | MOLY | SILVER |
| 8.4 | 4.4 | 494 | 61 |
| Million oz | Billion lb | Million lb | Million oz |
[See pages 12-13]
SNAPSHOT
| OWNERSHIP | 100% |
| DEPOSIT TYPE | Porphyry |
| PROCESS | Conventional flotation mill + gold heap leach |
| MINE TYPE | Open pit |
| MINE LIFE | 23 years |
| EMPLOYEES | 608 (peak) and 1,600 during construction |
| LOCATION | 380 km (240 mi) northwest of Whitehorse, Yukon 560 km (350 mi) from year-round port at Skagway, Alaska |
| STATUS | Permitting preparation / Exploration / Pre-feasibility update / Planning towards full feasibility |
KEY DATA
| SPOT | LONG | |
| Mar 2011(1) | TERM(2) | |
| Total Capex (C$ M) | 2,130 | |
| Pre-Tax NPV @ 5% (C$ M) | 5,860 | 2,570 |
| Pre-Tax NPV @ 8% (C$ M) | 3,927 | 1,570 |
| Pre-Tax IRR (100% equity) (%) | 32.2% | 19.6% |
| After-Tax NPV @ 5% (C$ M) | 4,004 | 1,700 |
| After-Tax NPV @ 8% (C$ M) | 2,621 | 963 |
| After-Tax IRR (100% equity) (%) | 26.8% | 16.2% |
| Cash Flow (Y1-Y4) (C$ M/y) | 830 | 567 |
| Cash Flow (LOM) (C$ M/y) | 430 | 250 |
| Payback (y) | 2.1 | 3.3 |
| Cu Cash Cost (net of credits) (US$ /lb) | (0.49) | 0.06 |
Based on Pre-Feasibility Study - April 2011
Notes:
| 1. | Metal price: US$ 4.30/lb Copper, US$1,439/oz Gold, US$17.29/lb Moly, US$37.87/oz Silver Foreign Exchange: C$1.00 = US$1.00 |
| 2. | Metal price: US$ 2.78/lb Copper, US$1,222.22/oz Gold, US$15.56/lb Moly, US$18.89/oz Silver Foreign Exchange C$1.00 = US$1.00 |
| OVERVIEW | 07 | |
| 2010 ANNUAL REPORT |
READY FOR CONSTRUCTION
Carmacks
OVERVIEW
The project will be an open pit mine producing copper cathode on site by crushing, stacking, and heap leaching the ore and treating the leach solution through a solvent extraction/electrowinning (SX-EW) plant. Construction will require 2 years, followed by more than 6 years of production. Power for the project will be taken from the yukon power grid via an 11 km spur line. Acid will be produced on site by a 140 tpd acid plant.
NEXT STEPS
OBTAIN WATER USE LICENSE
- Anticipate water license issued in 2012
GET PROJECT READY FOR PRODUCTION
- Examine development options
| 08 | OVERVIEW |
| 2010 ANNUAL REPORT |
| PRODUCTION | CASH COST |
| 32 | 0.84 |
| Million lb Cu/yr | US$/lb Cu |
SNAPSHOT
| OWNERSHIP | 100% |
| RESERVE | 10.6 million tonnes (Proven + Probable) |
| PRIMARY METALS | Copper |
| PROCESS | Heap leach, solvent extraction/electrowinning |
| END PRODUCT | Copper cathode |
| MINE TYPE | Open pit |
| MINE LIFE | 6+ years |
| EMPLOYEES | 180 (peak production), 250 (peak construction) |
| LOCATION | 220 km north of Whitehorse, Yukon - 400 km from year-round port at Skagway, AK |
| INFRASTRUCTURE | Good road access, upgrade of a 13 km access road |
| POWER | 12 km from Yukon power grid |
| STATUS | Engineering / Permitting (Obtained license allowing construction) |
KEY DATA
| SPOT | LONG | |
| Apr 2011(1) | TERM(2) | |
| Total Capex (C$ M) | 151 | |
| Copper (C$ M) | 4.30 | 2.50 |
| Foreign Exchange (%) | 1.00 | 0.90 |
| Pre-Tax NPV @ 8% (C$ M) | 313 | 92 |
| Pre-Tax IRR (100% equity) (%) | 50.3 | 22.1 |
| After Tax NPV @ 8% (C$ M) | 193 | 49 |
| After Tax IRR (100% equity) (%) | 37.5 | 16.4 |
| Cash Flow (C$ M/y) | 94 | 49 |
| Payback (y) | 1.6 | 3.8 |
Based on Pre-Feasibility Study - May 2007
Notes:
| 1. | Metal price: US$ 4.30/lb Copper - Foreign Exchange C$1.00 = US$1.00 |
| 2. | Metal price: US$ 2.50/lb Copper - Foreign Exchange C$.90 = US$1.00 |
| OVERVIEW | 09 | |
| 2010 ANNUAL REPORT |
PRIME LOCATION
Island Copper
OVERVIEW
The project is located on Vancouver Island 29 km from the reclaimed BHP Island Copper Mine. Excellent infrastructure including parts of the BHP marine load-out and hydro power infrastructure remain in place.
The Island Copper porphyry copper-molybdenum-gold property consists of 216 mineral claims (approximately 42,669 hectares) and is comprised of the Hushamu, Red Dog and NW Expo deposits. After internal review of the project an exploration plan for 2011 has been put in place.
SNAPSHOT
| OWNERSHIP | 100% |
| DEPOSIT TYPE | Porphyry |
| PRIMARY METALS | Copper, gold, molybdenum and rhenium |
| MINE TYPE | Open pit |
| LOCATION | Vancouver Island (25 km west of Port Hardy, BC) |
| INFRASTRUCTURE | 29 km (18 mi) from infrastructure of Island Copper Mine tide water port and high voltage power |
| STATUS | Commencing exploration options |
| RESOURCE | 231 M tonnes @ 0.47 CuEq (0.28% Cu, 0.31 g/t Au) |
Based on Technical Report: April 2005
| MEASURED + INDICATED RESOURCE | |
| COPPER | GOLD |
| 1.4 | 2.3 |
| Million lb | Million oz |
[See page 15]
NEXT STEPS
CONTINUE EXPLORATION
- Induced polarization (IP) study
- 5,000 – 10,000 m of drilling
| 10 | OVERVIEW |
| 2010 ANNUAL REPORT |
ENORMOUS POTENTIAL
Redstone
OVERVIEW
The Redstone project is located 290 km south of Norman Wells, Northwest Territories and comprises discontinuous claims and leases stretching over approximately 100 km in a northwest-southeast orientation. The Redstone copper belt is essentially an unmetamorphasized succession that is locally well exposed in an arcuate belt less than 15 km wide and about 300 km long. The inferred resource is located on the Coates Lake leases, which represents a small proportion of the total area of mineral rights. Western Copper is currently in the midst of a three year project with the University of British Columbia’s (UBC) mineral deposit research unit to analyze the regional geology in order to develop our future exploration plans.
SNAPSHOT
| OWNERSHIP | 100% |
| DEPOSIT TYPE | Sediment-hosted straitiform copper deposit |
| RESOURCE | 34 Million t @ 4.0 CuEq (3.92% Cu, 9.0 g/t Ag) |
| METALS | Copper and silver |
| MINE TYPE | Underground |
| LOCATION | Nahanni Mining District, Northwest Territories claims and leases over approximately 160 km |
| STATUS | UBC project to study regional geology and identify area with good exploration potential |
Based on Technical Report: August 2005
| INFERRED RESOURCE | |
| COPPER | COPPER |
| 2.9 | 3.92 |
| Billion lb | % Grade |
[See page 15]
NEXT STEPS
CONTINUE EXPLORATION PROGRAM
- UBC to continue ongoing study ofregional geology
- Exploration program to be developedbased on UBC’s results
| OVERVIEW | 11 | |
| 2010 ANNUAL REPORT |
RESERVE & RESOURCE TABLES
CASINO
NI 43-101 Compliant Resource Estimate*
LEACHED CAP / OXIDE GOLD ZONE AT 0.25 g/t Au Cut-off
| Resource Grade | Contained Metal | |||||||||
| Category | Tonnes M | Copper % | Gold g/t | Moly % | Silver g/t | CuEq % | Copper B lb | Gold M oz | Moly M lb | Silver M oz |
| Measured | 31 | 0.05 | 0.52 | 0.025 | 2.94 | 0.55 | 0.0 | 0.5 | 17 | 2.9 |
| Indicated | 53 | 0.03 | 0.33 | 0.017 | 2.36 | 0.36 | 0.0 | 0.6 | 20 | 4.0 |
| Measured + Indicated | 84 | 0.04 | 0.40 | 0.020 | 2.57 | 0.43 | 0.1 | 1.1 | 37 | 6.9 |
| Inferred | 17 | 0.01 | 0.31 | 0.008 | 1.93 | 0.27 | 0.0 | 0.2 | 3 | 1.1 |
SUPERGENE OXIDE ZONE AT 0.25% Cu EQ Cut-off
| Resource Grade | Contained Metal | |||||||||
| Category | Tonnes M | Copper % | Gold g/t | Moly % | Silver g/t | CuEq % | Copper B lb | Gold M oz | Moly M lb | Silver M oz |
| Measured | 25 | 0.28 | 0.52 | 0.026 | 2.38 | 0.78 | 0.2 | 0.4 | 14 | 1.9 |
| Indicated | 36 | 0.23 | 0.21 | 0.019 | 1.44 | 0.48 | 0.2 | 0.2 | 15 | 1.7 |
| Measured + Indicated | 61 | 0.25 | 0.34 | 0.022 | 1.82 | 0.60 | 0.3 | 0.7 | 30 | 3.6 |
| Inferred | 26 | 0.26 | 0.17 | 0.010 | 1.43 | 0.44 | 0.1 | 0.1 | 6 | 1.2 |
SUPERGENE SULPHIDE ZONE AT 0.25% Cu EQ Cut-off
| Resource Grade | Contained Metal | |||||||||
| Category | Tonnes M | Copper % | Gold g/t | Moly % | Silver g/t | CuEq % | Copper B lb | Gold M oz | Moly M lb | Silver M oz |
| Measured | 36 | 0.39 | 0.41 | 0.029 | 2.34 | 0.83 | 0.3 | 0.5 | 23 | 2.7 |
| Indicated | 216 | 0.24 | 0.22 | 0.019 | 1.72 | 0.50 | 1.1 | 1.5 | 90 | 11.9 |
| Measured + Indicated | 252 | 0.26 | 0.25 | 0.020 | 1.81 | 0.55 | 1.5 | 2.0 | 114 | 14.7 |
| Inferred | 102 | 0.20 | 0.19 | 0.010 | 1.49 | 0.39 | 0.5 | 0.6 | 23 | 4.9 |
HYPOGENE ZONE AT 0.25% Cu EQ Cut-off
| Resource Grade | Contained Metal | |||||||||
| Category | Tonnes M | Copper % | Gold g/t | Moly % | Silver g/t | CuEq % | Copper B lb | Gold M oz | Moly M lb | Silver M oz |
| Measured | 32 | 0.32 | 0.38 | 0.026 | 1.94 | 0.72 | 0.2 | 0.4 | 19 | 2.0 |
| Indicated | 711 | 0.17 | 0.21 | 0.023 | 1.65 | 0.45 | 2.7 | 4.8 | 360 | 37.7 |
| Measured + Indicated | 743 | 0.18 | 0.22 | 0.023 | 1.66 | 0.46 | 2.9 | 5.2 | 379 | 39.7 |
| Inferred | 1568 | 0.14 | 0.16 | 0.020 | 1.36 | 0.37 | 4.8 | 8.1 | 691 | 68.6 |
| 12 | OVERVIEW |
| 2010 ANNUAL REPORT |
NI 43-101 Compliant Reserve Estimate**
| Reserve Grade | Contained Metal | |||||||||
| Class | Tonnes M | Copper % | Gold g/t | Moly % | Silver g/t | CuEq % | Copper B lb | Gold M oz | Moly M lb | Silver M oz |
| MILL ORE Proven | 91 | 0.34 | 0.44 | 0.028 | 2.23 | 0.79 | 0.7 | 1.3 | 55 | 6.5 |
| MILL ORE Probable | 885 | 0.19 | 0.22 | 0.023 | 1.68 | 0.47 | 3.7 | 6.2 | 439 | 47.8 |
| MILL ORE TOTAL | 976 | 0.20 | 0.24 | 0.023 | 1.73 | 0.50 | 4.4 | 7.5 | 494 | 54.3 |
| Proven + Probable | ||||||||||
| HEAP LEACH Proven | 30 | 0.052 | 0.494 | - | 2.88 | n/a | 0.03 | 0.5 | - | 2.7 |
| HEAP LEACH Probable | 52 | 0.035 | 0.299 | - | 2.37 | n/a | 0.04 | 0.5 | - | 4.0 |
| HEAP LEACH TOTAL | 82 | 0.04 | 0.37 | - | 2.55 | n/a | 0.1 | 1.0 | - | 6.7 |
| Proven + Probable | ||||||||||
NOTES
| * | Supergene Oxide, Supergene Sulfide & Hypogene Zone cut-off 0.25% Cu Eq Leach Cap / Oxide Gold Zone cut-off 0.25 g/t Au |
Technical Report December 2010 - NI 43-101 Independent Qualified Person: Gary H. Giroux, P.Eng - Cu Eq Metal Prices: US$2.00/lb copper, US$875/oz gold, US$11.25/lb molybdenum | |
| ** | Technical Report May 2011 - NI 43-101 Independent Qualified Person: M. Hester FAusIMM - Cu Eq Metal prices: US$2.00/lb copper, US$875.00/oz gold and US$11.25/lb molybdenum |
| OVERVIEW | 13 | |
| 2010 ANNUAL REPORT |
CARMACKS
NI 43-101 Compliant Resource Estimate*
OXIDE
| Reserve Grade | Contained Metal | |||||||||
| Category | Tonnes M | Total Copper % | Oxide Copper % | Gold g/t | Silver g/t | CuEq % | Copper M lb | Gold k oz | Silver k oz | |
| Measured | 4.0 | 1.10 | 0.90 | 0.59 | 5.7 | 1.52 | 98 | 76 | 739 | |
| Indicated | 7.9 | 1.04 | 0.83 | 0.39 | 4.0 | 1.32 | 182 | 100 | 1,022 | |
| Measured + Indicated | 12.0 | 1.06 | 0.85 | 0.46 | 4.57 | 1.39 | 280 | 176 | 1,761 | |
| Inferred | 0.1 | 0.73 | 0.53 | 0.13 | 1.8 | 0.83 | 1 | 0 | 5 | |
SULPHIDE
| Reserve Grade | Contained Metal | |||||||||
| Category | Tonnes M | Total Copper % | Oxide Copper % | Gold g/t | Silver g/t | CuEq % | Copper M lb | Gold k oz | Silver k oz | |
| Measured | 0.7 | 0.80 | 0.02 | 0.26 | 2.5 | 0.99 | 12 | 6 | 56 | |
| Indicated | 3.6 | 0.74 | 0.03 | 0.21 | 2.3 | 0.89 | 59 | 25 | 270 | |
| Measured + Indicated | 4.3 | 0.75 | 0.03 | 0.22 | 2.33 | 0.91 | 72 | 30 | 325 | |
| Inferred | 4.0 | 0.71 | 0.01 | 0.18 | 1.9 | 0.84 | 63 | 23 | 246 | |
NI 43-101 Compliant Reserve Estimate**
| Reserve Grade | Contained Metal | |||||||||
| Class | Tonnes M | Total Copper % | Oxide Copper % | Gold g/t | Silver g/t | CuEq % | Copper M lb | Gold k oz | Silver k oz | |
| Proven | 3.2 | 1.23 | 1.028 | 0.659 | 6.20 | 1.70 | 86 | 68 | 636 | |
| Probable | 7.4 | 0.97 | 0.822 | 0.408 | 3.94 | 1.26 | 158 | 97 | 940 | |
| Proven & Probable | 10.6 | 1.04 | 0.88 | 0.48 | 4.62 | 1.39 | 222 | 165 | 1,576 | |
NOTES
| * | Technical Report: Wardrop, December 2007 - Qualified Person: G. Arsenau Ph.D., P.Geo & Scott Casselman P.Geo. - Total copper Cut-off: 0.25% - Cu Eq Metal prices: US$2.00/lb copper, US$875.00/oz gold, US$11.25/oz silver - Oxide resource estimate for Zones 1, 4 and 7. Sulphide resource estimate for Zone 1 - No discount for metallurgical recovery in contained metal figures |
| ** | Technical Report: May 2007 - Qualified Person: M. Hester FAusIMM - Cu Eq Metal prices: US$2.00/lb copper, US$875.00/oz gold, US$11.25/oz silver - Includes mining dilution |
| 014 | OVERVIEW |
| 2010 ANNUAL REPORT |
ISLAND COPPER
NI 43-101 Compliant Resource Estimate
| Resource Grade | Contained Metal | |||||
| Class | Tonnes M | Copper % | Gold g/t | CuEq % | Copper B lb | Gold M oz |
| Measured | 39 | 0.29 | 0.31 | 0.49 | 0.3 | 0.4 |
| Indicated | 192 | 0.27 | 0.31 | 0.47 | 1.1 | 1.9 |
| Measured + Indicated | 231 | 0.27 | 0.31 | 0.47 | 1.4 | 2.3 |
| Inferred | 53 | 0.28 | 0.38 | 0.52 | 0.3 | 0.6 |
NOTES
Technical Report: April 2005 - Qualified Persons: G. Giroux P. Eng. & D. Pawliuk P.Geo. - Total copper Cut-off: 0.20% - Cu Eq Metal prices: US$0.80/lb copper, US$350/oz gold - No discount for metallurgical recovery in contained metal figures
REDSTONE
NI 43-101 Compliant Resource Estimate
| Resource Grade | Contained Metal | |||||
| Class | Tonnes M | Copper % | Silver g/t | CuEq % | Copper M lb | Silver M oz |
| Inferred | 34 | 3.92 | 9.0 | 4.0 | 2,938 | 9.8 |
NOTES
Technical Report: August 2005 - Qualified Persons: A.W. Gourlay P.Geo. - 3.0% copper minimum assay intercept - Cu Eq Metal prices: US$2.00/lb copper, US$11.25/oz silver - No discount for metallurgical recovery in contained metal figures
| OVERVIEW | 15 | |
| 2010 ANNUAL REPORT |
MANAGEMENT
DISCUSSION & ANALYSIS
MANAGEMENT
DISCUSSION & ANALYSIS
MANAGEMENT DISCUSSION & ANALYSIS
The following management discussion and analysis of Western Copper Corporation (“Western Copper” or the “Company”) is dated March 24, 2011, and provides an analysis of the Company’s results of operations for the year ended December 31, 2010.
This discussion is intended to provide investors with a reasonable basis for assessing the financial performance of the Company as well as certain forward looking statements relating to its potential future performance. The information should be read in conjunction with the Western Copper Corporation December 31, 2010 audited annual consolidated financial statements and the related notes for the year then ended which have been prepared in accordance with Canadian generally accepted accounting principles. Western Copper’s accounting policies are described in note 2 of the December 31, 2010 audited annual consolidated financial statements. All of the financial information presented herein is expressed in Canadian dollars, unless otherwise indicated.
Western Copper is listed on the Toronto Stock Exchange (“TSX”) and the NYSE Amex under the symbol ‘WRN’. At March 24, 2011, the Company had 91,677,070 common shares outstanding.
Additional information on the Company can be found in the Company’s Annual Information Form (“AIF”), filed with Canadian regulators on SEDAR at www.sedar.com and with the United States Securities and Exchange Commission (the “SEC”) at www.sec.gov on Form 40-F.
The operations of the Company are highly speculative due to the high-risk nature of the mining industry. Western Copper faces risks that are generally applicable to its industry and others that are specific to its operations. Certain key risks affecting the Company’s current and future operations are discussed in its AIF and Form 40-F. This list is not exhaustive. Additional risks not currently known to the Company, or that the Company currently deems immaterial, may also impair the Company’s operations. If any of the risks actually occur, actual results could differ materially from those described in the forward looking statements contained in this management discussion and analysis. Reference is made to the discussion of forward-looking statements on page 27.
1. DESCRIPTION OF BUSINESS
Western Copper Corporation is a Canadian-based publicly-traded mineral exploration company with a primary focus of advancing its mineral properties towards production.
All of Western Copper’s properties are located in Canada. The Company’s two most advanced projects are located in the Yu-kon. The Casino project is one of the largest undeveloped porphyry deposits in Canada. Western Copper is currently working on updating the pre-feasibility study that it completed on the project in June 2008. The Carmacks Copper Project is in the last phase of permitting.
2. QUARTERLY SUMMARY OF ACTIVITIES
Significant increase to the Casino Project’s Mineral Resource Estimate
On November 1, 2010, Western Copper announced an updated resource estimate for the Casino Project. The new resource estimate is the first estimate to include the 26,000 metres of drilling performed by Western Copper over the past three years and represents a significant update to the resource estimated in 2008. In addition to the inclusion of the new drilling, the new estimate includes a re-interpretation of the geology of the deposit, which includes the re-logging of 90,000 metres of core.
| 18 | MANAGEMENTDISCUSSION & ANALYSIS | |
| 2010 ANNUAL REPORT |
Financing
On December 22, 2010, Western Copper issued 9,395,500 units at a price of $2.45 for gross proceeds of approximately $23 million. Each unit comprised one common share of the Company and half of one warrant. Each whole warrant is exercisable for one common share of the Company at a price of $3.45 and expires on December 22, 2012.
NYSE Amex Listing
Western Copper began trading on the New York Stock Exchange (“NYSE”) Amex on February 9, 2011 under the symbol ‘WRN’, the same symbol that the Company trades under on the TSX.
Carmacks Copper Project Water Use License Appeal Decision
On February 24, 2011, Western Copper received notification of the Yukon Supreme Court’s ruling regarding the Company’s appeal of the Yukon Water Board’s decision not to grant the Carmacks Copper Project a Water Use License. Western Copper had appealed the Yukon Water Board’s decision in order to clarify the rules it would have to follow for re-application of a Water Use License.
3. PROPERTY OVERVIEW
Casino (Yukon, Canada)
The Casino porphyry copper-gold-molybdenum deposit is located 300 kilometres northwest of Whitehorse, Yukon. It has been the subject of considerable exploration going back to 1967.
Should Western Copper make a production decision on the property, it is required to make a cash payment of $1 million. Production on the claims is also subject to a 5% net profits interest.
In June 2008, Western Copper announced that an independent pre-feasibility study on the Casino property supports the development of the project.
On November 1, 2010, Western Copper announced an updated resource estimate for the Casino Project. The new resource estimate is the first estimate to include the 26,000 metres of drilling performed by Western Copper over the past three years and represents a significant update to the resource estimated in 2008. In addition to the inclusion of the new drilling, the new estimate includes a re-interpretation of the geology of the deposit, which includes the re-logging of 90,000 metres of core under the direction of Jack McClintock, Consulting Geologist for Western Copper. The NI 43-101 technical report was filed on December 1, 2010.
The goal of the drilling campaign, to increase the near-surface supergene sulfide zone, was achieved. The size of this zone has increased from 133 million tonnes to 252 million tonnes at the measured and indicated level – an increase of 90% (Table 1).
The largest increase to the resource comes at the inferred level of categorization. The combined supergene oxide, super-gene sulphide, and hypogene inferred resource, at a 0.25% Copper Equivalent (“CuEq”) cutoff grade has been increased over 6 times to 1.70 billion tonnes (Table 2). The most recent results have added 7.4 million ounces of gold, 4.4 billion pounds of copper, and 615 million pounds of molybdenum to the resource at the inferred level.
The increase in supergene mineralization should result in higher grades at the beginning of the mine life and a lower strip ratio. Both of these factors are expected to improve the project’s economics. Western Copper plans to release the results of an updated pre-feasibility near the end of March 2011.
Other than the new resource estimate, the updated pre-feasibility is expected to include an increased throughput of 120,000 tonnes per day, the use of natural gas for power generation, and a new road route, among other items.
| MANAGEMENT DISCUSSION &ANALYSIS | 19 | |
| 2010 ANNUAL REPORT |
Following the release of the updated pre-feasibility study results, the Company will refine the engineering on metallurgy, geo-technical, and infrastructure and other aspects of the project with a view of progressing the Casino Project to the feasibility study stage by the end of 2012.
The Company will also continue its environmental programs in 2011 with a view of submitting the application to the Yukon Environmental and Socio-Economic Board (“YESAB”) by the end of 2012.
Table 1: Supergene Sulphide Zone Measured & Indicated Resource
Supergene Sulfide Zone (2010 Estimate)
| Class | Cutoff CuEq (%) | Tonnes M | Copper % | Gold g/t | Moly % | Silver g/t | CuEq % |
| Measured | 0.25% | 36 | 0.39 | 0.41 | 0.029 | 2.34 | 0.84 |
| Indicated | 0.25% | 216 | 0.24 | 0.22 | 0.019 | 1.72 | 0.50 |
| Total Measured + Indicated | 252 | 0.26 | 0.25 | 0.021 | 1.81 | 0.55 |
Supergene Sulfide Zone (2008 Estimate)
| Class | Cutoff CuEq (%) | Tonnes M | Copper % | Gold g/t | Moly % | Silver g/t | CuEq % |
| Measured | 0.25% | 33 | 0.39 | 0.47 | 0.030 | – | 0.87 |
| Indicated | 0.25% | 100 | 0.29 | 0.25 | 0.020 | – | 0.56 |
| Total Measured + Indicated | 133 | 0.31 | 0.31 | 0.020 | – | 0.63 |
Table 2: Inferred Resource of combined Supergene Oxide, Supergene Sulphide, and Hypogene Zones at 0.25% CuEq Cut-off
| Estimate | Tonnes M | Copper % | Gold g/t | Moly % | Silver g/t | CuEq % | Copper B lb | Gold M oz | Moly M lb | Silver M oz |
| New (2010) | 1,696 | 0.14 | 0.16 | 0.019 | 1.37 | 0.37 | 5.2 | 8.7 | 711 | 74.7 |
| Old (2008) | 232 | 0.16 | 0.18 | 0.019 | – | 0.38 | 0.8 | 1.3 | 95 | – |
| • | Gary Giroux, P.Geo. is the independent qualified person responsible for the preparation of the updated Mineral Resource estimate and the 2008 Mineral Resource estimate. | |
| ||
| • | The Copper Equivalent grade has been calculated using the following commodity prices: US$2.00/lb copper, US$875/oz gold, US$11.25/lb molybdenum, US$11.25/oz silver, and assuming 100% metallurgical recoveries. | |
| ||
| • | The 2008 Mineral Resource estimate Copper Equivalent grade has been calculated using the following commodity prices: US$0.80/lb copper, US$350/oz gold, US$4.50/lb molybdenum, and assuming 100% metallurgical recoveries. | |
| • | There has been no discount for metallurgical recovery in contained metal figures. |
Carmacks Copper Project (Yukon, Canada)
The Carmacks Copper Project is located 220 kilometres north of Whitehorse, Yukon.
In 2007, Western Copper reported the key findings of its feasibility study on the project and announced that the study supports the development of the mine. Based on the proven and probable reserve estimate of 10.6 million tonnes, the mine has an estimated six year ore production life. The feasibility study indicated initial capital development costs of $144 million, including a contingency of $14.1 million. An additional sum of $7.3 million is attributable to owner’s costs, which include the Company’s project team salaries, spare parts, and bond costs. The life-of-mine operating costs were estimated to be $0.98/ lb. of copper (US$0.84/lb. of copper at 0.85 US$/$). Using a copper price of US$2.32 per pound and an exchange rate of 0.85 US$/$, the feasibility study indicated a pre-tax IRR of 21.1% for the project.
| 20 | MANAGEMENTDISCUSSION & ANALYSIS | |
| 2010 ANNUAL REPORT |
In April 2009, Western Copper received the Quartz Mining License (“QML”) for the Carmacks Copper Project. This license permits the Company to begin construction of the Carmacks Copper Mine and establishes many of the terms and conditions under which the mine will operate.
The Water Use License (“WUL”) is the next and final permit required to build and operate the Carmacks Copper Project.
On May 10, 2010, Western Copper was notified by the Yukon Water Board (“Water Board”) that the Carmacks Copper Project would not receive the WUL under the current application. The Company subsequently filed a Petition with the Yukon Supreme Court appealing certain aspects the Water Board decision in order to clarify the rules it would have to follow to reapply for a Water Use License. The appeal hearing concluded on December 9, 2010.
On February 24, 2011, the Yukon Supreme Court ruled that the Water Board is not required to accept the findings of the YESAB which concluded that the project can be built and operated without significant environmental effect. Western Copper is considering the decision and will review its options before submitting a new WUL application.
Any production from the Carmacks Copper Project is subject to either a 15% net profits interest or a 3% net smelter royalty, at Western Copper’s election. If Western Copper elects the net smelter royalty, it has the right to purchase the royalty for $2.5 million, less any advance royalty payments made to that date. The Company is required to make an advance royalty payment of $100,000 for any year in which the average daily copper price reported by the London Metal Exchange is US$1.10 per pound or greater. As at the date of this report, Western Copper has made $800,000 in advance royalty payments.
Island Copper (British Columbia, Canada)
The Island Copper property consists of three blocks of mineral claims in a prospective copper-gold porphyry belt located on northern Vancouver Island, approximately 25 kilometres west of Port Hardy and 360 kilometres northwest of Vancouver, Brit-ish Columbia. The mineral claim blocks are referred to as the Hushamu claims, the Apple Bay claims, and the Rupert Block.
In 2008, Western Copper exercised its option on the Apple Bay claims and now owns 100% interest in all three mineral claim blocks that comprise the Island Copper property. An unrelated third party maintains the right to explore the Apple Bay claims for non-metallic minerals.
From August 2008 to July 2010, the Island Copper property was under option, most recently with Kobex Minerals Inc. (“Ko-bex”). On July 15, 2010, Kobex terminated its rights to earn-in to the property.
In 2011, Western Copper intends to restart exploration activities at the Island Copper property. The program will likely include geophysical surveying and drilling.
Should a production decision be made on the Hushamu claims, Western Copper is required to make a cash payment of $1 million to an unrelated third party within 60 days of the production decision. These mineral claims are also subject to a 10% net profits interest.
Should a production decision be made on the Apple Bay claims, Western Copper is required to pay $800,000 in cash or in Western Copper stock to an unrelated third party. The payment method is at the election of Western Copper.
Redstone (Northwest Territories, Canada)
The Redstone property comprises five mining leases and 15 mineral claims in six distinct areas in the Nahanni Mining District southwest of Norman Wells in the Northwest Territories.
In 2007, the Company signed an agreement with the Mineral Deposits Research Unit at the University of British Columbia (“MDRU”) to fund a research program that will aim to provide a better understanding of the regional geology and to identify the areas covered by the Company’s existing claims and leases that offer the most exploration potential.
MDRU spent the summers of 2009 and 2010 collecting data at and around the property. MDRU will continue its research in 2011. The field portion of the research program is expected to conclude in 2011.
| MANAGEMENT DISCUSSION &ANALYSIS | 21 | |
| 2010 ANNUAL REPORT |
The only area that presently has a NI 43-101 compliant resource estimate is the Coates Lake area. This area consists of the five mining leases noted above. Should production be initiated at Coates Lake, the five mining leases are subject to a net smelter royalty of between 3-4% depending on the monthly average of the final daily spot price of copper reported on the New York Commodities Exchange relating to each production month, as follows:
| • | 3% if the price is less than, or equal to US$0.75 per pound; | |
| • | 3.5% if the price is greater than US$0.75 per pound, but less than, or equal to US$1.00 per pound; and | |
| • | 4% if the price is greater than US$1.00 per pound. |
4. SELECTED QUARTERLY FINANCIAL INFORMATION
The following quarterly information has been extracted from the Company’s unaudited interim consolidated financial statements.
| As at and for the quarter ended | 31-Dec-10 | 30-Sep-10 | 30-Jun-10 | 31-Mar-10 | ||||||||
| Expressed in Canadian dollars | $ | $ | $ | $ | ||||||||
| Loss and comprehensive loss | 665,986 | 573,719 | 775,448 | 761,826 | ||||||||
| Loss per share – basic and diluted | 0.01 | 0.01 | 0.01 | 0.01 | ||||||||
| Mineral properties | 85,330,161 | 84,307,328 | 80,893,851 | 75,376,844 | ||||||||
| Cash, cash equivalents, and short-term investments | 23,636,895 | 3,728,713 | 8,232,576 | 10,798,525 | ||||||||
| Total assets | 109,377,291 | 88,500,931 | 89,688,423 | 87,003,474 |
| As at and for the quarter ended | 31-Dec-09 | 30-Sep-09 | 30-Jun-09 | 31-Mar-09 | ||||||||
| Expressed in Canadian dollars | $ | $ | $ | $ | ||||||||
| Loss and comprehensive loss | 233,672 | 509,122 | 594,590 | 522,773 | ||||||||
| Loss per share – basic and diluted | – | 0.01 | 0.01 | 0.01 | ||||||||
| Mineral properties | 72,790,644 | 70,960,998 | 67,117,675 | 65,970,008 | ||||||||
| Cash, cash equivalents, and short-term investments | 13,667,179 | 11,786,066 | 10,931,098 | 12,177,922 | ||||||||
| Total assets | 86,876,176 | 83,316,052 | 78,478,161 | 78,503,650 |
The quarterly fluctuations are due to the following:
Loss and Comprehensive Loss
The loss for the three months ended December 31, 2010 is in-line with the loss figures from September 30, 2010 and from March 31, 2009 to September 30, 2009. This is the approximate loss figure expected on a quarterly basis.
Loss and comprehensive loss is higher for the quarter ended June 30, 2010 than the previous quarters due to payments relating to changes in management.
Loss and comprehensive loss is higher during the period ended March 31, 2010 than the previous quarters because Western Copper issued and donated common shares in February 2010. The fair value of the common shares totaled $117,900 and was recorded as an office and administration expense.
Loss and comprehensive loss for the quarter ended December 31, 2009 is lower than the other quarters due to a future income tax recovery of $396,000 recorded during the quarter.
| 22 | MANAGEMENTDISCUSSION & ANALYSIS | |
| 2010 ANNUAL REPORT |
Mineral Properties
The Company continues to incur expenditures that add value to its mineral properties. As a result, the carrying value of the mineral properties has increased in every quarter presented above.
Cash, Cash Equivalents, and Short-term Investments
Cash is being spent to fund ongoing operations and to increase the value of the Company’s mineral properties. This has led to a decrease in cash, cash equivalents and short-term investments in the quarters presented above with the exception of the three months ended September 30, 2009, December 31, 2009, and December 31, 2010. Cash, cash equivalents and short-term investments increased in those quarters because the Company raised funds through private placements and public financings. The Company raised gross proceeds of $9.4 million and $23 million in 2009 and in 2010, respectively.
Total Assets
Because most dollars spent are capitalized to mineral properties, there has been no significant impact on total assets unless there is a financing. Total assets increased significantly in quarters when a financing occurred. Otherwise, the figure has remained relatively constant in all quarters presented.
5. RESULTS OF OPERATIONS
| For the quarter ended December 31, | 2010 | 2009 | 2008 | ||||||
| Expressed in Canadian dollars | $ | $ | $ | ||||||
| ADMINISTRATIVE EXPENSES | |||||||||
| Accounting and legal | 173,422 | 196,078 | 400,035 | ||||||
| Filing and regulatory fees | 80,882 | 72,728 | 78,101 | ||||||
| Office and administration | 2,116,235 | 1,800,325 | 1,921,138 | ||||||
| Shareholder communication | 462,391 | 414,303 | 354,521 | ||||||
| LOSS BEFORE TAXES AND OTHER ITEMS | 2,832,930 | 2,483,434 | 2,753,795 | ||||||
| OTHER ITEMS | |||||||||
| Foreign exchange | 1,735 | 10,786 | 51,731 | ||||||
| Interest income | (57,686 | ) | (238,166 | ) | (599,575 | ) | |||
| Write-off of mineral properties | – | – | 405,001 | ||||||
| LOSS BEFORE TAXES | 2,776,979 | 2,256,054 | 2,610,952 | ||||||
| Future income tax recovery | – | (395,897 | ) | (451,703 | ) | ||||
| LOSS AND COMPREHENSIVE LOSS | 2,776,979 | 1,860,157 | 2,159,249 |
| MANAGEMENT DISCUSSION &ANALYSIS | 23 | |
| 2010 ANNUAL REPORT |
Western Copper had a loss of $2.78 million ($0.03 per common share) for the year ended December 31, 2010 compared to a loss of $1.86 million ($0.02 per common share) in for the year ended December 31, 2009. Although the scale and nature of the Company’s administrative activity have remained consistent throughout 2009 and 2010, there are a number of items that have led to differences in the loss and comprehensive loss figures.
Western Copper recorded a future income tax recovery of $396,000 in 2009 as a result of changes in future tax rates. There was no such recovery in 2010.
Decreasing cash and short-term investment balances and lower interest rates led to a decline in interest income of $180,000 in 2010 as compared to 2009. Western Copper earns interest on its short-term investments, but as the Company uses its working capital to fund operations and mineral property development, its interest bearing balances decrease, leading to lower interest income until the Company’s next financing. Western Copper raised approximately $23 million in gross proceeds in December 2010. As a result, interest income is expected to increase slightly in 2011.
In February 2010, Western Copper made a donation of 90,000 common shares to the University of British Columbia’s Earth Systems Science Building. The fair value of the common shares totaled $117,900 and was recorded as an office and administration expense. There was no such expense in 2009.
| For the quarter ended December 31, | 2010 | 2009 | ||||
| Expressed in Canadian dollars | $ | $ | ||||
| ADMINISTRATIVE EXPENSES | ||||||
| Accounting and legal | 34,644 | 36,949 | ||||
| Filing and regulatory fees | 4,552 | 6,655 | ||||
| Office and administration | 541,119 | 482,521 | ||||
| Shareholder communication | 99,662 | 143,528 | ||||
| LOSS BEFORE TAXES AND OTHER ITEMS | 679,977 | 669,653 | ||||
| OTHER ITEMS | ||||||
| Foreign exchange | 430 | 243 | ||||
| Interest income | (14,421 | ) | (40,327 | ) | ||
| LOSS BEFORE TAXES | 665,986 | 629,569 | ||||
| Future income tax recovery | – | (395,897 | ) | |||
| LOSS AND COMPREHENSIVE LOSS | 665,986 | 233,672 |
Western Copper had a loss of $666,000 ($0.01 per common share) for the three months ended December 31, 2010. For the same period in 2009, the Company had a loss of $234,000 (less than $0.01 per common share).
The most significant reason for the difference is the future income tax recovery recorded in 2009 as a result of a change in future tax rates. There is no such expense in 2010.
| 24 | MANAGEMENTDISCUSSION & ANALYSIS | |
| 2010 ANNUAL REPORT |
6. LIQUIDITY AND CAPITAL RESOURCES
| For the year ended December 31, | 2010 | 2009 | 2008 | ||||||
| Expressed in Canadian dollars | $ | $ | $ | ||||||
| CASH PROVIDED BY (USED IN) | |||||||||
| Operating activities | (2,339,148 | ) | (1,793,475 | ) | (1,735,717 | ) | |||
| Financing activities | 24,784,204 | 8,956,411 | 500 | ||||||
| Investing activities | (24,250,489 | ) | (8,764,009 | ) | (16,954,526 | ) | |||
| INCREASE (DECREASE) IN CASH AND CASH EQUIVALENTS | (1,805,433 | ) | (1,601,073 | ) | (18,689,743 | ) | |||
| Cash and cash equivalents – beginning of the year | 3,436,131 | 5,037,204 | 23,726,947 | ||||||
| CASH AND CASH EQUIVALENTS – ENDING | 1,630,698 | 3,436,131 | 5,037,204 |
In addition to its cash and cash equivalents, the Company had $22 million in short-term investments at year-end. As at December 31, 2010, cash, cash equivalents, and short-term investments total $23.6 million. As at December 31, 2009, cash, cash equivalents, and short-term investments total $13.7 million. The figure increased $10 million in 2010 because of the Company raised net proceeds of $21.6 million on December 22, 2010 and received $2.5 million as a result of warrants exercised in 2010 while spending approximately $15 million on exploration and development costs and administrative expenses. Net proceeds from financing activities only totaled $9.0 million in 2009.
Cash and cash equivalents comprise cash deposits held at banks. Short-term investments consist of Guaranteed Investment Certificates (“GIC”) from Canadian chartered banks that are cashable at the Company’s discretion without penalty.
Western Copper is an exploration stage enterprise. As at December 31, 2010, the Company has not earned any production revenue. It depends heavily on its working capital balance and its ability to raise funds through capital markets to finance its operations.
Based on its current estimates, management expects that Western Copper will have sufficient working capital to fund its administrative expenses and its mineral property costs in 2011. The Company will have to raise significant additional capital in order to build any of its projects.
The financial statements have been prepared on a going concern basis, which contemplates the realization of assets and the satisfaction of liabilities in the normal course of business. The Company’s ability to continue as a going concern is substantially dependent on its ability to raise funds necessary to acquire assets, perform exploration and development activities, and conduct its corporate affairs primarily through the issuance of its common shares. There is a risk that in the future the Company may not be able to raise the capital required to fund operations. .
Operating Activities
The significant components of operating activities are discussed in the Results of Operations section above.
Financing Activities
On December 22, 2010, Western Copper raised gross proceeds of $23 million dollars by issuing 9,395,500 units at a price of $2.45. Each unit comprised one common share of the Company and half of one warrant.
| MANAGEMENT DISCUSSION &ANALYSIS | 25 | |
| 2010 ANNUAL REPORT |
On July 10, 2009, the Company issued 4 million units at a price of $1.00 per unit. Each unit comprised one flow-through common share and half of one warrant. On December 4, 2009, the Company issued 2.15 million units at a price of $2.50 per unit. Each unit comprised one flow-through common share and a whole warrant.
In May 2010, the expiration date of the investor warrants issued as part of the July 2009 private placement was accelerated from July 2012 to June 2010. As a result, Western Copper received $2.46 million from the exercise of 1,964,000 warrants during the year ended December 31, 2010. During the year ended December 31, 2009, the Company received $251,000 from the exercise of broker warrants relating to the July 2009 financing.
The Company received $695,000 from the exercise of stock options during the year ended December 31, 2010. During the year ended December 31, 2009, Western Copper received $107,000 from the exercise of stock options. The amount of stock options exercised increased in 2010 when compared to the previous year due to the timing of stock option expiry dates and an increase in Western Copper’s share price during the second half of 2010.
Investing Activities
Investing activities include both mineral property expenditures and purchases of short-term investments. In December, the Company transferred approximately $20 million received from the financing into short-term investments from cash and cash equivalents. Until the December transfer, the Company had divested $8 million in short-term investments in 2010 to pay for the exploration and on-going permitting activities at the Casino Project. In 2009, the Company purchased $2.23 million in short-term investments
The Company expended $12.5 million on mineral property expenditures during 2010. This compares with $6.5 million during 2009. The majority of these costs were spent on the exploration and permitting programs at the Casino Project. The scope of both of these programs was twice as much in 2010 compared to 2009.
A summary of activities relating to each project is available under the Property Overview section at the beginning of this document.
7. CONTRACTUAL OBLIGATIONS
The Company leases office space in Vancouver, British Columbia and Whitehorse, Yukon. The future minimum lease payments by calendar year are approximately as follows:
| Expressed in Canadian Dollars | Vancouver | Whitehorse | ||||
| $ | $ | |||||
| 2011 | 210,288 | 28,635 | ||||
| 2012 | 212,313 | - | ||||
| 2013 | 215,149 | - | ||||
| 2014 | 90,489 | - | ||||
| Thereafter | - | - | ||||
| TOTAL | 728,239 | 28,635 |
Western Copper has no debt and does not pay dividends.
The Company has no material off-balance sheet arrangements, no material capital lease agreements and no material long term obligations other than those described above or in the description of mineral properties contained in the consolidated financial statements.
Neither the Company nor any of its subsidiaries has any externally imposed capital requirements.
| 26 | MANAGEMENTDISCUSSION & ANALYSIS | |
| 2010 ANNUAL REPORT |
8. SIGNIFICANT ACCOUNTING ESTIMATES
Use of Estimates
The preparation of the consolidated financial statements in conformity with generally accepted accounting principles requires management to make estimates and assumptions that affect the amounts reported in the financial statements and the related notes. Significant areas where management’s judgment is applied include the assessment of impairment to the carrying value of mineral properties, the determination of the likelihood that future income tax benefits can be realized, the assumptions used to calculate the fair value of warrants and stock options, amounts and likelihood of contingent liabilities, and the cost allocation methodologies used to determine results of operations, the value of financing components, and the value of purchased assets. Actual results could differ from the estimates by a material amount.
Mineral Properties
Direct costs related to the acquisition, exploration, and development of mineral properties owned or controlled by the Company are deferred on an individual property basis until the viability of a property is determined or until the property is sold, abandoned, placed into production or determined to be impaired. Administration costs and general exploration costs are expensed as incurred. If a property is placed into commercial production, deferred costs will be amortized using the unit-of production method based on proven and probable reserves. The carrying amount for mineral properties represents costs net of write-downs to date and does not necessarily reflect present or future values. Recovery of capitalized costs is dependent on successful development of economic mining operations or the disposition of the related mineral properties.
The Company reviews the carrying value of mineral properties when there are events or changes in circumstances that may indicate impairment. Where estimates of future cash flows are available, an impairment charge is recorded if the undiscounted future net cash flows expected to be earned from the property are less than the carrying amount. Reductions in the carrying value of properties are recorded to the extent the net book value of the property exceeds management’s estimate of fair values.
Fair value is determined with reference to discounted estimated future cash flow analysis or on recent transactions involving dispositions of similar properties.
The estimated cash flows used to assess recoverability of certain of the Company’s mineral property carrying values are developed using management’s projections for long-term average copper, gold and molybdenum prices, recoverable reserves, operating costs, capital expenditures, reclamation costs, and applicable foreign currency exchange rates. Management makes estimates relating to current and future market conditions. There are inherent uncertainties related to these factors and management’s judgment when using them to assess mineral property recoverability.
The Company believes that the estimates applied in the impairment assessment are reasonable; however such estimates are subject to significant uncertainties and judgments. Although management has made its best estimate of these factors based on current conditions, it is possible that the underlying assumptions can change significantly and impairment charges may be required in future periods. Such charges could be material.
Asset Retirement Obligation
The fair value of a liability for an asset retirement obligation (“ARO”), such as site closure and reclamation costs, is recognized in the period in which it is incurred if a reasonable estimate of fair value can be made. The Company is required to record the estimated present value of future cash flows associated with site closure and reclamation as a long-term liability and increase the carrying value of the related assets for that amount. Subsequently, these asset retirement costs will be amortized to expense over the life of the related assets. At the end of each period, the liability is revised to reflect the passage of time and changes in the estimated future cash flows underlying any initial fair value measurements.
Minimum standards for site reclamation have been established by various governmental agencies that affect certain operations of the Company. The determination of reclamation costs requires assumptions with respect to future expected costs and legislation in effect at that time. Changes in these assumptions could have a material effect on the amount required to be recognized as an ARO.
| MANAGEMENT DISCUSSION &ANALYSIS | 27 | |
| 2010 ANNUAL REPORT |
Income Taxes
Income taxes are calculated using the liability method of accounting. Temporary differences arising from the difference between the tax basis of an asset or liability and its carrying amount on the balance sheet are used to calculate future income tax liabilities or assets. Future income tax assets and liabilities are measured using enacted or substantively enacted tax rates and laws that are expected to apply when the temporary differences are likely to reverse. When the future realization of income tax assets does not meet the test of being more likely than not to be realized, a valuation allowance in the amount of the potential future benefit is recorded and no net asset is recognized. Changes to income tax rules, interpretations, or rates could have a material impact on amounts recorded in the financial statements.
Stock-based Compensation and Warrant Valuation
The fair value of stock-based compensation awards and warrant issuances is calculated using the Black-Scholes option pricing model. Option pricing models require the input of highly subjective assumptions including the expected price volatility. Changes in the subjective input assumptions can materially affect the fair value estimate, and therefore the existing models do not necessarily provide a reliable single measure of the fair value of stock options granted and warrants issued by the Company.
9. CHANGE IN ACCOUNTING POLICIES
The Company has elected to adopt the following standards effective January 1, 2010 so that its accounting policies are more closely aligned with International Financial Reporting Standards during the year ending December 31, 2010.
Business Combinations
Section 1582, Business Combinations, replaces Section 1581, Business Combinations and establishes standards for the accounting for business combinations. It provides the Canadian equivalent to International Financial Reporting Standard IFRS 3, Business Combinations. The section applies prospectively to business combinations for which the acquisition date is on or after the beginning of the first annual reporting period after adoption.
Consolidated Financial Statements and Non-Controlling Interests
Section 1601, Consolidated Financial Statements, and Section 1602, Non-Controlling Interests, replace Section 1600, Consolidated Financial Statements. Section 1601 establishes standards for the preparation of consolidated financial statements. Section 1602 establishes standards for accounting for a non-controlling interest in a subsidiary in consolidated financial statements subsequent to a business combination. It is equivalent to the corresponding provisions of International Financial Reporting Standard IAS 27, Consolidated and Separate Financial Statements. The adoption of this standard had no effect on the Company’s financial statements.
10. INTERNATIONAL FINANCIAL REPORTING STANDARDS (“IFRS”)
Western Copper expects to adopt IFRS effective January 1, 2011. In 2011, the Company will have to report 2010 comparative figures restated using IFRS for each comparative period after the transition date.
Western Copper has compared its current accounting policies under Canadian Generally Accepted Accounting Principles (“GAAP”) to IFRS and identified differences between the two standards. Based on its review of historical transactions and current business activities, the Company has identified the treatment of exploration and evaluation (“E&E”) costs, income taxes, and asset impairment as areas with the greatest potential to create significant differences in the Company’s financial statements as a result of adopting IFRS.
| 28 | MANAGEMENTDISCUSSION & ANALYSIS | |
| 2010 ANNUAL REPORT |
Western Copper performed a comprehensive analysis of the areas noted above to determine the potential impact that adopting IFRS will have on the Company’s financial statements.
IFRS 6 allows companies to choose a policy that capitalizes E&E costs. The Company expects to continue capitalizing its E&E costs in a manner consistent with its current accounting policy.
The method of accounting for income taxes under IFRS is similar to Canadian GAAP, but one of the differences under IFRS is expected to have a significant impact on the Company’s financial reporting. Current IFRS guidelines prohibit the recognition of future income tax (“FIT”) assets or liabilities that arise from the initial recognition of assets or liabilities that do not impact profit or loss and that occur other than in a business combination. The majority of the Company’s FIT liability balance is due to the difference between the carrying value and the tax value of the properties that Western Copper acquired through its purchase of Lumina Resources Corp. in 2006. Western Copper accounted for the transaction as an acquisition of assets, not as a business combination. As a result of the rule noted above, the FIT liability balance recognized under Canadian GAAP would be eliminated. This would also decrease the carrying value of mineral properties by a similar amount because when the FIT liability was recognized, the carrying values of the related mineral properties were grossed up by the same amount.
Under Canadian GAAP, mineral property impairment testing is performed using a two-step test. The first step is to determine if there is an impairment loss by using an undiscounted cash flow analysis. If that analysis identifies an impairment loss, the loss is measured as the amount by which carrying value exceeds fair value. The fair value is often based on discounted cash flows. Under IFRS, assets are tested for impairment using a one-step process based on discounted cash flows. IFRS also allow the reversal of impairment charges from previous years if the fair value exceeds the carrying value of long-lived assets. Western Copper does not anticipate that the adoption of the IFRS in regards to mineral property impairment will have a material impact on the carrying value of its mineral properties.
Other IFRS that apply to the Company’s operations, but that are not expected to have a significant effect on 2010 financial results based on the Company’s activities are functional currency, business combinations, share based payments, and decommissioning and retirement obligations.
The Company has performed its review of IFRS based on standards applicable as of the date of this report. The International Accounting Standards Board is still developing IFRS and may propose changes to the standards between the date of this report and the date the Company adopts IFRS. Changes to IFRS could have material effects on Western Copper’s analysis discussed above.
The SEC has announced that it will not require a financial statements prepared in accordance with IFRS to be reconciled to accounting principles generally accepted in the United States (“US GAAP”). As a result, the Company’s annual consolidated financial statements for the year ended December 31, 2011 are not expected to include a US GAAP reconciliation note.
Western Copper does not expect the adoption of IFRS to have a significant impact on its information technology and data systems, internal control over financial reporting, or disclosure controls and procedures. Employees who have accounting responsibilities have received IFRS specific training. The Company’s directors have been provided with an overview of IFRS.
11. DISCLOSURE CONTROLS AND PROCEDURES
Management is responsible for designing, establishing, and maintaining a system of disclosure controls and procedures. Disclosure controls and procedures are designed to provide reasonable assurance that material information relating to the Company is made known to management, particularly during the period in which the annual filings are being prepared and that information required to be disclosed by the Company in its annual filings, interim filings or other reports filed or submitted by it under securities legislation is recorded, processed, summarized and reported within the time periods specified in securities legislation.
As a result of the material weakness identified during the assessment of internal control over financial reporting, as described below, management has also concluded that its disclosure controls and procedures were not effective as at December 31, 2010.
| MANAGEMENT DISCUSSION &ANALYSIS | 29 | |
| 2010 ANNUAL REPORT |
12. MANAGEMENT’S REPORT ON INTERNAL CONTROLS OVER FINANCIAL REPORTING AND DISCLOSURE CONTROLS
Management is responsible for designing, establishing, and maintaining a system of internal control over financial reporting to provide reasonable assurance regarding the reliability of financial reporting and the preparation of financial statements for external purposes in accordance with the Company’s generally accepted accounting principles.
The Chief Executive Officer and the Chief Financial Officer evaluated the effectiveness of the Company’s disclosure controls and procedures and assessed the design and the operating effectiveness of the Company’s internal control over financial reporting as of December 31, 2010.
Based on that assessment, management concluded that, as at December 31, 2010, the Company’s internal control over financial reporting was not effective due to the existence of a material weakness. A material weakness existed in the design of internal control over financial reporting caused by a lack of adequate segregation of duties in the financial close process. The Chief Financial Officer is responsible for preparing, authorizing, and reviewing information that is key to the preparation of financial reports. He is also responsible for preparing and reviewing the resulting financial reports. This weakness has the potential to result in material misstatements in the Company’s financial statements, and should also be considered a material weakness in its disclosure controls and procedures.
Management has concluded, and the audit committee has agreed that taking into account the present stage of Western Copper’s development, the Company does not have sufficient size and scale to warrant the hiring of additional staff to correct the weakness at this time.
There has been no significant change in internal control over financial reporting or in disclosure controls and procedures from October 1 to December 31, 2010 that has materially affected, or is reasonably likely to affect, the Company’s its internal control over financial reporting or its disclosure controls and procedures.
13. FINANCIAL INSTRUMENT RISK
The Board of Directors has overall responsibility for the establishment and oversight of the Company’s risk management framework. The Company has exposure to credit, liquidity, currency, interest rate and market risks from the use of financial instruments. Financial instruments consist of cash and cash equivalents, short-term investments, other receivables, reclamation bonds, and accounts payable and accrued liabilities.
Market Risk
The Company does not generate cash from its operating activities. Its principal source of funds is the issuance of common shares. It uses the capital raised from the issuance of its common shares to explore and develop its mineral properties with the goal of increasing the price of the Company’s common shares. Western Copper’s common shares are publicly traded. As such, the price of its common shares is susceptible to factors beyond management’s control including, but not limited to, fluctuations in commodity prices and foreign exchange rates and changes in the general market outlook. Should Western Copper require funds during a time when the price of its common shares is depressed, the Company may be required to accept significant dilution to maintain enough liquidity to continue operations or may be unable to raise sufficient capital to meet its obligations. The Company’s contractual obligations are described in the Property Overview and the Contractual Obligations sections of this report
Liquidity Risk
Liquidity risk is the risk that the Company will be unable to meet its financial obligations as they come due. The Company uses cash forecasts to ensure as far as possible that there is sufficient cash on hand to meet short-term business requirements. Cash is invested in highly liquid investments which are available to discharge obligations when they come due. The Company does not maintain a line of credit.
| 30 | MANAGEMENTDISCUSSION & ANALYSIS | |
| 2010 ANNUAL REPORT |
Credit Risk
Financial instruments that potentially subject the Company to credit risk consist primarily of cash and cash equivalents and short-term investments. These financial instruments are at risk to the extent that the institutions issuing or holding them cannot redeem amounts when they are due or requested. To limit its credit risk, the Company uses a restrictive investment policy. It deposits cash and cash equivalents in Canadian chartered banks and purchases short-term investments that are guaranteed by Canadian governments or by Canadian chartered banks.
Currency Risk
Currency risk is the risk that the Company will lose significant purchasing power to operate its business as a result of changes in currency rates. The Company raises funds in Canadian dollars. The majority of the Company’s expenditures are incurred in Canadian dollars. To limit its exposure to currency risk, the Company maintains the majority of its cash and cash equivalents in Canadian dollars. The Company did not have a material amount of financial instruments denominated in foreign currencies as at December 31, 2010 or December 31, 2009.
Interest Rate Risk
The Company is exposed to interest rate risk on its cash and cash equivalents and its short-term investments to the extent that the institutions that hold or issue those instruments cannot pay the interest earned on them by Western Copper. Potential losses in interest income would not have a material impact on the Company’s results of operations.
CAUTIONARY NOTES
Forward-looking statements
This Management’s Discussion and Analysis contains certain forward-looking statements concerning anticipated developments in Western Copper’s operations in future periods. Statements that are not historical fact are forward-looking statements as that term is defined in the United States Private Securities Litigation Reform Act of 1995 and forward looking information as that term is defined in National Instrument 51-102 (“NI 51-102”) of the Canadian Securities Administrators. Certain forward looking information should also be considered future-oriented financial information (“FOFI”) as that term is defined in NI 51-102. The purpose of disclosing FOFI is to provide a general overview of management’s expectations regarding the anticipated results of planned 2011 operations and capital expenditures. Forward-looking statements and information (referred to herein together as “forward-looking statements”) are frequently, but not always, identified by words such as “expects”, “anticipates”, “believes”, “intends”, “estimates”, “potential”, “possible” and similar expressions, or statements that events, conditions or results “will”, “may”, “could” or “should” occur or be achieved. These forward-looking statements are set forth principally under the heading “Property Overview”, “Quarterly Summary of Activities” and elsewhere in Management’s Discussion and Analysis and may include statements regarding perceived merit of properties; mineral reserve and resource estimates; capital expenditures; feasibility study results, ability to obtain required permits for the construction and operation of the Carmacks Copper Project; exploration results at the Company’s properties; budgets; work programs; timelines; strategic plans; market price of precious and base metals; or other statements that are not statement of fact. The material factors or assumptions used to develop forward-looking statements include prevailing and projected market prices and foreign exchange rates, exploitation and exploration estimates and results, continued availability of capital and financing, and general economic, market or business conditions and as more specifically disclosed throughout this document. Forward-looking statements are statements about the future and are inherently uncertain, and actual achievements of Western Copper and its subsidiaries may differ materially from those reflected in the forward-looking statements due to a variety of risks, uncertainties and other factors.
Western Copper’s forward-looking statements are based on the beliefs, expectations and opinions of management on the date the statements are made, and Western Copper does not assume any obligation to update forward-looking statements if circumstances or management’s beliefs, expectations or opinions should change except as required by law. For the reasons set forth above, investors should not place undue reliance on forward-looking statements. Important factors that could cause actual results to differ materially from Western Copper’s expectations include uncertainties involved in fluctuations in gold, copper and other commodity prices and currency exchange rates; uncertainties relating to interpretation of drill results and the geology, continuity and grade of mineral deposits; uncertainty of estimates of capital and operating costs, recovery rates, production estimates and estimated economic return; the need for cooperation of government agencies and First Nations in the exploration and development of properties and the issuance of required permits; the need to obtain additional financing to develop properties and uncertainty as to the availability and terms of future financing; the possibility of delay in exploration or development programs or in construction projects and uncertainty of meeting anticipated program milestones; uncertainty as to timely availability of permits and other governmental approvals; and other risks and uncertainties disclosed in Western Copper’s Annual Information Form, Western Copper’s annual report on Form 40-F, and other information released by Western Copper and filed with the applicable regulatory agencies.
Cautionary note to U.S. investors
The terms “measured mineral resource”, “indicated mineral resource”, and “inferred mineral resource” used in this management discussion and analysis are Canadian geological and mining terms as defined in accordance with National Instrument 43-101, Standards of Disclosure for Mineral Projects (“NI 43-101”) under the guidelines set out in the Canadian Institute of Mining, Metallurgy and Petroleum (the CIM) Standards on Mineral Resources and Mineral Reserves. We advise U.S. investors that while such terms are recognized and required under Canadian regulations, the SEC does not recognize them. “Inferred mineral resources” in particular have a great amount of uncertainty as to their existence, and great uncertainty as to their feasibility. It cannot be assumed that all or any part of an inferred mineral resource will ever be upgraded to a higher category. Under Canadian rules estimates of inferred mineral resources may not generally form the basis of feasibility or other economic studies. U.S. investors are cautioned not to assume that any part of an inferred mineral resource exists, or is economically or legally mineable. Disclosure of contained metal expressed is in compliance with NI 43-101, but does not meet the requirements of Industry Guide 7 of the SEC, which will only accept the disclosure of tonnage and grade estimates for non-reserve mineralization.
| MANAGEMENT DISCUSSION &ANALYSIS | 31 | |
| 2010 ANNUAL REPORT |
FINANCIAL
STATEMENTS
FINANCIAL
STATEMENTS
MANAGEMENT'S RESPONSIBILITY
FOR FINANCIAL REPORTING
The accompanying consolidated financial statements of the Company have been prepared by management in accordance with accounting principles generally accepted in Canada and reconciled to accounting principles generally accepted in the United States as set out in note 15 and contain estimates based on management’s judgment.
Management maintains an appropriate system of internal control to provide reasonable assurance that assets are safeguarded, transactions are properly authorized and recorded, and proper records are maintained. Further information on the company’s internal control over financial reporting and its disclosure controls is available in management’s report on internal control, which follows.
The Audit Committee of the Board of Directors has met with the Company’s independent auditors to review the scope and results of the annual audit and to review the consolidated financial statements and related financial reporting matters prior to submitting the consolidated financial statements to the Board of Directors for approval.
The Company’s independent auditors, PricewaterhouseCoopers LLP, have audited the Company’s consolidated financial statements on behalf of the shareholders and their report follows.
 | |
| Julien François | Dale Corman |
| Chief Financial Officer | Chief Executive Officer |
| March 24, 2011 | March 24, 2011 |
| 34 | CONSOLIDATEDFINANCIAL STATEMENTS | |
| 2010 ANNUAL REPORT |
MANAGEMENT'S REPORT ON INTERNAL
CONTROL OVER FINANCIAL REPORTING
The management of Western Copper Corporation is responsible for establishing and maintaining an adequate internal control over financial reporting. The Securities and Exchange Act of 1934 in Rule 13a-15(f) and 15d-15(f) defines this as a process designed by, or under the supervision of, the Company’s principal executive and principal financial officers and effected by the Company’s Board of Directors, management and other personnel, to provide reasonable assurance regarding the reliability of financial reporting and the preparation of financial statements for external purposes in accordance with generally accepted accounting principles, and includes those policies and procedures that:
| • | Pertain to the maintenance of records that, in reasonable detail, accurately and fairly reflect the transaction and dispositions of the assets of the Company; | |
| ||
| • | Provide reasonable assurance that transactions are recorded as necessary to permit preparation of financial statements in accordance with generally accepted accounting principles, and that receipts and expenditures of the Company are being made only in accordance with authorizations of management and directors of Company; and | |
| ||
| • | Provide reasonable assurance regarding prevention or timely detection of unauthorized acquisitions, use or disposition of the Company’s assets that may have a material effect on the consolidated financial statements. |
Because of its inherent limitations, internal control over financial reporting may not prevent or detect all misstatements. Also, projections of any evaluation of effectiveness to future periods are subject to risk that controls may become inadequate because of changes in conditions, or that the degree of compliance with the policies or procedures may deteriorate.
Management assessed the effectiveness of the Company’s internal control over financial reporting as at December 31, 2010. In making this assessment, the Company’s management used the criteria established by the Committee of Sponsoring Organizations of the Treadway Commission (COSO) in its Internal Control-Integrated Framework.
During the year ended December 31, 2010, and to the date of this report, there has been no change to internal controls that would have a material effect on internal controls over financial reporting.
Based on our assessment, management has concluded that, as at December 31, 2010, the Company‘s internal control over financial reporting was not effective due to the existence of a material weakness. A material weakness existed in the design of internal control over financial reporting caused by a lack of adequate segregation of duties in the financial close process. The Chief Financial Officer is responsible for preparing, authorizing, and reviewing information that is key to the preparation of financial reports. He is also responsible for preparing and reviewing the resulting financial reports. This weakness has the potential to result in material misstatements in the Company’s financial statements, and should also be considered a material weakness in its disclosure controls and procedures.
Management has concluded, and the Audit Committee has agreed that taking into account the present stage of Western Copper’s development, the Company does not have sufficient size and scale to warrant the hiring of additional staff to correct the weakness at this time.
The effectiveness of the Company’s internal control over financial reporting has been audited by the independent auditors, PricewaterhouseCoopers LLP, as stated in their attestation report, which is included herein.
| |
| Julien François | Dale Corman |
| Chief Financial Officer | Chief Executive Officer |
| March 24, 2011 | March 24, 2011 |
| CONSOLIDATED FINANCIALSTATEMENTS | 35 | |
| 2010 ANNUAL REPORT |
INDEPENDENT AUDITOR'S REPORT
To the Shareholders of Western Copper Corporation
We have completed integrated audits of Western Copper Corporation’s 2010, 2009 and 2008 consolidated financial statements and an audit of the effectiveness of internal control over financial reporting as at December 31, 2010. Our opinions, based on our audits, are presented below.
Report on the consolidated financial statements
We have audited the accompanying consolidated financial statements of Western Copper Corporation, which comprise the consolidated balance sheets as at December 31, 2010 and December 31, 2009 and the consolidated statements of loss and comprehensive loss, cash flow and shareholders’ equity for each of the years in the three year period ended Decem-ber 31, 2010, and the related notes.
Management’s responsibility for the consolidated financial statements
Management is responsible for the preparation and fair presentation of these consolidated financial statements in accordance with Canadian generally accepted accounting principles and for such internal control as management determines is necessary to enable the preparation of consolidated financial statements that are free from material misstatement, whether due to fraud or error.
Auditor’s responsibility
Our responsibility is to express an opinion on these consolidated financial statements based on our audits. We conducted our audits in accordance with Canadian generally accepted auditing standards and the standards of the Public Company Accounting Oversight Board (United States). Those standards require that we plan and perform an audit to obtain reasonable assurance about whether the consolidated financial statements are free from material misstatement. Canadian generally accepted auditing standards require that we comply with ethical requirements.
An audit involves performing procedures to obtain audit evidence, on a test basis, about the amounts and disclosures in the consolidated financial statements. The procedures selected depend on the auditor’s judgment, including the assessment of the risks of material misstatement of the consolidated financial statements, whether due to fraud or error. In making those risk assessments, the auditor considers internal control relevant to the company’s preparation and fair presentation of the consolidated financial statements in order to design audit procedures that are appropriate in the circumstances. An audit also includes evaluating the appropriateness of accounting principles and policies used and the reasonableness of accounting estimates made by management, as well as evaluating the overall presentation of the consolidated financial statements.
We believe that the audit evidence we have obtained in our audits is sufficient and appropriate to provide a basis for our audit opinion on the consolidated financial statements.
Opinion
In our opinion, the consolidated financial statements present fairly, in all material respects, the financial position of Western Copper Corporation as at December 31, 2010 and December 31, 2009 and the results of its operations and cash flows for each of the years in the three year period ended December 31, 2010 in accordance with Canadian generally accepted accounting principles.
Report on internal control over financial reporting
We have also audited Western Copper Corporation’s internal control over financial reporting as at December 31, 2010, based on criteria established in Internal Control - Integrated Framework, issued by the Committee of Sponsoring Organizations of the Treadway Commission (COSO).
Management’s responsibility for internal control over financial reporting
Management is responsible for maintaining effective internal control over financial reporting and for its assessment of the effectiveness of internal control over financial reporting included in Management’s Report on Internal Control over Financial Reporting.
| 36 | CONSOLIDATEDFINANCIAL STATEMENTS | |
| 2010 ANNUAL REPORT |
Auditor’s responsibility
Our responsibility is to express an opinion on Western Copper Corporation’s internal control over financial reporting based on our audit. We conducted our audit of internal control over financial reporting in accordance with the standards of the Public Company Accounting Oversight Board (United States). Those standards require that we plan and perform the audit to obtain reasonable assurance about whether effective internal control over financial reporting was maintained in all material respects.
An audit of internal control over financial reporting includes obtaining an understanding of internal control over financial reporting, assessing the risk that a material weakness exists, testing and evaluating the design and operating effectiveness of internal control, based on the assessed risk, and performing such other procedures as we consider necessary in the circumstances.
We believe that our audit provides a reasonable basis for our audit opinion on Western Copper Corporation’s internal control over financial reporting.
Definition of internal control over financial reporting
A company’s internal control over financial reporting is a process designed to provide reasonable assurance regarding the reliability of financial reporting and the preparation of financial statements for external purposes in accordance with generally accepted accounting principles. A company’s internal control over financial reporting includes those policies and procedures that (i) pertain to the maintenance of records that, in reasonable detail, accurately and fairly reflect the transactions and dispositions of the assets of the company; (ii) provide reasonable assurance that transactions are recorded as necessary to permit preparation of financial statements in accordance with generally accepted accounting principles, and that receipts and expenditures of the company are being made only in accordance with authorizations of management and directors of the company; and (iii) provide reasonable assurance regarding prevention or timely detection of unauthorized acquisition, use, or disposition of the company’s assets that could have a material effect on the financial statements.
Inherent limitations
Because of its inherent limitations, internal control over financial reporting may not prevent or detect misstatements. Also, projections of any evaluation of effectiveness to future periods are subject to the risk that controls may become inadequate because of changes in conditions or that the degree of compliance with the policies or procedures may deteriorate.
Opinion
A material weakness is a deficiency, or a combination of deficiencies, in internal control over financial reporting, such that there is a reasonable possibility that a material misstatement of the company’s annual financial statements will not be prevented or detected on a timely basis. As at December 31, 2010 a material weakness, relating to a lack of segregation of duties in the financial accounting process was identified, as described in Management’s Report on Internal Control over Financial Reporting.
We considered this material weakness in determining the nature, timing, and extent of audit tests applied in our audit of the December 31, 2010 consolidated financial statements, and our opinion regarding the effectiveness of Western Copper Corporation’s internal control over financial reporting does not affect our opinion on those consolidated financial statements.
In our opinion, Western Copper Corporation did not maintain, in all material respects, effective internal control over financial reporting as at December 31, 2010 based on criteria established in Internal Control - Integrated Framework issued by the COSO.
We do not express an opinion or any form of assurance on management’s conclusion as to whether the hiring of additional staff is warranted as included in Management’s Report on Internal Control over Financial Reporting..
Chartered Accountants
Vancouver, British Columbia
March 24, 2011
| CONSOLIDATED FINANCIALSTATEMENTS | 37 | |
| 2010 ANNUAL REPORT |
CONSOLIDATED BALANCE SHEETS
| December 31, 2010 | December 31, 2009 | ||||||||
| Expressed in Canadian dollars | $ | $ | |||||||
| ASSETS | Note | ||||||||
| CURRENT ASSETS | |||||||||
| Cash and cash equivalents | – | 1,630,698 | 3,436,131 | ||||||
| Short-term investments | 3 | 22,006,197 | 10,231,048 | ||||||
| Other receivables | – | 131,914 | 83,833 | ||||||
| Prepaid expenses | – | 56,638 | 44,714 | ||||||
| CURRENT ASSETS | 23,825,447 | 13,795,726 | |||||||
| 5 | |||||||||
| RECLAMATION BOND | 80,300 | 80,300 | |||||||
| PROPERTY AND EQUIPMENT | 4 | 141,383 | 209,506 | ||||||
| MINERAL PROPERTIES | 5 | 85,330,161 | 72,790,644 | ||||||
| ASSETS | 109,377,291 | 86,876,176 | |||||||
| LIABILITIES | |||||||||
| CURRENT LIABILITIES | |||||||||
| Accounts payable and accrued liabilities | – | 1,240,539 | 1,097,409 | ||||||
| FUTURE INCOME TAX | 14 | 12,472,501 | 9,661,846 | ||||||
| LIABILITIES | 13,713,040 | 10,759,255 | |||||||
| SHAREHOLDERS’ EQUITY | |||||||||
| SHARE CAPITAL | 6 | 97,086,083 | 78,252,251 | ||||||
| CONTRIBUTED SURPLUS | – | 29,411,940 | 25,921,463 | ||||||
| DEFICIT | – | (30,833,772 | ) | (28,056,793 | ) | ||||
| SHAREHOLDERS’ EQUITY | 95,664,251 | 76,116,921 | |||||||
| LIABILITIES + SHAREHOLDERS’ EQUITY | 109,377,291 | 86,876,176 | |||||||
| Commitments | 9 |
Approved by the Board of Directors
 | |
| Robert Gayton, Director | Dale Corman, Director |
| 38 | CONSOLIDATEDFINANCIAL STATEMENTS | |
| 2010 ANNUAL REPORT |
CONSOLIDATED STATEMENTS OF LOSS AND COMPREHENSIVE LOSS
| For the Year Ended December 31, | 2010 | 2009 | 2008 | |||||||||
| Expressed in Canadian dollars | $ | $ | $ | |||||||||
| Note | ||||||||||||
| ADMINISTRATIVE EXPENSES | ||||||||||||
| Accounting and legal | – | 173,422 | 196,078 | 400,035 | ||||||||
| Filing and regulatory fees | – | 80,882 | 72,728 | 78,101 | ||||||||
| Office and administration | – | 2,116,235 | 1,800,325 | 1,921,138 | ||||||||
| Shareholder communication | – | 462,391 | 414,303 | 354,521 | ||||||||
| LOSS BEFORE TAXES AND OTHER ITEMS | 2,832,930 | 2,483,434 | 2,753,795 | |||||||||
| OTHER ITEMS | ||||||||||||
| Foreign exchange | – | 1,735 | 10,786 | 51,731 | ||||||||
| Interest income | – | (57,686 | ) | (238,166 | ) | (599,575 | ) | |||||
| Write-off of mineral properties | 5e | – | – | 405,001 | ||||||||
| LOSS BEFORE TAXES | 2,776,979 | 2,256,054 | 2,610,952 | |||||||||
| FUTURE INCOME TAX RECOVERY | 14 | – | (395,897 | ) | (451,703 | ) | ||||||
| LOSS AND COMPREHENSIVE LOSS | 2,776,979 | 1,860,157 | 2,159,249 | |||||||||
| BASIC AND DILUTED LOSS PER SHARE | 0.03 | 0.02 | 0.03 | |||||||||
| WEIGHTED AVERAGE NUMBER OF COMMON SHARES OUTSTANDING | 81,128,926 | 74,897,792 | 72,792,941 |
| CONSOLIDATED FINANCIALSTATEMENTS | 39 | |
| 2010 ANNUAL REPORT |
CONSOLIDATED STATEMENTS OF CASH FLOW
| For the Year Ended December 31, | 2010 | 2009 | 2008 | |||||||||
| Expressed in Canadian dollars | $ | $ | $ | |||||||||
| Cash flows provided by (used in) | Note | |||||||||||
| OPERATING ACTIVITIES | ||||||||||||
| Loss for the year | – | (2,776,979 | ) | (1,860,157 | ) | (2,159,249 | ) | |||||
| ITEMS NOT AFFECTING CASH | ||||||||||||
| Amortization | – | 13,417 | 33,336 | 39,603 | ||||||||
| Donation of common shares | 6c | 117,900 | – | – | ||||||||
| Future income tax recovery | 14 | – | (395,897 | ) | (451,703 | ) | ||||||
| Stock-based compensation | 8 | 416,877 | 349,398 | 425,816 | ||||||||
| Write-off of mineral properties | 5e | – | – | 405,001 | ||||||||
| ITEMS NOT AFFECTING CASH | 548,194 | (13,163 | ) | 418,717 | ||||||||
| Change in non-cash working capital items | 13 | (110,363 | ) | 79,845 | 4,815 | |||||||
| OPERATING ACTIVITIES | (2,339,148 | ) | (1,793,475 | ) | (1,735,717 | ) | ||||||
| FINANCING ACTIVITIES | ||||||||||||
| Issuance of common shares and warrants | 6 | 23,018,975 | 9,375,000 | – | ||||||||
| Share issuance costs | – | (1,384,514 | ) | (776,422 | ) | – | ||||||
| Exercise of warrants | 7 | 2,455,000 | 251,250 | – | ||||||||
| Exercise of stock options | 7 | 694,743 | 106,583 | 500 | ||||||||
| FINANCING ACTIVITIES | 24,784,204 | 8,956,411 | 500 | |||||||||
| INVESTING ACTIVITIES | ||||||||||||
| Purchase of short-term investments | – | (11,775,000 | ) | (2,225,000 | ) | (8,000,000 | ) | |||||
| Mineral property expenditures | – | (12,475,489 | ) | (6,539,009 | ) | (8,653,293 | ) | |||||
| Acquisition of property and equipment | – | – | – | (301,233 | ) | |||||||
| INVESTING ACTIVITIES | (24,250,489 | ) | (8,764,009 | ) | (16,954,526 | ) | ||||||
| DECREASE IN CASH AND CASH EQUIVALENTS | (1,805,433 | ) | (1,601,073 | ) | (18,689,743 | ) | ||||||
| Cash and cash equivalents - Beginning | 3,436,131 | 5,037,204 | 23,726,947 | |||||||||
| CASH AND CASH EQUIVALENTS - ENDING | 1,630,698 | 3,436,131 | 5,037,204 |
| 40 | CONSOLIDATEDFINANCIAL STATEMENTS | |
| 2010 ANNUAL REPORT |
CONSOLIDATED STATEMENTS OF SHAREHOLDERS’ EQUITY
| Number of | Amount | Contributed | Deficit | Shareholders’ | |||||||||||
| shares | surplus | equity | |||||||||||||
| Expressed in Canadian dollars | $ | $ | $ | $ | |||||||||||
| DECEMBER 31, 2007 | 72,769,036 | 71,883,630 | 22,091,594 | (24,037,387 | ) | 69,937,837 | |||||||||
| Exercise of stock options | 50,000 | 500 | – | – | 500 | ||||||||||
| Transfer of value on exercise of stock options | – | 67,000 | (67,000 | ) | – | – | |||||||||
| Stock-based compensation | – | – | 674,391 | – | 674,391 | ||||||||||
| Loss and comprehensive loss | – | – | – | (2,159,249 | ) | (2,159,249 | ) | ||||||||
| DECEMBER 31, 2008 | 72,819,036 | 71,951,130 | 22,698,985 | (26,196,636 | ) | 68,453,479 | |||||||||
| Private placement – July 10 | 4,000,000 | 4,000,000 | – | – | 4,000,000 | ||||||||||
| Issuance costs | – | (355,320 | ) | – | – | (355,320 | ) | ||||||||
| Agent warrants | – | (114,960 | ) | 114,960 | – | – | |||||||||
| Investor warrants | – | (813,200 | ) | 813,200 | – | – | |||||||||
| Private placement – December 4 | 2,150,000 | 5,375,000 | – | – | 5,375,000 | ||||||||||
| Issuance costs | – | (421,102 | ) | – | – | (421,102 | ) | ||||||||
| Agent warrants | – | (89,440 | ) | 89,440 | – | – | |||||||||
| Investor warrants | – | (1,848,495 | ) | 1,848,495 | – | – | |||||||||
| Exercise of warrants | 201,000 | 251,250 | – | – | 251,250 | ||||||||||
| Transfer of value on exercise of warrants | – | 96,279 | (96,279 | ) | – | – | |||||||||
| Exercise of stock options | 105,000 | 106,583 | – | – | 106,583 | ||||||||||
| Transfer of value on exercise of stock options | – | 114,526 | (114,526 | ) | – | – | |||||||||
| Stock-based compensation | – | – | 567,188 | – | 567,188 | ||||||||||
| Loss and comprehensive loss | – | – | – | (1,860,157 | ) | (1,860,157 | ) | ||||||||
| DECEMBER 31, 2009 | 79,275,036 | 78,252,251 | 25,921,463 | (28,056,793 | ) | 76,116,921 | |||||||||
| Financing – December 22 | 9,395,500 | 23,018,975 | – | – | 23,018,975 | ||||||||||
| Issuance costs | – | (1,700,012 | ) | – | – | (1,700,012 | ) | ||||||||
| Agent warrants | – | (4,476,983 | ) | 4,476,983 | – | – | |||||||||
| Donation of common shares | 90,000 | 117,900 | – | – | 117,900 | ||||||||||
| Issuance costs | – | (2,217 | ) | – | – | (2,217 | ) | ||||||||
| Future income tax liability recorded pursuant to 2009 flow-through financings | – | (2,810,655 | ) | – | – | (2,810,655 | ) | ||||||||
| Exercise of warrants | 1,964,000 | 2,455,000 | – | – | 2,455,000 | ||||||||||
| Transfer of value on exercise of warrants | – | 801,386 | (801,386 | ) | – | – | |||||||||
| Exercise of stock options | 763,300 | 694,743 | – | – | 694,743 | ||||||||||
| Transfer of value on exercise of stock options | – | 735,695 | (735,695 | ) | – | – | |||||||||
| Stock-based compensation | – | – | 550,575 | – | 550,575 | ||||||||||
| Loss and comprehensive loss | – | – | – | (2,776,979 | ) | (2,776,979 | ) | ||||||||
| DECEMBER 31, 2010 | 91,487,836 | 97,086,083 | 29,411,940 | (30,833,772 | ) | 95,664,251 |
| CONSOLIDATED FINANCIALSTATEMENTS | 41 | |
| 2010 ANNUAL REPORT |
NOTES TO THE CONSOLIDATED
FINANCIAL STATEMENTS
| 1. | NATURE OF OPERATIONS |
Western Copper Corporation (“Western Copper” or the “Company”) is a mineral exploration company with a primary focus of advancing its mineral properties towards production. All of Western Copper’s mineral properties are located in Canada. | |
To date, the Company has not earned any production revenue. The recoverability of the amounts shown for mineral property assets is dependent upon the existence of economically recoverable reserves and the Company’s ability to secure and maintain title and beneficial interest in the properties, to obtain the necessary financing to continue the exploration and future development of the properties, or to realize the carrying amount through a sale. | |
| 2. | ACCOUNTING POLICIES |
| a. | Significant Accounting Policies |
The Company’s consolidated financial statements are prepared in accordance with accounting principles generally accepted in Canada. As described in note 15, these principles differ in certain material respects from accounting principles generally accepted in the United States. |
| i) | Use of estimates | |
The preparation of the consolidated financial statements in conformity with generally accepted accounting principles requires management to make estimates and assumptions that affect the amounts reported in the financial statements and the related notes. Significant areas where management’s judgment is applied include the assessment of impairment to the carrying value of mineral properties, the determination of the likelihood that future income tax benefits can be realized, the assumptions used to calculate the fair value of warrants and stock options, amounts and likelihood of contingent liabilities, and the cost allocation methodologies used to determine results of operations, the value of financing components, and the value of purchased assets. Actual results could differ from the estimates by a material amount. | ||
| ii) | Principles of consolidation | |
These consolidated financial statements include the accounts of the Company and its wholly-owned subsidiaries: Car- macks Copper Ltd., Lurprop Holdings Inc., CRS Copper Resources Corp., Moraga Resources Ltd., and Minera Costa de Plata S.A. de C.V. All intercompany transactions and balances have been eliminated. | ||
| iii) | Cash and cash equivalents | |
Cash and cash equivalents comprise cash deposits held at banks and highly liquid investments with original maturity dates that are less than 90 days from the date of acquisition. | ||
| iv) | Short-term investments | |
Short-term investments comprise investments with original maturity dates that are greater than 90 days but no more than one year from the date of acquisition. |
| 42 | NOTESTO THE CONSOLIDATED FINANCIAL STATEMENTS | |
| 2010 ANNUAL REPORT |
| v) | Property and equipment | |
Property and equipment are carried at cost less accumulated amortization. Amortization is provided on a straight-line basis over the estimated useful lives of the assets. |
| Computer equipment | 5 years |
| Field equipment | 5 years |
| Furniture and office equipment | 5 years |
| Leasehold improvements | over the term of the lease |
| Vehicles | 3 years |
| vi) | Mineral properties | |
Direct costs related to the acquisition, exploration, and development of mineral properties owned or controlled by the Company are deferred on an individual property basis until the viability of a property is determined or until the property is sold, abandoned, placed into production or determined to be impaired. Administration costs and general exploration costs are expensed as incurred. If a property is placed into commercial production, deferred costs will be amortized using the unit-of production method based on proven and probable reserves. The carrying amount for mineral properties represents costs net of write-downs to date and does not necessarily reflect present or future values. Recovery of capitalized costs is dependent on successful development of economic mining operations or the disposition of the related mineral properties. | ||
Cost recoveries, including tax credits and funds received as part of government assistance programs, are recognized as a reduction in the carrying value of the related asset when the money is more likely than not to be received. If the ap- plicable property has been written-off, the amount received is recorded as a credit to the statement of loss in the period in which the payment is more likely than not to be received. | ||
Although the Company has taken steps to verify title to mineral properties in which it has an interest, these procedures do not guarantee the Company’s title. Such properties may be subject to prior agreements or transfers, or title may be affected by undetected defects. | ||
| vii) | Impairment of long-lived assets | |
| ||
The Company reviews the carrying value of mineral properties when there are events or changes in circumstances that may indicate impairment. Where estimates of future cash flows are available, an impairment charge is recorded if the undiscounted future net cash flows expected to be earned from the property are less than the carrying amount. Reductions in the carrying value of properties are recorded to the extent the net book value of the property exceeds management’s estimate of fair values. | ||
Fair value is determined with reference to discounted estimated future cash flow analysis or on recent transactions involving dispositions of similar properties. | ||
The estimated cash flows used to assess recoverability of certain of the Company’s mineral property carrying values are developed using management’s projections for long-term average copper, gold and molybdenum prices, recoverable reserves, operating costs, capital expenditures, reclamation costs, and applicable foreign currency exchange rates. Management makes estimates relating to current and future market conditions. There are inherent uncertainties related to these factors and management’s judgment when using them to assess mineral property recoverability. | ||
The Company believes that the estimates applied in the impairment assessment are reasonable; however such estimates are subject to significant uncertainties and judgments. Although management has made its best estimate of these factors based on current conditions, it is possible that the underlying assumptions can change significantly and impairment charges may be required in future periods. Such charges could be material. |
| CONSOLIDATED FINANCIALSTATEMENTS | 43 | |
| 2010 ANNUAL REPORT |
| viii) | Asset retirement obligation | |
| ||
The fair value of a liability for an asset retirement obligation (“ARO’s”), such as site closure and reclamation costs, is recognized in the period in which it is incurred if a reasonable estimate of fair value can be made. The Company is required to record the estimated present value of future cash flows associated with site closure and reclamation as a long-term liability and increase the carrying value of the related assets for that amount. Subsequently, these asset retirement costs will be amortized to expense over the life of the related assets. At the end of each period, the liability is revised to reflect the passage of time and changes in the estimated future cash flows underlying any initial fair value measurements. | ||
| ix) | Translation of foreign currency | |
| ||
Monetary assets and liabilities are translated into Canadian dollars using period-end exchange rates. Non-monetary items are translated at rates prevailing at acquisition or transaction dates. Expense and other items are translated into Canadian dollars at the rate of exchange in effect at the date of the related transaction. All exchange gains or losses arising on translation are included in results of operations. | ||
| x) | Income taxes | |
| ||
Income taxes are calculated using the liability method of accounting. Temporary differences arising from the difference between the tax basis of an asset or liability and its carrying amount on the balance sheet are used to calculate future income tax liabilities or assets. Future income tax assets and liabilities are measured using enacted or substantively enacted tax rates and laws that are expected to apply when the temporary differences are likely to reverse. When the future realization of income tax assets does not meet the test of being more likely than not to be realized, a valuation allowance in the amount of the potential future benefit is recorded and no net asset is recognized. | ||
| xi) | Loss per share | |
| ||
Loss per share is calculated using the weighted average number of common shares outstanding during the year. Basic and diluted loss per share is the same as the effect of the exercise of outstanding stock options and warrants would be anti-dilutive. | ||
| xii) | Stock-based compensation | |
| ||
The Company uses the fair value method of accounting for the cost of stock-based compensation granted to employees, directors, and others. The fair value of stock-based compensation awards is determined at the time of grant using the Black-Scholes option pricing model. | ||
The costs are charged to the statement of loss or, if appropriate, are capitalized to mineral properties over the stock option vesting period with a corresponding increase to contributed surplus. The Company’s allocation of stock-based compensation is consistent with its treatment of other types of compensation for each recipient. | ||
When stock options are exercised, the consideration paid together with the amount previously recognized in contributed surplus is recorded as an increase to share capital. In the event that stock options are forfeited prior to vesting, the associated fair value recorded to date is reversed from the statement of loss or balance sheet item to which the fair value was originally charged in the period in which the stock options are forfeited. The fair value of any vested stock options that expire remains in contributed surplus. | ||
Option pricing models require the input of highly subjective assumptions including the expected price volatility. Changes in the subjective input assumptions can materially affect the fair value estimate, and therefore the existing models do not necessarily provide a reliable single measure of the fair value of the Company’s stock options and/or warrants granted and/or vested during the period. |
| 44 | NOTESTO THE CONSOLIDATED FINANCIAL STATEMENTS | |
| 2010 ANNUAL REPORT |
| xiii) | Share capital | |
The Company records proceeds from share issuances net of issue costs. Shares issued for consideration other than cash are valued at the market price on the date of issue. | ||
| xiv) | Valuation of equity unites issued as part of a financing | |
The Company has adopted a pro rata basis method for the measurement of shares and warrants issued as units in financing arrangements. The pro rata basis method requires that gross proceeds and related share issuance costs be allocated to the common shares and the warrants based on the relative fair value of each component. | ||
The fair value of the common shares is based on the closing price on the closing date of the transaction and the fair value of the warrants is determined on the closing date of the transaction using the Black-Scholes option pricing model. | ||
The fair value attributed to the warrants is recorded as contributed surplus. If the warrants are exercised, the value attributable to the warrants is transferred to share capital. | ||
| xv) | Flow-through common shares | |
Under the Canadian Income Tax Act, an enterprise may issue securities referred to as flow-through shares. These instruments permit the Company to renounce, or transfer to the investor the tax deductions associated with an equal value of qualifying resource expenditures. The Company records a future income tax liability on the date that the Com- pany files the renouncement documents with the tax authorities, provided that there is reasonable assurance that the expenditures will be made. At the time of recognition of the future income tax liability, an offsetting reduction to share capital is made. | ||
| xvi) | Related party transactions | |
Related party transactions are measured at the exchange amount. | ||
| xvii) | Financial instruments Designation | |
Western Copper has designated its financial instruments as follows: |
| • | Cash and cash equivalents, short-term investments, and reclamation bonds are classified as “Held-for-Trading” and are recorded at their fair value with changes in fair value recorded in the statement of loss; | |
| • | Other receivables are classified as “Loans and Receivables”. These financial assets are recorded at their amortized cost using the effective interest method; and | |
| • | Accounts payable and accrued liabilities are classified as “Other Financial Liabilities”. These financial liabilities are recorded at their amortized cost using the effective interest method. |
Fair value
Due to the short-term nature of other receivables and accounts payable and accrued liabilities, the Company estimates that their carrying value approximates their fair value.
| b. | Change in Accounting Policies | ||
The Company elected to adopt the following standards effective January 1, 2010 so that its accounting policies are more closely aligned with International Financial Reporting Standards for the year ending December 31, 2010. | |||
| i) | Business combinations | ||
Section 1582, Business Combinations, replaces Section 1581, Business Combinations and establishes standards for the accounting for business combinations. It provides the Canadian equivalent to International Financial Reporting Standard IFRS 3, Business Combinations. The section applies prospectively to business combinations for which the acquisition date is on or after the beginning of the first annual reporting period after adoption. | |||
| CONSOLIDATED FINANCIALSTATEMENTS | 45 | |
| 2010 ANNUAL REPORT |
| ii) | Consolidated financial statements and non-controlling interests | |
Section 1601, Consolidated Financial Statements, and Section 1602, Non-Controlling Interests, replace Section 1600, Consolidated Financial Statements. Section 1601 establishes standards for the preparation of consolidated financial statements. Section 1602 establishes standards for accounting for a non-controlling interest in a subsidiary in consoli- dated financial statements subsequent to a business combination. It is equivalent to the corresponding provisions of International Financial Reporting Standard IAS 27, Consolidated and Separate Financial Statements. The adoption of this standard had no effect on the Company’s financial statements. |
| 3. | SHORT-TERM INVESTMENTS |
| December 31, 2010 | December 31, 2009 | |||||
| Expressed in Canadian dollars | $ | $ | ||||
| Guaranteed Investment Certificates | 22,000,000 | 10,225,000 | ||||
| Accrued interest | 6,197 | 6,048 | ||||
| SHORT-TERM INVESTMENTS | 22,006,197 | 10,231,048 |
Short-term investments consist of Guaranteed Investment Certificates held with Canadian chartered banks. All certificates are redeemable in full or in portion at the Company’s option without penalty. Interest is paid when investments are redeemed subsequent to 30 days from the date of acquisition. Short-term investments held at December 31, 2010 bear an interest rate of 1.3%. | |
| 4. | PROPERTY AND EQUIPMENT |
| December 31, 2010 | ||||||||||
| Cost | Accumulated | Net book | ||||||||
| amortization | value | |||||||||
| Expressed in Canadian dollars | $ | $ | $ | |||||||
| Computer equipment | 69,634 | 69,634 | – | |||||||
| Field equipment | 273,534 | 136,767 | 136,767 | |||||||
| Furniture and office equipment | 24,486 | 24,486 | – | |||||||
| Leasehold improvements | 63,203 | 63,203 | – | |||||||
| Vehicles | 27,699 | 23,083 | 4,616 | |||||||
| PROPERTY AND EQUIPMENT | 458,556 | 317,173 | 141,383 | |||||||
| 46 | NOTESTO THE CONSOLIDATED FINANCIAL STATEMENTS | |
| 2010 ANNUAL REPORT |
| December 31, 2009 | |||||||||
| Cost | Accumulated | Net book | |||||||
| amortization | value | ||||||||
| Expressed in Canadian dollars | $ | $ | $ | ||||||
| Computer equipment | 69,634 | 67,461 | 2,173 | ||||||
| Field equipment | 273,534 | 82,061 | 191,473 | ||||||
| Furniture and office equipment | 24,486 | 22,475 | 2,011 | ||||||
| Leasehold improvements | 63,203 | 63,203 | – | ||||||
| Vehicles | 27,699 | 13,850 | 13,849 | ||||||
| PROPERTY AND EQUIPMENT | 458,556 | 249,050 | 209,506 | ||||||
| 5. | MINERAL PROPERTIES |
| Canada | ||||||||||||||||
| British | Northwest | |||||||||||||||
| Yukon | Columbia | Territories | ||||||||||||||
| Casino | Carmacks | Island | Redstone | TOTAL | ||||||||||||
| Copper | ||||||||||||||||
| Expressed in Canadian dollars | $ | $ | $ | $ | $ | |||||||||||
| DECEMBER 31, 2008 | 20,821,505 | 14,645,143 | 18,088,325 | 12,147,609 | 65,702,582 | |||||||||||
| Advance royalty | – | 100,000 | – | – | 100,000 | |||||||||||
| Claims maintenance | 10,363 | 4,408 | – | 40,199 | 54,970 | |||||||||||
| Detailed engineering | – | 93,945 | – | – | 93,945 | |||||||||||
| Engineering studies | 112,991 | 1,470 | – | – | 114,461 | |||||||||||
| Exploration | 3,711,996 | – | (331,310 | ) | 161,970 | 3,542,656 | ||||||||||
| Future income tax | 46,434 | 42,427 | – | 3,767 | 92,628 | |||||||||||
| Permitting | 1,652,334 | 673,916 | – | 2,162 | 2,328,412 | |||||||||||
| Reclamation obligation | – | 80,300 | – | – | 80,300 | |||||||||||
| Salary and wages | 224,775 | 215,625 | – | 22,500 | 462,900 | |||||||||||
| Stock-based compensation | 108,346 | 98,997 | – | 10,447 | 217,790 | |||||||||||
| DECEMBER 31, 2009 | 26,688,744 | 15,956,231 | 17,757,015 | 12,388,654 | 72,790,644 | |||||||||||
| Advance royalty | – | 100,000 | – | – | 100,000 | |||||||||||
| Claims maintenance | 25,151 | 210 | – | 65,099 | 90,460 | |||||||||||
| Detailed engineering | – | 48,940 | – | – | 48,940 | |||||||||||
| Engineering studies | 1,251,250 | – | – | – | 1,251,250 | |||||||||||
| Exploration | 6,187,151 | – | 29,101 | 252,643 | 6,468,895 | |||||||||||
| Permitting | 3,255,525 | 777,806 | – | – | 4,033,331 | |||||||||||
| Salary and wages | 269,290 | 143,653 | – | – | 412,943 | |||||||||||
| Sock-based compensation | 97,746 | 35,952 | – | – | 133,698 | |||||||||||
| DECEMBER 31, 2010 | 37,774,857 | 17,062,792 | 17,786,116 | 12,706,396 | 85,330,161 | |||||||||||
| CONSOLIDATED FINANCIALSTATEMENTS | 47 | |
| 2010 ANNUAL REPORT |
| a. | Casino (100% - Yukon, Canada) | |
The Casino porphyry copper-gold-molybdenum property is located in west-central Yukon, Canada. | ||
Should it make a production decision, Western Copper is required to make a cash payment of $1 million. Production on the claims is also subject to a 5% net profits interest. | ||
| b. | Carmacks (100% - Yukon, Canada) | |
The Carmacks Copper Project is an oxide copper deposit that is located in Yukon, Canada. | ||
In April 2009, the Company obtained the Quartz Mining License relating to the Carmacks Copper Project. As a result, West- ern Copper was required to provide security in the amount of $80,300 representing the estimated reclamation cost for work performed to date on the property. The Company holds a Guaranteed Investment Certificate in this amount in safekeeping for the Yukon Government. The security will be released once Western Copper performs its obligations pursuant to the Quartz Mining License. | ||
Any production from the Carmacks Copper Project is subject to either a 15% net profits interest or a 3% net smelter royalty, at Western Copper’s election. If Western Copper elects the net smelter royalty, it has the right to purchase the royalty for $2.5 million, less any advance royalty payments made to that date. The Company is required to make an advance royalty payment of $100,000 in any year in which the average daily copper price reported by the London Metal Exchange is US$1.10 per pound or greater. At December 31, 2010, Western Copper had made $700,000 in advance royalty payments and had accrued the amount relating to 2010. | ||
| c. | Island Copper (100% - British Columbia, Canada) | |
The Island Copper property consists of three blocks of mineral claims located on northern Vancouver Island. The mineral claim blocks are referred to as the Hushamu claims, the Apple Bay claims, and the Rupert Block. | ||
Should a production decision be made on the Hushamu claims, Western Copper is required to make a cash payment of $1 million to an unrelated third party within 60 days of the production decision. These mineral claims are also subject to a 10% net profits interest. | ||
Should a production decision be made on the Apple Bay claims, Western Copper is required to pay $800,000 in cash or in Western Copper stock to Electra Gold Ltd. (“Electra”). The payment method is at the election of Western Copper. Electra maintains the right to explore the Apple Bay claims for non-metallic minerals. | ||
The Island Copper property had been under option since 2008. On July 15, 2010, Kobex Minerals Inc. terminated its rights to earn-in on the property. | ||
| d. | Redstone (100% - Northwest Territories, Canada) | |
The Redstone property comprises mining leases and mineral claims located in the Northwest Territories. Should produc- tion be achieved on the mining leases, the revenue will be subject to a net smelter royalty of between 3-4% depending on the monthly average of the final daily spot price of copper reported on the New York Commodities Exchange relating to each production month, as follows: |
| • | 3% if the price is less than, or equal to US$0.75 per pound; | |
| • | 3.5% if the price is greater than US$0.75 per pound, but less than or equal to US$1.00 per pound; and | |
| • | 4% if the price is greater than US$1.00 per pound. |
| 48 | NOTESTO THE CONSOLIDATED FINANCIAL STATEMENTS | |
| 2010 ANNUAL REPORT |
| e. | Sierra Almoloya (100% - Chihuahua, Mexico) | |
In 2008, the Company re-evaluated the property and decided to abandon the claims. As a result, Western Copper wrote-off all costs capitalized relating to Sierra Almoloya. |
| 6. | SHARE CAPITAL AND CONTRIBUTED SURPLUS |
| a. | Share Capital |
| Authorized | Unlimited Class A voting shares with a par value of $0.00001 | |
| Unlimited common shares without par value | ||
| Unlimited number of preferred shares without par value | ||
| Issued and outstanding | 91,487,836 common shares |
| b. | Financing | |
On December 22, 2010, Western Copper issued 9,395,500 units at a price of $2.45. Each unit comprised one common share of the Company and half of one warrant. Each whole warrant is exercisable for one common share of the Company at a price of $3.45 and expires on December 22, 2012. The agent was paid a cash commission equal to 6.0% of gross proceeds. | ||
The fair value assigned to the warrants was $4,476,983. The fair value of the warrants was calculated using the Black-Sc- holes option pricing model and was based on the following assumptions: |
| Expected stock price volatility | 114% |
| Expected term, in years | 2.0 |
| Average risk-free interest rate | 1.66% |
| Expected dividend yield | – |
On December 4, 2009, Western Copper issued 2,150,000 units at a price of $2.50. Each unit was comprised of one flow-through common share of the Company and one warrant (“investor warrant”). Each warrant is exercisable for one non flow-through common share of the Company at a price of $2.60 per common share and expires three years following closing. If, commencing on the date that is four months plus one day following the closing of the transaction, the weighted average trading price of the Company’s common shares is at a price equal to or greater than $5.00 for twenty consecutive trading days, the Company has the right to accelerate the expiry date of the investor warrants by giving thirty days written notice to the holder.
The agent received a cash commission equal to 6.0% of the gross proceeds and that number of warrants (“agent warrants”) which is equal to 4.0% of the number of units sold. Each agent warrant is exercisable for one non flow-through common share of the Company at a price of $2.50 per common share and expires two years following closing. If, commencing on the date that is four months plus one day following the closing of the transaction, the weighted average trading price of the Company’s common shares is at a price equal to or greater than $4.00 for a period of fifteen consecutive trading days, the Company has the right to accelerate the expiry date of the agent’s warrants by giving thirty days written notice to the agent.
| CONSOLIDATED FINANCIALSTATEMENTS | 49 | |
| 2010 ANNUAL REPORT |
The fair value assigned to the agent warrants was $89,440. The fair value was calculated using the Black-Scholes option pricing model on the closing date of the transaction based on the following assumptions:
| Expected stock price volatility | 132% |
| Expected term, in years | 2.0 |
| Average risk-free interest rate | 1.27% |
| Expected dividend yield | – |
The fair value assigned to the investor warrants was $1,848,495. The fair value of the investor warrants was calculated using the Black-Scholes option pricing model and was based on the following assumptions:
| Expected stock price volatility | 114% |
| Expected term, in years | 3.0 |
| Average risk-free interest rate | 1.73% |
| Expected dividend yield | – |
On July 10, 2009, Western Copper issued 4,000,000 units at a price of $1.00. Each unit comprised of one flow-through common share of the Company and half of one warrant. Each whole warrant (“investor warrant”) is exercisable for one non flow-through common share of the Company at a price of $1.25 per common share and expires three years following closing. If, commencing on the date that is four months plus one day following the closing of the transaction, the weighted average trading price of the Company’s common shares is at a price equal to or greater than $2.00 for a period of twenty trading days, the Company has the right to accelerate the expiry date of the investor warrants by giving thirty days written notice to the holder.
The agent received a cash commission equal to 6.0% of the gross proceeds and that number of warrants (“agent warrants”) which is equal to 6.0% of the number of units sold. Each agent warrant is exercisable for one non flow-through common share of the Company at a price of $1.25 per common share and expires two years following closing. If, commencing on the date that is four months plus one day following the closing of the transaction, the weighted average trading price of the Company’s common shares is at a price equal to or greater than $1.75 for a period of fifteen consecutive trading days, the Company has the right to accelerate the expiry date of the agent’s warrants by giving thirty days written notice to the agent.
The fair value assigned to the agent warrants is $114,960. The fair value was calculated using the Black-Scholes option pricing model on the closing date of the transaction based on the following assumptions:
| Expected stock price volatility | 110% |
| Expected term, in years | 2.0 |
| Average risk-free interest rate | 1.33% |
| Expected dividend yield | – |
The fair value assigned to the investor warrants was $813,200. The fair value of the investor warrants was calculated using the Black-Scholes option pricing model and was based on the following assumptions:
| Expected stock price volatility | 127% |
| Expected term, in years | 3.0 |
| Average risk-free interest rate | 1.33% |
| Expected dividend yield | – |
| 50 | NOTESTO THE CONSOLIDATED FINANCIAL STATEMENTS | |
| 2010 ANNUAL REPORT |
| c. | Donation of Common Shares | |
On February 19, 2010, Western Copper issued and donated 90,000 common shares to the University of British Columbia. Western Copper recorded a total of $117,900 as a donation expense. |
| 7. | WARRANTS AND STOCK OPTIONS |
| a. | Warrants | |
A summary of the Company’s warrants outstanding at December 31, 2010 and the changes for the year then ended, is presented below: |
| Number of | Weighted average | |||||
| Warrants | exercise price | |||||
| Expressed in Canadian dollars | $ | |||||
| DECEMBER 31, 2009 | 4,275,000 | 1.95 | ||||
| Issued | 4,697,750 | 3.45 | ||||
| Exercised | (1,964,000 | ) | 1.25 | |||
| Expired | (75,000 | ) | 1.25 | |||
| DECEMBER 31, 2010 | 6,933,750 | 3.17 |
Warrants outstanding at December 31, 2010 are as follows:
| Warrants outstanding, | Number of | Average remaining | ||||
| by exercise price | Warrants | contractual life | ||||
| Expressed in Canadian dollars | years | |||||
| $2.50 | 86,000 | 0.93 | ||||
| $2.60 | 2,150,000 | 1.93 | ||||
| $3.45 | 4,697,750 | 1.98 | ||||
| DECEMBER 31, 2010 | 6,933,750 | 1.95 |
| CONSOLIDATED FINANCIALSTATEMENTS | 51 | |
| 2010 ANNUAL REPORT |
| b. | Stock Options | |
Based on the Company’s Stock Option Plan, the Company may issue stock options for the purchase of up to 10% of issued capital. The exercise price of the stock options shall be greater than, or equal to, the market value of the Company’s com- mon shares on the last trading day immediately preceding the date of grant. Stock options vest over a two year period from the date of grant unless otherwise determined by the directors. The maximum stock option term is 10 years. At December 31, 2010, the Company could issue an additional 4,945,449 stock options. | ||
A summary of the Company’s stock options outstanding at December 31, 2010 and the changes for the year then ended, is presented below: |
| Number of | Weighted average | |||||
| stock options | exercise price | |||||
| Expressed in Canadian dollars | $ | |||||
| DECEMBER 31, 2009 | 4,136,834 | 1.39 | ||||
| Granted | 970,000 | 1.05 | ||||
| Exercised | (763,300 | ) | 0.91 | |||
| Expired | (100,000 | ) | 1.50 | |||
| Forfeited | (40,200 | ) | 0.60 | |||
| DECEMBER 31, 2010 | 4,203,334 | 1.41 |
Stock options outstanding at December 31, 2010 are as follows:
| Stock options outstanding, | Number of | Weighted average | Average remaining | ||||||
| by exercise price | stock options | exercise price | contractual life | ||||||
| Expressed in Canadian dollars | $ | Years | |||||||
| $0.60 - 0.97 | 1,435,000 | 0.75 | 3.84 | ||||||
| $1.25 - 1.90 | 1,508,334 | 1.54 | 2.07 | ||||||
| $2.00 - 2.02 | 1,260,000 | 2.00 | 0.64 | ||||||
| DECEMBER 31, 2010 | 4,203,334 | 1.41 | 2.24 |
Of the total stock options outstanding, 2,957,900 were vested and exercisable at December 31, 2010. The weighted average exercise price of vested stock options is $1.57 and the average remaining contractual life is 1.40 years.
| 52 | NOTESTO THE CONSOLIDATED FINANCIAL STATEMENTS | |
| 2010 ANNUAL REPORT |
| 8. | STOCK-BASED COMPENSATION |
Stock-based compensation has been allocated to the following line items: |
| For the year ended December 31, | 2010 | 2009 | 2008 | |||||||
| Expressed in Canadian dollars | $ | $ | $ | |||||||
| STATEMENT OF LOSS AND COMPREHENSIVE LOSS | ||||||||||
| ADMINISTRATIVE EXPENSES | ||||||||||
| Office and administration | 400,875 | 295,842 | 389,533 | |||||||
| Shareholder communication | 16,002 | 53,556 | 36,283 | |||||||
| 416,877 | 349,398 | 425,816 | ||||||||
| BALANCE SHEET | ||||||||||
| MINERAL PROPERTIES | ||||||||||
| Casino | 97,746 | 108,346 | 122,390 | |||||||
| Carmacks | 35,952 | 98,997 | 122,514 | |||||||
| Island Copper | – | – | 1,383 | |||||||
| Redstone | – | 10,447 | 2,288 | |||||||
| 133,698 | 217,790 | 248,575 | ||||||||
| STOCK-BASED COMPENSATION | 550,575 | 567,188 | 674,391 |
The Company last granted stock options on November 4, 2010. On that date, Western Copper granted 100,000 stock options to an employee at an exercise price of $1.64 per common share. The fair value assigned to the stock options is $106,747.
On July 16, 2010, Western Copper granted 770,000 stock options to employees, directors, and consultants. The stock options granted on July 16, 2010 have an exercise price of $0.86 per common share. The fair value assigned to the stock options is $448,430.
On March 30, 2010, Western Copper granted 100,000 stock options to a director at an exercise price of $1.90 per common share. The fair value assigned to the stock options was $149,335.
The fair value of stock options granted in 2010 was calculated using the Black-Scholes option pricing model and the following assumptions:
| ASSUMPTION | November 4, 2010 | July 16, 2010 | March 30, 2010 | |||||||
| Expected stock price volatility | 104% | 118% | 107% | |||||||
| Expected option term, in years | 3.12 | 2.73 | 5.00 | |||||||
| Average risk-free interest rate | 1.57% | 1.82% | 2.92% | |||||||
| Expected dividend yield | – | – | – |
| CONSOLIDATED FINANCIALSTATEMENTS | 53 | |
| 2010 ANNUAL REPORT |
| 9. | COMMITMENTS |
The Company has an agreement to lease office space in Vancouver until May 31, 2014. The total amount of payments remaining during the course of the agreement as at December 31, 2010 is $728,239. Of this amount, $210,288 is due within the next twelve months. | |
The Company has an agreement to lease office space in the Yukon until December 31, 2011. The total amount of payments remaining during the course of the agreement as at December 31, 2010 is $28,635. The entire amount is due within the next twelve months. | |
Mineral property commitments are described in note 5. | |
| 10. | SEGMENTED INFORMATION |
| a. | Industry Information | |
The Company operates in one reportable operating segment: the acquisition, exploration, and future development of resource properties. | ||
| b. | Geographic Information | |
All interest is earned in Canada. All non-current assets are held in Canada. The geographical breakdown of mineral properties is shown in note 5. |
| 11. | CAPITAL MANAGEMENT |
Western Copper is a mineral exploration company with a primary focus of advancing its mineral properties towards production. Its principal source of funds is the issuance of common shares. The Company considers capital to be equity attributable to common shareholders, comprised of share capital, contributed surplus, and deficit. It is the Company’s objective to safeguard its ability to continue as a going concern so that it can continue to explore and develop its projects. | |
Western Copper manages its capital structure based on the funds available for its operations and makes adjustments for changes in economic conditions, capital markets and the risk characteristics of the underlying assets. To maintain its objectives, the Company may attempt to issue new shares, seek debt financing, acquire or dispose of assets or change the timing of its planned exploration and development projects. There is no assurance that these initiatives will be successful. | |
To facilitate the management of its capital, Western Copper prepares annual expenditure budgets and updates them as necessary, depending on various factors, many of which are beyond the Company’s control. The Board of Directors approves all annual budgets and subsequent updates. | |
The Company monitors its cash position and its short-term investments on a regular basis to determine whether sufficient funds are available to meet its short-term and long-term corporate objectives. The Company also seeks to provide liquidity and limit credit risk by acquiring investments that are guaranteed by Canadian governments or by a Canadian chartered bank and that are redeemable in portion or in full at the Company’s option without penalty. | |
There was no change in the Company’s approach to capital management during the period. Western Copper has no debt and does not pay dividends. Neither the Company nor any of its subsidiaries is subject to externally imposed capital requirements. |
| 54 | NOTESTO THE CONSOLIDATED FINANCIAL STATEMENTS | |
| 2010 ANNUAL REPORT |
| 12. | FINANCIAL INSTRUMENT RISK |
The Board of Directors has overall responsibility for the establishment and oversight of the Company’s risk management framework. The Company has exposure to credit, liquidity, currency, interest rate and market risks from the use of finan- cial instruments. Financial instruments consist of cash and cash equivalents, short-term investments, other receivables, reclamation bonds, and accounts payable and accrued liabilities. |
| a. | Market Risk | |
The Company does not generate cash from its operating activities. Its principal source of funds is the issuance of common shares. It uses the capital raised from the issuance of its common shares to explore and develop its mineral properties with the goal of increasing the price of the Company’s common shares. Western Copper’s common shares are publicly traded. As such, the price of its common shares is susceptible to factors beyond management’s control including, but not limited to, fluctuations in commodity prices and foreign exchange rates and changes in the general market outlook. Should Western Copper require funds during a time when the price of its common shares is depressed, the Company may be required to accept significant dilution to maintain enough liquidity to continue operations or may be unable to raise sufficient capital to meet its obligations. The Company’s contractual obligations are described in note 9. | ||
| b. | Liquidity Risk | |
Liquidity risk is the risk that the Company will be unable to meet its financial obligations as they come due. The Company uses cash forecasts to ensure as far as possible that there is sufficient cash on hand to meet short-term business requirements. Cash is invested in highly liquid investments which are available to discharge obligations when they come due. The Company does not maintain a line of credit. | ||
| c. | Credit Risk | |
Financial instruments that potentially subject the Company to credit risk consist primarily of cash and cash equivalents and short-term investments. These financial instruments are at risk to the extent that the institutions issuing or holding them cannot redeem amounts when they are due or requested. To limit its credit risk, the Company uses a restrictive investment policy. It deposits cash and cash equivalents in Canadian chartered banks and purchases short-term investments that are guaranteed by Canadian governments or by Canadian chartered banks. | ||
| d. | Currency Risk | |
Currency risk is the risk that the Company will lose significant purchasing power to operate its business as a result of changes in currency rates. The Company raises funds in Canadian dollars. The majority of the Company’s expenditures are incurred in Canadian dollars. To limit its exposure to currency risk, the Company maintains the majority of its cash and cash equivalents in Canadian dollars. The Company did not have a material amount of financial instruments denominated in foreign currencies as at December 31, 2010 or December 31, 2009. | ||
| e. | Interest Rate Risk | |
The Company is exposed to interest rate risk on its cash and cash equivalents and its short-term investments to the extent that the institutions that hold or issue those instruments cannot pay the interest earned on them by Western Copper. Potential losses in interest income would not have a material impact on the Company’s results of operations. |
| CONSOLIDATED FINANCIALSTATEMENTS | 55 | |
| 2010 ANNUAL REPORT |
| 13. | SUPPLEMENTAL CASH FLOW INFORMATION |
| For the year ended December 31, | 2010 | 2009 | 2008 | |||||||
| Expressed in Canadian dollars | $ | $ | $ | |||||||
| CHANGE IN NON-CASH WORKING CAPITAL ITEMS | ||||||||||
| Accrued interest on short-term investments | (149 | ) | 19,114 | (25,162 | ) | |||||
| Other receivables relating to operations | (48,081 | ) | 19,400 | 13,501 | ||||||
| Prepaid expenses | (11,924 | ) | 6,046 | 4,316 | ||||||
| Accounts payable and accrued liabilities relating to operations | (50,209 | ) | 35,285 | 12,160 | ||||||
| CHANGE IN NON-CASH WORKING CAPITAL ITEMS | (110,363 | ) | 79,845 | 4,815 |
| 14. | INCOME TAXES |
| a. | Income Tax Balances | |
The Company has approximately $8.2 million in non-capital losses that may be carried forward to apply against future years’ income for Canadian income tax purposes. The losses expire as follows: |
| Available to | Amount | ||
| Expressed in Canadian dollars | $ | ||
| 2014 | 89,319 | ||
| 2015 | 34,373 | ||
| 2024 | 10,780 | ||
| 2025 | 48,781 | ||
| 2026 | 410,941 | ||
| 2027 | 1,288,583 | ||
| 2028 | 1,880,692 | ||
| 2029 | 1,860,492 | ||
| 2030 | 2,585,586 | ||
| NON-CAPITAL LOSSES CARRIED FORWARD | 8,209,547 |
The Company has approximately $47.2 million in Canadian Exploration and Development Expenditures (“CEDE”) that are available to reduce future taxable income. CEDE balances do not expire. | ||
| b. | Statutory Rate Reconciliation | |
The current and future income tax expense or recovery reported by the Company differs from the amounts obtained by applying statutory rates to the loss before income tax. |
| 56 | NOTESTO THE CONSOLIDATED FINANCIAL STATEMENTS | |
| 2010 ANNUAL REPORT |
A reconciliation of the income tax provision computed at statutory rates to the reported income tax provision is provided below:
| 2010 | 2009 | 2008 | ||
| Expressed in Canadian dollars | $ | $ | $ | |
| Statutory tax rate | 28.50% | 30.00% | 31.00% | |
| Loss before taxes | 2,776,979 | 2,256,054 | 2,610,952 | |
| Income tax recovery calculated at statutory rate | 791,439 | 676,816 | 809,395 | |
| Non-deductible expenditures | (185,910) | (110,776) | (283,210) | |
| Effect of differences in income tax rates | (86,807) | 133,972 | 134,440 | |
| Effect of mineral property write-off | – | – | 103,185 | |
| Items included in equity and other | 381,144 | (40,094) | 213,768 | |
| Change in valuation allowance | (899,866) | (264,021) | (525,875) | |
| FUTURE INCOME TAX RECOVERY | – | 395,897 | 451,703 |
| c. | Future Income Tax Liability | |
Temporary differences arising from the difference between the tax basis and the carrying amount of the Company’s mineral properties is used to calculate the future income tax liability of $12,472,501 (2009 - $9,661,846). | ||
Future income tax liability is measured using tax rates and laws that are expected to apply when the differences are expected to reverse. | ||
| d. | Future Income Tax Assets | |
Future income tax liabilities and future income tax assets offset if they relate to the same taxable entity and the same taxation authority. Future potential tax deductions that are not used to offset future income tax liabilities are considered to be future income tax assets. | ||
The significant components of the Company’s future tax assets are as follows: |
| 2010 | 2009 | |||||
| Expressed in Canadian dollars | $ | $ | ||||
| Mineral property interests | 2,143,072 | 2,171,208 | ||||
| Non-capital losses | 2,029,201 | 1,417,476 | ||||
| Other temporary differences | 534,658 | 218,381 | ||||
| FUTURE INCOME TAX ASSETS | 4,706,931 | 3,807,065 | ||||
| Valuation allowance | (4,706,931 | ) | (3,807,065 | ) | ||
| FUTURE INCOME TAX ASSETS, NET | – | – |
| CONSOLIDATED FINANCIALSTATEMENTS | 57 | |
| 2010 ANNUAL REPORT |
The Company estimates that the realization of income tax benefits related to these future potential tax deductions is uncertain and cannot be viewed as more likely than not. Accordingly, a valuation allowance in the amount of the potential future benefit has been recorded and no net future income tax asset has been recognized. | |
| 15. | MATERIAL DIFFERENCES BETWEEN CANADIAN AND UNITED STATES GENERALLY ACCEPTED ACCOUNTING PRINCIPLES (GAAP) |
Western Copper prepares its consolidated financial statements in accordance with accounting principles generally accepted in Canada (“Canadian GAAP”), which differ in certain material respects from those principles that the Company would have followed had its financial statements been prepared in accordance with accounting principles generally accepted in the United States (“US GAAP”). The effects of significant measurement differences between Canadian and US GAAP are described below. |
| a. | Balance Sheets |
| As at December 31, | 2010 | 2009 | |||||
| Expressed in Canadian dollars | $ | $ | |||||
| Mineral properties - Canadian GAAP | 85,330,161 | 72,790,644 | |||||
| Cumulative exploration expenditures written off under US GAAP | (37,992,824 | ) | (25,453,307 | ) | |||
| Future income tax effect of cumulative exploration expenditures written off under US GAAP | (312,960 | ) | (312,960 | ) | |||
| MINERAL PROPERTIES - US GAAP | 47,024,377 | 47,024,377 | |||||
| Future income tax liability – Canadian GAAP | 12,472,501 | 9,661,846 | |||||
| Cumulative adjustments under US GAAP | (7,344,699 | ) | (3,772,304 | ) | |||
| FUTURE INCOME TAX LIABILITY – US GAAP | 5,127,802 | 5,889,542 | |||||
| Shareholders’ equity - Canadian GAAP | 95,664,251 | 76,116,921 | |||||
| Cumulative exploration expenditures written off under US GAAP | (37,992,824 | ) | (25,453,307 | ) | |||
| Cumulative future income tax recovery adjustment under US GAAP | 7,031,739 | 3,459,344 | |||||
| Flow-through share premium | – | (685,000 | ) | ||||
| SHAREHOLDERS’ EQUITY - US GAAP | 64,703,166 | 53,437,958 |
| 58 | NOTESTO THE CONSOLIDATED FINANCIAL STATEMENTS | |
| 2010 ANNUAL REPORT |
| b. | Statements of Loss, Comprehensive Loss and Deficit |
| For the years ended December 31, | 2010 | 2009 | 2008 | |||||||
| Expressed in Canadian dollars | $ | $ | $ | |||||||
| Loss and comprehensive loss – Canadian GAAP | 2,776,979 | 1,860,157 | 2,159,249 | |||||||
| Mineral property write-off under Canadian GAAP | – | – | (405,001 | ) | ||||||
| Exploration expenditures for the period under US GAAP | 12,539,517 | 6,995,434 | 8,727,133 | |||||||
| Future income tax recovery under Canadian GAAP | – | 395,897 | 451,703 | |||||||
| Future income tax recovery under US GAAP | (1,446,740 | ) | (1,683,289 | ) | (1,841,597 | ) | ||||
| LOSS AND COMPREHENSIVE LOSS – US GAAP | 13,869,756 | 7,568,199 | 9,091,487 | |||||||
| Loss and diluted loss per common share | 0.17 | 0.10 | 0.12 | |||||||
| Weighted average number of common shares outstanding | 81,128,926 | 74,897,792 | 72,792,941 | |||||||
| Deficit – US GAAP, beginning of year | 50,050,756 | 42,482,557 | 33,391,070 | |||||||
| Loss and comprehensive loss | 13,869,756 | 7,568,199 | 9,091,487 | |||||||
| DEFICIT – US GAAP, END OF YEAR | 63,920,512 | 50,050,756 | 42,482,557 |
| c. | Statements of Cash Flow |
| For the year ended December 31, | 2010 | 2009 | 2008 | |||||||
| Expressed in Canadian dollars | $ | $ | $ | |||||||
| Cash provided by (used in) operating activities – Canadian GAAP | (2,339,148 | ) | (1,793,475 | ) | (1,735,717 | ) | ||||
| Adjustment for mineral properties and deferred exploration under US GAAP | (12,475,486 | ) | (6,539,009 | ) | (8,573,293 | ) | ||||
| CASH PROVIDED BY (USED IN) OPERATING ACTIVITIES – US GAAP | (14,814,637 | ) | (8,332,484 | ) | (10,309,010 | ) | ||||
| Cash provided by (used in) financing activities – Canadian GAAP | 24,784,204 | 8,956,411 | 500 | |||||||
| Gross proceeds received from issuance of flow-through units | – | (9,375,000 | ) | – | ||||||
| CASH PROVIDED BY (USED IN) FINANCING ACTIVITIES – US GAAP | 24,784,204 | (418,589 | ) | 500 | ||||||
| Cash provided by (used in) investing activities – Canadian GAAP | (24,250,489 | ) | (8,764,009 | ) | (16,954,526 | ) | ||||
| Adjustment for mineral properties and deferred exploration under US GAAP | 12,475,489 | 6,539,009 | 8,573,293 | |||||||
| Gross proceeds received from issuance of flow-through units | – | 9,375,000 | – | |||||||
| CASH PROVIDED BY (USED IN) INVESTING ACTIVITIES – US GAAP | (11,775,000 | ) | 7,150,000 | (8,381,233 | ) |
| CONSOLIDATED FINANCIALSTATEMENTS | 59 | |
| 2010 ANNUAL REPORT |
| d. | Current Differences in Accounting Principles |
| i) | Mineral property expenditures | |
Mineral property exploration expenditures are accounted for in accordance with Canadian GAAP as disclosed in note 2. | ||
For US GAAP purposes, exploration expenditures relating to mineral properties for which commercial and legal feasibility has not yet been established and administrative expenditures are expensed as incurred. The Company expenses development costs until proven and probable reserves are determined and substantially all required permits are obtained. | ||
Mineral property acquisition costs, including periodic option payments, and development expenditures incurred subsequent to the determination of the feasibility of mining operations are deferred until the property to which they relate is placed into production, sold, allowed to lapse or abandoned, or when impairment in value has been determined to have occurred. | ||
| ii) | Flow-through shares | |
In 2009, the Company completed two private placements of flow-through units. For Canadian GAAP purposes, the Company records the proceeds of the issuance of flow-through shares as described in note 2. | ||
Under US GAAP, the gross proceeds from the issuance of flow-through shares need to be allocated between the offering of the flow-through shares and any premium paid for the implied tax benefit received by the investors as a result of the flow-through shares. The calculated tax benefit is recognized as a liability until the Company renounces the expenditures, at which point the liability is reversed and is recorded as a tax recovery on the statement of loss. At December 31, 2010, this liability was $nil (2009 - $685,000). | ||
US GAAP also requires that the portion of the gross proceeds from flow-through shares not yet spent by the Company be considered restricted cash, as the funds are required to be expended on exploration in Canada in order to satisfy the requirements of the renouncement to the investors. At December 31, 2010 this amount was $nil (2009 - $5.91 million). |
| e. | Recent and Future Accounting Pronouncements Under US GAAP |
| i) | ASU 2010-09 Topic 855 – Subsequent Events | |
Amends ASC 855 to address certain implementation issues, including (1) eliminating the requirement for SEC filers to disclose the date through which it has evaluated subsequent events, (2) clarifying the period through which conduit bond obligors must evaluate subsequent events, and (3) refining the scope of the disclosure requirements for reissued financial statements. The amendments to ASC 855 made by ASU 2010-9 are effective upon issuance for entities other than conduit bond obligors. This rule is effective for years ending June 15, 2010 or later. |
| 60 | NOTESTO THE CONSOLIDATED FINANCIAL STATEMENTS | |
| 2010 ANNUAL REPORT |
NOTES
| CONSOLIDATED FINANCIALSTATEMENTS | 61 | |
| 2010 ANNUAL REPORT |
WESTERN COPPER
MANAGEMENT TEAM

| MANAGEMENT | BOARD OF DIRECTORS | |
| Dale Corman, B.Sc., P.Eng | Dale Corman, B.Sc., P.Eng. | |
| Chairman & CEO | Chairman | |
| Paul West-Sells, Ph.D. | Robert Byford, B.A., FCA | |
| President & COO | Director | |
| Julien François, CA | Robert Gayton, B.Comm., Ph.D., FCA | |
| VP Finance & CFO | Director | |
| Cameron Brown, P. Eng. | Ian Watson | |
| VP Engineering | Director | |
| Jonathan Clegg, P.Eng | David Williams, LL.B., MBA | |
| Engineering | Director | |
| Klaus Zeitler, Ph.D. | ||
| Director |
| STOCK EXCHANGE | |||
| Toronto Stock Exchange Symbol: WRN | |||
| New York Stock Exchange AMEX Symbol: WRN | CORPORATE HEAD OFFICE | ||
| Western Copper Corporation | |||
| COMPANY FILINGS | 2050 - 1111 West Georgia Street | ||
| www.sedar.com | Vancouver, British Columbia | ||
| www.sec.gov | Canada V6E 4M3 | ||
| TRANSFER AGENT | Toll Free: 1 888 966 9995 | ||
| Phone: 604 684 9497 | |||
| Computershare Investor Services Inc. | Fax: 604 669 2926 | ||
| 100 University Avenue, 8th Floor | |||
| Toronto, Ontario | www.westerncoppercorp.com | ||
| Canada, M5J 2Y1 | |||
| INVESTOR RELATIONS | |||
| Toll Free in North America: 1 800 564 6253 | |||
| Int’l 514 982 7555 | Julie Kim | ||
| By Internet www.computershare.com | Manager Corporate Communications | ||
| & Investor Relations | |||
| AUDITORS | |||
| info@westerncoppercorp.com | |||
| PricewaterhouseCoopers LLP | |||
| 7th Floor – 250 Howe Street | ANNUAL GENERAL MEETING | ||
| Vancouver, British Columbia | |||
| Canada V6C 3S7 | Thursday, June 23rd, 2011 | ||
| 2:30pm PST | |||
| LEGAL COUNSEL | |||
| DuMoulin Black LLP | 1111 West Georgia Street | ||
| 10th Floor - 595 Howe Street | Thurlow Room, Main Floor | ||
| Vancouver, British Columbia | Vancouver, British Columbia | ||
| Canada V6C 2T5 | Canada V6E 4M3 |
TSX:WRN NYSE:WRN
WESTERN COPPER
CORPORATION
2050-1111 West Georgia Street ||Vancouver, BC ||Canada V6E 4M3
Toll Free:1 888 966 9995 ||Phone:604 684 9497 ||Fax:604 669 2926 ||Email:info@westerncoppercorp.com
WWW.WESTERNCOPPERCORP.COM