2011 Technical Report
On the
Island Copper Property
Vancouver Island, British Columbia
NTS
102I080 (NW Expo Target)
092L061 (Hushamu Target)
UTM Zone 9N
5619500N 569500E (NW Expo Target)
5614500N 580500E (Hushamu Target)
For
| Western Copper Corporation | NorthIsle Copper and Gold Inc. |
| Moraga Resources Ltd. | North Island Mining Corp. |
By
Christopher Baldys, P.Eng.,
Arnd Burgert, P.Geo., &
Jacques Houle, P.Eng.
August 22, 2011
TABLE OF CONTENTS
LIST OF TABLES
LIST OF CHARTS
- 1 -
LIST OF FIGURES
LIST OF APPENDICES
| Appendix 1 – 2008 Drill Hole Log Files |
| Appendix 2 – 2008 Analytical Reports and Laboratory Methods and Specifications |
| Appendix 3 – 2008 QA/QC Analyses, Reports, Methods and Specifications |
| Appendix 4 – Thin Section Descriptions and Photographs by J. Payne |
| Appendix 5 – Statistical Analyses of Mo-Re from DDH EC08-250 by H. Kucha |
| Appendix 6 – Surface Water Sampling Program |
| Appendix 7 – Stream Assessment by Fishfor Contracting |
| Appendix 8 – Hushamu Access Road Rehabilitation Prescription by H. Murphy |
| Appendix 9 – Health and Safety Guidelines for Island Copper Project |
| Appendix 10 – Work Permits from MEMPR, MOFR and Moraga |
| Appendix 11 – Road Use Agreements: WFP Port McNeill and Holberg Divisions |
| Appendix 12 – Geotechnical Core Logging Protocol by Piteau Engineering |
| Appendix 13 – Historical Work Summary for the Island Copper Property |
- 2 -
Summary
The Island Copper Property (“Island Copper”, or the “Property”) is an advanced exploration project covering at least seven (7) known mineral occurrences of porphyry and related deposit types containing copper-gold-molybdenum-rhenium situated along the “Northern Island Copper Belt” on Vancouver Island, British Columbia. The Property covers over 50 km strike length of the belt, and is underlain mainly by Jurassic age Bonanza volcanics and Island Plutonic Suite rocks, both east and west of the past producing Island Copper Mine.
In August, 2008 IMA Exploration Inc. (“IMA”) entered an option agreement to earn up to 70% interest in the Island Copper Property from owner Western Copper Corporation (“Western Copper”) and subsidiary Moraga Resources Ltd. (“Moraga”). During the fall of 2008, IMA completed an initial drilling program at 2 of the 7 known mineral occurrences on the Property: Northwest Expo and Hushamu. The program consisted of 13 HQ size holes totaling 5,123 metres, with 11 holes totaling 4,610 metres drilled at Northwest Expo and 2 holes totaling 513 metres at Hushamu. In September, 2009, IMA and two other companies merged to form Kobex Mineral Inc., who terminated the option agreement in July, 2010.
The 2008 drilling program at Northwest Expo was designed to delineate the northwest projection of the mineralized zone beyond significant intercepts of copper, molybdenum and gold achieved by Western Copper in their 2007 drilling program (Lehtinen, Awmak, 2007). The 2008 program utilized new logging roads to establish 5 drill pads located 300 to 400 metres apart with 2 to 3 holes drilled from each pad. Significant intercepts were achieved from 4 holes drilled from the 2 western-most pads in an extensive hydrothermal breccia zone, as follows:
EC08-248 yielded 100 metres @ 0.052 g/t gold, 0.003% copper, 0.003% molybdenum and 0.215 g/t rhenium from 267 to 367 metres, including: | ||
| o | 4 metres @ 0.026 g/t gold, 0.002% copper, 0.022% molybdenum and 0.561 g/t rhenium from 267 to 271 metres | |
EC08-250 yielded 196 metres @ 0.149 g/t gold, 0.009% copper, 0.019% molybdenum and 1.222 g/t rhenium from 291 metres to 487 metres, including: | ||
| o | 92 metres @ 0.218 g/t gold, 0.015% copper, 0.030% molybdenum and 2.210 g/t rhenium from 381 to 473 metres | |
EC08-252 yielded 290 metres @ 0.226 g/t gold, 0.026% copper, 0.016% molybdenum and 0.497 g/t rhenium from 165 to 455 metres, including: | ||
| o | 102 metres @ 0.121 g/t gold, 0.006% copper, 0.020% molybdenum and 0.776 g/t rhenium from 165 to 267 metres, and | |
| o | 124 metres @ 0.299 g/t gold, 0.053% copper, 0.017% molybdenum and 0.359 g/t rhenium from 329 to 453 metres | |
EC08-254 yielded 238 metres @ 0.606 g/t gold, 0.084% copper, 0.010% molybdenum and 0.265 g/t rhenium from 194 to 432 metres, including: | ||
o | 164 metres @ 0.817 g/t gold, 0.119% copper, 0.011% molybdenum and 0.368 g/t rhenium from 238 to 402 metres | |
The 2008 drilling program at Hushamu was designed to confirm the grade continuity of the core portion of the mineralized zone, particularly for rhenium and molybdenum, which had never been systematically analyzed in previous drilling programs. The 2008 program utilized refurbished logging roads to establish 2 drill pads located about 1 kilometre apart with 1 hole drilled from each pad. Both holes achieved significant intercepts in mainly hydrothermal breccia, as follows:
- HI08-03 yielded 179.3 metres @ 0.471 g/t gold, 0.423% copper, 0.011% molybdenum, and 0.436 g/t rhenium from 10.7 to 197.2 metres
- HI08-08 yielded 164 metres @ 0.505 g/t gold, 0.303% copper, 0.007% molybdenum and 0.419 g/t rhenium from 8 to 172 metres
At Northwest Expo, the mineralized zone was confirmed as a tabular shaped, +600 metre long by 300 metre thick hydrothermal breccia body striking approximately east-west and dipping moderately to the north. The drilling program was successful in delineating both the northern down-dip extent and the
- 3 -
eastern fault-bounded extent of the mineralized zone, but the western strike projection of the zone remains open and untested towards the western Property boundary. Copper values appear to decrease down-dip to the north within the zone relative to previous drilling results to the south, but gold, molybdenum and rhenium values are persistent throughout the zone. Preliminary microscopy work completed on 11 selected core samples from the zone confirmed hydrothermal breccia textures and alteration mineralogy with similarities to both epithermal and porphyry mineral deposits. (see Appendix 4)
The Northwest Expo target still has substantial growth potential as a large tonnage bulk mineable gold-molybdenum-rhenium deposit, and warrants additional exploration work. This work consists primarily of additional road-based delineation diamond drilling, both from newly built or proposed logging roads and from proposed exploration trails. Such work would be conducted in cooperation with logging operations. Proposed exploration trails would also be designed to expose the surface projection of the mineralized zone for trenching, geological mapping and sampling.
At Hushamu, the mineralized zone is relatively well established in shape, dimensions and grades of copper and gold (Giroux and Baker, 2008). Sufficient size and grades have been established to warrant a pre-feasibility study. The values and distribution of molybdenum and particularly rhenium within and peripheral to the zone are not well known, but from the limited drilling completed in 2008 they appear to be persistent and correlate well with copper and gold.
The Hushamu target warrants additional road-based definition diamond drilling from rehabilitated roads, largely deferred in 2008, including drilling on the adjacent South McIntosh target. The main drilling objective is to confirm grades of gold, molybdenum and rhenium within and peripheral to the mineral resource. In addition, mineralogical, metallurgical, infrastructure design, geotechnical, environmental, and social programs required to complete a pre-feasibility study are warranted for the Hushamu Deposit.
The remaining 5 known targets on the Island Copper Property (Cougar, Hep, Pemberton Hills, NW Expo, and Rupert) and the encompassing “Northern Island Copper Belt” should be further explored by systematic geology, geochemistry, geophysics, mechanized trenching and diamond drilling programs.
A two year, $5 million exploration work program is proposed for the Island Copper Property, consisting of both resource upgrade to minimum indicated category, and pre-feasibility work at the Hushamu target. In addition, systematic exploration at the NW Expo and 5 historical targets on the property is recommended utilizing geophysics, geochemistry, and exploration drilling.
Introduction
The co-authors were retained in July-August, 2008 by IMA Exploration Inc. as independent consultants to manage, execute and report on the 2008 field exploration program on the Island Copper Property. Jacques Houle, P.Eng. was retained in April, 2011 by Western Copper on behalf to update the technical report. Management, technical and support personnel involved in the program were as follows:
Grosso Group Corporate Personnel (Vancouver):
| David Terry, Ph.D. | Vice President – Exploration | ||
| Gregory Myers, Ph.D. | Chief Geologist | ||
| Claudia Sandoval | Environmental & Community Relations | ||
| Tina Balys | Project Coordinator |
Project Field Exploration Personnel (Coal Harbour):
| Jacques Houle, P.Eng. | Project Manager | ||
| Christopher Baldys, P.Eng. | Senior Geologist | ||
| Arnd Burgert, P.Geo. | Junior Geologist | ||
| Melissa Halpenny, B.Sc. | Junior Geologist | ||
| Rachel Harris, B.A. (pending) | Junior Geologist |
- 4 -
The 2008 field exploration program was conceived by Gregory Myers and David Terry, and consisted of a diamond drilling program utilizing 2 drill rigs capable of recovering HQ size drill core up to maximum depths of 700 metres. David Terry, Claudia Sandoval and Jacques Houle completed permit applications and negotiated agreements with local forestry companies and first nation bands. David Terry and Christopher Baldys negotiated technical and support contracts, with support from Tina Balys. Claudia Sandoval and Arnd Burgert managed environmental issues. Safety programs were designed by local expert consultant Rob Paterson. Jacques Houle established field logistics with support from Tina Balys, and managed the field program with support by Chris Baldys and Arnd Burgert. Drill core handling protocols were established by Chris Baldys, and core logging was done by Arnd Burgert, Melissa Halpenny and Rachel Harris. Drill core sawing and sampling was done by temporary employees of the Quatsino First Nation on contract to IMA, trained and supervised by the geologists.
The purposes of the field exploration program were as follows:
- Delineate the northwest extent of the Northwest Expo Target
- Define metal variations within the Hushamu Target
- Establish project technical procedures and protocols for the program to industry standards required for a pre-feasibility study
- Fulfill Year 1 commitment requirements for the property agreement with Western Copper, and to fulfill mineral tenure assessment work requirements to maintain the mineral claims in good standing
- Establish good relationships with all local stakeholders: Quatsino First Nation, Western Forest Products, suppliers, and all levels of government
The purposes of the original 2009 and updated 2011 Technical Report (NI-43-101 compliant) on the Island Copper Property are as follows:
- To document all aspects of the 2008 field exploration program,
- To make recommendations for further exploration and other work,
- To fulfill requirements for continuous disclosure by public companies
- To assist in raising the necessary funds required to complete further work
The report is based on the authors’ personal knowledge gained from working on the property in 2008, on reviewing data from the Company’s files, and from published government and industry data. All information used to prepare this report is contained in the References section of the report. Co-a uthor Arnd Burgert, P.Geo. last visited the property during July, 2011 to assist with Western Copper Corporation’s 2011 exploration program.
The two senior authors, Christopher Baldys, P.Eng., and Jacques Houle, P.Eng., are each Qualified Persons as defined by National Instrument 43-101. The junior author, Arnd Burgert, P.Geo., is both a qualified Geologist and Hydrogeologist. The authors’ certificates appear in the Certificates section.
Reliance on Other Experts
Technical Information in this report was derived from Company files, government publications and published reports. Original source data has been used where available. Reasonable care and diligence has been taken by the authors to verify all historical information. The authors have seen no reason to doubt the validity and accuracy of this source data and historical information, most of which was generated by qualified, professional persons at the times the work was done, much of it prior to the implementation of NI 43-101.
Property Description and Location
The Island Copper Property is centred near the village of Coal Harbour, 15 km. south of Port Hardy, B.C. along the northern shore of Holberg Inlet on northern Vancouver Island. The Property consists of two
- 5 -
separate blocks of mixed legacy and cell mineral claims, referred to as the West Block and the East Block, each forming contiguous claim blocks. These two blocks are separated by mining leases which cover the site of the past producing Island Copper Mine, and other cell mineral claims, both held by other companies or individuals. The Property covers at least 7 known mineral prospects of porphyry or related style mineralization, mostly on the larger western block, which also surrounds the producing Apple Bay (silica) Mine, owned and operated by Electra Gold Ltd.(See Figures 1a, 2a and 2h).
The Island Copper Property is comprised of 216 mineral claims covering a total of 42,669 hectares, all of which are in good standing until November 21, 2011 or later(see Table 11).All the claims are held by Moraga Resources Ltd. (owner ID 135925), wholly-owned subsidiary company of Western Copper. On August 12, 2008 IMA acquired an option to earn up to 70% interest in the Property from Western Copper, subject various conditions, and to a prior agreement with Electra Gold Ltd. who holds the rights to explore and exploit industrial minerals on the Property. As of February 28, 2009, IMA had incurred expenditures totaling approximately $2 million, fulfilling the agreement expenditure requirement for the initial year. On September 30, 2009 IMA merged with two other companies (Kobex Resources Ltd., and International Barytex Resources Ltd.) to form Kobex Minerals Inc. On July 2, 2010 Kobex terminated the option agreement, allowing 100% interest in the Island Copper Property to revert back to Moraga Resources Ltd., and thereby to Western Copper.
The surface rights over most of the Island Copper Property are held by the B.C. government as crown land. Parcels of surface rights are privately held within the area of the Property, mainly at or near the village of Coal Harbour and the Town of Port McNeill. Forestry tenures and logging roads cover most of the Property, and are held and managed by two divisions of Western Forest Products Ltd.: the eastern 80% by the Port McNeil Division, and the western 20% by the Holberg Division. In 2008, IMA entered into two separate road use agreements, one with each of the two divisions of Western Forest Products, to facilitate road access to the Hushamu (Port McNeil) and Northwest Expo (Holberg) target areas. IMA was also required to obtain a Mining Free Use Permit from the B.C. Ministry of Forest and Range prior to undertaking road rehabilitation work in the area of the Hushamu target(See Appendix 10).
Most of the Property occurs within the traditional lands of the Quatsino First Nation (“Quatsino”), whose primary residential community is Quatsino, located immediately north of and adjacent to Coal Harbour. The Quatsino also own the surface rights and remaining infrastructure facilities of the past producing Island Copper Mine. In July 2008, IMA entered into a lease agreement with the Quatsino to rent a building at the former mine as an office and core facility. Western Copper has taken over the lease.
Similar to elsewhere in British Columbia, no permit is required for non-mechanized exploration, but a valid permit is required to undertake any mechanized work on the Island Copper Property. Such permits are issued by the Inspector of Mines at the Victoria-based Southwest Regional Office, Health and Safety Branch, Mining and Minerals Division, B.C. Ministry of Energy, Mines and Petroleum Resources. This requires submission of a Notice of Work and Reclamation Application, which should take approximately one month to process, but commonly takes much longer. In 2008, the permit was received by IMA in October for the application submitted in July, or approximately 3 months(See Appendix 10).
In addition, owners of the surface rights if privately held must be notified in advance of any mining activity on their land, and fairly compensated for any damages inflicted to the surface rights, by the mineral tenure holder. It is generally considered good protocol for explorationists working in British Columbia to notify anyone with specific local interests prior to undertaking any exploration programs. In the case of the Island Copper Property, IMA notified forestry tenure holders, first nation’s bands, and local communities in advance of the 2008 program, and has maintained a good working relationship with all these groups.
Accessibility, Climate, Local Resources, Infrastructure and Physiography
The Island Copper Property is located in northern Vancouver Island along the north shore of Holberg Inlet, stretching from the village of Holberg in the west to the village of Suquash in the east. This provides
- 6 -
direct access from portions of the Property via the sheltered tidewaters of Holberg Inlet to the Pacific Ocean, and via Charlotte Strait to the northern Gulf Islands and Georgia Strait. This is generally considered the cheapest method for bulk transportation of equipment, supplies and products to or from suppliers and markets, a positive factor for development and operation of any large mining, milling and refining operation.
Provincial Highway 19 provides year round access to the Eastern Block of the Property from Port McNeil to Port Hardy, as does Highway 37 from the junction with Highway 19 to Port Alice. The publicly maintained and paved Coal Harbour Road and the unpaved Holberg Road provide year round access to the Western Block of the Property. A vast network of privately maintained or un-maintained logging roads provides access to most the Island Copper Property through negotiated road use agreements with forestry tenure holders. This road network is essential for cost-effective exploration and development work. Travel time by road from most areas of the property to the full service community of Port Hardy is less than 1 hour. Helicopter flying time, dependant on weather, is less than 15 minutes from Port Hardy to several designated medi-vac sites on the Property.
The topography of the West Block of the Property is characterized by north and north-east trending low ridgelines with broad intervening valleys that typically contain small rivers. Elevations range from sea level to 720 m. above sea level and ridges typically reach 100 to 300 m above valley floors. The East Block is flat with only low hills generally less than 100 m in elevation. Vegetation comprises a mix of second and first-growth forest of fir, hemlock, spruce and cedar. Logging has been active across the property for several decades so second growth areas are highly variable in terms of age, density and ease of access. Approximately 50% of the West Block and virtually all of the East Block have been clear cut. Western Forest Products is the main forestry tenure holder.
Climate in the area of the Property is typical of coastal areas of British Columbia with an annual precipitation in Coal Harbour of 1,987 mm, and a daily average temperature of 8.8°C (Environment Canada, 1971-2000). Winters are very wet, with 75% of the annual precipitation occurring from October to March, mostly as rainfall at lower elevation (Coal Harbour is at 57 m elevation), but with significantly increasing percentage of snowfall accumulation above 300 m elevation. Western Forest Products closely monitors weather conditions in the area and may impose access road closures immediately after occasional high rainfall accumulations in the fall or spring, or during rare prolonged dry spells in the summer. Generally, exploration and development work is cost-effectively possible for most of the year, allowing for a long exploration field season.
Northern Vancouver Island’s regional population is approximately 15,000, the largest community being Port Hardy (pop. 5,000). Smaller communities within 45 minutes’ drive from Port Hardy include Port McNeil (pop. 3,000), Port Alice (pop. 1,350), Holberg (pop. 200), Coal Harbour (pop. 200) and Quatsino (pop. 250). Port Hardy provides all but the most specialized supplies and services needed for exploration work on the Island Copper Property, and was formerly the main residential and supply centre for the past producing Island Copper Mine. Its main industries are forestry, aquaculture and tourism, but it is also the operational and shipping base for Electra Gold Ltd.’s 50,000 tpy silica-kaolin producing Apple Bay Mine. Port facilities at the former Island Copper Mine are currently in disrepair.
Several wind farm investigation permits have been issued to Sea Breeze Power Corp. for proposed projects in Northern Vancouver Island. If developed, the significant synergy opportunities exist between these power generation facilities and the development and operation of any large mining, milling and refining operation on the Island Copper Property.
IMA Exploration Inc. invested a significant amount of resources during 2008 in establishing a project office and core handling facility in the building which housed the welding shop at the former Island Copper Mine. This facility is leased from the Quatsino Band, owners of the surface rights and infrastructure at the former mine site. Also, the Company entered into employment agreements with the Quatsino Band to provide personnel for both site security and core sampling as required. As of the date of this report, the office and core facility are in use by Western Copper. The core facility is equipped with 6 core logging benches and 2 core saw stations wired for 240V power. Electrical power is supplied by a portable
- 7 -
generator provided by Western Copper. Non-potable water is supplied by a rain capture system from the building’s roof stored in an exterior 1000 gallon tank facilitating supply of water to the core saw stations. Temporary exterior toilet facilities were provided by rented porta-potties. All drill core from the 2008 program is securely stored in timber racks in the unheated part of the building, with additional space capacity for approximately 15,000 metres, if similar racks were to be constructed.
History
Early Work - Pre 1966
Mineral exploration work recorded in the area now covered by IMA’s Island Copper Property is summarized inAppendix 13. The history of exploration in the area dates to 1902, when an occurrence of limonite (bog iron) was staked on the southern flank of Pemberton Hills near Wanokana Creek (Minister of Mines, 1902 p. 202). In 1918, silver-lead-zinc-gold veins were discovered near Wanokana Creek, 5 km from its mouth (MOM AR 1918 p. 268), followed in 1930 by a series of massive galena and sphalerite skarn lenses (HPH showing) near Nahwitti Lake (Minister of Mines ,1930 p. 297). Each of these was followed up with some assays or shallow underground workings, but no production occurred and little further exploration is recorded until access was improved by construction of the Port Hardy to Holberg Road in 1951.
During 1962, a regional airborne magnetic survey was flown over northern Vancouver Island jointly by the British Columbia Department of Mines and the Geological Survey of Canada.(See Figure 1f)A belt of northwesterly-trending magnetic highs north of Holberg and Rupert inlets caused a flurry of exploration, mostly focused on skarn-type iron-copper deposits similar to the Merry Widow deposit 43 km southeast of Port Hardy. By 1966, discoveries of sulphide occurrences included the Hep and Bay showings, the latter being optioned to Utah Construction & Mining Company (“Utah”) that year (Minister of Mines, 1966 p. 64).
1966 to 1986 – Utah
West Block
Diamond drilling by Utah on the Bay property resulted in the delineation of a small ore body around the original Bay showing, and a large copper soil geochemistry anomaly 2 km to the southeast. The soil anomaly was drilled during the next two years, and by 1969 the first 180,000,000 tons of the main Island Copper ore body had been outlined (National Mineral Inventory card 092L11_Cu1). Aggressive development followed, and open pit production by a Canadian subsidiary of Utah began in 1971 at an initial rate of 33,000 tons per day. The mine operated until 1995, producing 345 million metric tonnes (t) of ore with average grades of 0.41% copper, 0.017% molybdenum, 0.19 g/t gold and 1.4 g/t silver (Perelló et al., 1995).
Exploration by Utah continued along the geological and magnetic trend to the northwest and southeast, and the large Expo claim block was staked in 1967. At about the same time, Westcoast Mining Co. staked the Red Dog claims which remain to this day a separate entity internal to the Expo claim block.
Between 1967 and 1969, Utah geologically mapped on the Expo block at 1:2400 scale and covered it with detailed soil sampling. The Utah soil grid covers a WNW-elongate area 27 by 8 kilometres and comprises about 17,000 samples collected 200 feet apart on lines separated by 500 feet. Available historic maps indicate that samples from the entire grid were analysed for Cu, whereas samples from the eastern half was also analysed for Mo and Zn. It is not clear if the eastern samples were never analysed for Mo and Zn, or if the maps have been lost.
Between 1966 and 1971, Utah drilled 33 XR, XRT, EX or BQ-sized drill holes totalling 1593 metres at the Hep target area. These closely spaced holes were generally about 30 metres deep, with a few holes
- 8 -
drilled between 100 and 200 metres. No geochemical data or drill logs are available.
As a follow-up to this large dataset, between 1970 and 1973, several areas of interest were mapped at a larger scale and surveyed by magnetometer. Most of these areas were also surveyed by induced polarization and a few areas were surveyed by electromagnetic and seismic surveys (Muntanion and Witherley, 1982).
Between 1966 and 1977, 146 diamond drill holes were drilled, most of which tested Cu-Mo soil anomalies in the Hushamu and Hep Creek valleys. By 1975, the Hushamu deposit was delineated and estimated (not 43-101 compliant) at 52.9 million tonnes grading 0.32% Cu, 0.008% Mo and 0.41 g/t Au, with a stripping ratio of 2.21:1 (BHP, 1975).
In 1980, driven in large part by high gold prices, Utah began to examine the gold potential of the McIntosh Mountain and Pemberton Hills alteration systems, having also recognized a potential for Pueblo Viejo-type Au-Ag-Cu deposits. Between 1980 and 1985, Utah conducted further detailed soil surveys, extensive rock sampling, ground geophysical surveys and drilled 12 drill holes in these areas. Several consultants reviewed the property and examined the potential for epithermal mineralization.
Between 1982 and 1983, Utah held an option on the Red Dog property and drilled 12 holes there (EC-131 to -135, -139 to -144) totalling 2,056 metres (Muntanion, 1983; Muntanion and Witherley, 1982).
Jones (1988) describes in his qualifying report a nine hole diamond drill program conducted in 1985, presumably by Utah. No primary source of this data has been located and it appears that the results were not filed for assessment. This drilling program was focused on the siliceous litho-caps southeast of the Hushamu deposit. Values were generally low, although holes EC-154 and -155 at McIntosh had elevated gold towards the bottoms of the holes. Hole EC-158 intersected abundant massive pyrite.
East Block
In that portion of the claims lying south and east of Rupert Inlet (Island Copper Property East Block), geophysical surveys were performed in an attempt to detect mineralization beneath thick overburden covering the area. In 1968 Riviera Mines Ltd. performed a 6.3 line-km IP survey on parts of the Expo and Har claim groups south of Rupert Inlet (Baird, 1968). Areas of weakly anomalous chargeability were delineated on the Expo claims. In 1969 Ballinderry Exploration acquired parts of the Expo claim block and conducted a 33.6 line-km IP survey, collected 1210 soil samples which were analyzed for copper, and completed a 56 line-km magnetometer survey (Baird, 1970). Two east-west trending steeply-dipping magnetic anomalies were identified and attributed to granite dykes with pyrrhotite, pyrite, and chalcopyrite mineralization.
By 1974 Utah had re-acquired and consolidated the Expo claims east of Rupert Inlet. Utah drilled five BQ diamond drill holes totaling 888.2 metres (holes R-001 to R-005) in the summer of 1974. The drilling was presumably to test previously identified geophysical and geochemical anomalies attributed to the Rupert Stock, although the intention is not stated (Kaiway, 1974). Six more holes were drilled between 1976 and 1980 (R-006 to R-012) totaling 545.6 metres of NQ and 673.6 metres of BQ size core. No indication of significant mineralization is made in any of the reports covering this period (Lamb, 1976, 1977, 1980a). Exploration efforts were renewed in 1981 and a two year program of ground geophysical (IP / resistivity, magnetics, VLF-EM) and soil geochemical surveys was undertaken with 124.8 line-km of ground geophysics completed. Three geophysical trends were delineated (Clarke, 1983; Fleming et al., 1983):
- The Dyke Trend – originally known as anomalies 81-8, 81-9, 81-11, and 82-1, this group of east- west trending chargeability highs and associated magnetic highs has been attributed to porphyritic dykes extending eastward from the Rupert Stock.
- Quatsino Trend – Comprising chargeability anomalies 81-12 and 82-3, that are located near the inferred contact with Quatsino Limestone to the north and is interpreted to be related to skarn in the limestone. The anomaly is partially contained within the Island Copper Property.
- M-1 Anomaly – A small, low-amplitude magnetic high in the southern part of the claim block east of Rupert Bay.
- 9 -
Another trend called the Parson Bay Trend was identified but attributed to pyrite mineralization in Bonanza Group volcanic rocks and was ignored as an exploration target. Subsequent drilling in 1983 and 1984 (DDHs R-013 to -016, totaling 555.0 metres of NQ) tested the strike length of the Dyke Trend. All diamond drill holes confirmed the presence of the Rupert Stock-like intrusive rocks and holes R-014 and R-015 returned anomalous copper and molybdenum (30 feet of 0.12% Cu, 0.048% Mo and 10 feet of 0.10% Cu, 0.008% Mo, respectively).
Diamond drilling of the Dyke Trend chargeability anomalies continued in 1985 with one drill hole, R-017, on the far east of the anomaly (Clarke, 1986a). This intersected Parsons Bay Formation from top to bottom and so closed off the eastern extent of the Rupert Stock. The following year the M-1 low amplitude magnetic anomaly was tested with diamond drill hole R-018 (Clarke, 1986b). The hole intersected magnetite alteration with higher than normal magnetic susceptibility (relative to other data from the same unit). The magnetite alteration was interpreted to be the cause of the M-1 anomaly.
Contemporaneous with the diamond drilling discussed above, a large soil geochemistry survey was undertaken (Clarke, 1986c; Fleming, 1985a, b, 1986a, b). The survey consisted of 2559 samples with about every second sample being analyzed for copper, molybdenum, lead, zinc, gold, silver, arsenic, and manganese (2435 samples) and 30 element ICP (124 samples and unknown number rerun from 1985 survey). The geochemical survey returned weak anomalies across most of the area except for some anomalous values of Zn, Cu, Au, Mo, and As in the western portion of the survey centered on hole R-017. Further drilling was recommended.
1987 to 1992 – Moraga
West Block
In 1987, BHP-Utah Mines Ltd. (the successor company to Utah) optioned the Expo Property to Moraga Resources Ltd. (“Moraga”). Moraga conducted numerous phases of exploration between 1987 and 1994 when Moraga vested in the option agreement. The first groundwork conducted was a down-hole pulse EM survey of an existing drill hole (EC-158) at Pemberton Hills (Woods, 1987), targeting massive sulphide deposits.
The BC Geological Survey released a set of regional stream sediment geochemistry data in 1989. Anomalies were identified, some of which were followed up by Moraga and others.
In late 1988 and early 1989, Moraga commenced a field program comprising geological mapping and soil sampling (Husband, 1989). This program focused on the Red Dog, McIntosh and Hushamu claim groups. Additionally, selected archived soil sample rejects from Utah’s 1960s soil programs were analyzed for Au, As, Se, Te, Bi and Sb.
Moraga focused its drilling efforts on the Hushamu Deposit and nearby McIntosh Mountain area and conducted extensive drilling of this deposit for seven years, eventually completing 45 holes for 13,668 metres in six drilling campaigns outlined below: (Giroux and Pawliuk, 2003).
- Five diamond drill holes (EC-159 to 163) for 762 metres were drilled at the Hushamu deposit between November and December, 1988. No report containing details of this program was written.
- Eleven diamond drill holes (EC-171 to 180, EC-154) totaling 3,822.7 metres were drilled at the Hushamu area between April and July, 1990; results of this drilling extended the Hushamu deposit 200 m southwards (Jones, 1990; Sutton and Dasler, 1990).
- Eight diamond drill holes (EC-181 to 188) totaling 2,347.0 metres were drilled during November and December 1990; the results of this work further extended the geological boundaries of the Hushamu copper-gold deposit (Pawliuk, 1991b). One previously drilled hole (EC-154) was lengthened.
- 10 -
- Four diamond drill holes (EC-189 to 192) totaling 933.0 metres were drilled at Hushamu between February and August, 1991; the results of this work defined additional copper mineralization beneath siliceous, pyrophyllitic breccias which cap McIntosh Mountain (Pawliuk, 1991a).
- Thirteen diamond drill holes (EC-198 to -210) totaling 4,832 metres were drilled between September 1, 1991 and March 15, 1992. The results of this work extended the geological boundaries of the Hushamu copper-gold deposit to the south and southeast (Pawliuk, 1992).
- Four diamond drill holes (EC-211 to 214) totaling 972 metres were drilled between March 3 and April 10, 1994. The geological boundaries along the southwestern and eastern sides of the Hushamu deposit were delineated by this work. Additional, but low grade, copper-gold mineralization was defined beneath the siliceous pyrophyllitic breccias on McIntosh Mountain (Pawliuk, 1994). An updated resource estimation (not 43-101 compliant) of 191 million tons (173 million tonnes) of 0.27% Cu, 0.34 g/t Au and 0.009% Mo was stated (Dasler, 1994).
Apart from Moraga’s focused efforts on the Hushamu deposit, the company conducted smaller programs to test additional targets in the belt. Moraga held an option on the Red Dog claims from Crew Natural Resources Ltd. during 1989 to 1991. They conducted further mapping and drilled eight holes (EC-164 to 171) in 1989 (Harrington, 1989); 11 holes (90-1 to 10) in 1990 (Richards, 1990) and eight holes (91-1 to 8) in 1991 (Richards, 1991).
In 1991, Moraga conducted a ground magnetic and soil sampling program across the Goodspeed target area east of the Red Dog and followed up by drilling five holes (Pawliuk, 1991a).
Also in 1991, a separate investigation was made by Consolidated Paytel Ltd. on the small Goldilox claim group located 4 km northeast of Holberg (Pawliuk, 1991b). The ground, straddling the contact between Bonanza Group volcanics and Parsons Bay sediments, is now part of the Island Copper Property. The Regional Geochemistry Sampling program that was released in 1989 had indicated a gold geochemical anomaly in stream sediments in the Goodspeed River.(See Figures 1c, 1d, 1e, 2c, 2d and 2e)The source of gold-bearing (up to 453 ppb) rock float specimens was left unexplained, and a property geology map describes an outcrop of a blue volcanic rock with trace chalcopyrite. The latter is of interest since the blue mineral dumortierite is associated with alteration at the Island Copper ore deposit. Soil sampling over the claims outlined a weak molybdenum-copper geochemical anomaly, but no follow up is recorded.
1987 to 1992 - BHP
East Block
The ground east and south of Rupert Inlet was not included in the Moraga option, and in early 1988 a follow-up geochemical survey was performed by BHP-Utah. This included taking 48 samples from shallow (0.3 to 1.0 m deep) pits and 72 line samples (Fleming, 1988). Samples from pits 15 and 16 returned anomalous values including 0.06% Mo, 0.13% Cu, 0.75% Zn and 1.1 g/t Au. Further trenching and drilling was recommended for this area.
1993 to 1997 – Jordex
West Block
In 1992, shares of Moraga were purchased by Jordex Resources Inc. (“Jordex”). By 1993, Moraga was reduced to a holding company and subsequent work was completed by the successor company. By early 1994, Jordex completed its 45% earn-in on the Expo Property pursuant to the 1987 joint venture agreement between Moraga and BHP-Utah. Later that year, Jordex participated in a drill program with BHP, drilling 822 metres in seven holes at the NW Expo zone (Gatchalian, 1994). In these first holes in this area, drill hole NWE-02 intersected 23.5 metres of 0.5 g/t gold and anomalous copper was returned in several other holes. In early 1995, Jordex converted its stake in the property to 100% subject to a 10%
- 11 -
NPI after recapture of capital (Jordex Annual Report, 1994; Dasler, 1994)
Additional work done on the Hushamu deposit from 1991 to 1993 consisted of a metallurgical study (Melis and Cron, 1992), a study of ore transport alternatives (Fernie, 1991), a preliminary mining study (Graham, 1993) and a resource estimation (Giroux, 1993). This resource estimate was subsequently upgraded to NI 43-101 compliance in 2003 (Giroux and Pawliuk, 2003). These authors concluded that the Hushamu Deposit contains a 231 Mt measured and indicated resource grading 0.28% Cu and 0.31 g/t Au.
The metallurgical study indicated that a copper recovery of close to 90% and a gold recovery of 70% to 75%, into a copper-gold concentrate assaying 25% Cu and 34 g/tonn, would be achievable for a higher grade composite (calculated head grade of 0.58% Cu and 1.16 g Au/tonne). For the lower grade composite (0.17% Cu and 0.38 g Au/tonne) achievable recoveries appear to be approximately 75% for copper and in the range of 50% to 55% for gold into a copper-gold concentrate assaying 24% Cu and 24 g Au/tonne.
During 1994 and 1995, just prior to closure of the Island Copper concentrator, Jordex sought partners to provide capital to bring the Hushamu deposit into production (Jordex Correspondence, 1994-1996). Ultimately, no partner was found and the mill was decommissioned as scheduled. In the following few years, Jordex continued to examine the potential of the Expo Property (Fingler, 1996; Roscoe and Cargill, 1996) and flew a 156km helicopter-borne geophysical survey over the NW Expo area (Woolham, 1997).
1992-1997 - BHP
East Block
A 1993 drill program was carried out by BHP Minerals (successor to BHP-Utah), including a final three holes, one in each of the main areas targeted previously: the far-east anomaly (R-019), the M-1 anomaly (R-020), and the Rupert Stock in the northwest of the property (R- 021) (Fleming, 1993). All three holes resulted in low geochemical values and no further drilling was recommended.
1998 to 2002 - CRS Copper
During the period of 1998 to 2001, exploration for primarily industrial minerals was undertaken in the West Block of the Island Copper Property. In 2001, Jordex was renamed iTech Capital Corp., and CRS Copper Resources Corp. (“CRS”) acquired an option to purchase the property for $1,000,000. To facilitate a decision on the feasibility of commercial production of the Hushamu Deposit, CRS commissioned a resource estimate in 2002 (Giroux and Pawliuk, 2002). The resource estimate included only the Hushamu zone, and excluded the Hep, Red Dog, NW Expo, and Cougar zones. The resource was calculated only for copper and gold, and excluded molybdenum and rhenium.
2003 to 2006 – Lumina
West Block
Lumina Copper Corp. (“LCC”) purchased Moraga in 2003 to acquire the core Hushamu claim holdings. In February 2005, LCC optioned the Shearer-held claims from Electra Gold Ltd. Lumina Resources Corp. (“Lumina”) took over the properties in a corporate restructuring in May 2005.
LCC and Lumina carried out property-wide exploration in 2005 (Baker, 2005a), consisting of:
- May 4 to May 11: DIGHEMV-DSPhelicopter-borne electromagnetic / resistivity / magnetic survey over the entire Hushamu property comprising approximately 2687 line-km(See Figures 2f, 2g)
- 12 -
- June 17 to July 24: three NQ diamond drill holes (EC-215 to 217) for 1,103.7 metres at the Hushamu Deposit and one NQ hole (EC-218) for 462.4 metres at NW Expo
- July 22 to August 9: re-logging and PIMA analysis of 12 drill holes along two sections of the Hushamu deposit
- August 3 to September 8: ~196 line-km grid soil sampling for 3842 samples in the NW corner of the property, geological mapping and prospecting of nine target areas across the property, collection of 264 rock samples
- October 26 to December 17: 14 BTW and NQ drill holes (EC-219 to 232) for 1,589.1 metres at Hushamu, Cougar and NW Expo areas
East Block
Ground-based exploration on the Rupert property was conducted by Lumina during September through December, 2005 following the DIGHEMV-DSPhelicopter-borne geophysical survey completed in May (Baker, 2005b). Mr. Jan Klein, a consulting geophysicist, identified a porphyry copper-gold target on the Rupert property, based on magnetic and resistivity patterns (Klein, 2005a).
Since no outcrop data was attainable, 138 soil samples were collected across the geophysical target area along north-south oriented grid lines. Given the potentially thick overburden, soil was analyzed using a selective leach methodology intended to account for thick overburden. The results of this survey did produce two multi-line anomalies which served as good starting points within an otherwise blind target.
Subsequently, eight NQ drill holes (R-022 to R-029) were drilled within the main target area totaling 1,108.7 metres. All drill sites were accessible by Western Forest Products logging roads. Despite a lack of mineralization within the 2005 drill holes, several holes did indicate the presence of a large alteration system. Epidote-altered andesite, locally with possible secondary magnetite, and sericite-silica altered and pyritic andesite were encountered in the 2005 drill holes. Baker concluded that soil sampling in the east block – even using the selective leach technique – seems to be inappropriate given the thick overburden, but pointed out that since all 2005 and earlier drilling was seemingly drilled on existing roads out of convenience, further testing of the BHP “Dyke Trend” would be warranted if drill sites were not confined to existing roads.
2006 to 2007 - Western Copper Corporation
In November 2006, Western Copper Corporation (“Western Copper”) acquired Lumina and its interests in the Hushamu property. Exploration efforts were focused on the NW Expo and Cougar zones (Lehtinen, J. and Awmack, H., 2007). From February through April 2007, 15 holes totalling 4360.3 metres of NQ2 core were completed, including some that required helicopter support. In addition, 12 short drill holes cored by Electra Gold in 2003 for industrial minerals investigations were re-sampled (Lehtinen, J. and Awmack, H., 2007). Further work was recommended for several targets on the Property.
2008 to 2009 - IMA Exploration Inc.
In August, 2008, IMA entered into an option agreement with Western Copper whereby IMA may acquire up to 70% interest in the Island Copper Property. Work performed in fulfillment of the first year’s commitment is described in this report. In September, 2009, IMA and two other companies merged to form Kobex Mineral Inc., who terminated the option agreement in July, 2010.
Geological Setting
The most recent description of the regional geology of Island Copper area is given by Nixon et al. (1994, 1997, 2000, 2006, 2007) and the following summary is taken predominantly from Nixon’s maps, papers
- 13 -
and references therein. Geology, aeromagnetic and gravity maps for the Region and the Property appear asFigures 1b, 2f, 1g, 2b, 2f and 2g.
The northern 90% of Vancouver Island is comprised of Upper Paleozoic to Lower Mesozoic rocks of Wrangellia – a tectonostratigraphic terrane that occurs discontinuously northward as far as central Alaska. This terrane was amalgamated to the Alexander Terrane of the Alaska panhandle (together comprising the Insular Superterrane) by late Carboniferous time. Subsequently, these terranes were accreted to North America between the Middle Jurassic and mid-Cretaceous. Thus, Vancouver Island records an early allocthonous history, and a later history with commonality to the North American margin.
The pre-accretion history of Wrangellia is represented by the Paleozoic Sicker Group and the Middle Triassic Karmutsen Formation of the Vancouver Group. The Sicker Group is comprised of marine Devonian to Early Permian volcanic and sedimentary rocks that host VMS deposits such as at Myra Falls. The Karmutsen unconformably overlies the Sicker Group and is comprised of basaltic and minor sedimentary rocks that underlie about 50% of Vancouver Island. This unit is up to 6,000 metres thick. Richards et al. (1991) suggested that the Karmutsen was initiated by and extruded above a mantle plume, and recent geochemical data support an oceanic plateau origin for the Karmutsen (Greene et al., 2006). The Karmutsen is in turn conformably overlain by the Quatsino Formation, also part of the Vancouver Group, comprised of bedded to massive limestone, consistent with a period of quiescence following impingement of a mantle plume.
The Bonanza Arc (Debari et al., 1999) formed along the length of Vancouver Island during the accretion of Wrangellia. Owing to later tilting during the Tertiary, products of this arc from various crustal depths are well preserved. These include the Westcoast Crystalline Complex, Island Plutonic Suite and the Bonanza Group volcano-sedimentary rocks. Debari et al. (1999) suggest that all these components have similar ages and geochemical signatures and they are therefore all products of a single arc. Plutonic rocks of the Jurassic Island Intrusions are associated with most porphyry copper and related mineralization on Vancouver Island, although some are also associated with the Tertiary Mount Washington Intrusions, and those situated in the accreted terrains (Pacific Rim and Crescent Terrains) on the south island may be Paleozoic in age. Refer toTable 9 titled “Significant Porphyry/Skarn Deposits on Vancouver Island”.
The Island Copper Property covers the majority of a structurally disrupted east-northeast-trending graben which preserves virtually all units of the Bonanza Group and the upper Vancouver Group rocks within and along its margins. The graben structure is roughly canoe-shaped, with its “keel” dipping north-northeast, and its “bow” and “stern” plunging inwards towards the thickest portion of the structure, centred on the Western Block of the Property. These layered rocks have been extensively intruded by differentiated stocks, dykes and sills of the Island Plutonic Suite, mainly exposed in widest portion of the graben. Porphyry copper mineralization and related alteration are associated with these intrusions.
The northern margin and portions of the southern margin of the Island Copper Property are underlain by the massive mafic volcanics of the Karmutsen Formation, the oldest member of the late Triassic Vancouver Group. These are locally overlain by, or structurally juxtaposed with, massive limestone of the Quatsino Formation, and less commonly by bedded siltstone of the Parson Bay Formation, also of the Vancouver Group. Skarn alteration and polymetallic deposits occur locally where these sedimentary rocks are in contact with intrusions of the early to middle Jurassic Island Plutonic Suite, mainly exposed along the northern margin of the property’s West Block.
Conformably overlying the Vancouver Group, the late Triassic to middle Jurassic Bonanza Group rocks dominate outcrop exposures on the Property, and consist mainly of rhyolitic to basaltic flows, breccias and tuffs of the LeMare Lake Volcanics. They are typically moderately chlorite-altered with common zeolite veins and fractures, except where proximal to centres of porphyry copper mineralization where they are so intensely altered that primary textures are mostly obliterated. Areas of intensely altered rocks occur in a belt within the core of the West Block of the Property from the Pemberton Hills to NW Expo, including the Hushamu and Red Dog Deposits. Variations in alteration assemblages are discussed in more detail in the Mineralization section of the report.
- 14 -
Unconformable sub-basins of lower Cretaceous clastic sedimentary rocks (Coal Harbour Group) outcrop both in the Coal Harbour area and to the immediately northwest of the West Block of the Property. The east end of the Property’s East Block is underlain by Upper Cretaceous clastic sedimentary rocks (Nanaimo Group). Both of these groups locally host coal formations, and are generally unaltered, postdating the Jurassic Island Plutonic Suite.
The layered units underlying the Island Copper Property generally dip gently southward, although they have been rotated against later faults causing steep local dips. Deformation of the area has been described by Nixon et al. (1994) with three deformation phases summarized by Lehtinen and al. (2007) as follows:
| 1. | Jurassic Deformation is related to an east-northeast directed compressional event that resulted in regional tilting of the Lower Jurassic and older strata to form the Victoria arch. In addition flexural slip folding and the development of northwesterly trending thrust faults occurred. | |
| 2. | Cretaceous Deformation post-dates deposition of the mid-Cretaceous Coal Harbour Group sediments. Northerly directed compression resulted in an episode of intense strike-slip faulting and lesser thrusting. Faults formed during this deformation event are dominantly northwesterly trending structures that have in many cases produced significant drag folding in adjacent strata where the units are well bedded, and common stratigraphic repetitions. | |
| 3. | Tertiary Deformation is characterized by northwesterly to north-northwesterly directed extension that post-dates the deposition of the Upper Cretaceous Nanaimo Group Sediments. This phase is represented by minor, north-easterly to east north-easterly striking normal faults, and northeast striking Tertiary intrusive dikes. |
Deposit Types
Vancouver Island hosts numerous porphyry copper and related mineral deposits as listed inTable 9titled “Significant Porphyry/Skarn Deposits on Vancouver Island”. In the immediate area of the Island Copper Property on Northern Vancouver Island there are approximately 95 documented mineral occurrences in the BC MINFILE database, of which 29 occur on the Property itself. These occurrences are listed in theTable 10, titled “Island Copper Project Area MINFILE Occurrences”. These represent a spectrum of mineral deposit types containing a variety of commodities, both metallic and non-metallic, at different status levels. Status levels used in MINFILE with the least to greatest knowledge are: Showings, Prospects, and Developed Prospects. Other status types are Producers and Past Producers. It should be noted that several of the more recently discovered occurrences on the Island Copper Property such as NW Expo, Cougar and Goodspeed Zones are not documented in BC MINFILE. Also, many showings documented in MINFILE are not assigned mineral deposit types, and some prospects and developed prospects are assigned multiple mineral deposit types, so the authors have inferred a single primary mineral deposit type for each occurrence to simplify statistics.
The 15 mineral deposit types documented in the area (within 5 km) and on the Property, with frequencies and percentages, including all 29 occurring on the Property with MINFILE numbers, status, and commodities, are as follows:
Porphyry Cu-Mo-Au:20 (21%) in the area; 7 (24%) on the Property: | ||
o | Hep 092L078 Developed Prospect containing Cu, Mo | |
o | Har 092L173 Showing containing Cu | |
o | Tie 092L177 Showing containing Cu, Mo | |
o | Hushamu 092L240 Developed Prospect containing Cu, Au, Mo | |
o | H 092L271 Showing containing Cu | |
o | Wanokana 092L272 Showing containing Cu, Fe, Magnetite | |
o | Rupert 092L273 Prospect containing Cu, Mo | |
- 15 -
| Cu-Ag Quartz Veins:15 (16%) in the area; 2 (7%) on the Property: | ||
o | Stuart 092L090 Showing containing Cu | |
o | Mor 092L192 Showing containing Cu | |
| Pb-Zn Skarns:14 (15%) in the area; 5 (17%) on the Property: | ||
o | North Shore 092L077 Showing with Zn, Pb, Ag, Cu, Magnetite | |
o | Aban 092L079 Showing containing Zn, Pb, Ag | |
o | Jean 092L098 Showing containing Zn, Pb | |
o | Mo 092L181 Showing containing Ag, Pb, Zn, Magnetite | |
o | A 092L239 Prospect containing Zn, Cu, Pb, Ag, Au | |
| Cu Skarns:12 (13%) in the area; none on the Property | ||
| Volcanic Redbed Cu:8 (8%) in the area; 1 (3%) on the Property: | ||
o | AAA 6 102I009 Showing containing Cu | |
| Hydrothermal Alteration Clays Al-Si:5 (5%) in the area; 3 (10%) on the Property, some of which are owned and operated by Electra Gold Ltd.: | ||
o | Pemberton 092L308 Showing containing Pyrophyllite | |
o | Apple Bay 092L150 Producer containing Silica and Kaolin | |
o | H&W 092L269 Prospect containing Silica | |
| Sedimentary Limestone:5 (5%) in the area; 1 (3%) on the Property: | ||
o | Hankin Point 092L285 Showing containing Limestone | |
| Bituminous Coal:4 (4%) in the area; 3 (10%) on the Property: | ||
o | Koskeemo 092L095 Past Producer containing Coal | |
o | Hallidie 092L218 Showing containing Coal | |
o | KW 092L270 Showing containing Coal and Cu | |
| Bog Fe-Mn-U-Cu-Au:3 (3%) in the area; all 3 (10%) on the Property: | ||
o | Quatsino Iron Ore 092L097 Showing containing Fe | |
o | Prince’s 092L088 Showing containing Fe | |
o | Sunrise 092L089 Showing containing Fe | |
| Polymetallic Veins Ag-Pb-Zn-Au:3 (3%) in the area; 2 (7%) on the Property: | ||
o | HPH Bluff 092L243 Showing containing Zn, Pb, Cu | |
o | Bowerman 092L131 Showing containing Ag, Pb, Zn, Cu, Au | |
| Fe Skarn:2 (2%) in the area; 1 (3%) on the Property: | ||
o | Sun 092L075 Showing containing Magnetite, Fe, Cu, Zn, Pb | |
| Epithermal Au-Ag-Cu High Sulphidation:2 (2%) in the area; 1 (3%) on the Property: | ||
o | Hushamu 092L185 Showing containing Pyrophyllite, Cu | |
| Dimension Stone; Rhodonite; and Silica-Hg Carbonate:1 each in the area (3% combined); none on the Property | ||
The porphyry Cu-Au-Mo, skarns (Pb-Zn, Cu and Fe) and, more recently, high-sulphidation epithermal Au-Ag-Cu deposits have attracted most of the exploration interest worldwide, in the area, and on the Property (Panteleyev et al.: 1998). Two local hydrothermal alteration Al-Si deposits have recently been developed as small scale producers of industrial silica and kaolin: Monteith Bay MINFILE 092L343 along the west coast of Vancouver Island, and Apple Bay 092L150 located on the Property and operated by Electra Gold Ltd. These deposit types, along with the vein types (Cu-Ag quartz and polymetallic Ag-Pb-Zn-Au) are all
- 16 -
hydrothermal in origin, and locally are genetically related to a series of Jurassic intrusions and coeval felsic volcanics of the Bonanza Group. The volcanic redbed Cu and Bog Fe deposits are formed by diagenetic or surficial processes, and may represent late remobilization of metals from hydrothermal deposits.
It is very important to correctly document, and to understand the significance of the spatial relationships to one another of, these types of metallic mineral deposits, particularly on a large property like the Island Copper Property. Equally important to document and understand are the permissive lithologies and controlling structures, and their spatial and genetic relationships to the mineral deposits. By modeling these parameters effectively, critical vectors can be established to assist in discovering and delineating economic mineral deposits, both on the Property and in the area.
Further refinement or modification of the known mineral deposit types are required to describe the Au-MoRe mineralization hosted by hydrothermal breccias recently discovered at the NW Expo deposit. A statistical analysis of the Mo-Re mineralization from hole EC08-252 was undertaken by Dr. H. Kucha of the University of Mining and Metallurgy in Krakow, Poland on behalf of IMA Exploration Inc., which appears inAppendix 5.
Mineralization
NW Expo
An area in the northwest corner of the Hushamu Property, the NW Expo Zone was the main focus of the 2008 drilling program. Prior to 2005 this area had seen relatively minimal exploration. There were indications that low grade Au-Cu-Mo mineralization was present at the base of cliffs containing widespread silica-pyrophyllite-altered altered tuffs of Bonanza volcanics. The 2005 drilling confirmed complex alteration systems with similarities to porphyry-style mineralization at Island Copper. Subsequently, fracture-controlled molybdenite mineralization found in a small rock quarry was identified as another exploration target within a “silica-altered volcanic rock” (Baker, 2005b) Airborne magnetic and soil surveys helped further identified targets of silica-chlorite-magnetite alteration carrying traces of disseminated chalcopyrite and low grade gold values.
Continued drilling in 2007 established that the footprint of strong alteration in the NW Expo Zone may extend across an area of 1.6 by 1.2 kilometres towards the Red Dog and Goodspeed targets. The predominant alteration present in the bluffs consists of siliceous breccias, with kaolinite, pyrophyllite and minor pyrite. The andesitic rocks surrounding the bluffs are pervasively chloritized and epidotized. The results of 2007 drilling were encouraging in that they outlined two mineralization styles. The first style containing predominantly copper-gold mineralization, is confined to zones of silica-chlorite-magnetite alteration within andesitic volcanic. The second Mo-rich style was described as “hosted by variety of alteration types, all of which lack chlorite and appreciable magnetite”. The Mo-rich zone appeared to surround the copper-gold zone both above and below. “Gold grades are consistently elevated in the copper zone, but extend into the molybdenum zones” concluded the 2007 drilling report (Lehtinen and Awmack, 2007).
In 2008 infill drilling along East-West oriented drill fences was designed to intersect a mineralized body dipping to the northeast. A total of 11 holes were drilled between October and December 2008.
Detailed core logging identified clusters of hydrothermal fluid conduits forming wide zones of silicified hydrothermal breccias. They appear to be oriented sub-parallel to intrusive bodies and dykes. The conduits consist of individual breccias pipes or breccia complexes similar to Mount McIntosh near the Hushamu Deposit. Multiphase alteration, brecciation and widely ranging pyrite content characterize these structures. Pervasive silicification is the most common alteration within the breccias, with minor pyrophyllite, sericite and argillic alteration showing selective distribution mainly within the matrix and often rimming heterolithic clasts. Pyrite content ranges from 1 to 20%.
- 17 -
The portions of the breccias that locally contain chlorite and magnetite in the matrix may represent the early stage of brecciation of andesites and previously contained copper and gold mineralization.
The hydrothermal breccias with the most intense silicification appear more susceptible to Mo mineralization along fractures and within zeolite veins. These breccias exhibit multiphase brecciation textures and often have elevated gold values while copper content is generally low. The orientation of the highest grades of molybdenum-rhenium mineralization is unclear, although they appear to occur along the margins of the hydrothermal breccias.
Hushamu Deposit
The Hushamu deposit is hosted by andesitic tuffs and flows of the Lower Jurassic Bonanza Formation. These have been intruded by north-westerly trending diorite and quartz-diorite stocks and quartz-feldspar porphyry dykes. Brecciated, altered and mineralized volcanic rocks form an envelope around the diorite stocks and associated dykes which are also mineralized. The description of the mineralization at the Hushamu copper-gold deposit that follows is taken mainly from Dasleret al.(1995).
A north-westerly trending, northeast-dipping normal fault is the main structural feature of the Hushamu area. Locally, north-easterly striking faults appear to be spatially related to, and may have localized, porphyry copper style mineralization.
The mineralization appears epigenetic in style and exhibits a zonation pattern from north to south. A silica-kaolinite-alunite-pyrophyllite cap that overlies the altered volcanic rocks in the southern part of the Hushamu deposit exhibits characteristics of epithermal deposits. The northern part shows characteristics of deep seated porphyry copper-gold deposits with multiple stage quartz-magnetite stockworks mineralized with chalcopyrite and pyrite. The stockwork veins are surrounded by chlorite altered rocks with local patches of possibly early albite and biotite alteration. These rocks have undergone later, structurally controlled quartz-sericite-clay alteration associated with veinlet and disseminated pyrite.
A multiple stage hydrothermal breccia complex at Hushamu contains mineralized fragments of various rock types. This breccia complex is centered above the diorite stock. Quartz feldspar porphyry dykes, pebble dykes and late rhyolite dykes crosscut the breccias; and some of these crosscutting dykes are mineralized.
The southern, uppermost part of the Hushamu deposit occurs on McIntosh Mountain. A north-westerly trending cap of vuggy silica rock overlies those rocks that have undergone porphyry-style mineralization. The vuggy silica rock probably formed under extremely acidic conditions, in a high sulphidation epithermal environment. Panteleyev and Koyanagi (1994) recognized both hydrothermal and phreatomagmatic breccias within the vuggy silica rock capping McIntosh Mountain. The vuggy silica occurs about 350 metres vertically above the main porphyry copper-gold deposit in the northern Hushamu area. The two geological environments have therefore been described as “telescoped”. Pyrite is the main sulphide mineral within the Hushamu deposit. Copper minerals occur as disseminated blebs, as wispy, irregular masses and as hairline veinlets. Chalcopyrite is the main copper mineral with lesser amounts of hypogene bornite, chalcocite and covellite; some supergene covelite was also observed.
Exploration
IMA’s work program in 2008 consisted exclusively of diamond drilling and related work (see the following paragraph). No other field exploration work was conducted in 2008. Other ancillary work completed by IMA in 2008 included a Surface Water Sampling Program around both drilling areas(Appendix 6),a Stream Assessment of Hepler Creek west of the Hushamu Deposit(Appendix 7),and an Access Road
- 18 -
Rehabilitation Prescription for the Hushamu and Clesgklagh Main roads(Appendix 8).The most recent field exploration work dates back to 2005 when Lumina Resources Corp. performed a comprehensive field program that included geochemical sampling, mapping, diamond drilling and airborne geophysical surveys (Baker, 2005). This work program was followed by more drilling in 2007 by Western Copper (Lethinen, Awmack, 2007).
Drilling
During the 2008 program, thirteen diamond drill holes totaling approximately 5,123 metres were drilled on the Island Copper property, as shown inTable 1.Drill logs files and intercept calculations appear inAppendix 1and analytical reports and methods and specifications appear inAppendix 2.
Table 1 – 2008 Drill Hole Summary for the Island Copper Property
DRILL HOLE NO. | EASTING | NORTHING | COLLAR ELEVATION | AZIMUTH | INCLINATION | DEPTH |
| (m) | (deg-min) | (deg-min) | (m) | |||
| NORTHWESTEXPO | ||||||
| EC08-248 | 569171.56 | 5619688.94 | 467.70 | 272-24 | 86-57 | 593.5 |
| EC08-249 | 569869.25 | 5619940.91 | 319.26 | 266-52 | 85 | 209.1 |
| EC08-250 | 569171.64 | 5619688.94 | 467.75 | 272-24 | 63-56 | 581.3 |
| EC08-251 | 569868.75 | 5619940.91 | 319.26 | 266-52 | 59-43 | 538.6 |
| EC08-252 | 569352.55 | 5619462.88 | 433.74 | 274-40 | 87-15 | 488.2 |
| EC08-253 | 569867.76 | 5619942.94 | 319.47 | 87-58 | 60-20 | 172.8 |
| EC08-254 | 569352.07 | 5619462.95 | 434.15 | 279-12 | 65-53 | 474.7 |
| EC08-255 | 570060.78 | 5619715.64 | 258.34 | 271-38 | 85-55 | 386.2 |
| EC08-257 | 570060.76 | 5619715.63 | 257.79 | 271-24 | 59-20 | 529.4 |
| EC08-259 | 569935.88 | 5619433.80 | 240.30 | 276-02 | 87-09 | 233.8 |
| EC08-261 | 569935.81 | 5619433.83 | 240.02 | 275-45 | 68-39 | 402.3 |
| HUSHAMU | ||||||
| HI08-08 | 580402.60 | 5614363.62 | 325.19 | 183-23 | 87-19 | 316.2 |
| HI08-03 | 580911.54 | 5614209.14 | 319.07 | 264-04 | 85-33 | 197.2 |
| TOTAL | 5123.3 |
NW Expo
Most of the drilling, 11 holes, was carried out within Northwest Expo target area (“NW Expo”) situated fifteen kilometres north of the village of Holberg in the northwest part of the property. In 2008 IMA Exploration Inc. focused on the NW Expo target due to encouraging gold, copper and molybdenum results obtained in 2005 and 2007 by Lumina Copper Corp. and Western Copper Corporation. These past operators established the presence of significant widths of low grade copper and gold mineralization surrounded by envelopes of molybdenum-gold mineralization.
The molybdenum, copper and gold mineralization was first discovered at NW Expo by predecessor companies of BHP-Billiton Diamonds Inc. (“BHP”) in 1994. However it was only recently that the interest in systematic exploration of the area was re-kindled by high commodity prices. IMA is following the strategy of developing exploration targets with tonnage and grade potential similar to the local past
- 19 -
producer, Island Copper – a porphyry-style copper and gold deposit which produced molybdenum and rhenium as by-products. Part of this strategy is the evaluation of the rhenium content in the drill core samples. Recoverable rhenium could significantly enhance the economic potential of porphyry-style targets in the area.
An area situated directly east of NW Expo called the Cougar Zone was not drilled in 2008. It represents a low-grade copper-gold target discovered in 2007 and shows similarities with other telescoped porphyry targets on the property.
As of year-end 2008 a total of 34 holes have been drilled in the NW Expo area. All historical drilling completed at NW Expo are shown inTable 2 and onFigure 3a.
Table 2 - Summary of Historical Drilling at NW Expo
| Company | Year | Number of holes | Length (m) |
| BHP – Jordex | 1994 | 7 | 822 |
| Lumina Copper | 2005 | 1 | 462 |
| Lumina Copper | 2005 | 7 | 1020 |
| Western Copper | 2007 | 8 | 2443 |
| IMA | 2008 | 11 | 4610 |
| Total | 34 | 9870 |
The objective of 2008 drilling program at NW Expo was two-fold: to establish controls of Mo-Au mineralization and to gain a better understanding of the geometry of Cu-Au mineralization hosted by silica-chlorite-magnetite altered rocks. Exploratory drilling along east-west oriented drill fences was designed to intersect a mineralized body dipping to the northeast. Eleven holes totaling 4,610 metres were drilled from October to December, 2008.
The 2008 program also focused on rhenium as a commodity of interest. Rhenium was expected to occur as a molybdenum substitute within molybdenite. A systematic analytical testing program was designed to determine the content of this high value commodity. The price of rhenium in January 2009 ranged from US $10,000 to $11,000 per kilogram (http://www.taxfreegold.co.uk/rheniumpricesusdollars.html).
The 2008 program benefited from recent active logging operations by the Holberg Division of Western Forest Products Ltd. in the area. This resulted in the construction of new access roads available to convey and to establish drill pads for drill rigs capable of drilling holes up to 700 metres in depth.
Four holes were drilled in the northwest part of NW Expo area to follow up on copper-gold intersections obtained in 2005 and 2007. The past drilling identified a zone of copper-gold mineralization striking 290° and dipping to the northeast at approximately 40°. Holes EC08-252 and 254 were fanned at -85 and -60 from the same pad, and designed to confirm the continuity of the mineralization between holes EC-229 and EC-245. Holes EC08-248 and 250 were also fanned at -85 and -60 from another pad, and designed to intercept the zone further west towards the western property boundary. All four holes were successful in reaching designed vertical depths of 500 metres.
All seven remaining holes were drilled to the north and east of past known intersections and were designed to test the down-dip extensions of mineralization. Only four of the holes reached the designed vertical depths of 500 of metres below the projected vertical limit of mineralized body.
Hushamu
Two vertical holes totaling 513 metres were drilled through the Hushamu deposit, located in the central part of the property. This deposit along with the Hep prospect to the north was a focus of drilling by BHP and predecessor companies and joint venture partners between 1967 and 1985. Following the closure of
- 20 -
the Island Copper open pit operations in 1995, various operators continued exploration efforts in the surrounding areas during times of high commodity prices.
As of year-end 2008 a total of 205 holes have been drilled in the Hushamu area. All historical drilling completed at Hushamu are shown inTable 7 and onFigure 4a.
Table 3 - Summary of Drilling at Hushamu and Hep Creek valleys
| Company | Year | Number of holes | Length (m) |
| BHP Utah | 1966-1977 | 146 | 14000 |
| BHP Utah | 1982-1983 | 11 | 1540 |
| BHP Utah | 1985? | 9* | 1059 |
| Moraga | 1988 | 5 | 762 |
| Moraga | 1990 | 19 | 6169 |
| Moraga | 1991 | 4 | 616 |
| Moraga | 1992 | 13 | 4832 |
| Lumina | 2005 | 5 | 1225 |
| IMA | 2008 | 2 | 513 |
| Total | 205 | 30716 |
*includes holes drilled at Pemberton Hills
Collar Location and Down-hole Surveys
Initial drill hole locations were established by geologists using hand held Garmin GPS units. Foresight and back sight bearings were established by geologists using compasses and marked in the field using pickets and flags. Drill pads were constructed by heavy equipment contractors using backhoes, and diamond drills were mobilized, setup and completed by the drilling contractor. Drill pads at Northwest Expo were constructed by Western Forest Products Ltd. Holberg Division, and those at Hushamu by North Island Rockpro of Port Hardy. Drilling was completed by Matrix Drilling Inc. of Kamloops, BC.
Drill hole collar surveys were done by Bazett Land Survey Inc. of Port Hardy. The list of drill holes with UTM coordinates and inclinations was sent to the surveyor crew who established final locations and measured orientations of each drill hole collar in the field as each hole was drilled. This required a brief cessation of drilling activity while each collar orientation was measured. It was often possible for the survey crew to measure hole locations and orientations for both drill rigs during a single trip to the drilling area.
Initially, a survey control network was established using Leica System 300 Differential GPS in both static and real-time kinematic modes. A base station location was set up and data was collected in static mode for post-processing. Concurrently, real-time data was collected on inter-visible pairs of traverse stations established at or near each drill pad. Vertical differences, horizontal angles and, where practical, vertical angles, were measured and recorded between inter-visible traverse stations, by conventional methods, using a Leica total station transit.
From the survey control network, additional temporary stations were placed as needed, and observations were made for each drill hole, recording horizontal and vertical angles, as well as horizontal distances to 2 points on the drill steel. All station and drill collar co-ordinates were reported in the UTM Zone 9, NAD83 grid system.
The majority of holes drilled in 2008 were surveyed down-hole for bearing and inclination with a Reflex Maxibor II tool, designed to produce accurate digital readings in magnetic rocks. The down-hole survey for each hole was completed immediately upon termination of the hole through the drill rods while they were still in the hole. The survey was done by two geologists after training by a specialist consultant,
- 21 -
while the surveying device was conveyed down-hole using the wire line operated by the drill crew. Each survey required two to three hours to complete.
NW Expo 2008 Drilling Results
The holes completed in the northwest part of NW Expo intersected two distinct styles of alteration and mineralization within the large, tabular hydrothermal breccia zone. Hole EC08-254 intersected 164 metres of gold-copper mineralization, confined to chlorite-magnetite altered sections of hydrothermal breccias similar to those intersected in 2007. The extent and intensity of this alteration and mineralization appears to be diminishing to the north and east, demonstrated by lower copper and gold values coinciding with increasing molybdenum and rhenium values in both holes EC08-252 and EC08-250. This second type of mineralization appears to be late stage event that follows a set of tectonic fractures within the hydrothermal breccia zone. Locally high rhenium values such as those obtained in hole EC08-250 may significantly enhance the economic significance of this style of mineralization.
Selected intercepts achieved in 2008 from the hydrothermal breccia zone at NW Expo are summarized inTable 4, and appear inFigures 3a, 3b, 3c and 3d.
Table 4 - NW Expo Drilling Results
| Target | Hole No. | Interval m | Length m | Au g/t | Cu % | Mo % | Re g/t | |
| NW Expo | EC08-248 | including | 267 – 367 267 – 271 | 100 4 | 0.052 0.026 | 0.003 0.002 | 0.003 0.022 | 0.215 0.561 |
| NW Expo | EC 08-250 | including and or and | 291 – 487 299 – 313 381 – 473 413 – 433 445 – 471 | 196 14 92 20 26 | 0.149 0.074 0.218 0.299 0.152 | 0.009 0.003 0.015 0.017 0.011 | 0.019 0.031 0.030 0.045 0.036 | 1.222 1.280 2.210 1.987 4.806 |
| NW Expo | EC 08-252 | including and and or and | 165 – 455 165 – 267 215 – 231 329 – 453 359 – 391 417 – 443 | 290 102 16 124 32 26 | 0.227 0.121 0.172 0.299 0.554 0.114 | 0.026 0.006 0.009 0.053 0.092 0.029 | 0.016 0.020 0.037 0.017 0.010 0.035 | 0.490 0.754 1.725 0.359 0.191 0.230 |
| NWExpo | EC08-254 | including or and and | 194 – 432 238 – 402 272 – 288 298 – 402 326 – 362 | 238 164 16 104 36 | 0.606 0.817 1.123 0.982 1.295 | 0.084 0.119 0.127 0.151 0.246 | 0.010 0.011 0.017 0.007 0.007 | 0.264 0.367 0.661 0.277 0.173 |
The orientation of the hydrothermal breccia zone appears to be flat-lying in the area of these intercepts. The true width of the gold-copper zone intersected in hole EC08-254 is approximately 85% of the intercept length. The true width and orientation of molybdenum-rhenium-gold zones intersected in holes
- 22 -
EC08-250 and 252 are probably similar, but continuity of high grade intercepts within the entire zone are unknown.
Drilling completed in the northeast part of NW Expo did not intersect any mineralization of economic significance. In addition, technical problems were encountered due to faulting and argillic alteration, resulting in three of the seven holes being terminated well short of their designed depths.
Overall the 2008 drill program at NW Expo confirmed that the highest gold-copper values are confined to magnetite-chlorite-silica zones in hydrothermal breccias. However, only hole EC08-254 intersected any significant width of this mineralization style.
Within these zones, samples with the highest gold values, up to 3 g/t correlate well with high magnetite content. This secondary magnetite is present where breccias clasts exhibit distinct chlorite haloes producing textures described as amoeboidal in appearance. The data obtained from magnetometer surveys and susceptibility measurements in core can be used to identify more drilling targets of this type.
In addition the 2008 drilling has identified tectonic fracturing as an important factor controlling molybdenum-rhenium-gold mineralization. The highest content of rhenium, reaching values of 8 to 12 g/t across 2 metre intervals in hole EC08-250, suggests that this metal may be forming minerals in addition to being a substitute for molybdenum in molybdenite (Kucha, 2008 – seeAppendix 5).
Hushamu 2008 Drilling Results
Only two holes were drilled on the Hushamu Target in 2008. The results are listed inTable 5 and shown onFigures 4a, 4b and 4c.
Table 5 – Hushamu Drilling Results
| Area | Hole No | Interval m | Length m | Au g/t | Cu % | Mo % | Re g/t |
| Hushamu | HI08-03 | 10.7-190 | 179.3 | 0.471 | 0.423 | 0.011 | 0.436 |
| Hushamu | HI08-08 | 8 -172 | 164.0 | 0.505 | 0.303 | 0.007 | 0.419 |
Hole HI08-08 was designed as an infill hole in the central portion of the deposit. Hole HI08-03 was drilled 530 metres southeast of hole HI08-08 to infill the area near Hushamu Lake. Both intersections represent the true thickness of the flat-lying, tabular deposit. The deposit is exposed at surface by erosion that shaped the Hushamu valley.
The Hushamu deposit was block modelled in 2003 for the purpose of resource estimation and historical data verification in a NI43-101 report format (Giroux and Pawliuk, 2003) which was then re-stated in 2008 (Giroux and Baker, 2008). The resource estimate was based on the results from 114 diamond drill holes completed between 1980 and 1993 and was an update from the earlier estimate completed in 1993 (Giroux, 1993). The combined measured and indicated resource using a 0.20% copper cut-off is estimated at 230.9 million tonnes averaging 0.28% copper and 0.309 g/t gold. The resource study also demonstrated the existence of a higher-grade core of 63.7 million tonnes averaging 0.41% copper and 0.37 g/t gold, using a 0.30% copper cut-off.
The 2008 drilling confirmed that the central part of the Hushamu deposit contains significant and continuous near surface mineralization with consistent values of both copper and gold. The drilling also established the significant and continuous values of both molybdenum and rhenium correlating well with the copper and gold values.
- 23 -
Sampling Method and Approach
Throughout the exploration history in the area of the Island Copper Property, there have been several campaigns of surface exploration and diamond drilling. For the purpose of this report the following descriptions deal exclusively with the methodology used by IMA Exploration Inc. during the 2008 exploration drilling program at NW Expo and Hushamu.
Core Handling
The HQ size drill core generated during drilling was placed into standard wooden core boxes divided into three rows, each one four feet in length. Each core box was labeled at the drill site by the drillers with its drill hole identification number and its box number, with wooden depth blocks inserted in the boxes marking the hole depth after each drill run, both in imperial and converted metric units.
During the course of the drilling program, the responsibility for delivering core from the drill to the core handling facility was changed twice. Initially, the drillers delivered the drill core from the drills at NW Expo to their accommodation site after each shift, and the drill foreman delivered the core from both drills from the accommodation site to the core handling facility each day using a trailer. Near the mid-point of the drilling program, IMA engaged Port Hardy Bulldozing of Port Hardy to transfer drill core directly from the drillers to the core handling facility at the end of each shift, relieving the drill foreman from this responsibility. For the Hushamu drill core at the end of the drilling program, the drillers or the drill foreman delivered the drill core directly from the drill to the core handling facility after each shift, since it was logistically convenient to do so.
When core arrived at the receiving area inside the core handling facility at the former Island Copper Mine, core samplers arranged the core boxes in numerical order either on tables or on timber rails resting on the ground. The geologist checked and if necessary corrected the metric values on the depth blocks labeled to two decimal places. Subsequently, the geologist marked the drill hole number, box number and depth intervals in metric units both in permanent marker on the upper surface of each box and on metal tags stapled onto the left end of each core box.
Drill Core Photography
Following the completion of marking, each core box containing whole core was placed on top of the logging benches and photographed in sets of two consecutive boxes per photo. Each photo shows the drill hole number, box number and depth interval marked on each of the two boxes. Digital colour photographs were taken using ambient light generated by fluorescent and incandescent lighting. The photographs were taken approximately perpendicular to the core boxes, minimizing shadows. The digital images were copied daily to the desktop computer in the project office.
Geotechnical Logging
Initial geotechnical methodology for the Island Copper project was designed by Piteau and Associates of North Vancouver, who sent a geotechnical engineer to visit the property in October 2008 to conduct training of IMA geologists in geotechnical core logging. Subsequently, Piteau issued a report entitled “Summary on 2008 Site Visit and Recommendations for the Geotechnical Program”. The report along with the Piteau Field Manual describes geotechnical core logging protocol, rock strength testing and rock mass classification approach followed by the geologists during the 2008 program (Scholz, 2008) This consisted of all standard geo-mechanical parameters including compressive strength testing of drill core segments using a rented PIL-7 point load tester, mounted on a wooden bench in the core logging area.
- 24 -
Core Logging
During the detailed mark-up of the drill core, the geologist performed magnetic susceptibility measurements and geological logging of the core (See Appendix 1). This initial logging by the geologist identified lithological boundaries, major structures, overburden and oxidation depths and broad mineralization and alteration intervals. Key parameters were recorded using a digital drill log template created for the project in Microsoft Excel, using one of three rugged notebook computers as data entry terminals linked via a wireless network into a single directory on a desktop computer (which was backed up daily) located in the project office, and summarized as follows:
Geology
The descriptive geology field consisted of a short description of the major lithology, alteration, textures and structures (defined as contacts, veins, shears, or faults) that were visually identifiable.
Sampling and QA-QC Data
Standardized two metre samples were established and core sample numbers taken from pre-numbered, three-part core tags were referenced to specific depths, including positions of standards, field blanks and duplicates. One section of each sample tag was stapled into the core box at the beginning of each sample interval, with the second section left attached and ready to insert into the sample. Labeled metal tags were also stapled into the core box with the sample tag.
Magnetic Susceptibility, Oxidation Depth and Total Sulphide Content
These parameters were collected at the beginning of detailed logging. Magnetic susceptibility was measured every 0.5 metres using hand-held KT-10 magnetic susceptibility meter.
Mineralization
Mineralization was recorded as the abundance of copper, molybdenum and other sulphides expressed in percentages based on visual estimations.
Alteration
Alteration type was indexed according to its type, style and intensity using an acronym letter coding system designed for the project.
Structural Domain
A simple classification was used consisting ofcompetent versus faulted for sections of drill core, with additional descriptions for faulted/sheared or crushed core intervals placed into “Description” field.
Sampling
After drill core mark-up, core boxes are taken to a designated cutting room where the core was cut longitudinally in half using a Pothier 14” circular rock saw. One half of each 2 metre section of drill core was placed into a clean plastic bag containing one of the pre-numbered tag sections, each sample number was marked on each bag, and each bag was secured using a plastic cable tie.
- 25 -
Storage of Core
Since the construction of core warehouse and logging facility at the former Island Copper Mine during the late summer of 2008, all core has been stored on timber racks within secure storage facilities. Pre-2008 drill core is located in outdoor racks at Port Hardy Bulldozing Ltd. in Port Hardy, established and paid for by Western Copper.
Sample Preparation, Analyses and Security
Chain of Custody
In 2008 IMA implemented a chain of custody protocol to track each sample and sample batch through all stages of sampling and shipping progress from the core handling facility to the analytical facility. This was initiated as each sample was taken, when geologists entered sample numbers and sample intervals on the core log. A sample batch was defined as a series of core samples taken from a single drill hole between consecutive sample shipments. Analytical results for each sample batch was reported as a separate work file by ALS Chemex (see Appendix 2). After cutting and sampling of each sample batch, including field blanks and standards, the core technicians placed them in order into consecutively numbered rice sacks, six samples per rice bag. Rice bag were then sealed with plastic cable ties and stored in a securely locked room until they were placed on pallets and picked up weekly from the core logging facility and transported to the analytical facility by VanKam Freightways Ltd., a bonding trucking company, and their Port Hardy affiliate, Busy Bee Trucking Ltd.
Each sample batch was logged in an ALS Chemex Sample Submittal Form. The following details were recorded: shipment and work order numbers, date dispatched, list of sample numbers, type and total number of samples in the shipment. In addition a unique waybill number was assigned to the sample shipment by the trucking company and entered on the submittal form. The waybill form was completed by the truck driver with details of shipment and the number of pallets loaded.
Upon receipt of the samples in North Vancouver, ALS Chemex made a record of all samples received. The rice bags were opened, the samples placed in order and each sample assigned an internal laboratory identification and a batch file number that corresponded to the IMA work order.
Insertion of Blanks, Duplicate Samples and Standard Reference Materials
Field blanks (blanks), coarse crush duplicates and standard reference materials (standards) were included in each sample shipment (minimum 2 sample batches per shipment) which always contained at least five of each these three types of quality control samples. Analytical shipments sent to IMA’s chosen principal laboratory, ALS Canada Limited (“ALS Chemex”), consisted of seven shipments containing from 199 to 544 samples each. Totals of 54 standards and 53 field blanks were inserted to support the 2,411 core samples, and 53 coarse crush duplicates were prepared by the lab during the preparatory stage. Sample numbers within the continuous sequences on each book of samples tags were allocated for the insertion of blank crushed rock and standard reference pulps by the Geologists prior to sampling. These materials were inserted by the Core Samplers within the sample stream prior to packing samples into rice sacks. The nature of these materials is described below. The coarse crush duplicates were designated using “a” and “b” suffixes after the same sample number, and analyzed by ALS Chemex.
Analytical Methods and Check Analyses
All samples sent to ALS Chemex were subjected to 250 gram splits of the entire sample crushed to >=70% passing 2 mm. The samples were pulverized to >=85% passing 75 um (- 200 mesh). A 30 gram
- 26 -
split from each sample pulp was assayed for Au (fire assay with atomic absorption finish, 5 ppb detection limit) and 33 element analysis Cu, Mo (four acid, total digestion with ICP emission spectrometry finish).
ACME Labs was used as an independent lab to complete check analyses on a split of 1 in 20 pulps using the same analytical procedures as initial analysis completed by ALS Chemex. These check sample batches were accompanied by IMA’s own standard reference materials as well.
After receipt of all initial analytical results from ALS Chemex, 655 samples were selected by IMA for rhenium analyses based on continuous intervals of elevated molybdenum values, using four acid digestion and mass spectrometry finish at ALS Chemex using the same sample pulps as were used for the initial analyses. Check analyses reports appear inAppendix 3.
IPL Labs of Richmond BC performed 33 rhenium check analyses, along with copper and molybdenum analyses, using pulp splits prepared by ALS Chemex.
Specific Gravity Tests
Immediately after the completion of all drill core logging, one of the geologists completed 61 specific gravity determinations using comparative weights in air and weights submerged in water. Samples were taken every 80 metres from all 2008 drill holes. Data was recorded for drill hole ID, depth, rock type, alteration, sulphide content, weight in air and weight in submerged water. All samples were returned to their original locations in the core boxes in the storage area of the core facility.
No check samples were sent to any laboratory for specific gravity determinations in 2008.
Field Blanks
Field blanks were used to monitor contamination introduced during the preparation of samples. Geologists routinely inserted field blank material within the sampling stream at a rate of 1 in 40 samples, so that each shipment of 300 samples (3 batches) always contained at least seven blanks.
Field blank material was obtained from a barren limestone quarry located outside of the project area. A 250 kg batch of the crushed material (roughly -2 cm fraction) was selected from a landscaping supplier in Pitt Meadows, B.C. Initially, 60 samples (approximately 0.5 kg each) were analyzed to determine the sterility and homogeneity before shipment to the project area. The geochemical trace element values for Au and Mo were considered uniform and at the acceptable levels, near and below the laboratories’ detection limits.
Field blank fail limits were set at 0.005% molybdenum or 5 times the detection limit of 1 ppm. There were two batches with failed blanks which were confined to one hole. The blank pulps from these sample batches were re-run along with several sample pulps that preceded and followed the blanks within the same batch.(Chart 1) The blank pulps from these sample batches were re-run along with several sample pulps that preceded and followed the blanks within the same batch.
All analyses of the field blanks were below the fail limit for gold of 0.025 ppm with the vast majority performing near the detection limit of 0.005 ppm.(Chart 2)
- 27 -
Chart 1 - Blank Evaluation - Molybdenum (Mo)
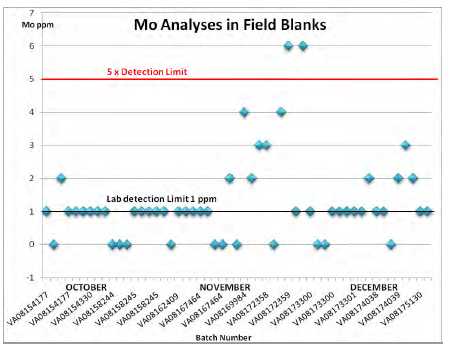
Chart 2 - Blank Evaluation - Gold (Au)

- 28 -
IMA Standards
Standard pulps were used to monitor the analytical accuracy of the laboratory. Geologist routinely inserted copper-molybdenum-gold standards into the sample stream at a ratio of 1 every 40 samples, so that each shipment of minimum 300 samples (3 batches) would always have at least seven standards. IMA geologists used three commercially available standards, purchased from WCM Minerals of Vancouver, details of which are shown inTable 6.
Table 6 - Copper-Molybdenum-Gold Standards used during 2008 Program
| Standard | Cu % | 2 ST DEV Limits | Mo % | 2 ST DEV Limits | Au g/t | 2 ST DEV Limits | |||
| Min | Max | Min | Max | Min | Max | ||||
| CU171 | 0.19 | 0.183 | 0.198 | 0.0307 | 0.0287 | 0.0327 | 0.22 | 0.190 | 0.250 |
| CU172 | 0.21 | 0.202 | 0.218 | 0.1042 | 0.1020 | 0.1062 | 0.26 | 0.232 | 0.288 |
| CU173 | 0.35 | 0.339 | 0.361 | 0.0183 | 0.0159 | 0.0207 | 0.93 | 0.875 | 0.985 |
Performance of Standards
Analytical batches with standards falling outside ±2 standard deviations from the mean certified value should be checked for potential analytical errors.
Standard CU171
The evaluation of standard pulp CU171 shows good performance for gold analyses with the majority of analyses following the certified value within the maximum and minimum acceptable limits (Chart 5). There were two significant departures lower than the certified value. The standard pulp with the lowest value of 0.105 g/t Au was re-analyzed along with the corresponding core sample pulps from the same batch. The re-analysis of the standard returned an acceptable value of 0.196 ppm gold and there were no other indications of problems with the batch.
Analytical performance of standard CU171 with respect to molybdenum and copper showed significant departures from the certified values with a low bias which required corrective action by ALS Chemex. Of 45 standard pulps 12 showed failed molybdenum values with overall average 9% lower than the certified average(Chart 4).For copper, 27 standard pulps returned values well below the IMA’s acceptable limit
(Chart 3).
Based on the performance of standard CU171 at ALS Chemex, there was a potential for the Mo and Cu analyses to have reduced accuracy, and this question was raised by IMA. ALS Chemex has conducted investigations into IMA’s standard performance and compared the findings with the internal QA/QC data, which appears inAppendix 3.
The results of this investigation were summarized by ALS Chemex as follows:
“…our control limits for standards are calculated using the following formula:
UpperControlLimit = NominalValue + (MethodPrecision * NominalValue + 2 * DetectionLimit)
LowerControlLimit = NominalValue - (MethodPrecision * NominalValue + 2 * DetectionLimit)
Applying this calculation to the certified Cu value of standard CU171, the expected precision limits for our ME-ICP61 method are 1691 ppm to 2071 ppm. I have reviewed the data in your spreadsheet and looked into the analytical process from weighing to instrumental analysis using our quality records and online audit trail system. Almost all results do fall within our method tolerance limits; however, they do tend to report on the lower side. The investigation to date has not revealed any evidence of a problem that would
- 29 -
explain the low results observed for Cu on your standards” (Lada Reimers, ALS Chemex communication, Jan 30, 2009).”
Chart 3 - Standard CU171 Evaluation - Copper
![]()
Chart 4 - Standard CU171 Evaluation - Molybdenum

- 30 -
Chart 5 - Standard CU171 Evaluation – Gold

Pulp CU172 and CU173
From a total of 54 standards inserted into the analytical batches only six were the CU172 type pulps and three where the CU173 type. Both standards returned values well within acceptable limits of certified values for gold, molybdenum and copper.
Coarse Crush Duplicates
The purpose of coarse reject duplicates is to test for the homogeneity of copper, gold and molybdenum grade within the -10 mesh crush material (-2mm fraction) and the splitting technique used by the laboratory.
IMA’s Quality Control program required the coarse reject of the entire remaining sample to be homogenized again and split down to 250 g then pulverized into a pulp sample “b”. This pulp would then be analyzed by the lab and compared with the original sample (sample “a” pulp).
Coarse reject duplicates have been run routinely on all sample batches for every 40thsample. A total of 53 core samples had been prepared using the above procedure to test the homogeneity of grades. Results appear for gold(Chart 6),copper(Chart 7)and molybdenum(Chart 8).
- 31 -
Chart 6 - Comparison between Original and Crushed Duplicate Pulps - Gold

Chart 7 - Comparison between Original and Crushed Duplicate Pulps – Copper
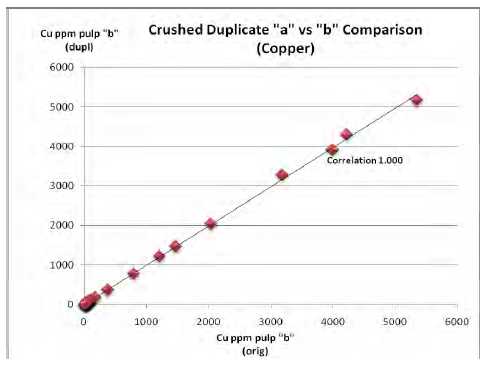
- 32 -
Chart 8 - Comparison between Original and Crushed Duplicate Pulps - Mo

Independent Laboratory Checks
IMA consistently sent 5% of pulps prepared and analyzed by ALS Chemex to an independent laboratory for check analyses of copper, molybdenum and gold. The pulps prepared at ALS Chemex were sent to ACME Laboratories in Vancouver for analysis by the same analytical procedures as the original analytical work (4 acid digestion of a 0.25 g pulp split and ICP-ES finish). IMA’s standard pulps were included in shipments to Acme to monitor the accuracy of analytical check results.
IMA carried out systematic analyses for rhenium at ALS Chemex using four acid digestion and mass spectrometry. A total of 655 samples were analyzed by this method. Independent laboratory checks were performed on 33 of these samples at IPL Plasma Labs in Richmond, B.C., who used the same methods.
All independent laboratory checks showed very good correlation with the original analyses. The check analyses appear forGold (Chart 9),Copper(Chart 10), Molybdenum(Chart 11)and Rhenium(Chart 12).
- 33 -
Chart 9 - Comparison of Pulp Duplicates between ALS Chemex and Acme (Au)
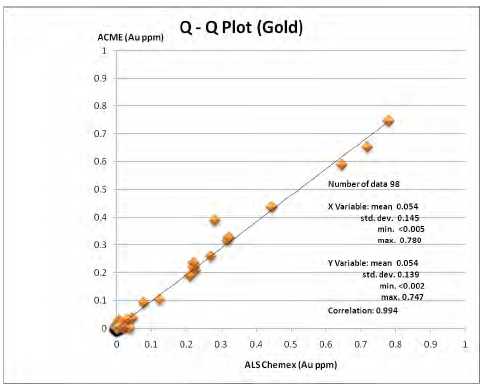
Chart 10 - Comparison of Pulp Duplicates between ALS Chemex and Acme (Cu)

- 34 -
Chart 11 - Comparison of Pulp Duplicates between ALS Chemex and Acme (Mo)

Chart 12 - Comparison of pulp duplicates between ALS Chemex andIPL (Re)
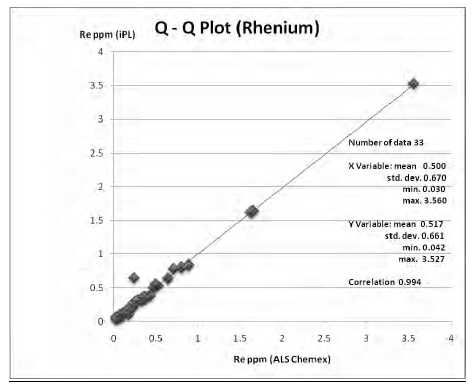
- 35 -
Re-assaying Procedures
IMA monitored assay results and implemented a protocol to determine whether or not the analyses were acceptable relative to the behavior of field blanks, standards, crushed duplicates and pulp duplicates. Standards were failed on gold, copper and molybdenum analyses where the value was outside the acceptable value limits defined as two standard deviations from the mean. Several core samples in batches with failed standards were re-analyzed, which showed good agreement with the original data.
The failed analyses were investigated by ALS Chemex and it was established that copper and molybdenum standards were well within internal limits set by ALS Chemex and were in compliance with the ISO 17025 Quality Systems and monthly Round Robin Data. However, several standards were rerun in January 2009 to reconcile the failures as defined by IMA’s limits. Most standards that had failed returned similar values as the failed value. One of the gold analyses with significant departure from the certified value was re-analyzed and returned a corrected value that was acceptable.
For the purpose of this report if three standard deviations were used as a fail criteria most standards used in the 2008 program would not fail. A blank failure was considered if the returned copper value was equal or greater than five times the laboratory detection limits. Blank failures had to be re-analyzed using coarse reject material to test the preparation procedures. Only two blanks failed marginally on molybdenum results and re-analyses returned similar values.
Record Keeping for Traceability
During drilling, logging, sampling and shipping multiple data keeping systems were employed. All data was recorded digitally in the drill logs, or in written form in sample tag books, sample sheets, logging forms, sample submittal or shipping forms. Various phases of record keeping are repeated in subsequent steps to confirm recorded values or numbers. For example the geologist recorded standards used during sampling, the core sampler recorded the actual sample numbers bagged and the sample submittal form confirms the number of bags and where standards were placed in the sample sequence. Any errors in labeling or sampling sequence were picked up during verification and usually traced back to the source, and corrective action was taken. Upon receiving of the samples, the laboratory issued a “work order write-up form” to IMA confirming the sample count and details of preparatory work ordered.
All drill log data was entered using Microsoft Excel into the desktop computer at IMA’s project office. Any errors in data entry picked up during the verification stage were identified and corrected. Data from third parties such as laboratories or survey contractors were generally supplied in digital and printed form. These records were printed and kept in binders for reference during data verification.
Data Verification
IMA has conducted the following checks of the 2008 drill hole database:
- Detailed verification of assays using signed assay certificates;
- Assay verification from electronic laboratory files;
- Verification of collar inclinations from down-hole survey data;
- Verification of drill hole positions in field;
- 36 -
Verification of Down-hole Survey Data
Of eleven drill holes, two are lacking down-hole survey data. Of the nine holes that have been surveyed down-hole, six holes had significant differences in collar survey inclinations using the Maxibor compared to the collar inclination measured by Bazett, exceeding 2º.
When surveyed, down-hole readings were done using a Reflex Maxibor II tool designed to produce accurate digital readings in magnetic rocks. The inclination readings obtained at the collar elevation were in close agreement with the collar survey inclinations prior to drilling (85º for vertical holes and 60º for inclined holes). For the purpose of this report, inclinations from the Maxibor survey were considered more accurate than, and used in priority over, the inclinations based on surface collar surveys or measurements of drill steel by the survey crews.
Verification of Drill Hole Collar Locations
The positions of 11 drill holes were checked using a hand-held Garmin GPS unit. A comparison of the results with surveyed collar positions by Bazett Surveying Ltd. is shown in Table 7.There is generally good agreement between the two determinations.
Table 7 – Comparison of Collar Survey Locations by Bazett and by IMA
| Collar Surveys by Bazett | IMA GPS Data | |||||
| HOLE # | NORTHING | EASTING | ELEVATION | NORTHING | EASTING | ELEVATION |
| EC08-248 | 5619688.94 | 569171.56 | 467.70 | 5619688 | 569169 | N/A |
| EC08-249 | 5619940.9 | 569869.4 | 319.26 | 5619940 | 569865 | N/A |
| EC08-250 | 5619688.94 | 569171.64 | 467.75 | 5619688 | 569169 | N/A |
| EC08-251 | 5619940.91 | 569868.75 | 319.26 | 5619940 | 569865 | N/A |
| EC08-252 | 5619462.88 | 569352.55 | 433.74 | 5619467 | 569354 | N/A |
| EC08-253 | 5619942.94 | 569867.76 | 319.47 | 5619940 | 569865 | N/A |
| EC08-254 | 5619462.95 | 569352.07 | 434.15 | 5619467 | 569354 | N/A |
| EC08-255 | 5619715.64 | 570060.78 | 258.34 | 5619721 | 570060 | N/A |
| EC08-257 | 5619715.63 | 570060.76 | 257.79 | 5619721 | 570060 | N/A |
| EC08-259 | 5619433.80 | 569935.88 | 240.30 | 5619432 | 569927 | N/A |
| EC08-261 | 5619433.83 | 569935.81 | 240.02 | 5619432 | 569927 | N/A |
| HI03-03 | 5614209.14 | 580911.54 | 319.07 | 5614209 | 580914 | N/A |
| HI03-08 | 5614363.62 | 580402.60 | 325.19 | 5614366 | 580400 | N/A |
Adjacent Properties
There are several mineral properties adjacent to the Island Copper Property which host MINFILE occurrences of potential economic significance, and are held by other companies or individuals. These occurrences are listed in theTable 10, titled “Island Copper Project Area MINFILE Occurrences”. Prospects, developed prospects and past producers of metallic minerals are considered significant for the purpose of this report. Showings are generally not considered significant.
- 37 -
The following 19 significant MINFILE occurrences are situated adjacent to the Island Copper Property, listed by deposit type with commodities of interest, and mineral tenure holders as of January, 2009:
8 Porphyry Cu-Mo-Au occurrences: | ||
o | Red DogMINFILE 092L200 developed prospect containing Cu, Au, Mo, Ag - owned 50% each by Tanya Veerman and William Botel on legacy mineral claim 231682 – surrounded by the cell mineral claims of the Western Block of the Island Copper Property | |
o | Island CopperMINFILE 092L158 past producer of Cu, Mo, Ag, Au, Zn, Pb, Re - owned 100% by BHP Billiton Diamonds Inc. on mining lease 231460 - situated between the Western and Eastern blocks of the Island Copper Property | |
o | Yankee GirlMINFILE 092L062 prospect containing Fe, Cu owned 100% by BHP Billiton Diamonds Inc. on mining lease 231461 - situated between the Western and Eastern blocks of the Island Copper Property | |
o | Bay 21MINFILE 092L099 prospect containing Cu, Ag, Au owned 100% by BHP Billiton Diamonds Inc. on mining lease 231459 – situated immediately east of the Western Block of the Island Copper Property | |
o | Bay 4MINFILE 092L136 prospect containing Fe, Cu, Au, Ti owned 100% by BHP Billiton Diamonds Inc. on mining lease 231459 - situated immediately east of the Western Block of the Island Copper Property | |
o | Bay 29MINFILE 092L139 prospect containing Fe, Cu owned 100% by BHP Billiton Diamonds Inc. on mining lease 231461 - situated between the Western and Eastern blocks of the Island Copper Property | |
o | Bay 56MINFILE 092L135 prospect containing Cu, Mo owned 100% by Jo Shearer on cell mineral claim 513736 – situated northeast of the Western Block of the Island Copper Property | |
o | RoadMINFILE 092L160 prospect containing Cu, Mo, Fe owned 100% by Kelly Funk on cell mineral claim 570829 - surrounded by BHP’s mining leases between the eastern and western blocks of the Island Copper Property | |
4 Cu Skarn Occurrences: | ||
o | Rainbow 1-4MINFILE 092L159 prospect containing Cu, Zn, Ag, Pb, Au, Magnetite owned 100% by Jo Shearer on cell mineral claim 551039 situated northeast of the Western Block of the Island Copper Property | |
o | SouthMINFILE 092L318 prospect containing Cu, Ag, Au, Magnetite, Fe owned 100% by Jo Shearer also on cell mineral claim 551039 situated northeast of the Western Block of the Island Copper Property | |
o | CranberryMINFILE 092L315 prospect containing Cu, Ag, Au owned 100% by Kelly Funk on cell mineral claim 592680 situated northeast of the Western Block of the Island Copper Property | |
o | SwampMINFILE 092L317 prospect containing Cu, Ag, Au, Magnetite, Fe owned 100% by Jo Shearer also on cell mineral claim 505458 situated northeast of the Western Block of the Island Copper Property | |
6 Pb-Zn Skarn occurrences: | ||
o | CaledoniaMINFILE 092L061 developed prospect containing Zn, Ag, Cu, Pb, Au owned 100% by Jo Shearer on cell mineral claim 504750 situated northeast of the Western Block of the Island Copper Property | |
o | HPH1MINFILE 092L069 prospect containing Ag, Pb, Zn, Cu, Au, Magnetite, Fe owned 100% by Rodney Zimmerman on cell mineral claim 568683 situated immediately north of the Western Block of the Island Copper Property | |
o | DorlonMINFILE 092L076 prospect containing Au, Zn, Ag, Cu, Pb, Cd, Magnetite, Fe owned 100% by Rodney Zimmerman on cell mineral claim 568683 situated immediately north of the Western Block of the Island Copper Property | |
o | South ShoreMINFILE 092L074 prospect containing Ag, Pb, Zn, Cu owned 100% by Speebo Inc. on cell mineral claim 592830 situated immediately north of the Western Block of the Island Copper Property | |
- 38 -
| o | South Shore (Ras 4)MINFILE 092L244 prospect containing Zn, Ag, Cu, Pb, Cd owned 100% by Speebo Inc. also on cell mineral claim 592830 situated immediately north of the Western Block of the Island Copper Property | |
| o | South Shore (HSW 3)MINFILE 092L245 prospect containing Ag, Zn, Pb, Cu owned 100% by Speebo Inc. also on cell mineral claim 592830 situated immediately north of the Western Block of the Island Copper Property | |
1 Epithermal Au-Ag-Cu High Sulphidation Occurrence: | ||
| o | KnobMINFILE 102I005 prospect containing Cu, Zn, Pb, Au, Ag, Mo owned 100% by Sea Breeze Power Corp. on cell mineral claim 533875 situated northwest of the Western Block of the Island Copper Property | |
By far the most significant adjacent property is the past producingIsland Copper Mine, the namesake for the Property which is the subject of this report. During its operating life from 1971 to 1995, the Mine produced 1,227 million kilograms of copper, 35,268 kilograms of gold, 294,106 kilograms of silver, 32 million kilograms of molybdenum and 236 kilograms of rhenium from 367 million tonnes of ore. Estimated resources after mining ceased were 23.4 million tonnes grading 0.33% copper, 0.02% molybdenum, 0.16 g/t gold and 1.2 g/t silver, estimated prior to the implementation of NI43-101 and CIM standards and guidelines. The property which hosts the Island Copper Mine and two of the five adjacent MINFILE prospects (Yankee Girl, Bay 21, Bay 4and Bay 29) is held by BHP Billiton Diamonds Inc., and is the site of ongoing environmental monitoring. TheRoadprospect held by Kelly Funk is covered by a small cell claim completely surrounded by BHP’s property. Four (Island Copper, Yankee Girl, Bay 29and Road) of these 6 MINFILE occurrences clustered together probably represent a single porphyry copper deposit, which may or may not host additional economic mineralization. 3-D modeling of the historic mine data may prove useful in delineating remnant mineralization peripheral to the reclaimed island copper open pit. The remaining two (Bay 21, Bay 4) prospects may represent a second porphyry deposit cluster northwest of the pit, and are worthy of research.
TheRed Dog developed prospect is covered by a series of 28 2-post legacy mineral claims held 50/50 by Tanya Veerman and William Botel. The porphyry copper deposit is reported to host mineral resources of 25 million tonnes grading 0.35% copper, 0.44 g/t gold and 0.006% molybdenum, estimated in 1988 prior to the implementation of NI43-101 and CIM standards and guidelines. It is located between west of theHushamu andHep developed prospects, and east of theNW Expo andCougaroccurrences, all located on the Island Copper Property. The claims covering the Red Dog partially underlie and are completely surrounded by Island Copper Property.
TheBay 56 porphyry copper prospect is covered by one of many cell mineral claims in the area held by Jo Shearer, and may represent another porphyry copper deposit situated to the northwest of both theIsland Copper andBay 21/Bay 4 clusters. TheKen copper skarn prospect is covered by a group of four small cell mineral claims held by Kelly Funk, located immediately north of theIsland Copper cluster. Four other nearby copper skarn prospects,Rainbow 1-4,Cranberry,Swamp, andSouth, appear to straddle boundaries of cell mineral claims held by either Jo Shearer or Kelly Funk, and are located north of theKen prospect. These two areas of copper skarn mineralization may represent replacement type mineralization peripheral to the known porphyry clusters nearIsland Copper, or other up to two other undiscovered porphyry copper deposits.
TheCaledonia lead-zinc skarn developed prospect is reported to host mineral resources of 69,000 tonnes grading 704 g/t silver, 6.1% copper, 7.45% zinc, 0.6% lead and 0.34 g/t gold, estimated in 1981, considerably before the implementation of NI43-101 and CIM standards and guidelines. The deposit is covered by another of many cell mineral claims in the area held by Jo Shearer, situated immediately north of the West Block of the Island Copper Property. Two other clusters of five lead-zinc skarn prospects occur to the west along the northern boundary of the Island Copper Property. TheDorlon andHPH 1lead- zinc skarns are covered by a cell mineral claim held by Rodney Zimmerman, situated northeast of theHushamu porphyry copper developed prospect. TheSouth Shore, Ras 4and HSW 1lead-zinc skarns are covered by a cell mineral claim held by Speebo Inc., situated due north ofHushamu.These
- 39 -
clusters of lead-zinc skarn prospects may represent distal replacement type mineralization hosted by limestone peripheral to known or undiscovered porphyry clusters.
TheKnobprospect is classified as an epithermal gold-silver-copper high sulphidation, and interpreted to represent the surface exposure of a possible buried porphyry copper system. The Knob and 3 other showings are held by Sea Breeze Power Corp. through 7 cell mineral claims situated immediately northwest of theNW Expooccurrence and adjacent to the Island Copper Property. Sea Breeze is primarily a wind energy company and may not be interested in exploring and developing mineral resources on their mineral claims.
Mineral Processing and Metallurgical Testing
In 1992, on behalf of Moraga Resources Ltd. (“Moraga”), Melis Engineering (“Melis”) completed five preliminary scoping flotation tests on Hushamu diamond drill composites to quantify potential copper and gold recovery to a copper/gold flotation concentrate (Melis and Cron, 1992). Two different approaches were used: bulk sulphide flotation followed by copper-pyrite separation and cleaner flotation; and a fine grind/selective copper-gold float at elevated pH to effectively suppress pyrite in the front-end rougher flotation stage.
Based on these five tests Melis concluded that: “These preliminary scoping tests indicate that a copper recovery of close to 90% and a gold recovery of 70% to 75%, into a copper/gold concentrate assaying 25% Cu and 34 g Au/tonne, would be achievable for the higher grade composite (calculated head grade of 0.58% Cu and 1.16 g Au/tonne). For the lower grade composite (0.17% Cu and 0.38 g Au/tonne) achievable recoveries appear to be approximately 75% for copper and in the range of 50% to 55% for gold into a copper/gold concentrate assaying 24% Cu and 24 g Au/tonne. These recovery expectations are only based on preliminary tests, more extensive flotation testing will be required to better quantify copper and gold recoveries for the Hushamu deposit and to determine what recovery improvements can be made.”
There are no known records available for any metallurgical testing for recoveries of molybdenum and rhenium from the Hushamu deposit, nor from any other metallic mineral occurrences on the Island Copper Property. According to BC MINFILE 092L158, the nearby Island Copper Mine produced 32 million kilograms of molybdenum and 236 kilograms of rhenium from 367 million tonnes of ore. The production head grade at the mine averaged approximately 175 ppm molybdenum, but unknown grades of rhenium (Brian Welchman, pers.comm.) The molybdenum concentrate grade averaged 45% Mo and is reported to have averaged approximately 2100 ppm rhenium. However, details are confidential and the rhenium content of the mill feed is not available.
It is strongly suggested that any metallurgical testing to recover metals be preceded by appropriate mineralogical studies to identify and characterize the sulphide minerals containing the metals of interest, and any others that might affect recovery of those metals. No known records are available for any polished thin section studies for the Hushamu deposit, nor from any other metallic mineral occurrence on the Property. Therefore, thin sections were prepared from 11 selected pieces of drill core from four of the 2008 drill holes completed in 2008, and analyzed by Dr. John Payne of Vancouver Petrographics Ltd. on behalf of IMA Exploration Inc. These thin section reports are summarized in the Exploration section of this report, and included with photographs inAppendix 4.
Mineral Reserve and Mineral Resource Estimates
The Island Copper Property hosts two developed prospects:HepMINFILE 092L078 andHushamuMINFILE 092L240. Mineral resource estimates have been documented for both porphyry copper deposits. In 1988, prior to the implementation of NI43-101 and CIM standards and guidelines, a resource
- 40 -
estimate was completed for Moraga Resources Ltd. for theHepdeposit of approximately 45,350 tonnes grading 0.80% copper (Jones, H.M.: 1988).
In early 2008, IMA Exploration Inc. engaged Gary Giroux, P.Eng. of Giroux Consultants Ltd. and Darcy Baker, PhD. of Equity Engineering Ltd. to update a previous resource estimate on theHushamudeposit completed by Mr. Giroux in 1993 for Jordex Resources Ltd., prior to the implementation of NI43-101 and CIM standards and guidelines. This estimate appears in MINFILE as follows: proven and probable reserves are 173,237,000 tons grading 0.27% copper, 0.34 grams per tonne gold, and 0.009% molybdenum (Giroux, G.: 1993).
Giroux and Baker used modern 3-D block modeling and kriging techniques on the same data used in 1993, consisting of 114 drill holes completed from 1980 to 1993, to produce a resource estimate to NI-43-101 and CIM standards and guidelines with three arbitrary copper cut-off grades (Giroux et. al.: 2008). These estimates for theHushamuCopper-Gold deposit are summarized as follows:
Table 8 – Mineral Inventory Estimates for the Hushamu Deposit
| Class | Cu Cut-off (%) | Tonnage Above Cut-off (millions) | Grade Cu (%) | Grad Au (%) |
| Measured | 0.10 | 87.7 | 0.21 | 0.206 |
| Indicated | 0.10 | 495.8 | 0.20 | 0.240 |
| Measured + Indicated | 0.10 | 583.5 | 0.20 | 0.240 |
| Inferred | 0.10 | 151.9 | 0.19 | 0.274 |
| Measured | 0.20 | 39.2 | 0.29 | 0.309 |
| Indicated | 0.20 | 191.7 | 0.27 | 0.309 |
| Measured + Indicated | 0.20 | 230.9 | 0.28 | 0.309 |
| Inferred | 0.20 | 52.8 | 0.28 | 0.377 |
| Measured | 0.30 | 14.0 | 0.37 | 0.411 |
| Indicated | 0.30 | 49.7 | 0.37 | 0.411 |
| Measured + Indicated | 0.30 | 63.7 | 0.37 | 0.411 |
| Inferred | 0.30 | 18.2 | 0.35 | 0.480 |
Neither molybdenum nor rhenium was reported in the 2008 mineral resource estimate of the Hushamu deposit completed by Mr. Giroux.
Other Relevant Data and Information
In 1991, Fluor Daniel Wright Ltd. completed a study for Jordex Resources Inc. of the transportation alternatives for shipping ore from the Hushamu Deposit to the Island Copper concentrator (Fernie, 1991). The three alternatives studied were: a slurry pipeline, an overland conveying system and a combination conveyor/barge system. The study indicated the pipeline system had the highest Capital Cost of $120 million, but the lowest operating cost of 0.054 $/ton. The conveyor system had a Capital Cost of $98 million with an operating cost of 0.159 $/ton. The conveyor/barge system had a Capital Cost of $115 million with the highest operating cost of 0.586 $/ton.
In 1993, J.D. Graham & Associates Ltd. completed a mining study for the Hushamu copper-gold deposit (Graham, 1993), also for Jordex Resources Ltd. Graham designed an open pit and reviewed scheduling and costs, using the resource estimate completed by G. Giroux in the same year, prior to the implementation of NI43-101 and CIM standards and guidelines. That resource estimate appears in
- 41 -
MINFILE as follows: proven and probable reserves are 173,237,000 tons grading 0.27% copper, 0.34 grams per tonne gold, and 0.009% molybdenum (Giroux, G.: 1993). S.R.K. (B.C.) Inc. designed an optimum open pit using Whittle Four-D computer software. All costs and metal prices for the mining study were based on 1993 information and technology, which have changed and are continuing to change considerably.
The Island Copper Mine was still in operation at the time these studies were completed. The mine closed in 1995 and the mine site has been reclaimed, including removal of the concentrator. During its 24 year operating life, it was the first mine in the world to use “engineered” submarine tailings disposal. Nearly 360 million tonnes of tailings were placed on the seafloor on nearby Rupert and Holberg Inlets without significant long-term effects on benthic life. Upon closure, the open pit was flooded and has been used since for passive treatment of acidic, metal-contaminated drainage from on-land waste rock dumps. The discharge from the surface of the pit lake has met all Provincial permit criteria. (Rescan Environmental Services Ltd. website)
It is unknown whether a similar submarine tailings disposal system could be permitted for a new mine and concentrator facility in the area of the Island Copper Property.
Interpretations and Conclusions
The Island Copper Property (“Island Copper”, or the “Property”) represents an advanced exploration project including at least seven (7) known mineral occurrences of porphyry and related deposit types containing copper-gold-molybdenum-rhenium situated along the “Northern Island Copper Belt” on Vancouver Island, British Columbia. The Property covers over 50 km strike length of the belt, and is underlain mainly by Jurassic age Bonanza volcanics and Island plutonic suite rocks, located both east and west of the past producing Island Copper Mine.
The 2008 drilling program at Northwest Expo was designed to delineate the northwest projection of the mineralized zone beyond significant intercepts of copper, molybdenum and gold achieved by Western Copper in their 2007 drilling program (Lehtinen, Awmak, 2007). The 2008 program utilized new logging roads to establish 5 drill pads located 300 to 400 metres apart with 2 to 3 holes drilled from each pad. Significant intercepts were achieved from 4 holes drilled from the 2 western-most pads in an extensive hydrothermal breccia zone, as follows:
EC08-248 yielded 100 metres @ 0.052 g/t gold, 0.003% copper, 0.003% molybdenum and 0.215 g/t rhenium from 267 metres to 367 metres, including: | ||
| o | 4 metres @ 0.026 g/t gold, 0.002% copper, 0.022% molybdenum and 0.561 g/t rhenium from 267 metres to 271 metres | |
EC08-250 yielded 196 metres @ 0.149 g/t gold, 0.009% copper, 0.019% molybdenum and 1.222 g/t rhenium from 291 metres to 487 metres, including: | ||
| o | 92 metres @ 0.218 g/t gold, 0.015% copper, 0.030% molybdenum and 2.210 g/t rhenium from 381 metres to 473 metres | |
EC08-252 yielded 290 metres @ 0.226 g/t gold, 0.026% copper, 0.016% molybdenum and 0.497 g/t rhenium from 165 metres to 455 metres, including: | ||
| o | 102 metres @ 0.121 g/t gold, 0.006% copper, 0.020% molybdenum and 0.776 g/t rhenium from 165 metres to 267 metres, and | |
| o | 124 metres @ 0.299 g/t gold, 0.053% copper, 0.017% molybdenum and 0.359 g/t rhenium from 329 metres to 453 metres | |
EC08-254 yielded 238 metres @ 0.606 g/t gold, 0.084% copper, 0.010% ppm molybdenum and 0.265 g/t rhenium from 194 metres to 432 metres, including: | ||
| o | 164 metres @ 0.817 g/t gold, 0.119% copper, 0.011% molybdenum and 0.368 g/t rhenium from 238 metres to 402 metres | |
- 42 -
At Northwest Expo, the mineralized zone was confirmed as a tabular shaped, +600 metre long by up to 300 metre thick hydrothermal breccia body striking approximately east-west and dipping moderately to the north. The drilling program was successful in delineating both the northern down-dip extent and the eastern fault-bounded extent of the mineralized zone, but the western strike projection of the zone remains open and untested towards the western Property boundary. Copper values appear to decrease down-dip to the north within the zone relative to previous drilling results to the south, but gold, molybdenum and rhenium values are persistent throughout the zone. Preliminary microscopy work completed on 11 selected core samples from the zone confirmed hydrothermal breccia textures and alteration mineralogy similar to both epithermal and porphyry mineral deposits.
The Northwest Expo target still has substantial growth potential as a large tonnage bulk mineable gold-molybdenum-rhenium deposit, and warrants additional exploration work.
The 2008 drilling program at Hushamu was designed to confirm the grade continuity of the core portion of the mineralized zone, particularly for rhenium and molybdenum, which had never been systematically analyzed in previous drilling programs. The 2008 utilized refurbished logging roads to establish 2 drill pads located about 0.5 kilometre apart with 1 hole drilled from each pad. Both holes achieved significant intercepts in mainly hydrothermal breccia, as follows:
- HI08-03 yielded 179.3 metres @ 0.471 g/t gold, 0.423% copper, 0.011% molybdenum, and 0.436 g/t rhenium from 10.7 to 197.2 metres
- HI08-08 yielded 164 metres @ 0.505 g/t gold, 0.303% copper, 0.007% molybdenum and 0.419 g/t rhenium from 8 m. to 172 metres
At Hushamu, the mineralized zone is relatively well established in shape, dimensions and grades of copper and gold (Giroux and Baker, 2008). Sufficient size and grades have been established to warrant a pre-feasibility study. The values and distribution of molybdenum and particularly rhenium within and peripheral to the zone are not well known, but from the limited drilling completed in 2008 they appear to be persistent and correlate well with copper and gold.
The Hushamu target warrants additional road-based definition diamond drilling from road rehabilitation planned and commenced but deferred in 2008. The remaining 6 known targets on the Island Copper Property (Cougar, Hep, Pemberton, South McIntosh, NW Expo, and Rupert) and the encompassing “Northern Island Copper Belt” should be further systematically explored, including drilling on the South McIntosh target.
Recommendations
A 2 Phase, $5 million exploration work program is proposed for the Island Copper Property, summarized as follows:
Phase 1: | ||||
| 100 km. reconnaissance I.P. survey in Rupert, Pemberton Hills, Hep and Cougar areas | $ | 450,000 | ||
| 4,000 m. drilling to define open portions of the Hushamu deposit, including the adjacent South McIntosh area | $ | 1,250,000 | ||
| Re-analyses of existing core for Re and/or Mo, re-logging and geological modeling, revision of the mineral resource estimate subsequent to re-analyses and drilling | $ | 150,000 | ||
| Subtotal Phase 1 | $ | 1,850,000 | ||
| Contingency Phase 1 | $ | 150,000 | ||
| Total Phase 1 | $ | 2,000,000 | ||
| Phase 2: | ||||
| In-fill I.P. to define the target(s) that would emerge from Phase 1 | $ | 200,000 | ||
| 2,000 m. drilling to test any I.P. anomalies found in Phase 1 | $ | 500,000 | ||
| 1,000 m. additional drilling at Northwest Expo to follow up 2008 results | $ | 250,000 |
- 43 -
| 4,000 m. additional drilling to close off any extensions at Hushamu from Phase 1 | $ | 1,250,000 | ||
| Preliminary geotechnical, engineering, metallurgical, and environmental studies | $ | 600,000 | ||
| Subtotal Phase 2 | $ | 2,800,000 | ||
| Contingency Phase 2 | $ | 200,000 | ||
| Total Phase 2 | $ | 3,000,000 | ||
| Combined Phases 1 and 2 | $ | 5,000,000 |
- 44 -
REFERENCES
Arancibia, O. N., and Clark, A. H., 1996, Early magnetite-amphibole-plagioclase alteration-mineralization in the Island Copper porphyry copper-gold-molybdenum deposit, British Columbia: Economic Geology, v. 91, p. 402-438.
Baker, D., 2005a, 2005 Geological, Geochemical, Geophysical and Diamond Drilling Report on the Hushamu Property, British Columbia Assessment Report 28375.
Baker, D., 2005b, 2005 Geological, Geochemical, Geophysical and Diamond Drilling Report on the Rupert Property, British Columbia Assessment Report 28389.
Baird, J., 1970, Report on an Induced Polarization Survey. Ballinderry Exploration, British Columbia Assessment Report 2659, pp. 17.
Baird, J. G., 1968, Report on Induced Polarization Surveys on some Har and Expo Claims, Rupert Inlet Area, British Columbia. Riviera Mines Ltd., British Columbia Assessment Report 1681, pp. 8.
Clarke, G. A., 1986a, Assessment Report - Diamond Drilling on the Expo Group of Claims. Utah Mines Ltd., British Columbia Assessment Report 14393, pp. 20.
Clarke, G. A., 1986b, Assessment Report - Diamond Drilling on the Far East 87 Group of Claims. Utah Mines Ltd., British Columbia Assessment Report 15884, pp. 18.
Clarke, G. A., 1986c, Assessment Report - Geophysics, Geochemistry, and Diamond Drilling on the Apple 1-6, Mars, Star, Sun, Moon, and Mary Group of Claims. Utah Mines Ltd., British Columbia Assessment Report 15707A, pp. 63.
Dasler, P. G., 1994, Summary report on the McIntosh drilling program, March 1994, and the history of the Expo property, Northern Vancouver Island, British Columbia. Moraga Resources Ltd.
Dasler, P. G., Young, M. J., Giroux, G. H., and Perelló, J., 1995, The Hushamu porphyry copper-gold deposit, northern Vancouver Island, British Columbia, Porphyry Deposits of the Northwest Cordillera of North America. CIMM Special Volume 46, p. 367-376.
DeBari, S. M., Anderson, R. G., and Mortensen, J. K., 1999, Correlation among lower to upper crustal components in an island arc: the Jurassic Bonanza arc, Vancouver Island, Canada: Canadian Journal of Earth Sciences, v. 36, p. 1371-1413.
Fernie, A. D., 1991, Preliminary Study of Transportation Alternatives for Hushamu Zone Ore to the Island Copper Concentrator. Jordex Resources Inc.
Fingler, J., 1996, Compilation and Program Proposal for the Expo Property, Northern Vancouver Island, B.C. Jordex Resources Inc., pp. 48.
Fleming, J. A., 1985a, Assessment Report - Geochemical Survey on the Mars and Pluto Group of Claims. Utah Mines Ltd., British Columbia Assessment Report 15024, pp. 63.
Fleming, J. A., 1985b, Soil Geochemical Survey on the East 86 Group of Claims. Utah Mines Ltd., British Columbia Assessment Report 15077, pp. 84.
Fleming, J. A., 1986a, Assessment Report - Geochemical Survey on the Har and Expo Group of Claims. Utah Mines Ltd., British Columbia Assessment Report 15367, pp. 47.
- 45 -
Fleming, J. A., 1986b, Assessment Report - Soil Geochemical Survey on the East 86 Group of Claims. Utah Mines Ltd., British Columbia Assessment Report 15707F, pp. 56.
Fleming, J. A., 1988, Soil Geochemical Survey East 88 Group of Claims. BHP-Utah Mines Ltd., British Columbia Assessment Report 17368, pp. 23.
Fleming, J. A., 1993, Assessment Report - Diamond Drilling East-94 Group of Claims. BHP Minerals Canada, British Columbia Assessment Report 23276, pp. 53.
Gatchalian, F., 1994, Summary Report on the Northwest Expo Zone Drilling Program, Expo Property. BHP Minerals Canada Ltd., pp. 23.
Giroux, G. H., 1993, A Geostatistical Study of Hushamu Copper-Gold Deposit. Jordex Resources Inc.
Giroux, G. H., and Pawliuk, D. J., 2003, A Resource Estimate of Hushamu Copper-Gold Deposit. CRS Copper Resources Corp. and First Trimark Ventures Inc., pp. 50.
Graham, J. D., 1993, Mining Study Hushamu Copper-Gold Deposit, Quatsino District, Vancouver Island, British Columbia. Jordex Resources Inc.
Greene, A. R., Scoates, J. S., Nixon, G. T., and Weis, D., 2006, Picritic Lavas and Basal Sills in the Karmutsen Flood Basalt Province, Wrangellia, Northern Vancouver Island, BC. British Columbia Geological Survey, pp. 39-54.
Harrington, E., 1989, Report on the Expo Drilling and Geochemical Program, Red Dog Area. Moraga Resources Ltd.
Hedenquist, J. W., R., A. A., and Gonzalez-Urien, E., 2000, Exploration for Epithermal Gold Deposits: Reviews in Economic Geology, v. 13, p. 245-277.
Husband, R. W., 1989, Geochemical Report on the McIntosh Claim Group, Northern Vancouver Island, British Columbia, Canada. Moraga Resources Ltd., pp. 32.
Jones, H. M., 1988, A Report on the Expo Property. Holberg Inlet, Port Hardy Area, Vancouver Island, B.C. Moraga Resources Ltd., pp. 37.
Jones, H. M., 1990, Drill Program, Expo Property, Holberg Inlet, Vancouver Island, B.C. Moraga Resources Ltd., pp. 9.
Jones, H. M., 1991, Expo Property Revised Summary Report. Moraga Resources Ltd.
Klein, J., 2005, Comments on DIGHEM-V data collected in May, 2005 during a survey over the Hushamu Project Area, NW Vancouver Island, B.C. Equity Engineering Ltd., pp. 19.
Klein, J., 2006, Further Review of Geophysical Data Over Lumina Resources Corp's NW Expo Area, Hushamu Project, Vancouver Island, BC, pp. 4.
Lehtinen, J. and Awmack, H., 2007, 2007 Drilling Report on the Hushamu Property, Western Copper Corporation
Lundberg, H., 1948, Report on the Geophysical Survey of the HPH Group of Claims Vancouver Island British Columbia for the Western Mining and Development Syndicate, pp. 9.
Mantanion, H. R., 1983, Drilling Report on the Expo Group A. Utah Mines Ltd.
- 46 -
Melis, L.A., Cron, A.B. (1992) - “Hushamu Deposit - Preliminary Flotation Scoping Tests” - Private Report for Jordex Resources Inc. Sept. 11, 1992.
Minister of Mines, 1902, Annual Report of the Minister of Mines for the Year Ending 31st December, 1902, Province of British Columbia.
Minister of Mines, 1930, Annual Report of the Minister of Mines for the Year Ending 31st December, 1930, Province of British Columbia.
Minister of Mines, 1966, Annual Report of the Minister of Mines for the Year Ending 31st December, 1966, Province of British Columbia.
Muntanion, H. R., and Witherley, K. E., 1982, Geophysical, Geochemical and Drilling Report on the Expo Group A and Expo Groups B, C, and D. Utah Mines Ltd., pp. 222.
National Mineral Inventory card 092L11_Cu1.
Nixon, G. T., Hammack, J. L., Koyanagi, V. M., Payie, G. J., Haggart, J. W., Orchard, M. J., Tozer, T., Archibald, D. A., Friedman, R. M., Palfy, J., and Cordey, F., 2000, Geology of the Quatsino-Port McNeill Map Area, Northern Vancouver Island, B.C. Ministry of Energy and Mines Geoscience Map 2000-6.
Nixon, G. T., Hammack, J. L., Koyanagi, V. M., Payie, G. J., Panteleyev, A., Massey, N. W. D., Hamilton, J. V., and Haggart, J. W., 1994, Preliminary geology of the Quatsino - Port McNeil map areas, northern Vancouver Island, (92L 12, 11). Paper 1994-1, Geological Fieldwork 1993, British Columbia Geological Survey, p. 63-85.
Nixon, G. T., Hammack, J. L., Payie, G. J., Snyder, L. D., Koyanagi, V. M., Hamilton, J. V., Panteleyev, A., Massey, N. W. D., Haggart, J. W., and Archibald, D. A., 1997, Geology of Northern Vancouver Island: Preliminary Compilation, B.C. Ministry of Energy and Mines Open File 1997-13.
Nixon, G. T., Kelman, M. C., Stevenson, D., Stokes, L. A., and Johnston, K. A., 2006, Preliminary Geology of the Nimpkish Map Area (NTS 092L/07), Northern Vancouver Island, British Columbia. British Columbia Geological Survey, pp. 135-152.
Pawliuk, D. J., 1991a, Assessment report on the McIntosh drilling and geochemical program, "MAC GROUPS" mineral claims and on the Goodspeed drilling and geochemical program "GOOD" group mineral claims, Northern Vancouver Island, British Columbia. Moraga Resources Ltd., pp.
October 30, 1991.
Pawliuk, D. J., 1991b, Geochemical Assessment Report on the Goldilox Mineral Claim Group for Consolidated Paytel Ltd., pp. 12.
Pawliuk, D. J., 1991c, Assessment report on the McIntosh drilling program, "MAC GROUPS" claims, North Vancouver Island, British Columbia. Moraga Resources Ltd.
Pawliuk, D. J., 1992, Assessment report on the McIntosh diamond drilling program, "MAC GROUPS" mineral claims, Northern Vancouver Island, British Columbia. Moraga Resources Ltd., pp. 13.
Pawliuk, D. J., 1994, Assessment report on the McIntosh diamond drilling program, Expo mineral claims, Northern Vancouver Island, British Columbia. Moraga Resources Ltd., pp. 12.
- 47 -
Perelló, J., Fleming, J. A., O'Kane, K. P., Burt, P. D., Clarke, G. A., Himes, M. D., and Reeves, A. T., 1995, Porphyry copper-gold-molybdenum deposits in the Island Copper Cluster, northern Vancouver Island, British Columbia, Porphyry Deposits of the Northwest Cordillera of North America. CIMM Special Volume 46, p. 214-238.
Richards, J. B., 1990, Assessment and Drilling Report on the Red Dog Project, Vancouver Island, B.C. Moraga Resources Ltd., pp. 135.
Richards, J. B., 1991, Assessment and Drilling Report on the Red Dog Project, Vancouver Island, B.C. Moraga Resources Ltd., pp. 114.
Richards, M. A., Jones, D. L., Duncan, R. A., and DePaolo, D. J., 1991, A mantle plume initiation model for the Wrangellia flood basalt and other oceanic plateaus: Science, v. 254, p. 263-267.
Roscoe, W. E., and Cargill, D. G., 1996, Review of the Potential of the Expo Property, Vancouver Island, B.C. Jordex Resources Inc., pp. 20.
Scholz, M., 2008, Summary of M. Scholz October 20 to 23, 2008 Site Visit and Recommendations for the Geotechnical Program – Island Copper Project, Memorandum
Sillitoe, R. H., 1993, Gold-rich Porphyry Copper Deposits: Geological Model and Exploration Implications, in Kirkham, R. V., Sinclair, W. D., Thorpe, R. I., and Duke, J. M., eds., Mineral deposit modeling, 40. Geol. Ass. of Can., Spec. Pap., p. 465-478.
Simmons, A., 2005, Report on Core re-logging of the Hushamu Porphyry Cu-Au Deposit: Hole and Section Summaries, Findings and Preliminary Interpretations. Lumina Resources Corp., pp. 8.
Smith, P., 2005, DIGHEMV-DSP Survey for CRS Copper Corp., Hushamu Project Area, Vancouver Island, B.C. Fugro Airborne Surveys Corp., pp. 203.
Sutton, G. A., and Dasler, P. G., 1990, Assessment Report on the McIntosh Drilling Program "Mac Groups" Claims, Northern Vancouver Island, British Columbia, Canada. Moraga Resources Ltd., pp. 19.
Woods, D. V., 1987, Geophysical Report on Reconnaissance Surface and Borehole Pulse Electromagnetic Survey on the Expo Project, Vancouver Island. Moraga Resources Ltd.
Woolham, R. W., 1997, Report on a Combined Helicopter-Borne Electromagnetic, Magnetic, Radiometric and VLF-EM Survey, Expo Property. Jordex Resources Inc., pp. 68.
- 48 -

- 49 -
![]()
- 50 -

- 51 -

- 52 -
Table 9 - Significant Porphyry and Related Deposits on Vancouver Island


Page 1 of 5
Table 11 - Mineral Claims Status as of August 18, 2011
| Tenure No. | Claim Name | Owner | Tenure Type | Issue Date | Good To Date | Status | Area (ha) |
| 229789 | EXPO 1013 FR. | 135925 (100%) | Legacy Claim | 1983/aug/22 | 2012/jan/13 | GOOD | 25 |
| 229790 | EXPO 1014 FR. | 135925 (100%) | Legacy Claim | 1983/aug/22 | 2012/jan/13 | GOOD | 25 |
| 229791 | EXPO 1015 FR. | 135925 (100%) | Legacy Claim | 1983/aug/22 | 2012/jan/13 | GOOD | 25 |
| 231651 | HEP #36 | 135925 (100%) | Legacy Claim | 1966/sep/20 | 2012/jan/13 | GOOD | 25 |
| 231667 | HEP #54 | 135925 (100%) | Legacy Claim | 1966/sep/20 | 2012/jan/13 | GOOD | 25 |
| 231668 | HEP #55 | 135925 (100%) | Legacy Claim | 1966/sep/20 | 2012/jan/13 | GOOD | 25 |
| 231669 | HEP #56 | 135925 (100%) | Legacy Claim | 1966/sep/20 | 2012/jan/13 | GOOD | 25 |
| 231671 | HEP #58 | 135925 (100%) | Legacy Claim | 1966/sep/20 | 2012/jan/13 | GOOD | 25 |
| 231672 | HEP #59 | 135925 (100%) | Legacy Claim | 1966/sep/20 | 2012/jan/13 | GOOD | 25 |
| 231933 | EXPO 190 | 135925 (100%) | Legacy Claim | 1967/oct/10 | 2012/jan/13 | GOOD | 25 |
| 231934 | EXPO 191 | 135925 (100%) | Legacy Claim | 1967/oct/10 | 2012/jan/13 | GOOD | 25 |
| 231961 | EXPO 218 | 135925 (100%) | Legacy Claim | 1967/oct/10 | 2012/jan/13 | GOOD | 25 |
| 231963 | EXPO 220 | 135925 (100%) | Legacy Claim | 1967/oct/10 | 2012/jan/13 | GOOD | 25 |
| 231965 | EXPO 222 | 135925 (100%) | Legacy Claim | 1967/oct/10 | 2012/jan/13 | GOOD | 25 |
| 231966 | EXPO 223 | 135925 (100%) | Legacy Claim | 1967/oct/10 | 2012/jan/13 | GOOD | 25 |
| 231968 | EXPO 225 | 135925 (100%) | Legacy Claim | 1967/oct/10 | 2012/jan/13 | GOOD | 25 |
| 231980 | EXPO 227 | 135925 (100%) | Legacy Claim | 1967/oct/19 | 2012/jan/13 | GOOD | 25 |
| 231982 | EXPO 229 | 135925 (100%) | Legacy Claim | 1967/oct/19 | 2012/jan/13 | GOOD | 25 |
| 231984 | EXPO 231 | 135925 (100%) | Legacy Claim | 1967/oct/19 | 2012/jan/13 | GOOD | 25 |
| 231990 | EXPO 237 | 135925 (100%) | Legacy Claim | 1967/oct/19 | 2012/jan/13 | GOOD | 25 |
| 231991 | EXPO 238 | 135925 (100%) | Legacy Claim | 1967/oct/19 | 2012/jan/13 | GOOD | 25 |
| 231995 | EXPO 242 | 135925 (100%) | Legacy Claim | 1967/oct/19 | 2012/jan/13 | GOOD | 25 |
| 231997 | EXPO 244 | 135925 (100%) | Legacy Claim | 1967/oct/19 | 2012/jan/13 | GOOD | 25 |
| 232000 | EXPO 247 | 135925 (100%) | Legacy Claim | 1967/oct/19 | 2012/jan/13 | GOOD | 25 |
| 232001 | EXPO 248 | 135925 (100%) | Legacy Claim | 1967/oct/19 | 2012/jan/13 | GOOD | 25 |
| 232002 | EXPO 249 | 135925 (100%) | Legacy Claim | 1967/oct/19 | 2012/jan/13 | GOOD | 25 |
| 232004 | EXPO 251 | 135925 (100%) | Legacy Claim | 1967/oct/19 | 2012/jan/13 | GOOD | 25 |
| 232005 | EXPO 252 | 135925 (100%) | Legacy Claim | 1967/oct/19 | 2012/jan/13 | GOOD | 25 |
| 232006 | EXPO 253 | 135925 (100%) | Legacy Claim | 1967/oct/19 | 2012/jan/13 | GOOD | 25 |
| 232007 | EXPO 254 | 135925 (100%) | Legacy Claim | 1967/oct/19 | 2012/jan/13 | GOOD | 25 |
| 232008 | EXPO 255 | 135925 (100%) | Legacy Claim | 1967/oct/19 | 2012/jan/13 | GOOD | 25 |
| 232011 | EXPO 258 | 135925 (100%) | Legacy Claim | 1967/oct/19 | 2012/jan/13 | GOOD | 25 |
| 232015 | EXPO 262 | 135925 (100%) | Legacy Claim | 1967/oct/19 | 2012/jan/13 | GOOD | 25 |
| 232017 | EXPO 264 | 135925 (100%) | Legacy Claim | 1967/oct/19 | 2012/jan/13 | GOOD | 25 |
| 232019 | EXPO 266 | 135925 (100%) | Legacy Claim | 1967/oct/19 | 2012/jan/13 | GOOD | 25 |
| 232020 | EXPO 267 | 135925 (100%) | Legacy Claim | 1967/oct/19 | 2012/jan/13 | GOOD | 25 |
| 232021 | EXPO 268 | 135925 (100%) | Legacy Claim | 1967/oct/19 | 2012/jan/13 | GOOD | 25 |
| 232022 | EXPO 269 | 135925 (100%) | Legacy Claim | 1967/oct/19 | 2012/jan/13 | GOOD | 25 |
| 232024 | EXPO 271 | 135925 (100%) | Legacy Claim | 1967/oct/19 | 2012/jan/13 | GOOD | 25 |
| 232025 | EXPO 272 | 135925 (100%) | Legacy Claim | 1967/oct/19 | 2012/jan/13 | GOOD | 25 |
| 232026 | EXPO 273 | 135925 (100%) | Legacy Claim | 1967/oct/19 | 2012/jan/13 | GOOD | 25 |
| 232027 | EXPO 274 | 135925 (100%) | Legacy Claim | 1967/oct/19 | 2012/jan/13 | GOOD | 25 |
| 232028 | EXPO 275 | 135925 (100%) | Legacy Claim | 1967/oct/19 | 2012/jan/13 | GOOD | 25 |
| 232030 | EXPO 278 | 135925 (100%) | Legacy Claim | 1967/oct/19 | 2012/jan/13 | GOOD | 25 |
| 232037 | EXPO 285 | 135925 (100%) | Legacy Claim | 1967/oct/19 | 2012/jan/13 | GOOD | 25 |
Page 2 of 5
Table 11 - Mineral Claims Status as of August 18, 2011
| Tenure No. | Claim Name | Owner | Tenure Type | Issue Date | Good To Date | Status | Area (ha) |
| 232041 | EXPO 289 | 135925 (100%) | Legacy Claim | 1967/oct/19 | 2012/jan/13 | GOOD | 25 |
| 232044 | EXPO 292 | 135925 (100%) | Legacy Claim | 1967/oct/19 | 2012/jan/13 | GOOD | 25 |
| 232045 | EXPO 293 | 135925 (100%) | Legacy Claim | 1967/oct/19 | 2012/jan/13 | GOOD | 25 |
| 232046 | EXPO 294 | 135925 (100%) | Legacy Claim | 1967/oct/19 | 2012/jan/13 | GOOD | 25 |
| 232105 | EXPO 312 | 135925 (100%) | Legacy Claim | 1967/nov/13 | 2012/jan/13 | GOOD | 25 |
| 232107 | EXPO 314 | 135925 (100%) | Legacy Claim | 1967/nov/13 | 2012/jan/13 | GOOD | 25 |
| 232220 | EXPO 326 | 135925 (100%) | Legacy Claim | 1967/dec/18 | 2012/jan/13 | GOOD | 25 |
| 232228 | EXPO 504 FR | 135925 (100%) | Legacy Claim | 1967/dec/18 | 2012/jan/13 | GOOD | 25 |
| 232275 | EXPO 1008 FR | 135925 (100%) | Legacy Claim | 1968/dec/05 | 2012/jan/13 | GOOD | 25 |
| 232276 | EXPO 1011 FR | 135925 (100%) | Legacy Claim | 1968/dec/05 | 2012/jan/13 | GOOD | 25 |
| 232277 | EXPO 1012 FR | 135925 (100%) | Legacy Claim | 1968/dec/05 | 2012/jan/13 | GOOD | 25 |
| 232306 | DON 9 FR. | 135925 (100%) | Legacy Claim | 1969/nov/21 | 2012/jan/13 | GOOD | 25 |
| 232307 | DON 10 FR. | 135925 (100%) | Legacy Claim | 1969/nov/21 | 2012/jan/13 | GOOD | 25 |
| 232308 | DON 11 FR. | 135925 (100%) | Legacy Claim | 1969/nov/21 | 2012/jan/13 | GOOD | 25 |
| 232309 | DON 12 FR. | 135925 (100%) | Legacy Claim | 1969/nov/21 | 2012/jan/13 | GOOD | 25 |
| 232310 | DON 13 FR. | 135925 (100%) | Legacy Claim | 1969/nov/21 | 2013/jan/13 | GOOD | 25 |
| 371777 | APPLE BAY THREE | 135925 (100%) | Legacy Claim | 1999/sep/18 | 2012/jan/13 | GOOD | 200 |
| 374744 | APPLE BAY FOUR | 135925 (100%) | Legacy Claim | 2000/mar/11 | 2012/jan/13 | GOOD | 400 |
| 377240 | APPLE BAY TWO | 135925 (100%) | Legacy Claim | 2000/may/17 | 2012/jan/13 | GOOD | 500 |
| 394718 | APPLE BAY NINETEEN | 135925 (100%) | Legacy Claim | 2002/jul/05 | 2012/jan/13 | GOOD | 500 |
| 398335 | APPLE BAY TWENTY | 135925 (100%) | Legacy Claim | 2002/nov/16 | 2012/jan/13 | GOOD | 500 |
| 402033 | APPLE BAY TWENTY-THREE | 135925 (100%) | Legacy Claim | 2003/apr/26 | 2012/jan/13 | GOOD | 400 |
| 402037 | APPLE BAY TWENTY SEVEN | 135925 (100%) | Legacy Claim | 2003/apr/29 | 2012/jan/13 | GOOD | 250 |
| 402513 | NORTHWEST 900 | 135925 (100%) | Legacy Claim | 2003/may/27 | 2012/jan/13 | GOOD | 250 |
| 405216 | NORTHWEST 901 | 135925 (100%) | Legacy Claim | 2003/sep/19 | 2012/jan/13 | GOOD | 25 |
| 501677 | 135925 (100%) | Cell Claim | 2005/jan/12 | 2012/jan/13 | GOOD | 81.854 | |
| 506021 | Wanakana Central | 135925 (100%) | Cell Claim | 2005/feb/06 | 2012/jan/13 | GOOD | 348.31 |
| 509465 | mo 1 | 135925 (100%) | Cell Claim | 2005/mar/23 | 2011/nov/21 | GOOD | 492.27 |
| 509466 | mo 2 | 135925 (100%) | Cell Claim | 2005/mar/23 | 2011/nov/21 | GOOD | 492.52 |
| 509467 | mo 3 | 135925 (100%) | Cell Claim | 2005/mar/23 | 2011/nov/21 | GOOD | 492.26 |
| 509468 | mo 4 | 135925 (100%) | Cell Claim | 2005/mar/23 | 2011/nov/21 | GOOD | 492.52 |
| 509469 | mo 5 | 135925 (100%) | Cell Claim | 2005/mar/23 | 2011/nov/21 | GOOD | 492.26 |
| 509470 | mo 6 | 135925 (100%) | Cell Claim | 2005/mar/23 | 2011/nov/21 | GOOD | 492.51 |
| 509471 | mo 7 | 135925 (100%) | Cell Claim | 2005/mar/23 | 2011/nov/21 | GOOD | 492.26 |
| 509472 | mo 8 | 135925 (100%) | Cell Claim | 2005/mar/23 | 2011/nov/21 | GOOD | 492.52 |
| 509474 | mo 9 | 135925 (100%) | Cell Claim | 2005/mar/23 | 2011/nov/21 | GOOD | 492.26 |
| 509475 | mo 10 | 135925 (100%) | Cell Claim | 2005/mar/23 | 2011/nov/21 | GOOD | 492.52 |
| 509476 | mo 11 | 135925 (100%) | Cell Claim | 2005/mar/23 | 2011/nov/21 | GOOD | 492.26 |
| 509479 | mo 12 | 135925 (100%) | Cell Claim | 2005/mar/23 | 2011/nov/21 | GOOD | 492.52 |
| 509480 | mo 13 | 135925 (100%) | Cell Claim | 2005/mar/23 | 2011/nov/21 | GOOD | 492.25 |
| 509481 | mo 14 | 135925 (100%) | Cell Claim | 2005/mar/23 | 2011/nov/21 | GOOD | 492.52 |
| 509482 | mo 15 | 135925 (100%) | Cell Claim | 2005/mar/23 | 2011/nov/21 | GOOD | 492.24 |
| 509483 | mo 16 | 135925 (100%) | Cell Claim | 2005/mar/23 | 2011/nov/21 | GOOD | 492.51 |
| 509485 | mo 17 | 135925 (100%) | Cell Claim | 2005/mar/23 | 2011/nov/21 | GOOD | 492.23 |
| 509486 | mo 18 | 135925 (100%) | Cell Claim | 2005/mar/23 | 2011/nov/21 | GOOD | 492.51 |
Page 3 of 5
Table 11 - Mineral Claims Status as of August 18, 2011
| Tenure No. | Claim Name | Owner | Tenure Type | Issue Date | Good To Date | Status | Area (ha) |
| 509487 | mo 19 | 135925 (100%) | Cell Claim | 2005/mar/23 | 2011/nov/21 | GOOD | 492.37 |
| 512085 | FILL 1 | 135925 (100%) | Cell Claim | 2005/may/05 | 2012/feb/03 | GOOD | 511.67 |
| 512087 | FILL 2 | 135925 (100%) | Cell Claim | 2005/may/05 | 2012/feb/03 | GOOD | 511.9 |
| 512088 | FILL 3 | 135925 (100%) | Cell Claim | 2005/may/05 | 2012/feb/03 | GOOD | 143.38 |
| 512089 | FILL 4 | 135925 (100%) | Cell Claim | 2005/may/05 | 2012/feb/03 | GOOD | 511.95 |
| 512091 | FILL 5 | 135925 (100%) | Cell Claim | 2005/may/05 | 2012/feb/03 | GOOD | 511.96 |
| 512092 | FILL 6 | 135925 (100%) | Cell Claim | 2005/may/05 | 2012/feb/03 | GOOD | 512.08 |
| 512093 | FILL 7 | 135925 (100%) | Cell Claim | 2005/may/05 | 2012/feb/03 | GOOD | 512.2 |
| 512094 | FILL 8 | 135925 (100%) | Cell Claim | 2005/may/05 | 2012/feb/03 | GOOD | 512.23 |
| 512095 | FILL 9 | 135925 (100%) | Cell Claim | 2005/may/05 | 2012/feb/03 | GOOD | 163.89 |
| 512096 | FILL 10 | 135925 (100%) | Cell Claim | 2005/may/05 | 2012/jan/13 | GOOD | 512.77 |
| 512102 | FILL 11 | 135925 (100%) | Cell Claim | 2005/may/05 | 2012/feb/03 | GOOD | 225.59 |
| 512103 | FILL 12 | 135925 (100%) | Cell Claim | 2005/may/05 | 2011/nov/21 | GOOD | 123.05 |
| 512104 | FILL 13 | 135925 (100%) | Cell Claim | 2005/may/05 | 2012/feb/03 | GOOD | 430.72 |
| 512105 | FILL 14 | 135925 (100%) | Cell Claim | 2005/may/05 | 2012/feb/03 | GOOD | 328.07 |
| 512107 | FILL 15 | 135925 (100%) | Cell Claim | 2005/may/05 | 2012/feb/03 | GOOD | 61.509 |
| 512108 | FILL 15 | 135925 (100%) | Cell Claim | 2005/may/05 | 2012/feb/03 | GOOD | 512.25 |
| 512109 | FILL 16 | 135925 (100%) | Cell Claim | 2005/may/05 | 2012/feb/03 | GOOD | 512.22 |
| 512110 | FILL 17 | 135925 (100%) | Cell Claim | 2005/may/05 | 2012/feb/03 | GOOD | 511.95 |
| 512111 | FILL 18 | 135925 (100%) | Cell Claim | 2005/may/05 | 2012/feb/03 | GOOD | 511.85 |
| 512113 | FILL 18 | 135925 (100%) | Cell Claim | 2005/may/05 | 2012/feb/03 | GOOD | 512.04 |
| 512114 | FILL 19 | 135925 (100%) | Cell Claim | 2005/may/05 | 2012/feb/03 | GOOD | 511.87 |
| 512115 | FILL 20 | 135925 (100%) | Cell Claim | 2005/may/05 | 2012/feb/03 | GOOD | 368.51 |
| 512116 | FILL 21 | 135925 (100%) | Cell Claim | 2005/may/05 | 2012/feb/03 | GOOD | 225.11 |
| 512117 | FILL 22 | 135925 (100%) | Cell Claim | 2005/may/05 | 2012/feb/03 | GOOD | 122.76 |
| 512118 | FILL 23 | 135925 (100%) | Cell Claim | 2005/may/05 | 2012/feb/03 | GOOD | 164.17 |
| 512120 | FILL 24 | 135925 (100%) | Cell Claim | 2005/may/05 | 2012/feb/03 | GOOD | 245.8 |
| 512122 | FILL 25 | 135925 (100%) | Cell Claim | 2005/may/05 | 2012/feb/03 | GOOD | 245.75 |
| 512952 | 135925 (100%) | Cell Claim | 2005/may/18 | 2017/jan/13 | GOOD | 81.972 | |
| 512963 | 135925 (100%) | Cell Claim | 2005/may/18 | 2017/jan/13 | GOOD | 81.972 | |
| 512964 | 135925 (100%) | Cell Claim | 2005/may/18 | 2017/jan/13 | GOOD | 81.971 | |
| 512966 | 135925 (100%) | Cell Claim | 2005/may/18 | 2017/jan/13 | GOOD | 61.479 | |
| 512967 | 135925 (100%) | Cell Claim | 2005/may/18 | 2017/jan/13 | GOOD | 61.478 | |
| 512968 | 135925 (100%) | Cell Claim | 2005/may/18 | 2017/jan/13 | GOOD | 61.471 | |
| 512972 | 135925 (100%) | Cell Claim | 2005/may/18 | 2017/jan/13 | GOOD | 81.949 | |
| 512980 | 135925 (100%) | Cell Claim | 2005/may/19 | 2017/jan/13 | GOOD | 81.933 | |
| 512983 | 135925 (100%) | Cell Claim | 2005/may/19 | 2017/jan/13 | GOOD | 81.948 | |
| 512984 | 135925 (100%) | Cell Claim | 2005/may/19 | 2017/jan/13 | GOOD | 40.969 | |
| 512986 | 135925 (100%) | Cell Claim | 2005/may/19 | 2017/jan/13 | GOOD | 40.96 | |
| 512988 | 135925 (100%) | Cell Claim | 2005/may/19 | 2017/jan/13 | GOOD | 40.961 | |
| 512989 | 135925 (100%) | Cell Claim | 2005/may/19 | 2017/jan/13 | GOOD | 20.48 | |
| 512990 | 135925 (100%) | Cell Claim | 2005/may/19 | 2017/jan/13 | GOOD | 40.964 | |
| 512993 | 135925 (100%) | Cell Claim | 2005/may/19 | 2017/jan/13 | GOOD | 40.969 | |
| 512994 | 135925 (100%) | Cell Claim | 2005/may/19 | 2017/jan/13 | GOOD | 81.957 | |
| 512996 | 135925 (100%) | Cell Claim | 2005/may/19 | 2017/jan/13 | GOOD | 81.957 |
Page 4 of 5
Table 11 - Mineral Claims Status as of August 18, 2011
| Tenure No. | Claim Name | Owner | Tenure Type | Issue Date | Good To Date | Status | Area (ha) |
| 512999 | 135925 (100%) | Cell Claim | 2005/may/19 | 2017/jan/13 | GOOD | 40.973 | |
| 513006 | 135925 (100%) | Cell Claim | 2005/may/19 | 2017/jan/13 | GOOD | 20.49 | |
| 513013 | 135925 (100%) | Cell Claim | 2005/may/19 | 2017/jan/13 | GOOD | 40.967 | |
| 513026 | 135925 (100%) | Cell Claim | 2005/may/19 | 2017/jan/13 | GOOD | 20.486 | |
| 513053 | 135925 (100%) | Cell Claim | 2005/may/19 | 2017/jan/13 | GOOD | 61.439 | |
| 513057 | 135925 (100%) | Cell Claim | 2005/may/19 | 2017/jan/13 | GOOD | 40.957 | |
| 513060 | 135925 (100%) | Cell Claim | 2005/may/19 | 2017/jan/13 | GOOD | 40.964 | |
| 513062 | 135925 (100%) | Cell Claim | 2005/may/19 | 2017/jan/13 | GOOD | 40.97 | |
| 513065 | 135925 (100%) | Cell Claim | 2005/may/19 | 2017/jan/13 | GOOD | 61.458 | |
| 513066 | 135925 (100%) | Cell Claim | 2005/may/19 | 2017/jan/13 | GOOD | 20.487 | |
| 513067 | 135925 (100%) | Cell Claim | 2005/may/19 | 2017/jan/13 | GOOD | 81.957 | |
| 513068 | 135925 (100%) | Cell Claim | 2005/may/19 | 2017/jan/13 | GOOD | 81.965 | |
| 513071 | 135925 (100%) | Cell Claim | 2005/may/19 | 2017/jan/13 | GOOD | 81.951 | |
| 513072 | 135925 (100%) | Cell Claim | 2005/may/19 | 2017/jan/13 | GOOD | 81.934 | |
| 513075 | 135925 (100%) | Cell Claim | 2005/may/19 | 2017/jan/13 | GOOD | 61.443 | |
| 513076 | 135925 (100%) | Cell Claim | 2005/may/19 | 2017/jan/13 | GOOD | 40.961 | |
| 513077 | 135925 (100%) | Cell Claim | 2005/may/19 | 2017/jan/13 | GOOD | 20.48 | |
| 513078 | 135925 (100%) | Cell Claim | 2005/may/19 | 2017/jan/13 | GOOD | 81.934 | |
| 513080 | 135925 (100%) | Cell Claim | 2005/may/19 | 2017/jan/13 | GOOD | 20.487 | |
| 513082 | 135925 (100%) | Cell Claim | 2005/may/19 | 2017/jan/13 | GOOD | 40.957 | |
| 513086 | 135925 (100%) | Cell Claim | 2005/may/19 | 2017/jan/13 | GOOD | 20.479 | |
| 513087 | 135925 (100%) | Cell Claim | 2005/may/19 | 2017/jan/13 | GOOD | 40.953 | |
| 513089 | 135925 (100%) | Cell Claim | 2005/may/19 | 2017/jan/13 | GOOD | 40.953 | |
| 513090 | 135925 (100%) | Cell Claim | 2005/may/19 | 2017/jan/13 | GOOD | 40.957 | |
| 513091 | 135925 (100%) | Cell Claim | 2005/may/19 | 2017/jan/13 | GOOD | 61.432 | |
| 513092 | 135925 (100%) | Cell Claim | 2005/may/19 | 2017/jan/13 | GOOD | 40.95 | |
| 513093 | 135925 (100%) | Cell Claim | 2005/may/19 | 2017/jan/13 | GOOD | 81.896 | |
| 513094 | 135925 (100%) | Cell Claim | 2005/may/19 | 2017/jan/13 | GOOD | 81.881 | |
| 513104 | 135925 (100%) | Cell Claim | 2005/may/19 | 2017/jan/13 | GOOD | 20.471 | |
| 513107 | 135925 (100%) | Cell Claim | 2005/may/19 | 2017/jan/13 | GOOD | 40.948 | |
| 513108 | 135925 (100%) | Cell Claim | 2005/may/19 | 2017/jan/13 | GOOD | 40.962 | |
| 513109 | 135925 (100%) | Cell Claim | 2005/may/19 | 2017/jan/13 | GOOD | 184.29 | |
| 513172 | 135925 (100%) | Cell Claim | 2005/may/21 | 2017/jan/13 | GOOD | 40.981 | |
| 513183 | CONNECT01 | 135925 (100%) | Cell Claim | 2005/may/22 | 2011/nov/21 | GOOD | 225.53 |
| 513758 | RED DOG NORTH | 135925 (100%) | Cell Claim | 2005/jun/01 | 2012/jan/13 | GOOD | 429.61 |
| 513760 | HEP 2.2 | 135925 (100%) | Cell Claim | 2005/jun/01 | 2012/jan/13 | GOOD | 20.464 |
| 513909 | 135925 (100%) | Cell Claim | 2005/jun/03 | 2012/jan/13 | GOOD | 511.7 | |
| 513910 | 135925 (100%) | Cell Claim | 2005/jun/03 | 2012/jan/13 | GOOD | 347.91 | |
| 513911 | 135925 (100%) | Cell Claim | 2005/jun/03 | 2012/jan/13 | GOOD | 61.383 | |
| 513912 | 135925 (100%) | Cell Claim | 2005/jun/03 | 2012/jan/13 | GOOD | 40.921 | |
| 513913 | 135925 (100%) | Cell Claim | 2005/jun/03 | 2012/jan/13 | GOOD | 20.461 | |
| 513914 | 135925 (100%) | Cell Claim | 2005/jun/03 | 2012/jan/13 | GOOD | 81.853 | |
| 513926 | 135925 (100%) | Cell Claim | 2005/jun/04 | 2012/jan/13 | GOOD | 286.51 | |
| 513927 | 135925 (100%) | Cell Claim | 2005/jun/04 | 2012/jan/13 | GOOD | 409.3 | |
| 513929 | 135925 (100%) | Cell Claim | 2005/jun/04 | 2012/jan/13 | GOOD | 430.36 |
Page 5 of 5
Table 11 - Mineral Claims Status as of August 18, 2011
| Tenure No. | Claim Name | Owner | Tenure Type | Issue Date | Good To Date | Status | Area (ha) |
| 513930 | 135925 (100%) | Cell Claim | 2005/jun/04 | 2012/jan/13 | GOOD | 389.32 | |
| 513931 | 135925 (100%) | Cell Claim | 2005/jun/04 | 2012/jan/13 | GOOD | 696.95 | |
| 515275 | 135925 (100%) | Cell Claim | 2005/jun/25 | 2012/jan/13 | GOOD | 470.91 | |
| 515276 | 135925 (100%) | Cell Claim | 2005/jun/25 | 2012/jan/13 | GOOD | 655.55 | |
| 515277 | 135925 (100%) | Cell Claim | 2005/jun/25 | 2012/jan/13 | GOOD | 245.85 | |
| 515278 | 135925 (100%) | Cell Claim | 2005/jun/25 | 2012/jan/13 | GOOD | 655.92 | |
| 515279 | 135925 (100%) | Cell Claim | 2005/jun/25 | 2012/jan/13 | GOOD | 184.47 | |
| 515280 | 135925 (100%) | Cell Claim | 2005/jun/25 | 2012/jan/13 | GOOD | 471.44 | |
| 515281 | 135925 (100%) | Cell Claim | 2005/jun/25 | 2012/jan/13 | GOOD | 614.93 | |
| 515282 | 135925 (100%) | Cell Claim | 2005/jun/25 | 2012/jan/13 | GOOD | 676.19 | |
| 515283 | 135925 (100%) | Cell Claim | 2005/jun/25 | 2012/jan/13 | GOOD | 553.44 | |
| 515284 | 135925 (100%) | Cell Claim | 2005/jun/25 | 2012/jan/13 | GOOD | 902.62 | |
| 515285 | 135925 (100%) | Cell Claim | 2005/jun/25 | 2012/jan/13 | GOOD | 102.42 | |
| 515313 | 135925 (100%) | Cell Claim | 2005/jun/26 | 2012/jan/13 | GOOD | 163.85 | |
| 515593 | 135925 (100%) | Cell Claim | 2005/jun/30 | 2012/jan/13 | GOOD | 656.14 | |
| 515594 | 135925 (100%) | Cell Claim | 2005/jun/30 | 2012/jan/13 | GOOD | 164.03 | |
| 515595 | 135925 (100%) | Cell Claim | 2005/jun/30 | 2012/jan/13 | GOOD | 615.08 | |
| 515596 | 135925 (100%) | Cell Claim | 2005/jun/30 | 2012/jan/13 | GOOD | 451.08 | |
| 516074 | 135925 (100%) | Cell Claim | 2005/jul/05 | 2012/jan/13 | GOOD | 553.63 | |
| 516075 | 135925 (100%) | Cell Claim | 2005/jul/05 | 2012/jan/13 | GOOD | 102.38 | |
| 516076 | 135925 (100%) | Cell Claim | 2005/jul/05 | 2012/jan/13 | GOOD | 245.87 | |
| 516077 | 135925 (100%) | Cell Claim | 2005/jul/05 | 2012/jan/13 | GOOD | 389.65 | |
| 516078 | 135925 (100%) | Cell Claim | 2005/jul/05 | 2012/jan/13 | GOOD | 286.99 | |
| 516079 | QUATSE LAKE TOO | 135925 (100%) | Cell Claim | 2005/jul/05 | 2012/jan/13 | GOOD | 143.49 |
| 516081 | 135925 (100%) | Cell Claim | 2005/jul/05 | 2012/jan/13 | GOOD | 491.18 | |
| 516527 | 135925 (100%) | Cell Claim | 2005/jul/09 | 2012/jan/13 | GOOD | 163.94 | |
| 516529 | APPLE BAY 9PLUS | 135925 (100%) | Cell Claim | 2005/jul/09 | 2012/jan/13 | GOOD | 20.49 |
| 516930 | NORTH RG | 135925 (100%) | Cell Claim | 2005/jul/11 | 2012/jan/13 | GOOD | 204.54 |
| 517055 | NEW 402513 | 135925 (100%) | Cell Claim | 2005/jul/12 | 2012/jan/13 | GOOD | 143.2 |
| 517076 | NEW RD | 135925 (100%) | Cell Claim | 2005/jul/12 | 2012/jan/13 | GOOD | 20.462 |
| 517123 | RD NORTHEAST | 135925 (100%) | Cell Claim | 2005/jul/12 | 2012/jan/13 | GOOD | 204.6 |
| 517213 | HOLBERG | 135925 (100%) | Cell Claim | 2005/jul/12 | 2012/jan/13 | GOOD | 143.52 |
| 517236 | NUMMMIS | 135925 (100%) | Cell Claim | 2005/jul/12 | 2012/jan/13 | GOOD | 41.018 |
| 517541 | APPLE BAY TEN | 135925 (100%) | Cell Claim | 2005/jul/12 | 2012/jan/13 | GOOD | 20.508 |
| 518531 | 135925 (100%) | Cell Claim | 2005/jul/29 | 2012/feb/03 | GOOD | 511.76 | |
| 525702 | HUSHAMU NORTHEAST | 135925 (100%) | Cell Claim | 2006/jan/17 | 2012/jan/13 | GOOD | 307.12 |

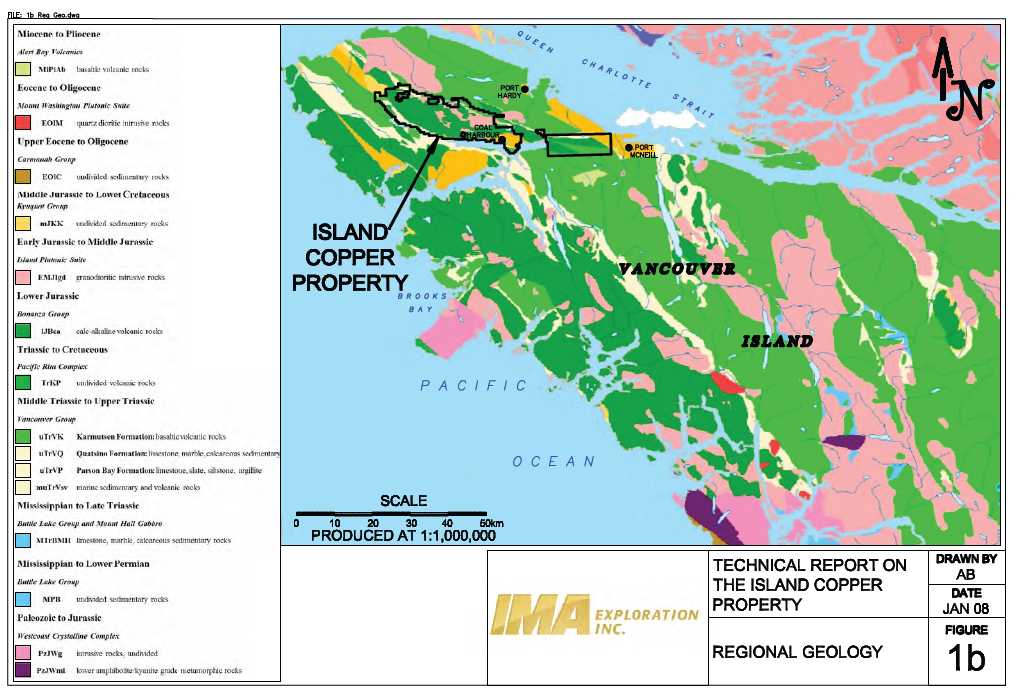

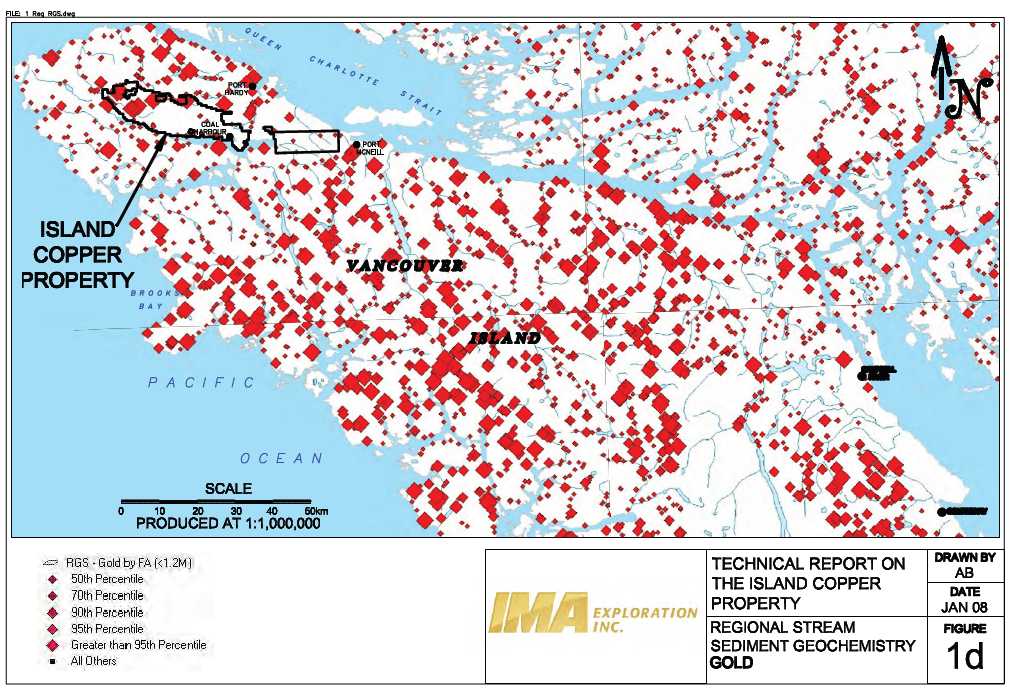


![]()


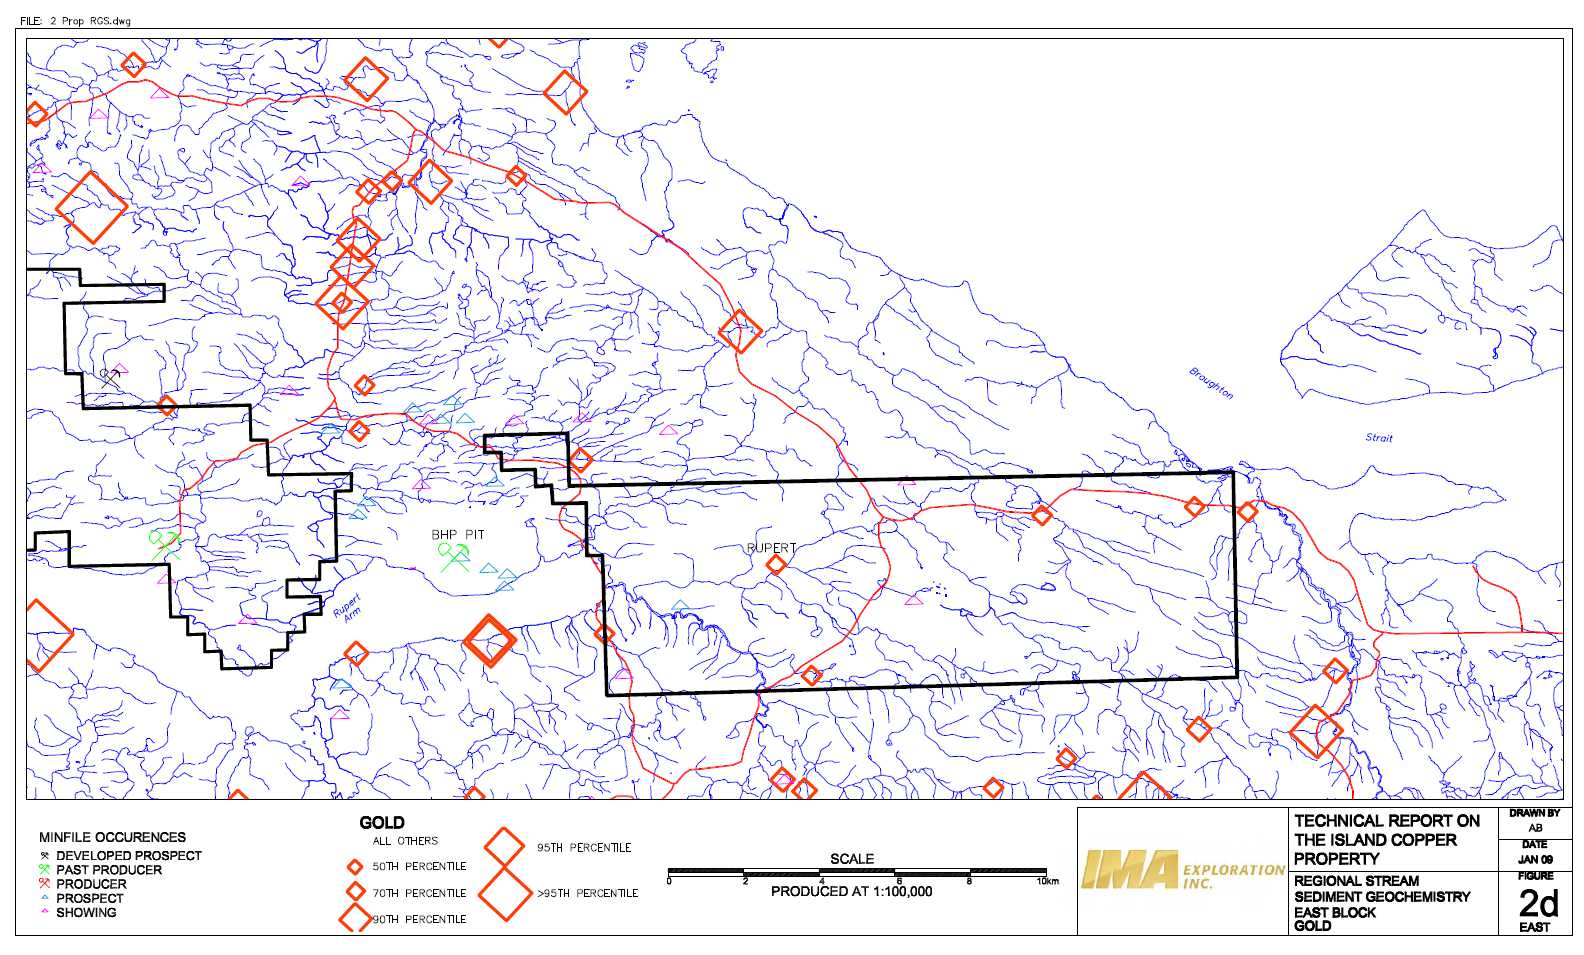


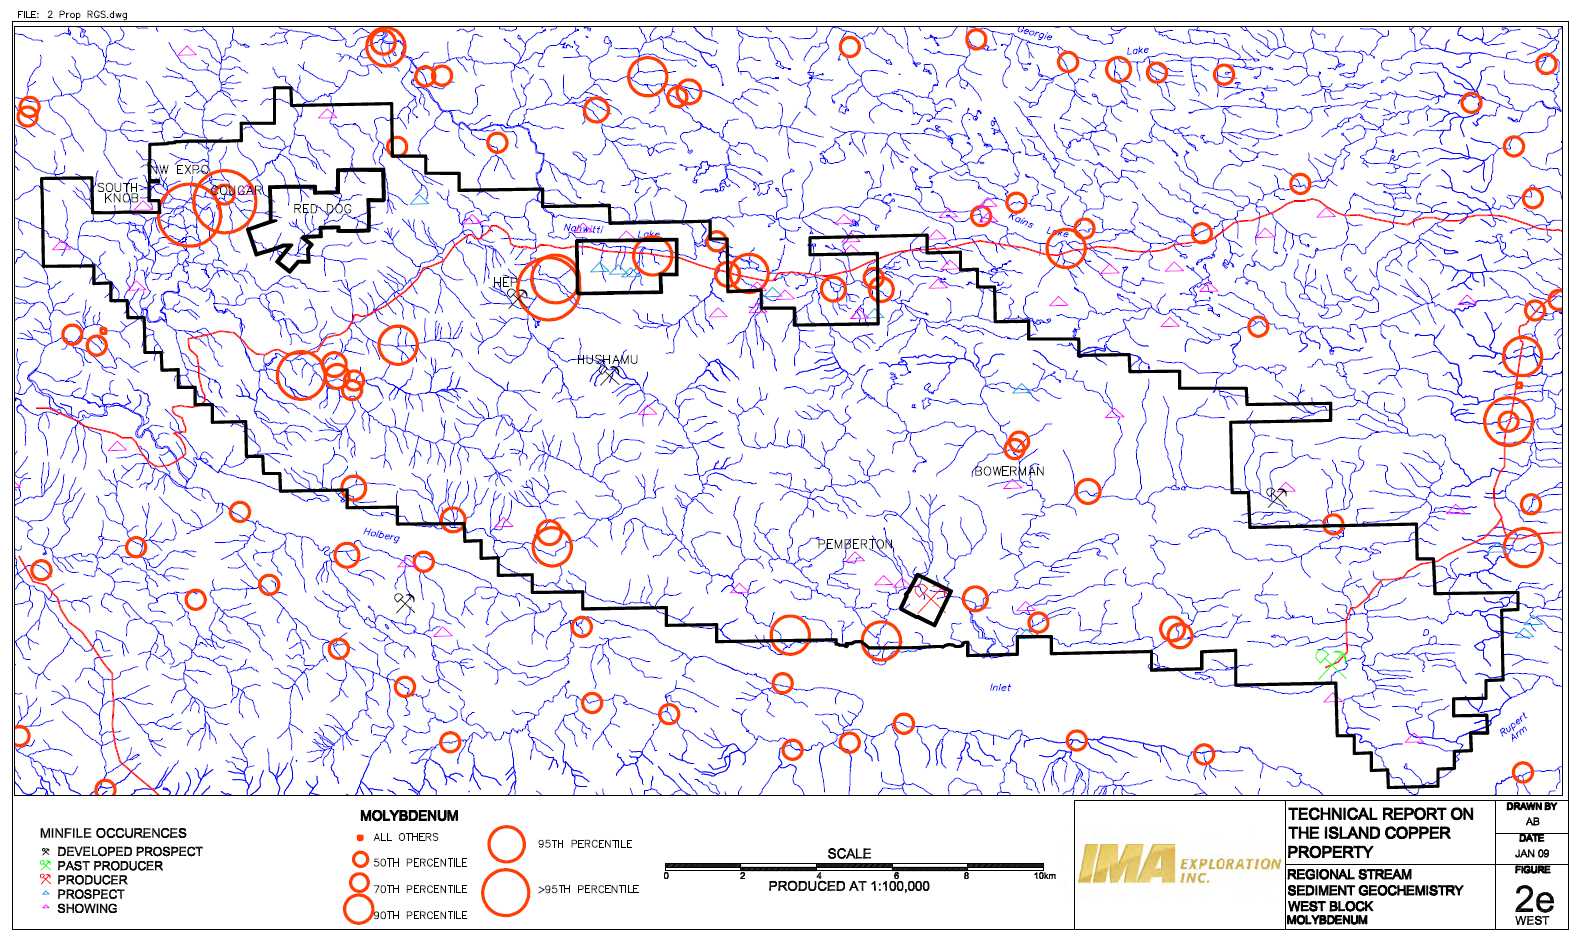

![]()


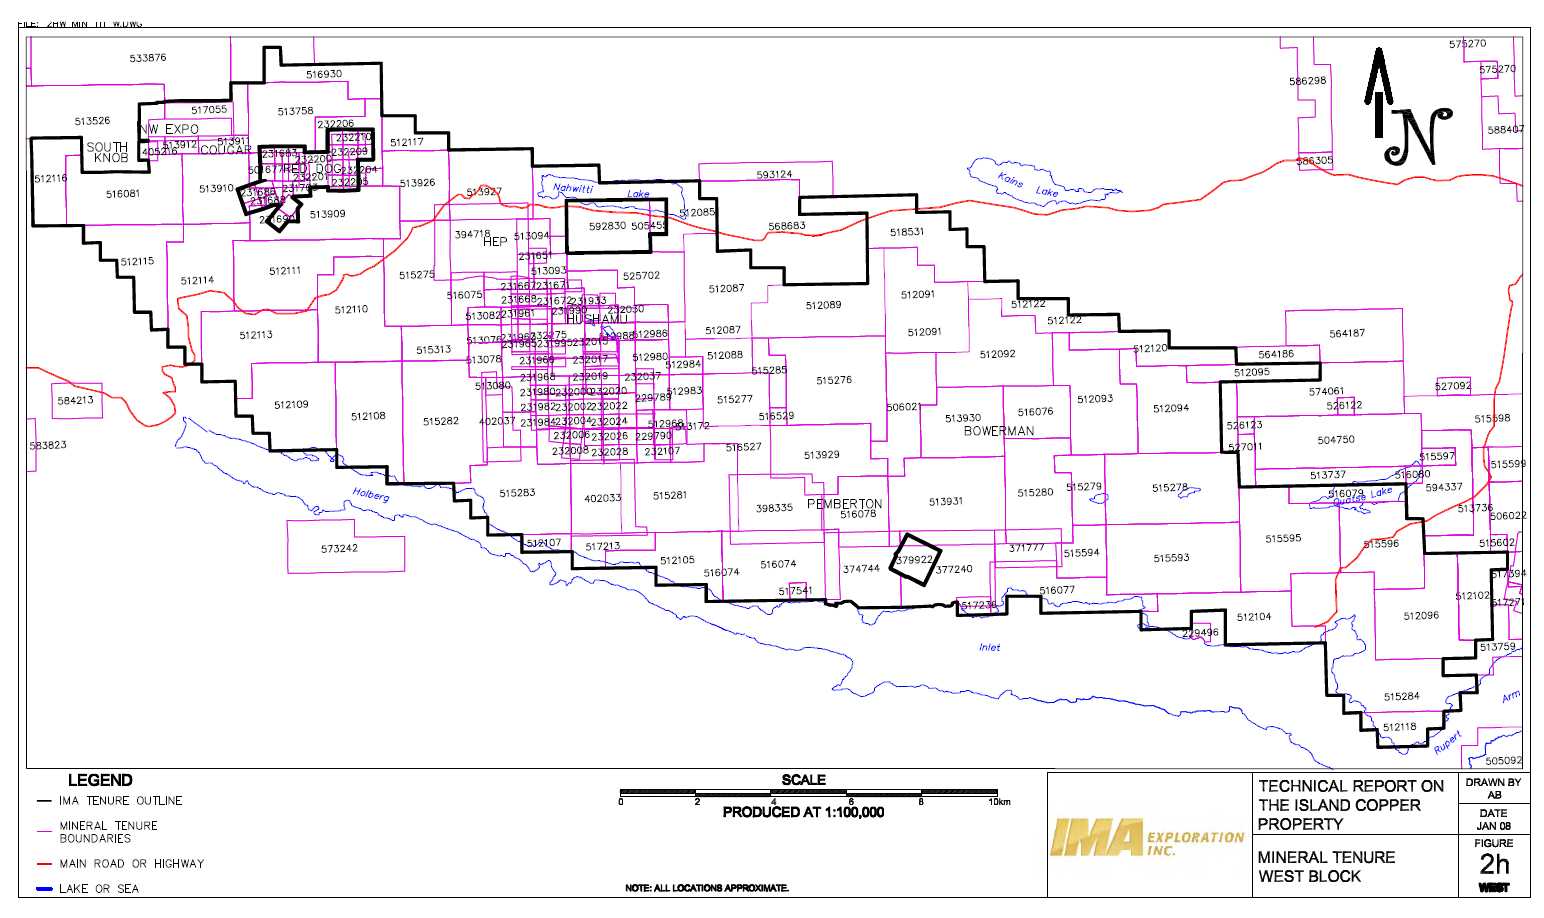


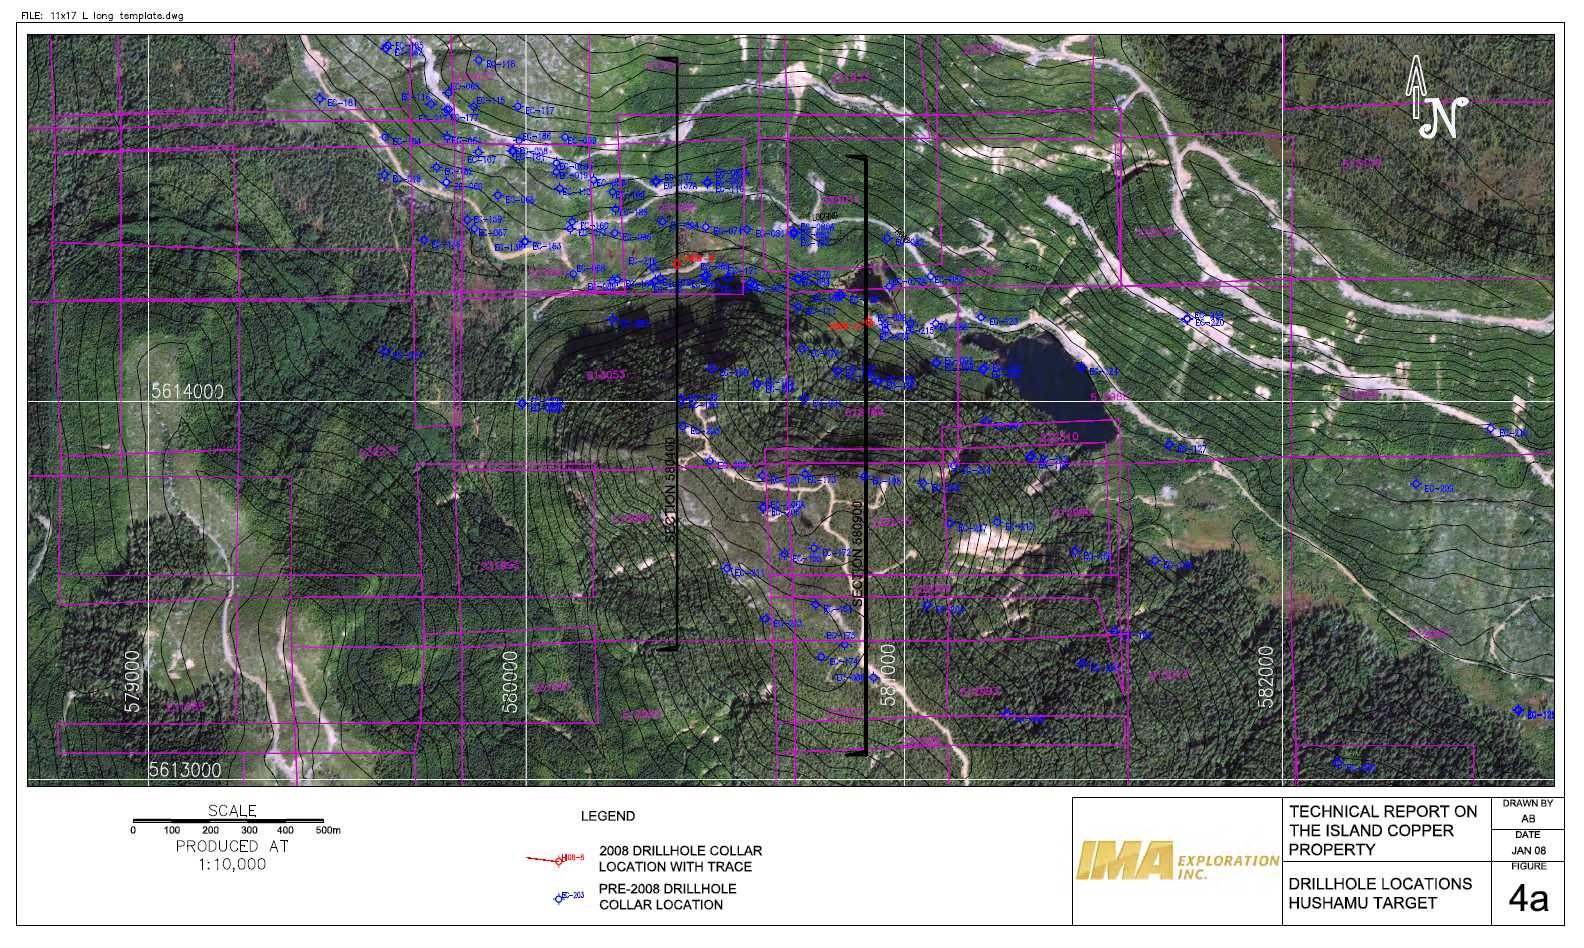
![]()
